Embed Size (px)
Citation preview

Quarterly Economic ReportQ4 | 2016
February 2017Deloitte Thailand
Message from the Country Managing Partner
Executive Summary
Global & Asian Economic Review
AEC Economic Review
Thailand Economic Review
Thailand Reform Review
Business Survey: Managing in a Slow-Growth Economy
Industry Sector Update
Automotive
Finance & Banking
Electronics
Residential Real Estate
Wholesale & Retail
Tourism
Upcoming Report Highlights
3
4
8
11
23
26
34
49
51
56
60
64
67
70
73
Contents
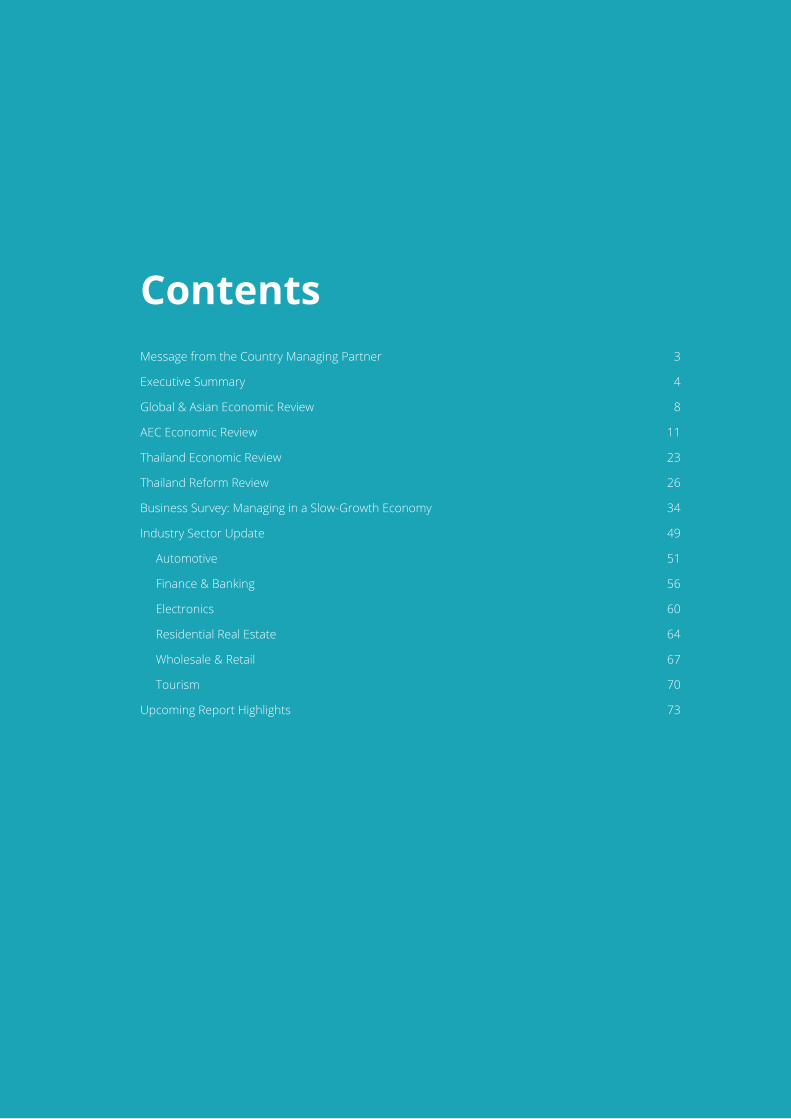
Dear Our Valued Clients,
We are very pleased to release Quarterly Economic Report
Q4|2016 to you. It is a part of our constant endeavors to provide
valuable insights to our clients. This high level update and summary
to understand the business environment so as to support you in
your decision making process and further development of your
business strategies.
Global economic growth projection in 2016 is revised down to
3.0% lower than 3.2% in previous year. A slower-than-expect
recovery has been caused by negative risks such as an economic
slump in China, currency depreciation, subdued global trade,
While some high-income economies from the west start to gain
economic momentum, China’s economic slowdown remains the
biggest risk to the prosperity of Asia. The lukewarm growth outlook
is 5.4% in 2016 and will decelerate to 4.6% on average in 2018-21
owing to an expected economic downturn in China and the
US during 2018-19. Nevertheless, ASEAN’s economy will be
resilient amid global headwinds due to a gradual increase in trade
and investment activities among the ASEAN member states.
For Thailand, 2016 economic growth is estimated to expand
3.2% driven by strong public investment on large-scale
infrastructure projects as well as healthy private consumption,
in particular tourism sector.
On behalf of Deloitte Thailand, we very much look forward to
supporting you in the dynamic and changing business environment.
If you have any questions or inputs, please do not hesitate to
contact us at Deloitte.
Best Regards,
Quarterly Economic Report : Q4 | 2016 3
Subhasakdi Krishnamra
Country Managing Partner

ExecutiveSummary
ExecutiveSummary
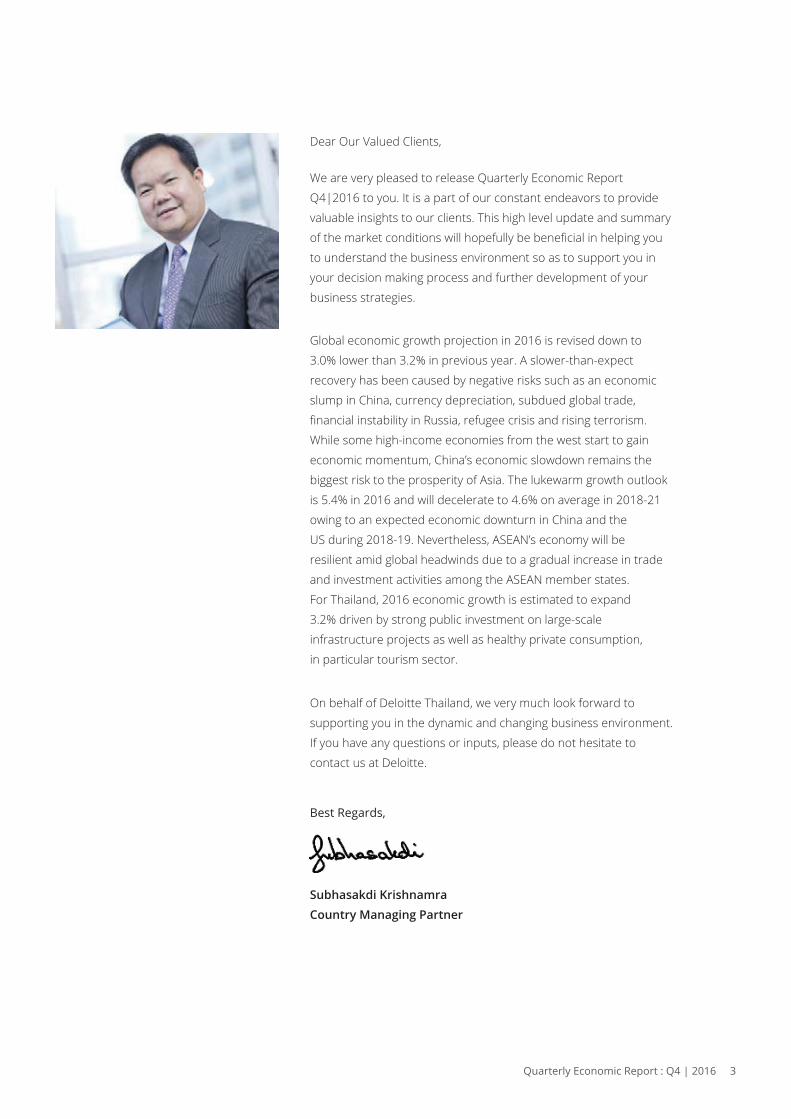
Headwinds in the global economy continue to causethe slow global growth environment
Global and major economies’ GDP growth in 2016
Asia5.4%
1/
World3.0%
1.6%EuroArea
UnitedStates
1.5%
China6.7%
India6.5%
Japan0.6%
ASEAN4.4%
Sources: ADB, EIU, European Economic forecast, & IMF
Remark : 1/ Asia’s GDP growth excl. Japan
- - - - -
- - - - -
- - - - - - - - - -
Quarterly Economic Report : Q4 | 2016 5
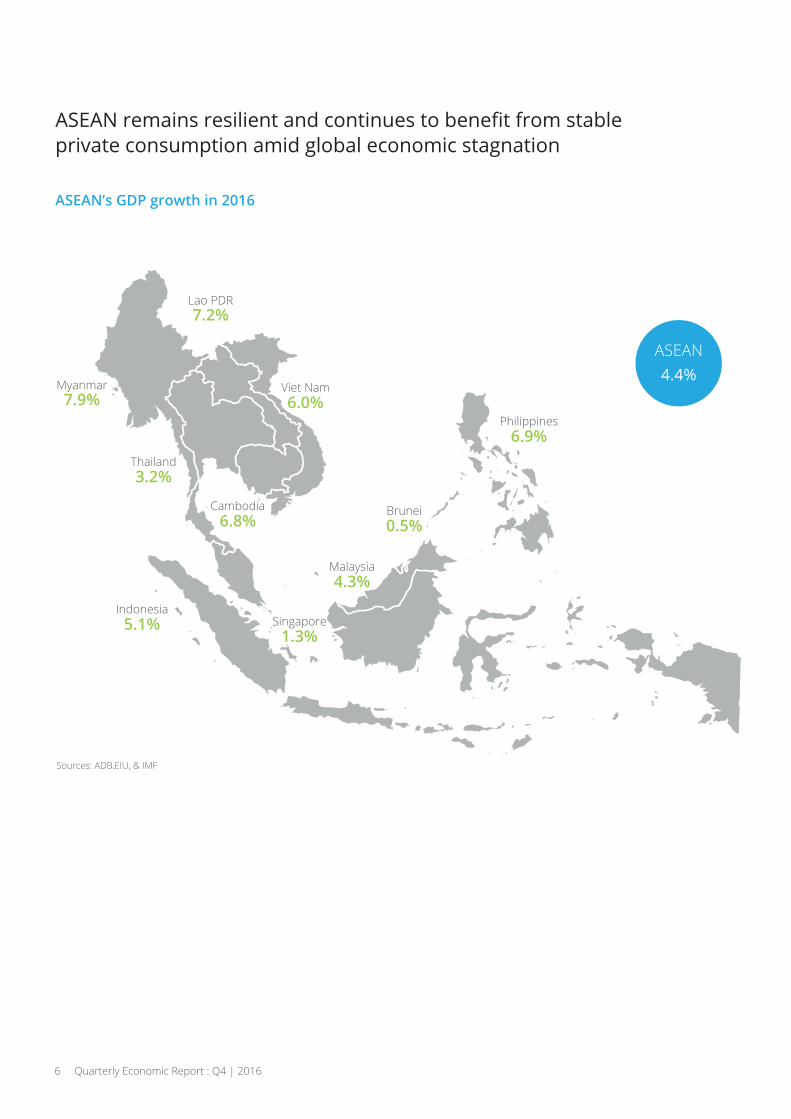
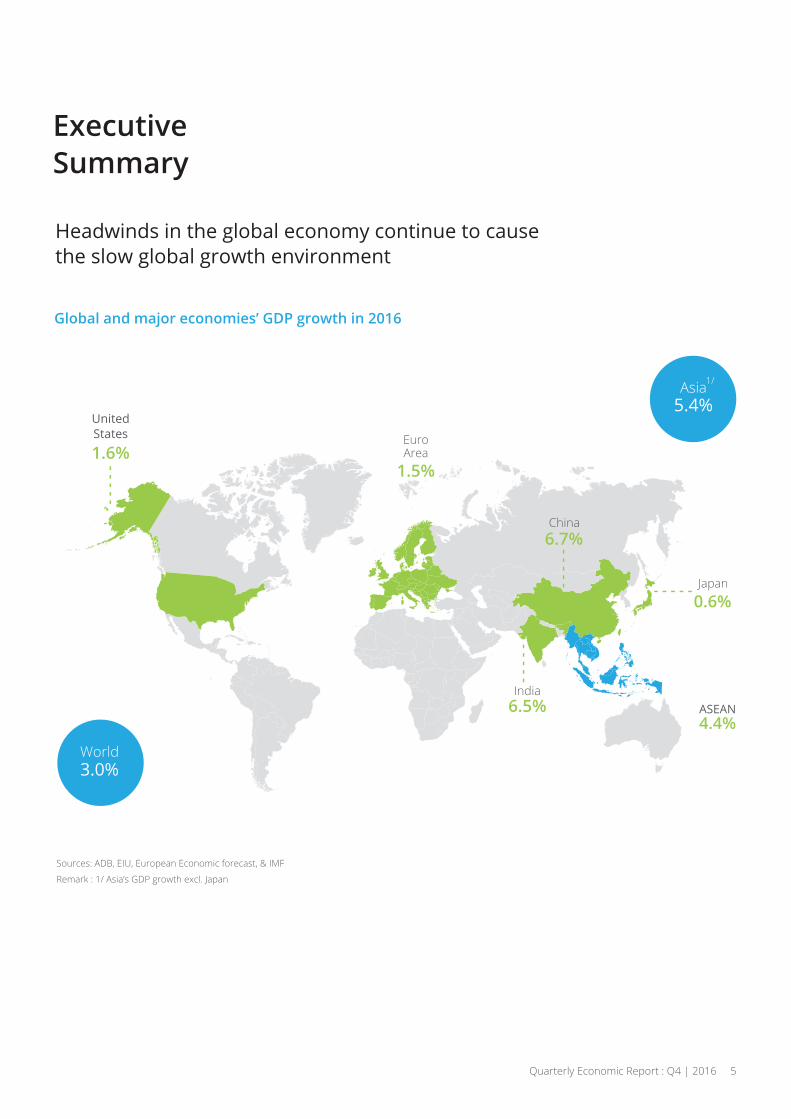
private consumption amid global economic stagnation
ASEAN’s GDP growth in 2016
Myanmar7.9%
Lao PDR7.2%
Viet Nam6.0%
Cambodia6.8%
Singapore1.3%
Malaysia4.3%
Brunei0.5%
Philippines6.9%
Thailand3.2%
Indonesia5.1%
Sources: ADB,EIU, & IMF
ASEAN4.4%
6 Quarterly Economic Report : Q4 | 2016
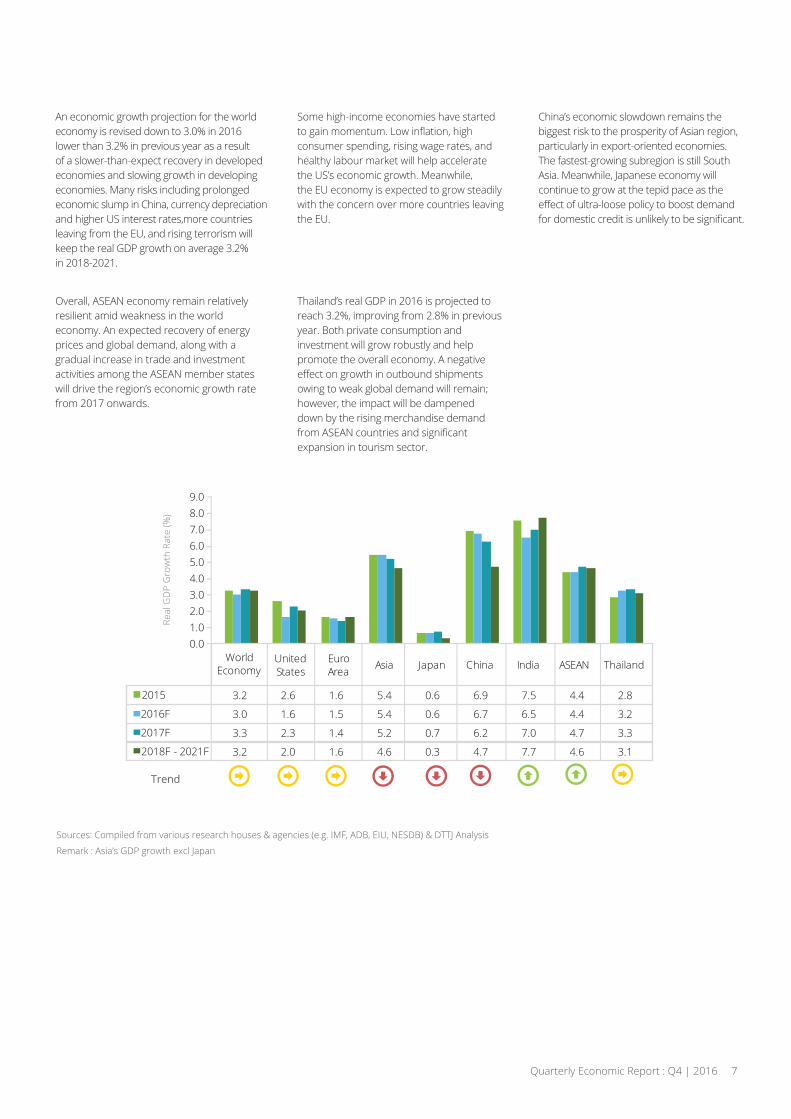
World Economy
United States
Euro Area Asia Japan China India ASEAN Thailand
2015 3.2 2.6 1.6 5.4 0.6 6.9 7.5 4.4 2.8
2016F 3.0 1.6 1.5 5.4 0.6 6.7 6.5 4.4 3.2
2017F 3.3 2.3 1.4 5.2 0.7 6.2 7.0 4.7 3.3
2018F - 2021F 3.2 2.0 1.6 4.6 0.3 4.7 7.7 4.6 3.1
0.01.02.03.04.05.06.07.08.09.0
An economic growth projection for the worldeconomy is revised down to 3.0% in 2016lower than 3.2% in previous year as a resultof a slower-than-expect recovery in developedeconomies and slowing growth in developingeconomies. Many risks including prolongedeconomic slump in China, currency depreciationand higher US interest rates,more countriesleaving from the EU, and rising terrorism willkeep the real GDP growth on average 3.2%in 2018-2021.
Overall, ASEAN economy remain relativelyresilient amid weakness in the worldeconomy. An expected recovery of energyprices and global demand, along with agradual increase in trade and investmentactivities among the ASEAN member stateswill drive the region’s economic growth ratefrom 2017 onwards.
Thailand’s real GDP in 2016 is projected toreach 3.2%, improving from 2.8% in previousyear. Both private consumption andinvestment will grow robustly and helppromote the overall economy. A negative
owing to weak global demand will remain;however, the impact will be dampeneddown by the rising merchandise demand
expansion in tourism sector.
Some high-income economies have started
consumer spending, rising wage rates, andhealthy labour market will help acceleratethe US’s economic growth. Meanwhile, the EU economy is expected to grow steadilywith the concern over more countries leavingthe EU.
China’s economic slowdown remains thebiggest risk to the prosperity of Asian region,particularly in export-oriented economies.The fastest-growing subregion is still SouthAsia. Meanwhile, Japanese economy willcontinue to grow at the tepid pace as the
Sources: Compiled from various research houses & agencies (e.g. IMF, ADB, EIU, NESDB) & DTTJ Analysis
Remark : Asia’s GDP growth excl Japan
Real
GD
P G
row
th R
ate
(%)
Trend
Quarterly Economic Report : Q4 | 2016 7
Global &Asian EconomicReview

Headwinds in the global economycontinue to cause the slow global growthenvironmentModerate global growth continues amid challengesand uncertainties. Some developed economies areexpected to gather momentum. Meanwhile majordeveloping economies will remain in slowing growth path.
World Economy
An economic growth projection for the worldeconomy is revised down to 3.0% lower than3.2% in previous year as a result of a slowerthan-expect recovery in developed economiesand slowing growth in developing economies.Many risks including prolonged economicslump in China, currency depreciation andhigher US interest rates, more countriesleaving from the EU, and rising terrorism willkeep the real GDP growthon average 3.2%in 2018-2021.
United State
rising wage rates, and healthy labour marketwill continue to boost economic growth.Real GDP growth in 2017 will robustly shiftabove 2.0% after years of recovery
Euro Area
The UK’s decision to leave the EU has weighedon the overall growth and raised concernsabout the future viability of the EU. The realGDP growth is expected to drop to 1.5% in2016 and 1.6% on average in 2018-21
Asia (Excl Japan)
The region’s real GDP in 2016 is projected at5.4% and will gradually decelerate to 4.6 onaverage in 2018-21 driven in large part byweaker growth in China. The fastest-growingsubregion is South Asia. Japanese economy,on the other hands, will only expand in atepid pace. Meanwhile, ASEAN’s economywill be resilient and grow steadily from 2017onwards.
Another concern on the health of the EU isthat more countries such as Greece and Italywill withdraw from the EU and would destabilizethe global economy.
The US political outlook is expected to changedramatically under the Trump administration.However, it is still doubtful that Mr.Trump’sprotectionist policies such as an increaseinfrastructure spending, more tax cuts, and
public spending. On the contrary, a recessionin China and a break-up of the EU will damageglobal sentiment and are likely to reduce
future.
World Economy United States Euro Area Asia2015 3.2 2.6 1.6 5.4
2016F 3.0 1.6 1.5 5.4
2017F 3.3 2.3 1.4 5.2
2018F - 2021F 3.2 2.0 1.6 4.6
0.0
1.0
2.0
3.0
4.0
5.0
6.0
Quarterly Economic Report : Q4 | 2016 9
Real
GD
P G
row
th R
ate
(%)
Sources: ADB, EIU, European Economic forecast, & IMF
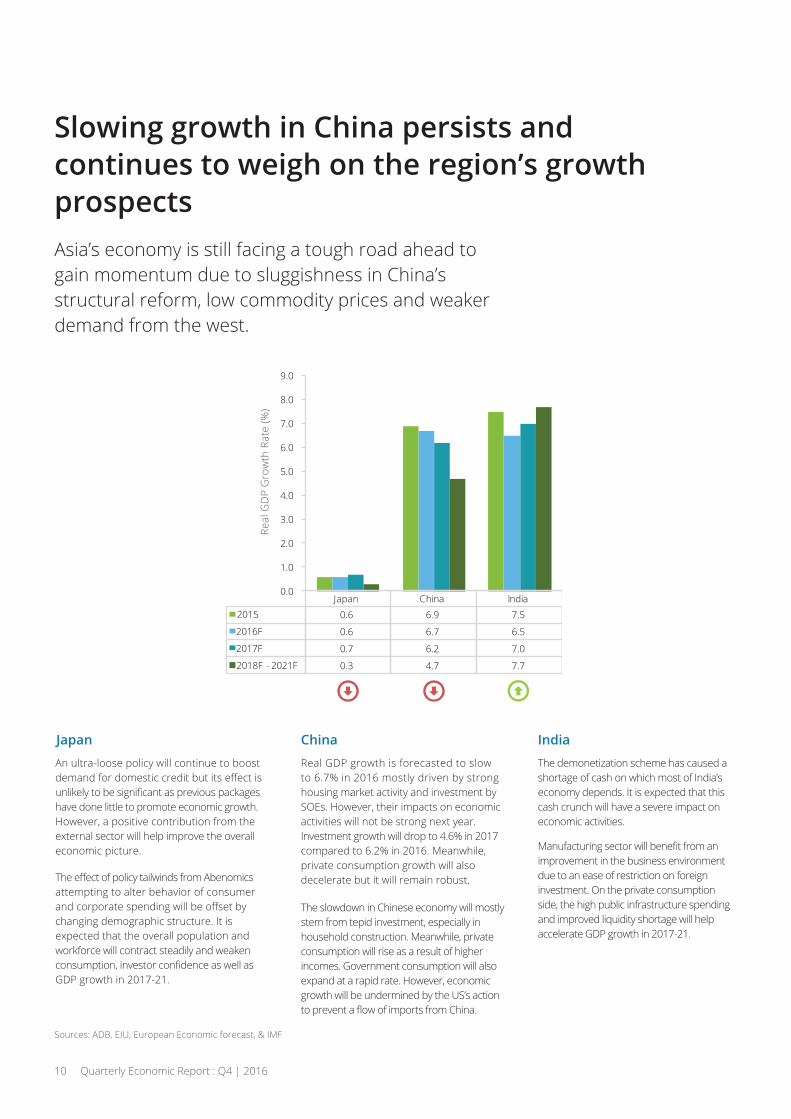
Slowing growth in China persists andcontinues to weigh on the region’s growthprospectsAsia’s economy is still facing a tough road ahead togain momentum due to sluggishness in China’s structural reform, low commodity prices and weakerdemand from the west.
Japan
An ultra-loose policy will continue to boost
have done little to promote economic growth.However, a positive contribution from theexternal sector will help improve the overalleconomic picture.
attempting to alter behavior of consumer
changing demographic structure. It isexpected that the overall population andworkforce will contract steadily and weaken
GDP growth in 2017-21.
China
Real GDP growth is forecasted to slow to 6.7% in 2016 mostly driven by stronghousing market activity and investment bySOEs. However, their impacts on economicactivities will not be strong next year.Investment growth will drop to 4.6% in 2017compared to 6.2% in 2016. Meanwhile,private consumption growth will alsodecelerate but it will remain robust.
India
The demonetization scheme has caused ashortage of cash on which most of India’seconomy depends. It is expected that thiscash crunch will have a severe impact oneconomic activities.
improvement in the business environmentdue to an ease of restriction on foreigninvestment. On the private consumptionside, the high public infrastructure spendingand improved liquidity shortage will helpaccelerate GDP growth in 2017-21.
The slowdown in Chinese economy will mostlystem from tepid investment, especially inhousehold construction. Meanwhile, privateconsumption will rise as a result of higherincomes. Government consumption will alsoexpand at a rapid rate. However, economicgrowth will be undermined by the US’s action
Sources: ADB, EIU, European Economic forecast, & IMF
10 Quarterly Economic Report : Q4 | 2016
Japan China India2015 0.6 6.9 7.5
2016F 0.6 6.7 6.5
2017F 0.7 6.2 7.0
2018F - 2021F 0.3 4.7 7.7
0.0
1.0
2.0
3.0
4.0
5.0
6.0
7.0
8.0
9.0
Real
GD
P G
row
th R
ate
(%)
AEC EconomicReview

ASEAN in the global economy
Source: ASEAN Secretariats, IMF, WorldBank, Internet Live Stats (http://www.internetlivestats.com/),and Simon Kemp. (2016). Digital in 2016. We Are Social.
1SEA countries as a single country, would be
12 Quarterly Economic Report : Q4 | 2016
Economy6 largest GDP globally 2015 –At US$ 2.6 billion behindUnited States, China, Japan,Germany, and United Kingdom.
TradeThe world’s 4 largest exporter– behind the EU, US and China.Intra-ASEAN trade is the largestshare (24%) of ASEAN’s 2015total trade
Internet4 largest pool of internet usersglobally in 2015: behind China,India, and the US.
Mobile3rd largest market for mobilesubscriptions after China and India.
Population3 largest population with 630 millionin 2015 – behind China and India.More than half under the age of 30and 48% living in urban areas.
InvestmentUS$120 billion of FDI in 2015(60% is FDI in services).
3x increase in total FDI from US$43billion 2005 to US$121 billion 2015.
Intra-ASEAN FDI was the highestsource of FDI in 2015 (5x increasefrom 2005 to 2015).
th
th
th
rd

Overall, ASEAN economy remains relativelystable amid external headwindsASEAN’s economic dynamics will bounce back andsteadily grow from 2017 onwards as the worldeconomy gradually stabilizes.
Sources: ADB, EIU, IMF, NESDB, & Research Houses
Real GDP growth rate of ASEAN economies from 2015 – 2021F
Real GDP growth Rate
ASEAN Brunei Darussalam
Cambodia Indonesia Lao PDR Malaysia Myanmar Philippines Singapore Thailand Viet Nam
2015 4.4 (0.6) 7.0 4.8 7.0 5.0 6.8 5.9 2.0 2.8 6.7
2016F 4.4 0.5 6.8 5.1 7.2 4.3 7.9 6.9 1.3 3.2 6.0
2017F 4.7 1.0 7.2 5.0 7.4 4.6 9.3 6.2 2.0 3.3 6.6
2018F -2021F 4.6 1.0 7.3 5.0 7.6 4.6 9.1 5.4 3.1 3.1 6.5
Trend
-2.0
-1.0
0.0
1.0
2.0
3.0
4.0
5.0
6.0
7.0
8.0
9.0
10.0
2015 2016F 2017F 2018F 2021F
ASEAN
Brunei
Cambodia
Indonesia
Lao PDR
Malaysia
Myanmar
Philippines
Singapore
Thailand
Viet Nam
Lao PDRCambodia
Myanmar
Thailand
Viet Nam
Brunei
Philippines
Malaysia
Indonesia
Singapore
ASEAN
Quarterly Economic Report : Q4 | 2016 13
Brunei
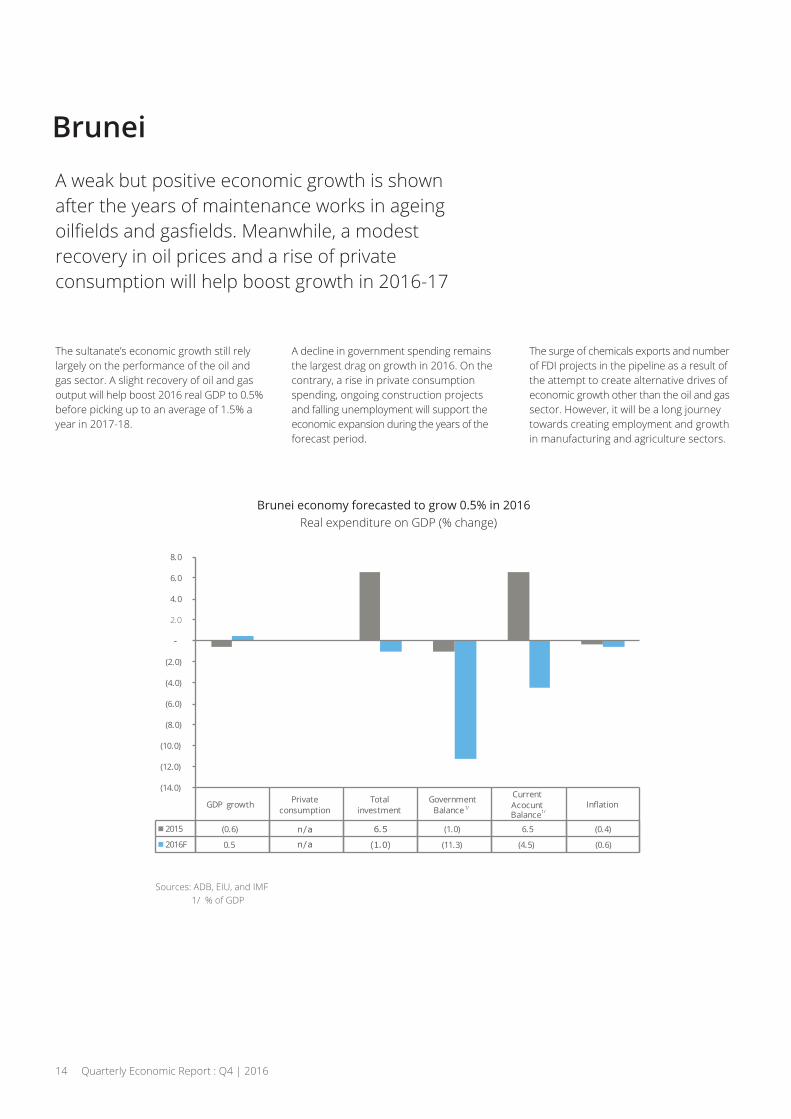
A weak but positive economic growth is shownafter the years of maintenance works in ageing
recovery in oil prices and a rise of privateconsumption will help boost growth in 2016-17
The sultanate’s economic growth still relylargely on the performance of the oil andgas sector. A slight recovery of oil and gasoutput will help boost 2016 real GDP to 0.5%before picking up to an average of 1.5% ayear in 2017-18.
A decline in government spending remainsthe largest drag on growth in 2016. On thecontrary, a rise in private consumptionspending, ongoing construction projectsand falling unemployment will support theeconomic expansion during the years of theforecast period.
The surge of chemicals exports and numberof FDI projects in the pipeline as a result ofthe attempt to create alternative drives ofeconomic growth other than the oil and gassector. However, it will be a long journeytowards creating employment and growthin manufacturing and agriculture sectors.
Sources: ADB, EIU, and IMF 1/ % of GDP
GDP growth Private consumption
Total investment
Government Balance
Current Acocunt Balance
In ation
2015 (0.6) 6.5 (1.0) 6.5 (0.4)
2016F 0.5 (1.0) (11.3) (4.5) (0.6)
(14.0)
(12.0)
(10.0)
(8.0)
(6.0)
(4.0)
(2.0)
-
2.0
4.0
6.0
8.0
Real expenditure on GDP (% change)
n/a
n/a
14 Quarterly Economic Report : Q4 | 2016
1/1/

Cambodia
A strong garment sector, real estate, and infrastructure
tourism sectors and continue to fuel growth.
Since the economy still re mostly on private consumption, the fall in household indebtedness and the improvement ofproductivity will help encourage higherspending. Cambodian economy isforecasted to slightly decelerate to 6.8%in 2016, compared to 7.0% in previous year.
Continued growth in exports from the garmentand footwear industry due to the recoveryof global trade will overshadow thedeceleration in tourism and agriculture sectors.
A positive outlook for investment growth isprojected owing to the strong relationsbetween Cambodia and China. This allowslarge direct bilateral loans from China andmake available for oversea infrastructureprojects in 2017-21.
Sources: ADB, EIU, & IMF
Real expenditure on GDP (% change)
Quarterly Economic Report : Q4 | 2016 15
Sources: ADB, EIU, & IMF
GDP growth Private consumption
Total investment
Government consumption
Exports Imports In ation
2015 7.0 7.8 2.9 4.0 20.3 16.5 1.2
2016F 6.8 5.6 4.9 11.5 7.7 7.2 2.8
0.0
5.0
10.0
15.0
20.0
25.0
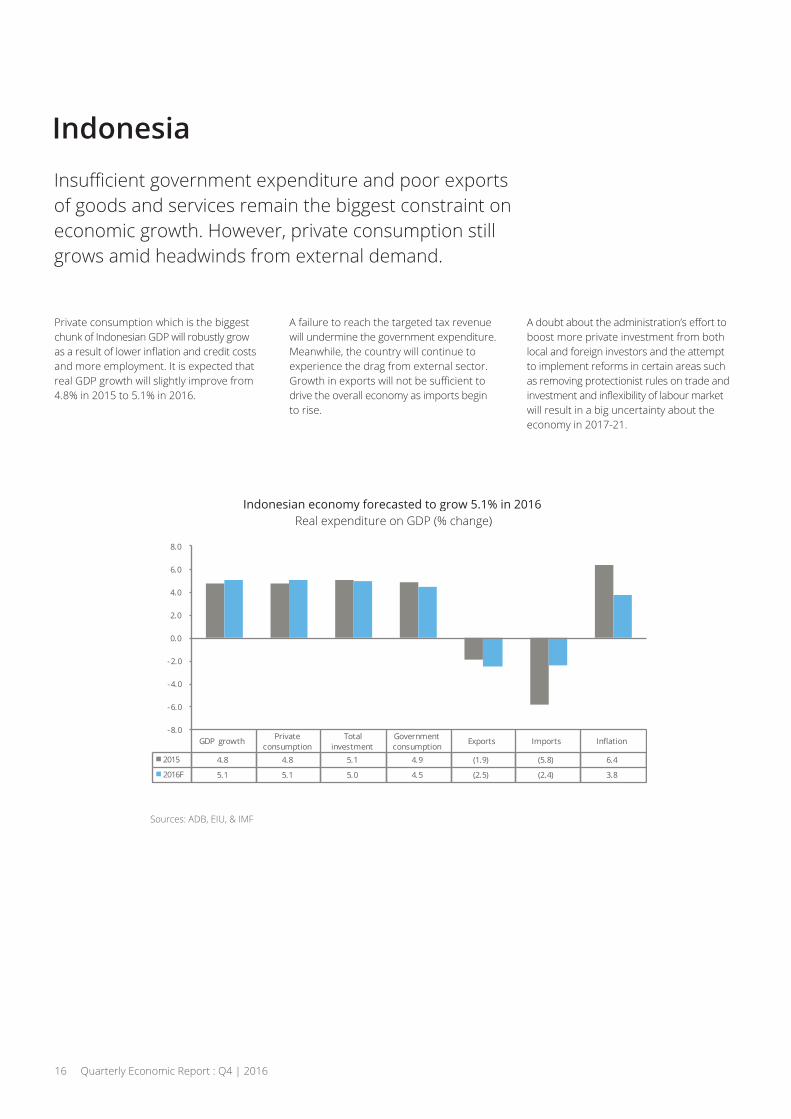
Indonesia
of goods and services remain the biggest constraint oneconomic growth. However, private consumption stillgrows amid headwinds from external demand.
Private consumption which is the biggestchunk of Indonesian GDP will robustly grow
and more employment. It is expected thatreal GDP growth will slightly improve from4.8% in 2015 to 5.1% in 2016.
A failure to reach the targeted tax revenuewill undermine the government expenditure.Meanwhile, the country will continue toexperience the drag from external sector.
drive the overall economy as imports beginto rise.
boost more private investment from bothlocal and foreign investors and the attemptto implement reforms in certain areas suchas removing protectionist rules on trade and
will result in a big uncertainty about theeconomy in 2017-21.
Sources: ADB, EIU, & IMF
Real expenditure on GDP (% change)
Sources: ADB, EIU, & IMF
Real expenditure on GDP (% change)
GDP growth Private consumption
Total investment
Government consumption
Exports Imports In ation
2015 4.8 4.8 5.1 4.9 (1.9) (5.8) 6.4
2016F 5.1 5.1 5.0 4.5 (2.5) (2.4) 3.8
-8.0
-6.0
-4.0
-2.0
0.0
2.0
4.0
6.0
8.0
16 Quarterly Economic Report : Q4 | 2016

Lao PDR
Nevertheless, the economy still fairly grows supported byhigher private consumption spending and exports of goodsand services and ongoing work on hydropower project.
Growth in tourism sector coupled with anincrease in remittances received from Laoworkers in Thailand will encourage privateconsumption spending. A higher thanexpected economic growth in Thailand willhave a positive impact on Lao’s economyhelping boosting retail trade.
The large numbers of ongoing constructionprojects such as hydropower projects, ahigh-speed railway from the capital,Vientiane, to the Chinese border, and theWattay international airport will supportinvestment spending and demand forimported capital goods over the forecastperiod.
A moderate rise in global commodity prices
It isforecasted that the country’s GDP growthin 2017 and 2018 will be slightly lower to 7.0%as the government will attempt to rein in
management of resources.
Sources: ADB, EIU, and IMF
1/ % of GDP
Real expenditure on GDP (% change)
Quarterly Economic Report : Q4 | 2016 17
GDP growth Private consumption
Total investment
Government Balance1/
Current Account Balance1/
In ation
2015 7.0 (4.5) (18.4) 1.3
2016F 7.2 (6.9) (18.3) 1.3
-20.0
-15.0
-10.0
-5.0
0.0
5.0
10.0
n/a
n/a
n/a
n/a
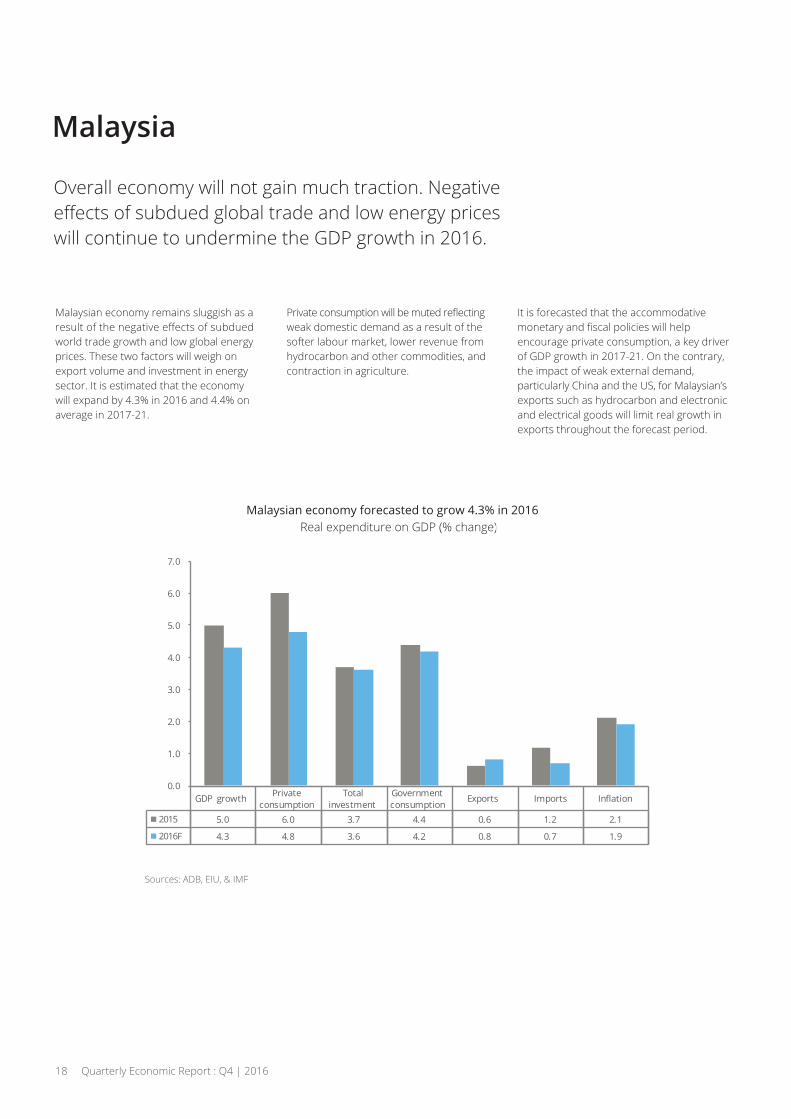
Malaysia
Overall economy will not gain much traction. Negative
will continue to undermine the GDP growth in 2016.
Malaysian economy remains sluggish as a
world trade growth and low global energyprices. These two factors will weigh onexport volume and investment in energysector. It is estimated that the economywill expand by 4.3% in 2016 and 4.4% onaverage in 2017-21.
weak domestic demand as a result of thesofter labour market, lower revenue fromhydrocarbon and other commodities, andcontraction in agriculture.
It is forecasted that the accommodative
encourage private consumption, a key driverof GDP growth in 2017-21. On the contrary,the impact of weak external demand,particularly China and the US, for Malaysian’sexports such as hydrocarbon and electronicand electrical goods will limit real growth inexports throughout the forecast period.
Sources: ADB, EIU, & IMF
Real expenditure on GDP (% change)
Sources: ADB, EIU, & IMF
Real expenditure on GDP (% change)
GDP growth Private consumption
Total investment
Government consumption
Exports Imports In ation
2015 5.0 6.0 3.7 4.4 0.6 1.2 2.1
2016F 4.3 4.8 3.6 4.2 0.8 0.7 1.9
0.0
1.0
2.0
3.0
4.0
5.0
6.0
7.0
18 Quarterly Economic Report : Q4 | 2016
Myanmar
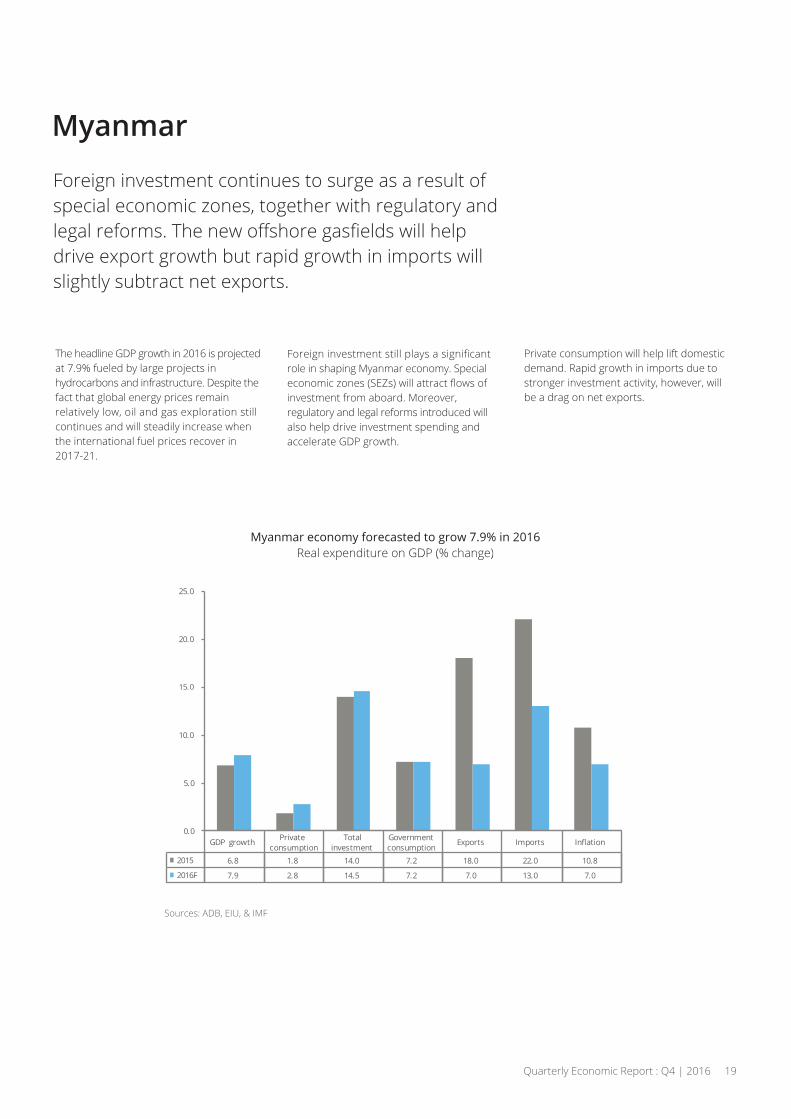
Foreign investment continues to surge as a result ofspecial economic zones, together with regulatory and
drive export growth but rapid growth in imports willslightly subtract net exports.
The headline GDP growth in 2016 is projectedat 7.9% fueled by large projects inhydrocarbons and infrastructure. Despite thefact that global energy prices remainrelatively low, oil and gas exploration stillcontinues and will steadily increase whenthe international fuel prices recover in2017-21.
role in shaping Myanmar economy. Special
nvestment from aboard. Moreover,regulatory and legal reforms introduced willalso help drive investment spending andaccelerate GDP growth.
Private consumption will help lift domesticdemand. Rapid growth in imports due tostronger investment activity, however, willbe a drag on net exports.
Sources: ADB, EIU, & IMF
Real expenditure on GDP (% change)
Sources: ADB, EIU, & IMF
Real expenditure on GDP (% change)
GDP growth Private consumption
Total investment
Government consumption
Exports Imports In ation
2015 6.8 1.8 14.0 7.2 18.0 22.0 10.8
2016F 7.9 2.8 14.5 7.2 7.0 13.0 7.0
0.0
5.0
10.0
15.0
20.0
25.0
Quarterly Economic Report : Q4 | 2016 19

PhilippinesA country remains resilient amid years of turbulencein the global economy. Public investment, especiallyinfrastructure projects, remains strong. Privateconsumption continues to support growth due to
The economy will constantly grow amid theturbulence in the global economy. It isprojected that real GDP growth in 2016 willreach 6.9% supported by strong publicinvestment and healthy private consumption.
A number of infrastructure projects continuesto promote public investment. However, thestagnation of Disbursement AccelerationProgramme, a funding transfer from stalledprojects to new or faster-moving one, willlimit the growth of investment in 2017-21.
Service exports grown steadily as thebusiness process outsourcing sector remainstrong. Nevertheless, an increase in totalinvestment, together with higher domesticdemand will result in higher imports andwill eventually undermine the net exportsand GDP headline in 2016.
Sources: ADB, EIU, & IMF
Real expenditure on GDP (% change)
Sources: ADB, EIU, & IMF
GDP growth Private consumption
Total investment
Government consumption
Exports Imports In ation
2015 5.9 6.3 15.1 8.4 9.2 14.0 1.3
2016F 6.9 7.2 23.4 7.1 5.2 14.3 1.8
0.0
5.0
10.0
15.0
20.0
25.0
20 Quarterly Economic Report : Q4 | 2016
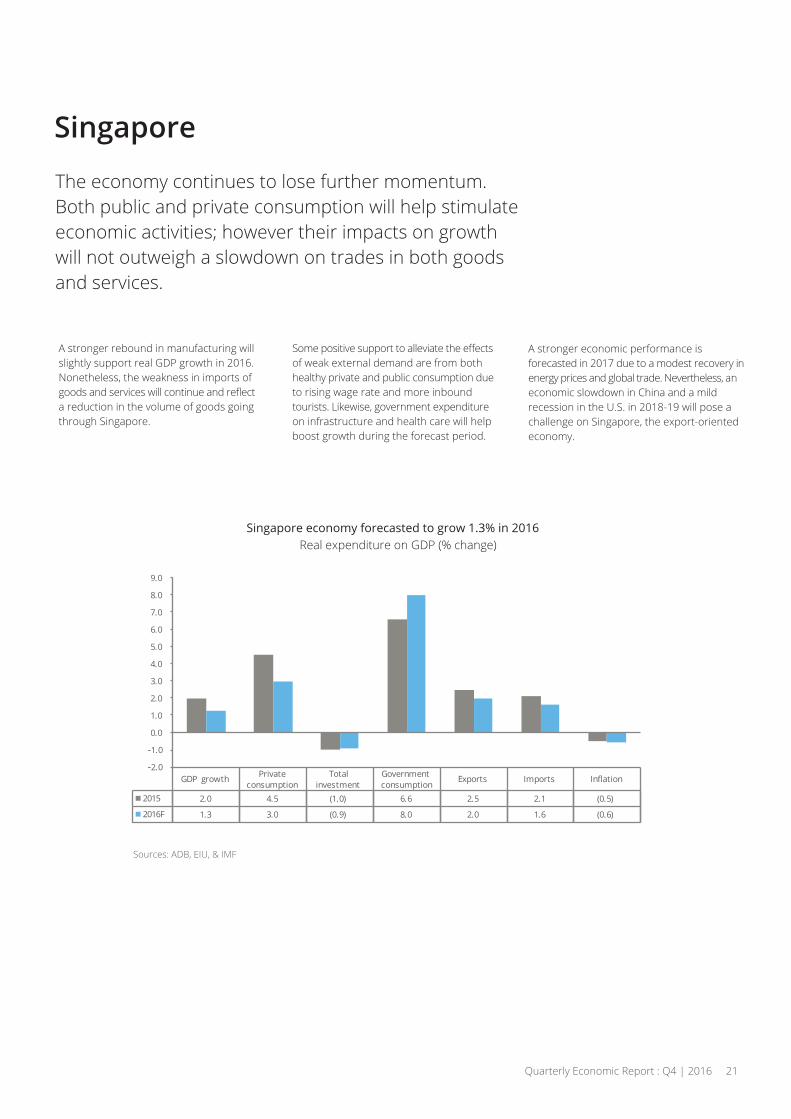
Singapore
The economy continues to lose further momentum.Both public and private consumption will help stimulateeconomic activities; however their impacts on growthwill not outweigh a slowdown on trades in both goodsand services.
A stronger rebound in manufacturing willslightly support real GDP growth in 2016.Nonetheless, the weakness in imports of
a reduction in the volume of goods goingthrough Singapore.
of weak external demand are from bothhealthy private and public consumption dueto rising wage rate and more inboundtourists. Likewise, government expenditureon infrastructure and health care will helpboost growth during the forecast period.
A stronger economic performance isforecasted in 2017 due to a modest recovery inenergy prices and global trade. Nevertheless, aneconomic slowdown in China and a mildrecession in the U.S. in 2018-19 will pose achallenge on the export-oriented economy.
Real expenditure on GDP (% change)
Sources: ADB, EIU, & IMFSources: ADB, EIU, & IMF
GDP growth Private consumption
Total investment
Government consumption
Exports Imports In ation
2015 2.0 4.5 (1.0) 6.6 2.5 2.1 (0.5)
2016F 1.3 3.0 (0.9) 8.0 2.0 1.6 (0.6)
-2.0
-1.0
0.0
1.0
2.0
3.0
4.0
5.0
6.0
7.0
8.0
9.0
Quarterly Economic Report : Q4 | 2016 21
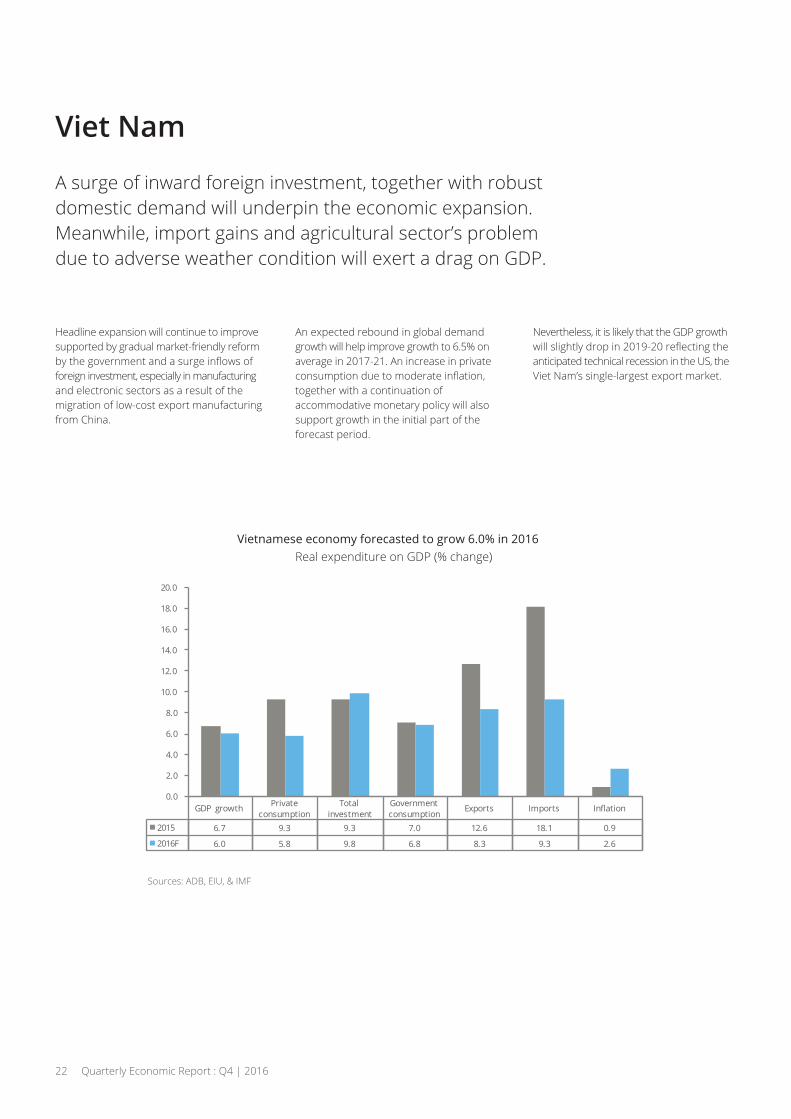
Viet Nam
A surge of inward foreign investment, together with robustdomestic demand will underpin the economic expansion.Meanwhile, import gains and agricultural sector’s problemdue to adverse weather condition will exert a drag on GDP.
Headline expansion will continue to improvesupported by gradual market-friendly reform
foreign investment, especially in manufacturingand electronic sectors as a result of themigration of low-cost export manufacturingfrom China.
An expected rebound in global demandgrowth will help improve growth to 6.5% onaverage in 2017-21. An increase in private
together with a continuation ofaccommodative monetary policy will alsosupport growth in the initial part of theforecast period.
Nevertheless, it is likely that the GDP growth
anticipated technical recession in the US, theViet Nam’s single-largest export market.
Real expenditure on GDP (% change)
Sources: ADB, EIU, & IMFSources: ADB, EIU, & IMF
GDP growth Private consumption
Total investment
Government consumption
Exports Imports In ation
2015 6.7 9.3 9.3 7.0 12.6 18.1 0.9
2016F 6.0 5.8 9.8 6.8 8.3 9.3 2.6
0.0
2.0
4.0
6.0
8.0
10.0
12.0
14.0
16.0
18.0
20.0
22 Quarterly Economic Report : Q4 | 2016

ThailandEconomicReview
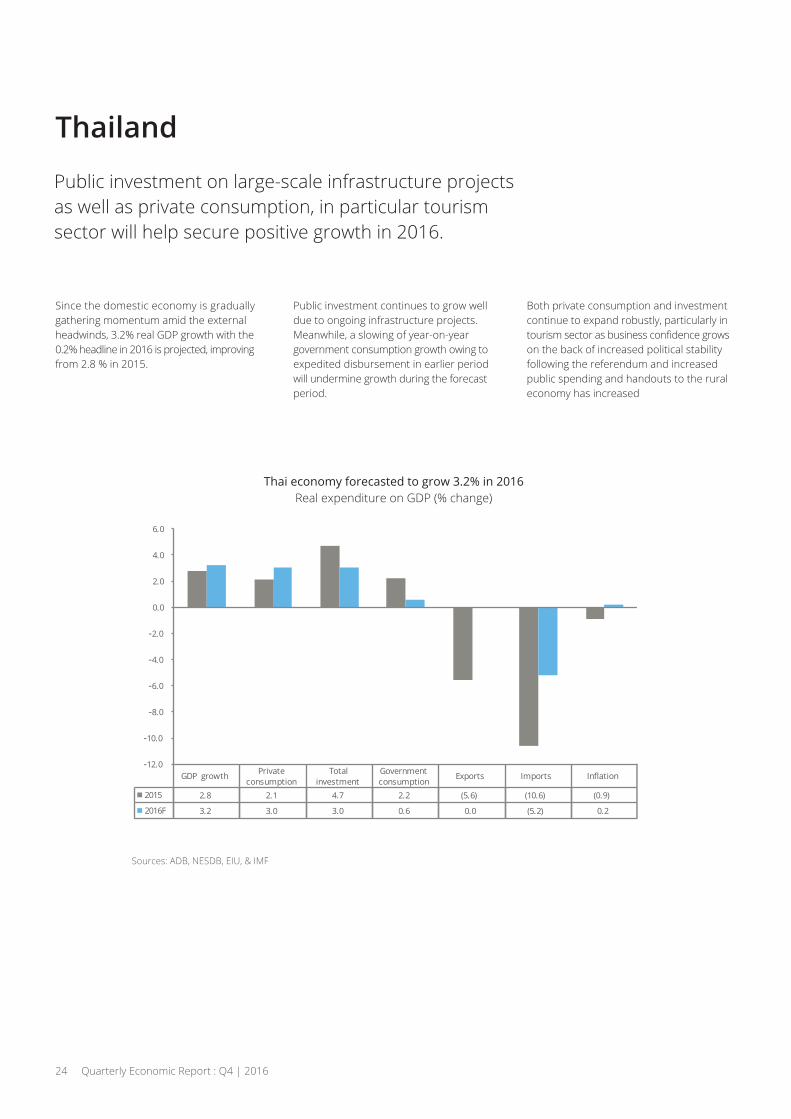
Thailand
Public investment on large-scale infrastructure projectsas well as private consumption, in particular tourismsector will help secure positive growth in 2016.
Since the domestic economy is graduallygathering momentum amid the externalheadwinds, 3.2% real GDP growth with the0.2% headline in 2016 is projected, improvingfrom 2.8 % in 2015.
Public investment continues to grow welldue to ongoing infrastructure projects.Meanwhile, a slowing of year-on-yeargovernment consumption growth owing toexpedited disbursement in earlier periodwill undermine growth during the forecastperiod.
Both private consumption and investmentcontinue to expand robustly, particularly in
on the back of increased political stabilityfollowing the referendum and increasedpublic spending and handouts to the ruraleconomy has increased
Sources: ADB, NESDB, EIU, & IMF
Real expenditure on GDP (% change)
Sources: ADB, NESDB, EIU, & IMF
GDP growth Private consumption
Total investment
Government consumption
Exports Imports In ation
2015 2.8 2.1 4.7 2.2 (5.6) (10.6) (0.9)
2016F 3.2 3.0 3.0 0.6 0.0 (5.2) 0.2
-12.0
-10.0
-8.0
-6.0
-4.0
-2.0
0.0
2.0
4.0
6.0
24 Quarterly Economic Report : Q4 | 2016
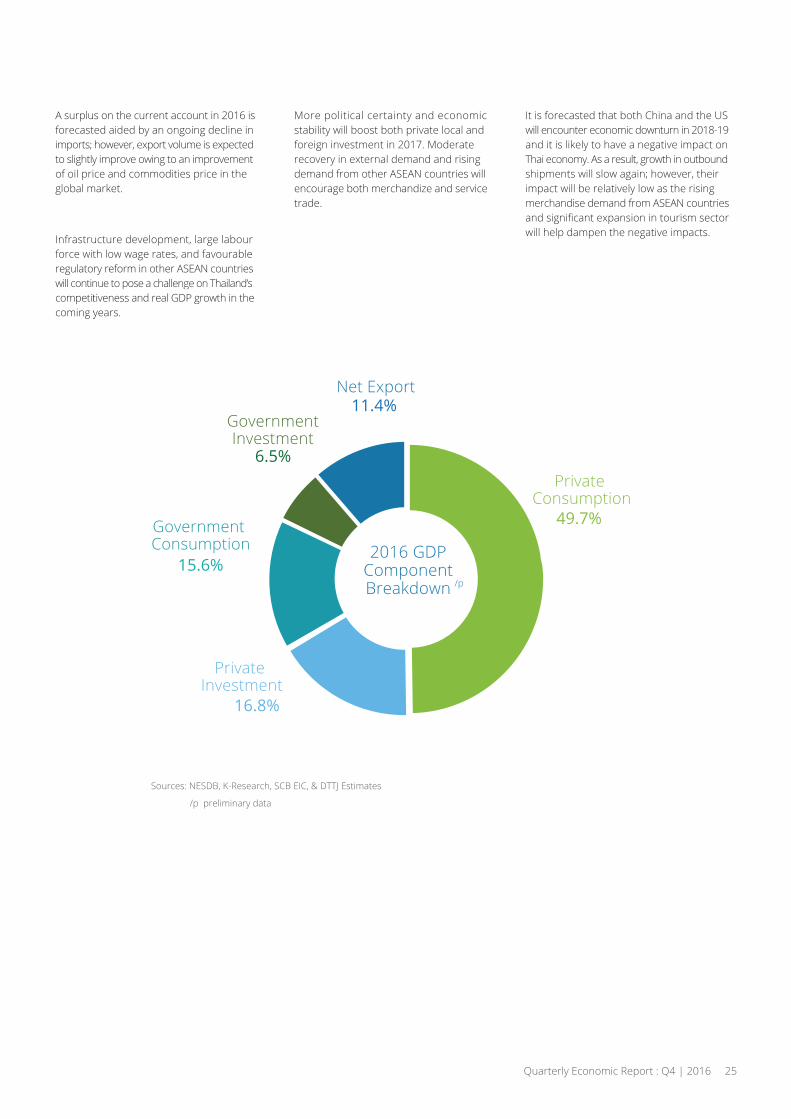
A surplus on the current account in 2016 isforecasted aided by an ongoing decline inimports; however, export volume is expectedto slightly improve owing to an improvementof oil price and commodities price in theglobal market.
More political certainty and economicstability will boost both private local andforeign investment in 2017. Moderaterecovery in external demand and risingdemand from other ASEAN countries willencourage both merchandize and servicetrade.
It is forecasted that both China and the USwill encounter economic downturn in 2018-19and it is likely to have a negative impact onThai economy. As a result, growth in outboundshipments will slow again; however, theirimpact will be relatively low as the risingmerchandise demand from ASEAN countries
will help dampen the negative impacts.Infrastructure development, large labourforce with low wage rates, and favourableregulatory reform in other ASEAN countrieswill continue to pose a challenge on Thailand’scompetitiveness and real GDP growth in thecoming years.
2016 GDPComponentBreakdown
Sources: NESDB, K-Research, SCB EIC, & DTTJ Estimates
/p preliminary data
nue to pose a challenge on Thailandstiveness and real GDP growth in theyears.
2016 GDPComponentBreakdown
49.7%
16.8%
15.6%
6.5%
11.4%Net Export
GovernmentInvestment
GovernmentConsumption
PrivateInvestment
PrivateConsumption
Quarterly Economic Report : Q4 | 2016 25
/p

Thailand
Review
NCPO
Government NLA NRSA
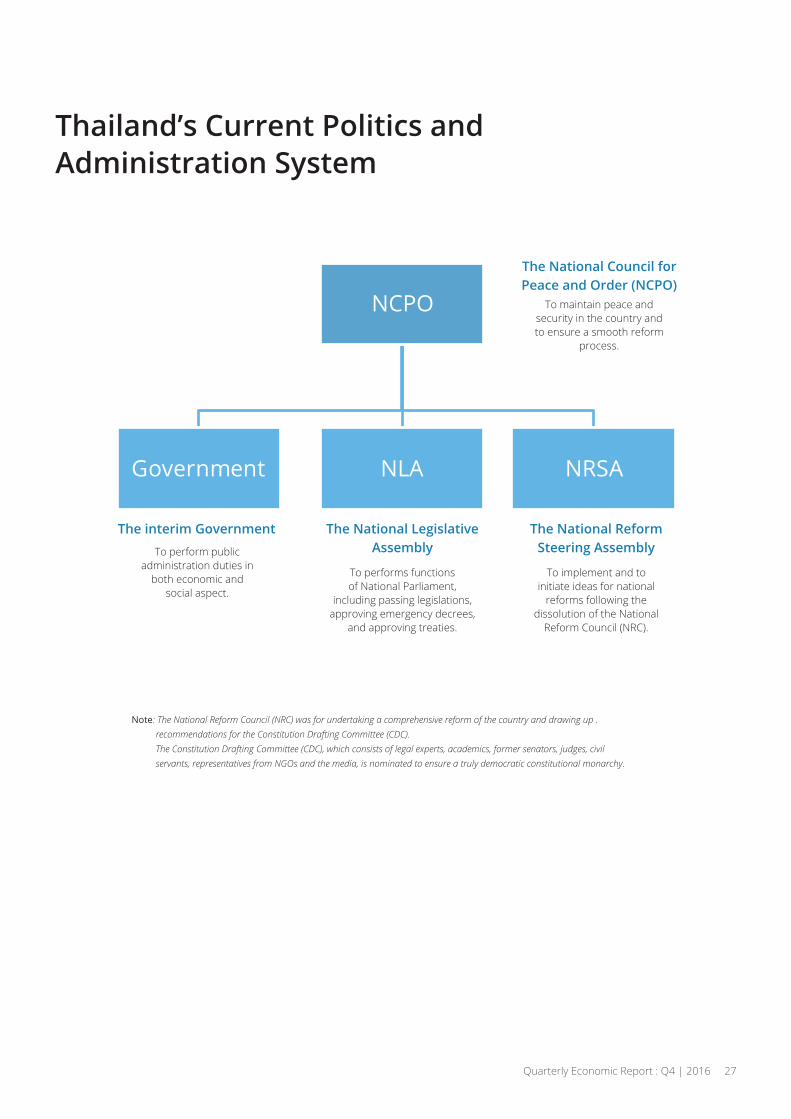
Thailand’s Current Politics andAdministration System
To maintain peace andsecurity in the country andto ensure a smooth reform
process.
Note: The National Reform Council (NRC) was for undertaking a comprehensive reform of the country and drawing up . recommendations for the Constitution Drafting Committee (CDC). The Constitution Drafting Committee (CDC), which consists of legal experts, academics, former senators, judges, civil servants, representatives from NGOs and the media, is nominated to ensure a truly democratic constitutional monarchy.
To perform publicadministration duties in
both economic andsocial aspect.
To performs functionsof National Parliament,
including passing legislations,approving emergency decrees,
and approving treaties.
To implement and toinitiate ideas for national
reforms following thedissolution of the National
Reform Council (NRC).
The interim Government The National LegislativeAssembly
The National ReformSteering Assembly
The National Council forPeace and Order (NCPO)
Quarterly Economic Report : Q4 | 2016 27

. . . .
. . . .
NCPO’s roadmap to reformThailand in Stage 2
The National Council for Peace and Order (NCPO) proposedthree stages of national administration during the transition period.
May 2014 Executed national security and law enforcement. Cleared illegal weapons.
.
.
.
.
.
.
.
.
.
Jun 2014 Developed economic master plans. Set up Reconciliation & Reform Center. Enforced narcotic suppression. Reviewed 56 SOEs’ governance structure.
Jul 2014 Launched the 19th interim constitution of Thailand. Drafted the 2015 Annual Budget Bill of THB 2.6 trillion.
Coup on 22 May 2014
Stage OneBring back normal operations of civil service
.
. . .
. . .
. . .
. . .
. . .
. . .
. . .
. . .
. . .
. . .
. . .
. . .
. . .
. . .
. . .
. .
28 Quarterly Economic Report : Q4 | 2016
Sources: compiled from NCPO, the Royal Thai Government, & Thai Local Newspapers
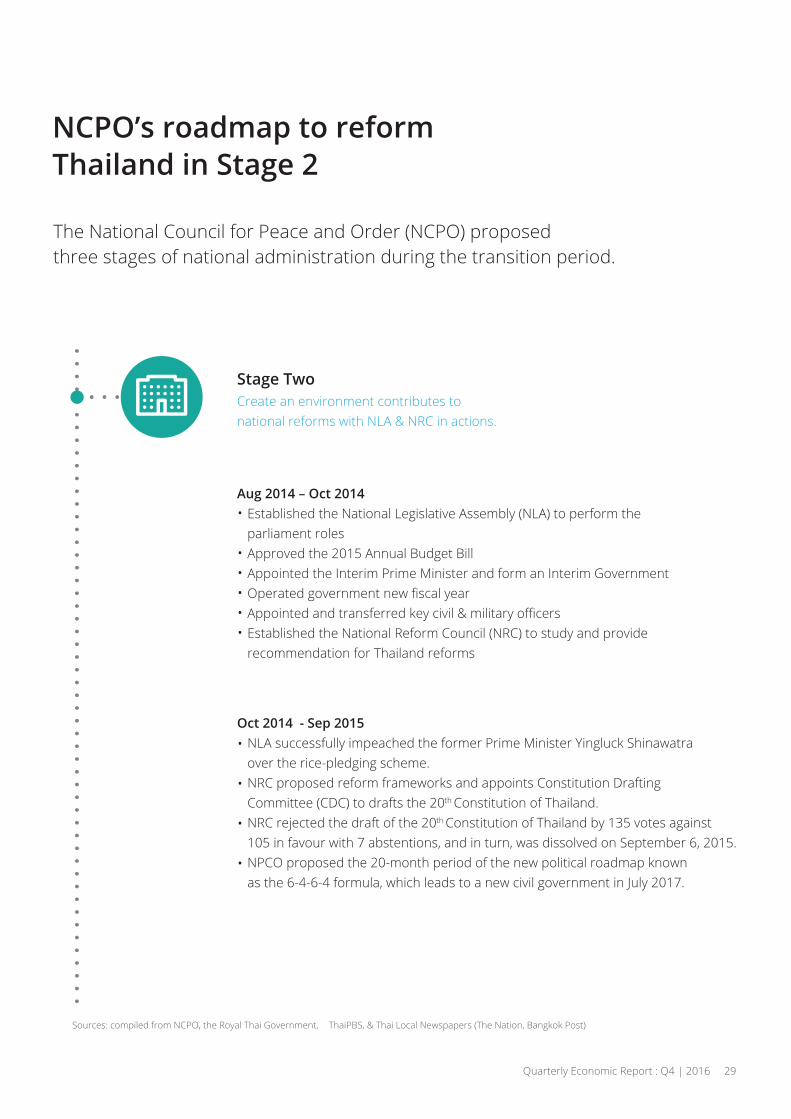
Aug 2014 – Oct 2014 Established the National Legislative Assembly (NLA) to perform the parliament roles Approved the 2015 Annual Budget Bill Appointed the Interim Prime Minister and form an Interim Government
Established the National Reform Council (NRC) to study and provide recommendation for Thailand reforms
Oct 2014 - Sep 2015 NLA successfully impeached the former Prime Minister Yingluck Shinawatra over the rice-pledging scheme. NRC proposed reform frameworks and appoints Constitution Drafting Committee (CDC) to drafts the 20th Constitution of Thailand. NRC rejected the draft of the 20th Constitution of Thailand by 135 votes against 105 in favour with 7 abstentions, and in turn, was dissolved on September 6, 2015. NPCO proposed the 20-month period of the new political roadmap known as the 6-4-6-4 formula, which leads to a new civil government in July 2017.
Stage TwoCreate an environment contributes tonational reforms with NLA & NRC in actions.
. . . .
. .
. . .
. . .
. . .
. . .
. . .
. . .
. . .
. . .
. . .
. . .
. . .
. . .
. . .
. . .
. . .
. . .
. .
NCPO’s roadmap to reformThailand in Stage 2
The National Council for Peace and Order (NCPO) proposedthree stages of national administration during the transition period.
.
.
.
.
.
.
.
.
.
.
Quarterly Economic Report : Q4 | 2016 29
�

Oct 2015 – Aug 2016 Appointed a new 21-person Constitutional Drafting Committee to propose the new draft of 20th Constitution of Thailand within 180 days. Established the National Reform Steering Assembly (NRSA) consisting of 200 members to implement the national reform blueprint proposed bythe dissolved NRC. Conducted a nationwide referendum of the drafted 20th Constitution of Thailand on August 7, 2016. the majority of the voters (61%) accepted the drafted 20th Constitution of Thailand and also 58% of them allowed the
transition period.
Aug 2016 – Nov 2017 (Approximately)Amended the drafted 20th Constitution in line with the referendum result. Launch the 20th Constitution of Thailand.Draft and deliberate the organic laws of the 20th Constitution of Thailand.
Dec 2017 onwards (Approximately) Execute general elections – the Senate and the House of Representatives. Parliament in action. Form a new government. Continue Thailand’s reform initiatives.
Stage Two - ContinuedCreate an environment contributes tonational reforms with NLA & NRC in actions.
Stage ThreeAn election will be held to restore full democracy.
. . . .
. .
. . .
. . .
. . .
. . .
. . .
. . .
. . .
. . .
. . .
. . .
. . .
. . .
. . .
. .
. . . .
NCPO’s roadmap to reformThailand in Stage 2
The National Council for Peace and Order (NCPO) proposedthree stages of national administration during the transition period.
.
.
.
.
.
.
.
.
.
.
30 Quarterly Economic Report : Q4 | 2016
�
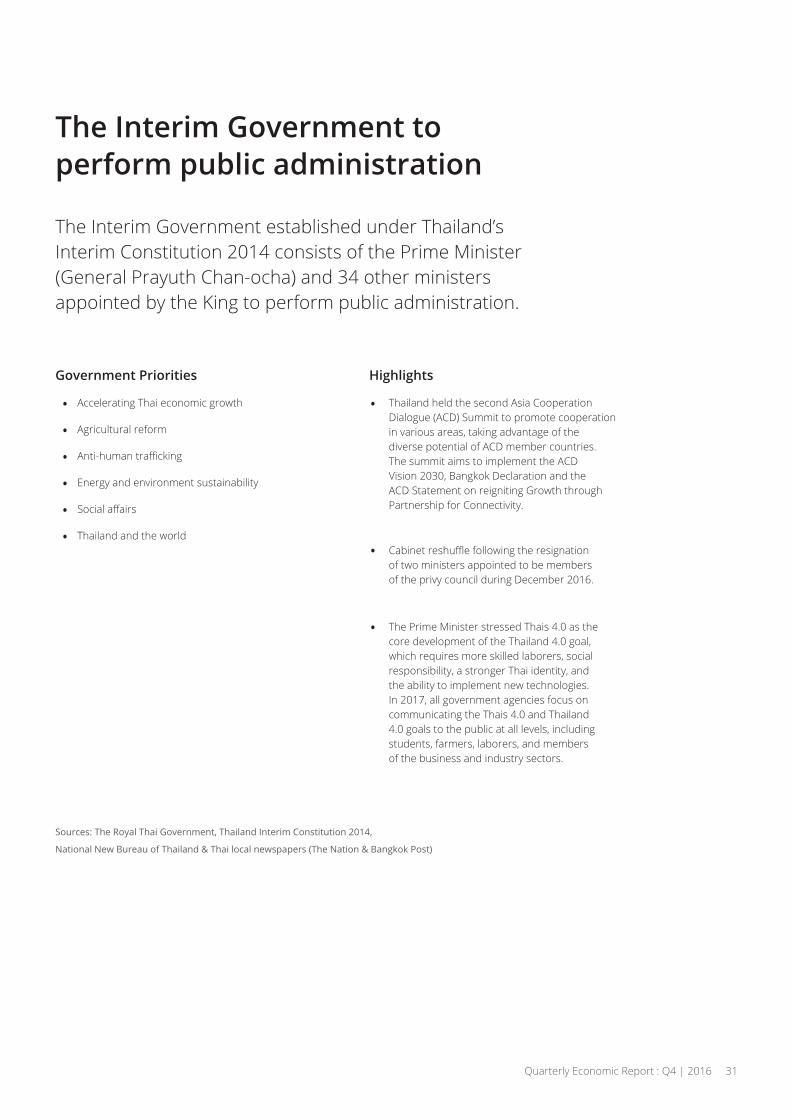
The Interim Government toperform public administration
The Interim Government established under Thailand’sInterim Constitution 2014 consists of the Prime Minister(General Prayuth Chan-ocha) and 34 other ministersappointed by the King to perform public administration.
Accelerating Thai economic growth
Agricultural reform
Energy and environment sustainability
Thailand and the world
.
.
.
.
.
.
.
.
.
Government Priorities
Thailand held the second Asia CooperationDialogue (ACD) Summit to promote cooperationin various areas, taking advantage of thediverse potential of ACD member countries.The summit aims to implement the ACDVision 2030, Bangkok Declaration and theACD Statement on reigniting Growth throughPartnership for Connectivity.
of two ministers appointed to be membersof the privy council during December 2016.
The Prime Minister stressed Thais 4.0 as thecore development of the Thailand 4.0 goal,which requires more skilled laborers, socialresponsibility, a stronger Thai identity, andthe ability to implement new technologies.In 2017, all government agencies focus oncommunicating the Thais 4.0 and Thailand4.0 goals to the public at all levels, includingstudents, farmers, laborers, and membersof the business and industry sectors.
Highlights
Sources: The Royal Thai Government, Thailand Interim Constitution 2014,
Quarterly Economic Report : Q4 | 2016 31
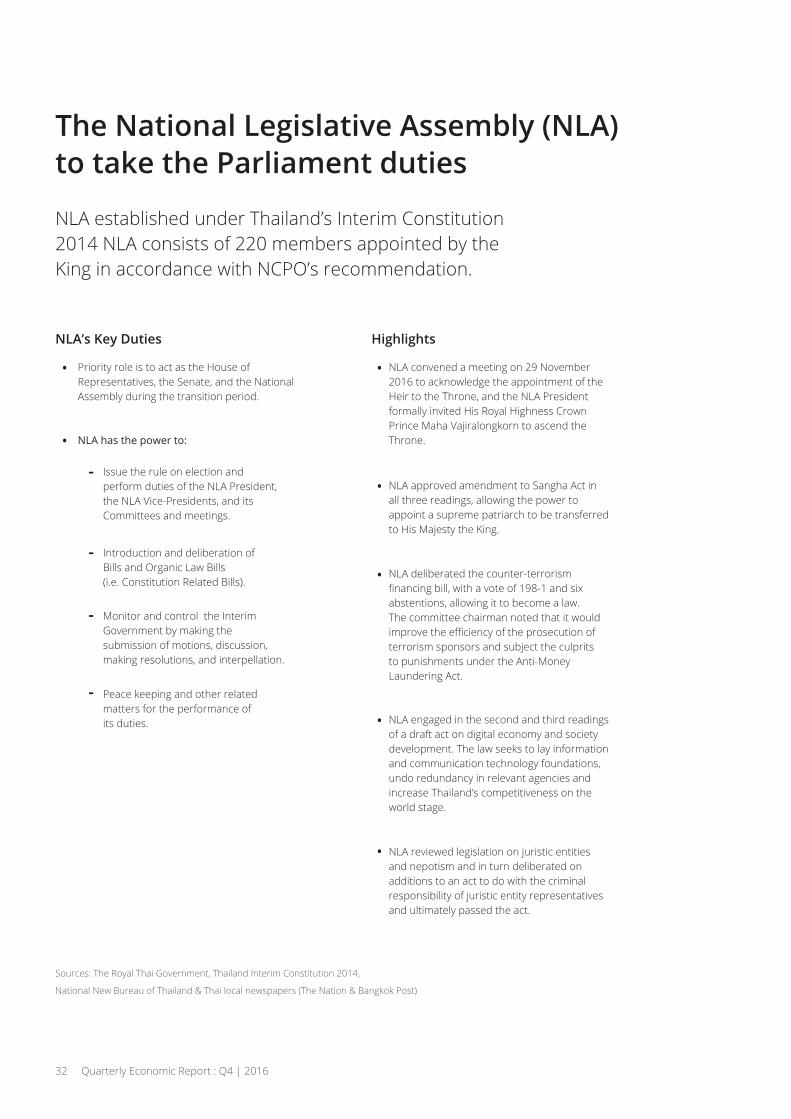
The National Legislative Assembly (NLA)to take the Parliament duties
NLA established under Thailand’s Interim Constitution2014 NLA consists of 220 members appointed by theKing in accordance with NCPO’s recommendation.
Priority role is to act as the House ofRepresentatives, the Senate, and the NationalAssembly during the transition period.
NLA has the power to:
Issue the rule on election andperform duties of the NLA President,the NLA Vice-Presidents, and itsCommittees and meetings.
Introduction and deliberation ofBills and Organic Law Bills(i.e. Constitution Related Bills).
Monitor and control the InterimGovernment by making thesubmission of motions, discussion,making resolutions, and interpellation.
Peace keeping and other relatedmatters for the performance ofits duties.
NLA’s Key Duties
NLA convened a meeting on 29 November2016 to acknowledge the appointment of theHeir to the Throne, and the NLA Presidentformally invited His Royal Highness CrownPrince Maha Vajiralongkorn to ascend theThrone.
NLA approved amendment to Sangha Act inall three readings, allowing the power toappoint a supreme patriarch to be transferredto His Majesty the King.
NLA deliberated the counter-terrorism
abstentions, allowing it to become a law.The committee chairman noted that it would
terrorism sponsors and subject the culpritsto punishments under the Anti-MoneyLaundering Act.
NLA engaged in the second and third readingsof a draft act on digital economy and societydevelopment. The law seeks to lay informationand communication technology foundations,undo redundancy in relevant agencies andincrease Thailand’s competitiveness on theworld stage.
NLA reviewed legislation on juristic entitiesand nepotism and in turn deliberated onadditions to an act to do with the criminalresponsibility of juristic entity representativesand ultimately passed the act.
Highlights
Sources: The Royal Thai Government, Thailand Interim Constitution 2014,
National New Bureau of Thailand & Thai local newspapers (The Nation & Bangkok Post)
. .
.
.
.
.
.-
-
-
-
32 Quarterly Economic Report : Q4 | 2016
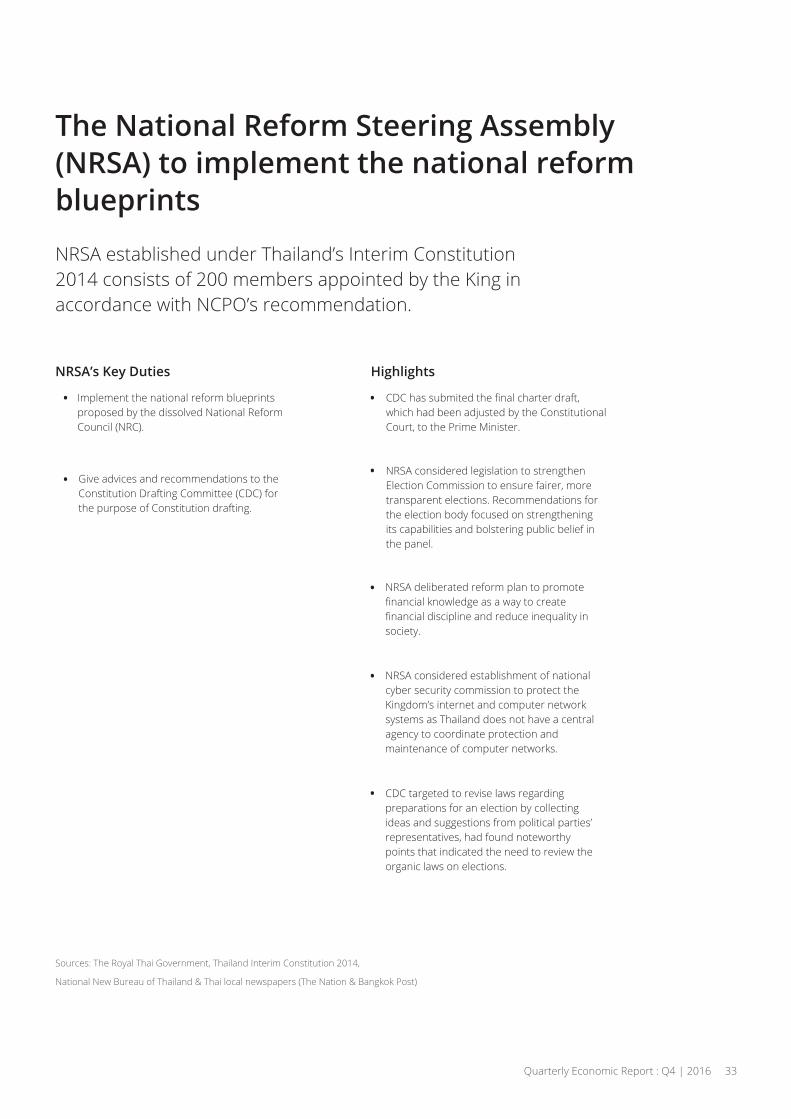
The National Reform Steering Assembly(NRSA) to implement the national reformblueprints
NRSA established under Thailand’s Interim Constitution2014 consists of 200 members appointed by the King inaccordance with NCPO’s recommendation.
Implement the national reform blueprintsproposed by the dissolved National ReformCouncil (NRC).
Give advices and recommendations to theConstitution Drafting Committee (CDC) forthe purpose of Constitution drafting.
NRSA’s Key Duties
which had been adjusted by the ConstitutionalCourt, to the Prime Minister.
NRSA considered legislation to strengthenElection Commission to ensure fairer, moretransparent elections. Recommendations forthe election body focused on strengtheningits capabilities and bolstering public belief inthe panel.
NRSA deliberated reform plan to promote
society.
NRSA considered establishment of nationalcyber security commission to protect theKingdom’s internet and computer networksystems as Thailand does not have a centralagency to coordinate protection andmaintenance of computer networks.
CDC targeted to revise laws regardingpreparations for an election by collectingideas and suggestions from political parties’representatives, had found noteworthypoints that indicated the need to review theorganic laws on elections.
Highlights
Sources: The Royal Thai Government, Thailand Interim Constitution 2014,
National New Bureau of Thailand & Thai local newspapers (The Nation & Bangkok Post)
. .
.
.
.
.
.
Quarterly Economic Report : Q4 | 2016 33
Business SurveyManaging in a Slowing Economy
Conducted by Deloitte ThailandPeriod: September – November 2016
“Risks to the global outlook remaintilted to the downside, with the worldfacing three big adjustments: theemerging-market slowdown, China’sshift to growth driven less by exportsand manufacturing, and the FederalReserve’s gradual exit from ultra-lowinterest rates. Global growth could bederailed if these challenges are notmanaged” – IMF
Quarterly Economic Report : Q4 | 2016 35
Contents
This section delineates the research objectivesaiming to understand on how companies fromvarious industries in Thailand will respondduring the period of slowing economy.
The scope of the survey will include topics ofinterest related to companies’ awareness andpotential actions for managing in theslow-growth economy.
Objectives
A detailed analysis conducted by DeloitteThailand’s specialists will be provided in thissection.
More than 100 respondents, mostly are top& senior executives participated in this survey.
Survey outcomes will be discussed in thissection. An in-depth summary will provide
strategies under the current economicslowdown.
With extensive experience in conductingresearch and business survey in Thailand
our ability to provide the high qualitysummary of the survey.
Findings Summary
36 Quarterly Economic Report : Q4 | 2016

Objectives
“It is evident that wemight be on the vergeof another economic
downturn if the debt crisisin Europe persists and theChinese bubble bursts.” –
Deloitte Thailand
Managingin a
SlowingEconomy
10-minute quantitativequestionnaire conducted online
Period: Sept 2016 – Nov 2016
How and When?
To understand the impactof the slowing economy onclients’ business decision-making and practices,and in turn, to improve our services accordingly
Why?DTTJ’s clients inThailand
Top & seniorexecutive levelstargeted
Who?
Quarterly Economic Report : Q4 | 2016 37
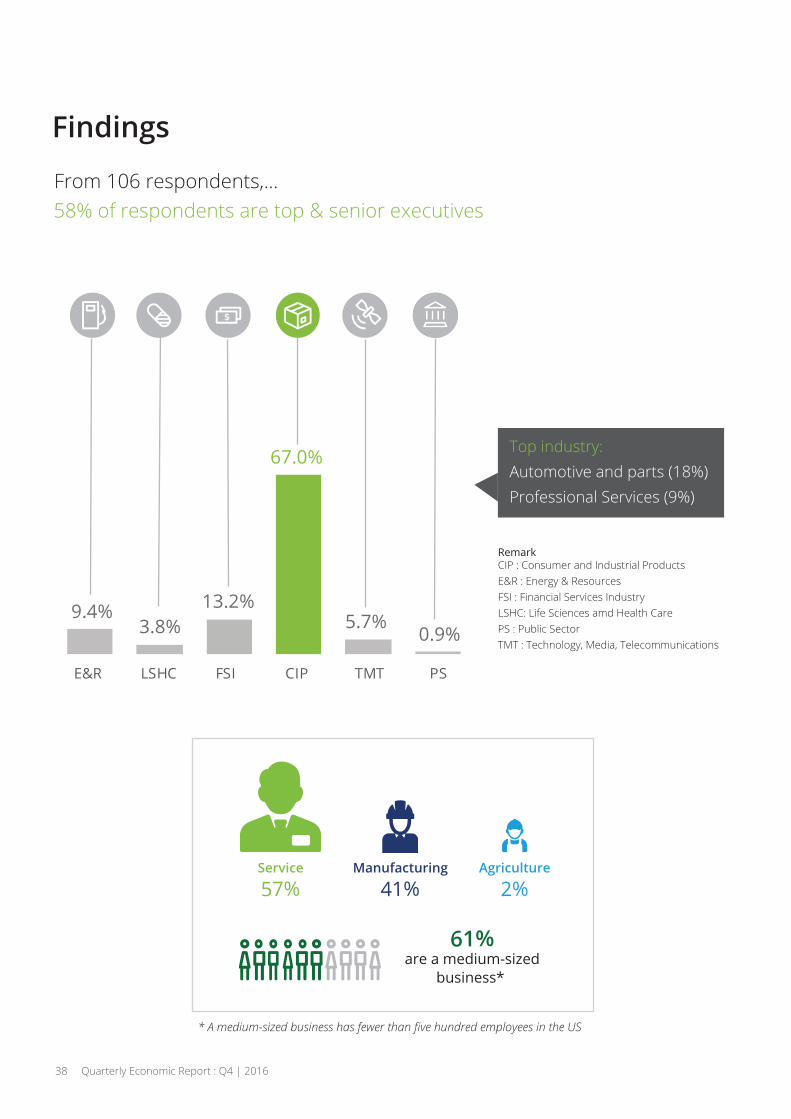
Findings
From 106 respondents,…
CIP : Consumer and Industrial ProductsE&R : Energy & ResourcesFSI : Financial Services IndustryLSHC: Life Sciences amd Health CarePS : Public SectorTMT : Technology, Media, Telecommunications
58% of respondents are top & senior executives
9.4%3.8%
13.2%
67.0%
5.7%0.9%
E&R LSHC FSI CIP TMT PS
Top industry: Automotive and parts (18%)Professional Services (9%)
Service
57%Manufacturing
41%Agriculture
2%
are a medium-sizedbusiness*
61%
38 Quarterly Economic Report : Q4 | 2016
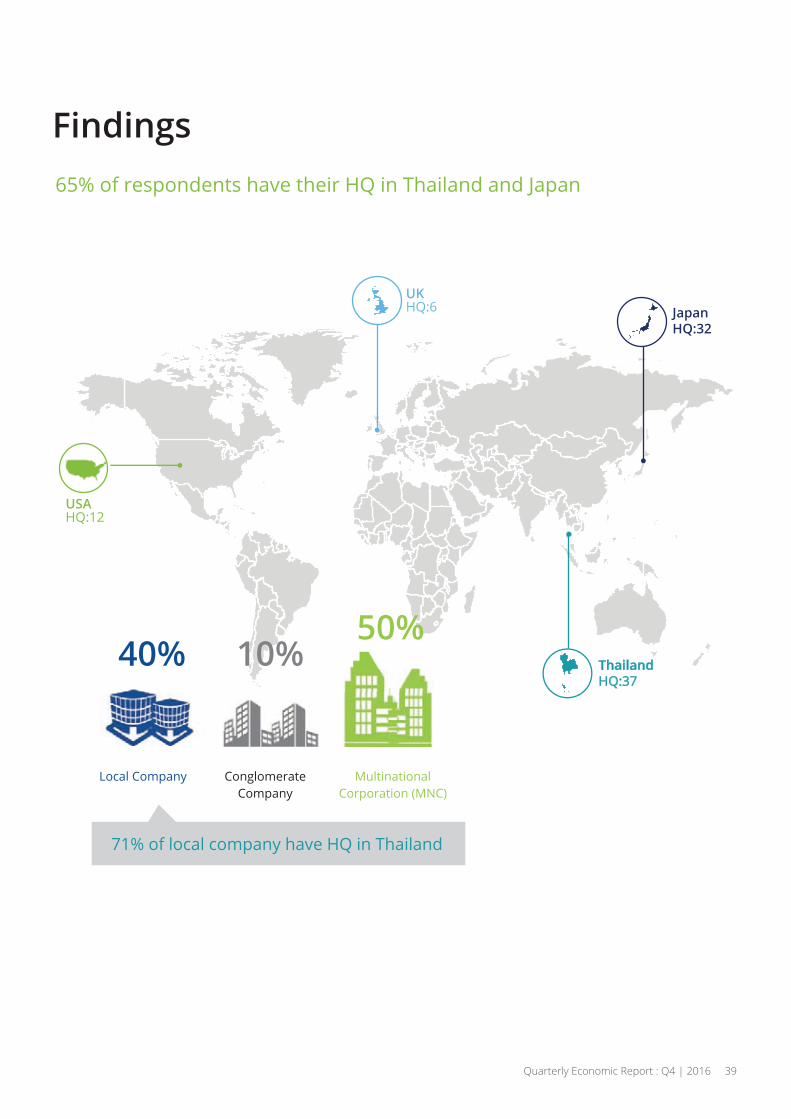
Findings
Local Company ConglomerateCompany
MultinationalCorporation (MNC)
USAHQ:12
UKHQ:6 Japan
HQ:32
ThailandHQ:37
40% 10%50%
Quarterly Economic Report : Q4 | 2016 39
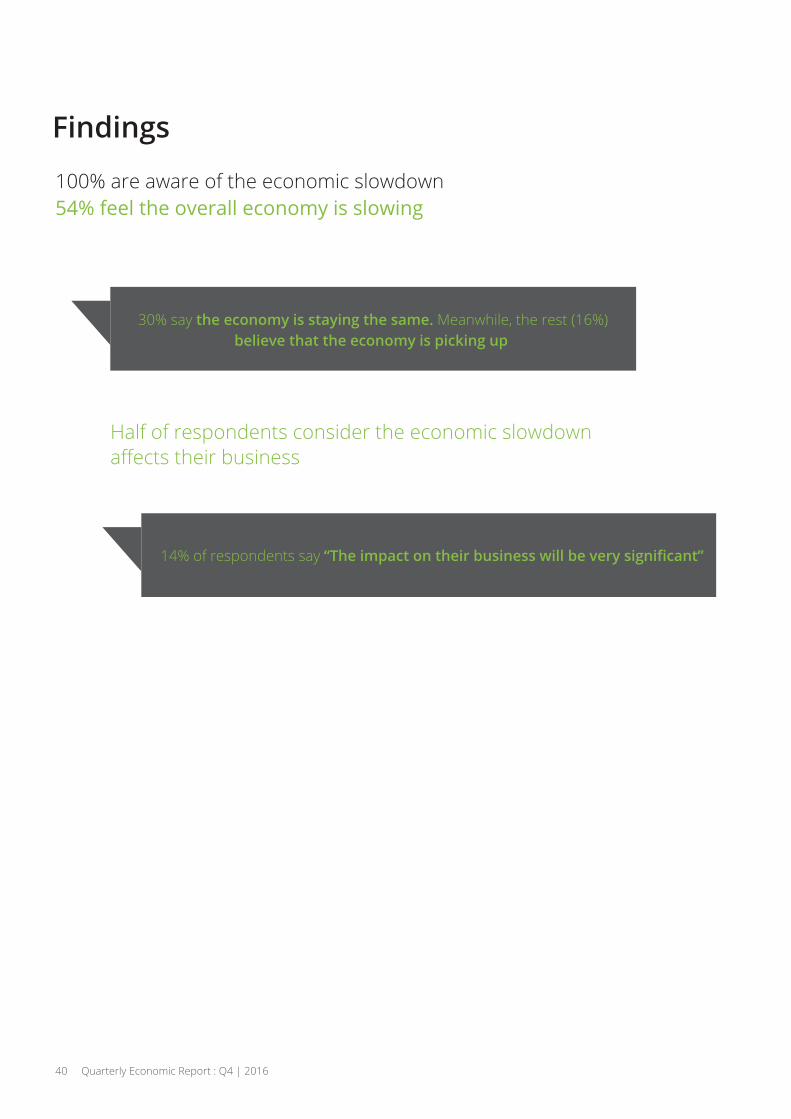
100% are aware of the economic slowdown
Half of respondents consider the economic slowdown
30% say the economy is staying the same. Meanwhile, the rest (16%)believe that the economy is picking up
14% of respondents say
Findings
40 Quarterly Economic Report : Q4 | 2016
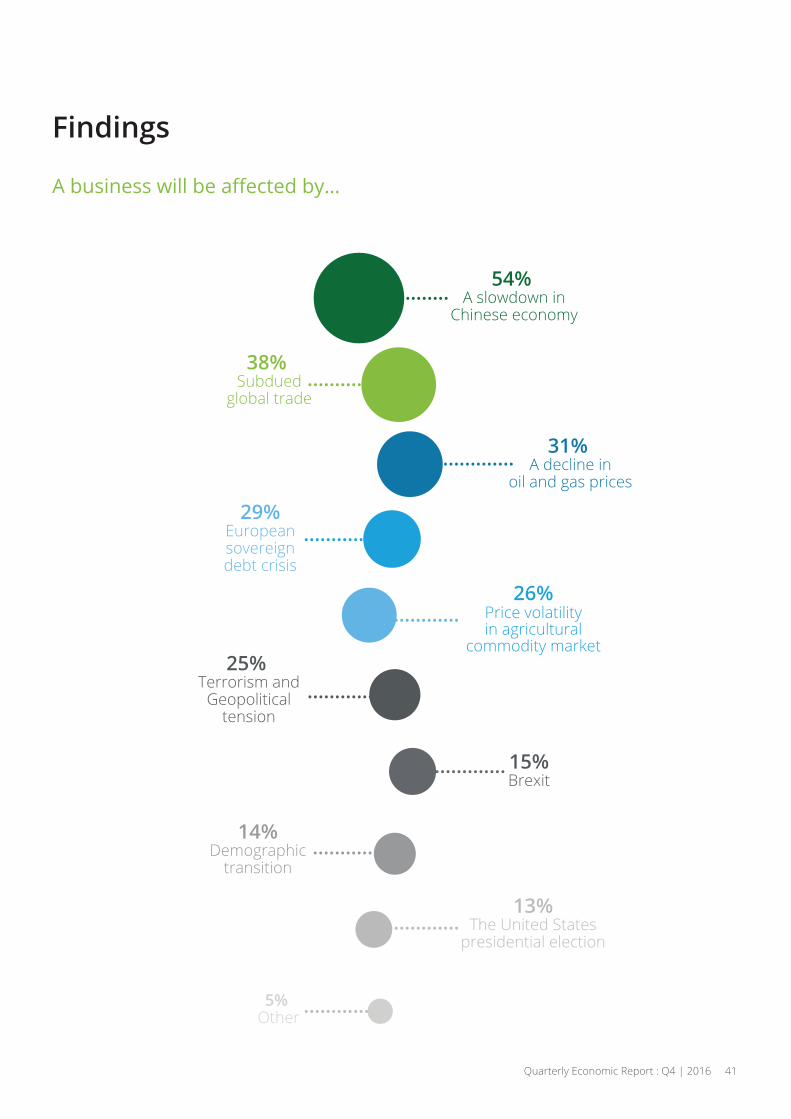
54%A slowdown in
Chinese economy.............
.............
.............
.............
.............
.............
.............
.............
.............
.............
38%Subdued
global trade
31%A decline in
oil and gas prices
26%Price volatilityin agricultural
commodity market
29%Europeansovereigndebt crisis
25%Terrorism and
Geopoliticaltension
15%Brexit
14%Demographic
transition
13%The United States
presidential election
5%Other
Findings
Quarterly Economic Report : Q4 | 2016 41
Findings
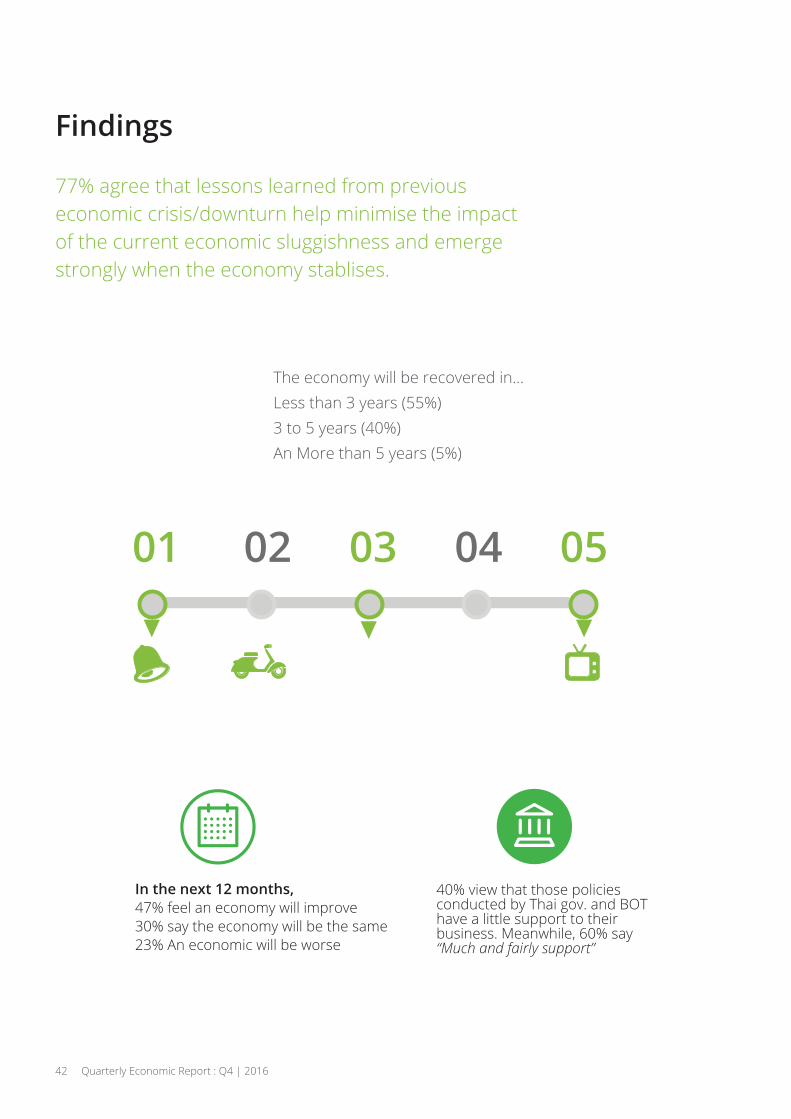
77% agree that lessons learned from previouseconomic crisis/downturn help minimise the impactof the current economic sluggishness and emergestrongly when the economy stablises.
The economy will be recovered in…Less than 3 years (55%)3 to 5 years (40%)An More than 5 years (5%)
01 02 03 04 05
In the next 12 months,47% feel an economy will improve30% say the economy will be the same23% An economic will be worse
40% view that those policiesconducted by Thai gov. and BOThave a little support to theirbusiness. Meanwhile, 60% say“Much and fairly support”
42 Quarterly Economic Report : Q4 | 2016
Findings
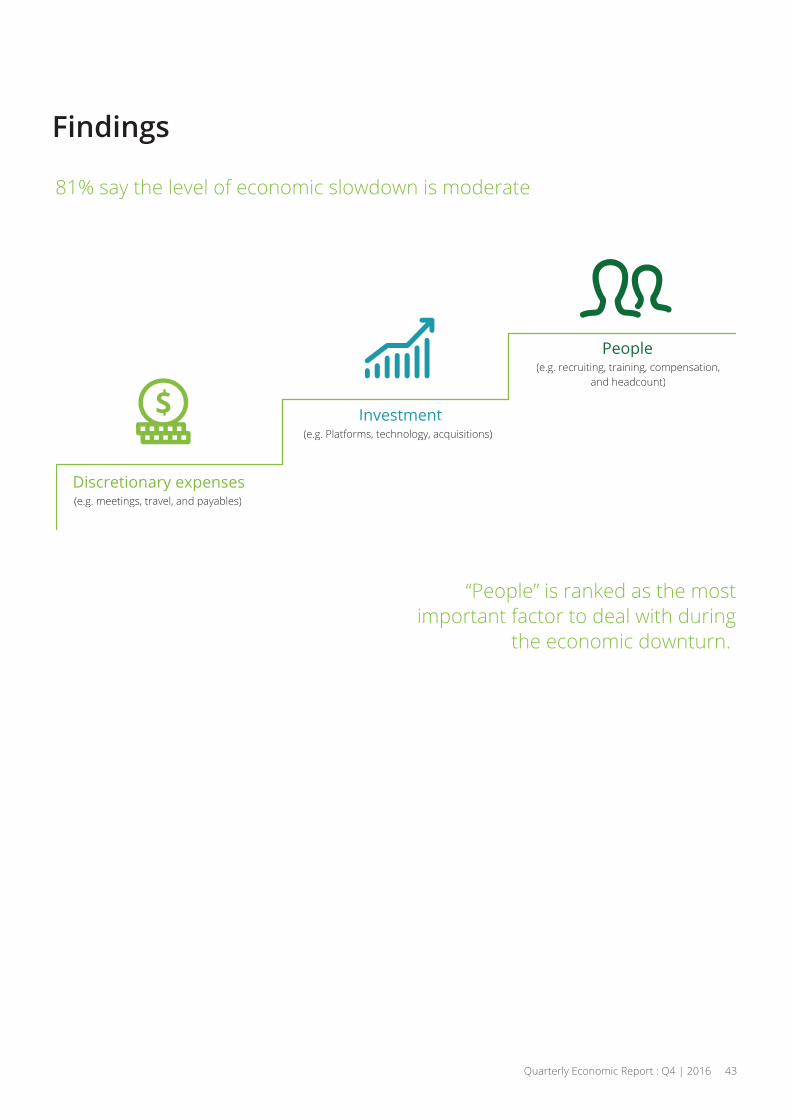
81% say the level of economic slowdown is moderate
“People” is ranked as the mostimportant factor to deal with during
the economic downturn.
(e.g. meetings, travel, and payables)Discretionary expenses
(e.g. Platforms, technology, acquisitions)Investment
(e.g. recruiting, training, compensation,and headcount)
People
(e.g. meetings, travel, and payables)Discretionary expenses
(e.g. Platforms, technology, acquisitions)Investment
(e.g. recruiting, training, compensation,and headcount)
People
Quarterly Economic Report : Q4 | 2016 43
Findings
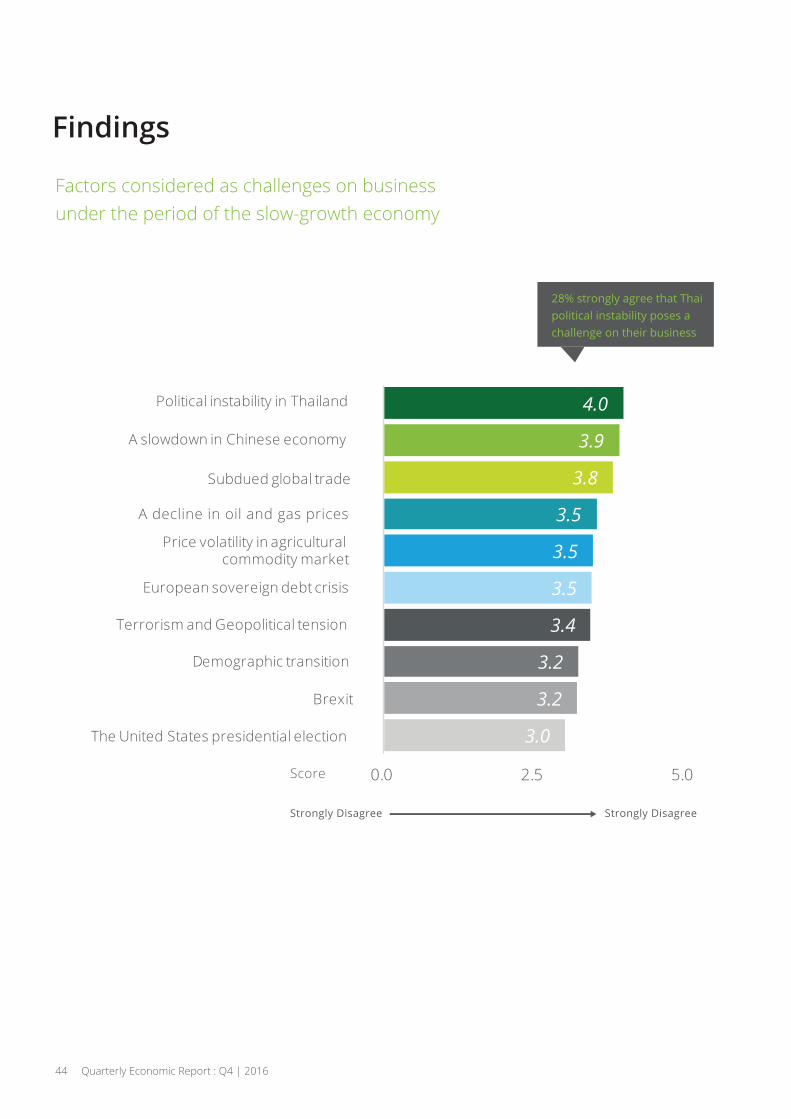
Factors considered as challenges on businessunder the period of the slow-growth economy
28% strongly agree that Thaipolitical instability pose achallenge on their business
3.0
3.2
3.2
3.4
3.5
3.5
3.5
3.8
3.9
4.0
0.0 2.5 5.0
The United States presidential election
Brexit
Demographic transition
Terrorism and Geopolitical tension
European sovereign debt crisis
Price volatility in agricultural commodity market
A decline in oil and gas prices
Subdued global trade
A slowdown in Chinese economy
Political instability in Thailand
44 Quarterly Economic Report : Q4 | 2016
Score
Strongly Disagree Strongly Disagree
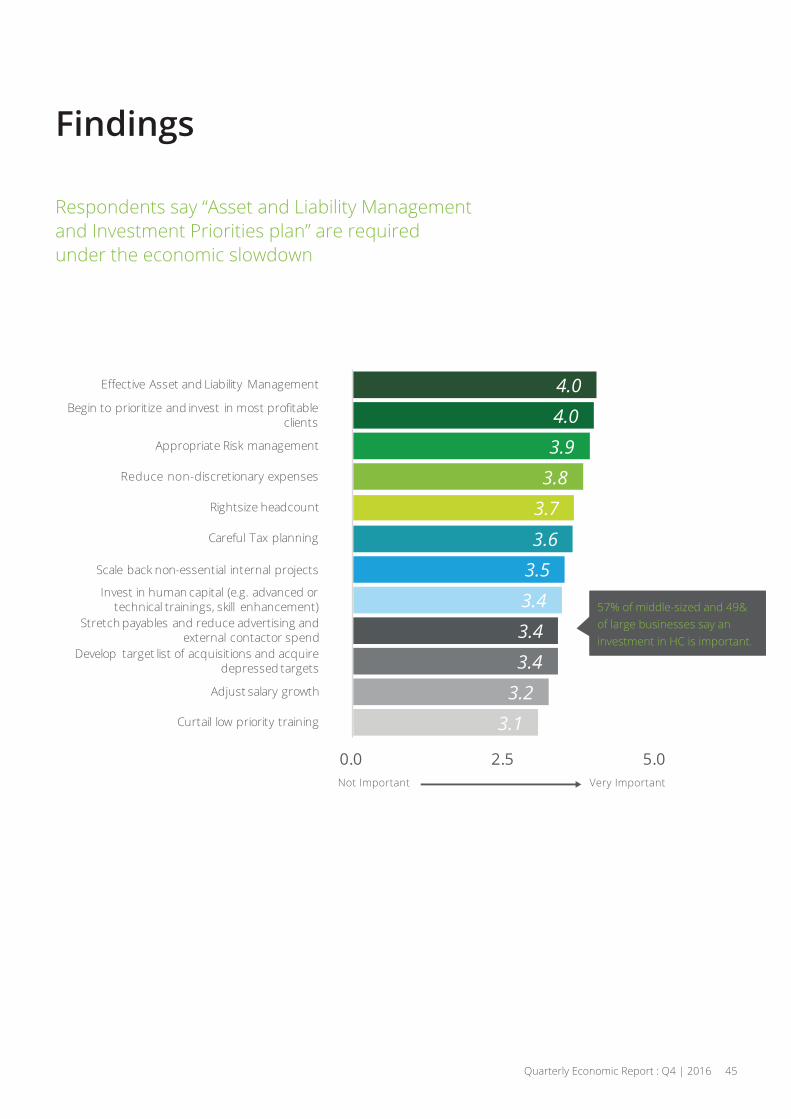
Findings
Respondents say “Asset and Liability Managementand Investment Priorities plan” are requiredunder the economic slowdown
3.1
3.2
3.4
3.4
3.4
3.53.6
3.7
3.8
3.9
4.0
4.0
0.0 2.5 5.0
Curtail low priority training
Adjust salary growth
Develop target list of acquisitions and acquire depressed targets
Stretch payables and reduce advertising and external contactor spend
Invest in human capital (e.g. advanced or technical trainings, skill enhancement)
Scale back non-essential internal projects
Careful Tax planning
Rightsize headcount
Reduce non-discretionary expenses
Appropriate Risk management
Begin to prioritize and invest in most pro table clients
E ective Asset and Liability Management
28% strongly agree that Thaipolitical instability pose achallenge on their business
57% of middle-sized and 49&of large businesses say aninvestment in HC is important.
Quarterly Economic Report : Q4 | 2016 45
Not Important Very Important
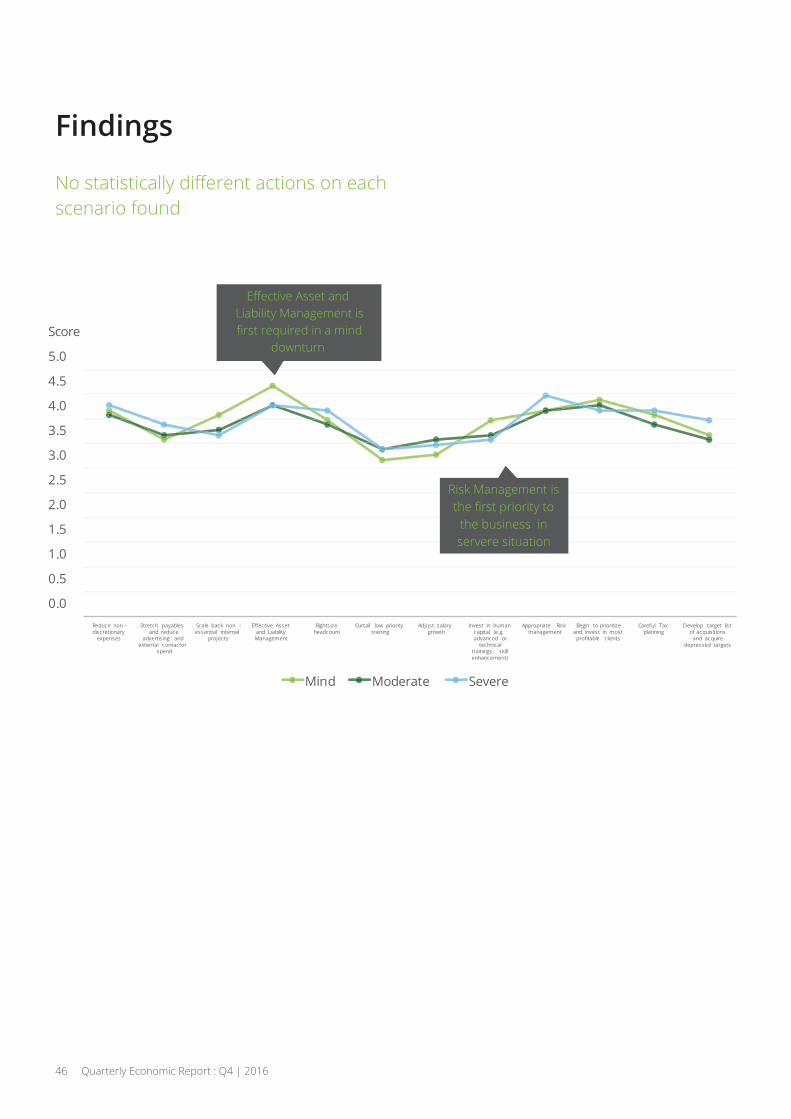
Findings
scenario found
0.0
0.5
1.0
1.5
2.0
2.5
3.0
3.5
4.0
4.5
5.0
Reduce non -discretionary
expenses
Stretch payables and reduce
advertising and external contactor
spend
Scale bac non -essential internal
projects
E ective Asset and Liability Management
Rightsize headcount
Curtail low priority training
Adjust salary growth
Invest in human capital (e.g. advanced or
technical trainings, s illenhancement)
Appropriate Rismanagement
Begin to prioritize and invest in most
pro table clients
Care ul Tax planning
Develop target list o acquisitions
and acquire depressed targets
Mind Moderate Severe
Liability Management is
downturn
Risk Management is
the business inserver situation
46 Quarterly Economic Report : Q4 | 2016
Score
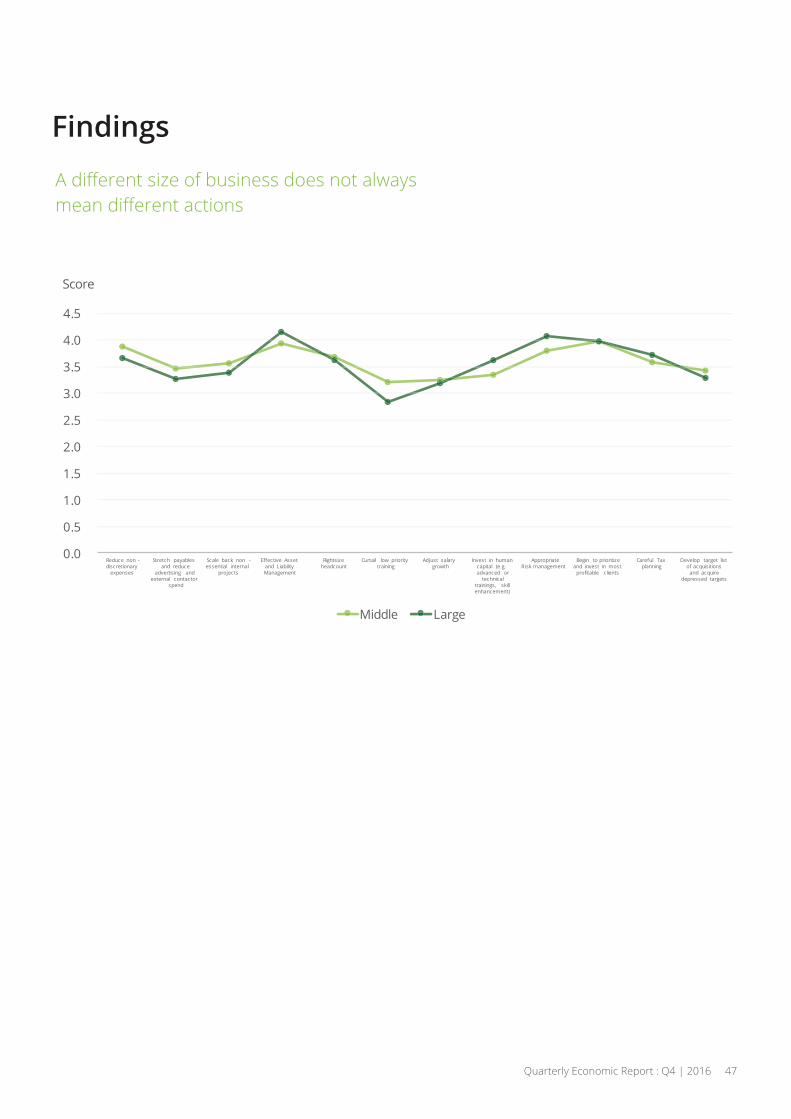
Findings
0.0
0.5
1.0
1.5
2.0
2.5
3.0
3.5
4.0
4.5
Reduce non -discretionary
expenses
Stretch payables and reduce
advertising and external contactor
spend
Scale bac non -essential internal
projects
E ective Asset and Liability Management
Rightsize headcount
Curtail low priority training
Adjust salary growth
Invest in human capital (e.g. advanced or
technical trainings, s illenhancement)
Appropriateanagement
Begin to prioritize and invest in most
pro table clients
Care ul Tax planning
Develop target list o acquisitions
and acquire depressed targets
Middle Large
Quarterly Economic Report : Q4 | 2016 47
Score

Summary
How to manage in a slowing economy:The voice of businesses
General InformationMost of respondents are Top & Senior
executives.
in Consumer & Industrial Product (CIP).
65% of respondents have HQ
in Japan and Thailand and
60% are a medium-sized business.
Perception & Awareness 100% are aware of the economic slowdown
their business.
A slowdown of Chinese economy, subdued
global trade, and a decline in energy prices
are considered as the top 3 challenges on
business.
60% of respondents believe that
government policies will help alleviate
the impacts of downturn.
The economy will be recovered in less
than 3 years said by 55%.
Potential ActionsIn respondents’ view, an economy is under
a moderate slowdown.
Political instability is ranked as the most
challenging factor to business.
clients and investment, and appropriate
potential actions to cope with economic
slowdown.
scenario (depth & duration) found.
1 2 3
48 Quarterly Economic Report : Q4 | 2016

Industry SectorUpdate
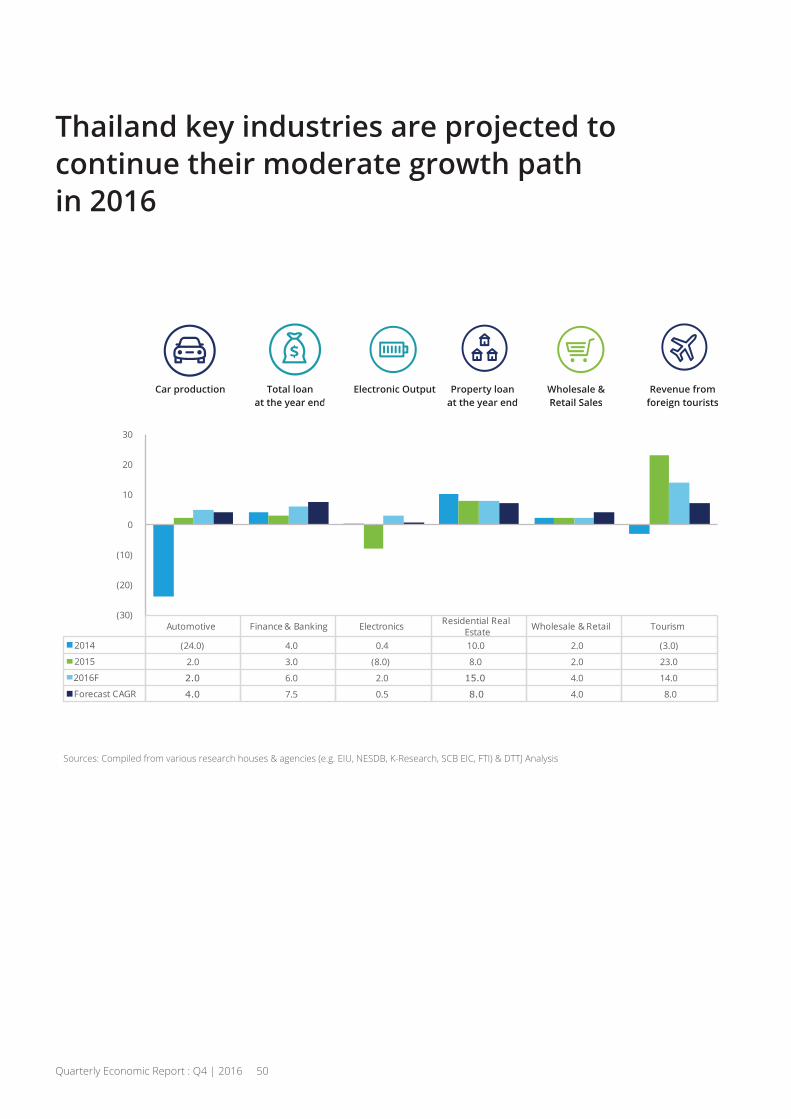
Thailand key industries are projected tocontinue their moderate growth pathin 2016
Car production Total loanat the year end
Electronic Output Property loanat the year end
Wholesale &Retail Sales
Revenue fromforeign touristsat the year end at the year end Retail Sales foreign tourists
Automotive Finance & Ban ing Electronics Residential Real Estate Wholesale & Retail Tourism
2014 (24.0) 4.0 0.4 10.0 2.0 (3.0)
2015 2.0 3.0 (8.0) 8.0 2.0 23.0
2016F 2.0 6.0 2.0 15.0 4.0 14.0
Forecast CAGR 4.0 7.5 0.5 8.0 4.0 8.0
(30)
(20)
(10)
0
10
20
30
Quarterly Economic Report : Q4 | 2016 50
Sources: Compiled from various research houses & agencies (e.g. EIU, NESDB, K-Research, SCB EIC, FTI) & DTTJ Analysis

Automotive
from export growth, while domestic marketcontracted since 2013. Total car productionwas 1.91 million units or grew by 2%compared to 2014s’. Car export reached1.2 million units or increased 7% YoY.However, domestic sales during 2015 was0.8 million units or 9% lower than 0.9 millionunits sold in 2014 due to the impact ofeconomic slowdown, lower commodityprices, and high level of household debt.
Car production is projected at 1.95 millionunits, growing 2% from 2015. Of which,62% of production is for export and 38%for domestic sales. Domestic car sales isforecasted at 0.75 million units or contracts 11%YoY due to the contraction of domesticcar demand, whilst car export is likely tomaintain the growth rate at 9%YoY thanksto growing demands in major exportmarkets.
As Thailand represents a regional strategiclocation for production along with the BOI’seco-car incentive scheme and mega-projectinvestment to enhance Thailand’scompetitiveness, major car producers willcontinue to deploy their production and
As analysts expect that overall globaleconomy will gradually capture an upwardgrowth trend in the coming years, Thailand’scar industry is projected to grow 4% over thelong-term.
Sources: ASEAN Automotive Federation (AAF), BOI, FTI, OIE & Thailand Automotive Institute
Thai automotive industry in 2016 is forecasted to grow 2%due to shrinking domestic market. Over the long-term,Thailand automotive industry is projected to have anupward moderate growth path.
Situation in 2015 Forecast 2016 Long-term trend
Automotive
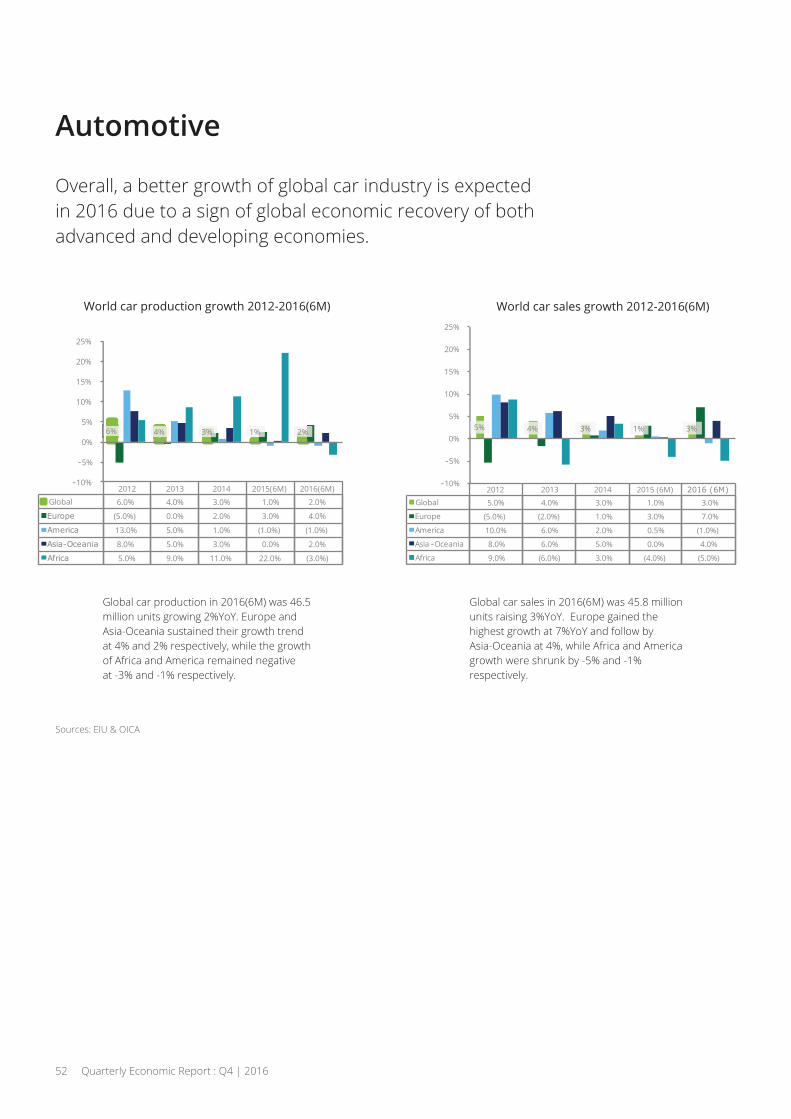
Global car production in 2016(6M) was 46.5million units growing 2%YoY. Europe andAsia-Oceania sustained their growth trendat 4% and 2% respectively, while the growthof Africa and America remained negativeat -3% and -1% respectively.
Global car sales in 2016(6M) was 45.8 millionunits raising 3%YoY. Europe gained thehighest growth at 7%YoY and follow byAsia-Oceania at 4%, while Africa and Americagrowth were shrunk by -5% and -1%respectively.
Sources: EIU & OICA
Overall, a better growth of global car industry is expectedin 2016 due to a sign of global economic recovery of bothadvanced and developing economies.
World car production growth 2012-2016(6M) World car sales growth 2012-2016(6M)
2012 2013 2014 2015 (6M) 2016 (6M)Global 5.0% 4.0% 3.0% 1.0% 3.0%
Europe (5.0%) (2.0%) 1.0% 3.0% 7.0%
America 10.0% 6.0% 2.0% 0.5% (1.0%)
Asia -Oceania 8.0% 6.0% 5.0% 0.0% 4.0%
A rica 9.0% (6.0%) 3.0% (4.0%) (5.0%)
5% 4% 3% 1% 3%
-10%
-5%
0%
5%
10%
15%
20%
25%
2012 2013 2014 2015(6M) 2016(6M)Global 6.0% 4.0% 3.0% 1.0% 2.0%
Europe (5.0%) 0.0% 2.0% 3.0% 4.0%
America 13.0% 5.0% 1.0% (1.0%) (1.0%)
Asia-Oceania 8.0% 5.0% 3.0% 0.0% 2.0%
Africa 5.0% 9.0% 11.0% 22.0% (3.0%)
6% 4% 3% 1% 2%
-10%
-5%
0%
5%
10%
15%
20%
25%
52 Quarterly Economic Report : Q4 | 2016
Automotive
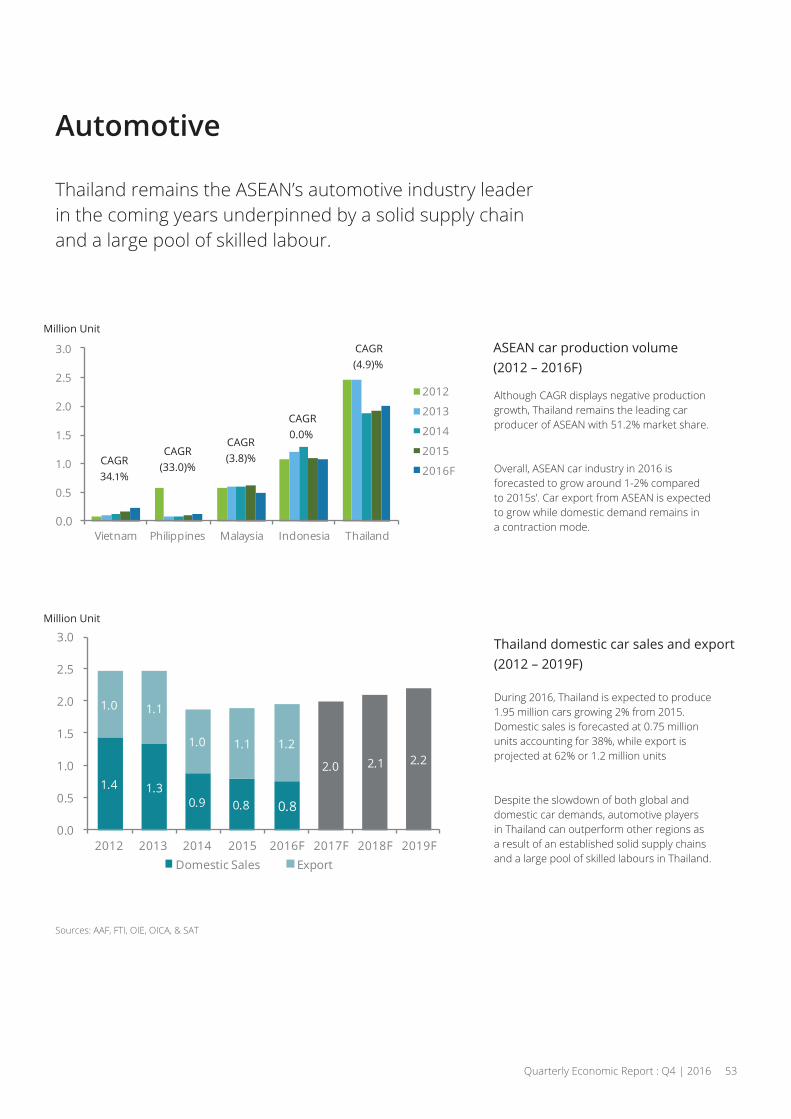
Although CAGR displays negative productiongrowth, Thailand remains the leading carproducer of ASEAN with 51.2% market share.
Overall, ASEAN car industry in 2016 isforecasted to grow around 1-2% comparedto 2015s’. Car export from ASEAN is expectedto grow while domestic demand remains ina contraction mode.
During 2016, Thailand is expected to produce1.95 million cars growing 2% from 2015.Domestic sales is forecasted at 0.75 millionunits accounting for 38%, while export isprojected at 62% or 1.2 million units
Despite the slowdown of both global anddomestic car demands, automotive playersin Thailand can outperform other regions asa result of an established solid supply chainsand a large pool of skilled labours in Thailand.
Sources: AAF, FTI, OIE, OICA, & SAT
Thailand remains the ASEAN’s automotive industry leaderin the coming years underpinned by a solid supply chainand a large pool of skilled labour.
ASEAN car production volume(2012 – 2016F)
Thailand domestic car sales and export(2012 – 2019F)
0.0
0.5
1.0
1.5
2.0
2.5
3.0
Vietnam Philippines Malaysia Indonesia Thailand
2012
2013
2014
2015
2016F
1.4 1.30.9 0.8 0.8
2.0 2.1 2.2
1.0 1.1
1.0 1.1 1.2
0.0
0.5
1.0
1.5
2.0
2.5
3.0
2012 2013 2014 2015 2016F 2017F 2018F 2019FDomestic Sales Export
Million Unit
Million Unit
CAGR34.1%
CAGR(33.0)%
CAGR(3.8)%
CAGR0.0%
CAGR4.9 %
Quarterly Economic Report : Q4 | 2016 53
Automotive
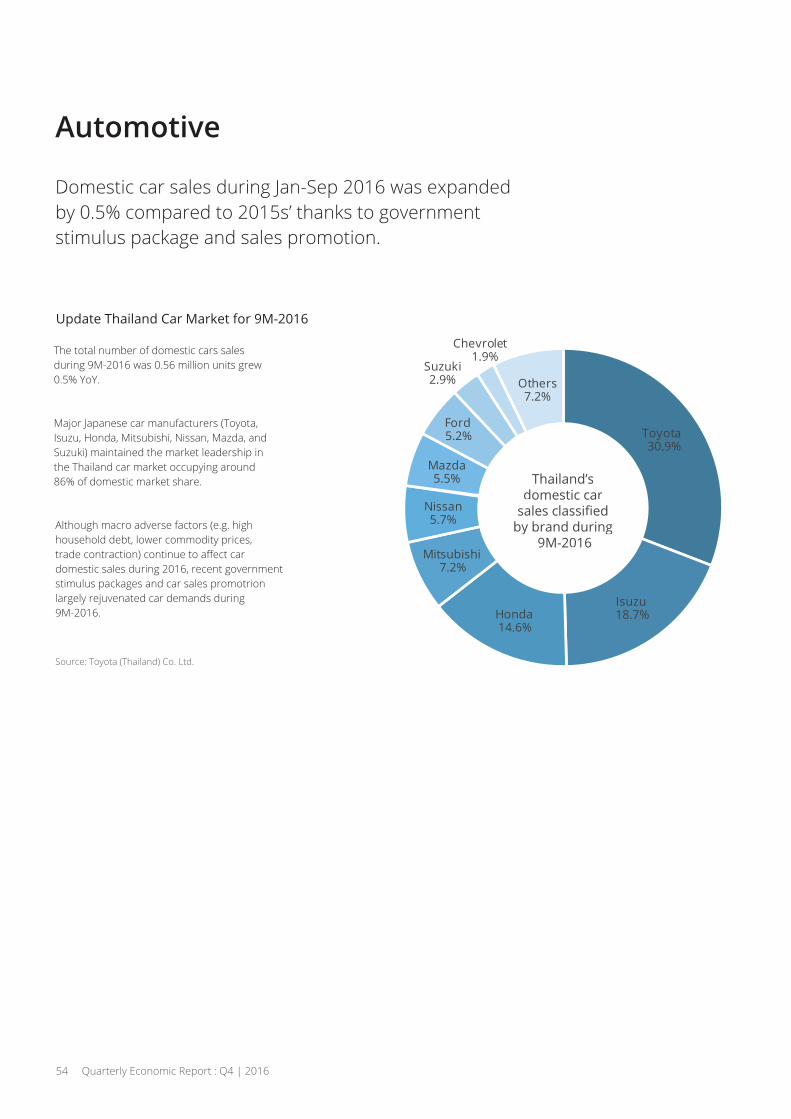
Domestic car sales during Jan-Sep 2016 was expandedby 0.5% compared to 2015s’ thanks to governmentstimulus package and sales promotion.
The total number of domestic cars salesduring 9M-2016 was 0.56 million units grew0.5% YoY.
Major Japanese car manufacturers (Toyota,Isuzu, Honda, Mitsubishi, Nissan, Mazda, andSuzuki) maintained the market leadership inthe Thailand car market occupying around86% of domestic market share.
Although macro adverse factors (e.g. highhousehold debt, lower commodity prices,
domestic sales during 2016, recent governmentstimulus packages and car sales promotrionlargely rejuvenated car demands during9M-2016.
Thailand’sdomestic car
by brand during 9M-2016
Source: Toyota (Thailand) Co. Ltd.
Thailand’sdomestic car
by brand during 9M-2016
Toyota30.9%
Isuzu18.7%Honda
14.6%
Mitsubishi7.2%
Nissan5.7%
Mazda5.5%
Ford5.2%
Suzu i2.9%
Chevrolet1.9%
Others7.2%
54 Quarterly Economic Report : Q4 | 2016
Automotive
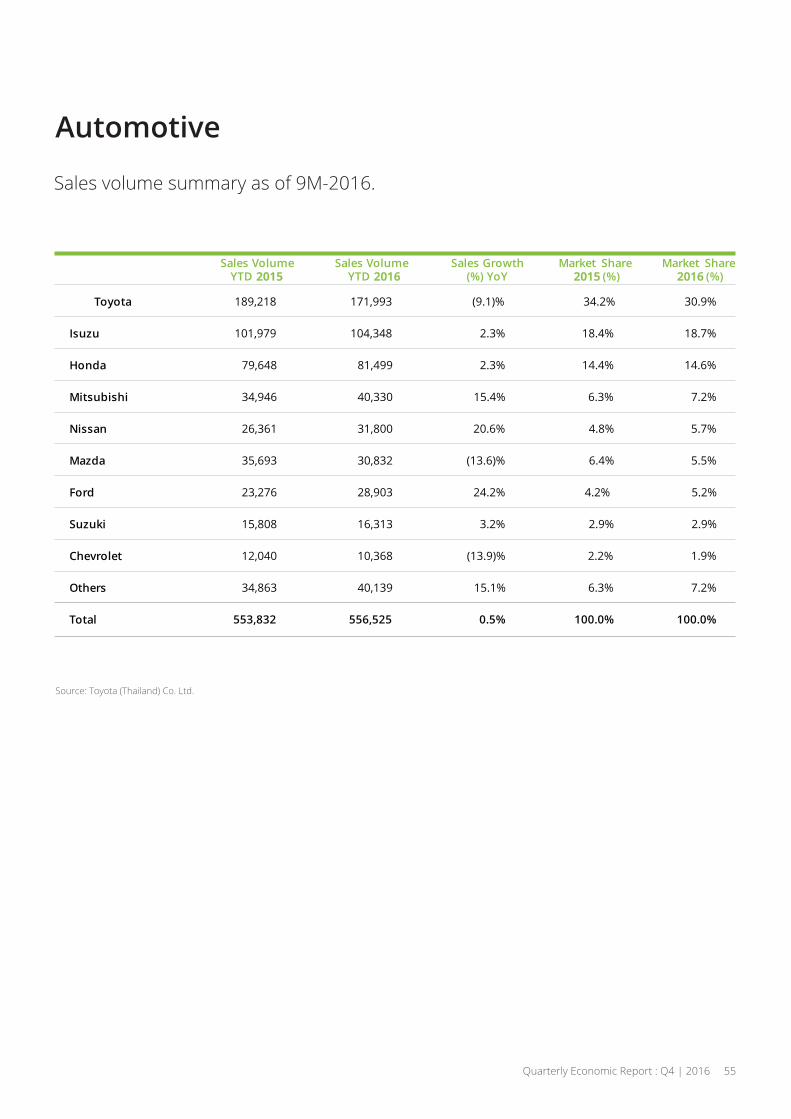
Sales volume summary as of 9M-2016.
Sales Volume YTD
Sales Volume YTD
Sales Growth (%) YoY
Market Share (%)
Market Share (%)
Toyota 189,218 171,993 (9.1)% 34.2% 30.9%
Isuzu 101,979 104,348 2.3% 18.4% 18.7%
Honda 79,648 81,499 2.3% 14.4% 14.6%
Mitsubishi 34,946 40,330 15.4% 6.3% 7.2%
Nissan 26,361 31,800 20.6% 4.8% 5.7%
Mazda 35,693 30,832 (13.6)% 6.4% 5.5%
Ford 23,276 28,903 24.2% 4.2% 5.2%
Suzuki 15,808 16,313 3.2% 2.9% 2.9%
Chevrolet 12,040 10,368 (13.9)% 2.2% 1.9%
Others 34,863 40,139 15.1% 6.3% 7.2%
Total 553,832 556,525 0.5% 100.0% 100.0%
Source: Toyota (Thailand) Co. Ltd.
Quarterly Economic Report : Q4 | 2016 55

Finance & Banking
As a result of domestic and global economic
(e.g. lower commodity prices, high level of
at 13.2 trillion Baht, growing 3% from 2014.
Overall, Thailand loan outstanding in 2016 isforecasted at 14.0 trillion Baht or grow 6% YoY.From Jan-Sep 2016, total loan outstandingwas 13.6 trillion Baht dropped 1.6% QoQ,but growing 5.0% YoY. Gross NPL in bankingindustry was 0.39 trillion Baht raisen 5.2%
conditions. Overall during 2016, loan demandsare expected to stem from an accommodativemonetary policy and public infrastructureinvestment.
Sources: EIU, K-Research, & SCB EIC
Finance & banking sector is projected to grow 6% in 2016mainly driven by accommodative monetary policy and
Financial institutions, will be posting loangrowth around 7-8%YoY over the next fewyears despite facing both external anddomestic downside risks. In addition, ThaiGovernment will continue to pursue bothshort-term and long-term economic stimulusschemes (e.g. SME incentives, transportationinfrastructure investments), which willstimulate both Bangkok and upcountryeconomic expansion, boost loan demandsacross Thailand, and also, provoke capitalmarkets to raise investment funds.
Situation in 2015 Forecast 2016 Long-term trend
56 Quarterly Economic Report : Q4 | 2016

Finance & Banking
Thailand’s total loans from January to September 2016was 13.6 trillion Baht declined 1.6% QoQ but grew 5.0% YoY.NPL proportion was 2.9% of total loan and NPL outstandingraised 5.3% QoQ or 9.2% YoY.
Overall, the growth of Thailand’s total loan outstanding is expected to accelerate from 3% in 2015 to 6% in 2016.
Both corporate and SME loan growth will be driven by public infrastructure investment, which also stimulates
private investment. Likewise, overall consumer loan segment will continue to its growth momentum
around 6-7% thanks to consumption demands and marketing campaigns. NPL proportion in 2016 is forecasted
at 2.8 - 3.0% compared to 2.6% in 2015 as a result of adverse economic conditions. Financial technology (FinTech)
Thailand’s total Loan vs. NPL 2006 – 9M/2016
0.4 0.5 0.4 0.4 0.3 0.3 0.3 0.3 0.3 0.3 0.4
6.0 6.2 7.5 7.8 8.8 9.811.3 12.3 12.9 13.2 13.6
0.0
2.0
4.0
6.0
8.0
10.0
12.0
14.0
16.0
2006 2007 2008 2009 2010 2011 2012 2013 2014 2015 9M/2016
CAGR8.6%
CAGR(1.2)%
Sources: BOT, EIU, SCB EIC, K-Research, TMB Analytics, & DTTJ Estimates (Data as of December 2016).
Note: (1) Total Loan includes both Thai banks’ and foreign banks’ loan outstanding as of the 3rd quarter 2006-2016.
(2) NPL includes both Thai banks’ and foreign banks’ gross NPL outstanding as of the 3rd quarter 2006-2016.
% NPL 7.5% 7.3% 5.3% 4.9% 3.6% 2.8% 2.3% 2.2% 2.2% 2.6% 2.9%
Quarterly Economic Report : Q4 | 2016 57
Trillion Baht
Total Loan
NPL
Finance & Banking
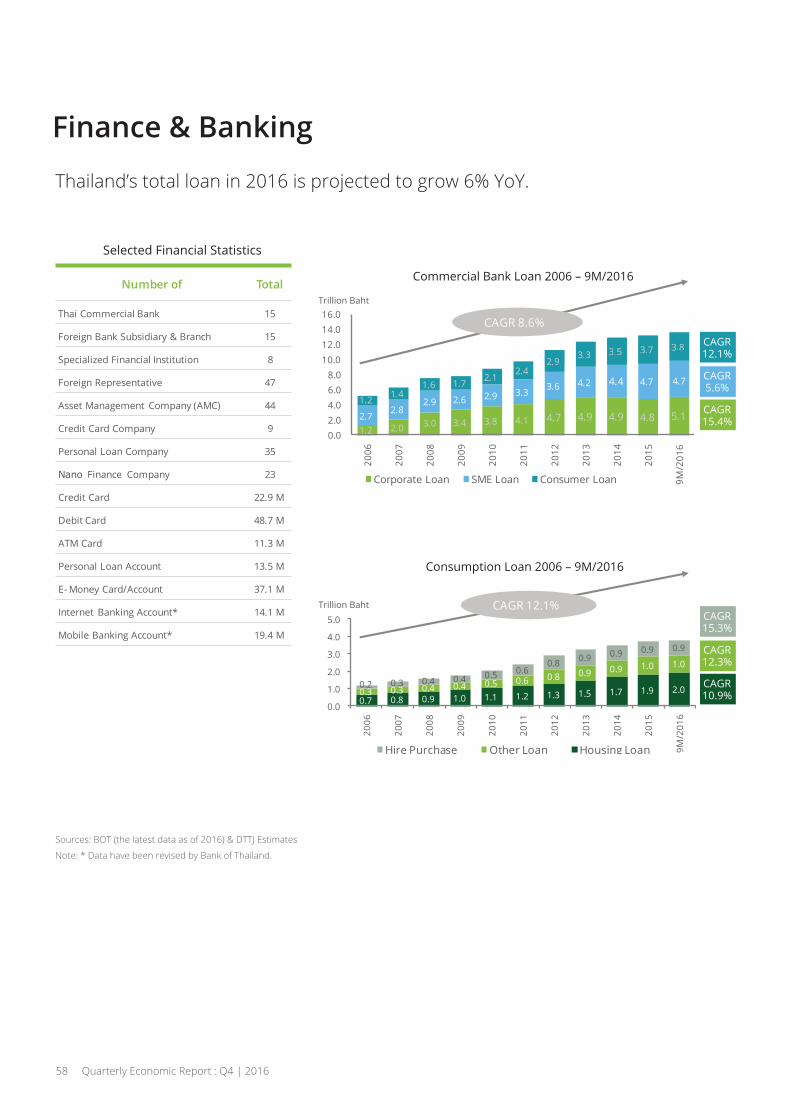
Thailand’s total loan in 2016 is projected to grow 6% YoY.
Selected Financial Statistics
Number of Total
Thai Commercial Ban 15
Foreign Ban Subsidiary & Branch 15
Specialized Financial Institution 8
Foreign Representative 47
Asset Management Company (AMC) 44
Credit Card Company 9
Personal Loan Company 35
Nano Finance Company 23
Credit Card 22.9 M
Debit Card 48.7 M
ATM Card 11.3 M
Personal Loan Account 13.5 M
E- Money Card/Account 37.1 M
Internet Ban ing Account* 14.1 M
Mobile Ban ing Account* 19.4 M
1.2 2.0 3.0 3.4 3.8 4.1 4.7 4.9 4.9 4.8 5.12.72.8
2.9 2.6 2.9 3.3 3.6 4.2 4.4 4.7 4.7
1.2 1.41.6 1.7 2.1
2.42.9
3.3 3.5 3.7 3.8
0.02.04.06.08.0
10.012.014.016.0
2006
2007
2008
2009
2010
2011
2012
2013
2014
2015
9M/2
016
Corporate Loan SME Loan Consumer Loan
0.7 0.8 0.9 1.0 1.1 1.2 1.3 1.5 1.7 1.9 2.00.3 0.3 0.4 0.4 0.5 0.6 0.8 0.9 0.9 1.0 1.0
0.2 0.3 0.4 0.4 0.5 0.60.8 0.9 0.9 0.9 0.9
0.0
1.0
2.0
3.0
4.0
5.0
2006
2007
2008
2009
2010
2011
2012
2013
2014
2015
9M/2
016
Hire Purchase Other Loan Housing Loan
2.93.3 3.5 3.7 3.8
CAGR 8.6%
CAGR 12.1%
Sources: BOT (the latest data as of 2016) & DTTJ Estimates
Note: * Data have been revised by Bank of Thailand.
Consumption Loan 2006 – 9M/2016
CAGR5.6%
CAGR12.1%
CAGR15.4%
CAGR12.3%
CAGR15.3%
CAGR10.9%
58 Quarterly Economic Report : Q4 | 2016
Trillion Baht
Trillion Baht

Finance & Banking
Total loan outstanding during January-September 2016 was 13.6 trillionBaht. Corporate, SME and Consumer loan proportion were 37.4%, 34.6%and 28.0% respectively. Interbank loan integrated into corporate segmentaccounted for 13.5% of total loan outstanding.
Loan growth comparisons
Loan proportion in 9M/2016 Loan proportion in 9M/2016
Consumer28.0%
SME34.6%
Corporate37.4%
9M/2015 H1/2016 9M/2016%YoY
%QoQ
Corporate 4.7 5.2 5.1 8.2% (2.7)%
SME 4.6 4.7 4.7 1.9% (0.4)%
Consumer 3.6 3.8 3.8 5.2% 0.8%
Total 12.9 13.7 13.6 5.1% (1.0)%
Source: Bank of Thailand (as of December 2016)
(Unit: Trillion Baht)
Quarterly Economic Report : Q4 | 2016 59

Electronics
Electronic industry outputs were contractedby 7.9% compared to 2014s’ due to theslowdown of global and domestic demands.Computer and part dropped by 10.2%, whiledomestic electrical appliances werecontracted 4.4% from the previous period.
The production of computer and parts isforecasted to shrink at 8%, while domesticappliances are projected to rise at 4%.However, Thai electronic export is expectedto shrink at 1% due to the sluggish demandof electronic inputs and products in exportmarkets.
Thailand’s electronic industry, especiallycomputer and parts, has been facing highcompetition and global demand uncertaintywith the projected long-term growth at 0-1%.In turn, computer and part players acrossthe world will create their new growth modelsto counter the aggressive moves ofsmartphone and tablet rivals (e.g. Samsung,Apple, Lenovo, Huawei, Xiaomi). For electronicappliance industry, although Thailand nolonger gains advantages as the regionalproduction-base, both export markets anddomestic demands for some products(e.g. air conditioners, refrigerators) are likelyto maintain their growth path in the comingyears.
Thailand’s electronic industry continues its downward
as well as shifting production-base.
Situation in 2015 Forecast 2016 Long-term trend
Sources: OIE & MOC
60 Quarterly Economic Report : Q4 | 2016
Electronics - computurs & parts
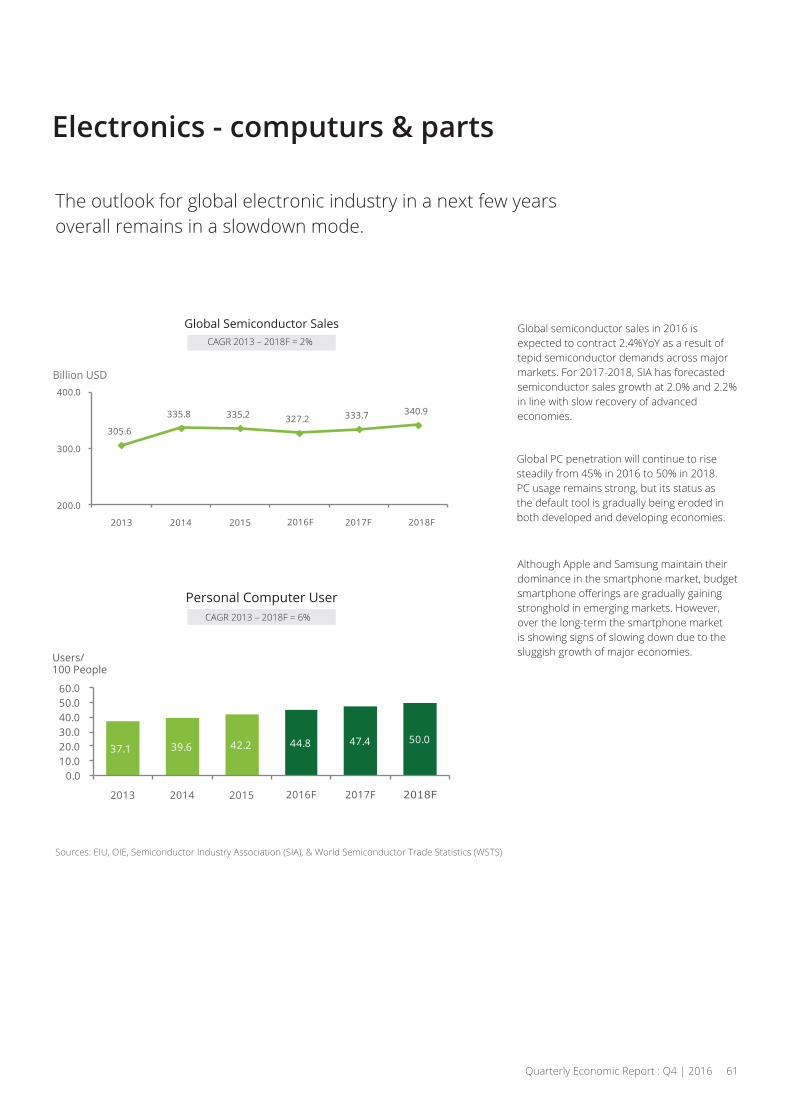
Global semiconductor sales in 2016 isexpected to contract 2.4%YoY as a result oftepid semiconductor demands across majormarkets. For 2017-2018, SIA has forecastedsemiconductor sales growth at 2.0% and 2.2%in line with slow recovery of advancedeconomies.
Global PC penetration will continue to risesteadily from 45% in 2016 to 50% in 2018.PC usage remains strong, but its status asthe default tool is gradually being eroded inboth developed and developing economies.
Although Apple and Samsung maintain theirdominance in the smartphone market, budget
stronghold in emerging markets. However,over the long-term the smartphone marketis showing signs of slowing down due to thesluggish growth of major economies.
The outlook for global electronic industry in a next few yearsoverall remains in a slowdown mode.
Global Semiconductor SalesCAGR 2013 – 2018F = 2%
Billion USD
Users/100 People
Personal Computer User
Sources: EIU, OIE, Semiconductor Industry Association (SIA), & World Semiconductor Trade Statistics (WSTS)
Billion USD
305.6
335.8 335.2 327.2 333.7 340.9
200.0
300.0
400.0
2013 2014 2015 2016F 2017F 2018F
100 People
37.1 39.6 42.2 44.8 47.4 50.0
0.010.020.030.040.050.060.0
2013 2014 2015 2016F 2017F 2018F
CAGR 2013 – 2018F = 6%
Quarterly Economic Report : Q4 | 2016 61
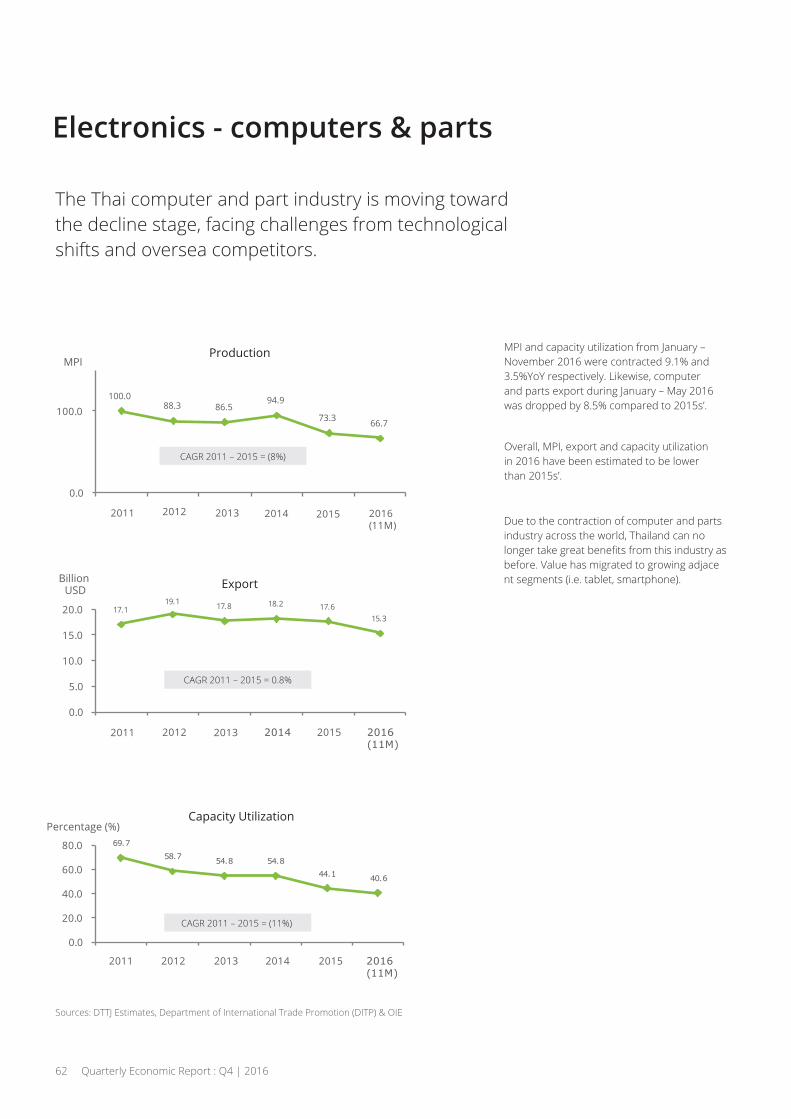
Electronics - computers & parts
MPI and capacity utilization from January –November 2016 were contracted 9.1% and3.5%YoY respectively. Likewise, computerand parts export during January – May 2016was dropped by 8.5% compared to 2015s’.
Overall, MPI, export and capacity utilizationin 2016 have been estimated to be lowerthan 2015s’.
Due to the contraction of computer and partindustry across the world, Thailand can no
asbefore. Value has migrated to growing adjacent segments (i.e. tablet, smartphone).
The Thai computer and part industry is moving towardthe decline stage, facing challenges from technologicalshifts and oversea competitors.
Production
Export
Capacity Utilization
Sources: DTTJ Estimates, Department of International Trade Promotion (DITP) & OIE
100.088.3 86.5
94.9
73.3 66.7
0.0
100.0
2011 2012 2013 2014 2015 2016(11M)
17.119.1 17.8 18.2 17.6
15.3
0.0
5.0
10.0
15.0
20.0
2011 2012 2013 2014 2015 2016(11M)
Sources: DTTJ Estimates, Department of International Trade Promotion (DITP) & OIE
69.758.7 54.8 54.8
44.1 40.6
0.0
20.0
40.0
60.0
80.0
2011 2012 2013 2014 2015 2016(11M)
BillionUSD
Percentage (%)
MPI
CAGR 2011 – 2015 = 0.8%
CAGR 2011 – 2015 = (11%)
CAGR 2011 – 2015 = (8%)
62 Quarterly Economic Report : Q4 | 2016

Electronics - domestic electrical appliances
From January – November 2016, MPI andcapacity utilization increased by 3.8% and2.8%YoY respectively. Likewise, export duringthe same period declined by 4%YoY.
Despite struggling in the recent years,Thailand remains competitive for severaldomestic appliance products such as airconditioners, refrigerator among them.
The new Thailand’s BOI investment policyprovides attractive schemes for investors,but also encourage them to deploy Thailandas a springboard to other AEC member statesin the coming years.
Domestic electrical appliance’s production and capacityutilization are projected to grow in 2016, while exportis expected to have a negative growth.
Production
Export
Capacity Utilization
Sources: DTTJ Estimate, DITP, & OIENote: Domestic Appliances include several electrical products such as air conditioner, rice cooker, refrigerator, water pot, electric fan and so on.
60.0
80.0
100.0
120.0
Billion USD
Percentage (%)
MPI
CAGR 2011 – 2015 = (1%)
CAGR 2011 – 2015 = 1.5%
CAGR 2011 – 2015 = (2%)
Quarterly Economic Report : Q4 | 2016 63
Man
ufac
turin
g Pr
oduc
tion
Inde
x (B
ase
Year
201
1 =
100)
20.0
15.0
10.0
5.0
0.0
100.0109.0
97.1 96.6 94.298.7
2011 2012 2013 2014 2015 2016 (11M)
80.0
60.0
40.0
2011 2012 2013 2014 2015 2016 (11M)
2011 2012 2013 2014 2015 2016 (11M)
14.9 14.8 14.7 14.6 14.012.4
64.9
72.2
64.5 64.3 62.265.5
Residential Real Estate
Real estate markets were solid during 2015,
estate sector improved. Nevertheless,various factors such as higher householddebt, low commodities prices and slowgovernment budget disbursement shook
resulted in the lower growth in real estatemarket. Property credit outstanding by theend of 2015 reached 2.5 trillion Baht or grew9% from 2014.
Thailand’s property loan outstanding wasprojected to grow by 15%, especially inBangkok and vicinity area due to publicinvestment in infrastructure projects andgovernment real estate incentives. Likewise,regional mega-project investments includingrailway double-tracking, motorways, andnew mass-transit routes will encourage thegrowth of property market nationwide.
The forecasted long-term GDP growth ofThailand at 3.0-3.5% in conjunction withglobal economic sluggish growth is likely to
in Thailand. In the wake of higher housingdebt, it is expected that lenders will tightenup the mortgage criteria and decelerate thedemand for house. Nonetheless, the ASEANintegrated market should help increasedemand for commercial and residential
to move their headquarters and some stages
Both rising GDP per capita and accelerating urbanizationcontinue to boost Thailand’s real estate sector. However,the growth rate has been restricted by an increase in thehigh level of household debt and some concerns overlower demand in the future.
Situation in 2015 Forecast 2016 Long-term trend
Sources: BOT, Plus Property, & SCB EIC
64 Quarterly Economic Report : Q4 | 2016

TrillionBaht
1.01.1
1.3 1.31.4
1.61.8
2.12.3
2.5 2.6
Residential Real Estate
Mortgage stimulus package in conjunctionwith attractive lending interest rates as wellas infrastructure investment in major regionalprovinces have contributed largely to thegrowth of property loan during 2016 andyears after.
During 9M/2016, residential and commercialconstruction activities were contracted by10.6% and 15.5% compared to 2015s’respectively, while industrial construction
Property loan continued its growth path in 2016 underpinned
Sources: BOT, GHB, REIC & DTTJ Estimates
Million M3
Permitted Construction Areas in Municipal Zones
CAGR 2006 – 2016F = 0.6%
Property Loan Outstanding
CAGR 2006 – 2016F = 10%
13.7 12.9 12.5 11.0 12.515.1 15.8 16.2 16.3
13.69.2
3.52.4 2.9
3.82.9
5.4 5.9 4.8 3.53.8
2.4
2.42.0 2.1 2.3 2.6
3.64.4
3.0 3.73.4
2.9
0.0
5.0
10.0
15.0
20.0
25.0
30.0
2006
2007
2008
2009
2010
2011
2012
2013
2014
2015
9M/2
016
Industrial Commercial Residential
19.617.4 17.5 17.0
18.0
24.226.1
24.1 23.4
20.7
14.7
0.7 0.8 0.9 1.0 1.1 1.2 1.3 1.5 1.7 1.8 1.90.3 0.4
0.4 0.40.4
0.40.5
0.50.6
0.6 0.6
0.0
0.5
1.0
1.5
2.0
2.5
3.0
2006
2007
2008
2009
2010
2011
2012
2013
2014
2015
9M/2
016
Developer Loan
Personal Housing Loan
Quarterly Economic Report : Q4 | 2016 65
Residential Real Estate
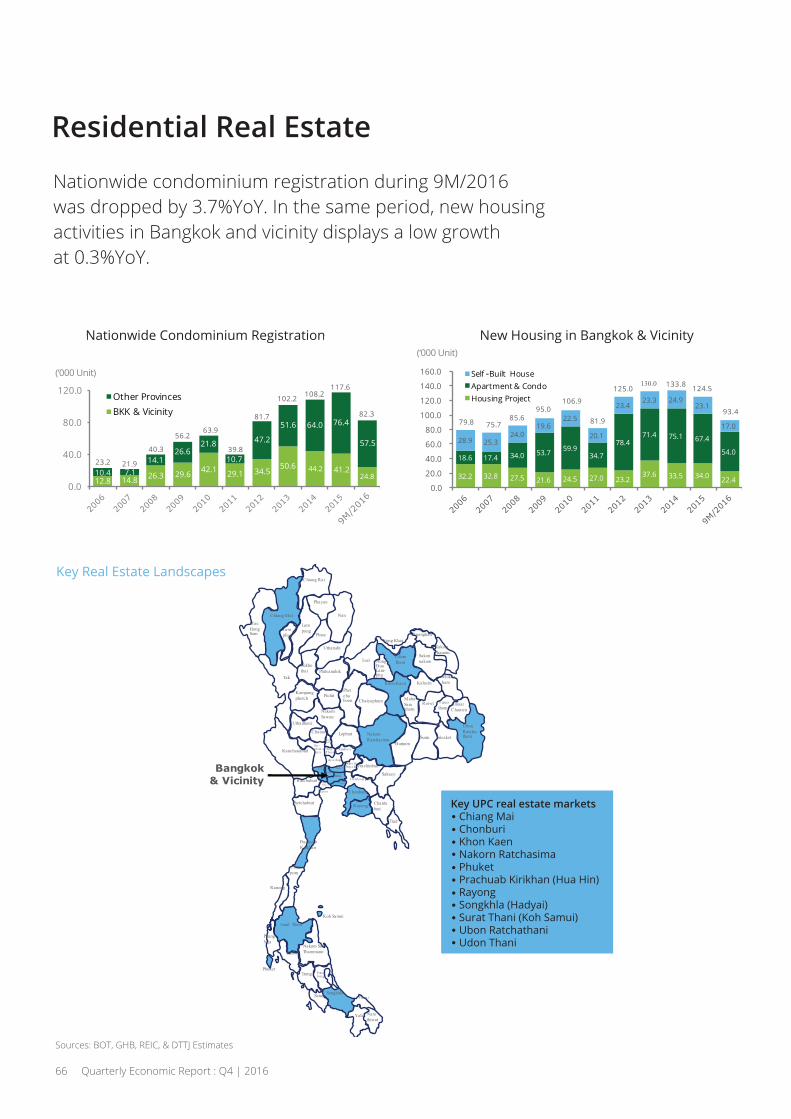
Nationwide condominium registration during 9M/2016was dropped by 3.7%YoY. In the same period, new housingactivities in Bangkok and vicinity displays a low growthat 0.3%YoY.
Nationwide Condominium Registration
Sources: BOT, GHB, REIC, & DTTJ Estimates
Bangkok & Vicinity
Nationwide Condominium Registration
12.8 14.8 26.3 29.6 42.1 29.1 34.550.6 44.2 41.2
24.810.4 7.114.1
26.621.8
10.7
47.2
51.6 64.0 76.4
57.5
0.0
40.0
80.0
120.0Other ProvincesBKK & Vicinity
23.2 21.9
40.3
56.263.9
39.8
81.7
102.2 108.2117.6
82.3
32.2 32.8 27.5 21.6 24.5 27.0 23.237.6 33.5 34.0 22.4
18.6 17.4 34.0 53.7 59.934.7
78.471.4 75.1 67.4
54.028.9 25.3
24.019.6
22.5
20.1
23.423.3 24.9
23.1
17.0
0.0
20.0
40.0
60.0
80.0
100.0
120.0
140.0
160.0 Sel -Built HouseApartment & CondoHousing Project
79.8 75.785.6
95.0106.9
81.9
125.0 124.5133.8
93.4
Key Real Estate Landscapes
66 Quarterly Economic Report : Q4 | 2016
(‘000 Unit)
(‘000 Unit)
Key UPC real estate markets Chiang Mai Chonburi Khon Kaen
Rayong
Surat Thani (Koh Samui) Ubon Ratchathani Udon Thani
Wholesale & Retail
Thailand’s consumer goods market wasimproved in 2015 thanks to better politicalconditions and domestic economic rebound.Retail and wholesale taken together grewapproximately 2% compared to 2014s’.Major players continued to adopt marketingpromotions, but also enlarge their footprintsnationwide.
Wholesale and retail sales in 2016 areexpected to be in a moderate growth modewith a combined growth rate at 4% comparedto 2015s’. Competition among major playersremain intensive with high barrier to entry.Consumer product suppliers based on thetrading index statistics, deploy sales forceloyalty programs via department stores toboost their sales volumes.
Thai government has tried to transformedthe traditional market to the service-basedeconomy. Private consumption has been
spending on repairing schools, hospitals andirrigation systems to support job creation inboth urban and rural areas. The emergenceof AEC, moreover, will open up an opportunityto invest and trade between ASEAN memberstates. The strong sales performance for thewholesale and retail industry over thelong-term is expected to grow around 3-4%.
Wholesale and retail players will continue their growthstrategy in the coming years underpinned by the expansionof tourism, e-commerce, and both modern and traditiontraders in urban and country areas.
Situation in 2015 Forecast 2016 Long-term trend
Sources: BOT, BOL Database, EIU, & DTTJ Analysis
Quarterly Economic Report : Q4 | 2016 67
Wholesale & Retail
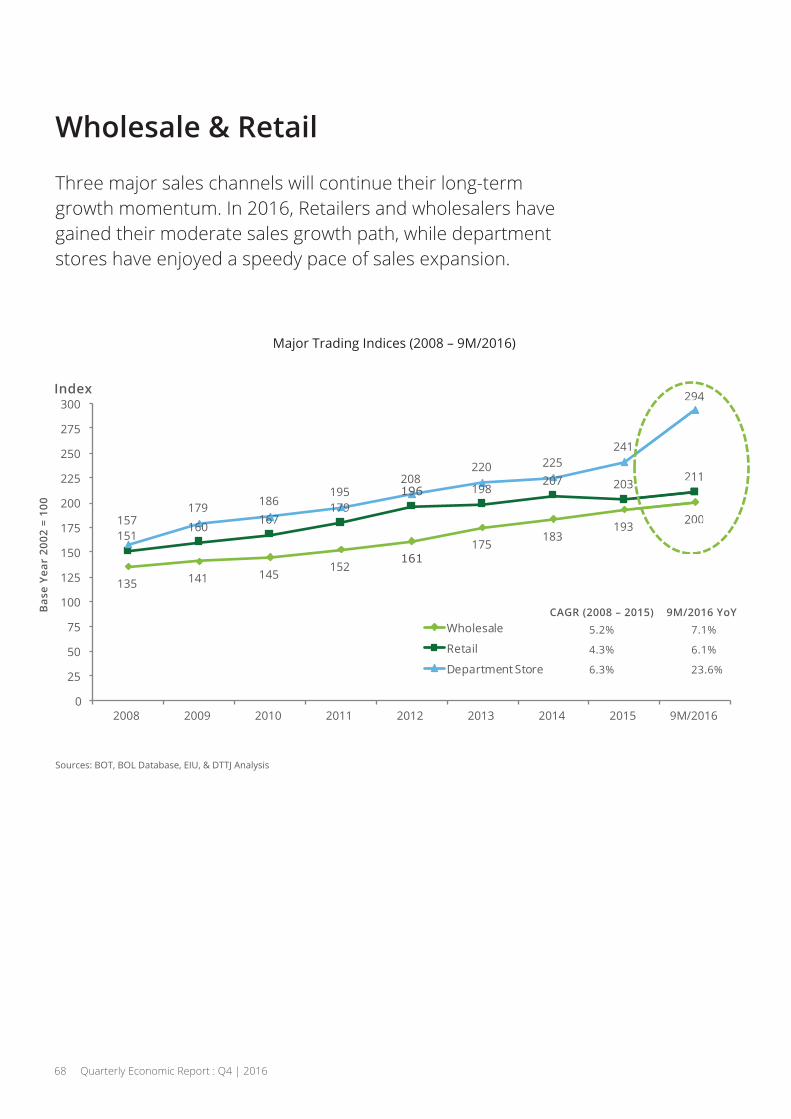
Three major sales channels will continue their long-termgrowth momentum. In 2016, Retailers and wholesalers havegained their moderate sales growth path, while departmentstores have enjoyed a speedy pace of sales expansion.
Major Trading Indices (2008 – 9M/2016)
135 141 145152
161175
183193 200
151160 167
179196 198
207 203 211
157179 186
195208
220 225241
294
0
25
50
75
100
125
150
175
200
225
250
275
300
2008 2009 2010 2011 2012 2013 2014 2015 9M/2016
Wholesale
Retail
Department Store
200
211
294Index
Bas
e Ye
ar 2
002
= 10
0
CAGR (2008 – 2015)5.2%
4.3%
6.3%
7.1%
6.1%
23.6%
9M/2016 YoY
68 Quarterly Economic Report : Q4 | 2016
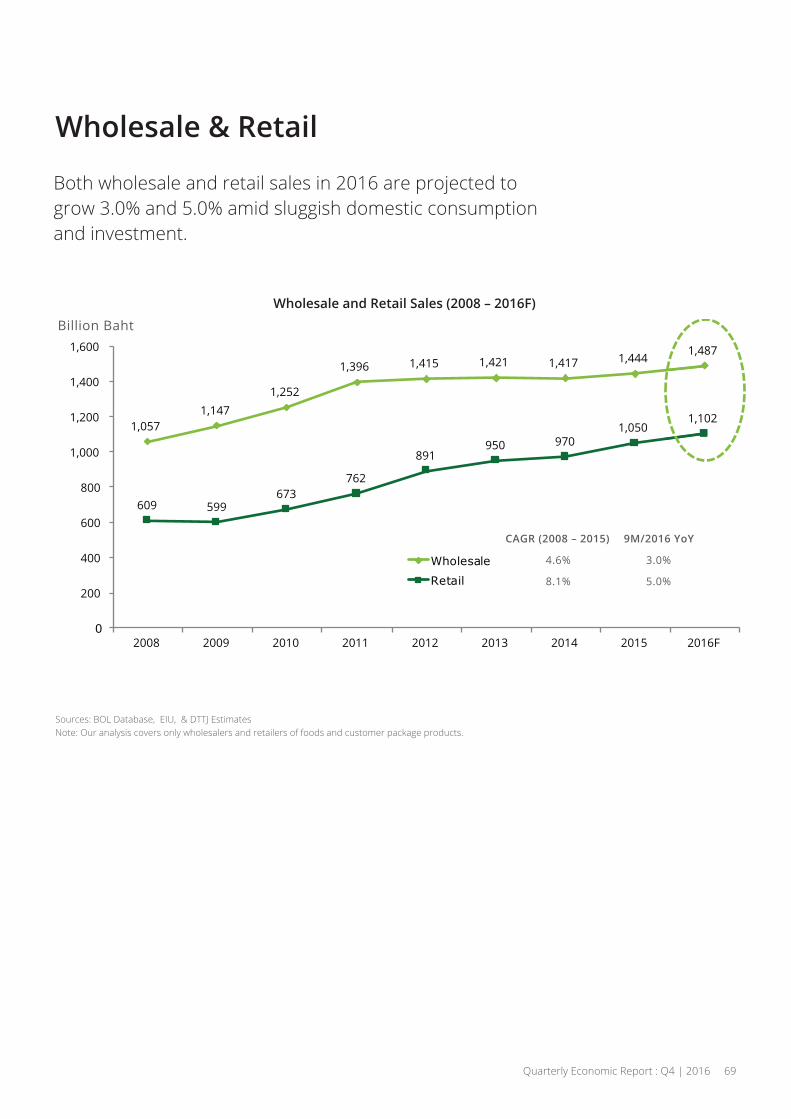
Wholesale & Retail
Both wholesale and retail sales in 2016 are projected togrow 3.0% and 5.0% amid sluggish domestic consumptionand investment.
Wholesale and Retail Sales (2008 – 2016F)
Sources: BOL Database, EIU, & DTTJ EstimatesNote: Our analysis covers only wholesalers and retailers of foods and customer package products.
1,0571,147
1,252
1,396 1,415 1,421 1,417 1,444 1,487
609 599673
762
891950 970
1,0501,102
0
200
400
600
800
1,000
1,200
1,400
1,600
2008 2009 2010 2011 2012 2013 2014 2015 2016F
Wholesale
Retail
Billion Baht
1,487
1,102
CAGR (2008 – 2015)
4.6%
8.1%
3.0%
5.0%
9M/2016 YoY
Quarterly Economic Report : Q4 | 2016 69
Tourism
Tourism sector was recovered in 2015 as aresult of a better political environment andthe success of the government’s tourismcampaign, namely, “2015 Discover Thainess”.The number of foreign tourists was 29.9million or grew 21% compared to 2014s’.Total tourism revenue in 2015 was 1.45 trillionBaht or increased 23%YoY.
As Thailand has implemented her tourismstrategy growing both the number of foreigntourists and revenues, several initiatives havebeen proposed by the Ministry of Tourismand Sports to increase visitor expenditure,average length of stay, and the overall qualityof the visitor experience. It is forecasted thatthe number of foreign visitors in 2016 willreach 33.0 million or grow 10% compared to2015. Similarly, revenue from foreign touristswill be around 1.64 trillion Baht or increase14%YoY.
Asian tourists especially from ASEAN, China, Japan and South Korea will be the majorcontributors to Thai tourism businesses overthe long-term. Likewise, a trend of globaleconomic recovery and better Thai politicalcondition could boost tourism sector withthe potential CAGR of 8%. In turn, it isexpected that hotel industry will gain highroom occupancy rate above 60%. In thelong-run, Thailand adopts “quality tourismstrategy”, which addresses the so-called“3Rs” (i.e. Repositioning, Restructure, andRebalance) to enhance both competitivenessand sustainability of tourism industry.
The implementation of “Quality Leisure Destination”vision will help sustain the growth of Thailand tourismsector in both the number of foreign tourists and revenues.
Situation in 2015 Forecast 2016 Long-term trend
Sources: BOT, Department of Tourism, Tourism Authority of Thailand (TAT), 2016 Thailand Tourism
by Minister of Tourism & Sports & The World Tourism Organization (UNWTO)
70 Quarterly Economic Report : Q4 | 2016
Tourism
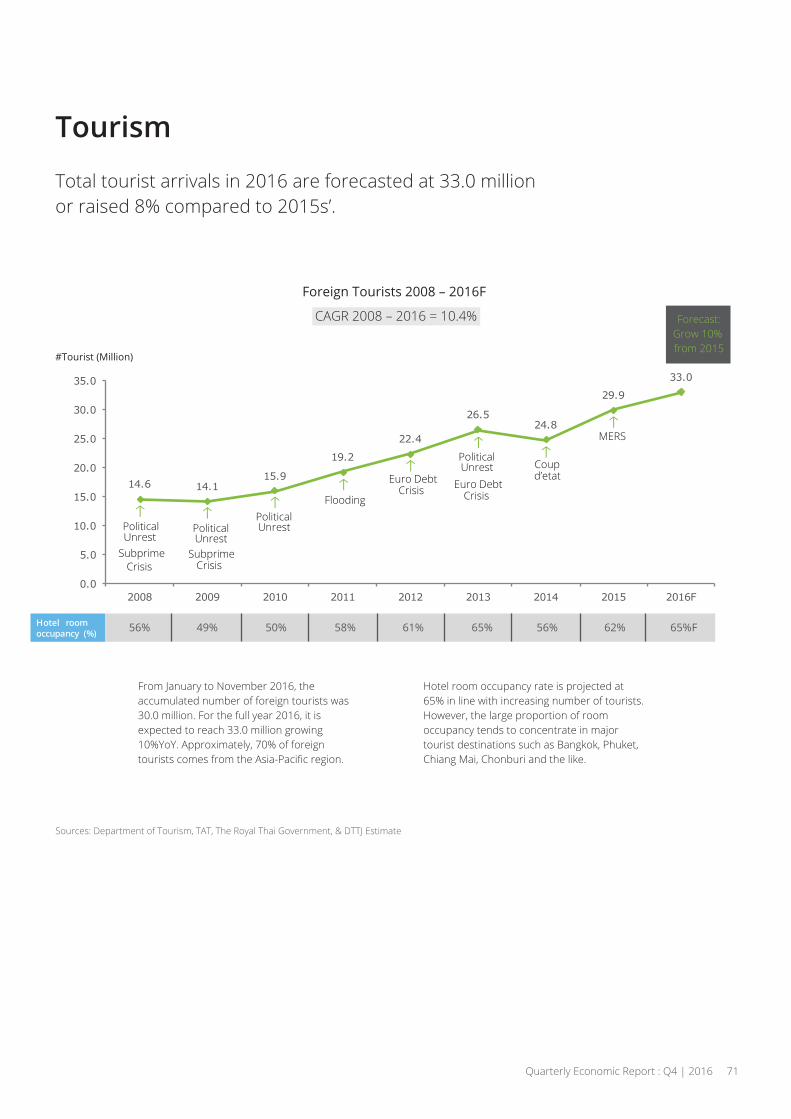
From January to November 2016, theaccumulated number of foreign tourists was30.0 million. For the full year 2016, it isexpected to reach 33.0 million growing10%YoY. Approximately, 70% of foreign
Hotel room occupancy rate is projected at65% in line with increasing number of tourists.However, the large proportion of roomoccupancy tends to concentrate in majortourist destinations such as Bangkok, Phuket,Chiang Mai, Chonburi and the like.
Total tourist arrivals in 2016 are forecasted at 33.0 millionor raised 8% compared to 2015s’.
Foreign Tourists 2008 – 2016F
CAGR 2008 – 2016 = 10.4%
#Tourist (Million)
Sources: Department of Tourism, TAT, The Royal Thai Government, & DTTJ Estimate
14.6 14.115.9
19.2
22.4
26.524.8
29.9
33.0
0.0
5.0
10.0
15.0
20.0
25.0
30.0
35.0
2008 2009 2010 2011 2012 2013 2014 2015 2016F
Hotel room occupancy (%) 56% 49% 50% 58% 61% 65% 56% 62% 65%F
Forecast:Grow 10% from 2015
Quarterly Economic Report : Q4 | 2016 71
Flooding
MERS
Political Unrest
Subprime Crisis
Political Unrest
Subprime Crisis
Political Unrest
Euro Debt Crisis
Political Unrest
Euro Debt Crisis
Coup d’etat

Tourism
During 2016, “Quality Tourism” strategyhelped sustain the growth momentum oftourism activities across tourism supply chainincluding hotels, airlines, travel agents,restaurants, and so on. In turn, the latestestimated revenue from foreign tourists isaround 1.64 trillion Baht raising 13.3%YoYaccounting for 11.1% of GDP in the sameperiod.
For the 2016 – 2026 period, WTTC hasprojected the cumulative average growthrate (CAGR) of 6.7%. By 2026, Thailand’stourism is expected to have a direct contributionof 2.48 trillion Baht or 14.0% of total GDPin 2026.
The implementation of new tourism strategy focusing on
tourists since 2015, but will also contribute a large proportionto Thailand GDP over the coming years.
Trillion THB
Sources: Department of Tourism, 2016 Thailand Tourism by Minister of Tourism & Sports, NESDB,
World Travel & Tourism Council 2016 (WTTC) & DTTJ Estimate
on THB
0.6 0.5 0.6 0.71.0
1.2 1.21.4
1.6
0.0
0.5
1.0
1.5
2.0
2008 2009 2010 2011 2012 2013 2014 2015 2016F
CAGR 2008 – 2016 = 14.0%
Revenue rom Foreign Tourists (2008-2016F)
72 Quarterly Economic Report : Q4 | 2016

Upcoming Report HighlightsComing next in April 2017
Current Situation of Key Industries:Food & Beverage, Energy (Electricity),and Telecommunications in Thailand
Quarterly Economic Report : Q4 | 2016 73
New Thailand key industry updates

Deloitte refers to one or more of Deloitte Touche Tohmatsu Limited, a UK private
entities. DTTL (also referred to as “Deloitte Global”) does not provide services to clients. Please see www.deloitte.com/th/about for a more detailed description of DTTL and its
services to public and private clients spanning multiple industries. Deloitte serves four
capabilities, insights, and high-quality service to address clients’ most complex business challenges. To learn more about how Deloitte’s approximately 245,000 professionals make an impact that matters, please connect with us on Facebook, LinkedIn, or Twitter.
About Deloitte Southeast Asia
comprising Deloitte practices operating in Brunei, Cambodia, Guam, Indonesia, Lao PDR, Malaysia, Myanmar, Philippines, Singapore, Thailand and Vietnam – was established to deliver measurable value to the particular demands of increasingly intra-regional and fast growing companies and enterprises.
expertise and deep industry knowledge to deliver consistent high quality services to companies in the region.
All services are provided through the individual country practices, their subsidiaries and
About Deloitte ThailandIn Thailand, services are provided by Deloitte Touche Tohmatsu Jaiyos Co., Ltd. and its
This communication contains general information only, and none of Deloitte Touche e
network”) is, by means of this communication, rendering professional advice or services. No entity in the Deloitte network shall be responsible for any loss whatsoever sustained by any person who relies on this communication.
© 2017 Deloitte Touche Tohmatsu Jaiyos Co., Ltd.