Embed Size (px)
Citation preview

Quarterly Economic Bulletin
2016/17 Q2

2 | P a g e
Table of Contents
Table of figures .......................................................................................................... 3
Table of tables ............................................................................................................ 3
List of Abbreviations ................................................................................................... 4
Foreword .................................................................................................................... 5
1. Introduction ......................................................................................................... 5
2. South African Economy ....................................................................................... 8
2.1. National Perspective ..................................................................................... 8
2.2. Provincial perspective ................................................................................... 9
3. Agriculture ......................................................................................................... 10
4. Social Indicators ................................................................................................ 12
4.1. Population ................................................................................................... 12
4.2. Education .................................................................................................... 14
4.2.1. Sub postgraduate qualification ............................................................. 14
4.2.2. Post matric qualification ........................................................................ 15
4.3. Health .......................................................................................................... 16
4.3.1. Medical aid coverage ............................................................................... 16
4.3.2. Chronic health conditions ......................................................................... 17
4.3.3. Disability .................................................................................................. 18
4.4. Social welfare .............................................................................................. 19
5. Communication ................................................................................................. 21
6. Transport ........................................................................................................... 22
7. Conclusion ........................................................................................................ 24
8. Recommendations ............................................................................................ 24

3 | P a g e
Table of figures
Figure 1 SA GDP, Constant 2010 prices, seasonally adjusted .................................. 8
Figure 2 Limpopo GDP, Constant 2010 prices, seasonally adjusted ......................... 9
Figure 3 Main reason for agricultural involvement in Limpopo province, 2015 ......... 10
Figure 4 Population by province, 2015 ..................................................................... 12
Figure 5 Limpopo population by sex, 2015 ............................................................... 13
Figure 6 Population aged 20 years and older with sub postgraduate qualification,
2015 ......................................................................................................................... 14
Figure 7 Population aged 20 years and older with post matric qualification, 2015 ... 15
Figure 8 Medical aid coverage, by population group, 2015 ...................................... 16
Figure 9 Population suffering from chronic health conditions as diagnosed by a
medical practitioner or nurse, by sex and province, 2015 ........................................ 18
Figure 10 Population aged 5 years and older that have some difficulty or are unable
to do basic activities, by province, 2015 ................................................................... 19
Figure 11 Population that received social grants, relief assistance or social relief,
province, 2015 .......................................................................................................... 20
Figure 12 Limpopo population that received social grants, relief assistance or social
relief, by sex, 2015 ................................................................................................... 20
Figure 13 Households’ ownership of a cellular phone and Land line, by province,
2015 ......................................................................................................................... 21
Figure 14 Low frequency trips by household members per week using each of the
following modes of transport (0 -10 Trips), 2015 ...................................................... 22
Figure 15 High frequency trips by household members per week using each of the
following modes of transport (11 - 41+ Trips), 2015 ................................................. 23
Table of tables
Table 1 The number of livestock the household has per province, 2015 ................. 11
4 | P a g e
List of Abbreviations
AIDS- Acquired Immune Deficiency Syndrome
BRT-Bus Rapid Transport System
EAT - Estimated Arrival Time
FDI-Foreign Direct Investments
GDP- Gross Domestic Product
GHS - General Household Survey
HIV- Human Immunodeficiency Virus
ICT- Information and Communication Technology
LDP-Limpopo Development Plan
MDGs- Millennium Development Goals
MTBPS- Medium Term Budget Policy Statement
NDP- National Development Plan
NHI- National Health Insurance
OECD -Organisation for Economic Co-operation and Development
RDP- Reconstruction and Development Programme
RSA-Republic of South Africa
SA- South Africa
SDG -Sustainable Development Goal
SDGs -Sustainable Development Goals
SERO -Socio-Economic Review and Overview
SEZ’s -Special Economic Zones
SOEs -state owned enterprises
UN-United Nations
WHO-World Health Organisation
StatsSA-Statistics South Africa

5 | P a g e
Foreword
About 170 countries, South Africa included, agreed to extend the successes of the
Millennium Development Goals (MDG’s) to the new Sustainable Development Goals
(SDG’s), of which there is a seamless coherence between the SDGs and the National
and Limpopo provincial development plans. The Limpopo Development Plan (LDP)
aspire to tackle the triple challenges of poverty, unemployment and income inequality
through inclusive economic growth which are embodied in the new SDGs.
Human development levels have generally improved over the years as projected in
the General Household Survey (GHS) 2015 produced by Statistics South Africa
(StatsSA). Crucial evidence in the survey is the education levels in the province,
challenges faced by the health sector to household infrastructure. This second
Quarterly Economic Bulletin (QEB) premises its analysis on the insightful survey to
understand the development needs of the province.
The national and provincial expenditure on development priorities are highly reliant on
government’s capacity to raise sufficient revenue, of which economic growth rate is an
important precursor of revenue generation. Economic performance, measured by real
GDP growth rate, grew by 3.3 percent in the 2nd quarter of 2016 reducing the risk of
suboptimal revenue collection.
As the province is preparing for the Medium Term Budget Policy Statement (MTBPS),
it is imperative that the fiscal policy support accelerated quantum industrialisation,
particularly in the identified Special Economic Zones (SEZ’s) and infrastructure
development to support market linkages and attract Foreign Direct Investments (FDI).
Integrated planning and coordinated implementation of development programmes will
assist the province to attain much with the limited resources it has in its disposal.
Signature
PRATT G. CA (SA) HEAD OF DEPARTMENT LIMPOPO TREASURY
6 | P a g e
Introduction
South Africa has marginally escaped falling into a technical recession, with the GDP
data for the second quarter of 2016 showing growth rate of 3.3 percent. This follows a
difficult first quarter performance, where the economy declined by 1.2 percent. This
marks the fastest pace of growth for South Africa since 2014. Manufacturing, mining
and quarrying made the biggest contribution to GDP growth.
South Africa’s population stood at an estimated 55.9-million mid-year, while Limpopo
was at 5.6 million in the same period. The gender variance between males and
females is not very significant especially among the youthful population, although the
gap seem to widen among the elderly population. Due to unfavourable socio-economic
conditions such as low labour absorption rate, increase in discouraged labour force,
low economic growth rate and persistent draught, which has led to the general public
relying heavily on government services. The demand for public goods and services is
rising while resources to provide such services is limited.
About 70 percent of the white population in the province have medical aid, followed by
coloureds and Indians with 45.5 percent and 44.7 percent respectively. At the same
time, only 7.2 percent of the black African population have medical aid coverage while
an overwhelming 92.2 percent does not have medical aid. The National Health
Insurance (NHI) appears to be a convenient solution for the poor as the programme is
envisaged to provide access to quality, affordable personal health services for all
South Africans based on their health needs, irrespective of their socio-economic
status. This must be done by finding sustainable funding models that won’t risk
increasing government debt.
Around 49 percent, which is almost a half of the population of people aged 20 years
and older, possess between grades 10 – 12 qualifications. While the majority of post
graduate possess Diploma with Grade 12 and Certificate with Grade 12 representing
a combined 5.2 percent of the total adults over 20 years of age. The policy question is
whether the education system is responsive to the skills needs that are unique to each

7 | P a g e
regional economy. If this was so, the province and the country wouldn’t be suffering
from structural unemployment.
Furthermore, government is maintaining and gradually increasing the social welfare
net in terms of social grants. About 13 percent of the recipients of social grants are in
Limpopo while the largest population is in KwaZulu Natal accounting for 24 percent.
There is a need for the South African government to find sustainable sources of
revenue to fund the social welfare of the country. Over and above sustainable
financing, government needs to deal with economic and socio-economic factors such
as economic growth and employment levels that can increase or reduce over reliance
on social grants.

8 | P a g e
1. South African Economy
1.1. National Perspective
South Africa’s gross domestic product (GDP) grew by 3.3 percent quarter-on-quarter
in the second quarter of 2016, after contracting by 1.2 percent in the previous quarter
of 2016. The year-on-year growth rate was 0.6 percent. The primary sector showed a
growth rate of 8.8 percent. Meanwhile the secondary sector grew by 5.3 percent and
the tertiary sectors showed a growth rate of 2 percent. Much of the growth in the
second quarter was driven by Mining and Manufacturing sectors.
Figure 1 SA GDP, Constant 2010 prices, seasonally adjusted
Source: StatsSA- Gross Domestic Product
The International Monetary Fund (IMF) expects South Africa’s gross domestic product
(GDP) growth to remain flat at 0.1 percent in 2016, noting that the economy will only
experience a modest recovery in 2017. It warned that unless a comprehensive
structural reform package, which fosters greater product market competition, more
inclusive labour market policies and industrial relations, and improved education and
training, as well as reducing infrastructure gaps, was tackled, the country would not
experience growth.
3.3
-3.0
-2.0
-1.0
0.0
1.0
2.0
3.0
4.0
5.0
6.0
Mar
-12
May
-12
Jul-
12
Sep
-12
No
v-1
2
Jan
-13
Mar
-13
May
-13
Jul-
13
Sep
-13
No
v-1
3
Jan
-14
Mar
-14
May
-14
Jul-
14
Sep
-14
No
v-1
4
Jan
-15
Mar
-15
May
-15
Jul-
15
Sep
-15
No
v-1
5
Jan
-16
Mar
-16
May
-16

9 | P a g e
For the country to evade the credit degrading, it has to maintain positive economic
growth over the medium term and to ensure fiscal sustainability. It should avoid
popular social expenditure that might risk widening national budget deficit and to
ensure financial stability of state owned entities. Finally, the independence of crucial
institutions in the country such as the judiciary, public protector and the South African
Reserve Bank among others needs to be maintained.
1.2. Provincial perspective
According to IHS Regional Explorer, provincial economic growth was recorded at 2
percent in 2015. Although the StatsSA doesn’t provide the GDP data at regional level
for the current quarter, it is estimated that the provincial economy is performing
moderately in a positive territory due to the improved commodity prices and increased
mineral resources exports. The local economy is driven secondly by the community
services of which its contribution in the local economy has been consistent over the
years which it is also expected to support the positive economic growth of the local
economy.
Figure 2 Limpopo GDP, Constant 2010 prices, seasonally adjusted
Source: (IHS) Regional Explorer
-1.6%
2.5%
0.9%
2.0%
-3.0%
-2.0%
-1.0%
0.0%
1.0%
2.0%
3.0%
4.0%
5.0%
6.0%
7.0%
8.0%

10 | P a g e
However, the drought in the country has not only caused water shortages but an
increase in interest rates and also a depreciating exchange rate. Maize and soybean
production will also be affected due to late summer rains. There will be a high amount
of maize being imported, GrainSA estimating about 4 million tonnes to be imported in
2016, which will hike up prices due to the rand weakening against major trading
countries’ currencies.
2. Agriculture
Agriculture in the province has a central role to play in building a strong economy and,
in the process, reducing inequalities by increasing incomes and employment
opportunities for the poor. The majority of subsistence farmers in the province are
black Africans located in semi- rural and rural areas. Most still utilise traditional farming
methods with heavy reliance on rain as the main source of irrigation. The El Niño
phenomenon has adversely affected sustainable subsistence farming particularly for
households who make farming as their main source of food. The drought therefore
risks food security in the province and compromises the development of small scale
farmers; upsurge in bankruptcy cases which forced many off their newly redistributed
farmland.
Figure 3 Main reason for agricultural involvement in Limpopo province, 2015
Source: StatsSA - General Household Survey (GHS)
93.2
0.9 1.5 3.1 1.2
0.0
10.0
20.0
30.0
40.0
50.0
60.0
70.0
80.0
90.0
100.0
Extra source of food Main source of foodfor the household
Leisure activity Extra source ofincome
Main source ofincome

11 | P a g e
Figure 3 shows the main reasons for agricultural involvement in the province by the
farmers. In Limpopo 93.2 percent of households engage in agricultural activities to
supplement their source of food. Meanwhile 3.1 percent engage in agriculture to
supplement their income and about 1.5 percent are practising agriculture for the
leisure. Furthermore, 1.2 percent are engaged in agriculture as the main source of
income and 0.9 percent are doing it as a main source of food for their households.
Table 1 The number of livestock the household has per province, 2015
Source: StatsSA - General Household Survey (GHS)
As illustrated in Table 1, Limpopo has a total of 185 thousand households that are
practising livestock farming. Out of that 73 thousand are involved in cattle farming,
about 100 thousand engaged in goat and sheep farming, while 13 thousand are in pig
farming. There is low variation between the number of households in Limpopo
participating in livestock farming as compared to those in Mpumalanga and North West
sitting at 185, 98, and 130 thousand households. While the largest number of
households are in Eastern Cape and KwaZulu Natal recording 587 and 405 thousand
households.
Western
Cape
Eastern
Cape
Northern
CapeFree State
KwaZulu-
Natal
North
WestGauteng
Mpumalan
gaLimpopo
South
Africa
0-10 0 125 4 7 124 31 0 35 57 381
11-100 2 41 2 4 57 20 0 15 15 156
100+ 1 2 1 1 1 4 1 1 1 13
Total 3 168 7 12 182 55 1 51 73 550
0-10 0 46 3 1 23 9 1 5 8 97
11-100 1 71 2 3 6 12 0 2 5 102
100+ 4 6 4 5 1 2 0 2 0 22
Total 5 123 9 9 30 23 1 9 13 221
0-10 0 86 7 1 122 24 1 24 70 335
11-100 0 79 4 1 45 24 0 7 16 175
100+ 0 * 1 2 1 * 0 0 0 4
Total 0 165 12 4 168 48 1 31 86 514
0-10 0 127 1 3 21 4 0 6 12 173
11-100 0 4 0 0 3 0 0 1 1 9
100+ 1 0 0 1 1 0 0 0 0 4
Total 1 131 1 4 25 4 0 7 13 186
Total 9 587 29 29 405 130 3 98 185 1 471
Pigs
Sheep
Goat
Number of livestock
Thousand
Cattle

12 | P a g e
It is evident that subsistence farming plays an important role in the rural parts of the
province as a source of food and income. In some instances, it can contribute to
employment for the low skilled or non-educated citizens.
3. Social Indicators
3.1. Population
Policy planners understand that development strategies depend on sustained
investments in health care, education, employment, and natural resources. However,
rapid population growth in many developing countries threatens to undermine these
investments and exacerbate the challenges of poverty, maternal and child health,
HIV/AIDS, gender discrimination, and job creation. It also puts pressure on agricultural
land, fresh water, and energy resources.
According to StatsSa in their mid-term estimates, the South Africa population is
currently sitting at 55.9 million people. Limpopo has the fifth largest population number
in the country at 5.6 million representing 10 percent of the national population.
Limpopo is preceded by Gauteng, KwaZulu-Natal, Eastern Cape and Western Cape
with population numbers sitting at 13.2 million, 10.7 million, 6.7 million and 6.2 million
respectively. The lowest populated region is Northern Cape at 1.2 million people.
Figure 4 Population by province, 2015
Source: StatsSA - General Household Survey (GHS)
1 182
2 763
3 703
4 236
5 654
6 246
6 693
10 688
13 268
0 2 000 4 000 6 000 8 000 10 000 12 000 14 000
Northern Cape
Free State
North West
Mpumalanga
Limpopo
Western Cape
Eastern Cape
KwaZulu-Natal
Gauteng

13 | P a g e
The growth in the population in the province has both positive and negative
implications in the province. When analysing the socio-economic conditions of the
province, the population growth is straining the provincial fiscus. Unfavourable socio-
economic conditions such as low labour absorption rate, increase in discouraged
labour force, low economic growth rate and persistence of draught, has led to the
general public relying heavily on government services. The demand for public goods
and services is rising while resources to provide such services is limited. There is a
need to convert the adversities of population growth to opportunities of development.
According to figure 5, there are more females in the province who make up 52 percent
of the total population as compared to males who make up only 48 percent. This
invariably raises policy questions of whether government services are gender inclusive
as the needs of both sexes vary.
Figure 5 Limpopo population by sex, 2015
Source: StatsSA - General Household Survey (GHS)
2 701, 48%
2 953, 52%
Male Female

14 | P a g e
3.2. Education
3.2.1. Sub postgraduate qualification
On the one hand, education which is SDG 4 is seen as a product of the development
process that is worthy of pursuit by itself. On the other hand, education is considered
a crucial input into the development process. It is considered an input to economic
growth, health outcomes, institutional development, and possibly trade, among others.
As indicated on Figure 6, around 46 percent, which is almost a half of the population
of people aged 20 years and older, possess between grades 10 – 12. This raises
policy questions of whether the provincial and national economy ready to
accommodate the growing number of high school learners throughput in the existing
higher learning institutions. Given limited learner absorption rate in higher learning
institutions, most of the youth will seek to find alternative occupation in the labour
market, raising socio-economic challenges such as unemployment, rise in criminal
activity and depression. About 10 percent, representing 312 thousand of the adults
above 20 years of age who do not have any form of education level.
Figure 6 Population aged 20 years and older with sub postgraduate qualification, 2015
Source: StatsSA - General Household Survey (GHS)
10%
0% 1% 1% 2% 2% 2%4%
5% 6%
9%
13% 13%
20%
0%
5%
10%
15%
20%
25%

15 | P a g e
3.2.2. Post matric qualification
Figure 7 Population aged 20 years and older with post matric qualification, 2015
Source: StatsSA - General Household Survey (GHS)
The majority of post graduate possess Diploma with Grade 12 and Certificate with
Grade 12 representing a combined 5.2 percent of the total adults over 20 years of age.
Nevertheless, this is the largest post matric qualifications in the province. Bachelor’s
Degree, Honours Degree and Higher degree (Masters, Doctorate) only make up 1.5
percent, 0.9 percent and 0.2 percent respectively.
The above analyses requires the province to assess and align post matric certificates
and diplomas to meet the skill demand in the various economic sectors in the province.
According to the Limpopo Socio-Economic Review and Overview (SERO) 2015/16 the
province has comparative advantage in agriculture, mining, electricity, and trade,
excluding the community services. These are the sectors that the education system
could feed in relevant skills and eliminate structural unemployment; graduates
possessing irrelevant qualifications for the local economic and industrial needs.
0.4% 0.3%0.6%
0.4%0.3% 0.3%
0.5%0.2%
1.6%
3.6%
0.5%
0.1%
1.5%
0.2%
0.9%
0.2%
0.0%
0.5%
1.0%
1.5%
2.0%
2.5%
3.0%
3.5%
4.0%

16 | P a g e
3.3. Health
3.3.1. Medical aid coverage
Medical services in the country are provided by both private and public sector. There
is an overwhelming perception that private sector medical services are more efficient
and satisfactory as compared to public health care. However, the private sector
medical services are normally accessed by the middle-class through medical aid
coverage. This generally excludes the majority of the low income and poor population
of the province to rely on public sector health care services. There is no doubt that
poverty is a contributing factor to poor health outcomes. Poor people have lower life
expectancies, higher prevalence of chronic illnesses and health conditions, and they
have more unmet health needs than people in the middle-class and high income
levels.
Figure 8 Medical aid coverage, by population group, 2015
Source: StatsSA - General Household Survey (GHS)
Based on Figure 8 about 70 percent of the white population in the province have
medical aid, followed by coloureds and Indians with 45.5 percent and 44.7 percent
respectively. Only 7.2 percent of the black African population have medical aid
coverage while an overwhelming 92.2 percent does not have medical aid. Followed
by the Indian/Asian population at 55.3 percent and Coloured population at 54.4
7.2%
45.5% 44.7%
70.3%
92.2%
54.5% 55.3%
29.7%
0.0%
10.0%
20.0%
30.0%
40.0%
50.0%
60.0%
70.0%
80.0%
90.0%
100.0%
Black African Coloured Indian/Asian White

17 | P a g e
percent. The least population without medical aid is the white population at 29.7
percent.
Private health insurance started to grow rapidly, the primary approach to helping poor
people obtain medical care has been to make public health insurance available to a
growing share of the poor. Underlying this approach is the assumption that if poor
people have health insurance, physicians and other providers of medical care will
provide the same services to poor people as they do to middle-class people. The idea
of rolling out of the National Health Insurance (NHI) was to provide access to quality,
affordable personal health services for all South Africans based on their health needs,
irrespective of their socio-economic status. NHI is intended to ensure that the use of
health services does not result in financial hardships for individuals and their families.
Nevertheless, the health care assistance for the poor is being administered more as a
welfare program than as part of a national system of financing health insurance and
medical care.
3.3.2. Chronic health conditions
According to the World Health Organisation (WHO) poverty is also caused by chronic
diseases. Once again, it is people and families who are already poor who are most
likely to suffer, because chronic diseases are likely to ruin a family’s economic
prospects. Wealth enables people to avoid most of the risks of developing chronic
disease, and to obtain access to health care. However, even within high income
countries, psychosocial factors, for example lack of social support and perceived lack
of control, are strongly related to the risk of chronic diseases.

18 | P a g e
Figure 9 Population suffering from chronic health conditions as diagnosed by a
medical practitioner or nurse, by sex and province, 2015
Source: StatsSA - General Household Survey (GHS)
According to Figure 9 about 227 thousand people in the province are suffering from
Hypertension/high blood pressure. Followed by HIV and AIDS and Diabetes affecting
92 thousand people and 75 thousand people. The least prevalent chronic health
conditions are Pneumonia affecting 6 thousand people, Bronchitis affecting 6
thousand people, as well as Meningitis and Sinusitis affecting 5 thousand people.
3.3.3. Disability
There is a high number of people in the province which are unable to care for
themselves, constituting 244 thousand. This number may be relatively small as a
proportion of the total population but the burden may be sever for poor and low income
households with lack of access to appropriate health services. The second highest
disability in the province is seeing affecting about 183 thousand people, thirdly
followed by disability of walking affecting 140 thousand people.
227
92
75
51
38
34
23
20
12
9
8
6
6
5
0 50 100 150 200 250
Hypertension/high blood pressure
HIV and AIDS
Diabetes
Asthma
Mental Illness
Arthritis
Epilepsy
Tuberculosis
Stroke
Cancer
Heart attack / Myocardial infarction
Pneumonia
Bronchitis
Meningitis and Sinusitis

19 | P a g e
Figure 10 Population aged 5 years and older that have some difficulty or are unable
to do basic activities, by province, 2015
Source: StatsSA - General Household Survey (GHS)
To enable persons with disabilities attain and maintain maximum independence,
capacity development efforts should be aimed at ensuring access to employment. This
can be done by promoting access to inclusive education, skill development and
vocational and entrepreneurial training
3.4. Social welfare
Social welfare policies are important because they form the framework that allows all
citizens to live within their basic rights with access to some of the most basic social
amenities. These programs developed and guided by the underlying policies are
geared towards helping people in need for purposes of poverty alleviation. They also
offer an opportunity to risk groups to maintain their households and preserve their
human dignity.
Limpopo is the fourth largest beneficiary of social grants in the country representing
13 percent. It is surpassed by KwaZulu Natal, Eastern Cape and Gauteng recording
24, 16 and 14 percent respectively. Generally, the number of beneficiaries is driven by
both demographic and socio-economic factors such as population size and age,
unemployment and economic activity.
0
50
100
150
200
250Seeing
Hearing
WalkingRemembering and
concentrating
Self-care

20 | P a g e
Figure 11 Population that received social grants, relief assistance or social relief,
province, 2015
Source: StatsSA - General Household Survey (GHS)
The majority of the social grant recipients in the province are females who account for
54 percent. Rightly so, because firstly they have longer life expectancy than men
making the senior female population more than that of males. Secondly, there are
more men in employment than females after the age of 60 years. Men who receive
social grant only account for 46 percent.
Figure 12 Limpopo population that received social grants, relief assistance or social
relief, by sex, 2015
Source: StatsSA - General Household Survey (GHS)
8%
16%
3%5%
24%
7%
14%
9%
13%
0%
5%
10%
15%
20%
25%
30%
982, 46%
1 164, 54%
Male Female
21 | P a g e
4. Communication
Africa has witnessed a fast penetration of telephone technologies and increased
access to ICT services in the last ten years. A study done by the United Nations (UN)
proved that in 2010, global coverage of land lines was only 2 percent, compared to a
global level of 80 percent for mobile coverage. Access to fixed phone lines in Africa
remains very low at less than 0.2 percent.
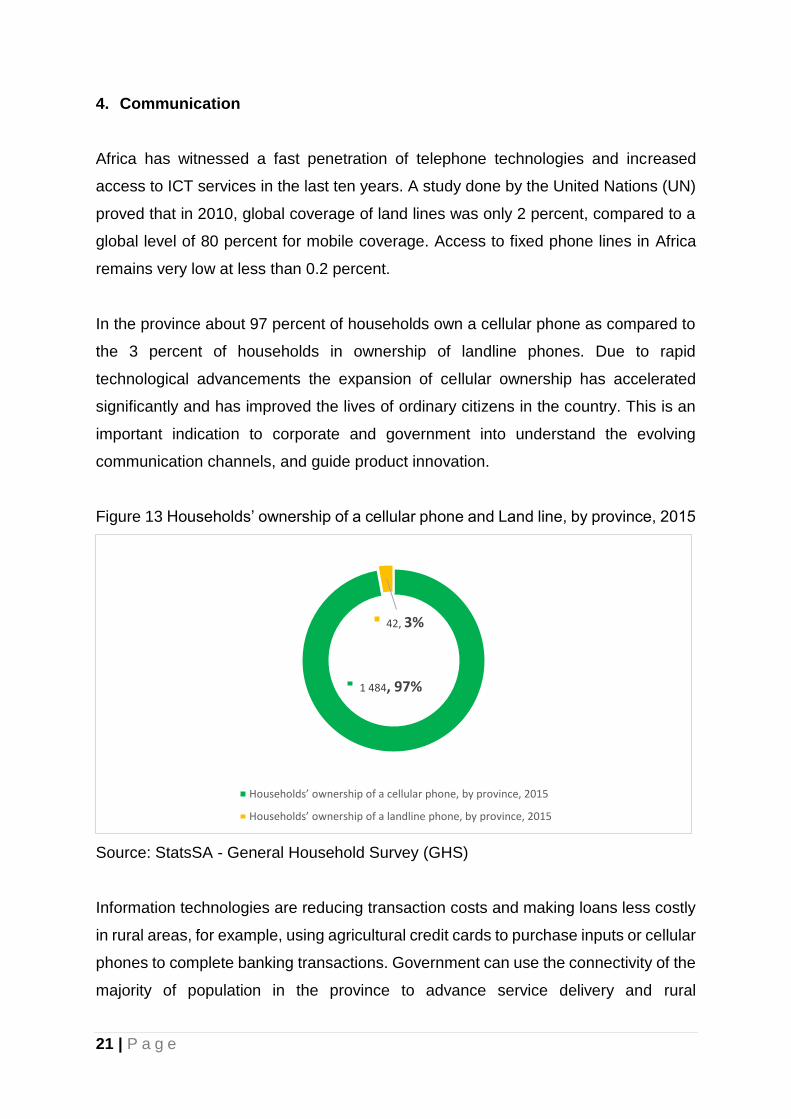
In the province about 97 percent of households own a cellular phone as compared to
the 3 percent of households in ownership of landline phones. Due to rapid
technological advancements the expansion of cellular ownership has accelerated
significantly and has improved the lives of ordinary citizens in the country. This is an
important indication to corporate and government into understand the evolving
communication channels, and guide product innovation.
Figure 13 Households’ ownership of a cellular phone and Land line, by province, 2015
Source: StatsSA - General Household Survey (GHS)
Information technologies are reducing transaction costs and making loans less costly
in rural areas, for example, using agricultural credit cards to purchase inputs or cellular
phones to complete banking transactions. Government can use the connectivity of the
majority of population in the province to advance service delivery and rural
1 484, 97%
42, 3%
Households’ ownership of a cellular phone, by province, 2015
Households’ ownership of a landline phone, by province, 2015
22 | P a g e
development through tele-oriented solutions. African countries such as Ghana are
advancing in providing agrarian support to small scale farmers through cellular
phones.
5. Transport
Transport is an indispensable element of development and socio-economic growth.
As engines of economic integration, transport infrastructure and service facilities
constitute a precondition for facilitating trade and the movement of goods and persons.
The National Development Plan (NDP) 2030 states that by 2030, passenger transport
should be user-friendly, less environmentally damaging, more affordable and
integrated or seamless. This aspiration is however hampered by the fragmented
nature of institutional governance in passenger transport.
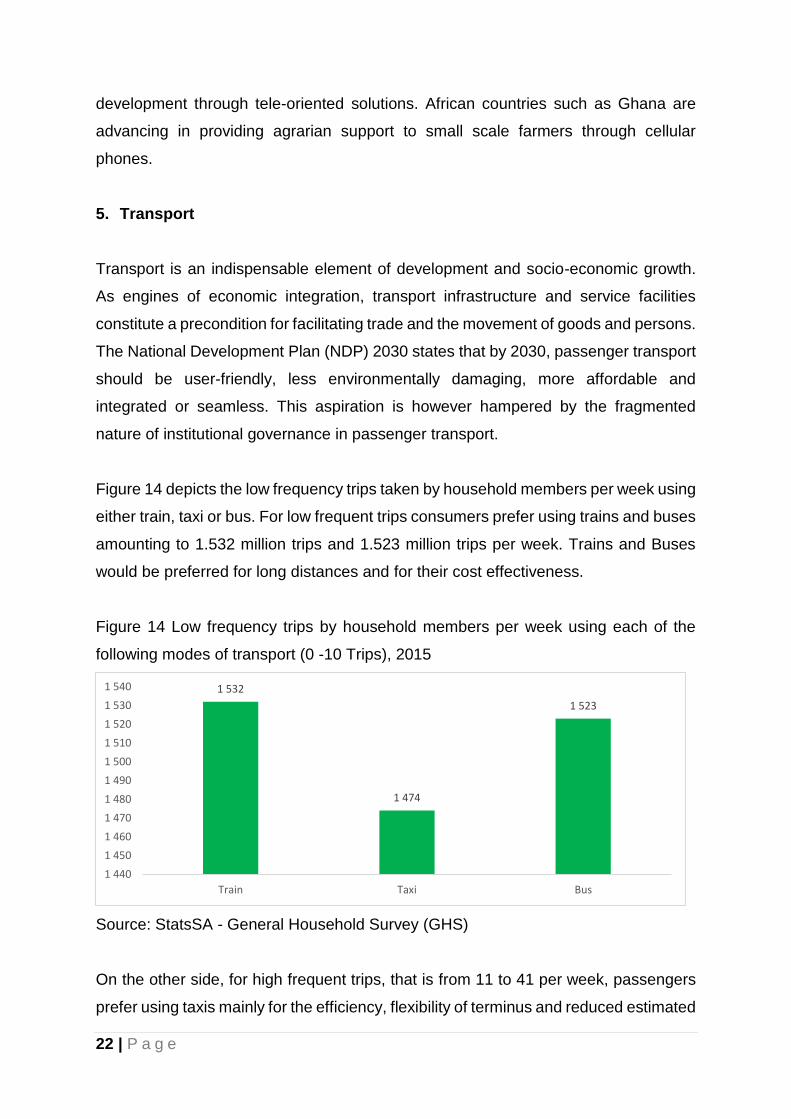
Figure 14 depicts the low frequency trips taken by household members per week using
either train, taxi or bus. For low frequent trips consumers prefer using trains and buses
amounting to 1.532 million trips and 1.523 million trips per week. Trains and Buses
would be preferred for long distances and for their cost effectiveness.
Figure 14 Low frequency trips by household members per week using each of the
following modes of transport (0 -10 Trips), 2015
Source: StatsSA - General Household Survey (GHS)
On the other side, for high frequent trips, that is from 11 to 41 per week, passengers
prefer using taxis mainly for the efficiency, flexibility of terminus and reduced estimated
1 532
1 474
1 523
1 440
1 450
1 460
1 470
1 480
1 490
1 500
1 510
1 520
1 530
1 540
Train Taxi Bus

23 | P a g e
arrival time (EIT). The taxis make 53 thousand trips per week as compared to trains
and busses which are only making 1 thousand and 9 thousand trips per week
respectively.
Figure 15 High frequency trips by household members per week using each of the
following modes of transport (11 - 41+ Trips), 2015
Source: StatsSA - General Household Survey (GHS)
The passenger transport system is not effectively integrated across all modes, nor at
different trip interchange segments. The ineffectiveness includes a lack of co-
ordination of services scheduled, facilities and infrastructure along strategic priority
corridors, and the fragmentation of regulatory authority in the sector. Implementation
of inter-modal transfers, fare structure, integration of and integrated ticketing systems
are generally not possible under the current passenger transport system. Some
progress has been made towards solving this issue where Bus Rapid Transport
System (BRT) systems have been implemented. Modal options are limited, particularly
among the low income households, and this results in the poorest of the poor often
having no choice other than to use the most expensive form of passenger transport.
Accessibility to passenger transport services is also a major challenge, particularly in
the rural areas. A large proportion of scholars and workers have no alternative in rural
areas other than to walk to their destinations. One of the key reasons for this is due to
passenger transport services being planned according to demand responsive
principles.
1
53
9
0
10
20
30
40
50
60
Train Taxi Bus
24 | P a g e
6. Conclusion
The general living conditions of the citizens in the province have improved,
notwithstanding the outliers where government needs to accelerate the provision of
basic services and correcting market failures in terms of inadequate private sector
participation particularly in rural areas. The back to basics philosophy is aimed at
realigning municipalities in increasing their efficiency and effectiveness in executing
their core mandate. However, for the province to achieve optimal development of all
citizens, the province needs to achieve accelerated economic growth that is labour
absorbing thereby growing the tax base that will support and finance developmental
priorities in the province.
7. Recommendations
The average lacklustre economic growth in the country requires comprehensive
structural reform package, which fosters greater product market competition, more
inclusive labour market policies and industrial relations, and improved education and
training, as well as reducing infrastructure gaps. On the other hand, subnational
governments can support accelerated economic growth by rigorously implementing
practical and impactful economic growth and development action plans. This growth
can be achieved by analysing and taking advantage of various sector and product
competiveness and location advantage. The province has the potential of becoming
the industrial and logistical hub of African markets. The provincial fiscal policy will have
to be deliberate in advancing and supporting economic infrastructure development and
economic sector development in the province.
The drought condition requires robust government intervention to cushion food
security crisis and protect smallholder farmers to remain productive. Develop a
comprehensive agrarian support package for smallholder famers in the province. The
package should include both financial and non-financial agrarian support aimed at
sustaining and developing smallholder farmers. Non-financial support should
emphasis on the use of new and efficient farming methods that yield high productivity
yet being cost effective. Encourage cooperative farming which rationalises farming
25 | P a g e
costs and resource sharing thereby reducing risk exposure that could have been borne
by a sole trader. Diversification is a high priority because it helps protect smallholders
from economic risks, such as market collapses, and helps prevent land degradation.
The land ownership and tenure status need to be look at in the province. The idea
behind is that famers can be able to invest in long term infrastructure and technologies
if they have certainty about the ownership of the land. The reality is that it is difficult to
invest in land that you are not sure of its future given the recent activities of illegal land
grabs and changing of the previously agricultural land to residential lands.
Population management is critical, while failure to do so may lead to social adversities.
Among other things, the provincial administration needs to stimulate labour absorbing
economic growth that will raise the general income levels of households to redeem
them out of poverty and capacitating them to be self-sustainable and not depend on
state services for sustenance. Raise literacy levels, particularly in rural areas. A literate
community is likely to take well informed decisions and become progressive
entrepreneurs thereby integrated to the mainstream economy. Promote family
planning can contribute directly or indirectly to achieving nearly all of the Sustainable
Development Goals (SDGs), by reducing household poverty, improving the health of
mothers and children, reducing the transmission of HIV/AIDS, and giving women more
opportunities to contribute fully to development. Leaders of many nations have
endorsed the MDGs.
To address the skills deficit in the country and oversupply of less demanded
qualifications, the national government needs to assess and align post matric
certificates and diplomas with the objective of synthesising skills supply and demand
in the various economic sectors in the provinces. According to the Limpopo Socio-
economic Review and Overview (SERO) 2015/16 the province has comparative
advantage in agriculture, mining, electricity, and trade, excluding the community
services. These are the sectors that the education system could feed in relevant skills
and eliminate structural unemployment; graduates possessing irrelevant qualifications
for the local economic and industrial needs.

26 | P a g e
Government needs to embark on growing international studies programme by sending
young South Africans to international university for scarce trades that can stimulate
innovation and productivity in the local economy.
While access to medical care is essential, a wide proportion of the province
Government needs to accelerate the rolling out of NHI to increase access to quality,
affordable personal health services for all South Africans based on their health needs,
irrespective of their socioeconomic status. NHI is intended to ensure that the use of
health services does not result in financial hardships for individuals and their families.
However, the health care assistance for the poor is being administered more as a
welfare program than as part of a national system of financing health insurance and
medical care. This therefore demands increased fiscal capacity to cover the uninsured
poor population requiring a raise in national revenue instruments such as taxes.
To enable persons with disabilities to attain and maintain maximum independence,
capacity development efforts should be aimed at ensuring access to employment. This
can be done by promoting access to inclusive education, skill development and
vocational and entrepreneurial training. As an integral part of building a moderately
prosperous society, government should strive to narrow the huge gap in per capita
household income between urban and rural disabled people, and provincial gap with
the national average.
There is a need for the South African government to find sustainable sources of
revenue to fund the social welfare of the country. Financing these benefits depends
on economic and socio-economic factors such as economic growth and employment
levels. The current financial requirements of social security in the province and country
as a whole is influenced by the extension of social rights, and the growth of needy
population.
Information technologies are reducing transaction costs and making loans less costly
in rural areas, for example, using agricultural credit cards to purchase inputs or cellular
phones to complete banking transactions. Government can use the connectivity of the
majority of population in the province to advance service delivery and rural
development through tele-oriented solutions. African countries such as Ghana are

27 | P a g e
advancing in providing agrarian support to small scale farmers through cellular
phones. Municipalities can take advantage of these growing connectivity or coverage
to reach out to its constituencies in terms of service delivery.
Accessibility to passenger transport services is also a major challenge, particularly in
the rural areas. A large proportion of scholars and workers have no alternative in rural
areas other than to walk to their destinations. One of the key reasons for this is due to
passenger transport services being planned according to demand responsive
principles. A shift in transport ideology is required to accelerate the integration of rural
economies to that of urban economies.