Embed Size (px)
Citation preview

kpmg.ch/valuation
Quarterly Brief12th Edition of the International Valuation Newsletter Q3 2020

As you undoubtedly have also felt, we are shocked to witness how swiftly the COVID-19 pandemic has developed and led to fundamental shifts in both our professional and personal lives.
In the period leading up to the end of March 2020, which was the planned release date of our last Quarterly Brief, the topics of valuation and price became so uncertain that we decided to skip its release. In the meantime, much has been published regarding this topic. See, as an example, KPMG’s collection of COVID-19 publications and webinars: Measuring the fair value for investments during volatile times.
As five months have elapsed since the global corona virus outbreak started, it is time to take stock of the current state of the industry and gain an understanding as well as develop a view of the future. In this edition, we will provide a comparison of share prices, analyst consensus forecast estimates as well as beta factors by sector with a timeframe of ‘before’ and ‘after’ COVID-19, in an effort to interpret and recognize the effects of the outbreak on these key focus areas in valuation, even as the situation continues to evolve.
We will also summarize key challenges to anticipate when implementing various valuation approaches in the context of COVID-19 and provide recommendations to develop supportable valuations as well as to identify and challenge areas of probable weakness in valuations, which are notoriously complex during times of crisis.
In the final section, we will summarize some key capital market data such as index performance, sector multiples, risk-free rates, as well as country risk premiums and growth rates for selected markets in our usual format.
We hope you stay safe, healthy and have a pleasant summer as we look forward to discussing your questions regarding valuation trends and practices during these unprecedented times.
Dear reader
Rolf LangeneggerDirector, Deal AdvisoryValuation / Financial Modelling
Johannes PostPartner, Deal AdvisoryGlobal Head of Valuation Services
Yours faithfully

Quarterly Brief – 12th Edition of the International Valuation Newsletter 3
Valuation mattersEven more so in times of great uncertainty
Quarterly Brief – 12th Edition of the International Valuation Newsletter 4
Remember, COVID-19 is not the only issueEven prior to February 2020, we occupied a significant era in global history characterized by extreme change on an epochal scale: globalisation, digitalisation, sector convergence, sustainable finance (ESG – Environmental, Social and Governance), and Brexit are only a few of these defining, world shaping shifts that will have a lasting impact on the economy, business and, consequently, valuations. As a further example of this, it is worth mentioning the observed political conflicts between the United States and China regarding international trade as well as tensions surrounding the price of oil between Russia and Saudi Arabia. Even though many of these cornerstone events in our recent history will continue to define the future and offer new opportunities as well as uncertainty, now, with the appearance COVID-19, they have very much faded from the spotlight.
Nevertheless, we have experienced elevated equity market prices up until mid-February 2020, as seen during the 12 to 18 month period prior to the corona virus outbreak during which we observed price-to-earnings (P/E) ratios that increased over-proportionally to their underlying earnings, in other words, share prices went up without the support of the fundamental
underlying substance of increased cash flow.
Many characterise COVID-19, in the context of equity markets, as a catalyst for revaluation, or a necessary reality check to return to ‘normal price levels’. However, over the last few months since mid-March 2020, we have observed the opposite with a remarkable bull market once more.
Impact and recoveryThe key questions, which are nearly impossible to answer, are the degree of magnitude of the economic impact as well as what the recovery path will look like. The letters V, U, and L have become the globally recognised acronyms for the expectations of the ‘shapes’ of the possible paths to recovery, characterised by the approximate shape of the economic data when plotted on a time-series graph as time elapses throughout recessions.
Soon after the outbreak of the corona virus, it became obvious that the impact of the pandemic would vary by sector. Some sectors, such as certain online retailers, information technology or the health care sector, may even stand to benefit, at least in the short term. Even if these sectors, recently considered as ’safer’, have not yet felt a great financial burden or impact from the virus, they too may also suffer
indirectly, perhaps with a time-lag, due to the systematic impact from the coming global recession.
The current lockdown measures and their release vary considerably by country and region. The timing of quarantine and travel as well as transportation restrictions is extremely unclear and depends heavily on the country-specific expectations of the possibility of experiencing a second wave of COVID-19. With that being said, the development, introduction and distribution of effective vaccines will undoubtedly keep protective measures such as these to a minimum and will likely shorten the timeline to return to a ’normal life’.
Of particular interest is whether certain business models will remain or will change sustainably and whether measures adopted during the COVID-19 pandemic, such as remote working, will continue even after the effects of the virus have settled. For example, Bill Gates voiced his opinion in April 2020 about the possibility that traditional physical business trips may be a thing of the past. Perhaps he is correct, at least to a certain degree, as this crisis has forced us all to adapt and become accustomed to relatively new means of regular communication in the form of video teleconference software systems.
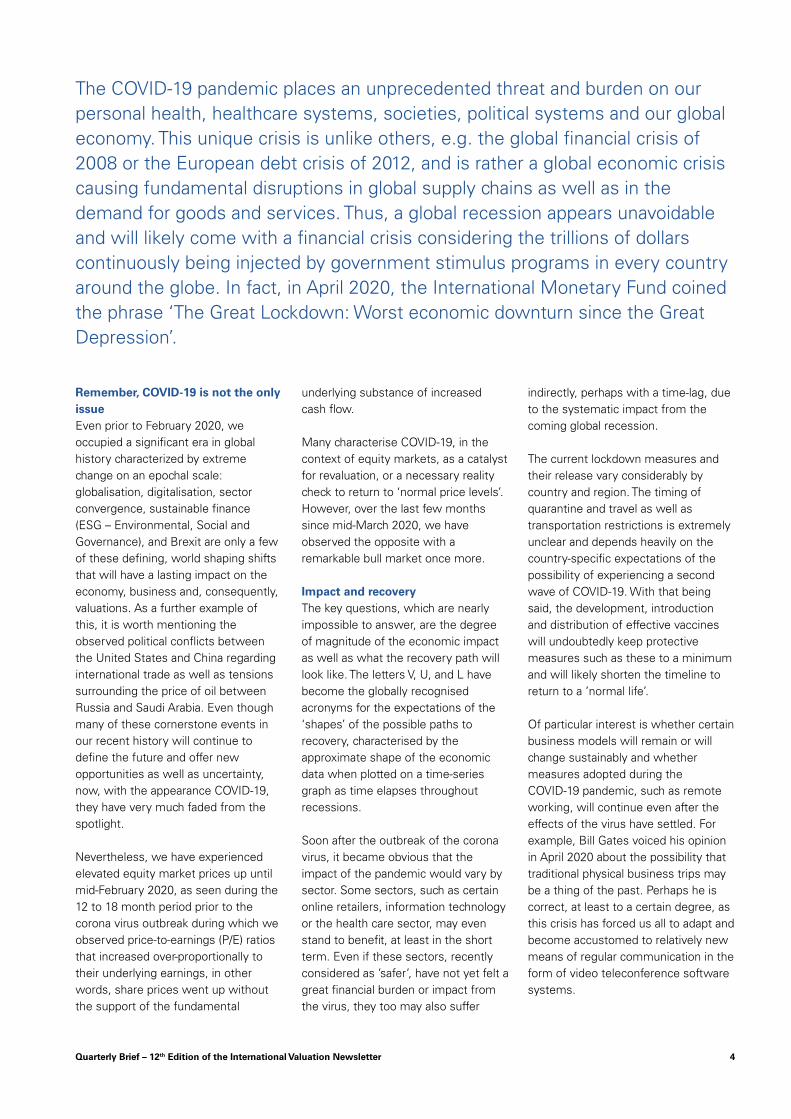
The COVID-19 pandemic places an unprecedented threat and burden on our personal health, healthcare systems, societies, political systems and our global economy. This unique crisis is unlike others, e.g. the global financial crisis of 2008 or the European debt crisis of 2012, and is rather a global economic crisis causing fundamental disruptions in global supply chains as well as in the demand for goods and services. Thus, a global recession appears unavoidable and will likely come with a financial crisis considering the trillions of dollars continuously being injected by government stimulus programs in every country around the globe. In fact, in April 2020, the International Monetary Fund coined the phrase ‘The Great Lockdown: Worst economic downturn since the Great Depression’.

Quarterly Brief – 12th Edition of the International Valuation Newsletter 5
Risk and returnThe key fundamental factors driving value are risk and return, which are equally important in their relation to one another. There are a number of COVID-19 specific macro-economic effects on those factors, such as:• Decreased economic activity• Increased liquidity and credit risk• Increased forecast risk• Increased volatility in foreign
exchange markets• Volatile commodity prices• Increasing country risk, in particular
in countries which are heavily exposed to the corona virus
In addition, specific micro-economic effects determine the value of businesses and assets such as:• Counter-party risk: the degree to
which suppliers and customers are exposed to COVID-19 in a specific sector
• Gearing and timing of refinancing• Effects from governmental support
on (a) short term cost structures and margins, and (b) debt repayments and investment limitations in the mid- and long-term
• Flexibility in future capital expenditures: reduced/delays in
cash outflows may lead to reduced growth potential
• Asset life: the shorter the life, the higher the impact of COVID-19
Equity returns are principally influenced by elements which have been significantly impacted in the past few weeks and months, such as:• Declined risk-free rate, negative in
some countries now • Increased market / equity risk
premiums• Increased beta factors; in-line with
increased volatility• Higher cost of debt / lower credit
quality• New uncertainty in the timing of
recovery and long-term normalisation levels to consider
Below, and in the capital market section, we will take a closer look at some of these factors. For further information, you may also visit KPMG’s COVID-19: The Economic Outlook.
Share prices, analyst forecasts and betas Over the past few months, we have observed exceptional developments in the equity markets. Shortly after the
global corona virus outbreak in mid-February, the MSCI Europe stock price index, for example, dropped by 35% in four weeks. Even more surprising is that the same index rose by 33% in the following months until the end of June. It is still down 13% over the entire period.
Do these changes in share prices reflect the real impact on value, or can this be characterised more as an overreaction in the market? A necessary distinction should be made here between ‘price’ and ‘value’. As we know, the market price of any equity security is simply driven by ‘supply and demand‘, which may or may not reflect the reality of the underlying economic fundamentals of a business. Value, on the other hand, is a function of such fundamentals, i.e. cash flows, future growth, and risk (i.e. volatility).
Examining the analyst consensus forecasts in the MCSI Europe index between December 2019 and June 2020, the plunge of 38% in earnings expectations for 2020 (see chart on page 6) is clearly misaligned with the relatively lower net decrease of 13% of the index itself (see table below).
Development of stock market indices – change of closing prices
Impact to index-low(20.02.20 to 23.03.20)
Index-low to date(23.03.20 to 30.06.20)
Impact to date(20.02.20 to 30.06.20)
MSCI World Arrow-alt-circle-down (33.8%) Arrow-alt-circle-up 37.4% Arrow-alt-circle-down (9.0%)
MSCI Europe Arrow-alt-circle-down (34.9%) Arrow-alt-circle-up 33.1% Arrow-alt-circle-down (13.4%)
EURO Stoxx 600 Arrow-alt-circle-down (34.8%) Arrow-alt-circle-up 28.5% Arrow-alt-circle-down (16.2%)
FTSE 100 Arrow-alt-circle-down (32.8%) Arrow-alt-circle-up 23.5% Arrow-alt-circle-down (17.0%)
DAX Arrow-alt-circle-down (36.0%) Arrow-alt-circle-up 40.8% Arrow-alt-circle-down (9.9%)
SMI Arrow-alt-circle-down (26.8%) Arrow-alt-circle-up 23.1% Arrow-alt-circle-down (9.9%)
S&P 500 Arrow-alt-circle-down (33.7%) Arrow-alt-circle-up 38.6% Arrow-alt-circle-down (8.1%)
Nikkei 250 Arrow-alt-circle-down (28.1%) Arrow-alt-circle-up 32.0% Arrow-alt-circle-down (5.1%) Source: S&P Capital IQ, KPMG analysis

Quarterly Brief – 12th Edition of the International Valuation Newsletter 6
Change in analyst forecasts (for net income) as of 30 June 2020 vs 31 December 2019
Source: S&P Capital IQ; KPMG analysisNote: Percentages represent the change in consensus net income 2020 analysts’ forecasts per sector of the MSCI Europe index between 31 December 2019 and 30 June 2020; change in total MSCI Europe index weighted by market capitalisation by sector
-102%
-98%
-78%
-51%
-49%
-31%
-30%
-28%
-23%
-11%
-4%
-38%
-120%-100%-80%-60%-40%-20%0%
Energy
Real Estate
Consumer Discretionary
Financials
Industrials
Communication Services
Materials
Information Technology
Consumer Staples
Utilities
Health Care
MSCI Europe (weighted)
The chart below further illustrates the impact on the various sectors, from the viewpoint of equity research analysts.1
Earnings forecasts are more relevant for valuation considerations than for analysing stock market prices. Analysts, when developing their earnings estimates, typically forecast over a limited number of years (typically from one to three). However, prices reflects a longer view dictated by the investment time horizon of the
1 The shown changes illustrate how analyst consensus for 2020 has decreased between December 2019 and June 2020. While most of the impact can be assumed to relate to COVID-19 effects, either direct or indirect, additional elements may have also played a role.
buyer and, as mentioned above, by the supply and demand for equity shares. Considering the current observed high price levels of equity shares as well as increased trading volume in the market, the demand for equity as an asset class seems to be high. Finally, values should reflect a long-term view (terminal value) on cash flows and growth. The analyst consensus shown in the graph below only provides the view on 2020 and not beyond. In order to bridge the gap that exists between the changes in analyst consensus and a sharp drop coupled with a surprising subsequent increase in price levels, as illustrated in the index development
table on the previous page, one may have to look at the considerably fast recovery of investor expectations.
Apart from the fundamentals of cash flow and growth, risk, as expressed by price volatility, is another key driver of value. This can be estimated by using beta factors (following the capital asset pricing model, or CAPM). The beta is a generally good proxy for volatility in the price of a share on an individual basis (or combined share prices within one sector for index considerations) compared with the volatility of the entire market.

Quarterly Brief – 12th Edition of the International Valuation Newsletter 7
Two year-weekly betas (raw) as of 30 June 2020 vs 31 December 2019
Source: S&P Capital IQ; KPMG analysisNote: Betas are calculated by regressing the respective MSCI Europe sector index against the overall MSCI Europe index over a 2-year weekly period
1.54
0.94
1.18
1.30
1.14
0.95
1.11
1.20
0.57
0.76
0.79
1.00
1.21
0.59
1.13
1.21
1.10
0.87
1.30
1.33
0.52
0.58
0.83
1.00
0.0 0.5 1.0 1.5
Energy
Real Estate
Consumer Discretionary
Financials
Industrials
Communication Services
Materials
Information Technology
Consumer Staples
Utilities
Health Care
MSCI Europe
Beta as of 31 December 2019 Beta as of 30 June 2020
The chart above examines the development of the beta factor by sector of the MSCI Europe index during the period from 31 December 2019 to 30 June 2020.
As shown above, we begin to see a different story compared to what we saw occurring in the consensus earnings forecasts. In the analyst consensus forecasts, many analysts had adjusted their estimates downward for each sector. In the beta factors, we see a mixed picture. This directional difference exemplifies our earlier observation that the impact of COVID-19 varies remarkably by sector.
In the Real Estate sector, as an example, the beta factor increased from 0.59 in December 2019 to 0.94 by the end of June 2020, representing a
significant increase in observed volatility and, as such, an indication of a potential significant reduction in value. As shown on page 6, analyst consensus in net income forecasts in the Real Estate sector plunged by 98%. However, the share prices for that sector dropped ‘only’ by 23% from mid-February to the end of June 2020. Increased risk, a significant drop in current earnings but still only a relatively moderate drop in share prices – how can this be explained? A sound valuation analysis should be able to provide answers to those observations and how they relate to the business that is subject to the valuation.
In summary, many macro- and micro-economic factors have been shifted dramatically over the course of the last months since the global outbreak of
COVID-19. Equity share price levels initially dropped but then significantly, but not fully, recovered towards June 2020. While it is true that the expected impact differs by sector, it is interesting to note that analysts generally expect a more significant overall drop in 2020 earnings compared to the observed decline in market price levels. This may indicate that investors expect a sharp recovery (V) which may stand in contrast to the looming global recession. Risk expressed in terms of beta is again assessed quite differently in various sectors. If we take into consideration the various capital market observations, it becomes clear that it is difficult to understand market developments and that, consequently, valuations become an even greater challenge these days.

Quarterly Brief – 12th Edition of the International Valuation Newsletter 8
Transparency mattersEven more so in times of great uncertainty

Quarterly Brief – 12th Edition of the International Valuation Newsletter 9
The turbulence created by the COVID-19 pandemic does not change the fundamentals of valuation. The generally accepted valuation principles, in particular the market and income approaches, still stand. However, the required inputs necessitate a very diligent analysis. This is true for both financial inputs from the target business as well as observable benchmark and capital market data. A careful balance in the risk assessment is also of the utmost importance.
Market approachOn one side, transactions signed and closed before the corona virus outbreak and the derived multiples are no longer particularly indicative valuation inputs while more recent comparable transactions after February 2020 are very sparse. On the other side, multiples from publicly listed companies are likely to be heavily distorted by COVID-19.
Whether the percentage change in the market capitalisation of a particular sector or of a set of comparable publicly listed companies provides a reasonable proxy of the magnitude of the change to be expected in multiples should be carefully considered given the discussions earlier in this newsletter.
Similarly, the effects of COVID-19 may or may not have yet materialised and impacted the current observed EBITDA and/or EBIT of the company or sector in question. In any case, even though impacts on the EBITDA and/or EBIT may reflect the short-term impact of
COVID-19, they do not reliably provide an indication of the company’s or sector’s recovery path.
In the application of multiples under the market approach, one typically make adjustments to normalise for one-off effects in earnings. However, it is challenging to assess whether the corona virus impact should be considered as an adjustable one-off effect or not, and if so, the extent to which multiples should be adjusted.
Forward looking multiples could certainly be helpful but it should be noted that the base metric of the peer group multiples is updated with a delay, i.e. the consensus analyst forecasts lag behind the swift moving environment of the target business.
When evaluating at EBITDA or EBIT, differences in financing structures are not particularly reflected. During ‘normal times’ this would be sufficiently considered in the bridge between enterprise and equity value. However, during times where the debt leverage is increasing substantially and the cost of debt is increasing as well (see further below) those effects on value may no longer be sufficiently reflected in the value analysis.
Even further adding to the disorientation caused by COVID-19, the new lease accounting standard IFRS 16, which was introduced in 2019, already significantly lowered the comparability as both financial metrics and multiples are affected in different magnitudes amongst peer companies.
Adjustments or normalisations to all factors as just mentioned can be considered and applied but it seems hard to assess the magnitude for all of these properly. Transparency is reduced with any such adjustment, which will, in the end, depend mostly on professional judgement. In any case, care should be taken to avoid double counting with regards to downwards adjustments of the financial metric (e.g. EBITDA or EBIT) and the multiple.
All these uncertainties lead to a notable shift towards scenario based income approaches and away from market approaches even in areas where multiples have been the dominate pricing methodology. An example is the increase in amount and level of detail requested by limited partners (LP) from general partners (GP) of private equity funds to a point never experienced before.
Income approachAn income approach such as the discounted cash flow (DCF) method or the dividend discount model (DDM) always provides more details with regards to assumptions and inputs, particularly over longer time horizons, and critical financing activities as well as their impact on value can be captured more precisely than in a market approach. However, an increased level of detail does not necessarily mean improved results. Nonetheless, such a detailed model-based analysis makes the thought process of management and the valuation analyst considerably more transparent.
Even the most sophisticated and widely-accepted valuation approaches, with the most detailed valuation analyses, undoubtedly, will struggle to eliminate the uncertainty of their results in an environment like today’s. However, the appropriate application of valuation methodologies and approaches should include sufficient details of the underlying process with the goal of increased transparency, thus allowing the audience of the valuation analysis to form their own view and have a more solid basis upon which a decision can be made.

Quarterly Brief – 12th Edition of the International Valuation Newsletter 10
Cash flow forecastsThe first key challenge is an adequate COVID-19 related adjustment of the financial projections applied in the valuation. An assessment should be performed with regards to all key macro-economic factors as well as sector and target business relevant micro-economic factors listed in the first section of this newsletter. Staying silent on such factors would implicitly assume an expectation of no changes compared to pre-COVID-19 times. The
key questions remain, i.e. the timing and shape of the recovery path (V, U or L), especially with regards to any long-term changes in business model, and the consequent assumptions on growth, profitability and investment requirements in the long run.
Discount ratesThe various parameters which determine the discount rate show remarkable changes in the past few months:
All these changes will likely lead to a net increase in the discount rates. All else being equal, i.e. even if no changes have been applied to the cash flow forecasts, an increase in the discount rate, which is a reflection of increased risk of other potential investments, would result already in a downward pressure on the value.
The biggest challenge regarding the cost of capital is assessing whether the corona virus effects should be reflected with a specific ‘COVID-19 risk premium’ (alpha factor) to the discount rate. There are two critical obstacles:(1) There is no reliable way to assess
the magnitude of a COVID-19 alpha factor (at least we have not seen anything yet). 50 bps, 100 bps or 200 bps? It is difficult to say.
(2) Any COVID-19 alpha factor would initially have an effect on the entire forecast period including the terminal value. This may not be appropriate if one assumes that COVID-19 risks will have dissolved at any point in time in the future. A consideration of the COVID-19 alpha factor only for the first years of the cash flow forecast might be a solution although this appears to be very arbitrary.
As for the market approach, it remains a big task to ensure that the risks associated with the corona virus pandemic are sufficiently covered without double counting the effects in the cash flows on one side and the discount rate on the other side.
Parameters Direction Comments
Risk free rate Arrow-alt-circle-downRisk free rates have been reduced and are now even below zero in some countries; it is unknown whether this is a sustainable level.
Equity risk premium Arrow-alt-circle-up
Equity risk premiums applied by analysts went up in the majority of cases, based on the assumption that the overall return expectation of equity investors stay fairly stable over time; this is supported by an increase in forward looking implied equity risk premiums.
Cost of debt Arrow-alt-circle-up Credit ratings declined, spreads went up and, in total, the overall cost of debt generally went up as well.
Country risk premium Arrow-alt-circle-up
Country risk premiums went up, depending mostly on the corona virus exposure of a particular country.
Small size premium Arrow-alt-circle-up
The small size premium, if applicable, does not necessarily require an adjustment but the lower values and market capitalisations may lead to a different size segmentation of the underlying analysis.
Source: KPMG

Quarterly Brief – 12th Edition of the International Valuation Newsletter 11
Expected cash flow approach provides the best basis for a sound analysisA traditional DCF analysis uses a single, most likely, cash flow projection. The base cost of capital should reflect the systematic risk (unmodified CAPM), while alpha factors, if applicable, would reflect any potential unsystematic risks, e.g. the COVID-19 risk premium as discussed above.
As previously mentioned, the uncertainty with regards to the depth and length of the corona virus pandemic, including the risk of a second wave, makes it hard to believe that there is a reasonable ‘single most likely cash flow projection’. This is made evident by the fact that, in light of COVID-19, most companies have envisioned different scenarios for their business plans, even though this is not always directly communicated in detail to the markets.
It is common sense amongst valuation practitioners, but also for standard setting bodies, regulatory authorities and auditors, that the application of multiple ‘probability-weighted projected cash flow scenarios’ provides the most robust, transparent and appropriate basis for a sound valuation analysis in times of uncertainties and, thus, in times of COVID-19.
Traditional DCF method: simple most likely cash flow projection
High uncertainty whether the projected recovery path will be achieved ➔ additional COVID-19 risk premium in the cost of capital might be appropriate
CHF
t
Source: KPMG

Quarterly Brief – 12th Edition of the International Valuation Newsletter 12
Probability weighted DCF method: multiple scenario-based cash flows projections
Source: KPMG
t
Uncertainty of the projected recovery path is reflected in the probability weighting ➔ no additional COVID-19 risk premium in the cost of capital required
Probability
10%
10%
60%
20%
CHF
The Cash flow scenarios can make very explicit distinctions with regards to the recovery path of the top line, cost developments, timing of investments, and any financing measures. These scenario assumptions can be supported with external data and aligned with expectations of the respective sector to the extent possible. Management’s view can also be easily illustrated and taken into consideration. While such an approach
does not reduce the amount of required professional judgment, it increases the accuracy and, even more importantly, provides the highest possible degree of transparency.
The cost of capital can apply the standard observable input (lower risk free rates, increased equity risk premium, country risk and cost of debt) but does not have to quantify any specific COVID-19 premium as this is
reflected in the probability weighting of the scenarios.
The main area of professional judgement in this approach is clearly the probability weighting of (a) the cash flow scenarios or (b) the resulting values for each scenario. In spite of this, we strongly believe that such an approach is, by far, more comprehensive and we are confident that it is easier to follow the probability assessment of a well described and documented scenario than the simple application of an arbitrary COVID-19 risk premium.
This probability-weighted projected cash flow scenario approach is not new and has already been applied for many years in other complex environments affected by a high degree of uncertainty such as, for example, in the pharmaceutical sector.
This recommended probability-weighted scenario analysis is less complicated than it may sound and KPMG has already developed and applied such analyses and methodologies based, for example, on Monte-Carlo simulations, which replace simple risk premiums with decisive cash flow based analyses enhancing the decision making process.

Quarterly Brief – 12th Edition of the International Valuation Newsletter 13
Capital market data

Quarterly Brief – 12th Edition of the International Valuation Newsletter 14
Inde
x pe
rfor
man
ce (%
)
QoQ YoY
MSCI World MSCI Emerging Markets
STOXXEurope
600
FTSE 100 DAX CAC 40 Ibex 35 SMI S&P 500 NASDAQ Nikkei 225
18.8%17.3%
12.6%
8.8%
23.9%
12.3%
6.6% 7.9%
20.0%
30.6%
17.8%
1.1%
-5.7% -6.4%
-16.9%
-0.7%
-10.9%
-21.4%
1.5%
5.4%
25.6%
4.8%
Performance of leading indices30 June 2019 – 30 June 2020
Source: Capital IQ, KPMG analysis
In this section, we provide a selection of key financial market data covering:• Comparison of major stock market
performance for the 12 months ending 30 June 2020
• EURO STOXX 600 sector multiples• Risk-free rates for major currencies• Country risk premiums and inflation
forecasts for the BRIC countries
Major stock market performance: Strong rebound in Q3 The outbreak of COVID-19 led to massive drops in stock prices in the
first quarter of this year as investors feared the consequences of the COVID-19 pandemic on the economy. Since then, all indices taken into consideration have increased, regaining part, but not all, of the value lost in Q1 2020. While the overall performance over the past 12 months is, on average, still negative, the picture looks quite different when evaluating individual sectors and regions. For example, while the MSCI World, DAX and SMI showed little movement (returns between -0.7%
and +1.5%), indices of other European countries such as the UK, France or Spain lost a significant portion of their value (returns between -16.9% and -21.4%). Similarly, the S&P 500 and Nikkei 225, while still able to generate returns of approximately 5%, were considerably outperformed by the NASDAQ, which gained more than 25% over the past 12 months, clearly highlighting who the ‘winners’ of the lockdown were, i.e. technology companies.

Quarterly Brief – 12th Edition of the International Valuation Newsletter 15
EURO STOXX 600 sector multiples: Multiples decreased across all sectorsThe enterprise value (EV) multiple states the market value of the business in relation to an appropriate base metric. Commonly used base metrics include revenue and EBITDA. The numerator (EV) and denominator (revenue, EBITDA) represent all investor’s claims on the business.
The outbreak of COVID-19 led most countries into a lockdown and a sharp
reduction of economic activity in the first months of 2020. Those measures taken by many countries in Europe triggered investors to sell their shares for various reasons causing many stock prices to fall significantly. This can also be observed when evaluating sector multiples of the Euro STOXX 600. Across all industries, the median EV/EBITDA multiple has decreased, consumer discretionary and consumer staples were hit the hardest with their median multiples falling by 3.1x and 2.6x, respectively, between
31 December 2019 and 30 June 2020. Interestingly, and in contradiction to the development of the technology index NASDAQ, which increased by more than 25% since December 2019, the European sector multiple for information technology decreased between December 2019 and June 2020. However, it should be emphasised that the multiple for information technology fell only by 0.6x – similar to that of the Healthcare Multiple – a much lesser decrease compared to that of other sectors.
30Jun20
31Mar20
31Dec19
30Sep19
30Jun20
31Mar20
31Dec19
30Sep19
EV/Revenue EV/EBITDA
Communication Services Median
0.0x
3.0x
6.0x
9.0x
12.0x
15.0x
18.0x
2.5x 2.6x 2.3x 2.3x
9.5x 9.3x7.7x 8.4x
30Jun20
31Mar20
31Dec19
30Sep19
30Jun20
31Mar20
31Dec19
30Sep19
EV/Revenue EV/EBITDA
Consumer Discretionary Median
0.0x
3.0x
6.0x
9.0x
12.0x
15.0x
18.0x
1.6x 1.8x 1.2x 1.5x
10.0x 11.1x
7.5x 8.0x
2.2x 2.2x 2.0x 2.0x
12.1x 12.9x
10.0x 10.3x
Consumer Staples Median
0.0x
3.0x
6.0x
9.0x
12.0x
15.0x
18.0x
EV/Revenue EV/EBITDA
30Jun20
31Mar20
31Dec19
30Sep19
30Jun20
31Mar20
31Dec19
30Sep19

Quarterly Brief – 12th Edition of the International Valuation Newsletter 16
Source: Capital IQ, KPMG analysisNotes: Multiples are analysed based on the latest information available as of the assessment date for the respective edition of the Quarterly Brief. Changes of index composition, revised financial information and newly available information as of the respective assessment date may cause multiples to change. 1 Financial services companies differ from many other companies in how they operate. Debt acts more as ‘raw material’ than operational capital for financial
services companies. A common valuation metric used by analysts evaluating such firms is the price to book (P/B) ratio.
0.9x 1.0x 0.8x 0.8x
5.6x 5.7x3.9x 4.3x
Energy (Oil and Gas) Median
30Jun20
31Mar20
31Dec19
30Sep19
30Jun20
31Mar20
31Dec19
30Sep19
EV/Revenue EV/EBITDA
0.0x
3.0x
6.0x
9.0x
12.0x
15.0x
18.0x
1.5x 1.6x 1.2x 1.2x
9.2x 8.8x7.1x 7.7x
1.0x 1.1x 0.7x 0.8x
Financials Median1
0.0x
2.0x
4.0x
6.0x
8.0x
10.0x
12.0x
EV/Revenue EV/EBITDA P/BV
30Sep19
31Dec19
31Mar20
30Jun20
30Sep19
31Dec19
31Mar20
30Jun20
30Sep19
31Dec19
31Mar20
30Jun20
4.2x 4.5x 4.2x 4.4x
17.0x 17.5x15.1x
16.9x
Health Care Median
30Jun20
31Mar20
31Dec19
30Sep19
30Jun20
31Mar20
31Dec19
30Sep19
EV/Revenue EV/EBITDA
0.0x
3.0x
6.0x
9.0x
12.0x
15.0x
18.0x
1.6x 1.7x 1.1x 1.4x
11.3x 11.4x
8.0x9.4x
Industrials Median
30Jun20
31Mar20
31Dec19
30Sep19
30Jun20
31Mar20
31Dec19
30Sep19
EV/Revenue EV/EBITDA
0.0x
3.0x
6.0x
9.0x
12.0x
15.0x
18.0x
4.2x 4.4x 3.9x 4.6x
15.8x17.9x
14.2x
17.3xInformation Technology Median
30Jun20
31Mar20
31Dec19
30Sep19
30Jun20
31Mar20
31Dec19
30Sep19
EV/Revenue EV/EBITDA
0.0x
3.0x
6.0x
9.0x
12.0x
15.0x
18.0x
1.4x 1.6x 1.2x 1.4x
9.0x 9.5x7.0x 8.0x
Materials Median
30Jun20
31Mar20
31Dec19
30Sep19
30Jun20
31Mar20
31Dec19
30Sep19
EV/Revenue EV/EBITDA
0.0x
3.0x
6.0x
9.0x
12.0x
15.0x
18.0x
16.8x17.4x14.7x16.0x
28.0x29.8x27.5x27.5x
1.1x 1.1x 1.0x 1.0x
Real Estate Median
30Sep19
31Dec19
31Mar20
30Jun20
30Sep19
31Dec19
31Mar20
30Jun20
30Sep19
31Dec19
31Mar20
30Jun20
0.0x5.0x
10.0x15.0x20.0x25.0x30.0x35.0x
EV/Revenue EV/EBITDA P/BV
2.9x 2.9x 2.9x 3.1x
10.9x 11.0x9.2x 9.7x
Utilities Median
30Jun20
31Mar20
31Dec19
30Sep19
30Jun20
31Mar20
31Dec19
30Sep19
EV/Revenue EV/EBITDA
0.0x
3.0x
6.0x
9.0x
12.0x
15.0x
18.0x

Quarterly Brief – 12th Edition of the International Valuation Newsletter 17
Risk-free rates: Interest rates fall againThe risk-free rate (or base rate) can generally be broken down into two key components that seek to compensate the investor: the first for expected inflation and the second for deferred consumption. The base rate is considered to be free of risks except for risks embedded in the underlying currency and risks related to investments in the particular country. As no investment is truly risk free, the risk-free rate is typically approximated by reference to the yield on long-term debt instruments issued by presumably financially healthy governments. The historical risk-free rates for Germany, the Eurozone, the US, the UK and Switzerland are shown below.
In the Quarterly Brief of January 2020 we raised the question whether the end of the zero-interest rate environment had been reached. Since then, however, central banks have started to ease their monetary policies again as a response to the outbreak of COVID-19. In Germany, interest rates are negative again for the first time since Q3 2019. In the UK, interest rates were cut by more than half compared to the end of 2019 and are now at approximately 0.6%. In the US, the risk-free rate decreased by 86 bps from 2.46% as of 31 December 2019 to 1.6% as of 30 June 2020.
Risk-free rates
Date Euro-countries Germany UK Switzerland USAEUR EUR GBP CHF USD
31/03/201630/06/201630/09/201631/12/2016
1.03%0.46%0.53%0.97%
0.90%0.49%0.47%0.95%
2.39%1.85%1.61%2.03%
0.25%(0.03)%0.00%0.35%
2.81%2.50%2.48%3.06%
31/03/201730/06/201730/09/201731/12/2017
1.25%1.39%1.40%1.34%
1.24%1.33%1.38%1.34%
1.88%2.02%2.05%1.89%
0.32%0.39%0.45%0.36%
3.27%3.04%3.04%2.89%
31/03/201830/06/201830/09/201831/12/2018
1.25%1.09%1.13%0.90%
1.24%1.12%1.15%0.94%
1.79%1.83%1.87%1.91%
0.56%0.51%0.61%0.37%
3.08%3.00%3.10%3.17%
31/03/201930/06/201930/09/2019 31/12/2019
0.67%0.35%(0.03)% 0.37%
0.65%0.33%(0.03)% 0.34%
1.65%1.56%0.88% 1.25%
0.17%0.02%(0.36)% (0.16)%
2.96%2.71%2.25% 2.46%
31/03/202030/06/2020
0.06%0.01%
0.01%(0.02)%
0.68%0.56%
(0.20)%(0.29)%
1.54%1.60%
Source: KPMG analysisApproach: Determination of a present value-equivalent uniform interest rate based on the yield curve of the respective central bank
Quarterly Brief – 12th Edition of the International Valuation Newsletter 18
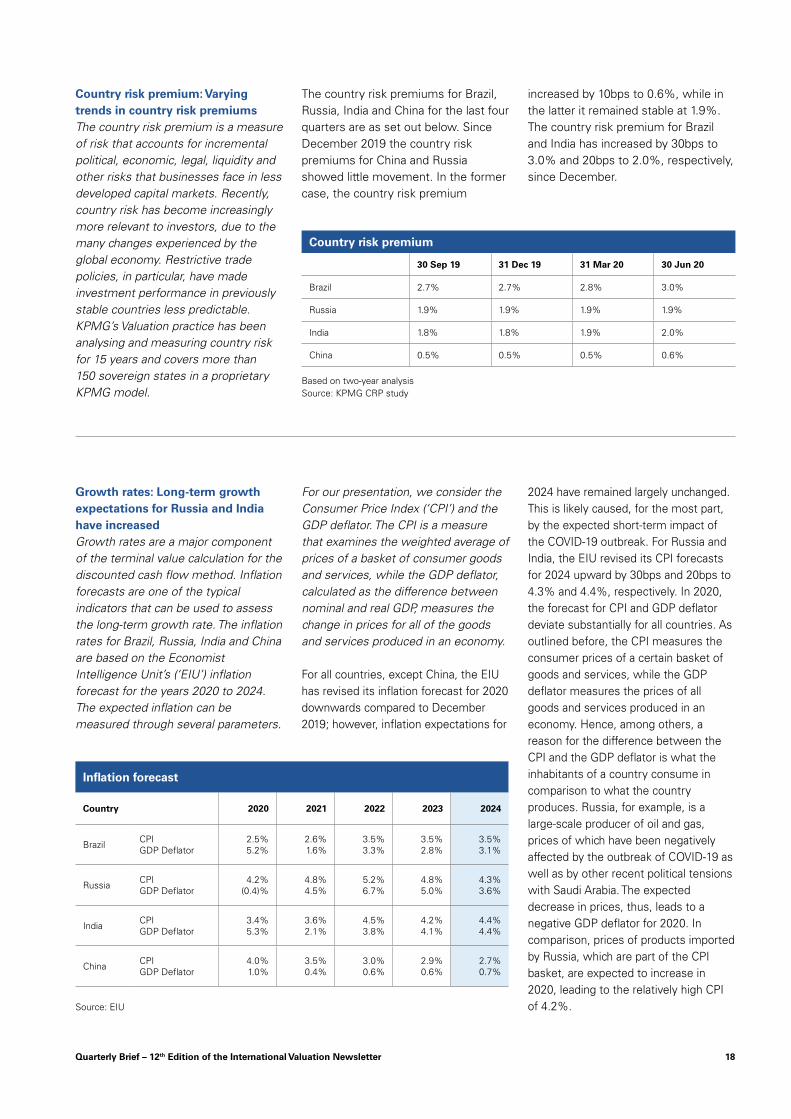
Country risk premium: Varying trends in country risk premiums The country risk premium is a measure of risk that accounts for incremental political, economic, legal, liquidity and other risks that businesses face in less developed capital markets. Recently, country risk has become increasingly more relevant to investors, due to the many changes experienced by the global economy. Restrictive trade policies, in particular, have made investment performance in previously stable countries less predictable. KPMG’s Valuation practice has been analysing and measuring country risk for 15 years and covers more than 150 sovereign states in a proprietary KPMG model.
The country risk premiums for Brazil, Russia, India and China for the last four quarters are as set out below. Since December 2019 the country risk premiums for China and Russia showed little movement. In the former case, the country risk premium
increased by 10bps to 0.6%, while in the latter it remained stable at 1.9%. The country risk premium for Brazil and India has increased by 30bps to 3.0% and 20bps to 2.0%, respectively, since December.
Country risk premium
30 Sep 19 31 Dec 19 31 Mar 20 30 Jun 20
Brazil 2.7% 2.7% 2.8% 3.0%
Russia 1.9% 1.9% 1.9% 1.9%
India 1.8% 1.8% 1.9% 2.0%
China 0.5% 0.5% 0.5% 0.6%
Based on two-year analysisSource: KPMG CRP study
Growth rates: Long-term growth expectations for Russia and India have increasedGrowth rates are a major component of the terminal value calculation for the discounted cash flow method. Inflation forecasts are one of the typical indicators that can be used to assess the long-term growth rate. The inflation rates for Brazil, Russia, India and China are based on the Economist Intelligence Unit’s (‘EIU’) inflation forecast for the years 2020 to 2024. The expected inflation can be measured through several parameters.
For our presentation, we consider the Consumer Price Index (‘CPI’) and the GDP deflator. The CPI is a measure that examines the weighted average of prices of a basket of consumer goods and services, while the GDP deflator, calculated as the difference between nominal and real GDP, measures the change in prices for all of the goods and services produced in an economy.
For all countries, except China, the EIU has revised its inflation forecast for 2020 downwards compared to December 2019; however, inflation expectations for
2024 have remained largely unchanged. This is likely caused, for the most part, by the expected short-term impact of the COVID-19 outbreak. For Russia and India, the EIU revised its CPI forecasts for 2024 upward by 30bps and 20bps to 4.3% and 4.4%, respectively. In 2020, the forecast for CPI and GDP deflator deviate substantially for all countries. As outlined before, the CPI measures the consumer prices of a certain basket of goods and services, while the GDP deflator measures the prices of all goods and services produced in an economy. Hence, among others, a reason for the difference between the CPI and the GDP deflator is what the inhabitants of a country consume in comparison to what the country produces. Russia, for example, is a large-scale producer of oil and gas, prices of which have been negatively affected by the outbreak of COVID-19 as well as by other recent political tensions with Saudi Arabia. The expected decrease in prices, thus, leads to a negative GDP deflator for 2020. In comparison, prices of products imported by Russia, which are part of the CPI basket, are expected to increase in 2020, leading to the relatively high CPI of 4.2%.
Inflation forecast
Country 2020 2021 2022 2023 2024
Brazil CPI GDP Deflator
2.5% 5.2%
2.6% 1.6%
3.5% 3.3%
3.5% 2.8%
3.5% 3.1%
Russia CPI GDP Deflator
4.2% (0.4)%
4.8% 4.5%
5.2% 6.7%
4.8% 5.0%
4.3% 3.6%
India CPI GDP Deflator
3.4% 5.3%
3.6% 2.1%
4.5% 3.8%
4.2% 4.1%
4.4% 4.4%
China CPI GDP Deflator
4.0% 1.0%
3.5% 0.4%
3.0% 0.6%
2.9% 0.6%
2.7% 0.7%
Source: EIU

Contacts
KPMG AGRäffelstrasse 28PO Box8036 Zurich
kpmg.ch/valuation
Johannes PostPartner, Deal AdvisoryGlobal Head of Valuation Services
+41 58 249 35 [email protected]
Rolf LangeneggerDirector, Deal Advisory Valuation / Financial Modelling
+41 58 249 42 [email protected]
The information contained herein is of a general nature and is not intended to address the circumstances of any particular individual or entity. Although we endeavor to provide accurate and timely information, there can be no guarantee that such information is accurate as of the date it is received, or that it will continue to be accurate in the future. No one should act on such information without appropriate professional advice after a thorough examination of the particular situation. The scope of any potential collaboration with audit clients is defined by regulatory requirements governing auditor independence. If you would like to know more about how KPMG AG processes personal data, please read our Privacy Policy, which you can find on our homepage at www.kpmg.ch.
© 2020 KPMG AG is a subsidiary of KPMG Holding AG, which is a member of the KPMG network of independent firms affiliated with KPMG International Cooperative (“KPMG International”), a Swiss legal entity. All rights reserved.