Embed Size (px)
Citation preview
WEB CHAPTER 19Analysis of Financial Statements
WEB CHAPTER 20An Introduction to Security Valuation
NEL
7P A R T
Valuation Principles and Practices
19Ch19.qxd 1/6/10 3:22 PM Page 1
Early in the textbook, you learnedabout the purpose of investing,the importance of appropriateasset allocation, and the numerousinvestment instruments availableon a global basis. In your earliercorporate finance classes, youwould have reviewed the majordevelopments in investmenttheory as they relate to efficientcapital markets, portfolio theory,capital asset pricing, and multi-factor valuation models.There-fore, at this point you are in aposition to consider the theoryand practice of estimating thevalue of various securities, whichis the heart of investing and leadsto the construction of a portfoliothat is consistent with your risk-return objectives.You will recallthat the investment decision isbased on a comparison of anasset’s intrinsic value and itsmarket price.
NEL
The main source of informa-tion regarding a stock or bond isthe corporation’s financial state-ments.Web Chapter 19 considerswhat financial statements areavailable and what informationthey provide, followed by a discussion of the financial ratiosused to answer several importantquestions about a firm’s liquidity,its operating performance, its riskprofile, and its growth potential.
Web Chapter 20 considers thebasic principles of valuation andapplies those principles to the valuation of bonds, preferredstock, and common stock.Because it is recognized that thevaluation of common stock is themost challenging task, we presenttwo general approaches to equityvaluation and several techniquesfor each of these approaches.Weconclude this chapter by
reviewing the basic factors thatinfluence the two critical variablesthat determine the intrinsic valueof an asset irrespective of the val-uation model: (1) the requiredreturn for an investment, and (2)the estimated growth rate of earn-ings, dividends, and cash flows forthe investment.
These two chapters, althoughmuch of a review, provide youwith the tools and the theoreticalunderstanding to apply the valua-tion models to the range of enti-ties included in the top-downapproach—the aggregate market,alternative industries, and indi-vidual companies and stocks.
2 PART 7 Valuation Principles and Practices
19Ch19.qxd 1/6/10 3:22 PM Page 2
W E B C H A P T E R
Analysis of Financial Statements
19
NEL
After you read this chapter, youshould be able to answer the following questions:
1. What are the main financialstatements provided by firmsand what specific informationdoes each of them contain?
2. Why do we use financial ratiosto examine the performance ofa firm, and why is it importantto examine performance relativeto the economy and to a firm’sindustry?
3. What are the main categoriesfor financial ratios and whatquestions are answered by theratios in these categories?
4. How can DuPont system analysishelp evaluate a firm’s past andfuture return on equity?
5. What is a quality balance sheetor income statement?
6. Why should you engage infinancial statement analysis ifmarkets are efficient and forward-looking?
You have probably already noted that this is a fairly long chapter withseveral financial statements and numerous financial ratios.The reasonfor this extensive discussion of how to analyze financial statements isthat our ultimate goal (as noted earlier) is to construct a portfolio ofinvestments that will provide returns that are consistent with the riskof the portfolio. In turn, to determine the expected returns on dif-ferent assets we must estimate the future value of each asset as a majorcomponent of the return is the change in asset value over time.There-fore, the crux of investments is valuation. Although we consider var-ious valuation models for common stocks in Web Chapter 20, you arealready aware that the value of any financial asset is the present valueof the expected cash flows generated by the asset.Therefore we mustderive an estimate of the discount rate for the asset (the requiredreturn) and its expected cash flows.The main source of informationneeded to make these two estimates is the financial statement. Toderive an estimated return, we need to understand the business andfinancial risk of the firm. To estimate future cash flows, we mustunderstand the composition of cash flows and what will contribute tothe short-run and long-run growth of these cash flows. Financialstatements, business and financial risk, and analysis of the compositionand growth of cash flow are all topics of this chapter.
We begin by introducing financial statements and discuss why andhow financial ratios are useful. We then review ratios that reflectinternal liquidity, operating performance, risk analysis, and growthanalysis. In addition, we address four main areas in investments wherefinancial ratios have been effectively employed.
Our example in this chapter is Shoppers Drug Mart, the largestretail drugstore chain in Canada. It operates in 1,149 drugstores and 66Shoppers Home Health Care stores. Pharmacy prescription sales gen-erate over 47% of total sales.The firm’s goal is to be Canada’s most con-venient health-care retailer. It takes great pride in its steady sales andearnings growth that have been reflected in strong stock performance.
19.1 Financial Statements
Financial statements are intended to provide information on theresources available to management, how these resources werefinanced, and what the firm accomplished with them. Annual and
19Ch19.qxd 1/6/10 3:22 PM Page 3
NEL
4 PART 7 Valuation Principles and Practices
quarterly reports to the shareholder include three financial statements: the balance sheet, theincome statement, and the statement of cash flows. In addition, reports that must be filed withthe Securities Commission(s) (for example,Annual Information Form or AIF) carry detailedinformation about the firm, such as information on loan agreements, material contracts, andthe like. Information from the basic financial statements can be used to calculate financialratios and to analyze the operations of the firm to determine what factors influence a firm’searnings, cash flows, and risk characteristics.
19.1.1 Generally Accepted Accounting PrinciplesAmong the input used to construct the financial statements are generally acceptedaccounting principles (GAAP), which are formulated by the Canadian Institute of Char-tered Accountants (CICA).The CICA recognizes that it would be improper for all compa-nies to use identical and restrictive accounting principles. Therefore, the CICA allowscompanies some flexibility to choose among appropriate GAAP. This flexibility allows thefirm’s managers to choose accounting standards that best reflect company practice. On thenegative side, this flexibility can allow firms to appear healthier than they really are.1 Giventhis possibility, the financial analyst must rigorously analyze the available financial informationto separate those firms that appear attractive from those that actually are in good financialshape.
Fortunately, the CICA requires that financial statements include notes that indicate whichaccounting principles were used by the firm. Because accounting principles frequently differamong firms, the information in the notes assists the analyst in adjusting the financial state-ments of companies so that they can better compare “apples with apples.”2
19.1.2 Balance SheetThe balance sheet shows what resources (assets) the firm controls and how it has financedthese assets. Specifically, it indicates the current and capital assets available to the firm at a pointin time (the end of the fiscal year or the end of a quarter). In most cases, the firm owns theseassets, but some firms lease assets on a long-term basis. How the firm has financed the acqui-sition of these assets is indicated by its mixture of current liabilities (accounts payable or short-term borrowing), long-term liabilities (fixed debt and leases), and owners’ equity (preferredstock, common stock, and retained earnings).
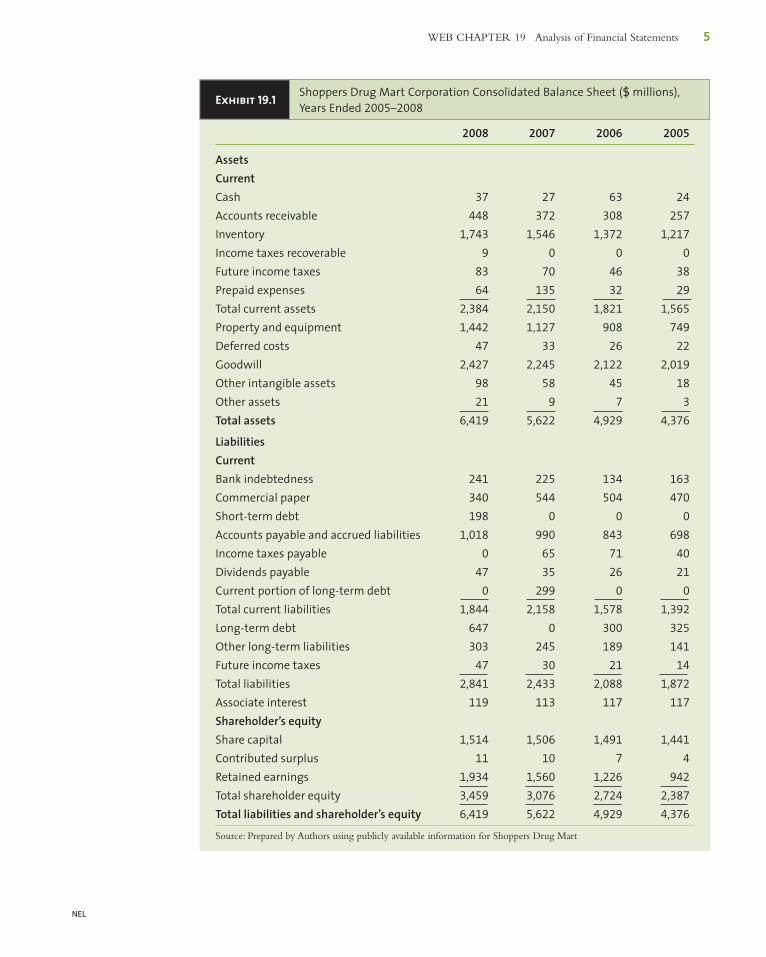
The balance sheet for Shoppers Drug Mart in Exhibit 19.1 represents the stock of assetsand its financing mix as at their fiscal year, 2005–2008.
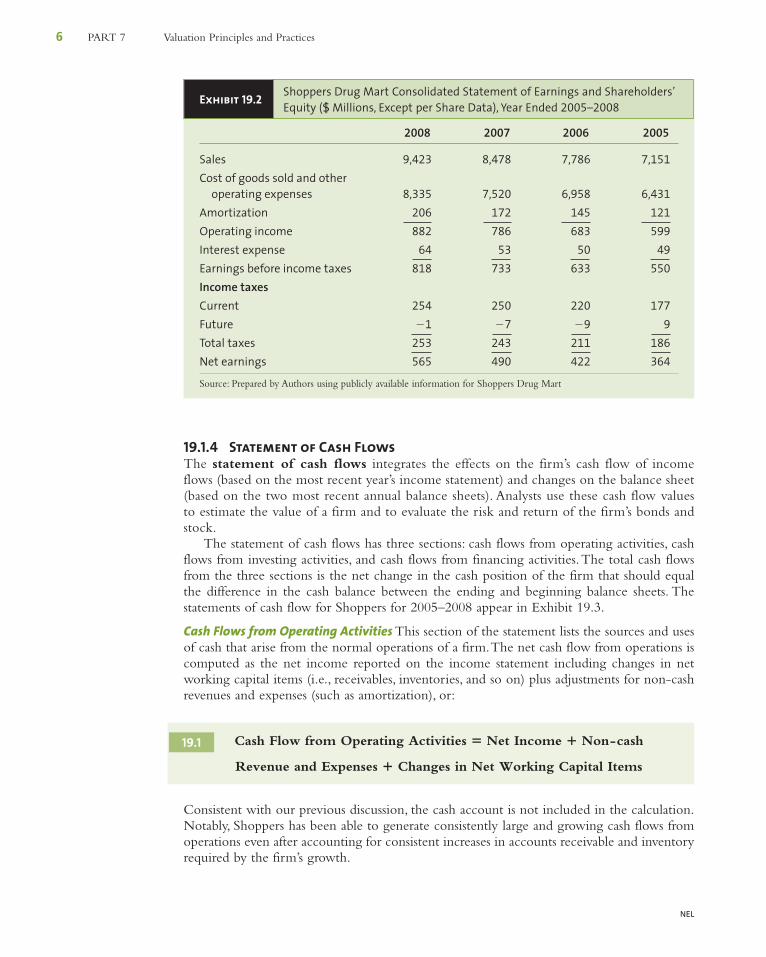
19.1.3 Income StatementThe income statement contains information on the operating performance of the firmduring some period of time (a quarter or a year). In contrast to the balance sheet, which is at afixed point in time, the income statement indicates the flow of sales, expenses, and earningsduring a period of time. The income statement for Shoppers Drug Mart for the years2005–2008 appears in Exhibit 19.2.We concentrate on earnings from operations after tax asthe relevant net earnings figure.
1 The Enron fiasco clearly makes this point. For a general discussion on this topic, see Byrnes and Henry (2001), Henry(2001), and Byrnes, McNamee, Brady, Lavelle, and Palmeri (2002).2 The Canadian Accounting Standards Board has confirmed January 1, 2011 as the date that the international financialreporting standards (IFRS) will replace Canadian GAAP.Although generally similar some significant differences exist.
For updated financialinformation for Shoppers,go to http://www.shoppersdrugmart.ca/english/corporate_ information/investor_relations/financial_information/index.html.
19Ch19.qxd 1/6/10 3:22 PM Page 4
NEL
WEB CHAPTER 19 Analysis of Financial Statements 5
Exhibit 19.1 Shoppers Drug Mart Corporation Consolidated Balance Sheet ($ millions),Years Ended 2005–2008
2008 2007 2006 2005
AssetsCurrentCash 37 27 63 24
Accounts receivable 448 372 308 257
Inventory 1,743 1,546 1,372 1,217
Income taxes recoverable 9 0 0 0
Future income taxes 83 70 46 38
Prepaid expenses 64 135 32 29
Total current assets 2,384 2,150 1,821 1,565
Property and equipment 1,442 1,127 908 749
Deferred costs 47 33 26 22
Goodwill 2,427 2,245 2,122 2,019
Other intangible assets 98 58 45 18
Other assets 21 9 7 3
Total assets 6,419 5,622 4,929 4,376
LiabilitiesCurrentBank indebtedness 241 225 134 163
Commercial paper 340 544 504 470
Short-term debt 198 0 0 0
Accounts payable and accrued liabilities 1,018 990 843 698
Income taxes payable 0 65 71 40
Dividends payable 47 35 26 21
Current portion of long-term debt 0 299 0 0
Total current liabilities 1,844 2,158 1,578 1,392
Long-term debt 647 0 300 325
Other long-term liabilities 303 245 189 141
Future income taxes 47 30 21 14
Total liabilities 2,841 2,433 2,088 1,872
Associate interest 119 113 117 117
Shareholder’s equityShare capital 1,514 1,506 1,491 1,441
Contributed surplus 11 10 7 4
Retained earnings 1,934 1,560 1,226 942
Total shareholder equity 3,459 3,076 2,724 2,387
Total liabilities and shareholder’s equity 6,419 5,622 4,929 4,376
Source: Prepared by Authors using publicly available information for Shoppers Drug Mart
19Ch19.qxd 1/6/10 3:22 PM Page 5
NEL
6 PART 7 Valuation Principles and Practices
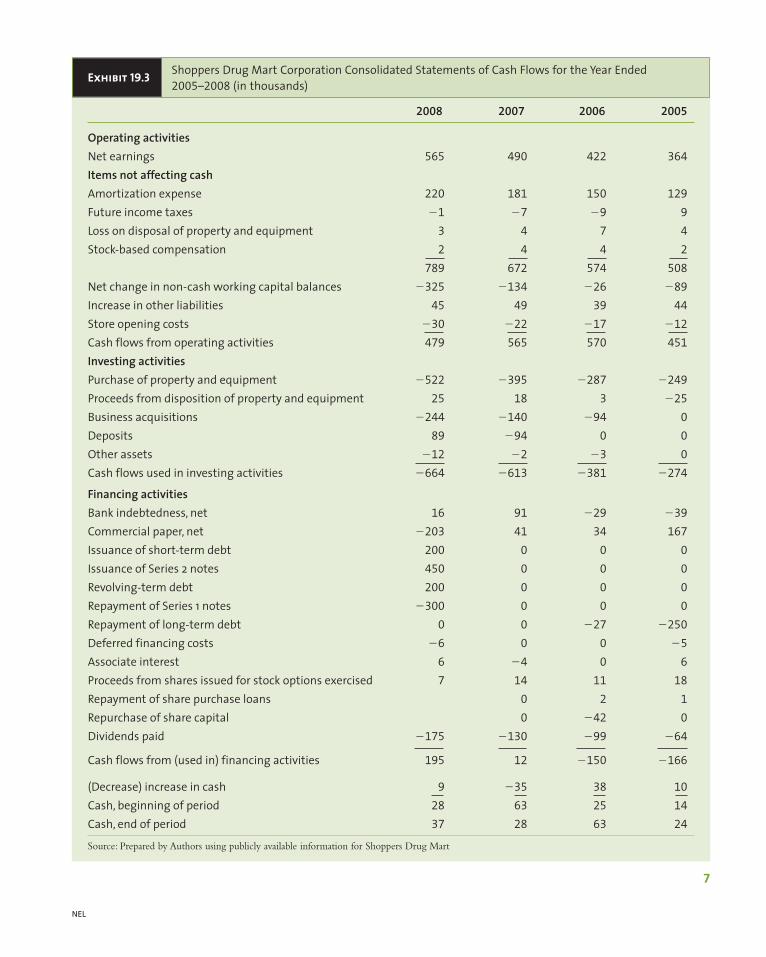
19.1.4 Statement of Cash FlowsThe statement of cash flows integrates the effects on the firm’s cash flow of incomeflows (based on the most recent year’s income statement) and changes on the balance sheet(based on the two most recent annual balance sheets). Analysts use these cash flow valuesto estimate the value of a firm and to evaluate the risk and return of the firm’s bonds andstock.
The statement of cash flows has three sections: cash flows from operating activities, cashflows from investing activities, and cash flows from financing activities.The total cash flowsfrom the three sections is the net change in the cash position of the firm that should equalthe difference in the cash balance between the ending and beginning balance sheets. Thestatements of cash flow for Shoppers for 2005–2008 appear in Exhibit 19.3.
Cash Flows from Operating Activities This section of the statement lists the sources and usesof cash that arise from the normal operations of a firm.The net cash flow from operations iscomputed as the net income reported on the income statement including changes in networking capital items (i.e., receivables, inventories, and so on) plus adjustments for non-cashrevenues and expenses (such as amortization), or:
Consistent with our previous discussion, the cash account is not included in the calculation.Notably, Shoppers has been able to generate consistently large and growing cash flows fromoperations even after accounting for consistent increases in accounts receivable and inventoryrequired by the firm’s growth.
Revenue and Expenses � Changes in Net Working Capital Items
Cash Flow from Operating Activities � Net Income � Non-cash19.1
Exhibit 19.2 Shoppers Drug Mart Consolidated Statement of Earnings and Shareholders’Equity ($ Millions, Except per Share Data), Year Ended 2005–2008
2008 2007 2006 2005
Sales 9,423 8,478 7,786 7,151
Cost of goods sold and other operating expenses 8,335 7,520 6,958 6,431
Amortization 206 172 145 121
Operating income 882 786 683 599
Interest expense 64 53 50 49
Earnings before income taxes 818 733 633 550
Income taxesCurrent 254 250 220 177
Future �1 �7 �9 9
Total taxes 253 243 211 186
Net earnings 565 490 422 364
Source: Prepared by Authors using publicly available information for Shoppers Drug Mart
19Ch19.qxd 1/6/10 3:22 PM Page 6
NEL
Exhibit 19.3 Shoppers Drug Mart Corporation Consolidated Statements of Cash Flows for the Year Ended2005–2008 (in thousands)
2008 2007 2006 2005
Operating activitiesNet earnings 565 490 422 364
Items not affecting cashAmortization expense 220 181 150 129
Future income taxes �1 �7 �9 9
Loss on disposal of property and equipment 3 4 7 4
Stock-based compensation 2 4 4 2
789 672 574 508
Net change in non-cash working capital balances �325 �134 �26 �89
Increase in other liabilities 45 49 39 44
Store opening costs �30 �22 �17 �12
Cash flows from operating activities 479 565 570 451
Investing activitiesPurchase of property and equipment �522 �395 �287 �249
Proceeds from disposition of property and equipment 25 18 3 �25
Business acquisitions �244 �140 �94 0
Deposits 89 �94 0 0
Other assets �12 �2 �3 0
Cash flows used in investing activities �664 �613 �381 �274
Financing activitiesBank indebtedness, net 16 91 �29 �39
Commercial paper, net �203 41 34 167
Issuance of short-term debt 200 0 0 0
Issuance of Series 2 notes 450 0 0 0
Revolving-term debt 200 0 0 0
Repayment of Series 1 notes �300 0 0 0
Repayment of long-term debt 0 0 �27 �250
Deferred financing costs �6 0 0 �5
Associate interest 6 �4 0 6
Proceeds from shares issued for stock options exercised 7 14 11 18
Repayment of share purchase loans 0 2 1
Repurchase of share capital 0 �42 0
Dividends paid �175 �130 �99 �64
Cash flows from (used in) financing activities 195 12 �150 �166
(Decrease) increase in cash 9 �35 38 10
Cash, beginning of period 28 63 25 14
Cash, end of period 37 28 63 24
Source: Prepared by Authors using publicly available information for Shoppers Drug Mart
7
19Ch19.qxd 1/6/10 3:22 PM Page 7
NEL
8 PART 7 Valuation Principles and Practices
Cash Flows from Investing Activities A firm makes investments in both its own non-currentand capital assets and the equity of other firms (which may be subsidiaries or joint ventures ofthe parent firm—they are listed in the “investment” account of the balance sheet). Increases anddecreases in these non-current accounts are considered investment activities.The cash flow frominvesting activities is the change in gross plant and equipment plus the change in the investmentaccount.The changes are positive if they represent a source of funds (e.g., sale of some plantand/or equipment); otherwise they are negative.The dollar changes in these accounts are com-puted using the firm’s two most recent balance sheets. Most firms (including Shoppers) experi-ence negative cash flows from investments due to significant capital expenditures.
Cash Flows from Financing Activities Cash inflows are created by increasing notes payableand long-term liability and equity accounts, such as bond and stock issues. Financing uses(outflows) include decreases in such accounts (i.e., repaying debt or the repurchase ofcommon shares). Dividend payments are a significant financing cash outflow. For many firms,the repurchase of shares has also been a main financing outflow in recent years.
The total cash flows from operating, investing, and financing activities are the net increaseor decrease in the firm’s cash. The statement of cash flows provides cash flow detail that islacking in the balance sheet and income statement.
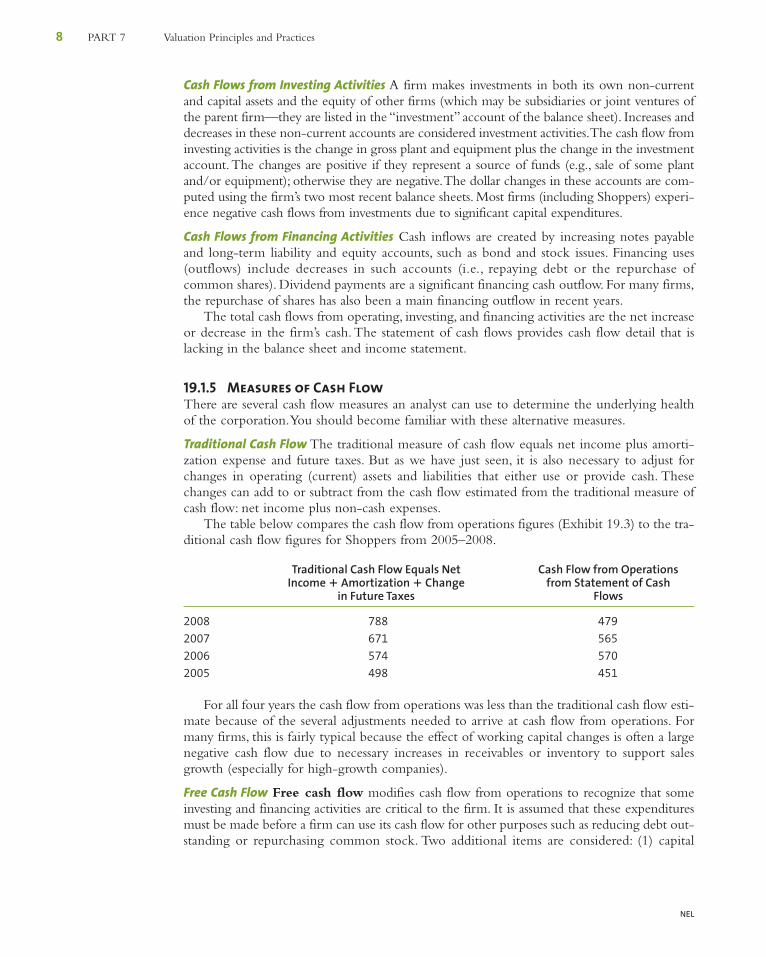
19.1.5 Measures of Cash FlowThere are several cash flow measures an analyst can use to determine the underlying healthof the corporation.You should become familiar with these alternative measures.
Traditional Cash Flow The traditional measure of cash flow equals net income plus amorti-zation expense and future taxes. But as we have just seen, it is also necessary to adjust forchanges in operating (current) assets and liabilities that either use or provide cash. Thesechanges can add to or subtract from the cash flow estimated from the traditional measure ofcash flow: net income plus non-cash expenses.
The table below compares the cash flow from operations figures (Exhibit 19.3) to the tra-ditional cash flow figures for Shoppers from 2005–2008.
Traditional Cash Flow Equals Net Cash Flow from OperationsIncome � Amortization � Change from Statement of Cash
in Future Taxes Flows
2008 788 479
2007 671 565
2006 574 570
2005 498 451
For all four years the cash flow from operations was less than the traditional cash flow esti-mate because of the several adjustments needed to arrive at cash flow from operations. Formany firms, this is fairly typical because the effect of working capital changes is often a largenegative cash flow due to necessary increases in receivables or inventory to support salesgrowth (especially for high-growth companies).
Free Cash Flow Free cash flow modifies cash flow from operations to recognize that someinvesting and financing activities are critical to the firm. It is assumed that these expendituresmust be made before a firm can use its cash flow for other purposes such as reducing debt out-standing or repurchasing common stock. Two additional items are considered: (1) capital
19Ch19.qxd 1/6/10 3:22 PM Page 8
NEL
WEB CHAPTER 19 Analysis of Financial Statements 9
3 As we will show in Web Chapter 20, small modifications of this free cash flow—called free cash flow to equity (FCFE),free cash flow to the firm (FCFF), and net operating profits less applicable taxes (NOPLAT)—are used in valuation modelsand also the economic value added (EVA) model.4 For a detailed discussion of the problems with using EBITDA, see Greenberg (2000).
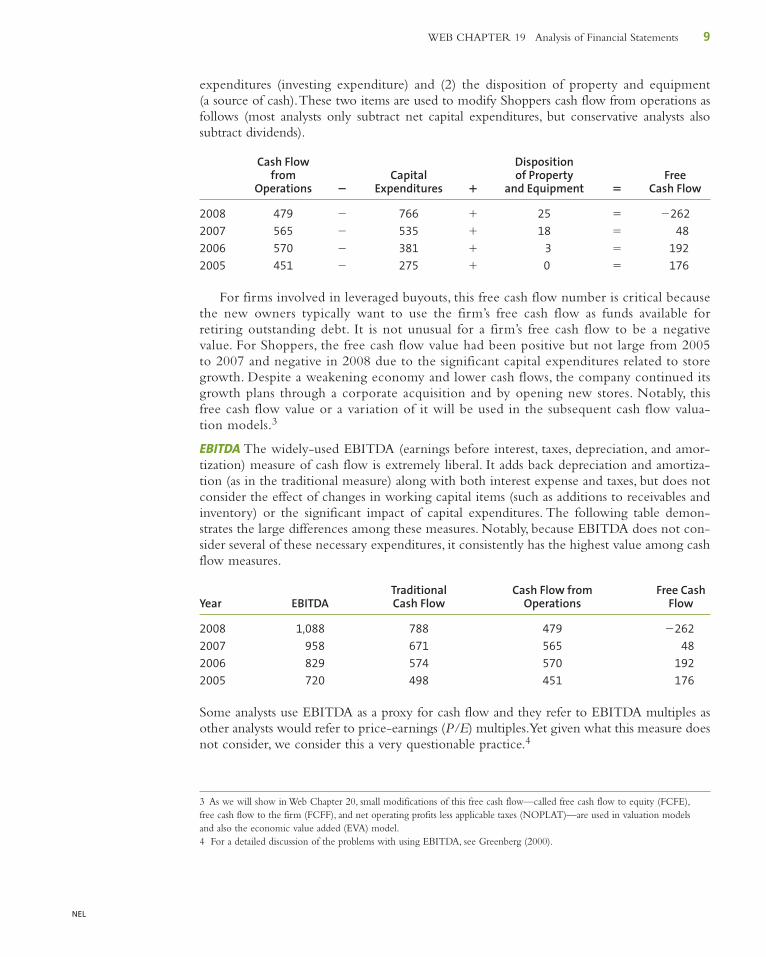
expenditures (investing expenditure) and (2) the disposition of property and equipment(a source of cash).These two items are used to modify Shoppers cash flow from operations asfollows (most analysts only subtract net capital expenditures, but conservative analysts alsosubtract dividends).
Cash Flow Dispositionfrom Capital of Property Free
Operations � Expenditures � and Equipment � Cash Flow
2008 479 � 766 � 25 � �262
2007 565 � 535 � 18 � 48
2006 570 � 381 � 3 � 192
2005 451 � 275 � 0 � 176
For firms involved in leveraged buyouts, this free cash flow number is critical becausethe new owners typically want to use the firm’s free cash flow as funds available forretiring outstanding debt. It is not unusual for a firm’s free cash flow to be a negativevalue. For Shoppers, the free cash flow value had been positive but not large from 2005to 2007 and negative in 2008 due to the significant capital expenditures related to storegrowth. Despite a weakening economy and lower cash flows, the company continued itsgrowth plans through a corporate acquisition and by opening new stores. Notably, thisfree cash flow value or a variation of it will be used in the subsequent cash flow valua-tion models.3
EBITDA The widely-used EBITDA (earnings before interest, taxes, depreciation, and amor-tization) measure of cash flow is extremely liberal. It adds back depreciation and amortiza-tion (as in the traditional measure) along with both interest expense and taxes, but does notconsider the effect of changes in working capital items (such as additions to receivables andinventory) or the significant impact of capital expenditures. The following table demon-strates the large differences among these measures. Notably, because EBITDA does not con-sider several of these necessary expenditures, it consistently has the highest value among cashflow measures.
Traditional Cash Flow from Free Cash Year EBITDA Cash Flow Operations Flow
2008 1,088 788 479 �262
2007 958 671 565 48
2006 829 574 570 192
2005 720 498 451 176
Some analysts use EBITDA as a proxy for cash flow and they refer to EBITDA multiples asother analysts would refer to price-earnings (P/E) multiples.Yet given what this measure doesnot consider, we consider this a very questionable practice.4
19Ch19.qxd 1/6/10 3:22 PM Page 9
NEL
10 PART 7 Valuation Principles and Practices
19.1.6 Purpose of Financial Statement AnalysisFinancial statement analysis seeks to evaluate management performance in several importantareas, including profitability, efficiency, and risk.Although we analyze historical data, the ulti-mate goal is to provide insights that will help us project future management performance,including pro forma balance sheets, income statements, cash flows, and risk. It is the firm’sexpected future performance that determines whether we should lend money to a firm orinvest in it.
19.2 Analysis of Financial Ratios
Just as a single number from a financial statement is of little use, an individual financial ratiohas little value except in relation to comparable ratios for other entities.That is, only relativefinancial ratios are relevant. Therefore, it is important to compare a firm’s performance relative to
• The aggregate economy• Its industry or industries• Its main competitors within the industry• Its past performance (time-series analysis)
The comparison to the aggregate economy is important because almost all firms areinfluenced by economic fluctuations. For example, it is unreasonable to expect a firm’sprofit margins to increase during a recession; a stable margin might be encouraging undersuch conditions. In contrast, a small increase in a firm’s profit margin during a major busi-ness expansion may be a sign of weakness.Thus, this analysis that considers the economicenvironment helps investors understand how a firm reacts to the business cycle and shouldimprove an estimate of the future performance of the firm during subsequent businesscycles.
Probably the most significant comparison relates a firm’s performance to that of itsindustry. Different industries affect the firms within them differently, but this relationship isalways significant.The industry effect is strongest for industries with homogeneous productssuch as steel, rubber, glass, and wood products, because all firms within these industries expe-rience coincidental shifts in demand. In addition, these firms employ fairly similar tech-nology and production processes. As a result, even the best-managed steel firm experiencesa decline in sales and profit margins during a recession. In such a case, the relevant questionis not whether sales and margins declined, but how bad was the decline relative to other steelfirms? In addition, investors should examine an industry’s performance relative to theeconomy to understand how the industry responds to the business cycle, as discussed inChapter 8.
When comparing a firm’s financial ratios to industry ratios, investors may not want to usethe average (mean) industry value when there is wide variation among firms in the industry.Alternatively, if we believe that a firm has a unique component, a cross-sectional analysisin which we compare the firm to a subset of industry firms comparable in size or character-istics, may be appropriate. As an example, we would compare the performance of GeorgeWeston Limited (Loblaws) to that of other national food chains rather than regional foodchains or specialty food chains.
Another practical problem with comparing a firm to its industry is that many largefirms are multi-industry. Inappropriate comparisons can arise when a multi-industryfirm is evaluated against the ratios from a single industry. To mitigate this problem, wecan use a cross-sectional analysis that compares the firm against a rival that operates in
19Ch19.qxd 1/6/10 3:22 PM Page 10
NEL
WEB CHAPTER 19 Analysis of Financial Statements 11
many of the same industries. Alternatively, we can construct composite industry averageratios for the firm.To do this, we use the firm’s annual report to identify each industryin which the firm operates and the proportion of total firm sales and operating earningsderived from each industry. The composite industry ratios would be the weighted-average ratios based on the proportion of firm sales and operating earnings derived fromeach industry.
Finally, time-series analysis, in which we examine a firm’s relative performance overtime to determine whether it is progressing or declining, is helpful when estimating futureperformance. Calculating the five- or ten-year average of a ratio without considering thetime-series trend can result in misleading conclusions. For example, an average return of 10%can be the result of returns that have increased from 5% to 15% over time or the result of aseries that declined from 15% to 5%. Obviously, the difference in the trend for these serieswould have a significant impact on our estimate for the future. Ideally, an analyst shouldexamine a firm’s time series of relative financial ratios compared to its industry and theeconomy.
19.3 Financial Ratios
We divide the ratios into five main categories that underscore the important economic char-acteristics of a firm:
1. Common size statements2. Internal liquidity (solvency)3. Operating performance
a. Operating efficiencyb. Operating profitability
4. Risk analysisa. Business riskb. Financial riskc. External liquidity risk
5. Growth analysis
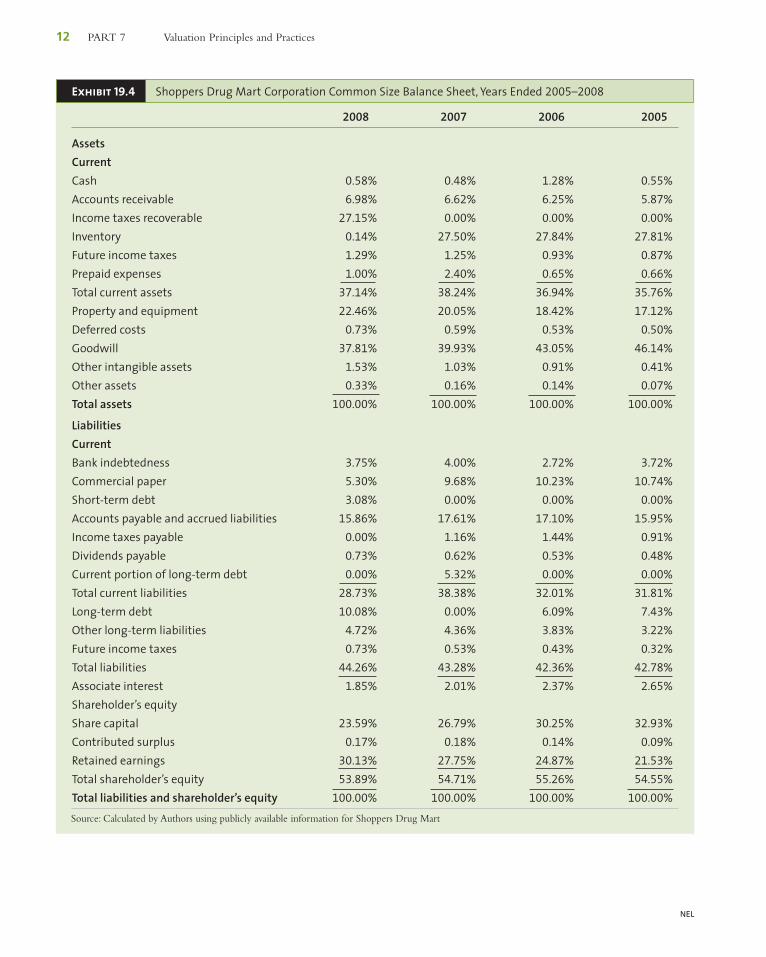
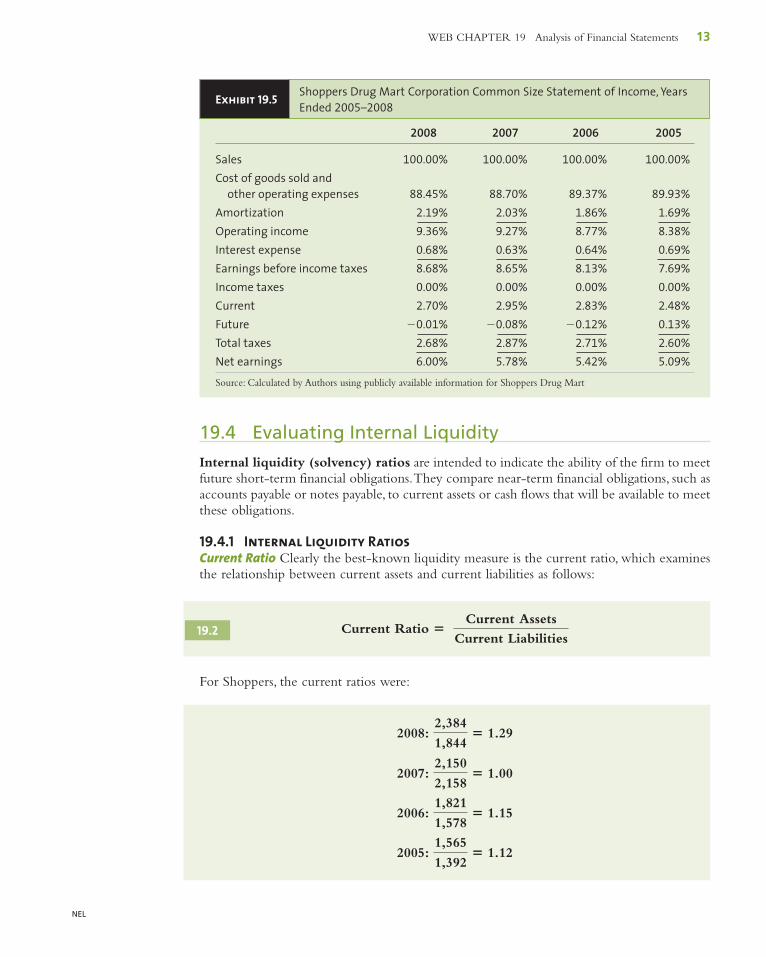
19.3.1 Common Size StatementsThese normalize balance sheet and income statement items to allow easier comparison ofdifferent-sized firms. A common size balance sheet expresses all balance sheet accounts as apercentage of total assets. A common size income statement expresses all income statementitems as a percentage of sales. Exhibit 19.4 is the common size balance sheet for Shoppers,and Exhibit 19.5 contains its common size income statement. Common size ratios areuseful to quickly compare two different-sized firms and to examine trends over timewithin a single firm. Common size statements also give insight into a firm’s financial con-dition, for example, the proportion of liquid assets, the proportion of short-term liabili-ties, or the percentage of sales consumed by production costs or interest expense. In thecase of Shoppers, the common size balance sheet shows a consistent increase in both thepercent of current assets and net property. Alternatively, the common size income state-ment shows that Shoppers’ cost of goods sold and other operating expenses were quitestable from 2003 to 2008 in proportion to sales. As a result of this stability, the firm hasexperienced virtually a constant operating profit margin before and after taxes.The abilityof Shoppers to experience consistent growth in sales (around 9% per year) and a constantprofit margin is impressive.
19Ch19.qxd 1/6/10 3:22 PM Page 11
NEL
12 PART 7 Valuation Principles and Practices
Exhibit 19.4 Shoppers Drug Mart Corporation Common Size Balance Sheet, Years Ended 2005–2008
2008 2007 2006 2005
AssetsCurrentCash 0.58% 0.48% 1.28% 0.55%
Accounts receivable 6.98% 6.62% 6.25% 5.87%
Income taxes recoverable 27.15% 0.00% 0.00% 0.00%
Inventory 0.14% 27.50% 27.84% 27.81%
Future income taxes 1.29% 1.25% 0.93% 0.87%
Prepaid expenses 1.00% 2.40% 0.65% 0.66%
Total current assets 37.14% 38.24% 36.94% 35.76%
Property and equipment 22.46% 20.05% 18.42% 17.12%
Deferred costs 0.73% 0.59% 0.53% 0.50%
Goodwill 37.81% 39.93% 43.05% 46.14%
Other intangible assets 1.53% 1.03% 0.91% 0.41%
Other assets 0.33% 0.16% 0.14% 0.07%
Total assets 100.00% 100.00% 100.00% 100.00%
LiabilitiesCurrentBank indebtedness 3.75% 4.00% 2.72% 3.72%
Commercial paper 5.30% 9.68% 10.23% 10.74%
Short-term debt 3.08% 0.00% 0.00% 0.00%
Accounts payable and accrued liabilities 15.86% 17.61% 17.10% 15.95%
Income taxes payable 0.00% 1.16% 1.44% 0.91%
Dividends payable 0.73% 0.62% 0.53% 0.48%
Current portion of long-term debt 0.00% 5.32% 0.00% 0.00%
Total current liabilities 28.73% 38.38% 32.01% 31.81%
Long-term debt 10.08% 0.00% 6.09% 7.43%
Other long-term liabilities 4.72% 4.36% 3.83% 3.22%
Future income taxes 0.73% 0.53% 0.43% 0.32%
Total liabilities 44.26% 43.28% 42.36% 42.78%
Associate interest 1.85% 2.01% 2.37% 2.65%
Shareholder’s equityShare capital 23.59% 26.79% 30.25% 32.93%
Contributed surplus 0.17% 0.18% 0.14% 0.09%
Retained earnings 30.13% 27.75% 24.87% 21.53%
Total shareholder’s equity 53.89% 54.71% 55.26% 54.55%
Total liabilities and shareholder’s equity 100.00% 100.00% 100.00% 100.00%
Source: Calculated by Authors using publicly available information for Shoppers Drug Mart
19Ch19.qxd 1/6/10 3:22 PM Page 12
NEL
WEB CHAPTER 19 Analysis of Financial Statements 13
19.4 Evaluating Internal Liquidity
Internal liquidity (solvency) ratios are intended to indicate the ability of the firm to meetfuture short-term financial obligations.They compare near-term financial obligations, such asaccounts payable or notes payable, to current assets or cash flows that will be available to meetthese obligations.
19.4.1 Internal Liquidity RatiosCurrent Ratio Clearly the best-known liquidity measure is the current ratio, which examinesthe relationship between current assets and current liabilities as follows:
For Shoppers, the current ratios were:
2005: 1,565
1,392� 1.12
2006: 1,821
1,578� 1.15
2007: 2,150
2,158� 1.00
2008: 2,384
1,844� 1.29
Current Ratio � Current Assets
Current Liabilities19.2
Exhibit 19.5 Shoppers Drug Mart Corporation Common Size Statement of Income, YearsEnded 2005–2008
2008 2007 2006 2005
Sales 100.00% 100.00% 100.00% 100.00%
Cost of goods sold and other operating expenses 88.45% 88.70% 89.37% 89.93%
Amortization 2.19% 2.03% 1.86% 1.69%
Operating income 9.36% 9.27% 8.77% 8.38%
Interest expense 0.68% 0.63% 0.64% 0.69%
Earnings before income taxes 8.68% 8.65% 8.13% 7.69%
Income taxes 0.00% 0.00% 0.00% 0.00%
Current 2.70% 2.95% 2.83% 2.48%
Future �0.01% �0.08% �0.12% 0.13%
Total taxes 2.68% 2.87% 2.71% 2.60%
Net earnings 6.00% 5.78% 5.42% 5.09%
Source: Calculated by Authors using publicly available information for Shoppers Drug Mart
19Ch19.qxd 1/6/10 3:23 PM Page 13
NEL
14 PART 7 Valuation Principles and Practices
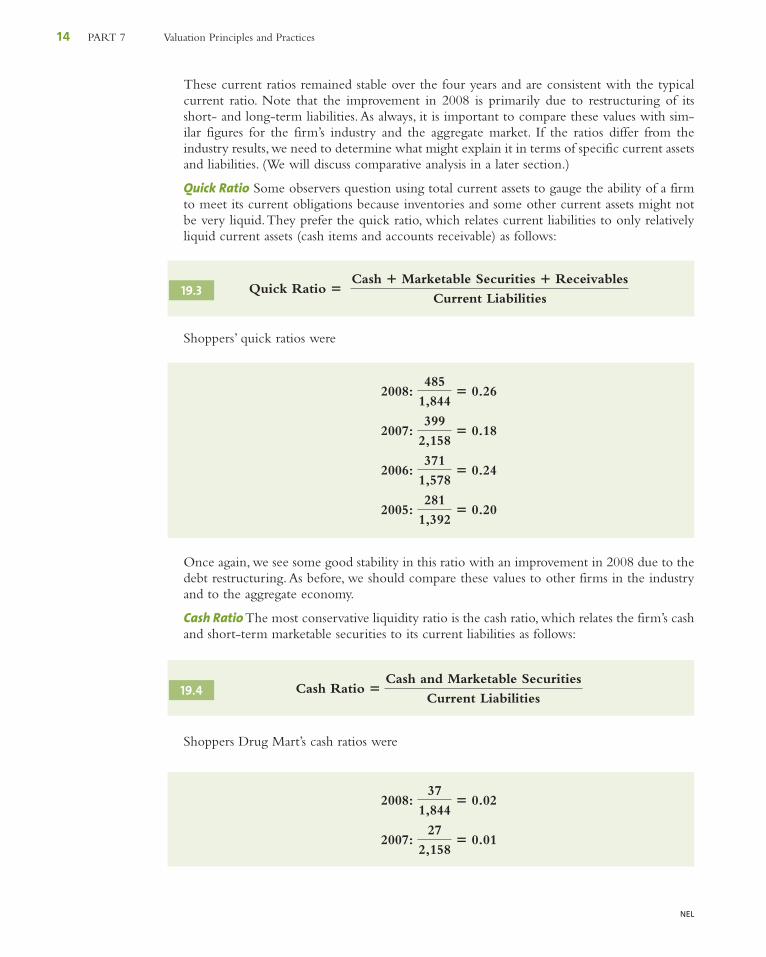
These current ratios remained stable over the four years and are consistent with the typicalcurrent ratio. Note that the improvement in 2008 is primarily due to restructuring of itsshort- and long-term liabilities.As always, it is important to compare these values with sim-ilar figures for the firm’s industry and the aggregate market. If the ratios differ from theindustry results, we need to determine what might explain it in terms of specific current assetsand liabilities. (We will discuss comparative analysis in a later section.)
Quick Ratio Some observers question using total current assets to gauge the ability of a firmto meet its current obligations because inventories and some other current assets might notbe very liquid.They prefer the quick ratio, which relates current liabilities to only relativelyliquid current assets (cash items and accounts receivable) as follows:
Shoppers’ quick ratios were
Once again, we see some good stability in this ratio with an improvement in 2008 due to thedebt restructuring.As before, we should compare these values to other firms in the industryand to the aggregate economy.
Cash Ratio The most conservative liquidity ratio is the cash ratio, which relates the firm’s cashand short-term marketable securities to its current liabilities as follows:
Shoppers Drug Mart’s cash ratios were
2007: 27
2,158� 0.01
2008: 37
1,844� 0.02
Cash Ratio �Cash and Marketable Securities
Current Liabilities19.4
2005: 281
1,392� 0.20
2006: 371
1,578� 0.24
2007: 399
2,158� 0.18
2008: 485
1,844� 0.26
Quick Ratio � Cash � Marketable Securities � Receivables
Current Liabilities19.3
19Ch19.qxd 1/6/10 3:23 PM Page 14
NEL
WEB CHAPTER 19 Analysis of Financial Statements 15
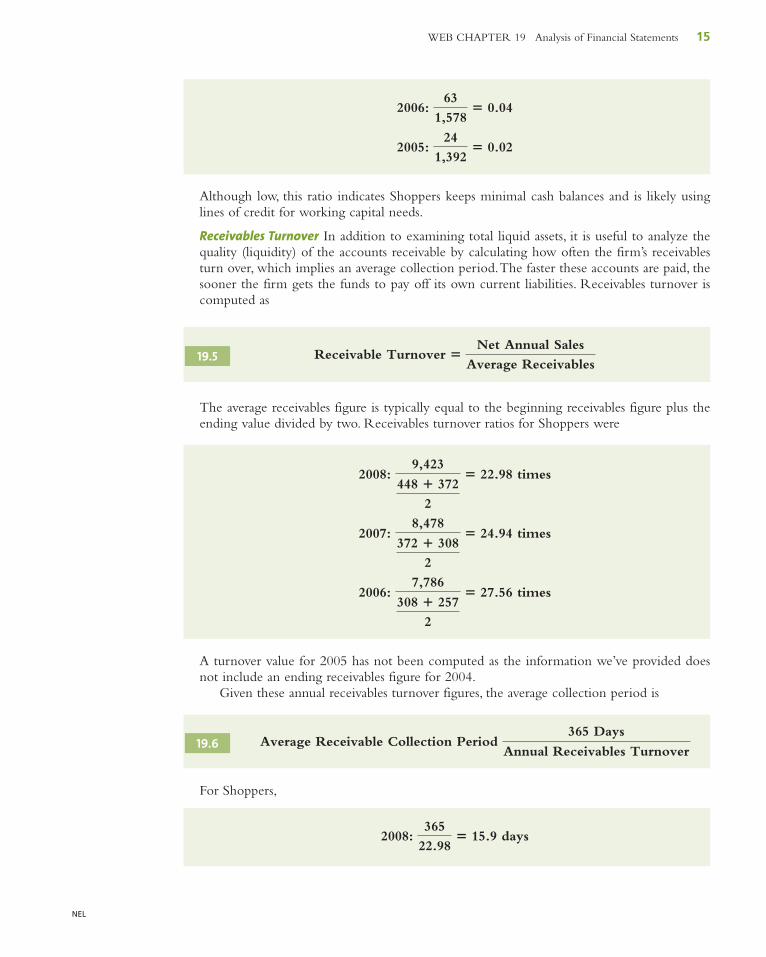
Although low, this ratio indicates Shoppers keeps minimal cash balances and is likely usinglines of credit for working capital needs.
Receivables Turnover In addition to examining total liquid assets, it is useful to analyze thequality (liquidity) of the accounts receivable by calculating how often the firm’s receivablesturn over, which implies an average collection period.The faster these accounts are paid, thesooner the firm gets the funds to pay off its own current liabilities. Receivables turnover iscomputed as
The average receivables figure is typically equal to the beginning receivables figure plus theending value divided by two. Receivables turnover ratios for Shoppers were
A turnover value for 2005 has not been computed as the information we’ve provided doesnot include an ending receivables figure for 2004.
Given these annual receivables turnover figures, the average collection period is
For Shoppers,
2008: 365
22.98� 15.9 days
Average Receivable Collection Period 365 Days
Annual Receivables Turnover19.6
2006: 7,786
308 � 257
2
� 27.56 times
2007: 8,478
372 � 308
2
� 24.94 times
2008: 9,423
448 � 372
2
� 22.98 times
Receivable Turnover �Net Annual Sales
Average Receivables19.5
2005: 24
1,392� 0.02
2006: 63
1,578� 0.04
19Ch19.qxd 1/6/10 3:23 PM Page 15
NEL
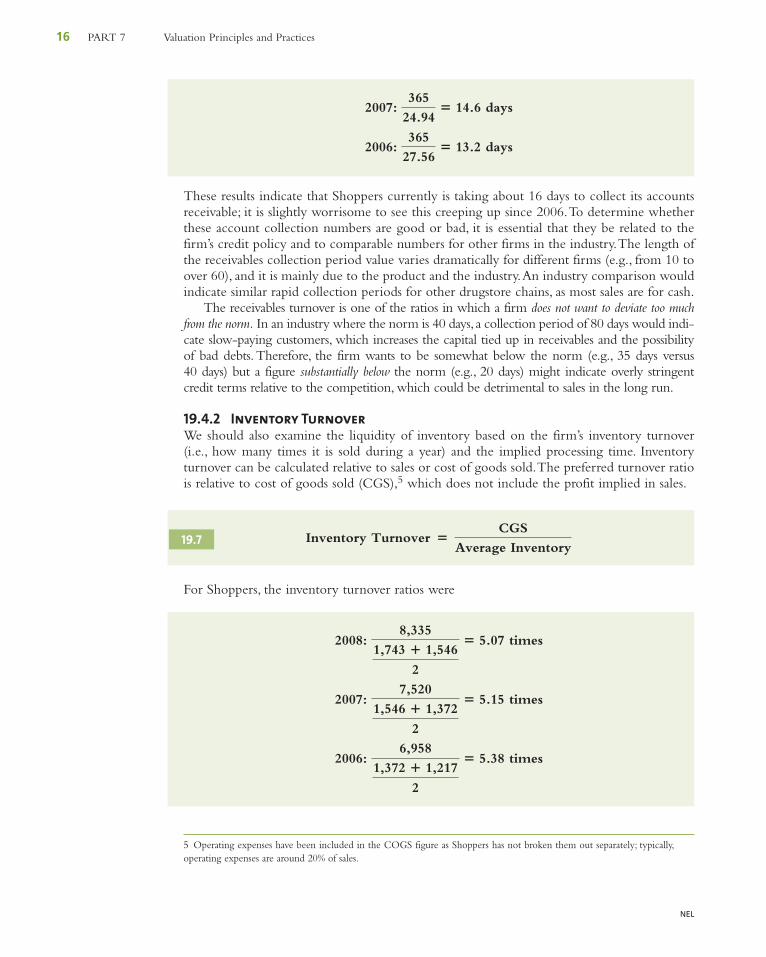
16 PART 7 Valuation Principles and Practices
These results indicate that Shoppers currently is taking about 16 days to collect its accountsreceivable; it is slightly worrisome to see this creeping up since 2006.To determine whetherthese account collection numbers are good or bad, it is essential that they be related to thefirm’s credit policy and to comparable numbers for other firms in the industry.The length ofthe receivables collection period value varies dramatically for different firms (e.g., from 10 toover 60), and it is mainly due to the product and the industry.An industry comparison wouldindicate similar rapid collection periods for other drugstore chains, as most sales are for cash.
The receivables turnover is one of the ratios in which a firm does not want to deviate too muchfrom the norm. In an industry where the norm is 40 days, a collection period of 80 days would indi-cate slow-paying customers, which increases the capital tied up in receivables and the possibilityof bad debts.Therefore, the firm wants to be somewhat below the norm (e.g., 35 days versus40 days) but a figure substantially below the norm (e.g., 20 days) might indicate overly stringentcredit terms relative to the competition, which could be detrimental to sales in the long run.
19.4.2 Inventory TurnoverWe should also examine the liquidity of inventory based on the firm’s inventory turnover(i.e., how many times it is sold during a year) and the implied processing time. Inventoryturnover can be calculated relative to sales or cost of goods sold.The preferred turnover ratiois relative to cost of goods sold (CGS),5 which does not include the profit implied in sales.
For Shoppers, the inventory turnover ratios were
2006: 6,958
1,372 � 1,217
2
� 5.38 times
2007: 7,520
1,546 � 1,372
2
� 5.15 times
2008: 8,335
1,743 � 1,546
2
� 5.07 times
Inventory Turnover � CGS
Average Inventory19.7
2006: 365
27.56� 13.2 days
2007: 365
24.94� 14.6 days
5 Operating expenses have been included in the COGS figure as Shoppers has not broken them out separately; typically,operating expenses are around 20% of sales.
19Ch19.qxd 1/6/10 3:23 PM Page 16
NEL
WEB CHAPTER 19 Analysis of Financial Statements 17
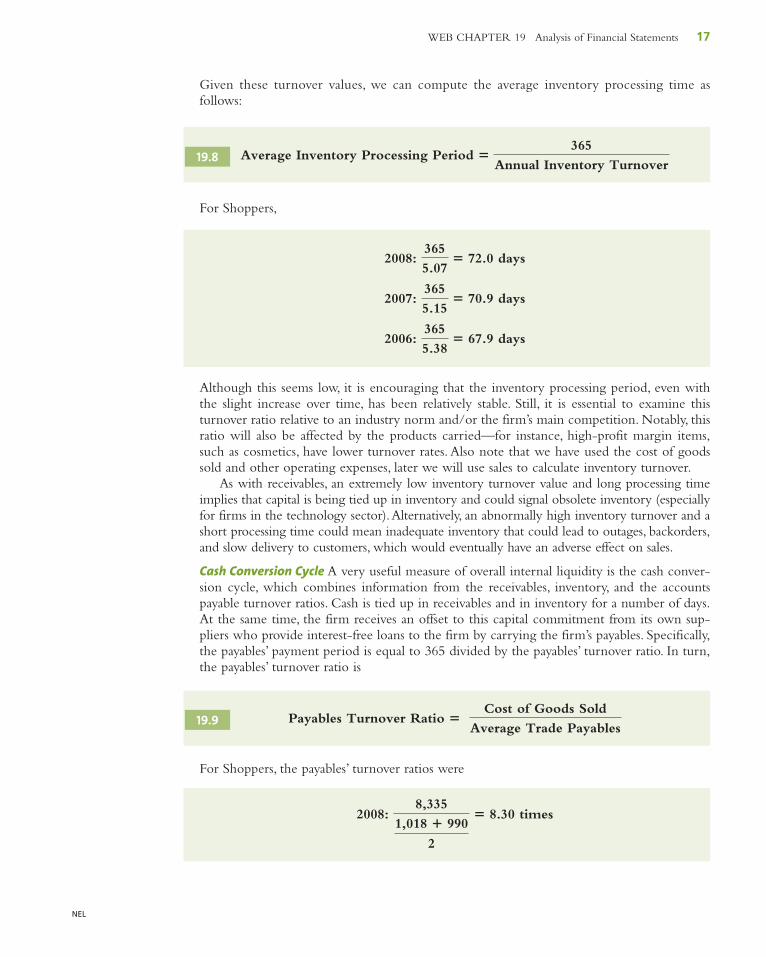
Given these turnover values, we can compute the average inventory processing time asfollows:
For Shoppers,
Although this seems low, it is encouraging that the inventory processing period, even withthe slight increase over time, has been relatively stable. Still, it is essential to examine thisturnover ratio relative to an industry norm and/or the firm’s main competition. Notably, thisratio will also be affected by the products carried—for instance, high-profit margin items,such as cosmetics, have lower turnover rates. Also note that we have used the cost of goodssold and other operating expenses, later we will use sales to calculate inventory turnover.
As with receivables, an extremely low inventory turnover value and long processing timeimplies that capital is being tied up in inventory and could signal obsolete inventory (especiallyfor firms in the technology sector).Alternatively, an abnormally high inventory turnover and ashort processing time could mean inadequate inventory that could lead to outages, backorders,and slow delivery to customers, which would eventually have an adverse effect on sales.
Cash Conversion Cycle A very useful measure of overall internal liquidity is the cash conver-sion cycle, which combines information from the receivables, inventory, and the accountspayable turnover ratios. Cash is tied up in receivables and in inventory for a number of days.At the same time, the firm receives an offset to this capital commitment from its own sup-pliers who provide interest-free loans to the firm by carrying the firm’s payables. Specifically,the payables’ payment period is equal to 365 divided by the payables’ turnover ratio. In turn,the payables’ turnover ratio is
For Shoppers, the payables’ turnover ratios were
2008: 8,335
1,018 � 990
2
� 8.30 times
Payables Turnover Ratio � Cost of Goods Sold
Average Trade Payables19.9
2006: 365
5.38� 67.9 days
2007: 365
5.15� 70.9 days
2008: 365
5.07� 72.0 days
Average Inventory Processing Period �365
Annual Inventory Turnover19.8
19Ch19.qxd 1/6/10 3:23 PM Page 17
NEL
18 PART 7 Valuation Principles and Practices
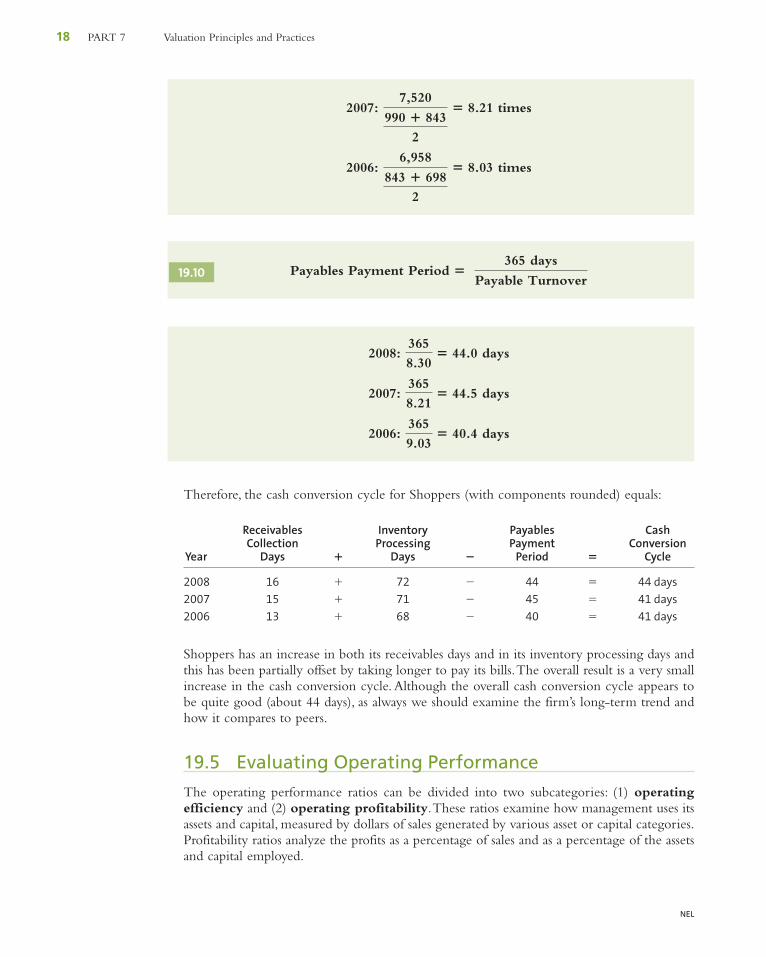
Therefore, the cash conversion cycle for Shoppers (with components rounded) equals:
Receivables Inventory Payables CashCollection Processing Payment Conversion
Year Days � Days � Period � Cycle
2008 16 � 72 � 44 � 44 days2007 15 � 71 � 45 � 41 days2006 13 � 68 � 40 � 41 days
Shoppers has an increase in both its receivables days and in its inventory processing days andthis has been partially offset by taking longer to pay its bills.The overall result is a very smallincrease in the cash conversion cycle. Although the overall cash conversion cycle appears tobe quite good (about 44 days), as always we should examine the firm’s long-term trend andhow it compares to peers.
19.5 Evaluating Operating Performance
The operating performance ratios can be divided into two subcategories: (1) operatingefficiency and (2) operating profitability.These ratios examine how management uses itsassets and capital, measured by dollars of sales generated by various asset or capital categories.Profitability ratios analyze the profits as a percentage of sales and as a percentage of the assetsand capital employed.
2006: 365
9.03� 40.4 days
2007: 365
8.21� 44.5 days
2008: 365
8.30� 44.0 days
Payables Payment Period � 365 days
Payable Turnover19.10
2006: 6,958
843 � 698
2
� 8.03 times
2007: 7,520
990 � 843
2
� 8.21 times
19Ch19.qxd 1/6/10 3:23 PM Page 18
NEL
WEB CHAPTER 19 Analysis of Financial Statements 19
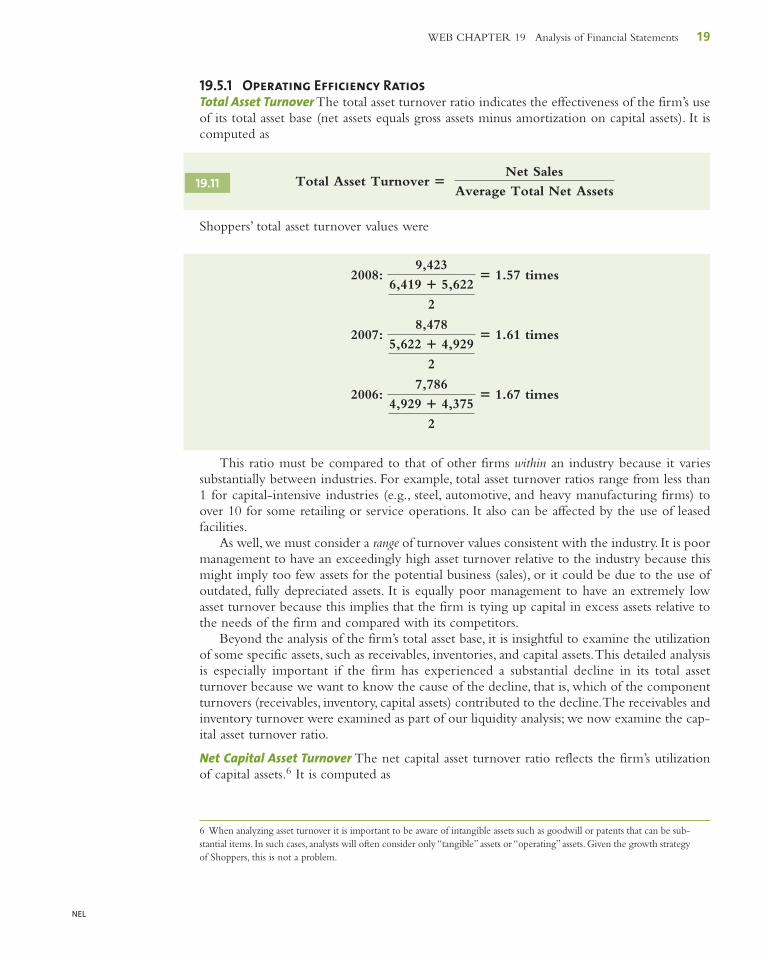
19.5.1 Operating Efficiency RatiosTotal Asset Turnover The total asset turnover ratio indicates the effectiveness of the firm’s useof its total asset base (net assets equals gross assets minus amortization on capital assets). It iscomputed as
Shoppers’ total asset turnover values were
This ratio must be compared to that of other firms within an industry because it variessubstantially between industries. For example, total asset turnover ratios range from less than1 for capital-intensive industries (e.g., steel, automotive, and heavy manufacturing firms) toover 10 for some retailing or service operations. It also can be affected by the use of leasedfacilities.
As well, we must consider a range of turnover values consistent with the industry. It is poormanagement to have an exceedingly high asset turnover relative to the industry because thismight imply too few assets for the potential business (sales), or it could be due to the use ofoutdated, fully depreciated assets. It is equally poor management to have an extremely lowasset turnover because this implies that the firm is tying up capital in excess assets relative tothe needs of the firm and compared with its competitors.
Beyond the analysis of the firm’s total asset base, it is insightful to examine the utilizationof some specific assets, such as receivables, inventories, and capital assets.This detailed analysisis especially important if the firm has experienced a substantial decline in its total assetturnover because we want to know the cause of the decline, that is, which of the componentturnovers (receivables, inventory, capital assets) contributed to the decline.The receivables andinventory turnover were examined as part of our liquidity analysis; we now examine the cap-ital asset turnover ratio.
Net Capital Asset Turnover The net capital asset turnover ratio reflects the firm’s utilizationof capital assets.6 It is computed as
2006: 7,786
4,929 � 4,375
2
� 1.67 times
2007: 8,478
5,622 � 4,929
2
� 1.61 times
2008: 9,423
6,419 � 5,622
2
� 1.57 times
Total Asset Turnover � Net Sales
Average Total Net Assets19.11
6 When analyzing asset turnover it is important to be aware of intangible assets such as goodwill or patents that can be sub-stantial items. In such cases, analysts will often consider only “tangible” assets or “operating” assets. Given the growth strategyof Shoppers, this is not a problem.
19Ch19.qxd 1/6/10 3:23 PM Page 19
NEL
20 PART 7 Valuation Principles and Practices
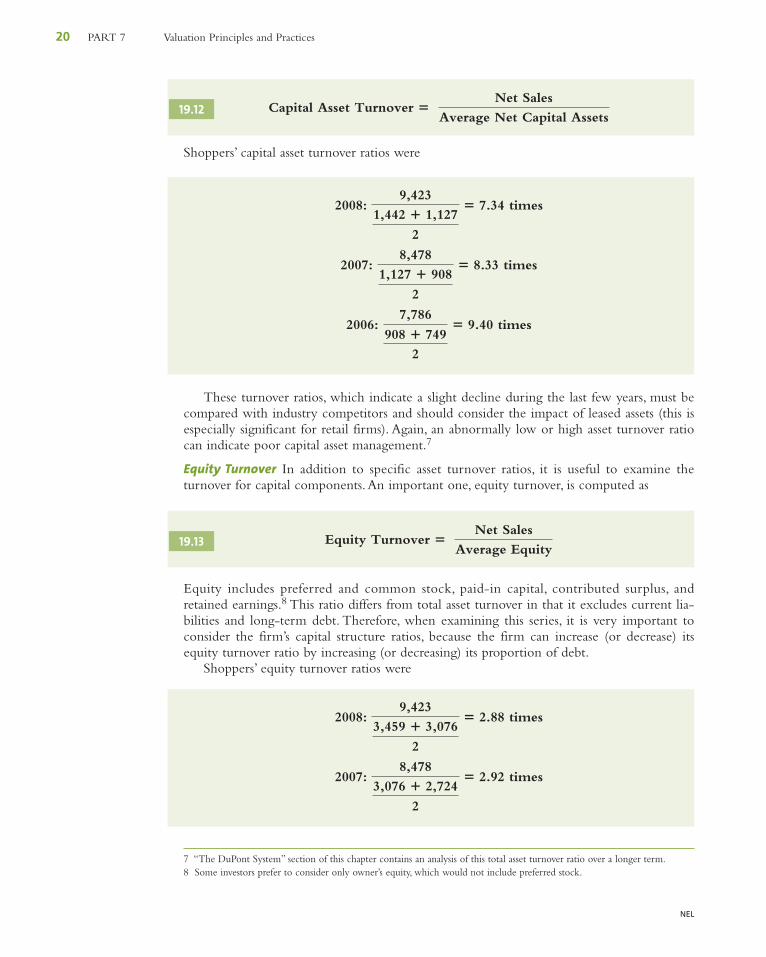
Shoppers’ capital asset turnover ratios were
These turnover ratios, which indicate a slight decline during the last few years, must becompared with industry competitors and should consider the impact of leased assets (this isespecially significant for retail firms). Again, an abnormally low or high asset turnover ratiocan indicate poor capital asset management.7
Equity Turnover In addition to specific asset turnover ratios, it is useful to examine theturnover for capital components.An important one, equity turnover, is computed as
Equity includes preferred and common stock, paid-in capital, contributed surplus, andretained earnings.8 This ratio differs from total asset turnover in that it excludes current lia-bilities and long-term debt. Therefore, when examining this series, it is very important toconsider the firm’s capital structure ratios, because the firm can increase (or decrease) itsequity turnover ratio by increasing (or decreasing) its proportion of debt.
Shoppers’ equity turnover ratios were
2007: 8,478
3,076 � 2,724
2
� 2.92 times
2008: 9,423
3,459 � 3,076
2
� 2.88 times
Equity Turnover � Net Sales
Average Equity19.13
2006: 7,786
908 � 749
2
� 9.40 times
2007: 8,478
1,127 � 908
2
� 8.33 times
2008: 9,423
1,442 � 1,127
2
� 7.34 times
Capital Asset Turnover � Net Sales
Average Net Capital Assets19.12
7 “The DuPont System” section of this chapter contains an analysis of this total asset turnover ratio over a longer term.8 Some investors prefer to consider only owner’s equity, which would not include preferred stock.
19Ch19.qxd 1/6/10 3:23 PM Page 20
NEL
WEB CHAPTER 19 Analysis of Financial Statements 21
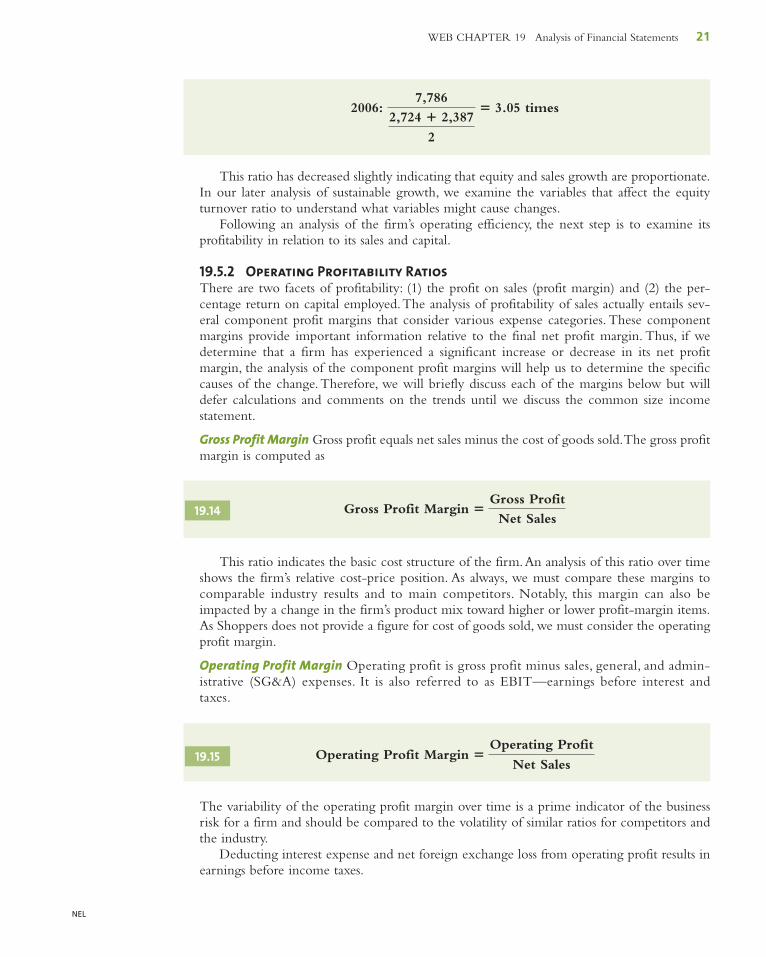
This ratio has decreased slightly indicating that equity and sales growth are proportionate.In our later analysis of sustainable growth, we examine the variables that affect the equityturnover ratio to understand what variables might cause changes.
Following an analysis of the firm’s operating efficiency, the next step is to examine itsprofitability in relation to its sales and capital.
19.5.2 Operating Profitability RatiosThere are two facets of profitability: (1) the profit on sales (profit margin) and (2) the per-centage return on capital employed.The analysis of profitability of sales actually entails sev-eral component profit margins that consider various expense categories. These componentmargins provide important information relative to the final net profit margin. Thus, if wedetermine that a firm has experienced a significant increase or decrease in its net profitmargin, the analysis of the component profit margins will help us to determine the specificcauses of the change.Therefore, we will briefly discuss each of the margins below but willdefer calculations and comments on the trends until we discuss the common size incomestatement.
Gross Profit Margin Gross profit equals net sales minus the cost of goods sold.The gross profitmargin is computed as
This ratio indicates the basic cost structure of the firm.An analysis of this ratio over timeshows the firm’s relative cost-price position. As always, we must compare these margins tocomparable industry results and to main competitors. Notably, this margin can also beimpacted by a change in the firm’s product mix toward higher or lower profit-margin items.As Shoppers does not provide a figure for cost of goods sold, we must consider the operatingprofit margin.
Operating Profit Margin Operating profit is gross profit minus sales, general, and admin-istrative (SG&A) expenses. It is also referred to as EBIT—earnings before interest andtaxes.
The variability of the operating profit margin over time is a prime indicator of the businessrisk for a firm and should be compared to the volatility of similar ratios for competitors andthe industry.
Deducting interest expense and net foreign exchange loss from operating profit results inearnings before income taxes.
Operating Profit Margin �Operating Profit
Net Sales19.15
Gross Profit Margin �Gross Profit
Net Sales19.14
2006: 7,786
2,724 � 2,387
2
� 3.05 times
19Ch19.qxd 1/6/10 3:23 PM Page 21
NEL
22 PART 7 Valuation Principles and Practices
Some investors add back the firm’s amortization expense to operating income (EBIT) tocompute a profit margin (EBITDA) that is then used as a proxy for pretax cash flow, how-ever, as discussed earlier, we consider this to be biased cash flow estimate.
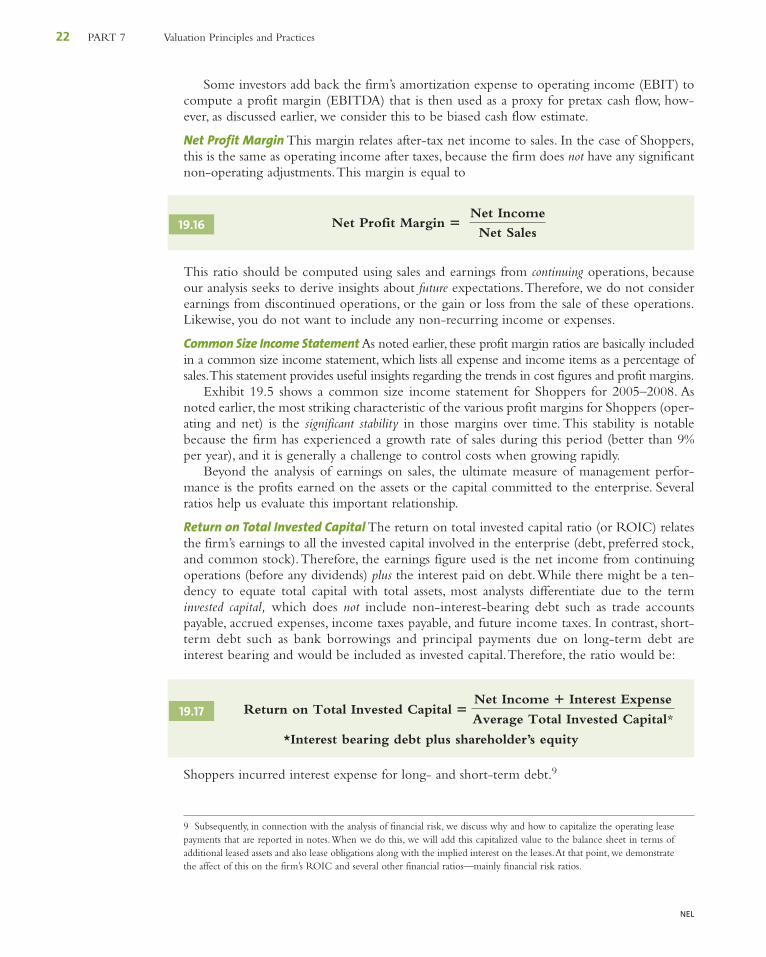
Net Profit Margin This margin relates after-tax net income to sales. In the case of Shoppers,this is the same as operating income after taxes, because the firm does not have any significantnon-operating adjustments.This margin is equal to
This ratio should be computed using sales and earnings from continuing operations, becauseour analysis seeks to derive insights about future expectations.Therefore, we do not considerearnings from discontinued operations, or the gain or loss from the sale of these operations.Likewise, you do not want to include any non-recurring income or expenses.
Common Size Income Statement As noted earlier, these profit margin ratios are basically includedin a common size income statement, which lists all expense and income items as a percentage ofsales.This statement provides useful insights regarding the trends in cost figures and profit margins.
Exhibit 19.5 shows a common size income statement for Shoppers for 2005–2008. Asnoted earlier, the most striking characteristic of the various profit margins for Shoppers (oper-ating and net) is the significant stability in those margins over time. This stability is notablebecause the firm has experienced a growth rate of sales during this period (better than 9%per year), and it is generally a challenge to control costs when growing rapidly.
Beyond the analysis of earnings on sales, the ultimate measure of management perfor-mance is the profits earned on the assets or the capital committed to the enterprise. Severalratios help us evaluate this important relationship.
Return on Total Invested Capital The return on total invested capital ratio (or ROIC) relatesthe firm’s earnings to all the invested capital involved in the enterprise (debt, preferred stock,and common stock).Therefore, the earnings figure used is the net income from continuingoperations (before any dividends) plus the interest paid on debt.While there might be a ten-dency to equate total capital with total assets, most analysts differentiate due to the terminvested capital, which does not include non-interest-bearing debt such as trade accountspayable, accrued expenses, income taxes payable, and future income taxes. In contrast, short-term debt such as bank borrowings and principal payments due on long-term debt areinterest bearing and would be included as invested capital.Therefore, the ratio would be:
*Interest bearing debt plus shareholder’s equity
Shoppers incurred interest expense for long- and short-term debt.9
Return on Total Invested Capital �Net Income � Interest Expense
Average Total Invested Capital*19.17
Net Profit Margin � Net Income
Net Sales19.16
9 Subsequently, in connection with the analysis of financial risk, we discuss why and how to capitalize the operating leasepayments that are reported in notes.When we do this, we will add this capitalized value to the balance sheet in terms ofadditional leased assets and also lease obligations along with the implied interest on the leases.At that point, we demonstratethe affect of this on the firm’s ROIC and several other financial ratios—mainly financial risk ratios.
19Ch19.qxd 1/6/10 3:23 PM Page 22
NEL
WEB CHAPTER 19 Analysis of Financial Statements 23
Shoppers’ returns on total invested capital (ROIC) were
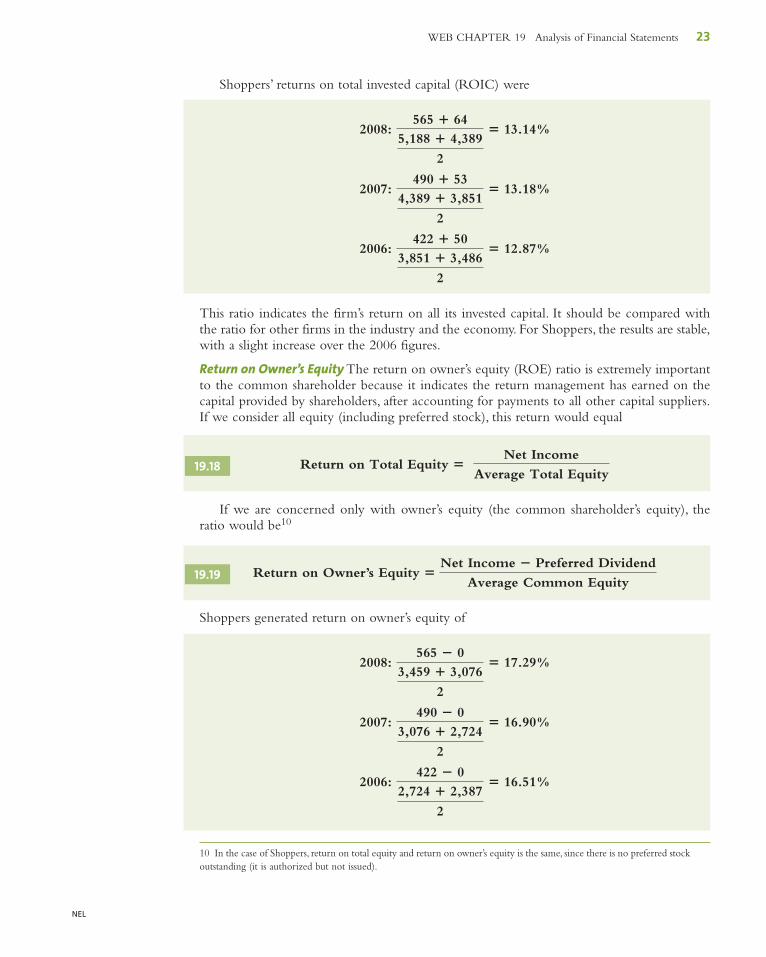
This ratio indicates the firm’s return on all its invested capital. It should be compared withthe ratio for other firms in the industry and the economy. For Shoppers, the results are stable,with a slight increase over the 2006 figures.
Return on Owner’s Equity The return on owner’s equity (ROE) ratio is extremely importantto the common shareholder because it indicates the return management has earned on thecapital provided by shareholders, after accounting for payments to all other capital suppliers.If we consider all equity (including preferred stock), this return would equal
If we are concerned only with owner’s equity (the common shareholder’s equity), theratio would be10
Return on Owner’s Equity
Shoppers generated return on owner’s equity of
2006: 422 � 0
2,724 � 2,387
2
� 16.51%
2007: 490 � 0
3,076 � 2,724
2
� 16.90%
2008: 565 � 0
3,459 � 3,076
2
� 17.29%
�Net Income � Preferred Dividend
Average Common Equity19.19
Return on Total Equity � Net Income
Average Total Equity19.18
2006: 422 � 50
3,851 � 3,486
2
� 12.87%
2007: 490 � 53
4,389 � 3,851
2
� 13.18%
2008: 565 � 64
5,188 � 4,389
2
� 13.14%
10 In the case of Shoppers, return on total equity and return on owner’s equity is the same, since there is no preferred stockoutstanding (it is authorized but not issued).
19Ch19.qxd 1/6/10 3:23 PM Page 23
NEL
24 PART 7 Valuation Principles and Practices
This ratio should be consistent with the firm’s overall business risk, and it should reflectthe financial risk assumed by the common shareholder because of the prior claims of thefirm’s bondholders.
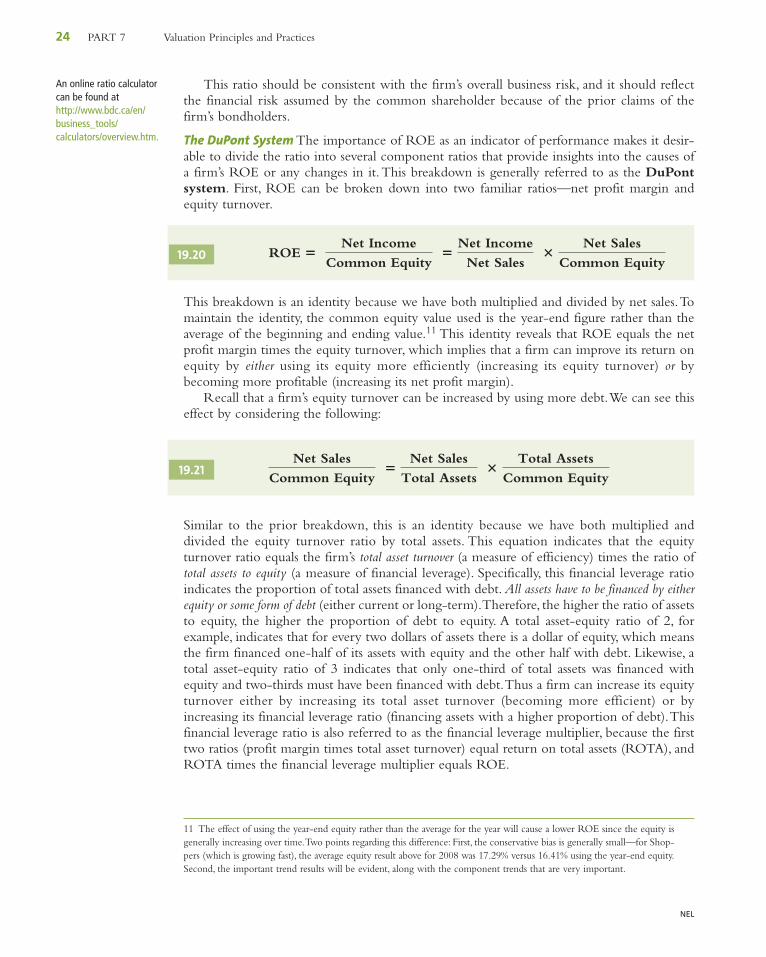
The DuPont System The importance of ROE as an indicator of performance makes it desir-able to divide the ratio into several component ratios that provide insights into the causes ofa firm’s ROE or any changes in it.This breakdown is generally referred to as the DuPontsystem. First, ROE can be broken down into two familiar ratios—net profit margin andequity turnover.
This breakdown is an identity because we have both multiplied and divided by net sales.Tomaintain the identity, the common equity value used is the year-end figure rather than theaverage of the beginning and ending value.11 This identity reveals that ROE equals the netprofit margin times the equity turnover, which implies that a firm can improve its return onequity by either using its equity more efficiently (increasing its equity turnover) or bybecoming more profitable (increasing its net profit margin).
Recall that a firm’s equity turnover can be increased by using more debt.We can see thiseffect by considering the following:
Similar to the prior breakdown, this is an identity because we have both multiplied anddivided the equity turnover ratio by total assets. This equation indicates that the equityturnover ratio equals the firm’s total asset turnover (a measure of efficiency) times the ratio oftotal assets to equity (a measure of financial leverage). Specifically, this financial leverage ratioindicates the proportion of total assets financed with debt. All assets have to be financed by eitherequity or some form of debt (either current or long-term).Therefore, the higher the ratio of assetsto equity, the higher the proportion of debt to equity. A total asset-equity ratio of 2, forexample, indicates that for every two dollars of assets there is a dollar of equity, which meansthe firm financed one-half of its assets with equity and the other half with debt. Likewise, atotal asset-equity ratio of 3 indicates that only one-third of total assets was financed withequity and two-thirds must have been financed with debt.Thus a firm can increase its equityturnover either by increasing its total asset turnover (becoming more efficient) or byincreasing its financial leverage ratio (financing assets with a higher proportion of debt).Thisfinancial leverage ratio is also referred to as the financial leverage multiplier, because the firsttwo ratios (profit margin times total asset turnover) equal return on total assets (ROTA), andROTA times the financial leverage multiplier equals ROE.
Net Sales
Common Equity �
Net Sales
Total Assets �
Total Assets
Common Equity19.21
ROE � Net Income
Common Equity �
Net Income
Net Sales �
Net Sales
Common Equity19.20
An online ratio calculatorcan be found athttp://www.bdc.ca/en/business_tools/calculators/overview.htm.
11 The effect of using the year-end equity rather than the average for the year will cause a lower ROE since the equity isgenerally increasing over time.Two points regarding this difference: First, the conservative bias is generally small—for Shop-pers (which is growing fast), the average equity result above for 2008 was 17.29% versus 16.41% using the year-end equity.Second, the important trend results will be evident, along with the component trends that are very important.
19Ch19.qxd 1/6/10 3:23 PM Page 24
NEL
WEB CHAPTER 19 Analysis of Financial Statements 25
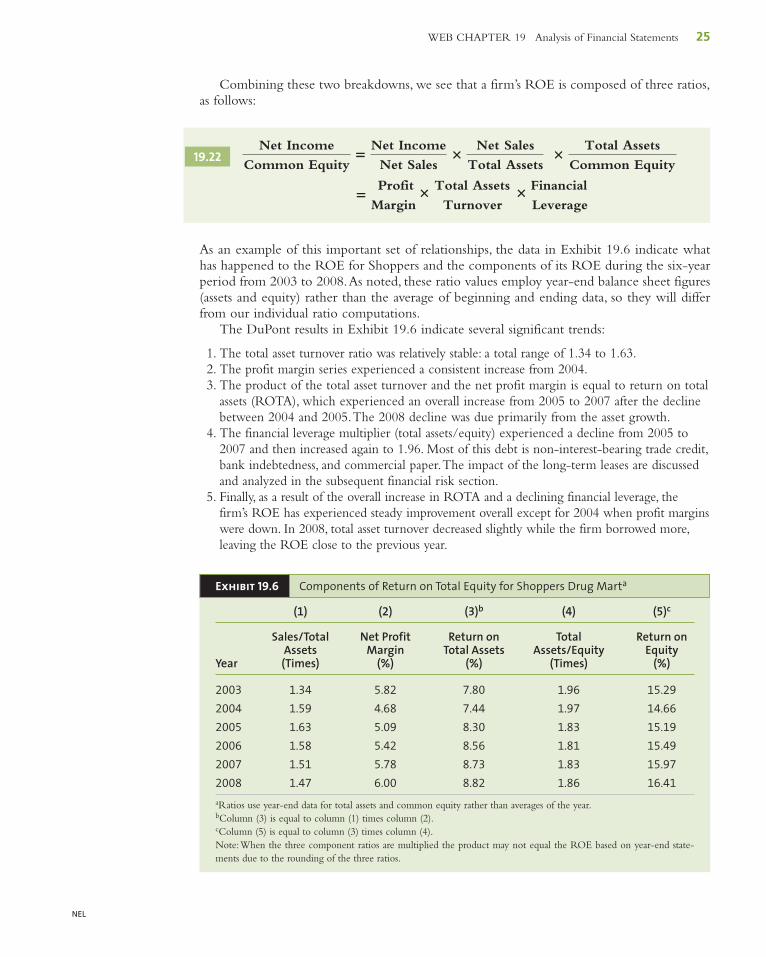
Combining these two breakdowns, we see that a firm’s ROE is composed of three ratios,as follows:
As an example of this important set of relationships, the data in Exhibit 19.6 indicate whathas happened to the ROE for Shoppers and the components of its ROE during the six-yearperiod from 2003 to 2008.As noted, these ratio values employ year-end balance sheet figures(assets and equity) rather than the average of beginning and ending data, so they will differfrom our individual ratio computations.
The DuPont results in Exhibit 19.6 indicate several significant trends:
1. The total asset turnover ratio was relatively stable: a total range of 1.34 to 1.63.2. The profit margin series experienced a consistent increase from 2004.3. The product of the total asset turnover and the net profit margin is equal to return on total
assets (ROTA), which experienced an overall increase from 2005 to 2007 after the declinebetween 2004 and 2005.The 2008 decline was due primarily from the asset growth.
4. The financial leverage multiplier (total assets/equity) experienced a decline from 2005 to2007 and then increased again to 1.96. Most of this debt is non-interest-bearing trade credit,bank indebtedness, and commercial paper.The impact of the long-term leases are discussedand analyzed in the subsequent financial risk section.
5. Finally, as a result of the overall increase in ROTA and a declining financial leverage, thefirm’s ROE has experienced steady improvement overall except for 2004 when profit marginswere down. In 2008, total asset turnover decreased slightly while the firm borrowed more,leaving the ROE close to the previous year.
�Profit
�Total Assets
� Financial
Margin Turnover Leverage
Net Income
Common Equity�
Net Income
Net Sales�
Net Sales
Total Assets �
Total Assets
Common Equity19.22
Exhibit 19.6 Components of Return on Total Equity for Shoppers Drug Marta
(1) (2) (3)b (4) (5)c
Sales/Total Net Profit Return on Total Return onAssets Margin Total Assets Assets/Equity Equity
Year (Times) (%) (%) (Times) (%)
2003 1.34 5.82 7.80 1.96 15.29
2004 1.59 4.68 7.44 1.97 14.66
2005 1.63 5.09 8.30 1.83 15.19
2006 1.58 5.42 8.56 1.81 15.49
2007 1.51 5.78 8.73 1.83 15.97
2008 1.47 6.00 8.82 1.86 16.41
aRatios use year-end data for total assets and common equity rather than averages of the year.bColumn (3) is equal to column (1) times column (2).cColumn (5) is equal to column (3) times column (4).Note:When the three component ratios are multiplied the product may not equal the ROE based on year-end state-ments due to the rounding of the three ratios.
19Ch19.qxd 1/6/10 3:23 PM Page 25
NEL
26 PART 7 Valuation Principles and Practices
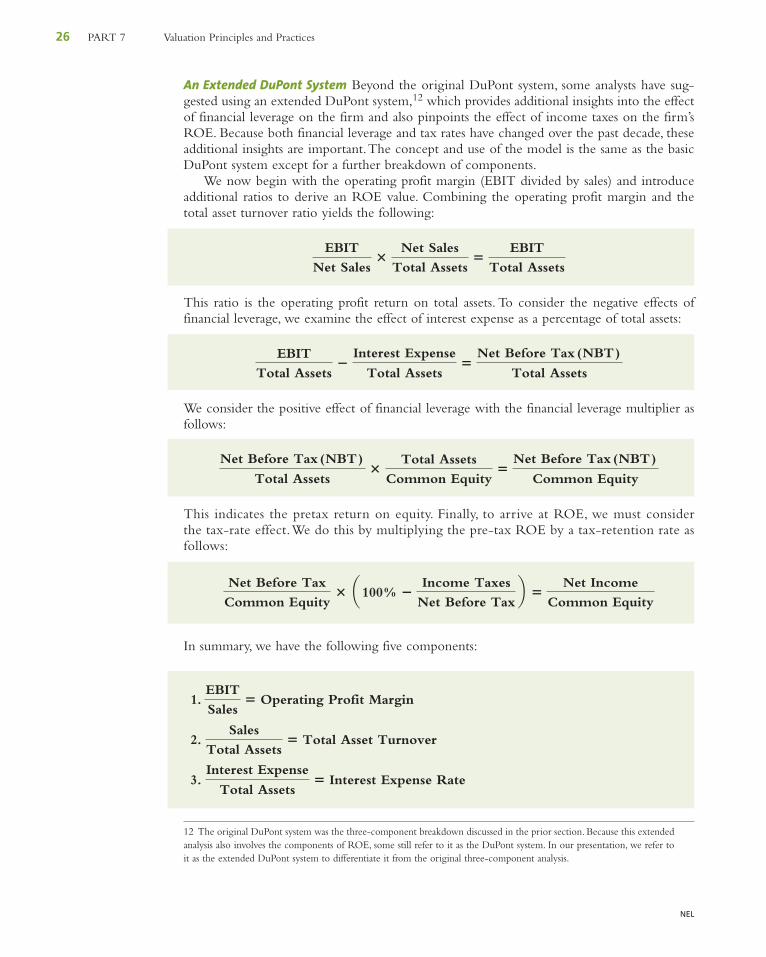
An Extended DuPont System Beyond the original DuPont system, some analysts have sug-gested using an extended DuPont system,12 which provides additional insights into the effectof financial leverage on the firm and also pinpoints the effect of income taxes on the firm’sROE. Because both financial leverage and tax rates have changed over the past decade, theseadditional insights are important.The concept and use of the model is the same as the basicDuPont system except for a further breakdown of components.
We now begin with the operating profit margin (EBIT divided by sales) and introduceadditional ratios to derive an ROE value. Combining the operating profit margin and thetotal asset turnover ratio yields the following:
This ratio is the operating profit return on total assets. To consider the negative effects offinancial leverage, we examine the effect of interest expense as a percentage of total assets:
We consider the positive effect of financial leverage with the financial leverage multiplier asfollows:
This indicates the pretax return on equity. Finally, to arrive at ROE, we must considerthe tax-rate effect.We do this by multiplying the pre-tax ROE by a tax-retention rate asfollows:
In summary, we have the following five components:
1.
2.
3.Interest Expense
Total Assets� Interest Expense Rate
Sales
Total Assets� Total Asset Turnover
EBIT
Sales� Operating Profit Margin
Net Before Tax
Common Equity� a100% �
Income Taxes
Net Before Taxb �
Net Income
Common Equity
Net Before Tax (NBT)
Total Assets�
Total Assets
Common Equity�
Net Before Tax (NBT)
Common Equity
EBIT
Total Assets�
Interest Expense
Total Assets�
Net Before Tax (NBT)
Total Assets
EBIT
Net Sales�
Net Sales
Total Assets�
EBIT
Total Assets
12 The original DuPont system was the three-component breakdown discussed in the prior section. Because this extendedanalysis also involves the components of ROE, some still refer to it as the DuPont system. In our presentation, we refer toit as the extended DuPont system to differentiate it from the original three-component analysis.
19Ch19.qxd 1/6/10 3:23 PM Page 26
NEL
WEB CHAPTER 19 Analysis of Financial Statements 27
4.
5.
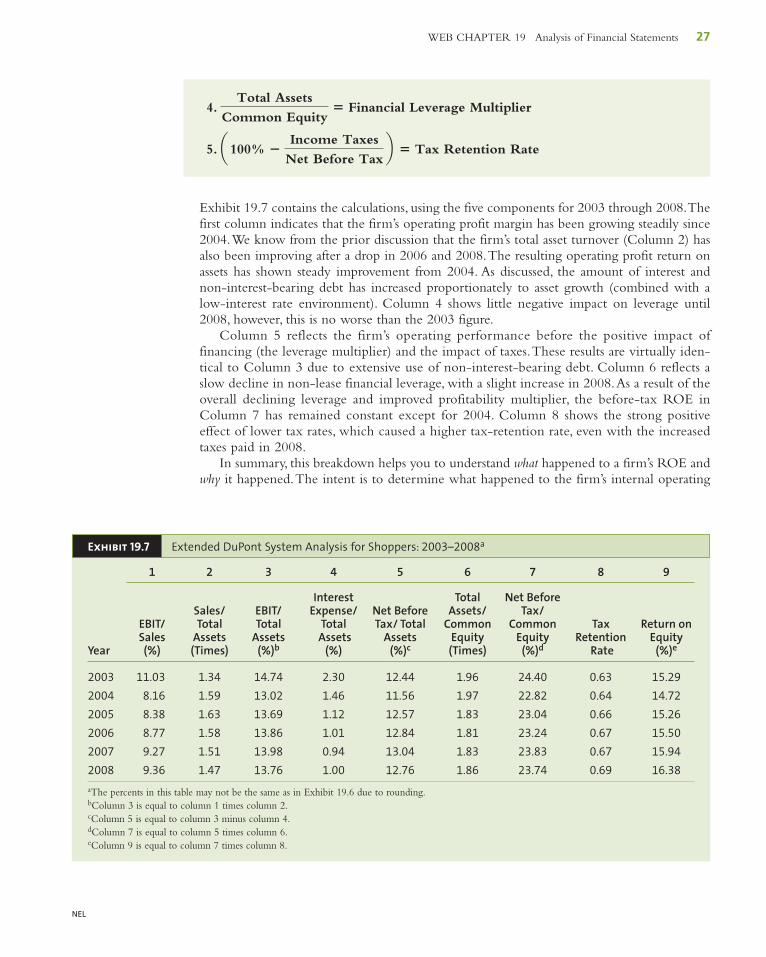
Exhibit 19.7 contains the calculations, using the five components for 2003 through 2008.Thefirst column indicates that the firm’s operating profit margin has been growing steadily since2004.We know from the prior discussion that the firm’s total asset turnover (Column 2) hasalso been improving after a drop in 2006 and 2008.The resulting operating profit return onassets has shown steady improvement from 2004. As discussed, the amount of interest andnon-interest-bearing debt has increased proportionately to asset growth (combined with alow-interest rate environment). Column 4 shows little negative impact on leverage until2008, however, this is no worse than the 2003 figure.
Column 5 reflects the firm’s operating performance before the positive impact offinancing (the leverage multiplier) and the impact of taxes.These results are virtually iden-tical to Column 3 due to extensive use of non-interest-bearing debt. Column 6 reflects aslow decline in non-lease financial leverage, with a slight increase in 2008.As a result of theoverall declining leverage and improved profitability multiplier, the before-tax ROE inColumn 7 has remained constant except for 2004. Column 8 shows the strong positiveeffect of lower tax rates, which caused a higher tax-retention rate, even with the increasedtaxes paid in 2008.
In summary, this breakdown helps you to understand what happened to a firm’s ROE andwhy it happened.The intent is to determine what happened to the firm’s internal operating
a100% �Income Taxes
Net Before Taxb � Tax Retention Rate
Total Assets
Common Equity� Financial Leverage Multiplier
Exhibit 19.7 Extended DuPont System Analysis for Shoppers: 2003–2008a
1 2 3 4 5 6 7 8 9
Interest Total Net BeforeSales/ EBIT/ Expense/ Net Before Assets/ Tax/
EBIT/ Total Total Total Tax/ Total Common Common Tax Return onSales Assets Assets Assets Assets Equity Equity Retention Equity
Year (%) (Times) (%)b (%) (%)c (Times) (%)d Rate (%)e
2003 11.03 1.34 14.74 2.30 12.44 1.96 24.40 0.63 15.29
2004 8.16 1.59 13.02 1.46 11.56 1.97 22.82 0.64 14.72
2005 8.38 1.63 13.69 1.12 12.57 1.83 23.04 0.66 15.26
2006 8.77 1.58 13.86 1.01 12.84 1.81 23.24 0.67 15.50
2007 9.27 1.51 13.98 0.94 13.04 1.83 23.83 0.67 15.94
2008 9.36 1.47 13.76 1.00 12.76 1.86 23.74 0.69 16.38
aThe percents in this table may not be the same as in Exhibit 19.6 due to rounding.bColumn 3 is equal to column 1 times column 2.cColumn 5 is equal to column 3 minus column 4.dColumn 7 is equal to column 5 times column 6.eColumn 9 is equal to column 7 times column 8.
19Ch19.qxd 1/6/10 3:23 PM Page 27
NEL
28 PART 7 Valuation Principles and Practices
results, what has been the negative and positive effect of its financial leverage policy, and whatwas the effect of external government tax policy.Although the two breakdowns should pro-vide the same ending value, they typically differ by small amounts because of the rounding ofcomponents.
19.6 Risk Analysis
Risk analysis examines the uncertainty of income flows for the total firm and for the indi-vidual sources of capital (i.e., debt, preferred stock, and common stock).The typical approachexamines the main factors that cause a firm’s income flows to vary. More volatile incomeflows mean greater risk (uncertainty) facing the investor.
The total risk of the firm has two internal components: business risk and financial risk.We first discuss the concept of business risk: how to measure it, what causes it, and how tomeasure its individual causes.Then we consider financial risk and the several ratios by whichwe measure it. Following this analysis of a firm’s internal risk factors, we discuss an importantexternal risk factor, external liquidity risk—that is, the ability to buy or sell the firm’s stockin the secondary equity market.
19.6.1 Business RiskRecall that business risk is the uncertainty of operating income caused by the firm’sindustry. In turn, this uncertainty is due to the firm’s variability of operating earnings causedby its products, customers, and the way it produces its products. Specifically, a firm’s operatingearnings vary due to two factors: (1) the volatility of the firm’s sales over time, and (2) howthe firm produces its products in terms of its mix of fixed and variable costs—that is, its oper-ating leverage. For example, the earnings for a steel firm will probably vary more than thoseof a grocery chain because (1) over the business cycle, steel sales are more volatile than gro-cery sales; and (2) the steel firm’s large fixed production costs (high operating leverage) makeits earnings vary more than its sales.
Business risk is generally measured by the variability of the firm’s operating income over timedetermined by the standard deviation of the historical operating earnings series.You will recallfrom Chapter 1 that the standard deviation is influenced by the size of the numbers, so investorsstandardize this measure of volatility by dividing it by the mean value for the series (i.e., the averageoperating earnings).The resulting ratio of the standard deviation of operating earnings divided bythe average operating earnings is the coefficient of variation (CV) of operating earnings:
The CV of operating earnings allows comparisons between standardized measures of businessrisk for firms of different sizes.To compute the CV of operating earnings, you need a min-imum of 5 years up to about 10 years. Less than 5 years is not very meaningful, and data more
�Ba
n
i�1
aOEi � OE—– b 2�n
an
i�1
OEi�n
�Standard Deviation of Operating Earnings (OE)
Mean Operating Earnings
Business Risk � f (Coefficient of Variation of Operating Earnings)
19Ch19.qxd 1/6/10 3:23 PM Page 28
NEL
WEB CHAPTER 19 Analysis of Financial Statements 29
than 10 years old are typically out of date. Besides measuring overall business risk, it is veryinsightful to examine the two factors that contribute to the variability of operating earnings:sales variability and operating leverage.
Sales Variability Sales variability is the prime determinant of operating earnings variability.In turn, the variability of sales is affected by a firm’s industry and is largely outside of man-agement control. For example, in a cyclical industry such as automobiles or steel, sales will bequite volatile over the business cycle compared to those in a non-cyclical industry, such asretail food or hospital supplies. Like operating earnings, the variability of a firm’s sales is typ-ically measured by the CV of sales during the most recent 5 to 10 years.
Adjusting Volatility Measures for Growth Besides normalizing the standard deviation ofEBIT and sales for size by computing the CV, it is also important to recognize that the stan-dard deviation is measured relative to the mean value for the series or deviations from“expected value.” A problem arises for firms that experience significant growth even if it isconstant as there will be very large deviations from the mean for the series.To avoid this biaswe measure deviations from the growth path of the series.
Operating Leverage The variability of a firm’s operating earnings also depends on its mixtureof production costs.Total production costs of a firm with no fixed production costs would varydirectly with sales, and operating profits would be a constant proportion of sales. In such anexample, the firm’s operating profit margin would be constant and its operating profits wouldhave the same relative volatility as its sales. Realistically, firms always have some fixed produc-tion costs such as buildings, machinery, or relatively permanent personnel. Fixed productioncosts cause operating profits to vary more than sales over the business cycle. Specifically, duringslow periods, operating profits will decline by a larger percentage than sales, while during aneconomic expansion, operating profits will increase by a larger percentage than sales.
The use of fixed production costs is referred to as operating leverage. Clearly, greateroperating leverage (caused by a higher proportion of fixed production costs) makes the oper-ating earnings series more volatile relative to the sales series.This basic relationship betweenoperating profit and sales leads us to measure operating leverage as the average of the annualpercentage change in operating earnings relative to the percentage change in sales during aspecified period as follows:
We take the absolute value of the percentage changes because the two series can move inopposite directions.The direction of the change is not important, but the relative size of the
Operating Leverage �a
n
i�1
`%¢OE
%¢S`
n
�Ba
n
i�1
aSi � S b 2�n
an
i�1
Si�n
Sales Volatility � f (Coefficient of Variation of Sales)
19Ch19.qxd 1/6/10 3:23 PM Page 29
NEL
30 PART 7 Valuation Principles and Practices
change is relevant. By implication, the more volatile the operating earnings as compared tothe volatility of sales, the greater the firm’s operating leverage.
19.6.2 Financial RiskFinancial risk, you will recall, is the additional uncertainty of returns to equity holders dueto a firm’s use of fixed financial obligation securities.This financial uncertainty is in additionto the firm’s business risk.When a firm issues bonds, the interest payments are fixed contrac-tual obligations.As with operating leverage, during an economic expansion, the net earningsavailable for common stock after the fixed interest payments will experience a larger per-centage increase than operating earnings. In contrast, during a business decline, the earningsavailable to shareholders will decline by a larger percentage than operating earnings becauseof these fixed financial costs (i.e., interest payments). Remember, as a firm increases its rela-tive debt financing with fixed contractual obligations, it increases its financial risk and the pos-sibility of default and bankruptcy.
Relationship between Business Risk and Financial Risk Remember that the acceptable level offinancial risk for a firm depends on its business risk. If the firm has low business risk (i.e., stableoperating earnings), investors are willing to accept higher financial risk. For example, retailfood companies typically have stable operating earnings over time, which implies low busi-ness risk and means that investors and bond-rating firms will allow the firms to have higherfinancial risk. In contrast, if a firm is in an industry that is subject to high business risk (i.e.,it experiences high sales volatility and it has high operating leverage), such as steel, automo-bile, and airline companies, an investor would not want these firms to also have high finan-cial risk. The two risks would compound and the probability of bankruptcy would besubstantial.13
In our analysis, we employ three sets of financial ratios to measure financial risk, and allthree sets should be considered. First, there are balance sheet ratios that compare the propor-tion of capital derived from debt and equity sources. Second are ratios that compare the earn-ings or cash flows available to the required fixed financial charges. Third are ratios thatconsider the cash flows available and relate these cash flows to the book value of the out-standing debt. Before we discuss and demonstrate these financial risk ratios, it is necessary toconsider the topic of operating lease obligations.
Consideration of Lease Obligations Many firms lease buildings and equipment rather thanborrow the funds and purchase the assets.The accounting for the lease obligation depends onthe type of lease. For a capital lease, the value of the asset and the lease obligation is includedon the balance sheet as an asset and liability. If it is an operating lease, it is recorded in the notesand perhaps the Management, Discussion and Analysis (M, D & A) but is not specificallyincluded on the balance sheet.14 Because operating leases are a form of financing used exten-sively by retailers (such as Shoppers, Sears, and Danier) and airlines, it is necessary to recog-nize this obligation, capitalize estimated future lease payments, and include this capitalizedlease value on the balance sheet as both an asset and a long-term liability. In the followingsubsection, we discuss how to do this, and demonstrate the significant impact this adjustmentcan have on several financial risk ratios.
13 Support for this specific relationship is found in a set of tables (see Standard & Poor’s, 2008, p. 21) that suggest specificrequired financial risk ratios necessary for a firm to be considered for a specific bond rating.The required ratios differ onthe basis of the perceived business risk of the firm.14 A discussion of the technical factors that will cause a lease to be capital versus operating is beyond the scope of thisbook, but it is covered in most intermediate accounting texts.
19Ch19.qxd 1/6/10 3:23 PM Page 30
NEL
WEB CHAPTER 19 Analysis of Financial Statements 31
15 These minimum lease payments have been assumed to occur annually although the annual report provides only bi-annual lease obligations.16 Notably, the “8 times” estimate almost always provides the lowest estimate of debt value, which means that this generalrule will tend to underestimate the financial leverage for these firms and the resulting implied interest expense.
Capitalizing Operating Leases Capitalizing leases basically involves an estimate of the presentvalue of a firm’s future required lease payments.Therefore, an analyst must estimate both anappropriate discount rate (typically the firm’s long-term debt rate) and the firm’s future leasepayment obligations.
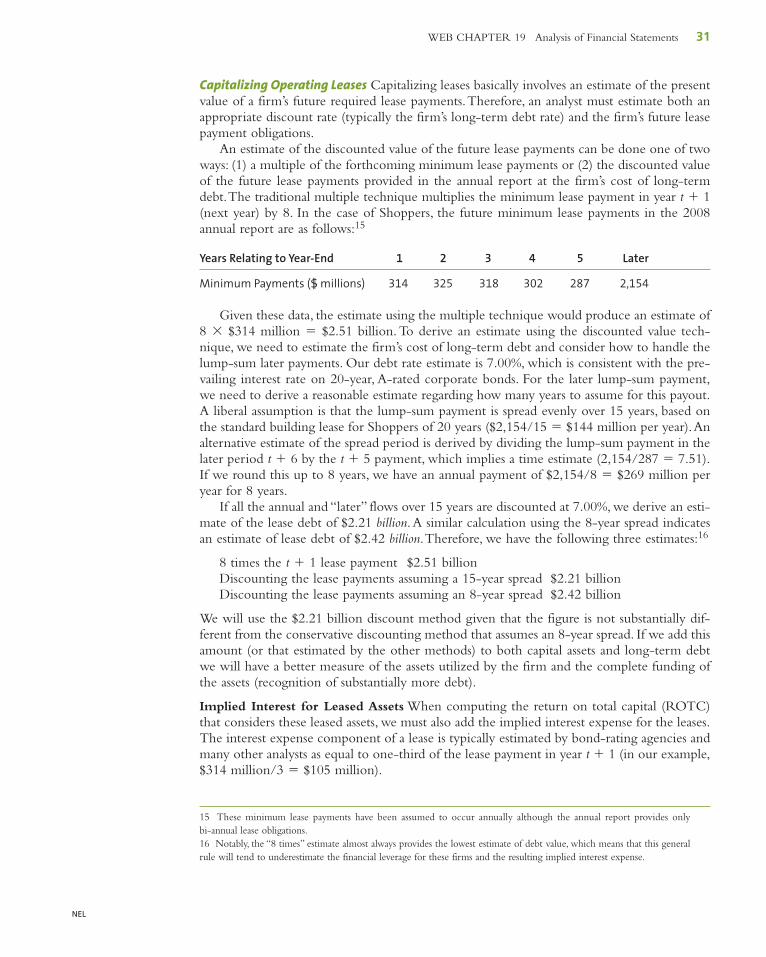
An estimate of the discounted value of the future lease payments can be done one of twoways: (1) a multiple of the forthcoming minimum lease payments or (2) the discounted valueof the future lease payments provided in the annual report at the firm’s cost of long-termdebt.The traditional multiple technique multiplies the minimum lease payment in year t � 1(next year) by 8. In the case of Shoppers, the future minimum lease payments in the 2008annual report are as follows:15
Years Relating to Year-End 1 2 3 4 5 Later
Minimum Payments ($ millions) 314 325 318 302 287 2,154
Given these data, the estimate using the multiple technique would produce an estimate of8 � $314 million � $2.51 billion. To derive an estimate using the discounted value tech-nique, we need to estimate the firm’s cost of long-term debt and consider how to handle thelump-sum later payments. Our debt rate estimate is 7.00%, which is consistent with the pre-vailing interest rate on 20-year, A-rated corporate bonds. For the later lump-sum payment,we need to derive a reasonable estimate regarding how many years to assume for this payout.A liberal assumption is that the lump-sum payment is spread evenly over 15 years, based onthe standard building lease for Shoppers of 20 years ($2,154/15 � $144 million per year).Analternative estimate of the spread period is derived by dividing the lump-sum payment in thelater period t � 6 by the t � 5 payment, which implies a time estimate (2,154/287 � 7.51).If we round this up to 8 years, we have an annual payment of $2,154/8 � $269 million peryear for 8 years.
If all the annual and “later” flows over 15 years are discounted at 7.00%, we derive an esti-mate of the lease debt of $2.21 billion.A similar calculation using the 8-year spread indicatesan estimate of lease debt of $2.42 billion.Therefore, we have the following three estimates:16
8 times the t � 1 lease payment $2.51 billionDiscounting the lease payments assuming a 15-year spread $2.21 billionDiscounting the lease payments assuming an 8-year spread $2.42 billion
We will use the $2.21 billion discount method given that the figure is not substantially dif-ferent from the conservative discounting method that assumes an 8-year spread. If we add thisamount (or that estimated by the other methods) to both capital assets and long-term debtwe will have a better measure of the assets utilized by the firm and the complete funding ofthe assets (recognition of substantially more debt).
Implied Interest for Leased Assets When computing the return on total capital (ROTC)that considers these leased assets, we must also add the implied interest expense for the leases.The interest expense component of a lease is typically estimated by bond-rating agencies andmany other analysts as equal to one-third of the lease payment in year t � 1 (in our example,$314 million/3 � $105 million).
19Ch19.qxd 1/6/10 3:23 PM Page 31
NEL
32 PART 7 Valuation Principles and Practices
An alternative to this general rule would be to derive a specific estimate based on an esti-mate of the firm’s cost of debt (7%) and the estimate of the present value (PV) of the leaseobligation, as follows:
PV of Lease Obligation Interest Expense at 7% Estimating Technique ($ billion) ($ million)
8 times estimate of t � 1 payment 2.51 176
PV with 15-year spread 2.21 155
PV with 8-year spread 2.42 169
Notably, all of these estimates of the implied interest expense are substantially higher than theone-third general rule estimate of $105 million. Again, the general rule underestimates thefinancial leverage related to these lease obligations.
To calculate the ROTC for 2007 and 2008, we need to compute the value of the lease obli-gations and the implied interest expense for the three years (2006, 2007, and 2008) as follows:
Estimate of PV of Estimate of InterestYear Lease Obligation ($ billion) Component of Leasea ($ million)
2008 2.21 155
2007 1.91 134
2006 1.57 110
aEqual to 0.07 of the PV of lease obligation.
Adding these values to the prior ROIC ratio (see Equation 19.17) results in the followinglease-adjusted return on total invested capital (ROIC) values:
As shown, the ROICs that include the leased assets and lease debt are lower (around 11.5%versus 13%), but they are still quite reasonable.
Implied Amortization on Leased Assets Another factor is the implied amortizationexpense that would be taken if these were not leased assets. One way to calculate this valueis to simply use the typical term of the lease or weighted-average term. In the case of Shop-pers, this is reasonably clear because almost all leases are 20-year leases on buildings. However,if the value were not clear, a second alternative would be the average percent of amortizationas a percent of beginning-of-year net capital assets. In our example, for 2008 this would be
at end of 2007: $1,127 million
Amortization (2008)$206 million; net capital assets
2007: 490 � 53 � 1346,299 � 5,421
2
� 11.55%
2008: 565 � 64 � 1557,398 � 6,299
2
� 11.45%
19Ch19.qxd 1/6/10 3:23 PM Page 32
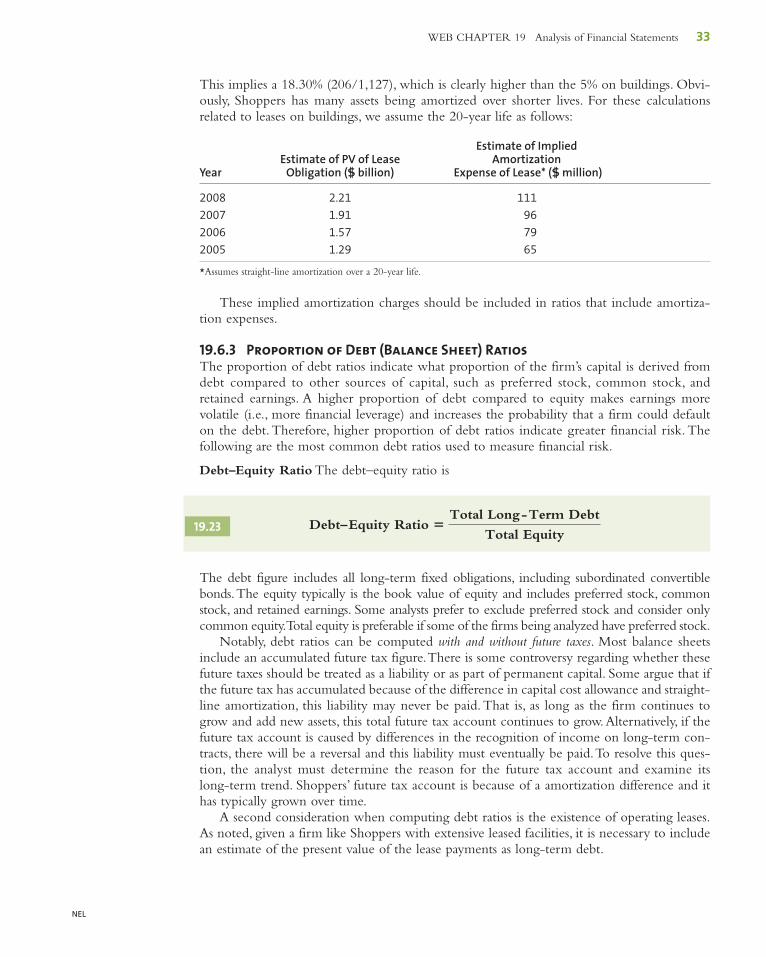
NEL
WEB CHAPTER 19 Analysis of Financial Statements 33
This implies a 18.30% (206/1,127), which is clearly higher than the 5% on buildings. Obvi-ously, Shoppers has many assets being amortized over shorter lives. For these calculationsrelated to leases on buildings, we assume the 20-year life as follows:
Estimate of ImpliedEstimate of PV of Lease Amortization
Year Obligation ($ billion) Expense of Lease* ($ million)
2008 2.21 111
2007 1.91 96
2006 1.57 79
2005 1.29 65
*Assumes straight-line amortization over a 20-year life.
These implied amortization charges should be included in ratios that include amortiza-tion expenses.
19.6.3 Proportion of Debt (Balance Sheet) RatiosThe proportion of debt ratios indicate what proportion of the firm’s capital is derived fromdebt compared to other sources of capital, such as preferred stock, common stock, andretained earnings. A higher proportion of debt compared to equity makes earnings morevolatile (i.e., more financial leverage) and increases the probability that a firm could defaulton the debt. Therefore, higher proportion of debt ratios indicate greater financial risk. Thefollowing are the most common debt ratios used to measure financial risk.
Debt–Equity Ratio The debt–equity ratio is
The debt figure includes all long-term fixed obligations, including subordinated convertiblebonds.The equity typically is the book value of equity and includes preferred stock, commonstock, and retained earnings. Some analysts prefer to exclude preferred stock and consider onlycommon equity.Total equity is preferable if some of the firms being analyzed have preferred stock.
Notably, debt ratios can be computed with and without future taxes. Most balance sheetsinclude an accumulated future tax figure.There is some controversy regarding whether thesefuture taxes should be treated as a liability or as part of permanent capital. Some argue that ifthe future tax has accumulated because of the difference in capital cost allowance and straight-line amortization, this liability may never be paid. That is, as long as the firm continues togrow and add new assets, this total future tax account continues to grow.Alternatively, if thefuture tax account is caused by differences in the recognition of income on long-term con-tracts, there will be a reversal and this liability must eventually be paid.To resolve this ques-tion, the analyst must determine the reason for the future tax account and examine itslong-term trend. Shoppers’ future tax account is because of a amortization difference and ithas typically grown over time.
A second consideration when computing debt ratios is the existence of operating leases.As noted, given a firm like Shoppers with extensive leased facilities, it is necessary to includean estimate of the present value of the lease payments as long-term debt.
Debt–Equity Ratio �Total Long-Term Debt
Total Equity19.23
19Ch19.qxd 1/6/10 3:23 PM Page 33
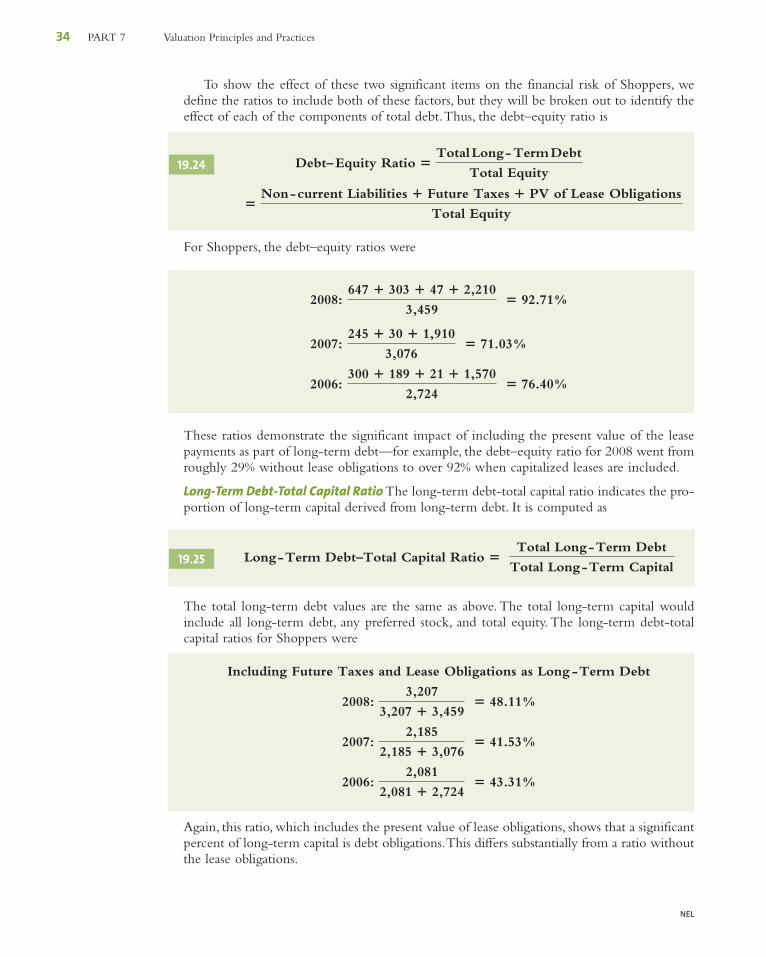
NEL
34 PART 7 Valuation Principles and Practices
To show the effect of these two significant items on the financial risk of Shoppers, wedefine the ratios to include both of these factors, but they will be broken out to identify theeffect of each of the components of total debt.Thus, the debt–equity ratio is
For Shoppers, the debt–equity ratios were
These ratios demonstrate the significant impact of including the present value of the leasepayments as part of long-term debt—for example, the debt–equity ratio for 2008 went fromroughly 29% without lease obligations to over 92% when capitalized leases are included.
Long-Term Debt-Total Capital Ratio The long-term debt-total capital ratio indicates the pro-portion of long-term capital derived from long-term debt. It is computed as
The total long-term debt values are the same as above. The total long-term capital wouldinclude all long-term debt, any preferred stock, and total equity. The long-term debt-totalcapital ratios for Shoppers were
Again, this ratio, which includes the present value of lease obligations, shows that a significantpercent of long-term capital is debt obligations.This differs substantially from a ratio withoutthe lease obligations.
2006: 2,081
2,081 � 2,724 � 43.31%
2007: 2,185
2,185 � 3,076 � 41.53%
2008: 3,207
3,207 � 3,459 � 48.11%
Including Future Taxes and Lease Obligations as Long -Term Debt
Long-Term Debt–Total Capital Ratio � Total Long-Term Debt
Total Long-Term Capital19.25
2006: 300 � 189 � 21 � 1,570
2,724 � 76.40%
2007: 245 � 30 � 1,910
3,076 � 71.03%
2008: 647 � 303 � 47 � 2,210
3,459 � 92.71%
�Non-current Liabilities � Future Taxes � PV of Lease Obligations
Total Equity
Debt–Equity Ratio �Total Long-Term Debt
Total Equity19.24
19Ch19.qxd 1/6/10 3:23 PM Page 34
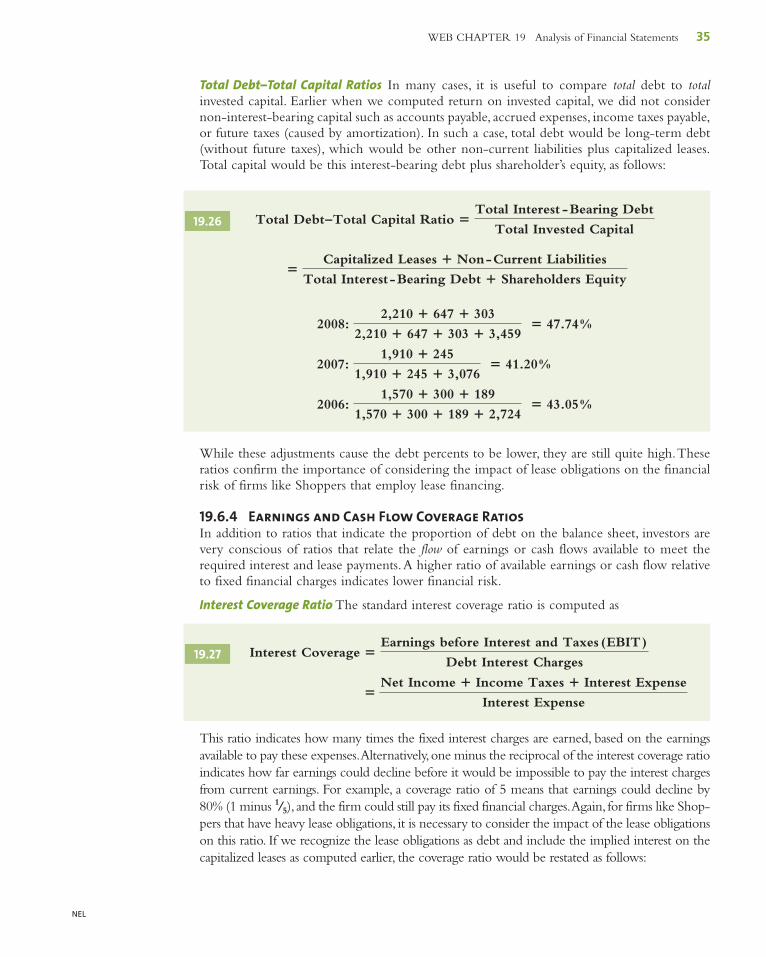
NEL
WEB CHAPTER 19 Analysis of Financial Statements 35
Total Debt–Total Capital Ratios In many cases, it is useful to compare total debt to totalinvested capital. Earlier when we computed return on invested capital, we did not considernon-interest-bearing capital such as accounts payable, accrued expenses, income taxes payable,or future taxes (caused by amortization). In such a case, total debt would be long-term debt(without future taxes), which would be other non-current liabilities plus capitalized leases.Total capital would be this interest-bearing debt plus shareholder’s equity, as follows:
While these adjustments cause the debt percents to be lower, they are still quite high.Theseratios confirm the importance of considering the impact of lease obligations on the financialrisk of firms like Shoppers that employ lease financing.
19.6.4 Earnings and Cash Flow Coverage RatiosIn addition to ratios that indicate the proportion of debt on the balance sheet, investors arevery conscious of ratios that relate the flow of earnings or cash flows available to meet therequired interest and lease payments.A higher ratio of available earnings or cash flow relativeto fixed financial charges indicates lower financial risk.
Interest Coverage Ratio The standard interest coverage ratio is computed as
This ratio indicates how many times the fixed interest charges are earned, based on the earningsavailable to pay these expenses.Alternatively,one minus the reciprocal of the interest coverage ratioindicates how far earnings could decline before it would be impossible to pay the interest chargesfrom current earnings. For example, a coverage ratio of 5 means that earnings could decline by80% (1 minus ), and the firm could still pay its fixed financial charges.Again, for firms like Shop-pers that have heavy lease obligations, it is necessary to consider the impact of the lease obligationson this ratio. If we recognize the lease obligations as debt and include the implied interest on thecapitalized leases as computed earlier, the coverage ratio would be restated as follows:
1/5
�Net Income � Income Taxes � Interest Expense
Interest Expense
Interest Coverage �Earnings before Interest and Taxes (EBIT)
Debt Interest Charges19.27
2006: 1,570 � 300 � 189
1,570 � 300 � 189 � 2,724 � 43.05%
2007: 1,910 � 245
1,910 � 245 � 3,076 � 41.20%
2008: 2,210 � 647 � 303
2,210 � 647 � 303 � 3,459 � 47.74%
�Capitalized Leases � Non-Current Liabilities
Total Interest-Bearing Debt � Shareholders Equity
Total Debt–Total Capital Ratio �Total Interest -Bearing Debt
Total Invested Capital19.26
19Ch19.qxd 1/6/10 3:23 PM Page 35
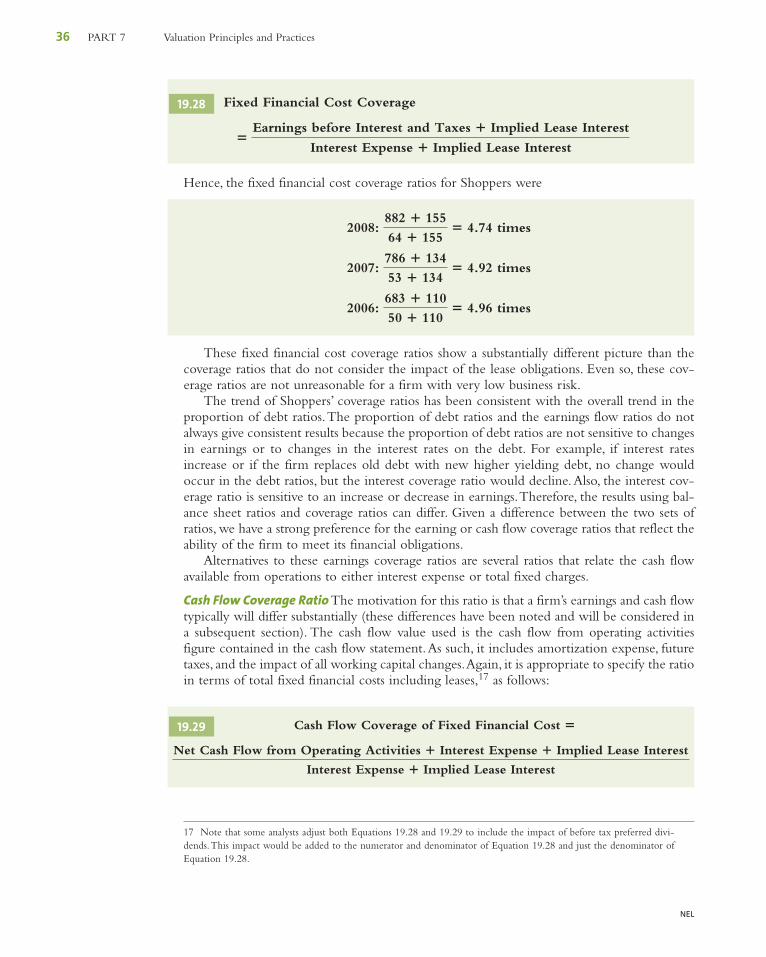
NEL
36 PART 7 Valuation Principles and Practices
Hence, the fixed financial cost coverage ratios for Shoppers were
These fixed financial cost coverage ratios show a substantially different picture than thecoverage ratios that do not consider the impact of the lease obligations. Even so, these cov-erage ratios are not unreasonable for a firm with very low business risk.
The trend of Shoppers’ coverage ratios has been consistent with the overall trend in theproportion of debt ratios.The proportion of debt ratios and the earnings flow ratios do notalways give consistent results because the proportion of debt ratios are not sensitive to changesin earnings or to changes in the interest rates on the debt. For example, if interest ratesincrease or if the firm replaces old debt with new higher yielding debt, no change wouldoccur in the debt ratios, but the interest coverage ratio would decline.Also, the interest cov-erage ratio is sensitive to an increase or decrease in earnings.Therefore, the results using bal-ance sheet ratios and coverage ratios can differ. Given a difference between the two sets ofratios, we have a strong preference for the earning or cash flow coverage ratios that reflect theability of the firm to meet its financial obligations.
Alternatives to these earnings coverage ratios are several ratios that relate the cash flowavailable from operations to either interest expense or total fixed charges.
Cash Flow Coverage Ratio The motivation for this ratio is that a firm’s earnings and cash flowtypically will differ substantially (these differences have been noted and will be considered ina subsequent section). The cash flow value used is the cash flow from operating activitiesfigure contained in the cash flow statement.As such, it includes amortization expense, futuretaxes, and the impact of all working capital changes.Again, it is appropriate to specify the ratioin terms of total fixed financial costs including leases,17 as follows:
Net Cash Flow from Operating Activities � Interest Expense � Implied Lease Interest
Interest Expense � Implied Lease Interest
Cash Flow Coverage of Fixed Financial Cost � 19.29
2006: 683 � 110
50 � 110� 4.96 times
2007: 786 � 134
53 � 134� 4.92 times
2008: 882 � 155
64 � 155� 4.74 times
�Earnings before Interest and Taxes � Implied Lease Interest
Interest Expense � Implied Lease Interest
Fixed Financial Cost Coverage19.28
17 Note that some analysts adjust both Equations 19.28 and 19.29 to include the impact of before tax preferred divi-dends.This impact would be added to the numerator and denominator of Equation 19.28 and just the denominator ofEquation 19.28.
19Ch19.qxd 1/6/10 3:23 PM Page 36
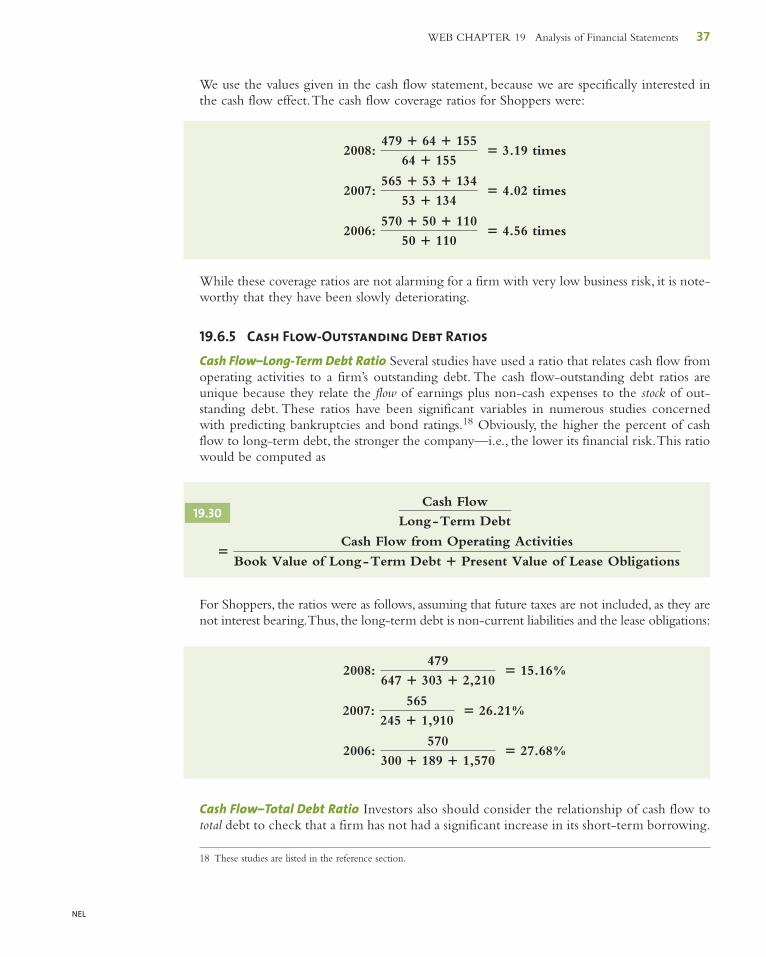
NEL
WEB CHAPTER 19 Analysis of Financial Statements 37
18 These studies are listed in the reference section.
We use the values given in the cash flow statement, because we are specifically interested inthe cash flow effect.The cash flow coverage ratios for Shoppers were:
While these coverage ratios are not alarming for a firm with very low business risk, it is note-worthy that they have been slowly deteriorating.
19.6.5 Cash Flow-Outstanding Debt RatiosCash Flow–Long-Term Debt Ratio Several studies have used a ratio that relates cash flow fromoperating activities to a firm’s outstanding debt. The cash flow-outstanding debt ratios areunique because they relate the flow of earnings plus non-cash expenses to the stock of out-standing debt. These ratios have been significant variables in numerous studies concernedwith predicting bankruptcies and bond ratings.18 Obviously, the higher the percent of cashflow to long-term debt, the stronger the company—i.e., the lower its financial risk.This ratiowould be computed as
For Shoppers, the ratios were as follows, assuming that future taxes are not included, as they arenot interest bearing.Thus, the long-term debt is non-current liabilities and the lease obligations:
Cash Flow–Total Debt Ratio Investors also should consider the relationship of cash flow tototal debt to check that a firm has not had a significant increase in its short-term borrowing.
2006: 570
300 � 189 � 1,570 � 27.68%
2007: 565
245 � 1,910 � 26.21%
2008: 479
647 � 303 � 2,210 � 15.16%
�Cash Flow from Operating Activities
Book Value of Long-Term Debt � Present Value of Lease Obligations
Cash Flow
Long-Term Debt19.30
2006: 570 � 50 � 110
50 � 110 � 4.56 times
2007: 565 � 53 � 134
53 � 134 � 4.02 times
2008: 479 � 64 � 155
64 � 155 � 3.19 times
19Ch19.qxd 1/6/10 3:23 PM Page 37
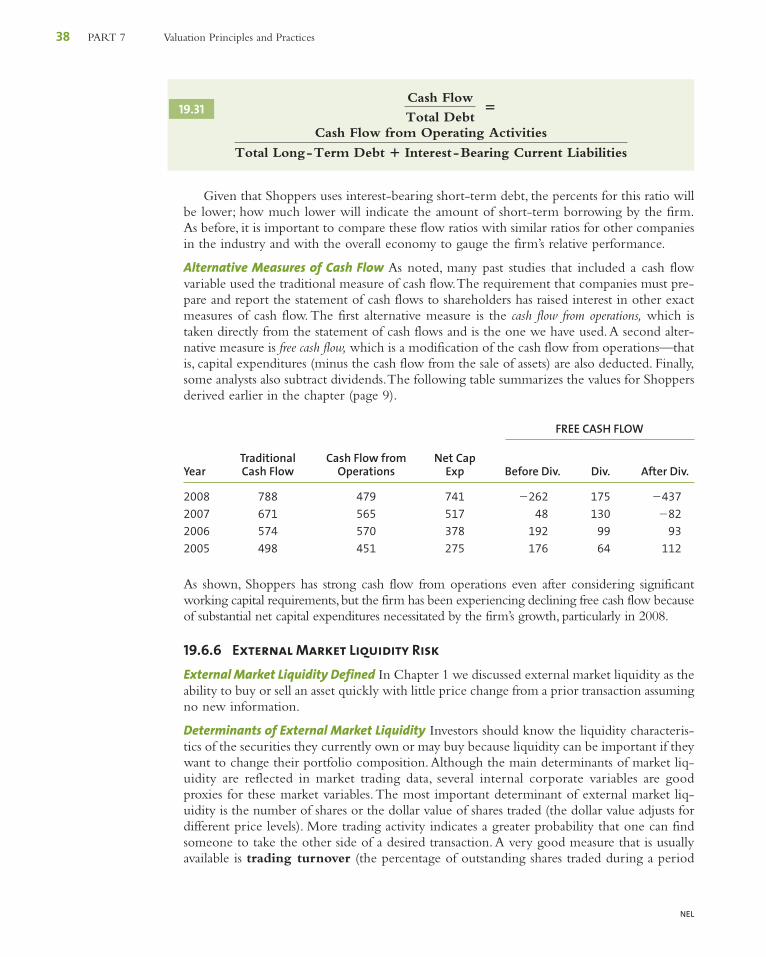
NEL
38 PART 7 Valuation Principles and Practices
Given that Shoppers uses interest-bearing short-term debt, the percents for this ratio willbe lower; how much lower will indicate the amount of short-term borrowing by the firm.As before, it is important to compare these flow ratios with similar ratios for other companiesin the industry and with the overall economy to gauge the firm’s relative performance.
Alternative Measures of Cash Flow As noted, many past studies that included a cash flowvariable used the traditional measure of cash flow.The requirement that companies must pre-pare and report the statement of cash flows to shareholders has raised interest in other exactmeasures of cash flow. The first alternative measure is the cash flow from operations, which istaken directly from the statement of cash flows and is the one we have used.A second alter-native measure is free cash flow, which is a modification of the cash flow from operations—thatis, capital expenditures (minus the cash flow from the sale of assets) are also deducted. Finally,some analysts also subtract dividends.The following table summarizes the values for Shoppersderived earlier in the chapter (page 9).
FREE CASH FLOW
Traditional Cash Flow from Net Cap Year Cash Flow Operations Exp Before Div. Div. After Div.
2008 788 479 741 �262 175 �437
2007 671 565 517 48 130 �82
2006 574 570 378 192 99 93
2005 498 451 275 176 64 112
As shown, Shoppers has strong cash flow from operations even after considering significantworking capital requirements,but the firm has been experiencing declining free cash flow becauseof substantial net capital expenditures necessitated by the firm’s growth, particularly in 2008.
19.6.6 External Market Liquidity RiskExternal Market Liquidity Defined In Chapter 1 we discussed external market liquidity as theability to buy or sell an asset quickly with little price change from a prior transaction assumingno new information.
Determinants of External Market Liquidity Investors should know the liquidity characteris-tics of the securities they currently own or may buy because liquidity can be important if theywant to change their portfolio composition.Although the main determinants of market liq-uidity are reflected in market trading data, several internal corporate variables are goodproxies for these market variables.The most important determinant of external market liq-uidity is the number of shares or the dollar value of shares traded (the dollar value adjusts fordifferent price levels). More trading activity indicates a greater probability that one can findsomeone to take the other side of a desired transaction. A very good measure that is usuallyavailable is trading turnover (the percentage of outstanding shares traded during a period
Cash Flow from Operating Activities
Total Long-Term Debt � Interest-Bearing Current Liabilities
Cash Flow
Total Debt � 19.31
19Ch19.qxd 1/6/10 3:23 PM Page 38
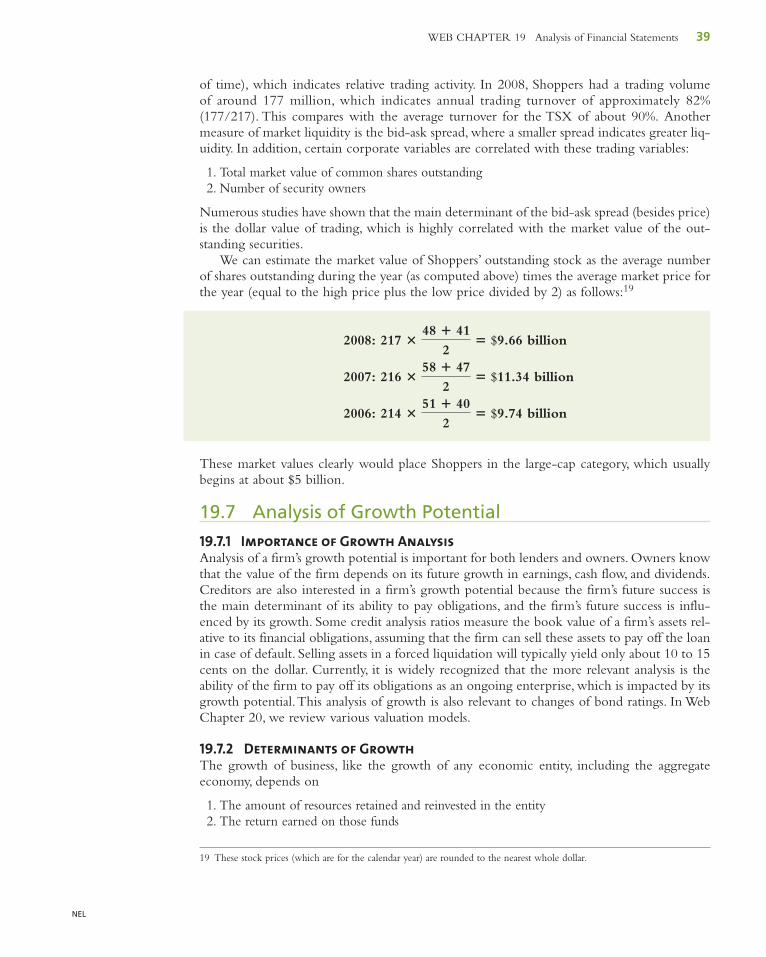
NEL
WEB CHAPTER 19 Analysis of Financial Statements 39
19 These stock prices (which are for the calendar year) are rounded to the nearest whole dollar.
of time), which indicates relative trading activity. In 2008, Shoppers had a trading volumeof around 177 million, which indicates annual trading turnover of approximately 82%(177/217). This compares with the average turnover for the TSX of about 90%. Anothermeasure of market liquidity is the bid-ask spread, where a smaller spread indicates greater liq-uidity. In addition, certain corporate variables are correlated with these trading variables:
1. Total market value of common shares outstanding2. Number of security owners
Numerous studies have shown that the main determinant of the bid-ask spread (besides price)is the dollar value of trading, which is highly correlated with the market value of the out-standing securities.
We can estimate the market value of Shoppers’ outstanding stock as the average numberof shares outstanding during the year (as computed above) times the average market price forthe year (equal to the high price plus the low price divided by 2) as follows:19
These market values clearly would place Shoppers in the large-cap category, which usuallybegins at about $5 billion.
19.7 Analysis of Growth Potential
19.7.1 Importance of Growth AnalysisAnalysis of a firm’s growth potential is important for both lenders and owners. Owners knowthat the value of the firm depends on its future growth in earnings, cash flow, and dividends.Creditors are also interested in a firm’s growth potential because the firm’s future success isthe main determinant of its ability to pay obligations, and the firm’s future success is influ-enced by its growth. Some credit analysis ratios measure the book value of a firm’s assets rel-ative to its financial obligations, assuming that the firm can sell these assets to pay off the loanin case of default. Selling assets in a forced liquidation will typically yield only about 10 to 15cents on the dollar. Currently, it is widely recognized that the more relevant analysis is theability of the firm to pay off its obligations as an ongoing enterprise, which is impacted by itsgrowth potential.This analysis of growth is also relevant to changes of bond ratings. In WebChapter 20, we review various valuation models.
19.7.2 Determinants of GrowthThe growth of business, like the growth of any economic entity, including the aggregateeconomy, depends on
1. The amount of resources retained and reinvested in the entity2. The return earned on those funds
2006: 214 �51 � 40
2� $9.74 billion
2007: 216 �58 � 47
2� $11.34 billion
2008: 217 �48 � 41
2� $9.66 billion
19Ch19.qxd 1/6/10 3:23 PM Page 39
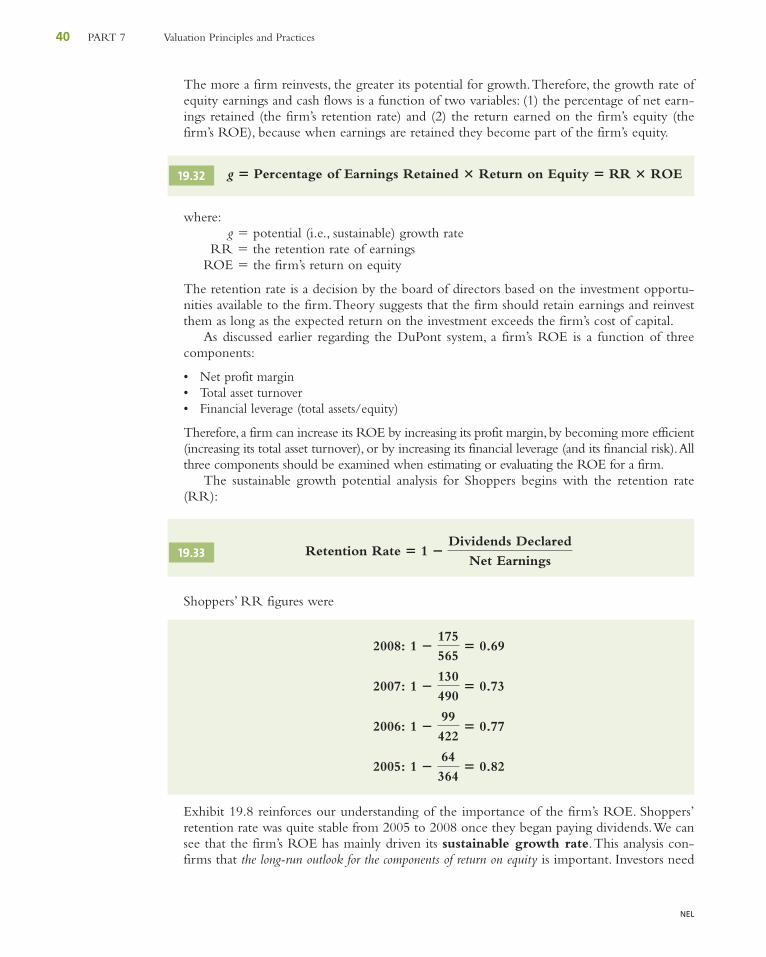
NEL
40 PART 7 Valuation Principles and Practices
The more a firm reinvests, the greater its potential for growth.Therefore, the growth rate ofequity earnings and cash flows is a function of two variables: (1) the percentage of net earn-ings retained (the firm’s retention rate) and (2) the return earned on the firm’s equity (thefirm’s ROE), because when earnings are retained they become part of the firm’s equity.
where:g � potential (i.e., sustainable) growth rate
RR � the retention rate of earningsROE � the firm’s return on equity
The retention rate is a decision by the board of directors based on the investment opportu-nities available to the firm.Theory suggests that the firm should retain earnings and reinvestthem as long as the expected return on the investment exceeds the firm’s cost of capital.
As discussed earlier regarding the DuPont system, a firm’s ROE is a function of threecomponents:
• Net profit margin• Total asset turnover• Financial leverage (total assets/equity)
Therefore, a firm can increase its ROE by increasing its profit margin, by becoming more efficient(increasing its total asset turnover), or by increasing its financial leverage (and its financial risk).Allthree components should be examined when estimating or evaluating the ROE for a firm.
The sustainable growth potential analysis for Shoppers begins with the retention rate(RR):
Shoppers’ RR figures were
Exhibit 19.8 reinforces our understanding of the importance of the firm’s ROE. Shoppers’retention rate was quite stable from 2005 to 2008 once they began paying dividends.We cansee that the firm’s ROE has mainly driven its sustainable growth rate.This analysis con-firms that the long-run outlook for the components of return on equity is important. Investors need
2005: 1 �64
364� 0.82
2006: 1 �99
422� 0.77
2007: 1 �130
490� 0.73
2008: 1 �175
565� 0.69
Retention Rate � 1 �Dividends Declared
Net Earnings19.33
g � Percentage of Earnings Retained � Return on Equity � RR � ROE19.32
19Ch19.qxd 1/6/10 3:23 PM Page 40
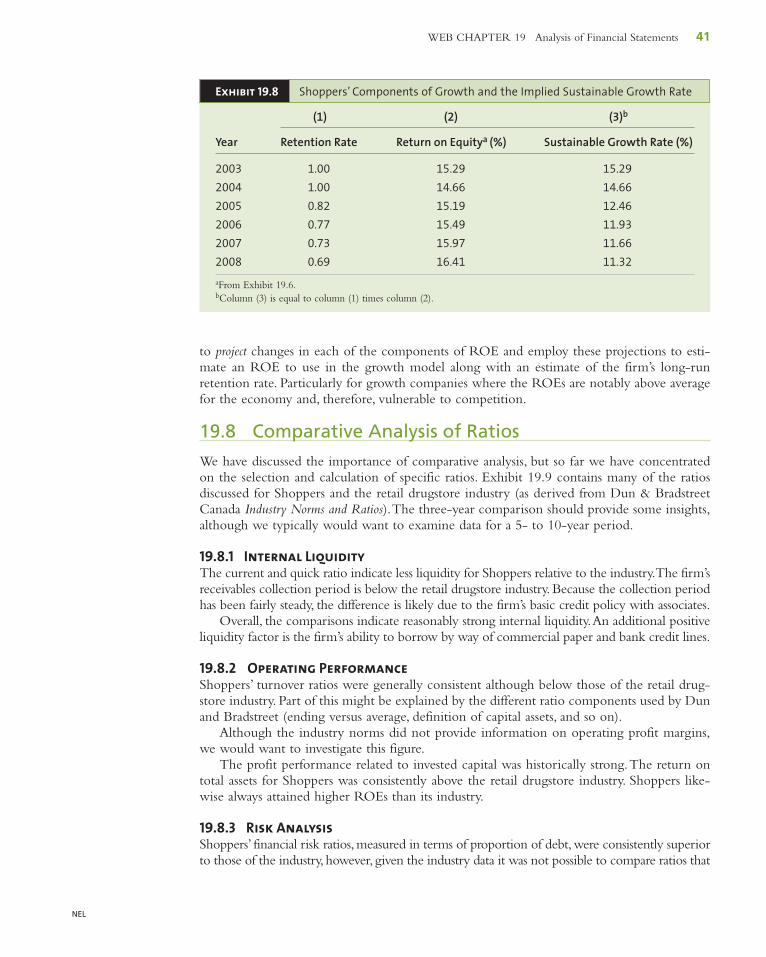
NEL
WEB CHAPTER 19 Analysis of Financial Statements 41
Exhibit 19.8 Shoppers’ Components of Growth and the Implied Sustainable Growth Rate
(1) (2) (3)b
Year Retention Rate Return on Equitya (%) Sustainable Growth Rate (%)
2003 1.00 15.29 15.29
2004 1.00 14.66 14.66
2005 0.82 15.19 12.46
2006 0.77 15.49 11.93
2007 0.73 15.97 11.66
2008 0.69 16.41 11.32
aFrom Exhibit 19.6.bColumn (3) is equal to column (1) times column (2).
to project changes in each of the components of ROE and employ these projections to esti-mate an ROE to use in the growth model along with an estimate of the firm’s long-runretention rate. Particularly for growth companies where the ROEs are notably above averagefor the economy and, therefore, vulnerable to competition.
19.8 Comparative Analysis of Ratios
We have discussed the importance of comparative analysis, but so far we have concentratedon the selection and calculation of specific ratios. Exhibit 19.9 contains many of the ratiosdiscussed for Shoppers and the retail drugstore industry (as derived from Dun & BradstreetCanada Industry Norms and Ratios).The three-year comparison should provide some insights,although we typically would want to examine data for a 5- to 10-year period.
19.8.1 Internal LiquidityThe current and quick ratio indicate less liquidity for Shoppers relative to the industry.The firm’sreceivables collection period is below the retail drugstore industry. Because the collection periodhas been fairly steady, the difference is likely due to the firm’s basic credit policy with associates.
Overall, the comparisons indicate reasonably strong internal liquidity.An additional positiveliquidity factor is the firm’s ability to borrow by way of commercial paper and bank credit lines.
19.8.2 Operating PerformanceShoppers’ turnover ratios were generally consistent although below those of the retail drug-store industry. Part of this might be explained by the different ratio components used by Dunand Bradstreet (ending versus average, definition of capital assets, and so on).
Although the industry norms did not provide information on operating profit margins,we would want to investigate this figure.
The profit performance related to invested capital was historically strong.The return ontotal assets for Shoppers was consistently above the retail drugstore industry. Shoppers like-wise always attained higher ROEs than its industry.
19.8.3 Risk AnalysisShoppers’ financial risk ratios,measured in terms of proportion of debt,were consistently superiorto those of the industry, however, given the industry data it was not possible to compare ratios that
19Ch19.qxd 1/6/10 3:23 PM Page 41
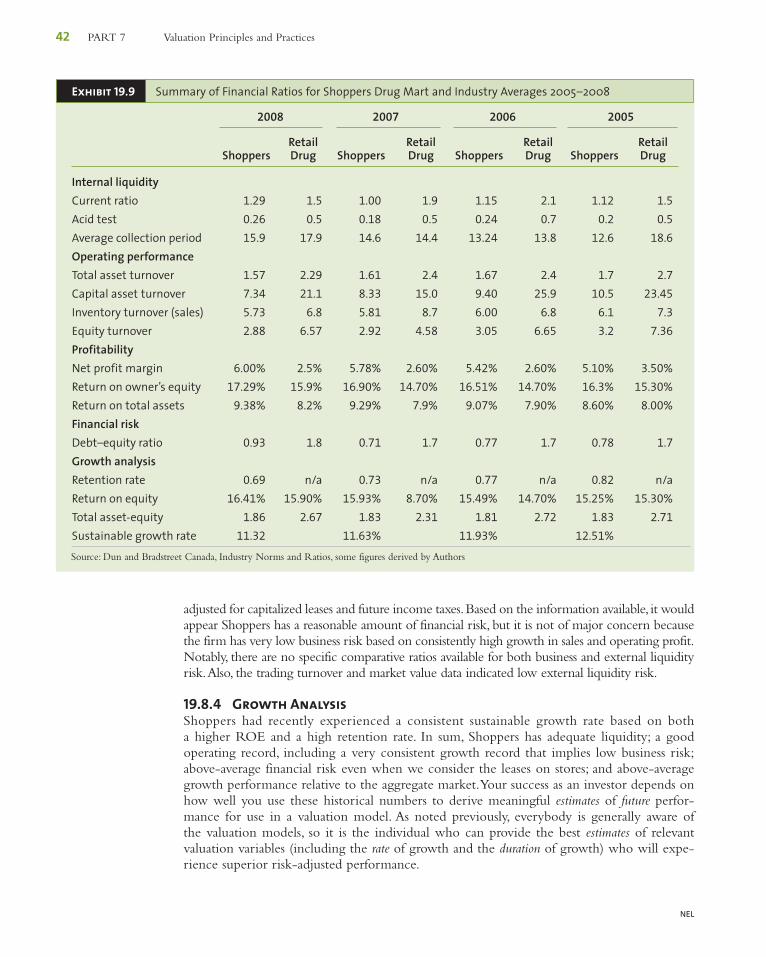
NEL
42 PART 7 Valuation Principles and Practices
Exhibit 19.9 Summary of Financial Ratios for Shoppers Drug Mart and Industry Averages 2005–2008
2008 2007 2006 2005
Retail Retail Retail RetailShoppers Drug Shoppers Drug Shoppers Drug Shoppers Drug
Internal liquidityCurrent ratio 1.29 1.5 1.00 1.9 1.15 2.1 1.12 1.5
Acid test 0.26 0.5 0.18 0.5 0.24 0.7 0.2 0.5
Average collection period 15.9 17.9 14.6 14.4 13.24 13.8 12.6 18.6
Operating performanceTotal asset turnover 1.57 2.29 1.61 2.4 1.67 2.4 1.7 2.7
Capital asset turnover 7.34 21.1 8.33 15.0 9.40 25.9 10.5 23.45
Inventory turnover (sales) 5.73 6.8 5.81 8.7 6.00 6.8 6.1 7.3
Equity turnover 2.88 6.57 2.92 4.58 3.05 6.65 3.2 7.36
ProfitabilityNet profit margin 6.00% 2.5% 5.78% 2.60% 5.42% 2.60% 5.10% 3.50%
Return on owner’s equity 17.29% 15.9% 16.90% 14.70% 16.51% 14.70% 16.3% 15.30%
Return on total assets 9.38% 8.2% 9.29% 7.9% 9.07% 7.90% 8.60% 8.00%
Financial riskDebt–equity ratio 0.93 1.8 0.71 1.7 0.77 1.7 0.78 1.7
Growth analysisRetention rate 0.69 n/a 0.73 n/a 0.77 n/a 0.82 n/aReturn on equity 16.41% 15.90% 15.93% 8.70% 15.49% 14.70% 15.25% 15.30%
Total asset-equity 1.86 2.67 1.83 2.31 1.81 2.72 1.83 2.71
Sustainable growth rate 11.32 11.63% 11.93% 12.51%
Source: Dun and Bradstreet Canada, Industry Norms and Ratios, some figures derived by Authors
adjusted for capitalized leases and future income taxes.Based on the information available, it wouldappear Shoppers has a reasonable amount of financial risk, but it is not of major concern becausethe firm has very low business risk based on consistently high growth in sales and operating profit.Notably, there are no specific comparative ratios available for both business and external liquidityrisk.Also, the trading turnover and market value data indicated low external liquidity risk.
19.8.4 Growth AnalysisShoppers had recently experienced a consistent sustainable growth rate based on botha higher ROE and a high retention rate. In sum, Shoppers has adequate liquidity; a goodoperating record, including a very consistent growth record that implies low business risk;above-average financial risk even when we consider the leases on stores; and above-averagegrowth performance relative to the aggregate market.Your success as an investor depends onhow well you use these historical numbers to derive meaningful estimates of future perfor-mance for use in a valuation model. As noted previously, everybody is generally aware ofthe valuation models, so it is the individual who can provide the best estimates of relevantvaluation variables (including the rate of growth and the duration of growth) who will expe-rience superior risk-adjusted performance.
19Ch19.qxd 1/6/10 3:23 PM Page 42
NEL
WEB CHAPTER 19 Analysis of Financial Statements 43
19.8.5 Comparator NumbersAs our brief analysis has shown, comparator numbers may be lacking, incomplete for yourpurposes, or calculated differently. In order to be confident in comparing trends, you mayhave to do a full analysis of comparator companies.
19.9 Analysis of Non-Canadian Financial Statements
As we have stressed several times, your portfolio should encompass other economies and mar-kets, numerous global industries, and many foreign firms in these global industries. However,because accounting conventions differ among countries, non-Canadian financial statementswill differ from those in this chapter and from what you will see in a typical accountingcourse.While it is beyond the scope of this text to discuss these alternative accounting con-ventions in detail, we encourage you to examine the sources in the “Suggested Readings”section entitled Analysis of International Financial Statements.
19.10 The Quality of Financial Statements
Analysts sometimes speak of the quality of a firm’s earnings or the quality of a firm’s balancesheet. In general, quality financial statements are a good reflection of reality; accountingtricks and one-time changes are not used to make the firm appear stronger than it really is.Some factors that lead to lower quality financial statements were mentioned previously whenwe discussed ratio analysis. Other quality influences are discussed here and in Palepu, Healy,and Bernard (2007, chapter 3).
19.10.1 Balance SheetA high-quality balance sheet typically has limited use of debt or leverage. Therefore, thepotential of financial distress resulting from excessive debt is quite low. Little use of debt alsoimplies the firm has unused borrowing capacity, which implies that the firm can draw on thatunused capacity to make profitable investments.
A quality balance sheet contains assets with market values greater than their book value.The capability of management and the existence of intangible assets—such as goodwill, trade-marks, or patents—will make the market value of the firm’s assets exceed their book values.In general, as a result of inflation and historical cost accounting, we might expect the marketvalue of assets to exceed their book values. Overpriced assets on the books occur when a firmhas outdated, technologically inferior assets; obsolete inventory; and non-performing assetssuch as receivables that have not been written off.
The presence of off-balance-sheet liabilities also harms the quality of a balance sheet. Suchliabilities may include joint ventures and loan commitments or guarantees to subsidiaries,which are discussed in Stickney, Brown, and Wahlen (2007, chapter 6).
19.10.2 Income StatementHigh-quality earnings are repeatable earnings. For example, they arise from sales to customerswho are expected to do repeat business with the firm and from costs that are not artificiallylow as a result of unusual and short-lived input price reductions. One-time and non-recur-ring items—such as accounting changes, mergers, and asset sales—should be ignored whenexamining earnings. Unexpected exchange rate fluctuations that work in the firm’s favour toraise revenues or reduce costs should also be viewed as non-recurring.
High-quality earnings result from the use of conservative accounting principles that do notresult in overstated revenues and understated costs.The closer the earnings are to cash, the higherthe quality of the income statement.Suppose a firm sells furniture on credit by allowing customers
19Ch19.qxd 1/6/10 3:23 PM Page 43
NEL
44 PART 7 Valuation Principles and Practices
to make monthly payments.A higher quality income statement will recognize revenue using the“installment” principle; that is, as the cash is collected each month, in turn, annual sales will reflectonly the cash collected from sales during the year.A lower quality income statement will recog-nize 100% of the revenue at the time of sale, even though payments may stretch well into nextyear.A detailed discussion of income items is in Stickney, Brown, and Wahlen (2007, chapter 5).
19.10.3 NotesA word to the wise: read the notes! The purpose of the notes is to provide information onhow the firm handles balance sheet and income items.While the notes may not reveal every-thing you should know (e.g., Enron), if you do not read them you cannot hope to beinformed.The fact is, many analysts recommend that you should read an annual report back-ward, so that you read the notes first!
19.11 The Value of Financial Statement Analysis
Financial statements, by their nature, are backward-looking.They report the firm’s assets, lia-bilities, and equity as of a certain (past) date; they report a firm’s revenues, expenses, or cashflows over some (past) time period.An efficient capital market will have already incorporatedthis past information into security prices; so it may seem, at first glance, that analysis of a firm’sfinancial statements and ratios is a waste of the analyst’s time.
The fact is, the opposite is true.Financial statement analysis allows the investor to gain knowl-edge of a firm’s operating and financial strategy and structure.This, in turn, assists them in deter-mining the effects of future events on the firm’s cash flows. Combining knowledge of the firm’soperating and financial leverage, its strategy, and possible macro- and microeconomic scenarios isnecessary to determine an appropriate market value for the firm’s stock. Combining the analysisof historical data with potential future scenarios allows analysts to evaluate the risks facing thefirm and then to develop an expected return and cash flow forecast based on these risks.The finaloutcome of the process, as detailed in other chapters detail, is the determination of the firm’s cur-rent intrinsic value based on expected cash flows,which is compared to the stock’s current marketprice to determine your investment decision.The point is, the detailed analysis of the historicalresults ensures a better estimation of the expected cash flows and an appropriate discount ratewhich in turn leads to a superior estimate of the intrinsic value of the firm.
19.12 Specific Uses of Financial Ratios
In addition to measuring firm performance and risk, financial ratios have been used in fourmain areas in investments: (1) stock valuation, (2) the identification of internal corporatevariables that affect a stock’s systematic risk, (3) assigning credit quality ratings on bonds, and(4) predicting insolvency (bankruptcy) of firms.
19.12.1 Stock Valuation ModelsAs we will discuss in Web Chapter 20, most valuation models attempt to derive a stock valuebased on one of several present value of cash flow models or appropriate relative valuation ratios.All the models require a growth rate estimate for earnings, cash flows, or dividends and therequired return on the stock. Clearly, financial ratios can help in estimating these critical inputs.
The typical empirical valuation model has examined a cross-section of companies and useda multiple regression model that relates one of the relative valuations ratios for the sample firmsto some of the following (the averages generally consider the past 5 or 10 years).20
20 A list of studies in this area appears in the “Suggested Readings” section at the end of the chapter.
19Ch19.qxd 1/6/10 3:23 PM Page 44
NEL
WEB CHAPTER 19 Analysis of Financial Statements 45
Financial Ratios1. Average debt-equity2. Average interest coverage3. Average dividend payout4. Average return on equity5. Average retention rate6. Average market price to book value7. Average market price to cash flow8. Average market price to sales
Variability Measures1. Coefficient of variation of operating earnings2. Coefficient of variation of sales3. Coefficient of variation of net income4. Systematic risk (beta)
Non-ratio Variable1. Average growth rate of earnings and cash flows
An alternative use of these ratios is to act as a filter to derive a subset of stocks to analyzefrom some total universe of stocks. For example, starting with a universe of 5,000 stocks, youwould screen on the basis of consistent growth rates, profitability, and stability to generate asubset of 250 stocks that you would analyze in depth.
19.12.2 Estimating Systematic RiskAs discussed in Chapter 7, the capital asset pricing model (CAPM) asserts that the relevantrisk variable for an asset should be its systematic risk, which is its beta coefficient related tothe market portfolio of all risky assets. In efficient markets, a relationship should exist betweeninternal corporate risk variables and market-determined risk variables such as beta.Numerousstudies have tested the relationship between a stock’s systematic risk (beta) and the firm’sinternal corporate variable intended to reflect business risk and financial risk.21 The signifi-cant variables (usually five-year averages) included were as follows:
Financial Ratios1. Dividend payout2. Total debt–total assets3. Cash flow–total debt4. Interest coverage5. Working capital–total assets6. Current ratio
Variability Measures1. Coefficient of variation of net earnings2. Coefficient of variation of operating earnings3. Coefficient of variation of operating profit margins4. Operating earnings beta (company earnings related to aggregate earnings)
Non-ratio Variables1. Asset size2. Market value of stock outstanding
21 A list of studies in this area appears in the “Suggested Readings” section at the end of the chapter.
19Ch19.qxd 1/6/10 3:23 PM Page 45
NEL
46 PART 7 Valuation Principles and Practices
19.12.3 Estimating the Ratings on BondsRecall from Chapter 3 that various agencies assign credit ratings to bonds on the basis of theissuing company’s ability to meet its obligations related to the bond. Numerous studies haveused various financial ratios to predict the rating to be assigned to a bond; these ratios include:22
Financial Ratios1. Long-term debt–total assets2. Total debt–total capital3. Net income plus amortization (cash flow)–long-term senior debt4. Cash flow–total debt5. Earnings before interest and taxes (EBIT)–interest expense (fixed charge coverage)6. Cash flow from operations plus interest–interest expense7. Market value of stock–par value of bonds8. Net operating profit–sales9. Net income–owners’ equity (ROE)
10. Net income–total assets (ROA)11. Working capital–sales12. Sales–net worth (equity turnover)
Variability Measures1. Coefficient of variation of sales2. Coefficient of variation of operating earnings3. Coefficient of variation of net earnings4. Coefficient of variation of return on assets
Non-ratio Variables1. Subordination of the issue2. Size of the firm (total assets)3. Issue size for alternative bond issues4. Par value of all publicly traded bonds of the firm
19.12.4 Predicting Insolvency (Bankruptcy)Analysts have always been interested in using financial ratios to identify firms that might defaulton a loan or declare bankruptcy.23 The typical study examines a sample of firms that havedeclared bankruptcy against a matched sample of firms in the same industry and of compa-rable size that have not failed. The analysis involves examining a number of financial ratiosexpected to reflect declining liquidity for several years prior to the declaring of bankruptcy.The goal is to determine which set of ratios correctly predict that a firm will be in the bank-rupt or non-bankrupt group.The better models have typically correctly classified more than80% of the firms one year prior to failure. Some of the financial ratios included in successfulmodels were as follows:
Financial Ratios1. Cash flow–total debt2. Cash flow–long-term debt3. Sales–total assets*4. Net income–total assets5. EBIT/total assets*
22 A list of studies in this area appears in the “Suggested Readings” section at the end of the chapter.23 A list of studies in this area appears in the “Suggested Readings” section at the end of the chapter.
19Ch19.qxd 1/6/10 3:23 PM Page 46
NEL
WEB CHAPTER 19 Analysis of Financial Statements 47
6. Total debt/total assets7. Market value of stock–book value of debt*8. Working capital–total assets*9. Retained earnings–total assets*
10. Current ratio11. Working capital–sales
In addition to the several studies that have used financial ratios to predict bond ratings and fail-ures, other studies have also used cash flow variables or a combination of financial ratios and cashflow variables for these predictions, and the results have been quite successful.These studies arelisted in the “Suggested Readings” section at the end of the chapter.The five ratios designated byan asterisk (*) are the ratios used in the well-known Altman Z-score model (Altman, 1968).
19.12.5 Limitations of Financial RatiosWe must reinforce an earlier point:You should always consider relative financial ratios. In addi-tion, you should be aware of other questions and limitations of financial ratios:
1. Are firms’ accounting treatments comparable? From your prior accounting courses, youknow there are several generally accepted methods for treating various accounting items,which can cause a difference in results.Therefore, you should check on the accounting treat-ment of significant items and adjust the values if necessary. Comparability is a critical consid-eration when dealing with foreign firms.
2. How homogeneous is the firm? Many companies have divisions that operate in differentindustries, which can make it difficult to derive comparable industry ratios.
3. Are the implied results consistent? It is important to develop a total profile of the firm andnot depend on only one set of ratios (e.g., internal liquidity ratios).As an example, a firmmay be having short-term liquidity problems but be very profitable—the profitability willeventually alleviate the short-run liquidity problems.
4. Is the ratio within a reasonable range for the industry? As noted on several occasions, youtypically want to consider a range of appropriate values for the ratio because a value that iseither too high or too low for the industry can be a problem.
Summary
1. Financial statements are intended to provide informationon the resources available to management, how theseresources were financed, and what the firm accomplishedwith them.Annual and quarterly reports to the shareholderinclude three financial statements: the balance sheet, theincome statement, and the statement of cash flows.
2. The overall purpose of financial statement analysis is tohelp investors make decisions on investing in a firm’sbonds or stock. Financial ratios should be examined rela-tive to the economy, the firm’s industry, the firm’s maincompetitors, and the firm’s past relative ratios.
3. The specific ratios can be divided into four categories,depending on the purpose of the analysis: internalliquidity, operating performance, risk analysis, and growthanalysis. Internal liquidity ratios are intended to indicatethe ability of the firm to meet future short-term financialobligations. Operating performance ratios examine how
management uses its assets and capital, measured by dollarsof sales generated by various asset or capital categoriesand the profits as a percentage of sales and as a percentageof the assets and capital employed. Risk analysis ratiosexamine various components of risk and their sources,whether business, financial or external liquidity. Growthratios look at sources of growth for the company and thefirm’s ability to fund some of that growth internally.
4. The DuPont system divides the ROE ratio into componentratios that provide insights into the causes of a firm’s ROEor any changes in it.The component ratios, net profitmargin, total asset turnover, and equity turnover whenbroken out give some indication on how a firm canimprove its return on equity by using more debt (increasingits equity turnover), by becoming more profitable(increasing its net profit margin), by increasing its asset effi-ciency (total asset turnover), or a combination of these.
An insolvency predictor calculator can be found athttp://www.creditguru.com/CalcAltZ.shtml
19Ch19.qxd 1/6/10 3:23 PM Page 47
NEL
48 PART 7 Valuation Principles and Practices
Key Terms
balance sheet, p. 4business risk, p. 28cross-sectional analysis, p. 10DuPont system, p. 24financial risk, p. 30free cash flow to equity, p. 8
generally accepted accounting principles (GAAP), p. 4
income statement, p. 4internal liquidity (solvency) ratios, p. 13operating efficiency ratios, p. 19operating leverage, p. 29
operating profitability ratios, p. 18quality financial statements, p. 43statement of cash flows, p. 6sustainable growth rate, p. 40time-series analysis, p. 11trading turnover, p. 38
Suggested Readings
General
Byrnes, Nanette, Mike McNamee, Diane Brady, Louis Lavelle,and Christopher Palmeri. 2002. “Accounting in Crisis.”Business Week, January 28, pp. 44–48.
Fridson, Martin, and Fernando Alvarez. Financial StatementAnalysis, 3rd ed. New York:Wiley, 2002.
Helfert, Erich A. Techniques of Financial Analysis, 11th ed. NewYork: McGraw-Hill, 2002.
Penman, Stephen. Financial Statement Analysis and SecurityValuation, 3rd ed. New York: McGraw-Hill, 2007.
Analysis of International Financial Statements
Doupnik,Timothy, and Hector Perera. International Accounting,1st ed. New York: McGraw-Hill, 2007.
Rueschhoff, Norlin, and David Strupeck. “Equity Returns:Local GAAP versus US GAAP for Foreign Issuers fromDeveloping Countries,” Journal of International Accounting33, no. 3 (Spring 2000).
Financial Ratios and Stock Valuation Models
Damodaran, Aswath. Investment Valuations: Tools and Techniquesfor Determining the Value of Any Asset, 2nd ed. New York:Wiley, 2002.
Danielson,M.G.“A Simple Valuation Model and Growth Expec-tations.” Financial Analysts Journal 54, no. 3 (May–June 1998).
Farrell, James L.“The Dividend Discount Model:A Primer.”Finan-cial Analysts Journal 41, no. 6 (November–December 1985).
Kaplan, S. N., and R. S. Ruback.“The Valuation of Cash FlowForecasts:An Empirical Analysis.” Journal of Finance 50, no. 4(September 1995).
Penman, S. H.“The Articulation of Price-Earnings Ratios andMarket-to-Book Ratios and the Evaluation of Growth.”Journal of Accounting Research 34, no. 2 (Spring 1996).
Financial Ratios and Systematic Risk (Beta)
Campbell, John Y., Christopher Polk, and Tuomo Vuolteenaho.“Growth or Glamour? Fundamentals and Systematic Risk inStock Return,”Working Paper, February 2007 retrieved athttp://personal.lse.ac.uk/polk/research/gorg20070219.pdf.
Mandelker, Gershon M., and S. Ghon Rhee. “The Impact ofDegrees of Operating and Financial Leverage on theSystematic Risk of Common Stock.” Journal of Financial andQuantitative Analysis 19, no. 1 (March 1984).
Financial Ratios and Bond Ratings
Cantor, R., and F. Packer. “The Credit Rating Industry.”Journal of Fixed Income 5, no. 3 (December 1995).
Fisher, Lawrence.“Determinants of Risk Premiums on Corpo-rate Bonds.” Journal of Political Economy 67,no.3 (June 1959).
Parnes, Dror. “Applying Credit Score Models to MultipleStates of Nature,” Journal of Fixed Income, Winter 2007.
Standard and Poor’s Corporation. “Corporate RatingsCriter ia,” 2008.
Zhou, Chunsheng. “Credit Rating and Corporate Defaults.”Journal of Fixed Income 11, no. 3 (December 2001).
Financial Ratios and Corporate Bankruptcy
Altman, Edward I. “Financial Ratios, Discriminant Analysis,and the Prediction of Corporate Bankruptcy.” Journal ofFinance 23, no. 4 (September 1968).
Altman, Edward I., and Edith Hotchkiss. Corporate FinancialDistress and Bankruptcy, 3rd ed. New York:Wiley, 2006.
Altman, Edward I., and Herbert Rijken. “A Point-in-TimePerspective on Through-the-Cycle Ratings.” FinancialAnalysts Journal 62, no. 1 (January–February 2006).
De Servigney, Arnaud, and Olivier Renault. Measuring andManaging Credit Risk. New York: McGraw-Hill, 2004.
5. A high-quality balance sheet typically has limited use ofdebt and assets with market values greater than theirbook value.A high-quality income statement has repeat-able earnings and the earning result from the use ofconservative accounting principles that do not result inoverstated revenues and understated costs.
6. Financial statement analysis allows investors to gainknowledge of a firm’s operating and financial strategyand structure.This, in turn, assists them in determiningthe effects of future events on the firm’s cash flows.
19Ch19.qxd 1/6/10 3:23 PM Page 48
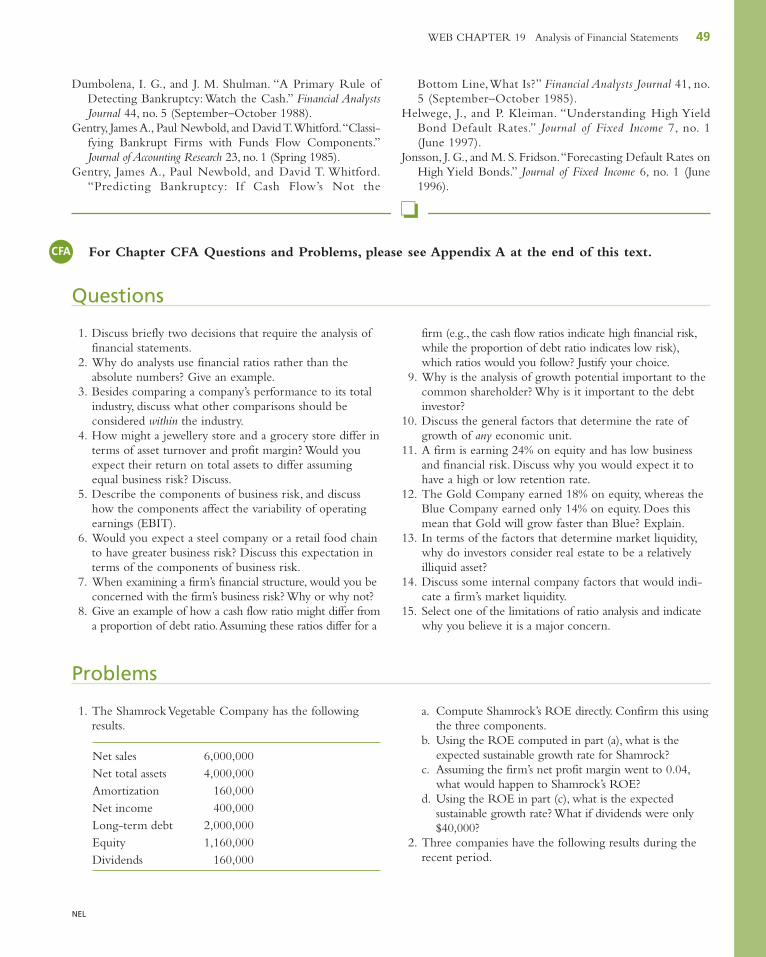
NEL
WEB CHAPTER 19 Analysis of Financial Statements 49
Dumbolena, I. G., and J. M. Shulman. “A Primary Rule ofDetecting Bankruptcy:Watch the Cash.” Financial AnalystsJournal 44, no. 5 (September–October 1988).
Gentry, James A., Paul Newbold, and David T.Whitford.“Classi-fying Bankrupt Firms with Funds Flow Components.”Journal of Accounting Research 23, no. 1 (Spring 1985).
Gentry, James A., Paul Newbold, and David T. Whitford.“Predicting Bankruptcy: If Cash Flow’s Not the
Bottom Line,What Is?” Financial Analysts Journal 41, no.5 (September–October 1985).
Helwege, J., and P. Kleiman. “Understanding High YieldBond Default Rates.” Journal of Fixed Income 7, no. 1(June 1997).
Jonsson, J. G., and M. S. Fridson.“Forecasting Default Rates onHigh Yield Bonds.” Journal of Fixed Income 6, no. 1 (June1996).
Questions
1. Discuss briefly two decisions that require the analysis offinancial statements.
2. Why do analysts use financial ratios rather than theabsolute numbers? Give an example.
3. Besides comparing a company’s performance to its totalindustry, discuss what other comparisons should beconsidered within the industry.
4. How might a jewellery store and a grocery store differ interms of asset turnover and profit margin? Would youexpect their return on total assets to differ assumingequal business risk? Discuss.
5. Describe the components of business risk, and discusshow the components affect the variability of operatingearnings (EBIT).
6. Would you expect a steel company or a retail food chainto have greater business risk? Discuss this expectation interms of the components of business risk.
7. When examining a firm’s financial structure, would you beconcerned with the firm’s business risk? Why or why not?
8. Give an example of how a cash flow ratio might differ froma proportion of debt ratio.Assuming these ratios differ for a
firm (e.g., the cash flow ratios indicate high financial risk,while the proportion of debt ratio indicates low risk),which ratios would you follow? Justify your choice.
9. Why is the analysis of growth potential important to thecommon shareholder? Why is it important to the debtinvestor?
10. Discuss the general factors that determine the rate ofgrowth of any economic unit.
11. A firm is earning 24% on equity and has low businessand financial risk. Discuss why you would expect it tohave a high or low retention rate.
12. The Gold Company earned 18% on equity, whereas theBlue Company earned only 14% on equity. Does thismean that Gold will grow faster than Blue? Explain.
13. In terms of the factors that determine market liquidity,why do investors consider real estate to be a relativelyilliquid asset?
14. Discuss some internal company factors that would indi-cate a firm’s market liquidity.
15. Select one of the limitations of ratio analysis and indicatewhy you believe it is a major concern.
Problems
1. The Shamrock Vegetable Company has the followingresults.
Net sales 6,000,000Net total assets 4,000,000Amortization 160,000Net income 400,000Long-term debt 2,000,000Equity 1,160,000Dividends 160,000
a. Compute Shamrock’s ROE directly. Confirm this usingthe three components.
b. Using the ROE computed in part (a), what is theexpected sustainable growth rate for Shamrock?
c. Assuming the firm’s net profit margin went to 0.04,what would happen to Shamrock’s ROE?
d. Using the ROE in part (c), what is the expected sustainable growth rate? What if dividends were only$40,000?
2. Three companies have the following results during therecent period.
❏
For Chapter CFA Questions and Problems, please see Appendix A at the end of this text.CFA
19Ch19.qxd 1/6/10 3:23 PM Page 49
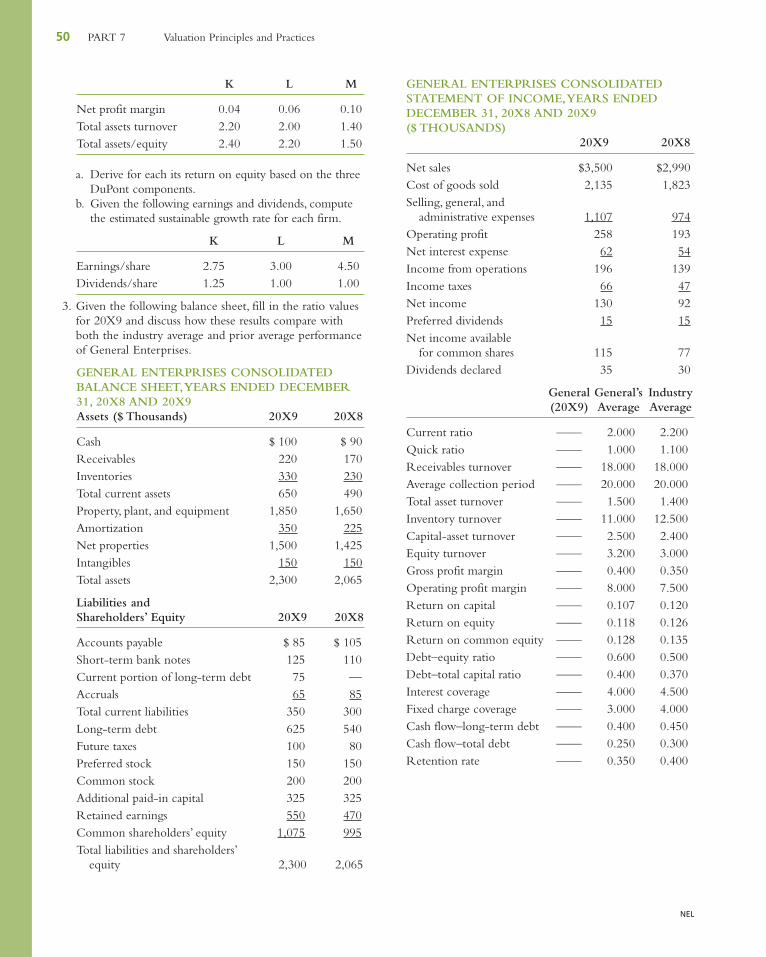
NEL
50 PART 7 Valuation Principles and Practices
K L M
Net profit margin 0.04 0.06 0.10Total assets turnover 2.20 2.00 1.40Total assets/equity 2.40 2.20 1.50
a. Derive for each its return on equity based on the threeDuPont components.
b. Given the following earnings and dividends, computethe estimated sustainable growth rate for each firm.
K L M
Earnings/share 2.75 3.00 4.50Dividends/share 1.25 1.00 1.00
3. Given the following balance sheet, fill in the ratio valuesfor 20X9 and discuss how these results compare withboth the industry average and prior average performanceof General Enterprises.
GENERAL ENTERPRISES CONSOLIDATEDBALANCE SHEET,YEARS ENDED DECEMBER31, 20X8 AND 20X9Assets ($ Thousands) 20X9 20X8
Cash $ 100 $ 90Receivables 220 170Inventories 330 230Total current assets 650 490Property, plant, and equipment 1,850 1,650Amortization 350 225Net properties 1,500 1,425Intangibles 150 150Total assets 2,300 2,065
Liabilities and Shareholders’ Equity 20X9 20X8
Accounts payable $ 85 $ 105Short-term bank notes 125 110Current portion of long-term debt 75 —Accruals 65 85Total current liabilities 350 300Long-term debt 625 540Future taxes 100 80Preferred stock 150 150Common stock 200 200Additional paid-in capital 325 325Retained earnings 550 470Common shareholders’ equity 1,075 995Total liabilities and shareholders’
equity 2,300 2,065
GENERAL ENTERPRISES CONSOLIDATEDSTATEMENT OF INCOME,YEARS ENDEDDECEMBER 31, 20X8 AND 20X9 ($ THOUSANDS)
20X9 20X8
Net sales $3,500 $2,990Cost of goods sold 2,135 1,823Selling, general, and
administrative expenses 1,107 974Operating profit 258 193Net interest expense 62 54Income from operations 196 139Income taxes 66 47Net income 130 92Preferred dividends 15 15Net income available
for common shares 115 77Dividends declared 35 30
General General’s Industry(20X9) Average Average
Current ratio —— 2.000 2.200Quick ratio —— 1.000 1.100Receivables turnover —— 18.000 18.000Average collection period —— 20.000 20.000Total asset turnover —— 1.500 1.400Inventory turnover —— 11.000 12.500Capital-asset turnover —— 2.500 2.400Equity turnover —— 3.200 3.000Gross profit margin —— 0.400 0.350Operating profit margin —— 8.000 7.500Return on capital —— 0.107 0.120Return on equity —— 0.118 0.126Return on common equity —— 0.128 0.135Debt–equity ratio —— 0.600 0.500Debt–total capital ratio —— 0.400 0.370Interest coverage —— 4.000 4.500Fixed charge coverage —— 3.000 4.000Cash flow–long-term debt —— 0.400 0.450Cash flow–total debt —— 0.250 0.300Retention rate —— 0.350 0.400
19Ch19.qxd 1/6/10 3:23 PM Page 50