Embed Size (px)
Citation preview
Source: Nevada Department of Public Safety
Domestic Violence Quarterly Report of Ombudsman Nicole O’Banion
Quarter 4
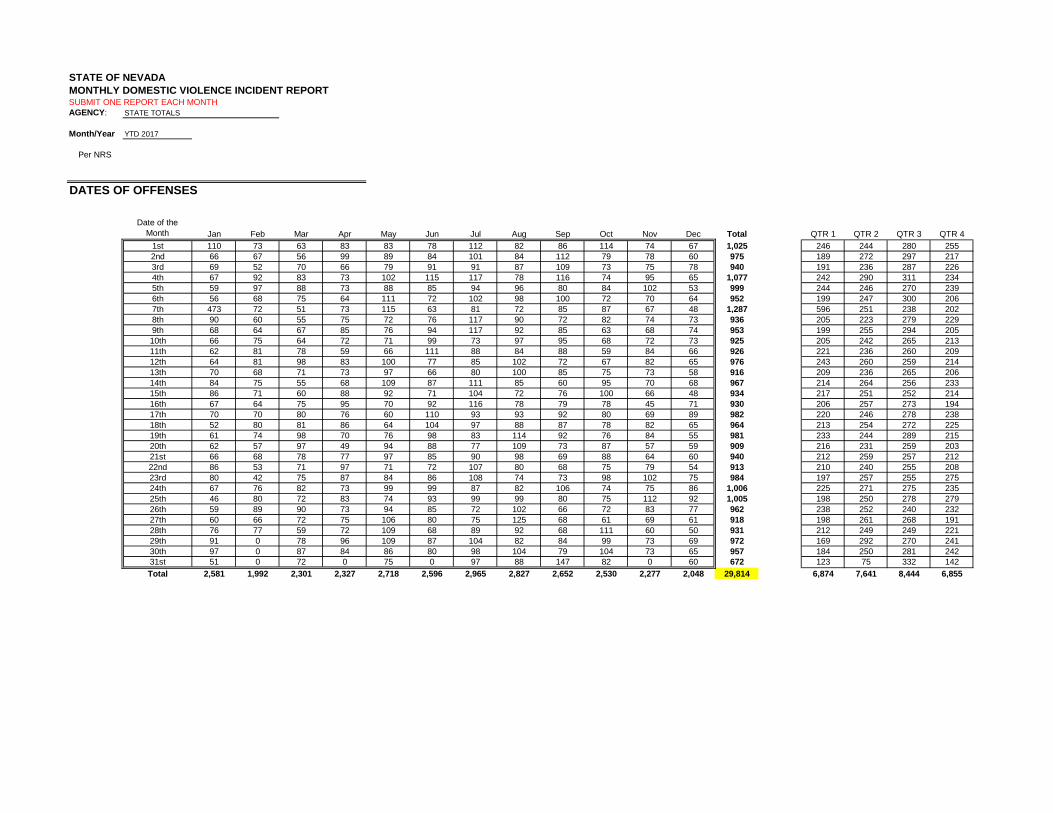
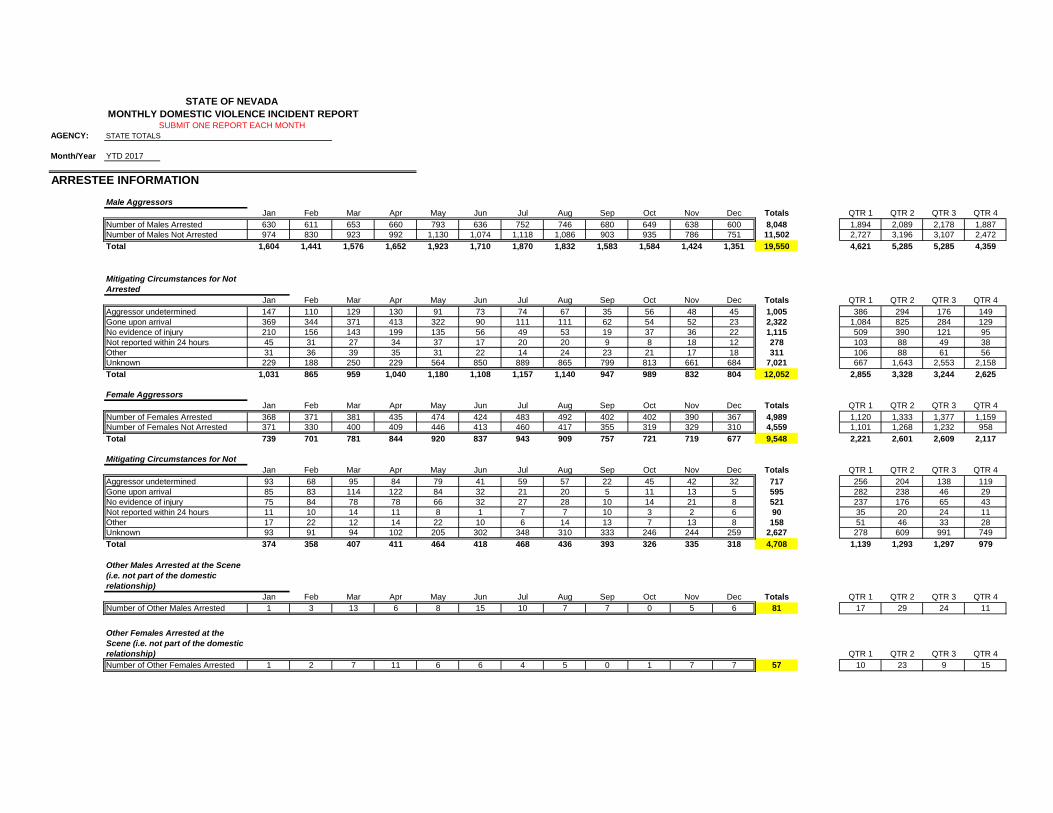
STATE OF NEVADA
MONTHLY DOMESTIC VIOLENCE INCIDENT REPORTSUBMIT ONE REPORT EACH MONTH AGENCY: STATE TOTALS
Month/Year YTD 2017
Per NRS
DATES OF OFFENSES
Date of the Month Jan Feb Mar Apr May Jun Jul Aug Sep Oct Nov Dec Total QTR 1 QTR 2 QTR 3 QTR 4
1st 110 73 63 83 83 78 112 82 86 114 74 67 1,025 246 244 280 2552nd 66 67 56 99 89 84 101 84 112 79 78 60 975 189 272 297 2173rd 69 52 70 66 79 91 91 87 109 73 75 78 940 191 236 287 2264th 67 92 83 73 102 115 117 78 116 74 95 65 1,077 242 290 311 2345th 59 97 88 73 88 85 94 96 80 84 102 53 999 244 246 270 2396th 56 68 75 64 111 72 102 98 100 72 70 64 952 199 247 300 2067th 473 72 51 73 115 63 81 72 85 87 67 48 1,287 596 251 238 2028th 90 60 55 75 72 76 117 90 72 82 74 73 936 205 223 279 2299th 68 64 67 85 76 94 117 92 85 63 68 74 953 199 255 294 20510th 66 75 64 72 71 99 73 97 95 68 72 73 925 205 242 265 21311th 62 81 78 59 66 111 88 84 88 59 84 66 926 221 236 260 20912th 64 81 98 83 100 77 85 102 72 67 82 65 976 243 260 259 21413th 70 68 71 73 97 66 80 100 85 75 73 58 916 209 236 265 20614th 84 75 55 68 109 87 111 85 60 95 70 68 967 214 264 256 23315th 86 71 60 88 92 71 104 72 76 100 66 48 934 217 251 252 21416th 67 64 75 95 70 92 116 78 79 78 45 71 930 206 257 273 19417th 70 70 80 76 60 110 93 93 92 80 69 89 982 220 246 278 23818th 52 80 81 86 64 104 97 88 87 78 82 65 964 213 254 272 22519th 61 74 98 70 76 98 83 114 92 76 84 55 981 233 244 289 21520th 62 57 97 49 94 88 77 109 73 87 57 59 909 216 231 259 20321st 66 68 78 77 97 85 90 98 69 88 64 60 940 212 259 257 21222nd 86 53 71 97 71 72 107 80 68 75 79 54 913 210 240 255 20823rd 80 42 75 87 84 86 108 74 73 98 102 75 984 197 257 255 27524th 67 76 82 73 99 99 87 82 106 74 75 86 1,006 225 271 275 23525th 46 80 72 83 74 93 99 99 80 75 112 92 1,005 198 250 278 27926th 59 89 90 73 94 85 72 102 66 72 83 77 962 238 252 240 23227th 60 66 72 75 106 80 75 125 68 61 69 61 918 198 261 268 19128th 76 77 59 72 109 68 89 92 68 111 60 50 931 212 249 249 22129th 91 0 78 96 109 87 104 82 84 99 73 69 972 169 292 270 24130th 97 0 87 84 86 80 98 104 79 104 73 65 957 184 250 281 24231st 51 0 72 0 75 0 97 88 147 82 0 60 672 123 75 332 142Total 2,581 1,992 2,301 2,327 2,718 2,596 2,965 2,827 2,652 2,530 2,277 2,048 29,814 6,874 7,641 8,444 6,855
AGENCY:
Month/Year YTD 2017
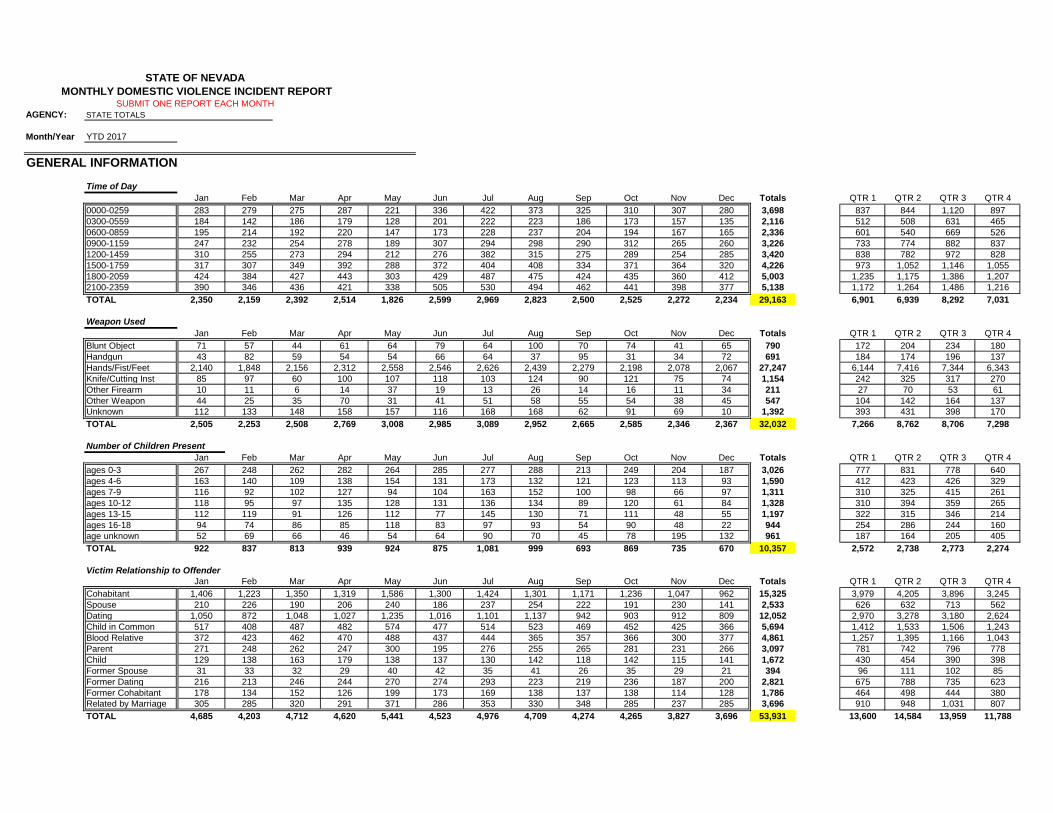
GENERAL INFORMATION
Time of DayJan Feb Mar Apr May Jun Jul Aug Sep Oct Nov Dec Totals QTR 1 QTR 2 QTR 3 QTR 4
0000-0259 283 279 275 287 221 336 422 373 325 310 307 280 3,698 837 844 1,120 8970300-0559 184 142 186 179 128 201 222 223 186 173 157 135 2,116 512 508 631 4650600-0859 195 214 192 220 147 173 228 237 204 194 167 165 2,336 601 540 669 5260900-1159 247 232 254 278 189 307 294 298 290 312 265 260 3,226 733 774 882 8371200-1459 310 255 273 294 212 276 382 315 275 289 254 285 3,420 838 782 972 8281500-1759 317 307 349 392 288 372 404 408 334 371 364 320 4,226 973 1,052 1,146 1,0551800-2059 424 384 427 443 303 429 487 475 424 435 360 412 5,003 1,235 1,175 1,386 1,2072100-2359 390 346 436 421 338 505 530 494 462 441 398 377 5,138 1,172 1,264 1,486 1,216TOTAL 2,350 2,159 2,392 2,514 1,826 2,599 2,969 2,823 2,500 2,525 2,272 2,234 29,163 6,901 6,939 8,292 7,031
Weapon UsedJan Feb Mar Apr May Jun Jul Aug Sep Oct Nov Dec Totals QTR 1 QTR 2 QTR 3 QTR 4
Blunt Object 71 57 44 61 64 79 64 100 70 74 41 65 790 172 204 234 180Handgun 43 82 59 54 54 66 64 37 95 31 34 72 691 184 174 196 137Hands/Fist/Feet 2,140 1,848 2,156 2,312 2,558 2,546 2,626 2,439 2,279 2,198 2,078 2,067 27,247 6,144 7,416 7,344 6,343Knife/Cutting Inst 85 97 60 100 107 118 103 124 90 121 75 74 1,154 242 325 317 270Other Firearm 10 11 6 14 37 19 13 26 14 16 11 34 211 27 70 53 61Other Weapon 44 25 35 70 31 41 51 58 55 54 38 45 547 104 142 164 137Unknown 112 133 148 158 157 116 168 168 62 91 69 10 1,392 393 431 398 170TOTAL 2,505 2,253 2,508 2,769 3,008 2,985 3,089 2,952 2,665 2,585 2,346 2,367 32,032 7,266 8,762 8,706 7,298
Number of Children PresentJan Feb Mar Apr May Jun Jul Aug Sep Oct Nov Dec Totals QTR 1 QTR 2 QTR 3 QTR 4
ages 0-3 267 248 262 282 264 285 277 288 213 249 204 187 3,026 777 831 778 640ages 4-6 163 140 109 138 154 131 173 132 121 123 113 93 1,590 412 423 426 329ages 7-9 116 92 102 127 94 104 163 152 100 98 66 97 1,311 310 325 415 261ages 10-12 118 95 97 135 128 131 136 134 89 120 61 84 1,328 310 394 359 265ages 13-15 112 119 91 126 112 77 145 130 71 111 48 55 1,197 322 315 346 214ages 16-18 94 74 86 85 118 83 97 93 54 90 48 22 944 254 286 244 160age unknown 52 69 66 46 54 64 90 70 45 78 195 132 961 187 164 205 405TOTAL 922 837 813 939 924 875 1,081 999 693 869 735 670 10,357 2,572 2,738 2,773 2,274
Victim Relationship to OffenderJan Feb Mar Apr May Jun Jul Aug Sep Oct Nov Dec Totals QTR 1 QTR 2 QTR 3 QTR 4
Cohabitant 1,406 1,223 1,350 1,319 1,586 1,300 1,424 1,301 1,171 1,236 1,047 962 15,325 3,979 4,205 3,896 3,245Spouse 210 226 190 206 240 186 237 254 222 191 230 141 2,533 626 632 713 562Dating 1,050 872 1,048 1,027 1,235 1,016 1,101 1,137 942 903 912 809 12,052 2,970 3,278 3,180 2,624Child in Common 517 408 487 482 574 477 514 523 469 452 425 366 5,694 1,412 1,533 1,506 1,243Blood Relative 372 423 462 470 488 437 444 365 357 366 300 377 4,861 1,257 1,395 1,166 1,043Parent 271 248 262 247 300 195 276 255 265 281 231 266 3,097 781 742 796 778Child 129 138 163 179 138 137 130 142 118 142 115 141 1,672 430 454 390 398Former Spouse 31 33 32 29 40 42 35 41 26 35 29 21 394 96 111 102 85Former Dating 216 213 246 244 270 274 293 223 219 236 187 200 2,821 675 788 735 623Former Cohabitant 178 134 152 126 199 173 169 138 137 138 114 128 1,786 464 498 444 380Related by Marriage 305 285 320 291 371 286 353 330 348 285 237 285 3,696 910 948 1,031 807TOTAL 4,685 4,203 4,712 4,620 5,441 4,523 4,976 4,709 4,274 4,265 3,827 3,696 53,931 13,600 14,584 13,959 11,788
STATE OF NEVADA
MONTHLY DOMESTIC VIOLENCE INCIDENT REPORTSUBMIT ONE REPORT EACH MONTH
STATE TOTALS

STATE OF NEVADA
MONTHLY DOMESTIC VIOLENCE INCIDENT REPORTSUBMIT ONE REPORT EACH MONTH AGENCY: STATE TOTALS
Month/Year YTD 2017
OFFENDER INFORMATION
MALE OffendersAge Jan Feb Mar Apr May Jun Jul Aug Sep Oct Nov Dec Totals QTR 1 QTR 2 QTR 3 QTR 4
Under 18 92 108 129 86 128 105 106 88 134 124 83 115 1,298 329 319 328 32218-24 326 250 323 315 364 272 370 346 257 270 259 240 3,592 899 951 973 76925-34 569 531 529 598 685 604 672 664 528 548 481 495 6,904 1,629 1,887 1,864 1,52435-44 354 323 303 368 416 367 412 402 323 401 360 334 4,363 980 1,151 1,137 1,09545-54 224 177 228 230 268 246 275 261 186 213 197 177 2,682 629 744 722 58755-64 109 87 90 98 128 124 121 122 107 118 91 91 1,286 286 350 350 30065 over 26 38 47 38 42 27 54 40 24 35 40 25 436 111 107 118 100Unknown 14 12 11 12 21 10 16 12 8 9 2 9 136 37 43 36 20TOTAL 1,714 1,526 1,660 1,745 2,052 1,755 2,026 1,935 1,567 1,718 1,513 1,486 20,697 4,900 5,552 5,528 4,717
Race Jan Feb Mar Apr May Jun Jul Aug Sep Oct Nov Dec Totals QTR 1 QTR 2 QTR 3 QTR 4White 1,006 927 955 1,014 1,226 1,046 1,194 1,146 894 1,067 898 869 12,242 2,888 3,286 3,234 2,834Black 598 501 598 619 696 572 696 670 572 540 508 524 7,094 1,697 1,887 1,938 1,572Am Indian 16 9 14 11 22 19 16 20 16 20 14 15 192 39 52 52 49Asian 42 39 42 52 48 57 48 46 51 51 55 49 580 123 157 145 155Native Alaskan/Pac. Islander 16 2 6 4 4 6 9 5 5 5 8 1 71 24 14 19 14Unknown 45 48 45 45 56 55 61 47 29 35 31 28 525 138 156 137 94Total 1,723 1,526 1,660 1,745 2,052 1,755 2,024 1,934 1,567 1,718 1,514 1,486 20,704 4,909 5,552 5,525 4,718
Injuries Jan Feb Mar Apr May Jun Jul Aug Sep Oct Nov Dec Totals QTR 1 QTR 2 QTR 3 QTR 4Minor 277 258 261 279 331 313 332 306 268 251 237 221 3,334 796 923 906 709Moderate 15 19 22 43 20 21 49 20 19 16 21 13 278 56 84 88 50No Visible 727 618 656 697 850 742 747 745 619 614 528 557 8,100 2,001 2,289 2,111 1,699Severe 3 10 6 5 6 5 3 1 3 4 8 3 57 19 16 7 15
Medical Jan Feb Mar Apr May Jun Jul Aug Sep Oct Nov Dec Totals QTR 1 QTR 2 QTR 3 QTR 41st Aid 91 38 40 41 56 106 97 49 38 50 39 36 681 169 203 184 125Hospital 37 25 35 47 52 44 43 45 35 38 34 27 462 97 143 123 99None 1,048 938 1,070 1,113 1,337 1,168 1,263 1,279 1,023 1,091 991 975 13,296 3,056 3,618 3,565 3,057Refused 323 275 276 294 311 328 338 282 265 244 189 211 3,336 874 933 885 644
Alcohol/Drug Use Suspected 1,125 976 1,033 1,095 1,296 1,220 1,291 1,234 979 1,065 948 942 13,204 3,134 3,611 3,504 2,955DV Card Given 696 631 666 685 781 664 784 781 578 710 548 507 8,031 1,993 2,130 2,143 1,765PO in Effect 15 18 11 16 24 29 15 14 11 24 12 12 201 44 69 40 48Arrested 167 125 135 123 132 112 154 151 117 93 97 38 1,444 427 367 422 228None 35 37 36 54 139 48 57 58 61 51 53 55 684 108 241 176 159
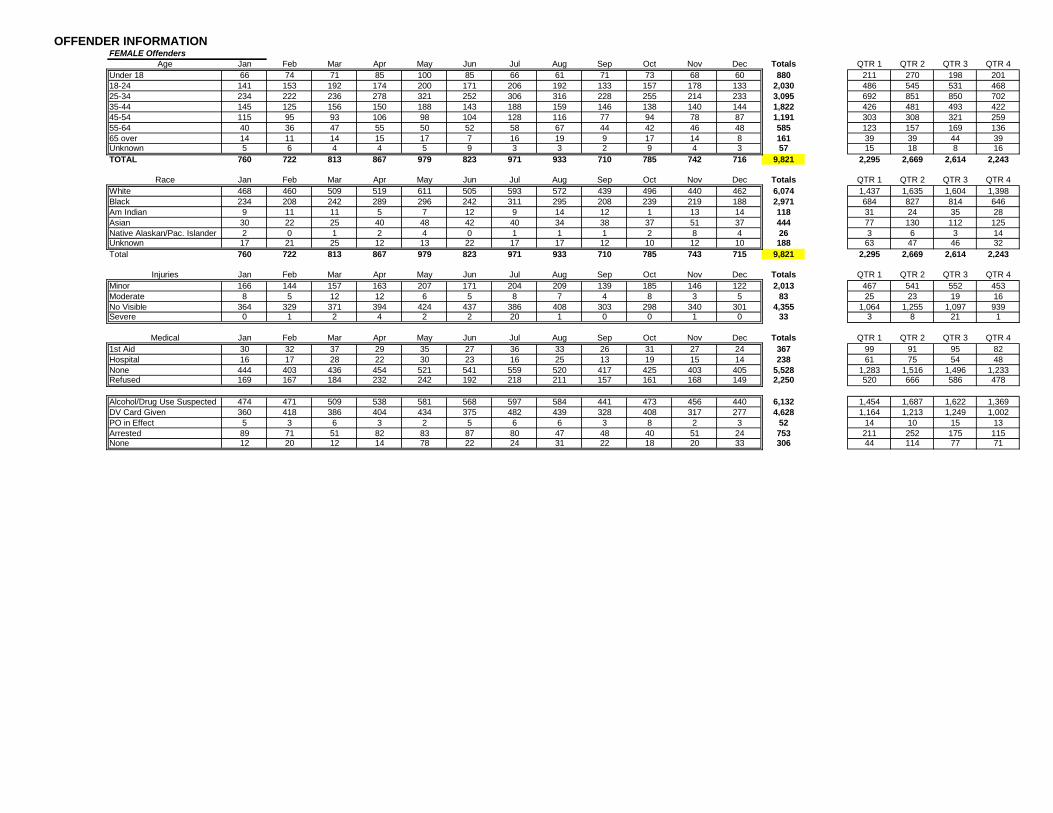
OFFENDER INFORMATIONFEMALE Offenders
Age Jan Feb Mar Apr May Jun Jul Aug Sep Oct Nov Dec Totals QTR 1 QTR 2 QTR 3 QTR 4Under 18 66 74 71 85 100 85 66 61 71 73 68 60 880 211 270 198 20118-24 141 153 192 174 200 171 206 192 133 157 178 133 2,030 486 545 531 46825-34 234 222 236 278 321 252 306 316 228 255 214 233 3,095 692 851 850 70235-44 145 125 156 150 188 143 188 159 146 138 140 144 1,822 426 481 493 42245-54 115 95 93 106 98 104 128 116 77 94 78 87 1,191 303 308 321 25955-64 40 36 47 55 50 52 58 67 44 42 46 48 585 123 157 169 13665 over 14 11 14 15 17 7 16 19 9 17 14 8 161 39 39 44 39Unknown 5 6 4 4 5 9 3 3 2 9 4 3 57 15 18 8 16TOTAL 760 722 813 867 979 823 971 933 710 785 742 716 9,821 2,295 2,669 2,614 2,243
Race Jan Feb Mar Apr May Jun Jul Aug Sep Oct Nov Dec Totals QTR 1 QTR 2 QTR 3 QTR 4White 468 460 509 519 611 505 593 572 439 496 440 462 6,074 1,437 1,635 1,604 1,398Black 234 208 242 289 296 242 311 295 208 239 219 188 2,971 684 827 814 646Am Indian 9 11 11 5 7 12 9 14 12 1 13 14 118 31 24 35 28Asian 30 22 25 40 48 42 40 34 38 37 51 37 444 77 130 112 125Native Alaskan/Pac. Islander 2 0 1 2 4 0 1 1 1 2 8 4 26 3 6 3 14Unknown 17 21 25 12 13 22 17 17 12 10 12 10 188 63 47 46 32Total 760 722 813 867 979 823 971 933 710 785 743 715 9,821 2,295 2,669 2,614 2,243
Injuries Jan Feb Mar Apr May Jun Jul Aug Sep Oct Nov Dec Totals QTR 1 QTR 2 QTR 3 QTR 4Minor 166 144 157 163 207 171 204 209 139 185 146 122 2,013 467 541 552 453Moderate 8 5 12 12 6 5 8 7 4 8 3 5 83 25 23 19 16No Visible 364 329 371 394 424 437 386 408 303 298 340 301 4,355 1,064 1,255 1,097 939Severe 0 1 2 4 2 2 20 1 0 0 1 0 33 3 8 21 1
Medical Jan Feb Mar Apr May Jun Jul Aug Sep Oct Nov Dec Totals QTR 1 QTR 2 QTR 3 QTR 41st Aid 30 32 37 29 35 27 36 33 26 31 27 24 367 99 91 95 82Hospital 16 17 28 22 30 23 16 25 13 19 15 14 238 61 75 54 48None 444 403 436 454 521 541 559 520 417 425 403 405 5,528 1,283 1,516 1,496 1,233Refused 169 167 184 232 242 192 218 211 157 161 168 149 2,250 520 666 586 478
Alcohol/Drug Use Suspected 474 471 509 538 581 568 597 584 441 473 456 440 6,132 1,454 1,687 1,622 1,369DV Card Given 360 418 386 404 434 375 482 439 328 408 317 277 4,628 1,164 1,213 1,249 1,002PO in Effect 5 3 6 3 2 5 6 6 3 8 2 3 52 14 10 15 13Arrested 89 71 51 82 83 87 80 47 48 40 51 24 753 211 252 175 115None 12 20 12 14 78 22 24 31 22 18 20 33 306 44 114 77 71
STATE OF NEVADA
MONTHLY DOMESTIC VIOLENCE INCIDENT REPORTSUBMIT ONE REPORT EACH MONTH AGENCY: STATE TOTALS
Month/Year YTD 2017
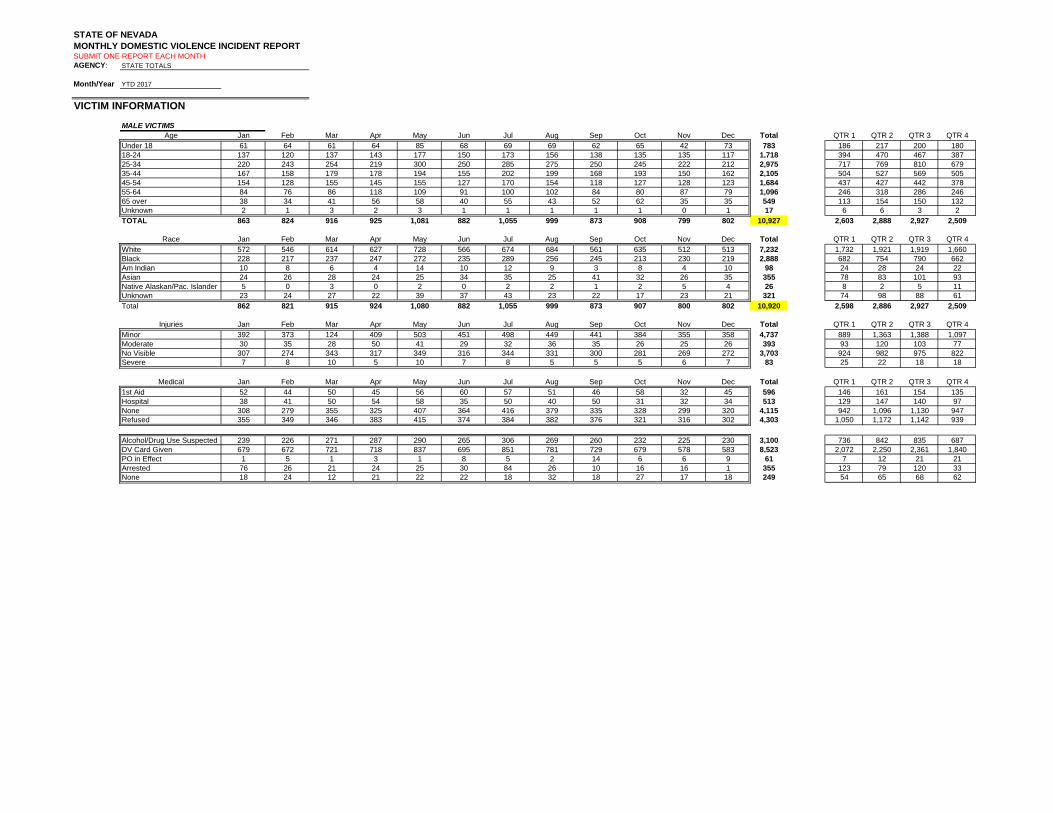
VICTIM INFORMATION
MALE VICTIMSAge Jan Feb Mar Apr May Jun Jul Aug Sep Oct Nov Dec Total QTR 1 QTR 2 QTR 3 QTR 4
Under 18 61 64 61 64 85 68 69 69 62 65 42 73 783 186 217 200 18018-24 137 120 137 143 177 150 173 156 138 135 135 117 1,718 394 470 467 38725-34 220 243 254 219 300 250 285 275 250 245 222 212 2,975 717 769 810 67935-44 167 158 179 178 194 155 202 199 168 193 150 162 2,105 504 527 569 50545-54 154 128 155 145 155 127 170 154 118 127 128 123 1,684 437 427 442 37855-64 84 76 86 118 109 91 100 102 84 80 87 79 1,096 246 318 286 24665 over 38 34 41 56 58 40 55 43 52 62 35 35 549 113 154 150 132Unknown 2 1 3 2 3 1 1 1 1 1 0 1 17 6 6 3 2TOTAL 863 824 916 925 1,081 882 1,055 999 873 908 799 802 10,927 2,603 2,888 2,927 2,509
Race Jan Feb Mar Apr May Jun Jul Aug Sep Oct Nov Dec Total QTR 1 QTR 2 QTR 3 QTR 4White 572 546 614 627 728 566 674 684 561 635 512 513 7,232 1,732 1,921 1,919 1,660Black 228 217 237 247 272 235 289 256 245 213 230 219 2,888 682 754 790 662Am Indian 10 8 6 4 14 10 12 9 3 8 4 10 98 24 28 24 22Asian 24 26 28 24 25 34 35 25 41 32 26 35 355 78 83 101 93Native Alaskan/Pac. Islander 5 0 3 0 2 0 2 2 1 2 5 4 26 8 2 5 11Unknown 23 24 27 22 39 37 43 23 22 17 23 21 321 74 98 88 61Total 862 821 915 924 1,080 882 1,055 999 873 907 800 802 10,920 2,598 2,886 2,927 2,509
Injuries Jan Feb Mar Apr May Jun Jul Aug Sep Oct Nov Dec Total QTR 1 QTR 2 QTR 3 QTR 4Minor 392 373 124 409 503 451 498 449 441 384 355 358 4,737 889 1,363 1,388 1,097Moderate 30 35 28 50 41 29 32 36 35 26 25 26 393 93 120 103 77No Visible 307 274 343 317 349 316 344 331 300 281 269 272 3,703 924 982 975 822Severe 7 8 10 5 10 7 8 5 5 5 6 7 83 25 22 18 18
Medical Jan Feb Mar Apr May Jun Jul Aug Sep Oct Nov Dec Total QTR 1 QTR 2 QTR 3 QTR 41st Aid 52 44 50 45 56 60 57 51 46 58 32 45 596 146 161 154 135Hospital 38 41 50 54 58 35 50 40 50 31 32 34 513 129 147 140 97None 308 279 355 325 407 364 416 379 335 328 299 320 4,115 942 1,096 1,130 947Refused 355 349 346 383 415 374 384 382 376 321 316 302 4,303 1,050 1,172 1,142 939
Alcohol/Drug Use Suspected 239 226 271 287 290 265 306 269 260 232 225 230 3,100 736 842 835 687DV Card Given 679 672 721 718 837 695 851 781 729 679 578 583 8,523 2,072 2,250 2,361 1,840PO in Effect 1 5 1 3 1 8 5 2 14 6 6 9 61 7 12 21 21Arrested 76 26 21 24 25 30 84 26 10 16 16 1 355 123 79 120 33None 18 24 12 21 22 22 18 32 18 27 17 18 249 54 65 68 62
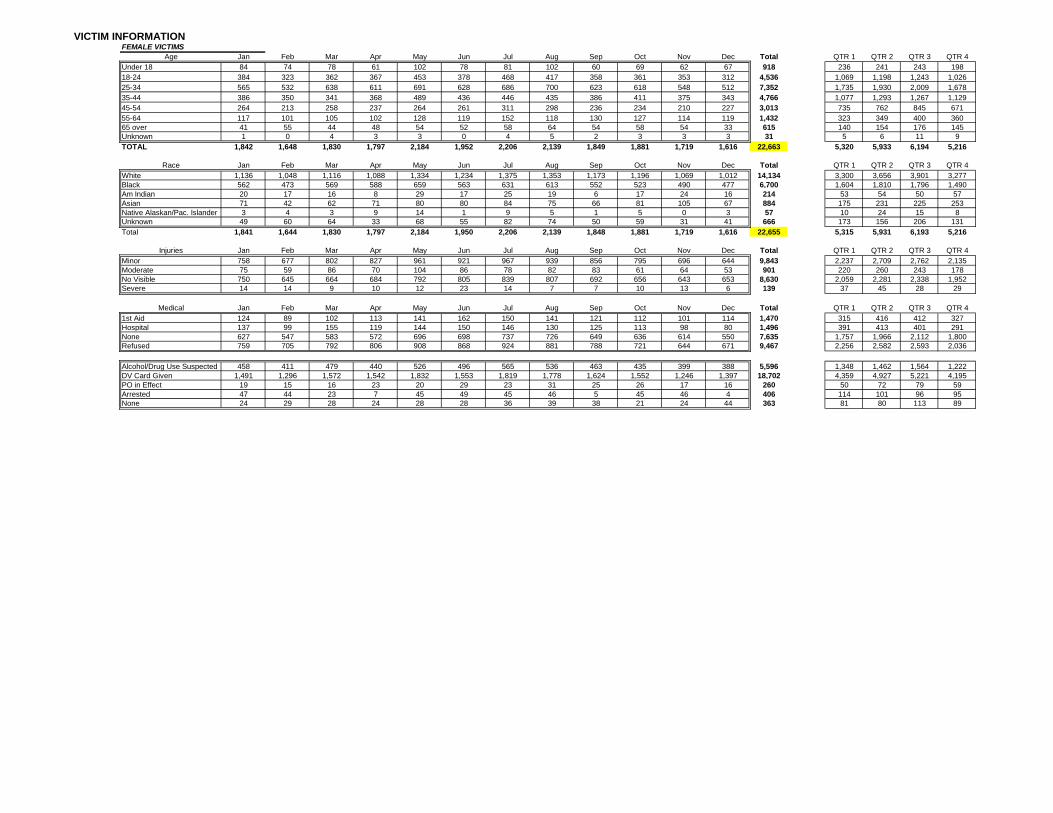
VICTIM INFORMATIONFEMALE VICTIMS
Age Jan Feb Mar Apr May Jun Jul Aug Sep Oct Nov Dec Total QTR 1 QTR 2 QTR 3 QTR 4Under 18 84 74 78 61 102 78 81 102 60 69 62 67 918 236 241 243 19818-24 384 323 362 367 453 378 468 417 358 361 353 312 4,536 1,069 1,198 1,243 1,02625-34 565 532 638 611 691 628 686 700 623 618 548 512 7,352 1,735 1,930 2,009 1,67835-44 386 350 341 368 489 436 446 435 386 411 375 343 4,766 1,077 1,293 1,267 1,12945-54 264 213 258 237 264 261 311 298 236 234 210 227 3,013 735 762 845 67155-64 117 101 105 102 128 119 152 118 130 127 114 119 1,432 323 349 400 36065 over 41 55 44 48 54 52 58 64 54 58 54 33 615 140 154 176 145Unknown 1 0 4 3 3 0 4 5 2 3 3 3 31 5 6 11 9TOTAL 1,842 1,648 1,830 1,797 2,184 1,952 2,206 2,139 1,849 1,881 1,719 1,616 22,663 5,320 5,933 6,194 5,216
Race Jan Feb Mar Apr May Jun Jul Aug Sep Oct Nov Dec Total QTR 1 QTR 2 QTR 3 QTR 4White 1,136 1,048 1,116 1,088 1,334 1,234 1,375 1,353 1,173 1,196 1,069 1,012 14,134 3,300 3,656 3,901 3,277Black 562 473 569 588 659 563 631 613 552 523 490 477 6,700 1,604 1,810 1,796 1,490Am Indian 20 17 16 8 29 17 25 19 6 17 24 16 214 53 54 50 57Asian 71 42 62 71 80 80 84 75 66 81 105 67 884 175 231 225 253Native Alaskan/Pac. Islander 3 4 3 9 14 1 9 5 1 5 0 3 57 10 24 15 8Unknown 49 60 64 33 68 55 82 74 50 59 31 41 666 173 156 206 131Total 1,841 1,644 1,830 1,797 2,184 1,950 2,206 2,139 1,848 1,881 1,719 1,616 22,655 5,315 5,931 6,193 5,216
Injuries Jan Feb Mar Apr May Jun Jul Aug Sep Oct Nov Dec Total QTR 1 QTR 2 QTR 3 QTR 4Minor 758 677 802 827 961 921 967 939 856 795 696 644 9,843 2,237 2,709 2,762 2,135Moderate 75 59 86 70 104 86 78 82 83 61 64 53 901 220 260 243 178No Visible 750 645 664 684 792 805 839 807 692 656 643 653 8,630 2,059 2,281 2,338 1,952Severe 14 14 9 10 12 23 14 7 7 10 13 6 139 37 45 28 29
Medical Jan Feb Mar Apr May Jun Jul Aug Sep Oct Nov Dec Total QTR 1 QTR 2 QTR 3 QTR 41st Aid 124 89 102 113 141 162 150 141 121 112 101 114 1,470 315 416 412 327Hospital 137 99 155 119 144 150 146 130 125 113 98 80 1,496 391 413 401 291None 627 547 583 572 696 698 737 726 649 636 614 550 7,635 1,757 1,966 2,112 1,800Refused 759 705 792 806 908 868 924 881 788 721 644 671 9,467 2,256 2,582 2,593 2,036
Alcohol/Drug Use Suspected 458 411 479 440 526 496 565 536 463 435 399 388 5,596 1,348 1,462 1,564 1,222DV Card Given 1,491 1,296 1,572 1,542 1,832 1,553 1,819 1,778 1,624 1,552 1,246 1,397 18,702 4,359 4,927 5,221 4,195PO in Effect 19 15 16 23 20 29 23 31 25 26 17 16 260 50 72 79 59Arrested 47 44 23 7 45 49 45 46 5 45 46 4 406 114 101 96 95None 24 29 28 24 28 28 36 39 38 21 24 44 363 81 80 113 89
AGENCY:
Month/Year YTD 2017
ARRESTEE INFORMATION
Jan Feb Mar Apr May Jun Jul Aug Sep Oct Nov Dec Totals QTR 1 QTR 2 QTR 3 QTR 4Number of Males Arrested 630 611 653 660 793 636 752 746 680 649 638 600 8,048 1,894 2,089 2,178 1,887Number of Males Not Arrested 974 830 923 992 1,130 1,074 1,118 1,086 903 935 786 751 11,502 2,727 3,196 3,107 2,472
1,604 1,441 1,576 1,652 1,923 1,710 1,870 1,832 1,583 1,584 1,424 1,351 19,550 4,621 5,285 5,285 4,359
Jan Feb Mar Apr May Jun Jul Aug Sep Oct Nov Dec Totals QTR 1 QTR 2 QTR 3 QTR 4Aggressor undetermined 147 110 129 130 91 73 74 67 35 56 48 45 1,005 386 294 176 149Gone upon arrival 369 344 371 413 322 90 111 111 62 54 52 23 2,322 1,084 825 284 129No evidence of injury 210 156 143 199 135 56 49 53 19 37 36 22 1,115 509 390 121 95Not reported within 24 hours 45 31 27 34 37 17 20 20 9 8 18 12 278 103 88 49 38
31 36 39 35 31 22 14 24 23 21 17 18 311 106 88 61 56229 188 250 229 564 850 889 865 799 813 661 684 7,021 667 1,643 2,553 2,158
1,031 865 959 1,040 1,180 1,108 1,157 1,140 947 989 832 804 12,052 2,855 3,328 3,244 2,625
Female AggressorsJan Feb Mar Apr May Jun Jul Aug Sep Oct Nov Dec Totals QTR 1 QTR 2 QTR 3 QTR 4
Number of Females Arrested 368 371 381 435 474 424 483 492 402 402 390 367 4,989 1,120 1,333 1,377 1,159Number of Females Not Arrested 371 330 400 409 446 413 460 417 355 319 329 310 4,559 1,101 1,268 1,232 958
739 701 781 844 920 837 943 909 757 721 719 677 9,548 2,221 2,601 2,609 2,117
Jan Feb Mar Apr May Jun Jul Aug Sep Oct Nov Dec Totals QTR 1 QTR 2 QTR 3 QTR 4Aggressor undetermined 93 68 95 84 79 41 59 57 22 45 42 32 717 256 204 138 119Gone upon arrival 85 83 114 122 84 32 21 20 5 11 13 5 595 282 238 46 29No evidence of injury 75 84 78 78 66 32 27 28 10 14 21 8 521 237 176 65 43Not reported within 24 hours 11 10 14 11 8 1 7 7 10 3 2 6 90 35 20 24 11
17 22 12 14 22 10 6 14 13 7 13 8 158 51 46 33 2893 91 94 102 205 302 348 310 333 246 244 259 2,627 278 609 991 749374 358 407 411 464 418 468 436 393 326 335 318 4,708 1,139 1,293 1,297 979
Jan Feb Mar Apr May Jun Jul Aug Sep Oct Nov Dec Totals QTR 1 QTR 2 QTR 3 QTR 4Number of Other Males Arrested 1 3 13 6 8 15 10 7 7 0 5 6 81 17 29 24 11
QTR 1 QTR 2 QTR 3 QTR 4Number of Other Females Arrested 1 2 7 11 6 6 4 5 0 1 7 7 57 10 23 9 15
Mitigating Circumstances for Not Arrested
Other Males Arrested at the Scene (i.e. not part of the domestic relationship)
STATE TOTALS
Male Aggressors
Other
Mitigating Circumstances for Not
Total
Other
STATE OF NEVADA
MONTHLY DOMESTIC VIOLENCE INCIDENT REPORTSUBMIT ONE REPORT EACH MONTH
UnknownTotal
Other Females Arrested at the Scene (i.e. not part of the domestic relationship)
Total
UnknownTotal
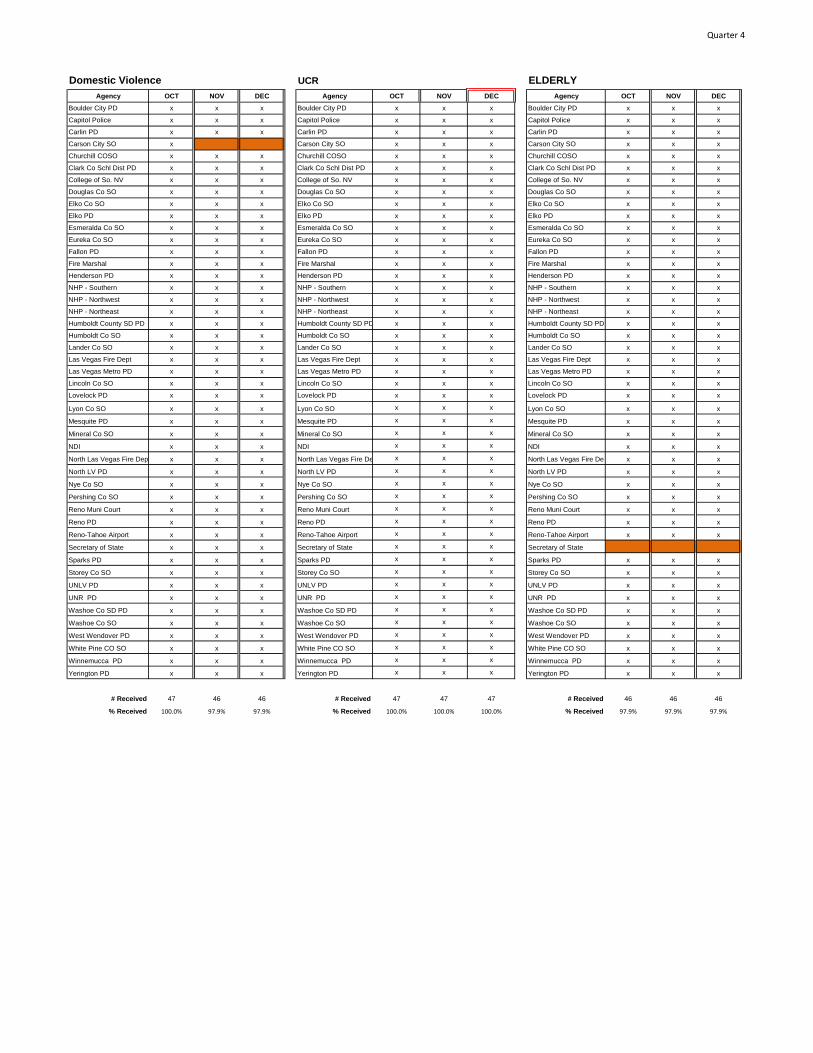
Quarter 4
Domestic Violence UCR ELDERLY
Agency OCT NOV DEC Agency OCT NOV DEC Agency OCT NOV DEC
Boulder City PD x x x Boulder City PD x x x Boulder City PD x x x
Capitol Police x x x Capitol Police x x x Capitol Police x x x
Carlin PD x x x Carlin PD x x x Carlin PD x x x
Carson City SO x Carson City SO x x x Carson City SO x x x
Churchill COSO x x x Churchill COSO x x x Churchill COSO x x x
Clark Co Schl Dist PD x x x Clark Co Schl Dist PD x x x Clark Co Schl Dist PD x x x
College of So. NV x x x College of So. NV x x x College of So. NV x x x
Douglas Co SO x x x Douglas Co SO x x x Douglas Co SO x x x
Elko Co SO x x x Elko Co SO x x x Elko Co SO x x x
Elko PD x x x Elko PD x x x Elko PD x x x
Esmeralda Co SO x x x Esmeralda Co SO x x x Esmeralda Co SO x x x
Eureka Co SO x x x Eureka Co SO x x x Eureka Co SO x x x
Fallon PD x x x Fallon PD x x x Fallon PD x x x
Fire Marshal x x x Fire Marshal x x x Fire Marshal x x x
Henderson PD x x x Henderson PD x x x Henderson PD x x x
NHP - Southern x x x NHP - Southern x x x NHP - Southern x x x
NHP - Northwest x x x NHP - Northwest x x x NHP - Northwest x x x
NHP - Northeast x x x NHP - Northeast x x x NHP - Northeast x x x
Humboldt County SD PD x x x Humboldt County SD PD x x x Humboldt County SD PD x x x
Humboldt Co SO x x x Humboldt Co SO x x x Humboldt Co SO x x x
Lander Co SO x x x Lander Co SO x x x Lander Co SO x x x
Las Vegas Fire Dept x x x Las Vegas Fire Dept x x x Las Vegas Fire Dept x x x
Las Vegas Metro PD x x x Las Vegas Metro PD x x x Las Vegas Metro PD x x x
Lincoln Co SO x x x Lincoln Co SO x x x Lincoln Co SO x x x
Lovelock PD x x x Lovelock PD x x x Lovelock PD x x x
Lyon Co SO x x x Lyon Co SO x x x Lyon Co SO x x x
Mesquite PD x x x Mesquite PD x x x Mesquite PD x x x
Mineral Co SO x x x Mineral Co SO x x x Mineral Co SO x x x
NDI x x x NDI x x x NDI x x x
North Las Vegas Fire Dep x x x North Las Vegas Fire De x x x North Las Vegas Fire Dep x x x
North LV PD x x x North LV PD x x x North LV PD x x x
Nye Co SO x x x Nye Co SO x x x Nye Co SO x x x
Pershing Co SO x x x Pershing Co SO x x x Pershing Co SO x x x
Reno Muni Court x x x Reno Muni Court x x x Reno Muni Court x x x
Reno PD x x x Reno PD x x x Reno PD x x x
Reno-Tahoe Airport x x x Reno-Tahoe Airport x x x Reno-Tahoe Airport x x x
Secretary of State x x x Secretary of State x x x Secretary of State
Sparks PD x x x Sparks PD x x x Sparks PD x x x
Storey Co SO x x x Storey Co SO x x x Storey Co SO x x x
UNLV PD x x x UNLV PD x x x UNLV PD x x x
UNR PD x x x UNR PD x x x UNR PD x x x
Washoe Co SD PD x x x Washoe Co SD PD x x x Washoe Co SD PD x x x
Washoe Co SO x x x Washoe Co SO x x x Washoe Co SO x x x
West Wendover PD x x x West Wendover PD x x x West Wendover PD x x x
White Pine CO SO x x x White Pine CO SO x x x White Pine CO SO x x x
Winnemucca PD x x x Winnemucca PD x x x Winnemucca PD x x x
Yerington PD x x x Yerington PD x x x Yerington PD x x x
# Received 47 46 46 # Received 47 47 47 # Received 46 46 46
% Received 100.0% 97.9% 97.9% % Received 100.0% 100.0% 100.0% % Received 97.9% 97.9% 97.9%

Quarter 3
Domestic Violence UCR ELDERLY
Agency JULY AUG SEPT Agency JULY AUG SEPT Agency JULY AUG SEPT
Boulder City PD x x x Boulder City PD x x x Boulder City PD x x x
Capitol Police x x x Capitol Police x x x Capitol Police x x x
Carlin PD x x x Carlin PD x x x Carlin PD x x x
Carson City SO x x Carson City SO x x x Carson City SO x x x
Churchill COSO x x x Churchill COSO x x x Churchill COSO x x x
Clark Co Schl Dist PD x x x Clark Co Schl Dist PD x x x Clark Co Schl Dist PD x x x
College of So. NV x x x College of So. NV x x x College of So. NV x x x
Douglas Co SO x x x Douglas Co SO x x x Douglas Co SO x x x
Elko Co SO x x x Elko Co SO x x x Elko Co SO x x x
Elko PD x x x Elko PD x x x Elko PD x x x
Esmeralda Co SO x x x Esmeralda Co SO x x x Esmeralda Co SO x x x
Eureka Co SO x x x Eureka Co SO x x x Eureka Co SO x x x
Fallon PD x x x Fallon PD x x x Fallon PD x x x
Fire Marshal x x x Fire Marshal x x x Fire Marshal x x x
Henderson PD x x x Henderson PD x x x Henderson PD x x x
NHP - Southern x x x NHP - Southern x x x NHP - Southern x x x
NHP - Northwest x x x NHP - Northwest x x x NHP - Northwest x x x
NHP - Northeast x x x NHP - Northeast x x x NHP - Northeast x x x
Humboldt County SD PD x x x Humboldt County SD PD x x x Humboldt County SD PD x x x
Humboldt Co SO x x x Humboldt Co SO x x x Humboldt Co SO x x x
Lander Co SO x x x Lander Co SO x x x Lander Co SO x x x
Las Vegas Fire Dept x x x Las Vegas Fire Dept x x x Las Vegas Fire Dept x x x
Las Vegas Metro PD x x x Las Vegas Metro PD x x x Las Vegas Metro PD x x x
Lincoln Co SO x x x Lincoln Co SO x x x Lincoln Co SO x x x
Lovelock PD x x x Lovelock PD x x x Lovelock PD x x x
Lyon Co SO x x x Lyon Co SO x x x Lyon Co SO x x x
Mesquite PD x x x Mesquite PD x x x Mesquite PD x x x
Mineral Co SO x x x Mineral Co SO x x x Mineral Co SO x x x
NDI x x x NDI x x x NDI x x x
North Las Vegas Fire Dep x x x North Las Vegas Fire De x x x North Las Vegas Fire Dep x x x
North LV PD x x x North LV PD x x x North LV PD x x x
Nye Co SO x x x Nye Co SO x x x Nye Co SO x x x
Pershing Co SO x x x Pershing Co SO x x x Pershing Co SO x x x
Reno Muni Court x x x Reno Muni Court x x x Reno Muni Court x x x
Reno PD x x x Reno PD x x x Reno PD x x x
Reno-Tahoe Airport x x x Reno-Tahoe Airport x x x Reno-Tahoe Airport x x x
Secretary of State x x x Secretary of State x x x Secretary of State
Sparks PD x x x Sparks PD x x x Sparks PD x x x
Storey Co SO x x x Storey Co SO x x x Storey Co SO x x x
UNLV PD x x x UNLV PD x x x UNLV PD x x x
UNR PD x x x UNR PD x x x UNR PD x x x
Washoe Co SD PD x x x Washoe Co SD PD x x x Washoe Co SD PD x x x
Washoe Co SO x x x Washoe Co SO x x x Washoe Co SO x x x
West Wendover PD x x x West Wendover PD x x x West Wendover PD x x x
White Pine CO SO x x x White Pine CO SO x x x White Pine CO SO x x x
Winnemucca PD x x x Winnemucca PD x x x Winnemucca PD x x x
Yerington PD x x x Yerington PD x x x Yerington PD x x x
# Received 47 47 46 # Received 47 47 47 # Received 46 46 46
% Received 100.0% 100.0% 97.9% % Received 100.0% 100.0% 100.0% % Received 97.9% 97.9% 97.9%
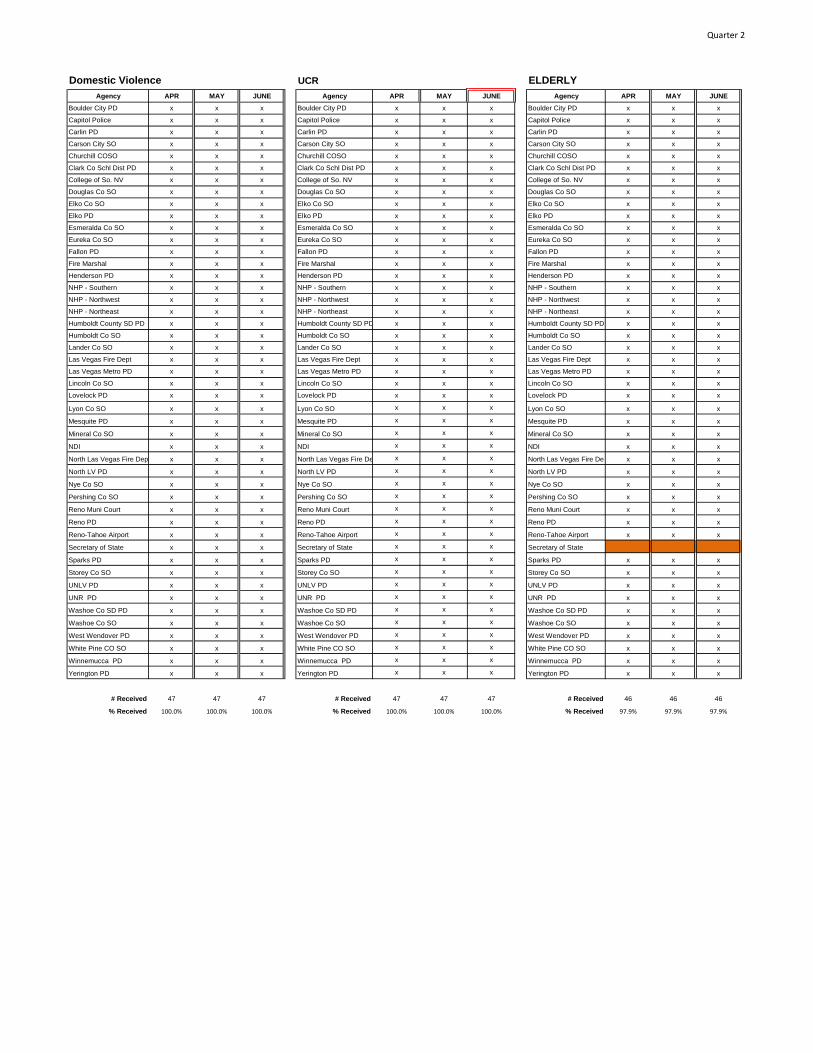
Quarter 2
Domestic Violence UCR ELDERLY
Agency APR MAY JUNE Agency APR MAY JUNE Agency APR MAY JUNE
Boulder City PD x x x Boulder City PD x x x Boulder City PD x x x
Capitol Police x x x Capitol Police x x x Capitol Police x x x
Carlin PD x x x Carlin PD x x x Carlin PD x x x
Carson City SO x x x Carson City SO x x x Carson City SO x x x
Churchill COSO x x x Churchill COSO x x x Churchill COSO x x x
Clark Co Schl Dist PD x x x Clark Co Schl Dist PD x x x Clark Co Schl Dist PD x x x
College of So. NV x x x College of So. NV x x x College of So. NV x x x
Douglas Co SO x x x Douglas Co SO x x x Douglas Co SO x x x
Elko Co SO x x x Elko Co SO x x x Elko Co SO x x x
Elko PD x x x Elko PD x x x Elko PD x x x
Esmeralda Co SO x x x Esmeralda Co SO x x x Esmeralda Co SO x x x
Eureka Co SO x x x Eureka Co SO x x x Eureka Co SO x x x
Fallon PD x x x Fallon PD x x x Fallon PD x x x
Fire Marshal x x x Fire Marshal x x x Fire Marshal x x x
Henderson PD x x x Henderson PD x x x Henderson PD x x x
NHP - Southern x x x NHP - Southern x x x NHP - Southern x x x
NHP - Northwest x x x NHP - Northwest x x x NHP - Northwest x x x
NHP - Northeast x x x NHP - Northeast x x x NHP - Northeast x x x
Humboldt County SD PD x x x Humboldt County SD PD x x x Humboldt County SD PD x x x
Humboldt Co SO x x x Humboldt Co SO x x x Humboldt Co SO x x x
Lander Co SO x x x Lander Co SO x x x Lander Co SO x x x
Las Vegas Fire Dept x x x Las Vegas Fire Dept x x x Las Vegas Fire Dept x x x
Las Vegas Metro PD x x x Las Vegas Metro PD x x x Las Vegas Metro PD x x x
Lincoln Co SO x x x Lincoln Co SO x x x Lincoln Co SO x x x
Lovelock PD x x x Lovelock PD x x x Lovelock PD x x x
Lyon Co SO x x x Lyon Co SO x x x Lyon Co SO x x x
Mesquite PD x x x Mesquite PD x x x Mesquite PD x x x
Mineral Co SO x x x Mineral Co SO x x x Mineral Co SO x x x
NDI x x x NDI x x x NDI x x x
North Las Vegas Fire Dep x x x North Las Vegas Fire De x x x North Las Vegas Fire Dep x x x
North LV PD x x x North LV PD x x x North LV PD x x x
Nye Co SO x x x Nye Co SO x x x Nye Co SO x x x
Pershing Co SO x x x Pershing Co SO x x x Pershing Co SO x x x
Reno Muni Court x x x Reno Muni Court x x x Reno Muni Court x x x
Reno PD x x x Reno PD x x x Reno PD x x x
Reno-Tahoe Airport x x x Reno-Tahoe Airport x x x Reno-Tahoe Airport x x x
Secretary of State x x x Secretary of State x x x Secretary of State
Sparks PD x x x Sparks PD x x x Sparks PD x x x
Storey Co SO x x x Storey Co SO x x x Storey Co SO x x x
UNLV PD x x x UNLV PD x x x UNLV PD x x x
UNR PD x x x UNR PD x x x UNR PD x x x
Washoe Co SD PD x x x Washoe Co SD PD x x x Washoe Co SD PD x x x
Washoe Co SO x x x Washoe Co SO x x x Washoe Co SO x x x
West Wendover PD x x x West Wendover PD x x x West Wendover PD x x x
White Pine CO SO x x x White Pine CO SO x x x White Pine CO SO x x x
Winnemucca PD x x x Winnemucca PD x x x Winnemucca PD x x x
Yerington PD x x x Yerington PD x x x Yerington PD x x x
# Received 47 47 47 # Received 47 47 47 # Received 46 46 46
% Received 100.0% 100.0% 100.0% % Received 100.0% 100.0% 100.0% % Received 97.9% 97.9% 97.9%
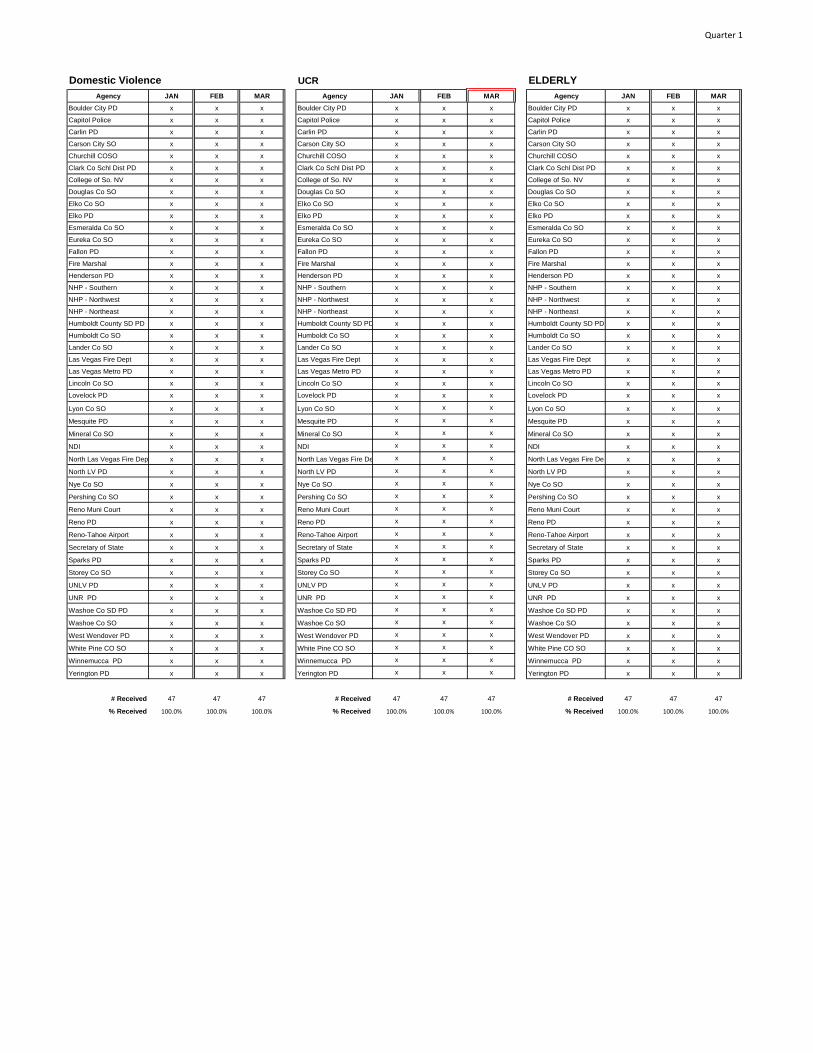
Quarter 1
Domestic Violence UCR ELDERLY
Agency JAN FEB MAR Agency JAN FEB MAR Agency JAN FEB MAR
Boulder City PD x x x Boulder City PD x x x Boulder City PD x x x
Capitol Police x x x Capitol Police x x x Capitol Police x x x
Carlin PD x x x Carlin PD x x x Carlin PD x x x
Carson City SO x x x Carson City SO x x x Carson City SO x x x
Churchill COSO x x x Churchill COSO x x x Churchill COSO x x x
Clark Co Schl Dist PD x x x Clark Co Schl Dist PD x x x Clark Co Schl Dist PD x x x
College of So. NV x x x College of So. NV x x x College of So. NV x x x
Douglas Co SO x x x Douglas Co SO x x x Douglas Co SO x x x
Elko Co SO x x x Elko Co SO x x x Elko Co SO x x x
Elko PD x x x Elko PD x x x Elko PD x x x
Esmeralda Co SO x x x Esmeralda Co SO x x x Esmeralda Co SO x x x
Eureka Co SO x x x Eureka Co SO x x x Eureka Co SO x x x
Fallon PD x x x Fallon PD x x x Fallon PD x x x
Fire Marshal x x x Fire Marshal x x x Fire Marshal x x x
Henderson PD x x x Henderson PD x x x Henderson PD x x x
NHP - Southern x x x NHP - Southern x x x NHP - Southern x x x
NHP - Northwest x x x NHP - Northwest x x x NHP - Northwest x x x
NHP - Northeast x x x NHP - Northeast x x x NHP - Northeast x x x
Humboldt County SD PD x x x Humboldt County SD PD x x x Humboldt County SD PD x x x
Humboldt Co SO x x x Humboldt Co SO x x x Humboldt Co SO x x x
Lander Co SO x x x Lander Co SO x x x Lander Co SO x x x
Las Vegas Fire Dept x x x Las Vegas Fire Dept x x x Las Vegas Fire Dept x x x
Las Vegas Metro PD x x x Las Vegas Metro PD x x x Las Vegas Metro PD x x x
Lincoln Co SO x x x Lincoln Co SO x x x Lincoln Co SO x x x
Lovelock PD x x x Lovelock PD x x x Lovelock PD x x x
Lyon Co SO x x x Lyon Co SO x x x Lyon Co SO x x x
Mesquite PD x x x Mesquite PD x x x Mesquite PD x x x
Mineral Co SO x x x Mineral Co SO x x x Mineral Co SO x x x
NDI x x x NDI x x x NDI x x x
North Las Vegas Fire Dep x x x North Las Vegas Fire De x x x North Las Vegas Fire Dep x x x
North LV PD x x x North LV PD x x x North LV PD x x x
Nye Co SO x x x Nye Co SO x x x Nye Co SO x x x
Pershing Co SO x x x Pershing Co SO x x x Pershing Co SO x x x
Reno Muni Court x x x Reno Muni Court x x x Reno Muni Court x x x
Reno PD x x x Reno PD x x x Reno PD x x x
Reno-Tahoe Airport x x x Reno-Tahoe Airport x x x Reno-Tahoe Airport x x x
Secretary of State x x x Secretary of State x x x Secretary of State x x x
Sparks PD x x x Sparks PD x x x Sparks PD x x x
Storey Co SO x x x Storey Co SO x x x Storey Co SO x x x
UNLV PD x x x UNLV PD x x x UNLV PD x x x
UNR PD x x x UNR PD x x x UNR PD x x x
Washoe Co SD PD x x x Washoe Co SD PD x x x Washoe Co SD PD x x x
Washoe Co SO x x x Washoe Co SO x x x Washoe Co SO x x x
West Wendover PD x x x West Wendover PD x x x West Wendover PD x x x
White Pine CO SO x x x White Pine CO SO x x x White Pine CO SO x x x
Winnemucca PD x x x Winnemucca PD x x x Winnemucca PD x x x
Yerington PD x x x Yerington PD x x x Yerington PD x x x
# Received 47 47 47 # Received 47 47 47 # Received 47 47 47
% Received 100.0% 100.0% 100.0% % Received 100.0% 100.0% 100.0% % Received 100.0% 100.0% 100.0%