Embed Size (px)
Citation preview

Quarantine and surveillance strategies for plant pathogen detection and control
P.W.J Baxter a,b, S. Parnell c and G. Hamilton a,b
a Plant Biosecurity Cooperative Research Centre, Bruce, Australian Capital Territory, Australia b Earth, Environmental and Biological Sciences School, Queensland University of Technology (QUT),
Brisbane, Queensland, Australia c School of Environment and Life Sciences, University of Salford, Manchester M5 4WT, U.K.
Email: [email protected]
Abstract: Incursions of plant pests and diseases pose serious threats to food security, agricultural productivity and the natural environment. One of the challenges in confidently delimiting and eradicating incursions is how to choose from an arsenal of surveillance and quarantine approaches in order to best control multiple dispersal pathways. Anthropogenic spread (propagules carried on humans or transported on produce or equipment) can be controlled with quarantine measures, which in turn can vary in intensity. In contrast, environmental spread processes are more difficult to control, but often have a temporal signal (e.g. seasonality) which can introduce both challenges and opportunities for surveillance and control. This leads to complex decisions regarding when, where and how to search.
Recent modelling investigations of surveillance performance have optimised the output of simulation models, and found that a risk-weighted randomised search can perform close to optimally. However, exactly how quarantine and surveillance strategies should change to reflect different dispersal modes remains largely unaddressed.
Here we develop a spatial simulation model of a plant fungal-pathogen incursion into an agricultural region, and its subsequent surveillance and control. We include structural differences in dispersal via the interplay of biological, environmental and anthropogenic connectivity between host sites (farms). Our objective was to gain broad insights into the relative roles played by different spread modes in propagating an invasion, and how incorporating knowledge of these spread risks may improve approaches to quarantine restrictions and surveillance.
We find that broad heuristic rules for quarantine restrictions fail to contain the pathogen due to residual connectivity between sites, but surveillance measures enable early detection and successfully lead to suppression of the pathogen in all farms. Alternative surveillance strategies attain similar levels of performance by incorporating environmental or anthropogenic dispersal risk in the prioritisation of sites.
Our model provides the basis to develop essential insights into the effectiveness of different surveillance and quarantine decisions for fungal pathogen control. Parameterised for authentic settings it will aid our understanding of how the extent and resolution of interventions should suitably reflect the spatial structure of dispersal processes.
Keywords: Modelling, simulation, fungal pathogen, horticultural management, detection
21st International Congress on Modelling and Simulation, Gold Coast, Australia, 29 Nov to 4 Dec 2015 www.mssanz.org.au/modsim2015
1261

Baxter et al., Quarantine and surveillance strategies for plant pathogens
1. INTRODUCTION
Incursions of plant pests and pathogens pose serious threats to agricultural productivity, food security and the environment, and their impact and management impose considerable costs on agriculture and other economic sectors (Pimentel et al. 2000). In particular, invasive fungi are of growing concern worldwide (Gladieux et al. 2015) and their management may impose significant costs and burdens on landowners (Cook et al. 2013).
Pest and pathogen incursions generally require complex multi-layered management (Dhillon et al. 2005), which ideally integrates quarantine, surveillance and eradication efforts. Quarantine measures generally seek to limit the spread of a pest through anthropogenic means. Restriction zones may be declared which may relate to natural dispersal ability but may also account for human-facilitated movement through social contact, trade or market distribution. Quarantine can therefore include diverse measures such as roadblocks and inspections, and movement controls on machinery, soil and plant material (Cantrell et al. 2002), and may be more effective if it reflects the structure of socio-economic connectivity. Surveillance is an essential tool for determining and monitoring the spatial distribution of the pathogen in an eradication or containment programme (FAO 2006). Its ultimate objective is detection and containment of incidences of pest incursions before the invasion becomes unmanageable (Lance et al. 2014).
Challenges in detecting and therefore delimiting and controlling pests and pathogens demand intelligent approaches to developing search strategies. Recent modelling approaches to pest surveillance and management point to the value of incorporating estimates of relative risk of spread (Parnell et al. 2014), including elements of socio-economic connectivity (Potts et al. 2013), in prioritising sites for surveillance. Such approaches, with advances in computational capability, show considerable promise for informing and optimising the management of detrimental invasive species.
We present a stochastic model of a fungal pathogen incursion into a spatially-connected system of host farms, and its subsequent detection and management. We examine spread via multiple modes of dispersal: humans, soil-water and storm events. We then contrast the effect of management combinations of quarantine and surveillance based on different underlying risk assumptions that incorporate elements of these dispersal modes.
We leave our model deliberately generic but choose some parameters and assumptions to correspond to fungal infections of banana plantations in Queensland, Australia. Recent major fungal infestations of Queensland bananas include Mycosphaerella fijiensis (causing black sigatoka) in 2001 (Henderson et al. 2006) and Panama Tropical Race IV (Fusarium oxysporum f.sp. cubense) in 2015, as well as ongoing control of an incidence of M. musicola (causing yellow sigatoka; Cook et al. 2013). Such fungal incursions present serious challenges, rendering a major state industry susceptible to disruption and economic loss. An uncontained fungal pathogen may further spread into surrounding natural ecosystems where it may threaten native species such as the bananas M. jackeyi and M. acuminata subsp. banksii. These threats, coupled with the virtual ineradicability of some fungal pathogens, make the insights obtained from modelling of great potential value in maximising early detection and containment through informed quarantine and surveillance.
2. THE MODEL
2.1. Spatial distribution of host properties
We seeded a regional area Ω = 10,000 km2 with n = 100 “host” farms (those with crops that are susceptible to fungal infection), choosing the centroid (xi, yi) of each individual farm i at random. We assumed that host farms comprised 10% of the total area, with individual farm areas, Ai, sampled from a lognormal (2.07, 0.69) distribution to give mean = 10 ha and SD = 7.8 ha. The coefficient of variation of farm areas reflects that of farm sizes in a commercial banana enterprise in Queensland.
2.2. Rainfall simulator
We modelled scaled weekly rainfall wt by sampling from 2005-2014 rainfall records for Tully, Queensland (Bureau of Meteorology station 32042:
Figure 1. Spatial distribution of properties in a 10000km2 region, indicating the initial incursion at
the most south-central property (red square).
1262

Baxter et al., Quarantine and surveillance strategies for plant pathogens
www.bom.gov.au/climate/data; accessed on 30th June 2015), which was close to multiple fungal outbreaks in the past (see Introduction). To produce rainfall signatures typical of each week-of-year, from daily rainfall data, we chose seven rainfall records from randomly selected days and years for each relevant week (1-52), and summed these to calculate weekly rainfall totals.
For modelling purposes, we scaled the simulated rainfall relative to its mean (Figure 2) and further defined extreme-weather events relating to high rainfall, defining severity as linearly increasing on [0, 1] between rainfall levels hL and hU:
Xt = max (0, min (1, (wt – hL)/(hU – hL) )).
We arbitrarily set hL = 4 and hU = 10, which resulted in Xt > 0 for about 3.5% of weeks.
2.3. Infection dynamics
We modelled the intensity of fungal infection as notional “reproductive entities”, i.e. spore equivalents, without modelling fungal mycelia or fruiting bodies themselves. Nor did we model individual host plants but rather assumed that “fungal load” Ni,t, the coverage of fungal entities within farm i at time t, would grow following a logistic growth model (Scanlan and Vanderwoude 2006; Kompas and Che 2009):
Ni,t+1 = [ min(1,wt) rNi,t + Δ(Ni , Nj≠i) ] (1 – Ni,t / AiK(mi,t)),
whereby the maximum growth rate r = 0.1 is reduced under drier conditions (scaled weekly rainfall wt < 1). We used a time-step of one week to better model human-facilitated movement and management response.Δ() is a composite function representing dispersal between farms, described in §2.5 below. K(mi,t) is a maximum density which depends on whether a farm has undergone management treatment (mi,t) for the infection. Although treated sites (mi,t = 1) likely have all host plants removed, we assume the fungus can persist at a base level in the soil, so that K(mi,t = 0) = 100 and K (mi,t = 1) = 1. We initiated infection at a single site (the first identified infected property is commonly called “IP1”) by setting its initial fungal load to NIP1,0 = 10. We chose the incursion site as that with the centroid closest to the centre-south of the grid (red square in Figure 1), to explore the influence of directional environmental connectivity (see next section).
2.4. Site connectivity
We assumed that the fungus can spread between host farms either environmentally (through soil-water or larger storm events) or through human agency (socioeconomically), allowing us to contrast three spread modes and their potential relevance to management strategies. We modelled this potential spread by calculating farm connectivity on each of these levels, with more broadcast dispersal in major storm events.
a) Environmental spread: we assumed that spores can be transmitted through soil-water, includingtransmission by downstream irrigation. Therefore we modelled a unidirectional “plume” with distance-decaying connections to farms lying within an angle of θ = ±30° to the north from a source farm. Theplume-spread from farms j to i is given by a plume connection matrix Cp with elements
cp,ij = σw exp(–dij) if |θ| ≤ 30° and yi > yj
and
cp,ij = 0 otherwise,
where σw is the spread rate in the soil water and dij is the Euclidian distance between farms i and j; dij = [(xi – xj)
2 + (yi – yj)2]½. A plume angle of ±30° starting from the exact centre-south of the grid would
connect 56.7% of the properties (two triangular areas of 2165 each would be excluded). We also allowed for large-scale mixing events in major storms; see below.
b) Socio-economic interactions between farms can aid fungal spread by transmission of mud-borne sporeseither directly on humans or vehicles, or by equipment sharing. We assumed random strength of socialinteraction (i.e., random variate vij drawn from Uniform[0,1] for i > j) and to account for higher
Figure 2. Typical (400 week sample trajectory; above) and overall distribution (n = 400000; below) of rainfall drawn from weather data for Tully, Qld.
1263

Baxter et al., Quarantine and surveillance strategies for plant pathogens
connections between neighbours, we weighted the level of interaction between pairs of farms linearly by inverse-distance, to produce a symmetric connection matrix Cs with elements
cs,ij = cs,ji = vij [1 – dij / max(d••)]
Note that one artefact of this distance model is that the two furthest-apart farms will not directly interact, although they may be strongly connected over two time steps depending on the strength of their shared connections. Following discovery of the pathogen we reduced the matrix Cs by a factor uα = 0.4 to reflect general community alertness, independent of quarantine restrictions to limit connectivity between farms.
2.5. Dispersal
Spore dispersal between sites depends on intensity (growth) of the infection at source. We assume that proportions fW, fX and fS of a site’s fungal growth (gi,t = min[1,wt]rNi,t) are available or mobilised for propagation by soil-water and irrigation, storms and societal means, respectively, with the propagule release zX
i,t also reflecting storm o intensity Xt. Thus, the variables
zWi,t = fW gi,t,
zXi,t = fX gi,t Xt ,
and
zSi,t = fS gi,t
are the propagules leaving site i via soil-water (“W”), storms (“X”) and socio-economic interactions (“S”), respectively. These may arrive at other farms according to the connectivity between sites (employing the matrices Cp and Cs) and broader mixing in more extreme weather (e.g. Gottwald et al. 2002):
aWi,t = Σj≠i cp,ij z
Wj,t ;
aXi,t = (Σj z
Xj,t ) Ai/Ω; and
aSi,t = (1 – uααt) Σj≠i cs,ij z
Sj,t.
are the propagules arriving at site i via soil-water, storms (arriving proportional to farm size Ai relative to regional area Ω) and humans, respectively. The quantity αt is an indicator variable which reduces the socio-economic connectivity matrix Cs by factor uα to reflect general community awareness reducing interactions during the incursion response. Hence the net change due to dispersal in and out of site i is given by
Δi,t = aWi,t + aX
i,t + aSi,t – (zW
i,t + zXi,t + zS
i,t).
2.6. Detection and Surveillance
We assumed that detection of infestations occurs passively at first, and under active surveillance thereafter. For the initial passive detection, we calculated probability of detection at site i and time t as exponentially approaching one as infection increased:
pi,t = 1 – exp(–δ(ρ0) Ni,t)
We set δ(ρ) = –ln(1 – p*)/ρ such that there would be a probability of p* (set to 0.5) of detecting an infection intensity ρ = ρ0. For illustration purposes we set ρ0 = 200.
For actively surveyed sites we assumed stronger detection levels (ρ = ρs = 10) and that probability varies with the proportion πi,t of the site surveyed:
pi,t = 1 – exp(–δ(ρs) πi,t Ni,t).
We assumed that management resources constrain the total area available for surveillance each week to proportion μ (= 1%) of the total area. Sites at which the fungus is detected are treated (see §2.7) and recorded in a “known-infection” vector kt. We modelled three contrasting strategies for prioritising sites for surveillance , each incorporating kt in calculating relative risk factors for candidate sites, as follows:
a) Rank each site i (not in kt) using a risk factor Ri,t equal to the distance to the nearest known infection site:
Ri,t = mink(dik), k ϵ kt
b) Rank sites according to assumed risk of infection, applying an estimate C's of the social connectivity matrix and the environmental plume dispersal to known infected sites. The risk weighting of site i being infected from known-infected sites kt is calculated as
1264
Baxter et al., Quarantine and surveillance strategies for plant pathogens
Ri,t = Σk Nk,t [1 – (1 – cp,ik)(1 – c's,ik)], k ϵ kt,
where c's,ik is the estimate of social interactions between sites i and k. We assumed that these estimates vary by ±25% from true interaction strengths, and that only estimates greater than u0 (set to 0.5) are included: i.e. c's,ik = v1cs,ik if v1cs,ik ≥ u0, and 0 otherwise, with the random variate v1 drawn from U(0.75, 1.25).
c) As (b) but perturbing the risk-factors further by multiplying by a random variate v2 drawn from U(0,1):
Ri,t = v2Σk Nk,t [1 – (1 – cp,ik)(1 – c's,ik)], k ϵ kt.
This ranking procedure is similar to the risk-weighted randomised method of Parnell et al. (2014), which also re-ranks candidate sites each time-step, but sacrifices occasional sampling of sites with very low (assumed) risk for computational speed.
These strategies give risk-weightings Ri,t of possible sites to survey, allowing a ranked schedule to be created for each strategy. The last site i = κ to be included in the survey is only partially surveyed so that the overall survey area is limited to μΩ = Σi πiAi, where πi is the proportion of site i surveyed (for surveyed sites, πi = 1, except πκ ≤ 1).
2.7. Treatment and Quarantine
Effective treatment of fungal infection often involves complete removal of the host plant. As the remaining fungal spores may persist in the soil for decades, however, we modelled treatment as reducing the density of fungal load to 1% of its maximum: K(mi,t) = 100 or 1 for mi,t = 0 or 1, respectively.
Following treatment, further spread of the pathogen is limited by quarantine restrictions, which we modelled by reducing each element within the connectivity matrix Cs to a base value cq,ij = min(cs,ij, q). We assumed q to be positive (q = 0.05) to represent some permeability of quarantine restrictions. In practice quarantine intensity often increases with proximity to an outbreak centre (Interstate Plant Health Regulation Working Group 1996). Therefore we also modelled a more risk-based quarantine zonation, effecting the same overall reduction in connectivity but weighting the reduction by inverse-distance to known infected properties:
ωq',ik = cs,ij dik–1 /Σik dik
–1 ,
cq',ij = Σij(cs,ij – cq,ij) ωq',ij /Σij ωq',ij .
More nuanced reductions of connectivity between specific sites could model progressive or adaptive quarantine zone implementation, e.g. radial nesting of quarantine intensity with respect to duration of incursion (Potts et al. 2013).
We assumed that in extreme weather (Xt > 0), poor working and observational conditions or flooding events would prevent surveillance and quarantine operations. We left social connectivity unchanged in extreme weather conditions, however, on the assumption that close acquaintances would assist each other following the extreme events, counteracting their restricted movement during the actual storm.
2.8. Implementation
We simulated the progression and management of an incursion over 400 weeks (7.7 years, encompassing 8 wet seasons). We used the same simulated spatial configuration of farms for each simulation, therefore our results here reflect the specific configuration shown in Figure 1. The social connectivity (Cs) between the farms, however, was generated stochastically for each simulation. We examined the contribution of each
Figure 3. Simulation of 400-week uncontrolled incursion of a fungal pathogen infecting 100 farms (coloured lines), showing effects of spread by (a) soil-water, (b) storms, (c)
humans and (d) all modes combined. The trajectories, which are the mean of 1000 simulations for identical spatial
configuration, plateau out at fungal carrying capacities proportional to each farm’s area.
1265
Baxter et al., Quarantine and surveillance strategies for plant pathogens
form of spread to the invasion, and the relative performances of the quarantine and surveillance combinations. We measured performance in terms of mean overall fungal load in the system (fungus-weeks), which can be loosely interpreted as relating to the agro-economic impact of the incursion.
3. RESULTS AND DISCUSSION
3.1. Incursion spread
For our default parameter set, the fungal pathogen reaches all farms within four years if left unmanaged (Figure 3). The speed and extent of its spread depends on spread mode and associated connectivity through the system. If spread only occurs through a soil-water plume (Figure 3a), only those farms within the plume’s influence (roughly 50%) are susceptible. If spread only occurs via human socio-economic connections (for example, transported on footwear, vehicles, or machinery), all farms will eventually be affected although the transfer takes slightly longer than with soil-water alone (Figure 3c). Similarly, extreme weather events can spread the pathogen throughout the system albeit over a longer expected time-frame (Figure 3b). Combining all forms of spread hastens the entire system becoming saturated by the fungus (Figure 3d).
3.2. Incursion management
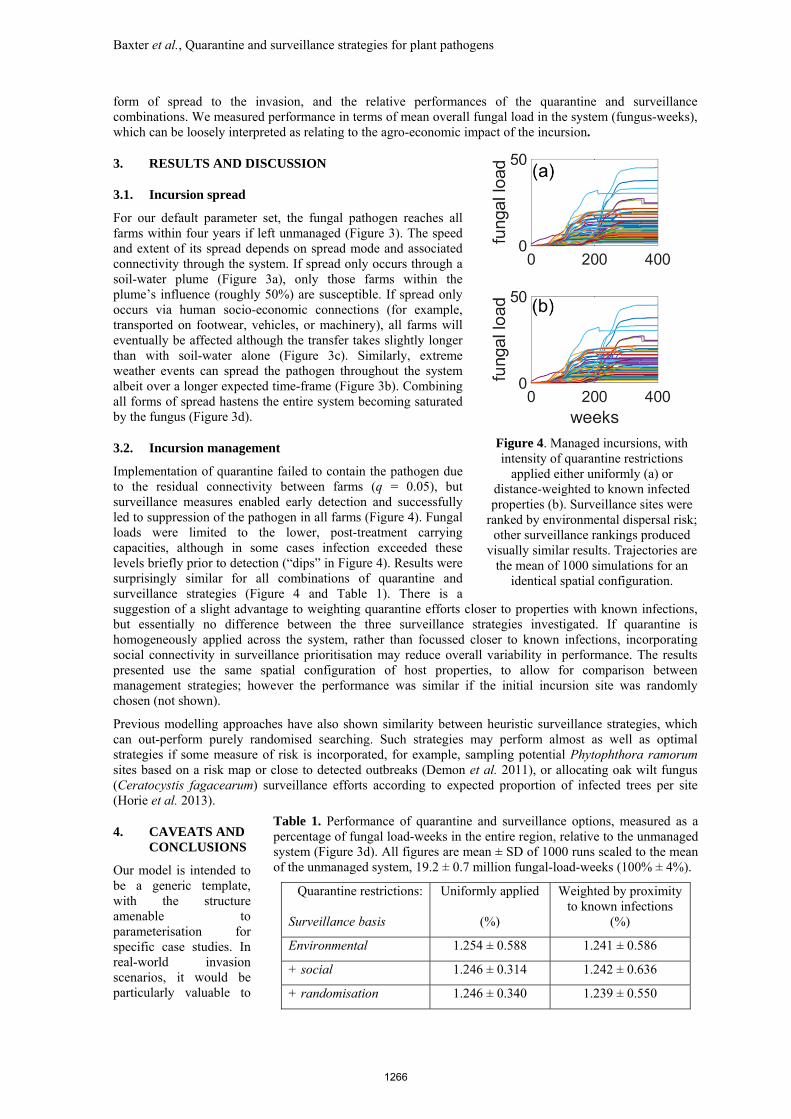
Implementation of quarantine failed to contain the pathogen due to the residual connectivity between farms (q = 0.05), but surveillance measures enabled early detection and successfully led to suppression of the pathogen in all farms (Figure 4). Fungal loads were limited to the lower, post-treatment carrying capacities, although in some cases infection exceeded these levels briefly prior to detection (“dips” in Figure 4). Results were surprisingly similar for all combinations of quarantine and surveillance strategies (Figure 4 and Table 1). There is a suggestion of a slight advantage to weighting quarantine efforts closer to properties with known infections, but essentially no difference between the three surveillance strategies investigated. If quarantine is homogeneously applied across the system, rather than focussed closer to known infections, incorporating social connectivity in surveillance prioritisation may reduce overall variability in performance. The results presented use the same spatial configuration of host properties, to allow for comparison between management strategies; however the performance was similar if the initial incursion site was randomly chosen (not shown).
Previous modelling approaches have also shown similarity between heuristic surveillance strategies, which can out-perform purely randomised searching. Such strategies may perform almost as well as optimal strategies if some measure of risk is incorporated, for example, sampling potential Phytophthora ramorum sites based on a risk map or close to detected outbreaks (Demon et al. 2011), or allocating oak wilt fungus (Ceratocystis fagacearum) surveillance efforts according to expected proportion of infected trees per site (Horie et al. 2013).
4. CAVEATS AND CONCLUSIONS
Our model is intended to be a generic template, with the structure amenable to parameterisation for specific case studies. In real-world invasion scenarios, it would be particularly valuable to
Figure 4. Managed incursions, with intensity of quarantine restrictions
applied either uniformly (a) or distance-weighted to known infected properties (b). Surveillance sites were
ranked by environmental dispersal risk; other surveillance rankings produced
visually similar results. Trajectories are the mean of 1000 simulations for an
identical spatial configuration.
Table 1. Performance of quarantine and surveillance options, measured as a percentage of fungal load-weeks in the entire region, relative to the unmanaged system (Figure 3d). All figures are mean ± SD of 1000 runs scaled to the mean of the unmanaged system, 19.2 ± 0.7 million fungal-load-weeks (100% ± 4%).
Quarantine restrictions: Surveillance basis
Uniformly applied
(%)
Weighted by proximity to known infections
(%)
Environmental 1.254 ± 0.588 1.241 ± 0.586
+ social 1.246 ± 0.314 1.242 ± 0.636
+ randomisation 1.246 ± 0.340 1.239 ± 0.550
1266

Baxter et al., Quarantine and surveillance strategies for plant pathogens
include greater spatial realism such as actual farm geometries; multi-directionality of abiotic drivers rather than a simplified unidirectional “plume”; structured social connectivity to include roads or market hubs; and heterogeneous establishment potential in the farms or surrounding landscape. The model could also be adapted to include greater dynamic realism such as within-site infestation dynamics, and changes in social connectivity and surveillance operations in response to weather conditions. These caveats, and the underlying assumptions that they imply, warrant further investigation, and are the subject of ongoing research, leading to the potential for case-specific parameterisation and optimisation of management performance.
ACKNOWLEDGMENT
We acknowledge the support of the Australian Government’s Cooperative Research Centres Program.
REFERENCES
Cantrell, B., Chadwick, B. and Cahill, A. (2002). Fruit fly fighters: eradication of the papaya fruit fly. CSIRO Publishing, Collingwood, Australia.
Cook, D., Liu, S., Edwards, J., Villalta, O., Aurambout, J.-P., Kriticos, D. et al. (2013). An assessment of the benefits of yellow sigatoka (Mycosphaerella musicola) control in the Queensland Northern Banana Pest Quarantine Area. NeoBiota, 18, 67-81.
Demon, I., Cunniffe, N.J., Marchant, B.P., Gilligan, C.A. and van den Bosch, F. (2011). Spatial sampling to detect an invasive pathogen outside of an eradication zone. Phytopathology, 101, 725-731.
Dhillon, M.K., Singh, R., Naresh, J.S. and Sharma, H.C. (2005). The melon fruit fly, Bactrocera cucurbitae: A review of its biology and management. Journal of Insect Science, 5, 40.
FAO (2006). ISPM No. 9 Guidelines For Pest Eradication Programmes (1998). In: International Standards for Phytosanitary Measures No. 1 to 24 (2005 edition).
Gladieux, P., Feurtey, A., Hood, M.E., Snirc, A., Clavel, J., Dutech, C. et al. (2015). The population biology of fungal invasions. Molecular Ecology, 24, 1969-1986.
Gottwald, T.R., Sun, X., Riley, T., Graham, J.H., Ferrandino, F. and Taylor, E.L. (2002). Geo-Referenced Spatiotemporal Analysis of the Urban Citrus Canker Epidemic in Florida. Phytopathology, 92, 361-377.
Henderson, J., Pattemore, J.A., Porchun, S.C., Hayden, H.L., Van Brunschot, S., Grice, K.R.E. et al. (2006). Black Sigatoka disease: new technologies to strengthen eradication strategies in Australia. Australasian Plant Pathology, 35, 181-193.
Horie, T., Haight, R.G., Homans, F.R. and Venette, R.C. (2013). Optimal strategies for the surveillance and control of forest pathogens: A case study with oak wilt. Ecological Economics, 86, 78-85.
Interstate Plant Health Regulation Working Group (1996). Code of practice for management of the Queensland fruit fly. Standing Committee on Agriculture and Resource Management Australia.
Kompas, T. and Che, N. (2009). A practical optimal surveillance measure: the case of papaya fruit fly in Australia. Australian Centre for Biosecurity and Environmental Economics. Canberra, ACT, Australia, 29pp.
Lance, D.R., Woods, W.M. and Stefan, M. (2014). Invasive insects in plant biosecurity: case study – Mediterranean fruit fly. pp. 447-484 in: The Handbook of Plant Biosecurity (eds. Gordh, F and McKirdy, S). Springer Dordrecht, Netherlands.
Parnell, S., Gottwald, T.R., Riley, T. and van den Bosch, F. (2014). A generic risk-based surveying method for invading plant pathogens. Ecological Applications, 24, 779-790.
Pimentel, D., Lach, L., Zuniga, R. and Morrison, D. (2000). Environmental and economic costs of nonindigenous species in the United States. Bioscience, 50, 53-65.
Potts, J.M., Cox, M.J., Barkley, P., Christian, R., Telford, G. and Burgman, M.A. (2013). Model-based search strategies for plant diseases: a case study using citrus canker (Xanthomonas citri). Diversity and Distributions, 19, 590-602.
Scanlan, J.C. and Vanderwoude, C. (2006). Modelling the potential spread of Solenopsis invicta Buren (Hymenoptera: Formicidae) (red imported fire ant) in Australia. Australian Journal of Entomology, 45, 1-9.
1267