Embed Size (px)
Citation preview

POLITECNICO DI MILANO
School of Industrial and Information Engineering
Master Degree in Materials Engineering and Nanotechnology
QUANTUM CHEMICAL SIMULATIONS AND
SPECTROSCOPIC CHARACTERIZATION OF
POLY(P-PHENYLENE TEREPHTHALAMIDE) FIBERS
Supervisor: Dr. Alberto MILANI
Graduation thesis of: Lorenzo AVANZINI
Registration number: 824147
Academic year 2015/2016

1
Abstract
In the field of characterization techniques of materials, and in particular of IR and Raman
spectroscopy, this work sheds light on the usefulness and reliability achieved by state-of-
the-art computational methods for the investigation, at the molecular scale, of the
spectroscopic and structural properties of the semi-crystalline polymers. The research and
development of new polymeric materials, as shown by the most recent papers appeared in
the literature, are still very active. Acting on the physical and mechanical properties of these
materials, involves a deep knowledge of the structure and arrangement of the molecular
chains and in particular of how they influence the physical-chemistry of the material. For
this reason, the need for innovative characterization techniques, which lead to a rational
design of the molecular structure of polymeric materials, is taking ground. By means of the
current CRYSTAL14 and Gaussian09 implementations, we report a detailed study on the
spectroscopic properties of the poly(p-phenylene terephthalamide) (PPTA). The potential of
this code applied to polymer materials, are still almost completely unexplored. This work
shows how these computational models are able to accurately reproduce the vibrational
spectra (IR and Raman) of PPTA, providing an effective method to interpret in details the
information obtained by experimental characterization techniques. In addition to the
assignment of the main group frequencies of vibrational spectra IR and Raman of the 3D
and 1D (infinite isolated chain) crystals by means of CRYSTAL14, we also simulated the
effect induced by the mechanical stretching of PPTA fibers on the Raman spectrum,
observing a downward frequency shift of the bands related to backbone vibrations. The
results obtained turned out to be in direct agreement with data found in the literature. In
particular, we also verified how structural changes, due to fibers stretching, play a
fundamental role in modifying the vibrational spectra. By means of CRYSTAL14 we
determined the elastic modulus of the PPTA crystalline phase, and we simulated the IR
spectrum with polarized incident light, obtaining once again results in good agreement with
experimental measurements. Furthermore, by taking advantage of Gaussian09 we also
carried out calculations of the IR and Raman spectra of different kinds of PPTA oligomers.
Making a comparison between these latter oligomers spectra with CRYSTAL14 and
experimental results, we were able to deeply understand the role of intra and intermolecular
interactions in modifying the spectroscopic properties of the polymer. From the
methodological point of view, this work shows the different results obtained by means of
different exchange-correlation functionals and basis sets, sheding light on their strengths and
weaknesses in simulating real systems and obtaining on this way useful information on the
computational set up of the DFT calculation of polymeric systems. All the experimental
spectra reported in this work has been carried out in the FunMat laboratory of the chemistry
and materials department of the Politecnico di Milano, while the acquisition of the Raman
spectrum performed during the PPTA fibers tensile test took place in collaboration with Prof.
Claudia Marano of Politecnico di Milano. The proposed approach, emphasizes the
importance of computational methods not only for a reliable interpretation of vibrational
spectra, but also to understand those molecular phenomena responsible of many physical
and chemical properties of polymeric materials. Furthermore, its potentialities are not only

2
limited to the basic study of the material, but have also a significant impact in applied
research also in the industrial and technological fields.

3
Abstract
Nell’ambito delle tecniche di caratterizzazione dei materiali e in particolare della
spettroscopia Raman e infrarossa, questo lavoro mette in luce l’utilità e l’affidabilità
raggiunta dai metodi computazionali allo stato dell’arte per lo studio, a livello molecolare,
delle proprietà strutturali e spettroscopiche dei polimeri semicristallini. La ricerca e lo
sviluppo di nuovi materiali a base polimerica, come dimostrato dalla letteratura più recente,
è tuttora molto attiva. Intervenire sulle proprietà fisiche e meccaniche di questi materiali
implica una profonda conoscenza della struttura e dell’organizzazione delle catene
polimeriche, in particolare di come esse influenzino le proprietà fisico-chimiche del
materiale. Per questo motivo, nasce la necessità di tecniche di caratterizzazione sempre più
evolute, che permettano un design razionale della struttura molecolare dei materiali
polimerici. Attraverso l’attuale implementazione di CRYSTAL14 e Gaussian09 proponiamo
uno studio dettagliato sulle proprietà spettroscopiche del poly(p-phenylene terephthalamide)
(PPTA). Le potenzialità di questo codice di calcolo applicato a materiali polimerici, sono
quasi del tutto ancora inesplorate. Questo lavoro mostra come tali metodi computazionali
siano in grado di riprodurre fedelmente gli spettri vibrazionali Raman e IR del PPTA,
fornendo un valido metodo per consolidare e meglio interpretare le informazioni fornite dalle
tecniche di caratterizzazione sperimentali. Oltre all’aver identificato le principali frequenze
di gruppo degli spettri vibrazionali (Raman e IR) del cristallo 3D e 1D (singola catena
infinita) attraverso il codice CRYSTAL14, abbiamo anche simulato l’effetto che la trazione
meccanica delle fibre di PPTA ha sullo spettro Raman, osservando uno spostamento delle
principali bande associate alle vibrazioni dello scheletro delle catene polimeriche verso
frequenze più basse, in ottimo accordo con i dati presenti in letteratura. In particolare,
abbiamo anche verificato come i cambiamenti strutturali, dovuti allo stretching meccanico,
giochino un ruolo fondamentale nel modificare lo spettro vibrazionale. Per mezzo di
CRYSTAL14 abbiamo potuto determinare il modulo elastico della fase cristallina del PPTA
e simulare lo spettro IR in luce polarizzata, ottenendo sempre risultati in ottimo accordo con
le misure sperimentali. Inoltre, attraverso il codice Gaussian09 abbiamo calcolato gli spettri
vibrazionali, Raman e IR, di differenti oligomeri di PPTA. Paragonando quest’ultimi spettri
con quelli ottenuti dalla simulazione del cristallo 3D e con gli spettri sperimentali, siamo
stati in grado di approfondire il ruolo delle interazioni intra ed intermolecolari (per esempio
il legame ad idrogeno) nel modificare le proprietà spettroscopiche del polimero oggetto di
studio. Dal punto di vista metodologico, questo lavoro mostra i differenti risultati ottenuti
attraverso i differenti funzionali di scambio-correlazione e basis set utilizzati, mettendo in
luce i loro punti di forza e debolezze nel simulare un sistema reale, ottenendo in questo modo
utili informazioni per il setup computazionale di calcoli DFT su sistemi polimerici. Tutti gli
spettri sperimentali proposti in questo lavoro, sia IR che Raman, sono stati registrati da noi
nel laboratorio FunMat del dipartimento di chimica e materiali del Politecnico di Milano,
mentre l’acquisizione dello spettro Raman effettuato durante la prova a trazione delle fibre
di PPTA, si è svolto in collaborazione con la Prof. Claudia Marano del Politecnico di Milano.
L’approccio da noi presentato, enfatizza l’importanza di metodi computazionali non solo per
un’affidabile interpretazione degli spettri vibrazionali, ma anche per la comprensione di quei
fenomeni moleculari responsabili di molte proprietà fisico-chimiche dei materiali polimerici.

4
Inoltre, le sue potenzialità non si limitano solo allo studio di base del materiale ma hanno
importanti ricadute anche nella ricerca applicata in campo tecnologico ed industriale.

5
Summary
Chapter 1 ............................................................................................................................... 7
Introduction ........................................................................................................................... 7
1.1 The aims of this work ............................................................................................. 7
1.2 Kevlar ..................................................................................................................... 9
Chapter 2 ............................................................................................................................. 14
Quantum-chemical methods for molecular crystals calculations ........................................ 14
2.1 Crystal lattice properties ....................................................................................... 14
2.1.1 Direct and reciprocal lattice ................................................................................ 14
2.1.2 Bloch’s Theorem ................................................................................................ 16
2.1.2 Non translational symmetries effects ................................................................. 18
2.1.3 Born Von Karman boundary conditions ............................................................. 20
2.2 Solving Schrodinger equation for molecular crystals........................................... 20
2.2.1 The Born-Oppenheimer approximation ............................................................. 21
2.2.2 The Hartree – Fock approximation ..................................................................... 22
2.2.3 The Roothaan - Hall equations ........................................................................... 25
2.2.4 Crystalline orbitals .............................................................................................. 26
2.2.5 Hartree-Fock equations applied to a periodic system ......................................... 27
2.2.6 The SCF procedure ............................................................................................. 28
2.2.7 Long-range interactions calculations .................................................................. 29
2.3 Fundamental principle of DFT ............................................................................. 30
2.3.1 The Kohn-Sham method ..................................................................................... 32
2.3.2 The Exchange-Correlation functional Exc ........................................................... 34
2.3.3 Dispersion Interactions ....................................................................................... 35
Chapter 3 ............................................................................................................................. 37
Introduction to vibrational dynamics and vibrational spectroscopy .................................... 37
3.1 The intramolecular potential and normal modes .................................................. 37
3.2 Infra-red intensities ............................................................................................... 41
3.3 Classical theory of Raman scattering ................................................................... 42
3.4 Instrumentation for vibrational spectroscopy ....................................................... 45
3.4.1 IR spectrometer................................................................................................... 46
3.4.2 Raman spectrometer ........................................................................................... 48
3.4.3 FT Raman spectrometer ..................................................................................... 51

6
3.4.3 Portable Raman spectrometer ............................................................................. 53
Chapter 4 ............................................................................................................................. 55
Characterization of PPTA vibrational spectra ..................................................................... 55
4.1 Experimental spectra ............................................................................................ 55
4.2 Computational details ........................................................................................... 58
4.3 Crystal full geometry optimization ....................................................................... 61
4.4 Vibrational spectra prediction of PPTA oligomers .............................................. 63
4.4.1 PPTA monomer .................................................................................................. 64
4.4.2 PPTA two monomers ......................................................................................... 74
4.4.3 PPTA isolated chain described as a 1-D crystal ................................................. 82
4.4.3.1 1D chain full geometrical optimization ....................................................... 82
4.4.3.2 Isolated chain IR spectra.............................................................................. 84
4.4.3.3 Isolated chain Raman spectra ...................................................................... 88
4.4.4 PPTA dimer ........................................................................................................ 92
4.4.5 Simulation of Kevlar 3D crystal ......................................................................... 96
4.4.5.1 Intermolecular crystal packing effects on vibrational spectra ..................... 96
4.4.5.2 Comparison between different computational methods adopted for 3D
crystal simulations ................................................................................................... 98
4.4.5.3 Kevlar crystal characterization .................................................................. 102
4.5 Polarized IR spectroscopy of Kevlar .................................................................. 111
4.5.1 Computational method for the prediction of polarized IR spectra ................... 112
4.5.2 Comparison of experimental and DFT computed polarized IR spectra ........... 114
Chapter 5 ........................................................................................................................... 117
Quantum chemical simulation of Raman spectra of Kevlar under mechanical stretching 117
5.1 DFT simulations of stress-dependent Raman spectra ......................................... 118
5.3 Experimental Raman spectra ............................................................................... 122
5.3.1 Experimental details ..................................................................................... 122
5.3.2 Results .............................................................................................................. 124
5.4 DFT calculation of elastic modulus ..................................................................... 128
Chapter 6 ........................................................................................................................... 130
Conclusions ....................................................................................................................... 130

7
Chapter 1
Introduction
1.1 The aims of this work
From the middle of the last century, the study of polymers became a cornerstone of material
science and engineering. Just 50 years ago polymeric materials, unavoidable ingredient of
our everyday life, did not exist. Now researches and new applications for these materials are
gaining ground increasingly and there is no reason to believe that the “polymeric revolution”
will stop any time soon. Polymeric materials will be the main actors of the new millennium
due to their advantages: in lightweight structural parts for vehicles and aircraft or power
plants based on wind, in insulating materials for drastic saving in energy, new packaging
solutions, in molecular electronics and photonics, and in a host of biomedical applications.
Despite their great technological development in recent years, many questions about their
chemical/physical properties still need to be answered due to their complex and variable
nature. In order to get a more general overview of the macroscopic properties of a particular
material and to predict how this material will be able to withstand a stimulus from the
external environment, a more detailed description of the microscopic phenomena is indeed
required. Almost all the properties of polymers, such as the elastic modulus, transition
temperatures, density and conductivity could be explained on the basis of intra-molecular
features (chemical compositions, molecular chain structure and conformation) and inter-
molecular interactions (hydrogen bond, Van der Waals forces, morphology). Polymers,
unlike metals, are not always characterized by a regular and periodic arrangement of atoms,
but they can be both amorphous or semi-crystalline, and in the last case they may be
subjected even to a large degree of polymorphism. For these reasons it is not easy to
understand the role played by the different microscopic phenomena (or even nanoscopic) at
macroscopic scale and how they can affect the properties of a particular polymer. The
advantage of such a high dependence on the microscopic structure makes these materials
versatile and adaptable to a host of needs, but it’s important to understand how the processing
techniques, the environment, etc. may affect the material characteristics.
After this brief introduction about the fundamental role played by the microscopic structures
in modifying the macroscopic properties of polymers (i.e. the so-called “structure property”
correlations), we can now figure out the great relevance of understanding the atomic
arrangement, the molecular chains properties and their supramolecular interactions. To this
aim, suitable characterization techniques are required for an investigation of the material at
the nanoscale.
IR and Raman vibrational spectroscopies have been always used as a very efficient
techniques of characterization in the molecular and polymeric materials field, and their
employment is widely used also in the industrial environment. By means of the vibrational
analysis it is possible to obtain qualitative and quantitative information regarding phenomena
which take place at the molecular scale.

8
This thesis aims at employing computational techniques at the state-of-the-art and IR, Raman
vibrational spectroscopies in order to study and characterize semi-crystalline polymers, in
particular poly(p-phenylene terephthalamide).
Many experimental studies to determine the PPTA structure and to characterize its marker
bands have been already carried out [1-4,18] but in several papers there are considerable
uncertainty, many ambiguities and discrepancies among the spectral bands assignments
proposed by different authors. Moreover, Kevlar (the PPTA trade name by DuPont) displays
some interesting properties, such as the modulation of the Raman response as a function of
mechanical strain, which still needs a detailed interpretation at the nanoscale. For this reason,
due to both its technological importance and the peculiarities of its behavior from a material
scientist prospective, we decide to investigate in details its molecular properties.
In recent years many molecular dynamic studies and quantum-chemical simulations have
been done to characterize the spectroscopic properties of the most common polymers [5-6].
However, the lack of instruments and codes for solid state polymer calculation prevented a
systematic verification of the structural and vibrational properties of these systems, taking
into account the most relevant solid state effect.
Thanks to the current implementation of CRYSTAL14 [7], taking into account the spatial
symmetry group of the system, we can perform accurate quantum-chemical calculations for
the prediction of IR and Raman spectra of an infinite polymer and its 3D crystal. This
possibility makes us able to inspect the previous spectroscopic assignments of Kevlar’s
marker bands and to show how a computational approach is extremely useful in order to
clarify unambiguously the structural and spectroscopic properties of semi-crystalline
polymers.
The CRYSTAL code was originally developed for the investigation of inorganic crystalline
systems, and only recently it has been applied to polymers and molecular materials:
therefore, also from the computational point of view there are still several open issues,
needing an investigation. As an example in this context the correct description of Van der
Waals interactions is particularly important [8-12].
Indeed, in many chemical systems and especially in macromolecular one, dispersion
interactions play a fundamental role, since they are responsible of the molecular chains
packing and they govern all the possible relative motions between different chains, and
hence a detailed description of this type of interactions is essential for a careful study of the
crystal structure of semi-crystalline polymers. However, standard DFT functionals don’t
describe correctly dispersion interactions, and corrections are required as done in CRYSTAL
according to the Grimme method.
Due to the fact that quantum chemical methods able to describe accurately a molecular
system packed in its solid state phases have been available only recently, also the detailed
interpretation of vibrational spectra is a quite recent field of research. Indeed, only few years
ago the interpretation of the vibrational spectra was only derived on the basis of empirical
correlation rules or according to eigenvectors obtained through semi-empirical quantum-
chemical calculations performed on small model systems. Now by means of CRYSTAL14
we are able to describe the Raman spectra and relative normal modes of vibration, by taking
into account the whole set of intra and inter-molecular interactions taking place in the real
crystal structures.

9
This work does not only support the spectra assignment, but by comparing the properties of
the crystal or single-infinite-chain, it sheds light on the role of molecular and supramolecular
effects ruling the spectroscopic response of Kevlar.
Since Kevlar was available in form of fiber and since PPTA molecular chains in fibers are
characterized by a very well ordered arrangement (rod-like molecules), we have also
recorded experimental IR spectra by means of polarized laser and performed calculations for
this specific case in order to study orientation phenomena from a molecular perspective.
Furthermore, it has been possible to simulate the effect of mechanical distortion on a single
infinite polymer chain, to analyze the modulation of the vibrational spectra in terms of
marker bands shifting due to mechanical stretching. This application has been developed by
comparing the computed spectra with experimental spectra obtained by a portable FT Raman
spectroscope during a Twaron’s fibers stretching (Twaron is the trade name of PPTA fibers
produced by Teijin). This last research helps us to understand more deeply the complex
molecular phenomena that occur during the stretching of polymers such as PPTA, and to
appreciate the main microscopic mechanisms which govern the macroscopic behavior of a
highly oriented polymer under tensile stress. This is a fundamental step to better rationalize
the structure-properties relationships of this material, and to pave the way for the evolution
and future employment of Kevlar.
All experimental vibrational spectra presented in this work, both IR and Raman, have been
properly recorded in our laboratory, and then compared with those found in literature,
obtaining always good agreements.
1.2 Kevlar
Kevlar is the registered trademark (by DuPont) for the poly-para-phenylene terephthalamide
(PPTA). These synthetic aromatic polyamide fibers are strong enough to stop bullets and
knives, often trivially described as being “five times stronger than steel on an equal basis of
weigh”. They have many other uses too, from boats and bowstrings to reinforcing tires and
brake pads. Let’s take a closer look at why and how they are made.
Kevlar history
In order to achieve maximum strength and high modulus, polymer molecules should have
an extended-chain conformation and high crystallinity. This could be accomplished only by
mechanical drawing the fibers after melt spinning. This process requires chain
disentanglement and orientation in the solid phase, unlikely achievable with nylon and
polyester. In 1965, DuPont discovered a new method of producing an almost perfect polymer
chain extension. The polymer poly-p-benzamide was found to form liquid crystalline
solutions due to its peculiar molecular backbone and the strong inter-chains interactions [16].
This development founded the basis for the current formulation of the high-strength Kevlar
aramid fiber. The key structural requirement for the backbone is the para orientation on the
benzene ring, which allows the formation of rod-like molecular structures. This effect is due

10
to the formation of molecular hydrogen bonds between the carbonyl and NH groups, with
additional strength obtained from the aromatic stacking interactions between adjacent
strands. All these interactions have a greater influence on Kevlar than the van der Waals
interactions and chain length that typically influence the property of other common synthetic
polymers.
Figure 1.1 – Rod-Like fiber structure by the radial stacking of Hydrogen-Bonded Sheets.
The formation of Rod-Like molecular structure opened new dimensions in fibers
manufacturing and processing. Under shear forces, as the solutions pass through a
spinner, the randomly oriented domains become fully oriented in the direction of the
shear and emerge with an almost perfect molecular orientation. The crystallinity varies
from 68% to 80% for Kevlar 29, and from 76% to 90% for Kevlar49.This process
allows us to orient polymer molecules and to achieve very strong fibers.

11
Figure 1.2 – Differences in behavior during spinning between flexible and rigid polymers.
Kevlar production process
Kevlar is synthetized through a condensation reaction by means of a solution composed of
1,4 phenilene-diamine and teraphthaloyl chloride, obtaining hydrochloric acid as a
byproduct. The solvents used for the polymerization is the N-methyl-pyrrolidone and
calcium chloride. Thanks to this process we obtain a liquid crystal polymer solution which
displays a unique behavior under shear stress. The chemical obtained is turned into fibers by
a process called wet spinning, by forcing a hot, concentrated, and very viscous solution
through a spinneret to make long and thin fibers that are coiled onto drums. The fibers are
then cut and woven in a tough mat. Later these fibers are woven into sheets.
Figure 1.3 – The reaction of 1,4 phenilene-diamine with teraphthaloyl chloride yielding Kevlar.
Kevlar production is expensive because of the difficulties arising by the use of concentrated
sulfuric acid, needed to keep the water-insoluble polymer in solution during its synthesis and
spinning.

12
Several grades of Kevlar are available:
- Kevlar K-29: industrial applications, such as cables, brake linings, and body/vehicle
armor.
- Kevlar K-49: high modulus used in cable and rope products.
- Kevlar K-100: colored version of Kevlar.
- Kevlar K-119: higher tenacity for ballistic applications.
- Kevlar AP: 15% higher tensile strength than K-29.
- Kevlar XP: lighter weight resin and KM2 plus fiber combination.
- Kevlar KM2: enhanced ballistic resistance for armor applications.
Properties of Kevlar
The table below lists tensile and thermal properties of Kevlar 29 and Kevlar 49 yarns [17].
Table 1.1 – Typical properties of Kevlar 29 and 49 yarns.

13
Kevlar is chemically stable under a wide variety of exposure conditions; however, certain
strong aqueous acids, bases and sodium hypochlorite can cause degradation, particularly
over long periods of time and at elevated temperatures.
Kevlar has very impressive thermal properties, it can withstand up to 450°C and as low as -
196°C. In particular, this aramid fiber doesn’t melt, it decomposes at relatively high
temperature, and the decomposition temperatures vary with the rate of temperature rise and
length of exposure.
Figure 1.4 – Typical thermogravimetric analysis of Kevlar 49 in air at the temperature rise of
10C°/min.
As usual for polymeric materials, increasing temperatures reduce modulus, tensile strength
and break elongation of Kevlar yarns, as reported in the figure below.
Figure 1.5 – Comparative effect of elevated temperatures.

14
Chapter 2
Quantum-chemical methods for molecular crystals
calculations
This chapter will introduce the basic principles employed by Crystal,describing in particular
Hartree-Fock and DFT theories in order to solve complex quantum-chemical calculations of
crystalline systems. To this aim we will start from the definition of what a crystal is, and
which are its quantum mechanical properties.
2.1 Crystal lattice properties
Crystals are particularly important. Such systems are characterized by a long range 3D order
of atomic positions, described in terms of: translational symmetry. In sequent paragraphs we
describe some properties of ideal crystals, free of both lattice defects end thermal motions.
First let us consider the so-called simple crystals in which atomic positions coincide with the
points of a Bravais lattice.
2.1.1 Direct and reciprocal lattice
An ideal crystal is the superposition of two elements: the lattice and the basis.
We can define the lattice as a discrete infinite set of points given by the following formula:
Tn = n1a1+ n2a2 + n3a3 (2.1)
Where n1, n2, n3 are integer numbers and a1, a2, a3 are called basis vectors and define the
primitive cell as the smallest repetitive unit of the lattice. The basis are the group of atoms
(or molecules) that are located in correspondence of each lattice point and which define the
physical and chemical nature of a crystalline solid. The basis vectors are univocally
identified (primitive unit cell) providing the volume of the cell is minimal and the three
vector connect the origin of the cell to the nearest neighbors. The primitive cell, which
contains only one lattice point, is the volume of the space that, when translated through all
the vectors in a lattice, fills the space without either overlapping itself or leaving voids. In
addition to translational symmetry each ideal crystal can be characterized by further point
group symmetry.
The point group is the set of symmetry operations which leave a lattice point fixed. A point
group contains rotations, center of inversion and rotoreflections. Groups theory shows that
in three dimensions, only fourteen different Bravais lattices can be defined in terms of
translation symmetry and they are grouped into seven crystal systems.
In addition, taking into account, point group symmetry, other 32 point groups can be

15
identified.
The overall set of symmetry translations and of point group symmetry operations which
leave the crystal invariant can be further classified among 230 space groups.
The minimum set of atoms that generates the crystal cell by the application of space group
operations is indicated as the asymmetric unit. The position r of atoms belong to the
asymmetric unit within the cell is usually given in fractional coordinates ( x1, x2, x3 ) by the
following expression:
r = x1 a1 + x2 a2+ x3 a3 for 0 ≤ xi ≤ 1 (2.2)
Since a crystal is characterized by translational invariance, all the primitive cells generated
by translation of a reference one. More in general, due to this properties, it’s clear that the
whole set of physical properties of the crystal must be invariant under translation, i.e. they
are periodic.
Given a generic physical property ƒ(r), we can write:
ƒ(r + Tn) = ƒ(r) (2.3)
Any periodic function can be described as a Fourier series:
Where Vc is the primitive cell volume:
Vc = |a1 · a2 × a3| (2.5)
For reason that will be clear later, we now introduce the reciprocal lattice, defined by the
set of points K:
K = K1b1 + K2b2 + K3b3 (2.6)
b1, b2, b3 being the primitive vectors of the reciprocal lattice, which are expressed by:
b1 = 2 π 𝒂𝟏 × 𝒂𝟐
|𝒂𝟏 ∙𝒂𝟐 ×𝒂𝟑| b2 = 2 π
𝒂𝟑 × 𝒂𝟏
|𝒂𝟏 ∙𝒂𝟐 ×𝒂𝟑| b3 = 2 π
𝒂𝟏 × 𝒂𝟐
|𝒂𝟏 ∙𝒂𝟐 ×𝒂𝟑| (2.7)
We can notice that, from the dimensional point of view, the vectors described the reciprocal
lattice are wave vectors.A clear relation exist among direct and reciprocal lattice: each direct
lattice is related to one and only one reciprocal lattice and viceversa:
(2.4)

16
(2.8)
In the following paragraphs we will see how the introduction of reciprocal lattice allows us
to describe the quantum theory of crystals.
2.1.2 Bloch’s Theorem In quantum mechanics, all physical systems can be described by using a function dependent
by spatial coordinates, spin and time, called wavefunction ѱ (r, s, t). Thanks to the
wavefunction we can know all the information describing a physical system and its
evolutions. We can obtain ѱ (r, s, t) by solving the time dependent Schroedinger equation:
(2.9)
By considering the separable variables wavefunction ѱ (r, s, t) = T (t) ѱ (r, s), we can derive
the time independent Schroedinger equation, which describes the stationary states of the
system to be studied.
(2.10)
The equation above describes an eigenvalue/eigenfunction problem, where E represents the
energy of each stationary state. In the previous paragraph we explain that all properties of a
crystal system must be translational invariant, for this reason also the Hamiltonian operator
must respect this symmetry. Therefore, if we consider a lattice translation Tn the solution to
the equation:
(2.11)
must coincide to the solution of the equation (2.10). Moreover, since Tn describes the ideally
set of lattice point, an infinite number of eq. (2.11) should be slved. By means of group
theory we can prove that for an ideal infinite crystal that is a system charcacterized by
translation symmetry, an eigenfunction of (2.11) can be written in this form:
(2.12)
Where k is the wavevector and Ф (r; k) are the so-called Bloch’s functions.
For each different value of the k parameter, we obtain a different eigenvalue problem:

17
(2.13)
In other words, the wavevector k allows to transform the general problem of solving the
Schroedinger equations for infinite points into one Schroedinger equation as a function of
the k variable.
It can be demonstrated by Bloch’s Theorem that the eigenfunctions of the stationary state
equation for a periodical potential are the product of a plane wave exp( ik × r ), multiplied
by a function uk (r) having the same periodicity of the crystal lattice.
(2.14)
An important property of the Bloch’s theorem is that Ф (r; k) and Ф (r; k + K) are
eigenfunctions corresponding the same value. As a matter of fact from the application of
(2.3) is obtained:
(2.15)
Being ei×K×Tn = 1
(2.16)
In which Ф (r; k) and Ф (r; k + K) are eigenfunctions of the same eigenvalue and E (k + K)
= E (k).
In the reciprocal lattice, energy bands (that is the set of E(k) eigenvalue) have therefore a
translational symmetry with period equal to K. And we can therefore restricte to study only
the so-called first Brillouine zone, that is the zone ranging from – K and +K values.
Another interesting result is related to the calculation of integrals, extended to the whole
space, of the following form:
(2.17)
where ƒ(r) is a periodic function with the same translational symmetry of the direct lattice
and k, k' points in the first Brillouin zone defined as the geometric locus of the nearest point
to a certain lattice point with respect to all other lattice points. From what has been said
before, the functions u (r, i), u (r; k0) (parts of the periodic Bloch functions) and ƒ(r) can be
expressed as a linear combination of plane waves:
(2.18)

18
(2.19)
By (2.4) we obtain:
(2.20)
And substituting them in the integral, we write:
(2.23)
Given the orthogonality of the plane waves, the terms of the summation are zero unless
k + K + K'' = k' + K', and this condition is satisfied only in the case in which k = k’.
What we have found above demonstrates the benefits of working with Bloch waves in the
case of a periodic potential: as the Hamiltonian operator is periodic, the Hamiltonian matrix
can be transformed into a block matrix where each block refers to a particular point k of the
reciprocal lattice. Each block is independent from the others and then it can be treated
separately. Finally, we note that, given the translational symmetry, the Bloch functions
cannot vanish when we are tending to infinity; in order to solve it they are normalized on a
single cell instead of on the entire space.
2.1.2 Non translational symmetries effects
So far we have concentrated just on translational symmetry, but crystals possess other
symmetry operations which will affect their properties. As we have seen before, a stationary
state in a crystal is described in terms of Bloch theorem. Considering Pr the operator
corresponding to a symmetry operation R belonging to point group of the crystal:
(2.21)

19
If we apply to both sides of a scalar product the same orthogonal transformation, the value
of the product remains unchanged.
(2.22)
If the function uk (r) is a periodic function also the function uk (R-1r) is periodic, because
symmetry operations of a crystal point group move one point to another equivalent one.
We can rename u k(R-1r) with u'(r), substituting what obtained in (2.22)
(2.23)
Being ɸk' the product of a function having the same periodicity of the direct lattice, ɸk' is a
Bloch’s wave. In particular the wave ɸk' has E(Rk) as eigenvalue and Rk as wavevector. In
order to respect the translational invariance of the Hamiltonian operator Ĥ, we write:
(2.24)
The energy bands in the reciprocal lattice have the same non-translational symmetry of
crystal in its direct lattice.
Degenerate eigenfunctions with respect to translational symmetry can be classified with
respect to non-translational symmetry.

20
2.1.3 Born Von Karman boundary conditions
Since real crystal are finite, they are not perfectly periodic.By neglecting surface effects and
introducing appropriate boundary conditions compatible with translational invariance (PBC-
periodic boundary conditions), Bloch’s theorem holds and provides a suitable approximation
for the real case. Considering a crystal composed by N1×N2×N3 cells, according to the
translational symmetry, we can impose that the last cell in each directions coincides with the
first cell of the same direction. If we consider Nj cells along the j direction, in which j = 1,
2, 3, for every integer value of m and j we get :
(2.25)
And
From this expression we can deduce that, in order to agree with translational symmetry and
Bloch’s theorem, only same k values within the first Brillouin zone are possible. In
particular:
n1, n2, n3 are integer numbers. The advantage of using periodic boundary conditions is the
discretization of k-space, on this way we are creating the basis for the physical properties
calculations of an ideal infinite crystal.
2.2 Solving Schrodinger equation for molecular crystals
Since in the previous paragraphs we said that all the properties of a physical system can be
described by the wave function, now our goal is to solve the Schrodinger equation for an
ideal crystal and derive the corresponding wave function. As a first step, we will first
describe a molecular system which is not periodic. We will then introduce straightforwardly
Bloch theorem as described in previous section. We can consider the time independent
Schrodinger equation:
(2.26)

21
Our goal is to solve this equation, where Ĥ is the Hamiltonian operator for a molecular
system composed by M nuclei and N electrons, respectively described by RA and ri vectors.
The distance between the electron i and the nucleus A is riA = | riA | = | ri - RA |, the distance
between the electron i and j is rij = | ri – rj |, and the distance between the nucleus A and the
nucleus B is RAB = | RA – RB |. Therefore, adopting atomic units (a.u , it’s a system of natural
units which is especially convenient for atomic physics calculations) we can express the
Hamiltonian operator:
(2.27)
MA is the ratio between nucleus A and electron masses and ZA is the nucleus A atomic number.
The first term is the electronic kinetic energy operator, the second the nuclei kinetic energy
operator; the third term represents the attraction between electrons and nuclei whereas the
last two terms are the electron-electron and nucleus-nucleus repulsion contributions.
2.2.1 The Born-Oppenheimer approximation
In order to solve the previous equation we have to introduce some approximations. The first
fundamental approximation, which is the basis of all molecular physics and quantum-
chemistry is the Born-Oppenheimer approximation. The nuclei are thousands of times
heavier than the electrons therefore they move much more slowly. This implies that we can
consider nuclei as frozen to study first the motion of electrons in the field of fixed nuclei.
This assumption allows us to neglect the nuclei kinetic energy terms and consider core-core
repulsion as a constant. What remains is the electronic Hamiltonian that describes the motion
of N electrons in the field of M nuclei:
(2.28)
Now we have to solve:
The solution ψelec = ψelec({ri};{RA}) is a parametric function of RA and depends on electrons
coordinates, while electronic energy εelec. In order to get the total potential energy of the

22
nuclear system, we have to introduce the nucleus-nucleus repulsion term in addition to the
eigenvalues of the electronic problem:
(2.29)
We can now write the Hamiltonian operator of nuclei, by taking into account the kinetic
energy og nuclei and their potential energy, the total energy εtot = εtot({RA}).
(2.30)
The solution of this nuclear Schroedinger equation ψnucl = ψnucl({RA}) describes the nuclear
motions, that is vibrations, rotations and molecular translations. In the Born-Oppenheimer
approximation the total wave function will be therefore:
(2.31)
2.2.2 The Hartree – Fock approximation
Except for the hydrogen molecule, the above problem cannot be solved analytically and
approximated techniques have been required to solve the electronic problem.
One of the first approximations ( Hartree approximation) describes the electrons as a system
of non-interacting particles. The interaction between different electrons is taken into account
through a mean potential due to all the electrons themselves. In this situation the Hamiltonian
takes the following form:
h(i) is the operator describing the kinetic and potential energy of the electron I and
the total wave function can be write as the product of the all single-electron wavefunctions
ψi( ri )(orbitals):
(2.32)

23
The total Schrodinger equation is:
The Hartree product is a completely uncorrelated wavefunction, and the probability of
finding the electron 1 in a precise position is independent from electron 2 position, without
taking into account neither the coulombic electron-electron repulsion nor the antisymmetry
principle of fermions. In order to take into account the anti-symmetry principle, a further
step is writing the total wave function in the form of a Slater determinant:
In order to find a solution for the electronic problem, by assuming such a wavefunction, the
variational method is exploited: this principle states that the best wavefunction is the one
minimizing the energy:
(2.34)
Minimizing E0 with respect to the chosen orbitals which entered the slater determinant, we
can derive, the Hartree-Fock equation, giving as a solution the one electron energies ε and
the related orbitals φ.
(2.35)
f (i) is the Fock’s operator:
Where vHF(i) is the mean potential felt by the electron i, due to the presence of all the other
electrons. The goal of the Hartree-Fock approximation is to replace the many-electrons
problem by a single-electron one, in which the electron-electron repulsion is taken into
(2.33)

24
account using an average contribution. Since the vHF(i) depends on the eigenfunctions φ i.
e. our unknows, in order to find the solutions of the Schroedinger equation we have to use
an iterative procedure, called SCF (Self-Consistent-Field). First of all we have to choose
suitable guess orbitals with which we can calculate the initial mean field, This filed is use to
solve for the first time the (2.35), from which new orbitals are obtained as solutions. These
orbitals are used to build a new mean field to solve eqn. (2.35) again. This procedure goes
on iteratively in this way as long as the self-consistency is reached. These orbitals therefore
constitute the solution of the problem. The N orbitals having the lowest energies are the
occupied orbitals. The Slater’s determinant built with these orbitals is the ground state wave
function and it is the best variational approximation of the single determinant form. The
remaining orbitals are called virtual or not occupied. Using the Lagrange’s multiplier
method, we can minimize the Slater’s single-determinant energy in order to obtain the
standard Hartree-Fock equation, whose solution gives the minimum energy wave functions.
Equation (2.35) is an integral-differential equation:
(2.36)
in which:
(2.37)
is the nuclei potential and kinetic energy of the single electron (indicated electron 1).
εa is the energy of the ψa orbital. The second term is the Coulomb’s term, which represents
the classical coulombic repulsion between electrons, the third one is the exchange term, due
to the employment of an antisymmetric wave function in the determinant form. For both
these terms we can introduce a suitable operator:
(2.38)
the Coulomb operator, and the exchange operator:
(2.39)
Now we can rewrite the equation (2.36) as:

25
(2.40)
We can observe that the Fock operator previously introduced in eqn. (2.35) can be written
as:
Therefore Fock’s operator is the sum of the core Hamiltonian operator h(1) and the
Hartree-Fock potential vHF(1).
2.2.3 The Roothaan - Hall equations
The integro-differential Hartree-Fock equations cannot be implemented with efficient
numerical algorithms. However, thanks to Roothaan it’s possible to write the Hartree-Fock
equation in a matrix form suitable for numerical calculations. First of all, it can be
demonstrated that the equation (2.35) can be rewritten by taking into account the spatial part
only. As result the closed-shell Hartree-Fock equations are obtained:
As already mentioned, reliable procedures to obtain numerical solutions have not been yet
found to solve this integro-differential equation. The idea by Roothaan to bypass this
limitation, was to introduce a basis set of known functions to describe the molecular orbitals.
In this way the HF equations becomes a set of algebraic equations resolvable by matrix
algebra. In particular, Roothaan represented molecular orbitals (MO) as a linear combination
of atomic orbitals (LCAO). Atomic orbitals themselves are approximated by a suitable
gaussians contractions. Introducing a basis set of K known functions (ɸμ (r) |μ = 1, 2, . . . ,
K) we can expand MO by a linear expansion:
If ɸμ was complete, we would have an exact expansion. However, due to computational
reasons, we have to use a finite basis set, whose dimension determines the accuracy of the
calculations. According to LCAO method, the unknowns are not φi anymore, but the

26
coefficients Cμi of the linear combination. Indeed, by substituting φi the Hartree-Fock
equation becomes:
FC = SCε (2.41)
The so-called Roothaan-Hall equations. F is the Fock’s matrix, S is the overlap matrix and C is the square expansion coefficients
matrix. The Fock’s matrix is composed by two terms, the first one is about the two-electrons
interactions, the latter regards the core Hamiltonian. The first term of Fock’s matrix depends
on the density matrix and consequently on expansion coefficients Cµi.
F = F(C).
F(C)C = SCε
Hence Roothan’s equations are not linear and an iterative SCF procedure is required. We
have to keep in mind that an overlap matrix is present due to the non-ortonormality of the
basis set.
2.2.4 Crystalline orbitals
Till now we only consider the single-molecule case, this section describes how the
previously theory can be applied to a molecular crystal. First of all we have to introduce the
concept of CO-LCAO [24, 25] (crystalline orbitals as a linear combination of atomic
orbitals). For the CO-LCAO case, wave functions are presented as a Bloch’s functions linear
combination:
(2.42)
At the same time, ɸμ are expressed as atomic orbitals linear combination. In order to do it,
we chose a set nf of localized functions (the AOs basis set) referred to the cell 0: this set will
be replied in all crystal cells in order to create to periodic component µ ( r;k) of nf Bloch’s
functions. In particular, we can define φµ (r-rμ) the μ-esimo AO referred to the 0 cell having
origin in rμ, and φµ (r – rμ – Tn) = φµTn (r-rμ) the corresponding AO referred to the Tn cell.
(2.43)
Substituting the eqn. (2.43) in to the eqn. (2.14), we obtain:

27
(2.44)
The AO orbitals can be built by means of Gaussians contractions.
In this latter case, φμ are linear combinations of gaussians in which both the exponent of
each equations and the combination coefficients are preconditioned and no more modified
by the SCF procedure. Among all basis sets,it is named “ minimal” , the basis set which uses
the smallest possible number of functions describing the atomic orbitals, in other words the
basis set containing just a single occupied atomic orbital in the ground state. A further
evolution is represented by split-valence basis sets, in which we make a distinction between
valence orbitals and core ones, while the latter are presented as a single contraction, the
valence orbitals are described by more contractions in order to gain more accuracy. This
kind of basis sets are indicated with n-ijG or n-ijkG : n stands for the number of primitives
of the single contraction used for the internal shell, while i, k, k are the number of contraction
primitives of the external shell. Some examples are 3-21G or 6-31G. In order to increase the
accuracy in the description of chemical bonds, it’s possible to add “polarization functions”,
which mean adding d type functions on the heavy atoms and p type functions on hydrogen
atoms. So we obtain 6-31G*, 6-31G** etc…in which * represents the use of d functions and
** the use of both d and p functions. Usually, the polarization functions are added as non-
contracted gaussians, thus they inevitably conduce to a significant increase of the
computational cost.
2.2.5 Hartree-Fock equations applied to a periodic system
Using Bloch functions as a basis set, the Fock matrix can be rewrite as [24, 25, 26]:
(2.45)
In which Fμv(Tn) is the matrix element of the Fock operator between the μ-esimo AO located
in the 0 cell and the v-esimo AO located in the Tn cell.
As we have already seen for the operator H(k), also F(k) assumes the form of Bloch’s matrix,
each bloc, having a dimension equal to the dimension of the chosen AOs set for the single
cell, is referred to a different k value and can be diagonalized in an independent way.
The equation (2.41) becomes:
(2.46)

28
From a theoretical point of view, this equation can be solved for an infinite number of k
values belonging to the first Brillouin zone. On the other hand, especially for the case of
semiconductors, the eigenvalues and eigenvectors change vary slowly to the change in k
value. C(k) and E(k) values for the first Brillouin zone are evaluated by means of the eqn.
(2.46) solutions only for e narrow range of k. The k points density must be high enough to
guarantee the electronic energy convergence.
By means of the crystal translational symmetry it is possible to further reduce the number of
Fock matrix integral orbitals to be calculated.
We can observe that:
in which m = Tn – Tn’ is a direct lattice vector.
A generic element of the Fock matrix represented in the reciprocal space
can be reduced to
This last equation is the Fourier transform from the direct space the the reciprocal one of
Fock matrix. This means that the Fock matrix is periodic in the reciprocal space with period
K. More in general, if we introduce SACO (Symmetry-Adapted Crystalline Orbitals) it is
possible to use narrow range of k, by which, applying all point group symmetry operations
of the crystal, it is possible recreate the entire reciprocal lattice [27, 28].
2.2.6 The SCF procedure
1. Bloch’s functions making as a linear combination of local basis sets.
2. Evaluation of the S matrix with respect to the proper basis set.
3. Evaluation of the Fock’s matrix elements in the direct space.
4. S and F matrix representation in the basis functions set for every k point of the
considered set, and then solving the equation:
F(k)C(k) = S(k)C(k)E(k)

29
5. Fermi energy EF calculation that is the maximum energy value for an occupied state
in the first Brillouin zone.
6. Density matrix P construction and its transformation in the direct lattice according
to Fourier transform:
(2.47)
Confining the integration to energy states lower than EF, by means of an Heaviside
function we can include the total amount the empty states eigenfunctions.
7. Convergence check: we have to control if the new density matrix is the same of that
associated to the previous step according to precise convergence criterion. If the
procedure is not conerged we have to go back to the point 3 with the new density
matrix and repeat all the steps.
8. If the calculations converge, we can use the results (C, P, F) in order to compute all
properties of interest, such as the total energy per cell, which includes electrons and
nuclei interactions in the 0 cell with electrons and nuclei of the all crystal.
As we have seen this procedure needs the sums of the all direct lattice infinite vectors, in
order to effort this issue we have to introduce a truncation criteria. Particularly insidious is
the Coulombic interactions case, which for their nature are slowly convergent, this issue is
solved by the Ewald’s method [25].
2.2.7 Long-range interactions calculations
In order to take into account long-range interactions, many codes used to perform quantum-
chemical calculations employ the Ewald’s method. The Ewald summation replaces the
summation of interacting energies in real space with an equivalent summation in Fourier
space. In this method, the long-range interaction is divided into two parts: a short-range
contribution, and a long-range contribution which does not have singularity. The short-range
contribution is calculated in real space, whereas the long-range contribution is calculated
using a Fourier transform. The advantage of this method is the rapid convergence of the
energy compared with that of a direct summation.
This method rewrites the interaction potential as the sum of two terms,
where φsr represents the short-range term whose sum quickly converges in real space, and
φlr represents the long-range term whose sum quickly converges in Fourier reciprocal lattice.

30
The method assumes that the short part can be summed easily; hence, the problem becomes
the summation of the long-range term. Due to the use of the Fourier sum, the method
implicitly assumes that the system under study is infinitely periodic (a sensible assumption
for the interiors of crystals).
The basic idea is to replace the direct summation of interacting energies between particles:
with two summations, a direct sum Esr of the short-range potential in real space
and a summation in Fourier space of the long-ranged part
Where the two terms inside the summations represent rispectively the Fourier tranform of
the potential and the charge density. Since both summation converge quickly in their
respective spaces (real and Fourier), they may be truncated with little loss of accuracy and
great improvment in required computational time. As we said before, due to the periodicity
assumption implicit in Ewald summation, applications of this method to physical systems
require the imposition of periodic symmetry. Thus, the method is best suited to systems that
can be simulated as infinite in spatial extent. Further more, this method is more efficient for
systems with smooth variations in density, or continuous potential functions. Localized
systems or those with large fluctuations in density may be treated more efficiently with the
fast multiple method of Greengard and Rokhlin [29].
2.3 Fundamental principle of DFT
Density functional theory (DFT) is a theory which stands out from all the others theories
based on Hartree-Fock method. The starting point of the quantum mechanical description of
the system is based no more on the wave function, but on the electronic density. For a system
composed by N electrons, the wave function depends on 3N spatial coordinate plus N spin
coordinates, whereas the electronic density depends only on the 3 spatial coordinates. It’s
evident the convenience of a method based only on density. The proof that the properties of
the ground state are a functional of the electronic density has been provided by Honenberg
and Kohn, and it establishes the cornerstone of the density functional theory, and one of the
most important achivements in quantum-mechanics (Kohn has been awarded with the Nobel
prize in chemistry in 1998 for this discovery). In particular, the energy of the ground state
could be write as a functional of the density and it is the minimum possible energy if the
density is exact. Below we can see that this potential exists, but we have no information on
how to built it. Thus DFT is an exact theory in principle, but in practice we need to introduce

31
some approximations (the exchange-correlation function which if exactly determined would
give the exact result).
In this thesis work we propose simulations carried out by density functional theory (DFT).
This paragraph introduces the most general concepts of DFT and we will show how, using
the Kohn-Sham method, the DFT equations assume a form similar to HF equations.
In order to introduce the following arguments, we reintroduce the general Hamiltonian of
the system:
Each term represents respectively the electrons and nuclei kinetic energy, the electron-
electron interactions, nuclei-nuclei interactions and nuclei-electrons interactions. This latter
term in the DFT is represented by the functional Vext[ρ] that is:
(2.43)
Where v(r) is the external potential.
On this basis the Hohemberg and Kohn theorems state:
Theorem 2.3.1: The external potential v(r) could be determine uniquely by the electronic
density ρ(r), except for an additive constant.
Corollary 1: because density ρ(r) uniquely determines v(r), therefore it determines also the
wave function ψ of the ground state.
Theorem 2.3.2: if ρ’(r) is a non-negative density normalized to N, thus E0 < Ev [ρ’(r)], where
Ev [ρ’(r)] is the functional for a state having an external potential determined by a ground
state density ρ’(r). In other words, the ground state density could be computed by variational
method implying the density only.
We have already seen how, given the nuclei position,it is possible to obtain the electronic
configuration ψelec and consequently the charge density 𝜌(𝑟).
The above theorems guarantee also the contrary: knowing 𝜌(𝑟) we are able to univocally
find v(r) and so the nuclei positions as well.
Because also terms representing the electron kinetic energy and the electron-electron
interactions are uniquely determined by electronic density, the system energy could be
written as a density functional (i.e. a function of the function ρ(r)):
(2.44)
we can define the FHK as:

32
(2.45)
Substituting eqns. (2.43) and (2.45) in (2.44) we find:
(2.46)
FHK(ρ) doesn’t depend on the external potential, this is an intrinsic property of the electronic
system; hence FHK(ρ) is a universal function and eqn (2.46) is an exact representation of the
system.
Previous theorems implies the possibility of calculating exactly every stationary quanto-
mechanical parameter. The main issue is that the FHK functional is an extremely complex
physical quantity, for which the exact form has not been determined yet.
2.3.1 The Kohn-Sham method
Based on equation (2.44), Ve-e[ρ] could be divided in two terms:
(2.47)
VH[ρ] represents the classical Coulomb repulsion energy between electrons and can be
written as:
(2.48)
Exc[ρ] collects all contributes due to non-classical electron-electron interactions, the total
energy is thus:
(2.48)
Whereas VH[ρ] and Vext[ρ] can be computed in an exact way, Exc[ρ] and Te[ρ] are
unknown.
In order to simplify the problem related to Exc[ρ] and Te[ρ] Kohn and Sham [12, 15]
proposed a method which consists in substituting the real system with one formed by
independent electrons, characterized by the same density of the real system and with an
effective external potential VKS(r).

33
So we obtain:
(2.49)
Ts[ρ] is the kinetic energy for the non-interacting electrons system and it can be exactly
computed. The exchange-correlation functional Exc[ρ] now gathers all contributes due to the
exchange-correlation energy and to the correction term for TS to obtain the true kinetic
energy.
Comparing (2.49) and (2.48) we obtain:
(2.50)
Exc is the only unknown term of the previous equation, it’s much smaller than VH but it is
extremely important and proper approximation are required for it.
thus its approximation is not an issue.
Let’s introduce now fictitious orbitals ψi(r), named Kohn-Sham orbitals. In this particular
case, energy and density assume the form:
(2.51)
substituting (2.51) in (2.49) and applying the variational principle, we obtain the Kohn-Sham
equations.
(2.52)
in which vxc([ρ], r) is the exchange-correlation potential
(2.53)

34
We now introduce the following Hamiltonian:
in which:
We can also rewrite Kohn-Sham equations in a more compact form:
(2.54)
finally we can rewrite EKS[ρ] taking into account what we found above:
(2.55)
We have to keep in mind that the eigenvalues εi doesn’t have an exact physicalnmeaning
except for the highest energy state eigenvalue which corresponds to ionization potential. The
only unknown term in the above equation is the exchange-correlation functional Exc[ρ], for
which in literature many forms have been proposed.
We can observe that equations (2.54) and (2.52) have a form similar to HF equations, so they
can be solved by the procedure and algorithms exposed in the previous paragraph.
2.3.2 The Exchange-Correlation functional Exc
We already explained that the only unknown term in (2.50), (2.52) and (2.55) is the Exc[ρ]
functional. Many approximations has been proposed to obtain a correct and reliable
descrption of this term and of physical-chemical properties.
Local density Approximation (LDA)
In this approximation the electronic system, which is heterogeneous, is considered locally
homogeneous, so we can write:

35
Where εxcLDA[ρ] is the exchange-correlation energy for the homogeneous gas. The local
density approximation (LDA) involves a very strong approximation on the electron density,
so this method has to be used for system having slowly changes in electronic density. LDA
gives indeed good results for the case of solid metals.
General Gradient Approximation
On the contrary, in the case of molecular solids LDA is not relable. Many different
approaches have been developed in order to solve this problem, for example in some
methods the exchange-correlation functional depends no more on the local density only, but
also on the local density gradient. This kind of approximation is named General Gradient
Approximation (GGA); in this particular case the Exc functional becomes:
Hybrid functionals
In order to obtain better results than LDA and GGA, some hybrid functional have been
developed. In this method a part of the HF exchange is mixed with the DFT exchange
contribution, whereas for the correlation contribution it employs one of the GGA functionals.
An example is the Becke’s B3 in which combination parameters are obtained in a semi-
empirical way obtaining:
ΔExB88 represents the exchange contribution of the Becke’s GGA functional; for Ex
LDA we
use the Slater’s parametrization named S, whereas EcVWN is the LDA contribution for the
correlation. The last term depends on the GGA correlation functional with which B3 is
coupled. In chemical field the B3LYP functional is frequently used.
2.3.3 Dispersion Interactions
In many chemical and macromolecular systems the van der Waals dispersion interactions
play a fundamental role. Many studies have showed that exchange-correlation functionals
proposed so far are not able to describe correctly these interactions. In order to solve this
serious inaccuracy Grimme proposed a simple method to obtain a precise description of
dispersion interactions by adding an empirical potential term in the form C6R-6 to the DFT
energy. More in detail:

36
in which C6ij is the dispersion coefficient for i and j atoms, s6 is the global scaling factor
dipending on the choice of the exchange function, and Rij is the interatomic distance between
the i atom and j atom. In bibliography different combination rules for the dispersion
coefficient have been proposed. In crystal according to Grimme we find:
C6i are the model parameters, and describe the atomic contribution of the crystal atomic
force.
The damping function f dump(Rij) is defined as:
and it is used to turn off the dispersion correction in the short-range region, where DFT
functionals accurately describe the electronic wave function. The RVdW parameter is equal to
the sum of the Van der Waals atomic radii of the i and j atoms and determines the distance
for which the dispersion interactions correction must be activated.

37
Chapter 3
Introduction to vibrational dynamics and vibrational
spectroscopy
In the previous chapter we focused on the solution of the quantum mechanical electronic
problem. We turn now to the descrption of the nuclear motions, occurring in the field
generated by the electrons and of which vibrations are one of the possible atomic motions
displayed by our molecules.
In these grounds, vibrational spectroscopy techniques are indeed both experimental and
theoretical methods which allow to investigate molecular vibrations and to rationalize them
based on intra and intermolecular phenomena. These phenomena are responsible of
structure/properties relationships that is how molecular structure properties can modulate the
macroscopic properties of the materials.
Vibrational spectroscopy is thus a powerful characterization method whose importance
ranges from analytical chemistry to molecular materials science and technology.
This chapter resumes the vibrational spectroscopy basis fundamentals. We can define
spectroscopy as an investigation on the interaction between electromagnetic radiation and
matter. The nature of this specific interaction depends on radiation frequency and we can
study many different aspect of the matter by modulating the frequency. In this chapter we
consider the infra-red rad absorption and the Raman scattering phenomena. These techniques
can be used for a chemical and structural characterization of molecules in a rapid a selective
way. First of all, we have to understand the nature of molecular vibrations.
3.1 The intramolecular potential and normal modes
Let’s consider an isolated system containing a molecular chain composed by N atoms. As
already analyzed in the previous chapter the total intramolecular potential V represents the
sum of potential energy contributions due to the all interactions between all charge particles
of molecule (nucleus-nucleus, electron-electron and electron-nucleus interactions).
Therefore the intramolecular potential depends on the nuclei and electrons positions. Using
the Born-Oppenhaimer approximation it’s possible to compute the potential energy for N
nuclei, hence we obtain:
(3.1)
in which V(ξ)n-n is the Coulombic interactions between nuclei and V(ξ)eff represents the
effective potential due to electrons (i.e. the solution of the electronic problem chap.2). ξ is
the column vector representing the displacement from the equilibrium geometry (in
Cartesian coordinates) of the all atoms of the molecule to be studied.

38
V depends on 3N variables, and it is possible to obtain a good approximation in the
neighborhood of the minimum energy point of the system by using a Taylor’s series at
second order to obtain an harmonic potential (mechanical harmonic approximation),
arranging the reference system origin in the minimum energy point, on this assumption the
first two terms of the Taylor series are zero and the potential becomes:
(3.2)
in which fijx are the strength constants and ξi and ξj are the Cartesian displacement along the
j and i directions. We shall recall that neglecting orders higher than the second means the
forces among atoms are assumed being elastic. The strength constants fijx represent, in the
case for which i = j, the restoring forces between adjacent atoms, otherwise for i ≠ j the
interactions between non-directly related atoms.
By introducing the mass-weighted displacements q = M1/2ξ we get:
(3.3)
in which fijq are the strength constant for the mass-weighted coordinates q.
Now the molecule kinetic energy is:
(3.4)
and by applying the Lagrange equation of motion:
(3.5)
we obtain 3N differential equations of the following form:
(3.6)
The solution can be looked for in the following form:

39
(3.7)
Where λk = 4π2c2vk2, c is the light speed in vacuum, vk is the vibrational frequency in cm-1
and εk the phase angle of the vibrational mode k. Hence many different vibrational modes
do exist, the so-called normal modes, each of which is characterized by a specific vibrational
frequency vk and by a vector Ak which collects all the oscillation amplitudes of the qk
coordinates. We can label as Q the vector gathering the vibrational normal modes, to obtain:
q = AQ,
in which A is the transformation matrix from the normal coordinates to the mass-weighted
coordinates. In order to obtain A we can substitute the eqn (3.7) in ( 3.6) obtaining:
in which δij is the Kronecker’s delta. Non-trivial solution are obtained by vanishing the
determinant:
(3.8)
This is called secular equation, from which we get 3N eigenvalues λk, associated to 3N-6 vibrational pure modes and six zero eigenvalues representing the rotations and translations
motions of the molecule as a rigid body. From now on λk will refer to the non-zero
vibrational eigenvalues only. Substituting the eigenvalues in the equation (3.3) we can find
the 3N-6 eigenvectors Aik which give us the vibrational amplitudes for every q coordinates,
i.e. they describe how the atoms are moving in the vibration of frequency vk. Amplitudes
have been determined by imposing eqn.(3.8), thus they will not be linear independent.
Therefore, obtaining all Aik values is not possible and we can get their ratios only. In order
to determine Aik values a normalization is necessary:
in which
(3.9)

40
We can observe that the problem represented by the previous equations can be solved by
using the matrix algebra, where Fq represents the force constants matrix.
(3.10)
In which Λ is a diagonal matrix (3N-6) x (3N-6) having the eigenvalues λk on its own
diagonal. We can now write kinetic and potential energy as a function of the normal modes
Q.
By this way we have described the kinetic energy in a diagonal form.
Now, taking into account the relation q = M1/2ξ, we can write:
(3.11)
In conclusion, we have described molecule as a set composed by 3N-6 uncoupled harmonic
oscillators, having vibrational frequencies vk. During every normal mode, all atoms vibrate
at the same frequency (the so-called characteristic frequency) with different vibrational
amplitudes described by Ak, every real molecular motion can be obtained as a combination
of normal modes.
In addition to Cartesian or mass-weighted coordinates, the vibrational problem can be
described also by internal coordinates (see Fig. 3.1). We can notice that using internal
coordinates we have a smaller number of variables, 3N-6 for a molecule composed by N
atoms. Furthermore, internal coordinates for a polyatomic molecules have a direct chemical
meaning, such as: chemical bonds stretching (stretching), valence angles deformations
(bending), angular deformation with respect to a molecular plane (out of plane bending) and
torsional angles variations.
Figure 3.1 – Internal coordinates

41
3.2 Infra-red intensities
In the previous section we analyzed the vibrational properties to understand the meaning and
the origin of vibrational frequencies and normal modes.
Vibrational frequencies can be measured by IR or Raman spectroscopic measurement as the
position of the absorption / scattering bands, but they are not the not the only observable that
can be measured. Indeed, also the intensity of these bands (i.e. IR or Raman intensities) are
important quantities.
According to classical electrodynamics a system emits radiation by virtue of periodic
changes in its electric dipole moment and the frequency of emitted radiation is the same as
that of the dipole oscillations. Absorption is the inverse of emission, and so the system is
able to absorb electromagnetic radiations. Infra-red spectroscopy is generally concerned with
the absorption of radiation incident upon a sample. These absorption corresponds to the
excitation of the vibrational normal modes of the system.
The electric dipole μ of a molecule is a vector, and so it has three components μx, μy, μz in a
Cartesian coordinates system. On the basis of classical electrodynamics we can say that the
molecule will only be able to absorb (or emit) radiation of the frequency v, provided that μ
(or in greater detail at least one of its three components) can oscillates with this frequency.
Now the dipole moment is a function of the nuclear configuration and so, when the molecule
vibrates, it varies correspondingly. In the simple-harmonic approximation, all the molecular
vibrations can be regarded as superpositions of a limited number of normal modes, each with
its own normal frequency vk. It follows therefore that electric dipole moment can only
oscillates with these normal frequencies, and that only radiation with these frequencies can
be absorbed, (and they lie in the infra-red region of the spectrum). We shall see later that, in
the case of certain normal modes, due to implicit properties of our molecules, the amplitudes
of vibration of μ may necessary be zero. Due to proper selection rules the intensity of
absorption of radiation of the corresponding normal frequency will then also be zero. And
the transition is forbidden.
In general, the magnitude of the components of the molecular dipole moment will be
functions of all the vibrational coordinates Q, and also in this case a Taylor expansion can
be introduced. We may conveniently adopt the convention whereby the three separate
expression for μx, μy, μz are all implied by the single condensed form
𝝁 = 𝝁𝟎 + ∑ {(𝜕𝝁
𝜕𝑸𝒌)
𝟎 𝑸𝒌}𝒌 + higher terms ( 3.12 )
Since all the amplitudes of the normal vibrations are very small. It is a good approximation
to neglect terms of higher than the first degree in the Qs (electrical harmonic approximation).
We may therefore write:
𝝁 = 𝝁𝟎 + ∑ {(𝜕𝝁
𝜕𝑸𝒌)
𝟎 𝑸𝒌}𝒌 . ( 3.13 )

42
Evidently the condition that the molecular dipole moment shall be able to oscillate with the
frequency vk, i.e the condition that this normal frequency shall be capable of being absorbed,
is that:
(𝜕𝝁
𝜕𝑸𝒌)
𝟎≠ 0
for at least one of the components (i = x, y, or z).
This is a general statement of the selection rule or infra-red absorption. It is clear that these
selections rules are the results of two special approximation adopted. The first is that the
molecular vibrations are simple-harmonic, otherwise the normal modes would not be
separable and the meaning of the individual normal coordinates Qk would be lost. The second
assumption is that in the Taylor expansion of the electric dipole moment represented by eqn
(3.12) all the higher terms are negligible. As already mentioned these are called mechanical
and electrical harmonic approximation and all those effects lying outside their range of
validity are called “anharmonic” effects and usually play a minor (but not negligible) role in
spectroscopic analysis.
As we said before, if we know the characteristic frequency of a molecule, we are able to
obtain some information about chemical bonds strength between atoms of the molecule
itself. Another data that we can acquire from the infra-red spectroscopy is the absorbed
radiation intensity related to the variation of the dipole moment, and thus to the charges
distributions of our system also from this parameter it is possible to rationalize peculiar intra
and intermolecular phenomena. The light intensity is defined as the number of photons
through a unit beam cross-section per unit of time. Infra-red spectra show, depending on the
frequency, absorbing bands. The absorbance is defined as:
(3.14)
In which I(v) is the transmitted radiation from the sample, whereas I0(v) is the incident
radiation. Spectra are usually plotted as a curve where on the x-axis we have the wave
numbers and on the y-axis the absorbance. The amplitude of the peaks depends on the
number of molecules along the incident beam path and on the magnitude of the interaction
between the incident radiation electric-field and the molecule dipole moment.
3.3 Classical theory of Raman scattering
The Raman spectroscopy measures the vibrational motions of a molecule such as infrared
spectroscopy. The physical phenomenon is, however, different from infrared spectroscopy.
In Raman spectroscopy one measures the light scattering while the infrared spectroscopy is
based on an absorption process. Raman scattering takes place when the incident electric field
induced a dipole moment through a polarizability variation of the molecule, so we can state

43
that in the Raman effect we have an electronic perturbation. This change in polarizability
can be saw as a shape distortion of the electronic cloud around the nucleus.
Figure 3.2 – electronic cloud distortion due to an applied electric field
The induced dipole moment will be oscillating because stimulated by an oscillating electric
field, so the amplitude of radiation emitted by the dipole moment will be:
in which P is the induced dipole moment:
P = α · E (3.15)
where in this case α is the polarizability and E is the oscillating electric field:
(3.16)
If now we consider a normal mode q of frequency vk and describe as:
(3.17 )
Such as the dipole moment, the electric polarizability of a molecule will in general be a
function of all the normal vibrational coordinates. We may therefore expand α as a Taylor
series with respect to these coordinates and neglect powers higher than the first. We thus
obtain:
(3.18)
In this equation, α0 is the polarizability tensor in the equilibrium configuration of the
molecule, and the derivative in the second term is the so-called derived polarizability for the
kth normal mode.

44
Substituting equations (3.16) and (3.18) in (3.15) we obtain this expression:
Since every component of α0 is simply a molecular constant and every component of E
oscillates with the incident light frequency v0 , it follows that the corresponding part of every
component of P must oscillate with this same frequency. Thus light of the incident frequency
v0 will be emitted and will be observable in directions which differ from that of the incident
light. This is the phenomenon known as classical or Rayleigh scattering. It is of no interest
to us, as it in no way involve the vibrations of the scattering molecule. We can therefore
ignore the first term on the right hand side of the equation.
Considering now the second term, let us fix our attention on the contribution from the
particular vibrational mode with the normal coordinate qk. We can notice that under a
specific condition all the corresponding contribution to all the components of the induced
dipole are characterized by the two new frequencies v0+vk and v0-vk called Stokes and anti-
Stokes lines.
They constitute the contribution of the kth normal mode to the Raman spectrum of the
scattering molecule. The frequency shifts are known as Raman frequencies. They are equal
to the normal vibration frequencies of the molecule investigated, such as might have been
observed directly in the infra-red.
Clearly the condition that a particular normal frequency vk shall be active in Raman
scattering is that:
(𝜕𝛼
𝜕𝑞𝑘) ≠ 0
for at least one of the component of the polarizability tensor α.
This classical description of Raman scattering allows to understand in a qualitative way the
nature of the interaction, but it doesn’t provide any kind of quantitative information. For
example, a classical description would expect that Stokes and anti-Stokes lines have the
same amplitude, but this is not true (it will be explained later). We can depict the different
Raman scattering stages in the following picture:

45
Figure 3.3 – Simple representation of the energy levels involved in Raman scattering.
Stokes line are provoked by a virtual transition from the g, v (electronic ground state) to
the virtual level m. The anti-Stokes lines are due to a transition from the ground state to a
virtual level m’. In a more detailed description we can state that Raman interactions leads
to two possible outcomes:
- The material absorbs energy and the emitted photon has a lower energy than the
absorbed photon. This outcome is called Stokes Raman scattering.
- The material loses energy and the emitted photon has a higher energy than the
absorbed one. This outcome is called Anti-Stokes Raman scattering.
The energy difference between the absorbed and emitted photon corresponds to the energy
difference between two resonant states of the material and is independent of the absolute
energy of the photon.
Thanks to Boltzmann’s statistic, in a system having a specific temperature, the lower energy
state m results more populated and so the transition probability from this level is higher than
from the state m’. Therefore, on this basis we can understand why the Stokes lines are more
intense than anti-Stokes ones. The quantum theory of Raman scattering is quite complex, we
just say that only transition between neighboring energy levels (Δv=+-1) are permitted and
selection rules imposed by symmetry do exist in harmonic approximations.
For what concerns the Raman scattering intensity of a single molecule, from a classical point
of view, we can state:
in which the terms inside the summation represent the derivatives of the polarizability tensor
components with respect to a specific normal mode.
3.4 Instrumentation for vibrational spectroscopy

46
3.4.1 IR spectrometer
The spectrometer we used for the infra-red spectroscopy is a NEXUS FT-IR made by
Thermo Instruments.
This instrument is composed by five main parts, that are:
Radiation source.
IR intensity modulation through
interference between different monochromatic
components
For the sample placement
Optical signal recording
System for the monitoring and elaboration
of the signal by means of Fourier transform
Technical specifications
Detectable wave length range: 6000-400 cm-1
Radiation sources: Silicon carbide.
Detector:
- DTGS thermoelectrically cooled.
- MCT cooled by liquid nitrogen.
Modalities: analysis by Fourier transform.
Maximum resolution: 0.125 cm-1.
SOURCE
INTERFEROMETER
SAMPLE-HOLDER
DETECTOR
MONITORING
ELECTRONIC

47
Interferometer: Michelson type.
Microscope: infra-red microscope Thermo Nicolet Continuµm IR
made by thermo instruments.
Objective:
- IR Cassegrain 15x
- Visibile 10x
- Cassegrain grazing angle 32x
Modalities:
- reflection
- transmission
- ATR “single bounce” made in silicon
Minimum analyzable area: 50µm2
Detector: MCT
The image of the optical bench is the sequent:
Figure 3.4 – Optical path of the infra-red radiation.
The source is heated by Joule effect up to 1200°C applying an electrical current. At this
temperature, the black body emission is maximum in the IR region. The emitted radiation is
focused on a diaphragm which calibrates the beam diameter sent to the interferometer. The
single monochromatic components are subjected to an interference process which modulates
the intensities. The exiting radiation is made pass through the sample to be analyzed and
collected by a detector. The recorded signal is the interferogram composed by the
convolution of the single component intensities.

48
Figure 3.5 – Infrared radiation optical path toward the microscope.
When we use microscope the optical path is different, the exiting radiation is directed toward
the microscope and focused by means objectives placed above the sample. Radiation then is
collected by the microscope optic in order to be directed toward a detector located inside the
microscope itself.
The conversion mathematic operation allows us to pass from the recorded interferogram to
the vibrational absorption spectrum is the Fourier transform.
Samples have to be placed through supports transparent to the infra-red radiation.
Figure 3.6 – Nicolet Nexus Ft-IR spectrometer.
3.4.2 Raman spectrometer
The spectrometer used during our experimentations is HORIBA JOBIN YVON LabRAM
HR800.
The instrument is composed 5 subsets:

49
Exciter monochromatic radiation source
Focalization and collection of the light diffused by the
sample
Monochromator + detector for selection and recording light
diffused by the sample
Series of mirrors, lens, filters and clefts, all these
components constitute the optical path
The hardware and software interface for the elaboration
and monitoring
Photons coming from the laser are directed to the instrument inlet through a mirrors system
and filtered by an interferential filter in order to remove the spurie lines. A series of filters
having a variable optical density adjust the power, then they direct photons toward the LIRS
system which in turn reflects light toward the sample. The radiation emitted by the sample
then is transmitted by the LIRS system into the spectrometer.
The entering radiation is diffracted by a flat lattice and then it’s sent to the detector in order
to be recorded and developed.
Laser
Diode laser:
- λ = 784.5 nm
- polarization of 45 degree in the x-y plane of the samples-holder
LASER
MICROSCOPE
SPECTROMETER
OPTIC
ELECTRONIC
MONITORING

50
Argon ions laser:
- λ = 514.53 nm
- polarization parallel to the y-axis of the x-y plane of the sample-holder
Microscope
Olympus BX41 microscope with lens
- 10x NA 0.25
- 50x NA 0.7
- 100x NA 0.9
A camera allows us to observe the sample image and where laser is illuminating.
Spectrometer
The spectrometer used a CZERNY TURNER ASIMMETRIC configuration and has a depth
of focus of 800 mm. We can use different diffraction lattices placed upon a specific turret.
Diffraction lattices
The spectrometer is provided with three lattices having 600, 1800 and 2400 lines/mm,
optimized for its specific laser sources.
The choice of the lattice is based on the laser source we are going to use, we want to underline
different lattices, means different resolution: the higher is the lines density, the higher is
dispersion and so the resolution.
The spectrometer gives us a quasi-constant dispersion in λ (0.05 nm/mm for a lattice having
1800 lines/mm). The dispersion formula is:
in which n is the diffraction order and N the number of lines per mm.
Detector
CCD detector cooled by Peltier cells, of 1024x256 pixel.
Spectrometer inlet optic

51
The optical instruments are:
- Mirrors
- Different optical density neutral filters
Table 3.1 – Power attenuation due to different optical density D filters inside the optical path.
-LIRS system: Laser Injection Rejection System: this system is composed by a notch filter
and a mirror, thus laser is totally reflected by the filter toward the sample and the Raman
scattering is completely transmitted toward the spectrograph inlet through the filter.
Electronic monitoring
The hardware and software interface for acquisition parameters monitoring and the contents
development.
- Hardware: allows us to control gaps, lattices, shutters, camera and the alignment
system.
- Software: the informatics program LabSpec through which we can define many
acquisition parameters, such as: spectral range, acquisition time and number.
3.4.3 FT Raman spectrometer
NXR 9650 FT-Raman made by Thermo Scientific.
The instrument is composed by the sequent sections:
POWER ATTENUATION

52
LASER radiation source.
Sample placement.
Modulation of the light diffused by the sample.
Acquisition system.
Monitoring system for the signal development by Fourier
transform.
Technical specifications
Spectral range: 100-4000 cm-1
Source: laser Nd: YAG, λ = 1064 nm, power 2W.
Detector:
- Liquid nitrogen cooled Germanium.
- Thermoelectrically cooled InGaAs.
Interferometer: Michelson type.
Beam-splitter: optimized silicon on CaF2 for NIR.
Resolution: 1-4 cm-1.
Measure modality: Fourier transform.
The optical table is represented by the sequent figure:
SOURCE
SAMPLE-HOLDER
INTERFEROMETER
DETECTOR
ELECTRONIC
MONITORING

53
Figure 3.8 – FT Raman optical table.
The laser beam is focused on the sample inside the instrument and the diffused radiation is
collected by a mirror and sent to the interferometer.
Similarly to the IR spectroscopy the Raman scattering spectrum is obtained through Fourier
transform.
Figure 3.9 – NXR 9650 FT-Raman made by Thermo Scientific.
3.4.3 Portable Raman spectrometer
Raman analysis during the tensile test on Twaron fibers were performed using a portable i-
Raman 785 spectrometer produced by B&W Tek. The Raman module (17 x 34 x 23 cm and
approximately 3 kg) was equipped with a CleanLaze (B&W Tek) laser emitting at 785 nm
with a continuously adjustable power from 0 to 450 mW and 600 groove/mm grating, which
disperses the scattered light on a thermoelectrically cooled CCD (2048 pixels), covering a
spectral range of 175-3200 cm-1 at a resolution of approximately 4 cm-1. Spectral data-
acquisition software, BWSpecTM, installed on a portable computer was used for the control
of the spectrometer and the collection of Raman spectra.

54
Figure 3.10 – Portable i-Raman 785 made by B&W Tek.

55
Chapter 4
Characterization of PPTA vibrational spectra
This chapter deals with the spectroscopic characterization of Kevlar by means of both
experimental and computational techniques. In particular, it analyzes how, by means of
computational methods based on density functional theory (DFT), we were able to assign in
details the vibrational spectra of this polymer to give a detailed interpretation of the intra and
intermolecular effects ruling its structure and properties. In order to choose the best method
describing the above-mentioned molecular system, a precise setup of the calculation is
required including a proper comparison between different functionals and basis sets. Starting
from an isolated chain model, we first applied the “oligomer approach” by using small
molecular models of increasing length up to the real infinite chain (described as a 1D crystal)
in order to study the peculiar intramolecular effects ruling the vibrational properties of
Kevlar. We then described it in its true crystal packing to investigate also the relevant
supramolecular effects. To completely characterize the behavior of this polymer,
calculations have been complemented by an experimental investigation, carried out in our
laboratory.
4.1 Experimental spectra
A few spectroscopic characterizations of Kevlar are found in the literature, but most of
them are not accurate enough for a detailed investigation of its properties. For this reason,
we chose to carry out experimental IR and Raman measurement in our laboratory, in order
to obtain reference spectra with reliable and controlled conditions. Twaron (PPTA fibers
produced by Teijin) samples have been kindly provided by Prof. Claudia Marano (Polimi).
IR spectra
IR spectra have been recorded by means of Nexus FT-IR spectrometer, we have performed
analysis both by using a non-polarized radiation source and by means of a polarizer filter.
Polarized IR spectra has been recorded locating the PPTA fiber axis at 0° and 90° with
respect to the electric field vector of the incident light. Unfortunately, no sufficient detailed
spectra have been found in literature for a comparison. All characteristic features of each
spectrum will be explained in the following sections.

56
FT-Raman spectra
FT-Raman analysis have been carried out by means of NXR 9650 FT-Raman spectrometer.
Spectra has been recorded with sample located with both a vertical and horizontal
arrangement on the sample holder. Some difference, between the two spectra (horizontal and
vertical arrangement), could be observed especially for low frequencies, but for a detailed
description of the polarization effects on the Raman spectra a more complex and precise
experimental set up is required and it will be not treated in this work.
Figure 4.1- Twaron IR spectra performed by means of non-polarized radiation source, and
by a polarized light locating the fibers axis along (0°) the electric field of the incident beam
and perpendicular (90°) to it .

57
In [1] a Raman spectrum of good quality has been reported by Washer and Brooks, as we
can observe in Figure 4.3 Washer-Brooks spectrum and our experimental Raman spectrum
perfectly match and in our case a better resolution is also obtained.
Figure 4.2 – Twaron FT-Raman spectra performed locating the fibers sample with vertical
and horizontal arrangement on the sample holder.
Figure 4.3 – Comparison between Experimental Raman spectrum performed in our
laboratory, and Raman spectrum proposed by Washer and Brooks in [1].

58
Raman spectrum performed with portable spectrometer
In order to verify the reliability of the portable Raman spectrometer, which will be used for
the vibrational spectroscopic analysis of Kevlar fibers subjected to a tensile strain, a
comparison with the NXR 9650 FT-Raman spectra has be made. Both spectra, recorded by
means of the portable spectrometer, have been performed by a polarized laser beam with a
wavelength of 785nm. As we can deduce by the comparison below, the portable
spectrometer is a bit noisy at high frequency, but after all the Raman spectra are of very good
quality and resolution, thus assessing the reliability of the spectrometer for the aims of the
work.
4.2 Computational details
The quantum-chemical calculations carried out in this thesis have been performed by means
of two different codes, Gaussian09 [33] and Crystal14 [34]. By means of Gaussian 09 we
carried out the fully geometry optimization and frequencies calculations for the following
models: one single Kevlar monomer, one Kevlar chain formed by 2 monomeric units and
two interacting Kevlar chains each composed by two monomeric units. In all these models,
we used CH3 endgroups since no periodic boundary conditions are applied and finite-length
models are adopted. These groups are arbitrary chosen and related vibrational modes would
give spurious bands in the simulated spectra, therefore with the intent of simulating the
Figure 4.4 – Comparison between Raman spectra performed by NXR 9650 FT-Raman
spectrometer, and Raman spectra recorded by portable Raman spectrometer.

59
dynamic effect of the whole macromolecular chain and to make negligible the influence of
the terminal groups, we also post-processed the calculations increasing the mass of the atoms
belonging to the terminal groups. More in details, we chose to increase the mass of the carbon
and hydrogen atoms, belonging to the methyl groups, of three orders of magnitude,
simulating the “weight” and thus the kinetic contribution of the missing part of the chain.
The effect of the “heavy” atoms results in lowering significantly the frequency of the
vibrational contributions due to methyl groups, isolating them from the characteristic region
of the IR and Raman spectra. As result we obtain a theoretical spectra closer to the
experimental ones. The whole set of Gaussian09 calculations has been performed in the
framework of DFT, employing the hybrid exchange-correlation potential B3LYP and the
basis set 6-31G(d, p).
Table 4.1 - Oligomer models investigated by means of Gaussian09
PPTA single monomer
PPTA two monomers
PPTA dimer

60
Fully geometry optimization and vibrational spectra calculations both for the Kevlar 3D-
crystal and for the infinite single Kevlar chain (1D crystal), have been carried out by means
of CRYSTAL14 code, in the framework of DFT and by adopting periodic boundary
conditions (PBC) (i.e. describing infinite systems). In order to assess the best method
describing the structure of Kevlar crystal, these calculations have been carried out by
adopting two different functionals, B3LYP and PBE0, and two different basis sets, 6-
31G(d,p) and pob-TZVP (suitably developed for crystal calculations). The aim of performing
calculations also for the isolated Kevlar chain, is to deeply understand, by employing the
single molecule vibrational frequencies and eigenvectors, the vibrational normal modes of
the crystal and the influence of inter-molecular interactions on the spectra.
All calculations made by means of Crystal14 include the empirical correction for dispersion
interactions proposed by Grimme [13, 14], and a more detailed description of this method
has been already reported in the previous section (2.3.3). According to previous works on
the subject [14] we chose the following empirical parameters:
Table 4.2 - Summary of the C6 and RvdW parameters adopted in the present work for the Grimme’s
empirical dispersion correction. A cutoff distance of 25.0 Å was used to truncate direct lattice
summation. C6 are in units of J nm6 mol-1 RvdW are in unit of Å. For the d parameter a standard
value of 20 has been chosen and for s6 parameter a value of 1.00.
In order to obtain a better matching with experimental results, all frequencies computed by
CRYSTAL14 and Gaussian09 have been scaled by factor of 0.9614 for the B3LYP/6-31G(d,
p), 0.9688 for B3LYP/pob-TZVP, 0.9512 PBE0/6-31G(d, p) and 0.9594 for the PBE0/pob-
TZVP. Furthermore, to obtain a correct comparison among the different models adopted, all
intensities have been normalized to one monomeric unit.

61
4.3 Crystal full geometry optimization
In order to obtain a reliable geometry and hence a reliable prediction of the vibrational
spectra, a “full” geometry optimization, of both the atomic positions and the cell parameters
of the crystalline system is required.
To carry out a full geometry optimization by means of CRYSTAL14 code we need some
input data, such as atomic Cartesian coordinates, space group symmetry of the system and
lattice parameters of the unit cell. All these structural information have been found in
literature [31] based on experimental measurements. In particular, we found a model for the
crystal and molecular structure of poly (p-phenylene terephthalamide) on the basis of an x-
ray diffraction study. All the reflections observed by the PPTA diffraction pattern, could be
satisfactorily indexed by assuming a monoclinic (pseudo-orthorhombic) unit cell with
dimension a = 7.87Å, b = 5.18Å, c = 12.9Å and γ being approximately 90°, as reported in
Table 4.3.
Due to steric hindrance, in particular repulsion between the amide hydrogen and an ortho
hydrogen within the phenyl group of the molecule, coplanarity of the planes through the
centeres of the atoms of the amide groups and through the centers of the atoms of the
phenylene groups had to be excluded [32].
The orientation angles of the axes, defined by the carbon atoms in the one and four positions
of both phenylene groups, with respect to the c axis is approximately 6° for the para-
phenylenediamine segment and approximately 14° for the terephthalic segment, implying a
different tilt angle for each segment. Furthermore, an angle of -30° between the amide plane
and the terephthalic segment, and an angle of 38° between the amide plane and the phenylene
plane of the p-phenylenediamine segment have been found.
Table 4.3 – Comparison of the unit cell data of poly(p-phenylene terephthalamide), poly(p-
phenylene oxide) and poly(p-phenylene sulphide) as reported in Ref.[31].

62
The most significant intramolecular interactions governing the molecular conformation, are:
the resonance effect trying to stabilize coplanarity of the amide groups and the phenylene
groups, the counteracting steric hindrance found between the oxygen and an ortho-hydrogen
of the p-phenylene diamine segment, and the steric hindrance between the amide hydrogen
and an ortho-hydrogen of the terephthalic segment.
In the literature [31, 35], due to the presence of stereochemically centrosymmetric segments
together with the possibility for the amide group to form centro-symmetric pairs of hydrogen
bonds, it is suggested that the most favorable symmetry may indeed be Pn.
As already explained, the full geometry optimization has been carried out with two different
exchange-correlation functionals (B3LYP and PBE0) and two basis sets (6-31-G(d, p) and
pob). Unfortunately, vibrational frequencies calculation by means of PBE0/pob-TZVP,
despite numerous attempts, failed to converge. A table reporting the results of the
optimization and the geometrical error with respect to the starting experimental data are
reported below:
(a) (b)
Figure 4.5 – (a) A layer of hydrogen-bonded chains. Projection parallel to the a axis. Glide
planes n with orientation (001) are located halfway between the centers of the phenylene
groups.(b)Fracional positions in the unit cell. All these data are taken from Ref.[31].

63
Table 4.4 – Summary of the unit cell parameters obtained by four different full geometry
optimizations, each carried out by means of different exchange-correlations functionals and basis
sets. The parameters a, b, c are expressed in Angstrom, the value the percentage error with respect
to the experimental model is reported in brackets.
Functional
Basis set
a
b
c
α
β
γ
Total
Error
(%)
B3LYP
6-31G
(d, p)
7,994198 (+1,57%)
5,177199 (-0,05%)
13,04411 (+1,11%)
90°
109,9875°
(+22%)
90°
6,18
pob-TZVP
7,372264 (-6,32%)
5,196993 (+0,32%)
12,98725
(0,67%)
90°
108,6811°
(+20%)
90°
6,82
PBE0
6-31G
(d, p)
7,588622 (-3,57%)
5,168784 (-0,21%)
12,97547 (+0,58%)
90°
108,9198°
(+21%)
90°
6,34
pob-
TZVP
7,130465 (-9,39%)
5,153160 (-0,51%)
12,91611 (+0,12%)
90°
106,0202°
(+17%)
90°
6,75
Experimental data
7,87
5,18
12,9
90°
90°
90°
-
Referring to the total error illustrated in the table 4.3, we can notice that the method which
provides a structure as close as possible to the real crystal is the one adopting B3LYP/6-
31G(d, p). For this reason, “oligomers models” and stretching of Kevlar chain calculations
will be carry out only by means of these functional and basis set. 1D crystal model has been
computed also with the other functionals and basis sets, in order to provide a comparison
with 3D crystal calculations and to understand which method better describe the
intermolecular interactions.
4.4 Vibrational spectra prediction of PPTA oligomers
Many mechanical and thermal properties of molecular systems, such as Young modulus,
glass and melting temperatures, of many of polymers, (e.g Nylons, PPTA (p-phenylene
terephthalamide)), are widely influenced by Van der Waals interactions and Hydrogen

64
bonding between molecular chains [1, 2, 19, 21]. Solvents or a prolonged exposure to heat
may affect significantly these inter-molecular interactions, inducing a significant change in
material performances. This suggest that changes in the material on a molecular scale
resulting from external variables such as stress, temperature, moisture, etc.., may be
detectable by examining the features of vibrational spectra.
In order to study the influence of the inter-molecular forces on the vibrational spectra, we
performed fully geometry optimization and vibrational normal modes calculations for the
case of Kevlar oligomers. We then carried out comparison with the CRYSTAL calculations,
with the aim of pointing out the main differences due to the effect of intermolecular
interactions
4.4.1 PPTA monomer
As a first case, we consider the simplest model that we can use to simulate the properties of
PPTA as a single monomer with CH3 endgroups (see figure 4.6).
Figure 4.6 – PPTA monomer with methyl groups as terminal groups
For this model a full geometry optimization and vibrational frequencies calculations have
been carried out by means of Gaussian09 code, at B3LYP/6-31G(d, p) level of theory. We
report in the following the picture of the computed spectra and a table with frequencies and
IR intensity values and normal modes assignments.

65
Figure 4.7 – DFT computed (B3LYP/6-31G(d, p)) IR spectrum of PPTA monomer model.
Table 4.5- DFT computed vales of frequencies and IR intensities and normal modes assignment of
PPTA monomer model.
Frequency (cm-1) (scaling factor 0.9614)
IR Intensity ( km/mol )
Respective vibrations
397
91
541
75
1218
169

66
1310
201
1390
80
1453
79
1511
659
1576
63
1615
68
1683
224
1709
168
3039
23
3483
23
3496
14

67
Figure 4.8 – DFT computed (B3LYP/6-31G(d, p)) Raman spectrum of PPTA monomer model.
Table 4.6- DFT computed vales of frequencies and Raman intensities and normal modes
assignment of PPTA monomer model.
Frequency (cm-1) (scaling factor 0.9614)
Raman activity (A4/amu)
Respective vibration
1167
342
1218
919
1313
412

68
1262
917
1453
666
1511
1213
1595
2892
1615
1860
1683
262
1709
288
3080
101
3483
267
3496
173
This model allows to carry out a first characterization of the most significant marker bands
of the PPTA vibrational spectra, keeping in mind that this is just a very simple model of the

69
real polymer. We will analyze in next section the changes occurring in the spectra when
taking into account more reliable and complex PPTA molecules.
In any case, we can recognize obviously some features (having slight differences in
amplitude and frequency) that we will find also in the IR and Raman spectra of the whole
crystalline system: N-H stretching mode are predicted at 3483 and 3496 cm-1, C-H stretching
mode from 3052 to 3138 cm-1; at 1683 and 1709 cm-1 we find C=O stretching mode (amide
I); at 1615 and 1595 cm-1, aromatic ring vibrations are obtained; at 1453 and 1511 cm-1, N-
H bending, C-N stretching and C=C aromatic ring stretching vibrations (amide II band) are
found. All these values, are in agreement with previous experimental characterizations [1,
19, 23].
Bands exclusively due to methyl group vibrations, have not been mentioned here, since they
are spurious bands due to the model adopted in this calculation and they are not observed for
the real polymer.
Effects of the terminal –CH3 groups on the vibrational spectra
The “oligomer approach” that we are using (i.e. describing the polymer by means of a small,
short length oligomer), has two implicit strong approximations. From one hand,
intermolecular interactions are completely lacking, from the other hand the length of the
chain should be long enough to take into account all the relevant intramolecular interactions.
In addition to these approximations we must also consider that the terminal groups chosen
are completely arbitrary and we have to remove their contribution from the vibrational
spectra. In our case, CH3 groups have been adopted, as already explained. In order to remove
their contribution a possible method consist in increasing the masses of these terminal
groups: this will shift the associated vibrational frequencies to very low values, removing
them from the spectral region relevant for the characterization of the polymer. Moreover, by
this way we are also artificially describing the very large mass of the remaining polymers
chain that is linked to our monomer model, thus we are taking into account the kinetic effect
of a very long polymer chain.

70
Figure 4.9 – DFT computed IR spectra of PPTA monomer model where heavy masses have been
used for the atoms in CH3 end groups.
Figure 4.10 – DFT computed IR spectra of PPTA monomer model where heavy masses have been
used for the atoms in CH3 end groups.

71
Figure 4.11 – Comparison between the experimental IR spectrum of Kevlar and DFT computed IR
spectra of PPTA monomer and PPTA monomer with heavy CH3 groups.
In Fig. 4.11, experimental and DFT computed IR spectra are reported: we can notice that
our model succeeds in predicting the most significant bands of the experimental spectrum
and it is already a quite good model system. Anyway a few discrepancies are observed: in
particular we can appreciate that the calculated frequency gap between amide I and II bands
(marked as 1 in Fig 4.11) is larger than in the experimental spectrum. We will verify that
this effect is mainly due to the hydrogen bond, which is totally absent in our model.
Hydrogen bonding causes indeed a downshift of the amide I band, and an upshift of the
amide II band. It’s also curious to notice that in the monomer vibrational spectrum, two
bands for the C=O stretching appears, while only one is experimentally observed. More in
detail the first peak, having frequency of 1709 cm-1 corresponds to the stretching of the C=O
bonds near to the methyl group, while the second peak (1683 cm-1) is associated to the
stretching of the C=O embedded between two aromatic rings (see table 4.2). These effects
are therefore directly related to the arbitrary choice of our model: indeed the first band, due
to the C=O stretching close to the methyl group is not observed in the real system since there
are no C=O bonds “feeling” such a chemical environment. In the next paragraph we shall
see more in details the effect of the chain length on these bands, in particular the longer the
molecular chain becomes, the smaller the 1709 cm-1 band will be, getting closer and closer
to the experimental spectrum.
We can also appreciate the good result of the “heavy” masses calculations: many bands due
to the fictitious endgroups, such as 2869 cm-1 peak, complete disappear, making our model
closer again to the experimental one.
A more detailed explanation of the effects introduced by using “heavy masses” is explained
in the following.
1 2
3 4

72
Group 2 in Fig 4.11: 1235 cm-1; 283 km/mol
This band is observed only for calculations performed without the heavy masses on the
methyl group, and it is indeed mainly due to the bending modes of the hydrogens belonging
to the methyl group, C-C stretching between amide and phenyl group and the hydrogen
bending belonging to the aromatic ring.
Group 3 in Fig. 4.11: 1341 cm-1 ; 52 km/mol
This band is mainly due to hydrogens bending modes of methyl group, and it disappears in
the spectrum obtained by means of heavy masses on the endgroups.
Group 4 in Fig. 4.11: 2869 cm-1 105 km/mol
This mode corresponds to the CH stretching of the CH3 groups and for this reason doesn’t
appear in the spectrum obtained by means of heavy masses on these groups.
Figure 4.12 – normal modes corresponding to the band at 1235 cm-1
Figure 4.13 – normal modes corresponding to the band at 1341 cm-1
Figure 4.14 – Normal mode corresponding to the band at 2869 cm-1

73
Also in the analysis of Raman spectra, we are able to identify the highest bands, even if, for
the bands group (2), a significant shift to lower frequencies is observed. As we have already
explained above, among the two bands due to the C=O stretching, only the band having
frequency 1683 cm-1 (corresponding to the stretching of the C=O in between two aromatic
rings) is also found in the experimental spectra (the explanation of this phenomenon is
already proposed in the previous section). The blue shifting of the peak, not observed in the
DFT computed spectra (1), is due to the absence of hydrogen bonds in our model. We can
observe how, by means of “heavy masses” calculations, we are able to remove also in this
case spurious bands due to CH3 groups, as labeled with (3), (4) and (5). A more detailed
description of these findings is proposed below:
Group 3 in Fig. 4.11: 1479 cm-1 213 A4/amu
This normal mode is a bending mode of CH3 endgroups, for this reason the corresponding
Figure 4.15 – Comparison between the experimental Raman spectrum of Kevlar and DFT
computed IR spectra of PPTA monomer and PPTA monomer with heavy CH3 groups.
Figure 4.16– Normal mode corresponding to the band at 1479 cm-1
1 3
4
1
5
2

74
band disappears in spectrum computed by taking into account “fixed” the ends of the
molecule, since we are using a very large masses for the CH3 groups.
Group 4 in Fig 4.11: 1008 cm-1 110 A4/amu
Also in this case the contribution of end groups is significant.
Group 5 in Fig. 4.11: 2783 cm-1 147 A4/amu 2931 cm-1 134 A4/amu 3011
cm-1 140 A4/amu
These vibrational normal modes are only due to CH stretching of methyl groups, and they
are completely removed in the spectrum calculated by associating “heavy” masses to the
endgroups.
4.4.2 PPTA two monomers
Starting from the previous case, we verify now if and how increasing the size of the
molecular model allow to approach better the description of the real polymer. Indeed, we
will study, step by step, Kevlar vibrational dynamics moving from the single PPTA
monomer to the entire crystal.
Figure 4.17 – Normal mode corresponding to the band at 1008 cm-1
Figure 4.18 – normal modes corresponding to the bands at 2783 cm-1, 2931 cm-1 and 3011
cm-1

75
In this section we analyze a model of PPTA composed by two connected monomer units
(see Fig 4.19), in order to identify the chain length contribution to the dynamic behavior of
the molecule. Also in this case CH3 endgroups have been used and as before we have also
performed simulations increasing the masses of the endgroups to remove all spurious
contributions.
Figure 4.19 – PPTA two monomers
In this section we will analyze the vibrational spectra of PPTA monomer and two monomers
models, focusing on the most significant differences when interpreting the experimental
spectra of Kevlar. First of all we report below the IR and Raman spectra calculated for the
PPTA two monomers.
Figure 4.20 – DFT computed (B3LYP/6-31G(d, p)) IR spectrum of PPTA two monomers
model.

76
Effects of the terminal –CH3 groups on the vibrational spectra
Also in this case we have post-processed the calculation increasing the masses of the atoms
belonging to the terminal group, in order to better simulate the real vibrational motion of the
molecules inside the crystal.
Figure 4.21 – DFT computed (B3LYP/6-31G(d, p)) Raman spectrum of PPTA two
monomers model.

77
Figure 4.22 – DFT computed IR spectra of PPTA two monomers model where heavy masses
have been used for the atoms in CH3 end groups.
Figure 4.23 – DFT computed Raman spectra of PPTA two monomers model where heavy
masses have been used for the atoms in CH3 end groups.

78
Comparisons
By this comparison we can identify the main changes obtained by the connection of two
monomeric units, to verify if such a larger model is significantly better or not to improve the
rationalization of the experimental spectra.
As reported in the previous section, increasing the molecular chain length, the band labeled
as (1) in Fig 4.24, which corresponds to the C=O stretching near to the terminal group and
which describes a vibration not observed for the real polymer is now less significant.
Furthermore, we can observe the appearance of the band (2), due to C-C stretching and C-H
bending, that, even if shifted to an higher frequency is also found in the experimental
spectrum. Even if the relative position of amide I and II bands is again too large due to the
absence of inter-molecular interactions, a slight improvement has been found with respect
to the monomer spectrum. Here below, a more detailed description of the most significant
changes is reported.
Figure 4.24 – Comparison between the experimental IR spectrum of Kevlar and DFT
computed IR spectra of: PPTA monomer, PTTA monomer with heavy CH3, PPTA two
monomers and PPTA two monomers with heavy CH3 groups.
1
2
3

79
Band 1 in Fig. 4.24: 1711 cm-1 151 km/mol
This normal mode mainly corresponds to the C=O stretching directly connected to the
methyl group: the frequency remains the same of the monomer model, but its relative
intensity is now lower with respect to the other C=O stretching band which takes
contribution from 3 different C=O groups.
Band 2 in Fig. 4.24: 1494 cm-1 242 km/mol
This band, which is better distinguished in the two monomers spectrum, is mainly due to
C-C stretching and N-H bending
Band 3 in Fig. 4.24: 1389 cm-1 90 km/mol
For this band we appreciate a small frequency shifting and a relative intensity increase.
Figure 4.25 – normal mode corresponding to the band at 1711 cm-1
Figure 4.26 – normal mode corresponding to the band at 1494 cm-1
Figure 4.27 – normal modes relative to the band at 1389 cm-1

80
As we have already notice, the amide I band (1) obviously increases as the number of C=O
increases. The band (2) has a higher relative intensity with respect to the monomer spectra
and it corresponds to the highest peak of the experimental spectra, even if its relative position
in frequency with respect to (1) is not correctly described due to the absence of the hydrogen
bonds. We can also observe an increase in the relative intensity of the bands (3) and (4).
Band 1 in Fig. 4.28: 1716 cm-1 769 A4/amu
This normal mode is characterized by the stretching of the C=O bond between aromatic
rings, as observed in the real PPTA polymer.
Figure 4.28 – Comparison between monomer and two monomers Raman spectra
Figure 4.29 – normal mode corresponding to the band at 1716 cm-1
1
2 3 4

81
Band 2 in Fig. 4.28: 1597 cm-1 3415 A4/amu
This normal mode corresponds to the aromatic ring vibration in between two C atoms and
C-H bending.
Band 3 in Fig. 4.28: 1476 cm-1 1063 A4/amu 1489 cm-1 1518 A4/amu
These two bands are not distinguished in the monomer spectrum, and they are associated to
C-C and C=O stretching, and C-H bending.
Band 4 in Fig. 4.28: 1244 cm-1 1523 A4/amu
This band is subjected to a significant relative intensity increase, it’s mainly due to C-C
and C=O stretching, and C-H and N-H bending.
Figure 4.30 – normal mode corresponding to the band at 1597 cm-1
Figure 4.31 – normal modes corresponding to the bands at 1476 cm-1 and 1489 cm-1
Figure 4.32 - normal mode corresponding to the band at 1244 cm-1

82
4.4.3 PPTA isolated chain described as a 1-D crystal
In the previous paragraph, we have interpreted the experimental spectra of PPTA based on
the spectra computed for two finite-length models (oligomers approach). We stressed in
particular the importance of the chain length and of a correct treatment of endgroups
properties. In order to approach even better the real system, we have also performed
calculations for the isolated single PPTA chain described as 1-D crystal. Indeed, by using
CRYSTAL14 code, we can optimized the geometry and compute the vibrational spectra of
an infinite chain where a monomeric unit is replicated by adopting periodic boundary
condition along the chain direction, thus truly describing an infinite one-dimensional system
with no arbitrary endgroups. By means of this simulation we should be able to obtain a
spectrum even closer to the experimental one, where all intramolecular effects are described
properly. We will see that discrepancies still observed are associated to the relevant role of
intermolecular interactions, lacking even in the infinite chain model.
4.4.3.1 1D chain full geometrical optimization
While Gaussian09 calculations in the oligomer approach are a well-established tool in the
science and characterization of macromolecular materials, the applications of the CRYSTAL
code in the field have been explored only in recent years. CRYSTAL14 is the only program
where PBC calculations are carried out by employing a Gaussian basis set and careful testing
of the computational setup is required to test the most reliable method for the system under
study.
For vibrational spectroscopy purposes, a very careful geometry optimization should be
carried out preliminarily that and not only atomic positions, but also cell parameters must be
optimized, (full geometry optimization). This is true for a 3D crystal, but also for the 1D
crystal which are now considering. Therefore, in order to perform the full geometry
optimization for a PPTA single infinite chain by means of CRYSTAL14, we chose unit cell
parameters (chain repetition distance and atomic position) obtained by the geometry
optimization of the entire 3D crystal (described in paragraph 4.3) as first guess input
structure. In order to avoid any constraint due to symmetry, no line group symmetry has been
imposed to the atomic positions. A very detailed analysis of the calculations carried out for
the 3D crystal, have been already proposed in paragraph 4.3. For testing purposes all the
calculations have been performed by using two different DFT functionals (B3LYP and
Figure 4.33- PPTA infinite single chain (1D crystal)

83
PBE0) and two different basis set (6-31G(d, p) and pob-TZVP). In details, we chose the
space group P1 and the following c parameters:
Table 4.7 – The different c parameters used as geometry input, for the full geometry optimization
of the single infinite chain
A significant difference between the geometries obtained by the optimization of the 1D chain
and the starting geometries has been observed: we have to keep in mind that these starting
value are taken from the 3D crystal structure, where molecular chains are embedded into the
crystal, where hydrogen bonding interactions and steric hindrance are very effective and
promote a quite different spatial arrangement with respect to the isolated chain (in agreement
with [31]). As a matter of fact, we can appreciate a significant change of the torsional angle
between two consecutive aromatic rings; in particular, in the case of the isolated chain,
aromatic rings tend to be coplanar, reducing the torsional angle between them, as depicted
in the following figures:
Functional
Basis set
Input c (Å)
Output c(Å)
B3LYP
6-31G(d, p)
13.04411
13.08787
B3LYP
pob-TZVP
12.98725
12.96772
PBE0
6-31G(d, p)
12.97547
13.01667
PBE0
pob-TZVP
12.91611
12.90593

84
In the case of the 3D crystal by means of B3LYP/6-31G(d, p) we calculated an angle of 22°
between the amide plane and the p-phenylenediamine segment, and an angle of 30° between
the amide plane and the theraphthalic segment, while for the 1D crystal we obtained
respectively 1,78° and 27,58°.
This significant variation of the chain structure will also result in a further consequent change
in the spectroscopic spectra, in addition to the effects generated by the lack of hydrogen
bonds for the 1D chain. This effect emphasizes the importance of the intermolecular forces
which affect not only the vibrations of the chemical groups involved in the bond, but causes
also significant and indirect changes in the intramolecular chain conformation. Similar
geometrical effect has been obtained with all the different DFT functionals and basis sets
adopted, demonstrating that it is not a result due to the different setup. As general case, the
structure obtained with 6-31G(d, p) basis set appears to be more planar. How and why this
conformations difference will affect the IR and Raman spectra will be provided in the next
section. Significant discrepancies or different behaviours among the four geometrical
optimizations with different functionals and basis sets, have not been found.
4.4.3.2 Isolated chain IR spectra
In this section we will compare the IR spectra computed by different functionals and basis
sets and we make a comparison between the results obtained by using the “oligomer
(a)
(b)
Figure 4.34 – (a) Conformation of the PPTA chains embedded into the 3D crystal, (b)
conformation of the isolated PPTA chain (1D crystal).

85
approach” and the PBC approach to further evaluate the most suitable method for the
interpretation of the experimental spectra.
Comparison between isolated PPTA chain and two monomers
As reported in the previous section the vibrational spectra for the two monomers of PPTA
have been calculated by means of Gaussian09 at B3LYP/6-31G(d, p) level of theory, for this
reason they are compared only with single chain data obtained with the same functional and
basis set. The comparison is reported in Fig 4.35 where we can verify that the 1D chain
spectrum is evolving in the right direction, and it is very similar to the experimental one. In
particular, we can observe that almost all the most significant bands have been predicted by
the isolated chain model, and the discrepancies still present are indeed due to the absence of
intermolecular interactions. As the matter of facts, we can appreciate the effect of hydrogen
bonding and of the difference in the tilt angle between two consecutive aromatic rings (a
more detailed description of this phenomenon will be given in the next section) on the
distance between the amide I and amide II bands (5). The band at 1208 cm-1 is subjected to
a redshift (6) with respect to the experimental spectrum, moving away from the band at 1306
cm-1. The first is related to aromatic rings vibrations and N-C stretching, and it’s probably
shifted due to the backbone conformational chain observed in absence of intermolecular
interactions. The bands group (2) is not present in the isolated chain spectrum, because those
peaks are related to the aromatic rings vibrations close to the endgroups and which are thus
Figure 4.35 –Comparison between experimental IR Kevlar spectrum, Kevlar 1D crystal IR
spectrum computed in the framework of DFT by means of B3LYP/6-31G(d, p), DFT two
monomers IR spectrum and DFT two monomers with “heavy” CH3 groups IR spectrum.
1
2
3
4
5 6

86
slightly affected by CH3 groups, not present for the real polymer. These contributions in the
infinite single chain disappears since no terminations are present and all the aromatic rings
are feeling the same environment. In support of this hypothesis a relative intensity reduction
of these bands can be also appreciated by the comparison between PPTA monomer and two
monomers spectra (figure 4.24) where the spurious contributions become less effective for
increasing length of the chain. In proximity of the amide II band, in the two monomers
spectrum two different peaks appear (3), while in the experimental and single chain spectra,
only one band is reported. These two peaks have frequency of 1520 cm-1 and 1513 cm-1, the
first corresponds to the N-H bending and C-N stretching of the amide group near to the end
of the chain, while the higher frequency band is related to the N-H bending and C-N
stretching of the amide group far from the terminal groups. The contribution of the 1520 cm-
1 normal modes is thus not present for the case of the infinite isolated chain, and in the
experimental spectrum since it is again an effect associated to the arbitrary endgroups
introduced in the oligomer calculations. The same reasoning can be also applied to the band
(1), which is related to stretching of the C=O bond belonging to the amide group close to the
end of the chain.
Comparison between spectra obtained by different functionals and basis sets
Figure 4.36 – Comparison between DFT Kevlar 1D crystal IR spectra, calculated by means of
B3LYP/6-31G(d, p), B3LYP/pob-TZVP, PBE0/6-31G(d, p) and PBE0/pob-TZVP, and
experimental Kevlar IR spectrum.
1 2 3
4 5 6

87
At first glance, the best model describing the experimental spectrum, from a general point
of view, is the B3LYP 6-31G(d,p), but also the other cases give a good description of the
spectrum. More in details, at B3LYP/6-31G(d,p) level of theory we are able to better
describe bands (2) and (3), but the most reliable prediction of the frequency gap between
amide I and II bands is obtained by means of the B3LYP/pob-TZVP method. On the other
hand, the weakness of B3LYP/pob-TZVP is the absence of bands (2) and (3), which have
been replaced by a single peak having frequency 1503 cm-1. These peaks are well predicted
by B3LYP/6-31G(d,p), in particular band (2) is the amide II band, while band (3) is related
to C-N stretching and C-H bending, even if a significant frequency shift is still present.
IR spectrum assignment
Table 4.8 – Bands assignment for the isolated PPTA chain IR spectrum as obtained by
B3LYP/6-31G(d, p) calculations.
Frequency (cm-1) (scaling factor of 0.9614)
IR
Intensity ( km/mol )
Normal modes
1088
165
Figure 4.37 – Comparison between DFT calculated Kevlar IR spectrum for the 1D crystal
case and experimental Kevlar IR spectrum.
1088
1208
1306
1378
1494
1513
1689

88
4.4.3.3 Isolated chain Raman spectra
As well as for the IR calculations, in this chapter a general overview of the most significant
Raman spectra features will be provided. Furthermore, we propose a comparison between
the different computed spectra and the experimental one, highlighting the differences and
similarities.
1208
445
1220
224
1306
424
1378
204
1388
243
1494
738
1513
1274
1689
376

89
Also in this case, the most significant bands are recognizable, with similar accuracy as
described for IR spectra.
Indeed, as we have already notice, we can observe an increase in the relative position
between the computed amide I band (1) and band (2) with respect to the experiments, due to
the lack of hydrogen bonding. A similar effect is shown by bands (4), (5), (6), (7) including
also relative intensities differences, especially for peaks (4), (1), (5) and (6). Furthermore,
we can observe that the band group (a), which appears in theoretical calculations, becomes
a single band in the experimental spectrum. The same happens for the band group (b), three
of these four bands are related to N-H bending, C-N stretching and aromatic rings vibrations
of the groups close to the ends of the chain, for this reason only the band of frequency 1483
cm-1, which is related to vibrations inside the chain, is observed in the infinite chain
spectrum (4). We will see in the next section, that some of these discrepancies could be
caused not only by the absence of inter-molecular interactions, but also by the method
adopted for calculations, and some of this spectral features are indeed differently described
by changing the functional and/or the basis set.
Figure 4.38 – Comparison between experimental Raman Kevlar spectrum, Kevlar 1D crystal
Raman spectrum computed in the framework of DFT by means of B3LYP/6-31G(d, p), DFT
two monomers Raman spectrum and DFT two monomers with “heavy” CH3 groups Raman
spectrum.
a b
1
2
3
4 5 6
7
1 2
3 4
5 6
7

90
As well as in the IR calculations, the best model describing the band (1) relative position is
the one having B3LYP as functional and pob-TZVP as basis set. No models describe
properly neither the relative band positions, nor the relative intensity. This band, related to
N-C stretching and N-H bending normal modes, is probably deeply affected by the
interactions with the other molecules within the crystal. Bands (5) and (6), which correspond
to C-H and N-H bending, are better predicted by the PBE0 functional, in particular by the
model adopting 6-31G(d, p) basis set, while B3LYP method tends to split very much bands
(6).
Raman spectrum characterization
Even if, we stated that the best theoretical model to describe the single Kevlar chain is
B3LYP/pob-TZVP, we have chosen B3LYP/6-31G(d,p) model in order to obtain a
comparison with the IR characterization.
Figure 4.39 – Comparison between DFT Kevlar 1D crystal IR spectra, calculated by means of
B3LYP/6-31G(d, p), B3LYP/pob-TZVP, PBE0/6-31G(d, p) and PBE0/pob-TZVP, and
experimental Kevlar IR spectrum.
1 2
3 4 5 6
7

91
Table 4.9 – Bands assignment for the isolated PPTA chain Raman spectrum as obtained by
B3LYP/6-31G(d, p) calculations.
Frequency (cm-1) (scaling factor of 0.9614)
Intensity (A4/amu)
Normal mode
1162
1383
1222
2730
1243
3041
1295
2861
Figure 4.40 – Comparison between DFT computed Raman spectrum for the Kevlar 1D
crystal by means of B3LYP/6-31G(d, p) and experimental Kevlar spectrum.
1695
1599
1483
1295
1243
1162

92
1483
6352
1599
8818
1695
1818
4.4.4 PPTA dimer
In this paragraph by applying again the oligomer approach, we briefly analyze a dimer model
(see fig.4.41) for Kevlar, in order to study the hydrogen bonding effects on the vibrational
spectra of PPTA polymer. By this model, we carry out the simulation of the vibrational
spectra of two interacting Kevlar chains: the spurious bands due to the CH3 endgroups are
still present in this case and for this reason we also solved again the vibrational problem by
assuming “heavy” masses for the endgroups. As depicted in figure 4.41, Kevlar chains
interact through hydrogen bonding between oxygen atoms and hydrogen atoms belonging to
the amide group. In addition to hydrogen bonding, other molecular interactions occur into
the real crystalline structure (such as Van der Walls interactions between phenyl group) and
a more detailed description, taking into account the whole set of intermolecular forces acting
on the Kevlar molecules packed in the crystal, will be reported in the following sections.
Figure 4.41-PPTA dimer model

93
In the spectra reported in fig. 4.42, we can appreciate the effect of the hydrogen bonding by
observing the relative frequency difference between amide I and II bands ((1) and (2)):
indeed the distance between the groups labeled as (a) and (b) in fig. 4.42, is significant
reduced in the dimer spectrum, becoming closer and closer to the experimental one.
Hydrogen bonding is indeed responsible for a redshift of the C=O stretching (amide I) band
and an upshift of the amide II band, thus decreasing the gap between them. In our case these
shifts, with respect to the isolated chain are of 35 cm-1 and 14 cm-1 respectively.
Furthermore, we can observe an increase in the number of bands belonging to the groups (a)
and (b). The number of peaks of these bands groups is smaller for the two monomers case
and again smaller for the experimental spectrum. This is due to the fact that these bands are
related to vibrations of atoms close to the ends of the chain which experience a different
“environment” than the real case. Now this is further magnified since two different
oligomers are present in the dimer. For example, the only band belonging to the group (a)
remaining also in the experimental spectrum, is the band at 1656 cm-1 (amide I band), which
is related to the C=O stretching mode of the amide groups far from the ends of the chain,
experiencing the same environment of the amide groups inside the real polymer (see fig
4.44).
Figure 4.42 – Comparison between DFT computed (B3LYP/6-31G(d,p)) IR spectra of the
PPTA dimer, dimer with heavy CH3 groups, two monomers with heavy CH3 and experimental
IR spectrum in the range between 2200 and 500 cm-1.
1 2 3 4 5 6 7
a b

94
Indeed, from the spectrum calculated with heavy methyl endgroups, a reduction of the
number of the peaks belonging to the bands groups (a) and (b) is observed, because the
“heavy” atoms well-simulate the dynamical and mass effects of the polymer chain. A similar
behavior is observed also in group (b). In figure 4.43 we report a zoom on the high
frequencies range, in order to illustrate a further and well-known effect of hydrogen bonding,
in particular band (8) which is associated to the N-H stretching vibration has a very low
intensity both in the case of two monomers and 1D crystal model and it is widely affected
by hydrogen bonding both in frequency and intensity. It is indeed well-known that hydrogen
bonding implies a partial charge transfer from C=O bonds (which becomes weaker causing
the redshift of amide I) to the antibonding orbital localized on N-H groups. Therefore, N-H
bonds become much weaker and NH stretchings shift of hundreds of cm-1 to lower values.
Moreover, it has been demonstrated that this causes a significant variations of charge fluxes,
causing a massive increase of IR intensity [41, 44].
Figure 4.43 – Comparison between DFT computed (B3LYP/6-31G(d, p)) IR spectra for the
PPTA dimer , dimer with heavy CH3 groups, two monomers with heavy CH3 and
experimental IR spectrum in the range between 3700 and 2500 cm-1.
8

95
In figure 4.45 the Raman spectra of different models are also compared with the
experimental one.
As in the previous case, we can appreciate the hydrogen bonding influence on the reduction
of the relative position between band (1) and (2), due mainly to the redshift of the band (1).
(e) (f)
(g) (h)
Figure 4.44 – (e) normal modes corresponding to the band at 1694 cm-1, (f) normal mode
corresponding to the band at 1711 cm-1, (g) normal mode corresponding to the band at 1656
cm-1, (h) normal mode corresponding to the band at 1674 cm-1
Figure 4.45 - Comparison between DFT computed (B3LYP/6-31G(d,p)) Raman spectra by
means of B3LYP/6-31G(d, p) for the PPTA dimer , dimer with heavy CH3 groups, two
monomers with heavy CH3 and experimental Raman spectrum.
1 2
3 4 5
6
a

96
Hydrogen bonding effect could be also observed for the bands groups marked as (a) in
fig.4.45: their relative intensities significantly reduce moving from the two monomers
Raman spectrum, to the dimer one. These bands are related to N-H bending mode and
aromatic ring vibrations, which are affected by H bonding.
4.4.5 Simulation of Kevlar 3D crystal
In this paragraph we discuss the Raman and IR spectra obtained from the Kevlar 3D crystal
calculations, obtained by means of CRYSTAL14. For the first time, we can take into account
all inter-molecular interactions, approaching as much as possible the real crystalline system
and we obtained theoretical spectra very close to the experimental ones. We have however,
to keep in mind that these calculations are considering an ideal infinite 3D crystal, described
by periodic boundaries conditions. In the real material amorphous domains, molecular
disorder and boundary effects are always present, and they are probably responsible for the
small discrepancies still present.
4.4.5.1 Intermolecular crystal packing effects on vibrational spectra
From the figure 4.47 we can appreciate the reliability of the Kevlar 3D crystal calculation in
the description of the vibrational properties of this polymer. Many of the discrepancies
present in the 1D crystal have been solved giving a substantial improvement and a theoretical
spectrum very close to the experimental one.
Figure 4.46 – Schematic rapresentation of the PPTA molecular chains arrangement inside
the Kevlar crystal

97
In particular, we can observe the fundamental role played by the hydrogen bonding between
C=O and N-H, which shifts upward the amide II band (2) and downward the amide I band
(1), reducing their relative position in the spectrum. Also bands (4), (5), (6) and (7) are
subjected to a significant frequency shift in switching from the 1D to the 3D crystal, probably
due to a synergic effect of the hydrogen bonding and of the molecular conformation changes
induced by the intermolecular interactions with the other chains. The discrepancies which
are still present in our simulation are related to the prediction of the relative intensities of the
band (3), related to C-H, N-H bending modes and aromatic rings vibrations, and band (6),
which mainly corresponds to aromatic rings vibrations. Also considering the Raman
spectrum, from the figure 4.48, we can appreciate the effect of crystal packing in reducing
the frequency gap between bands (1) and (2). 3D crystal and experimental spectra present a
significant relative intensity reduction of the band (4) with respect to the 1D crystal
spectrum: this band corresponds indeed to the N-H bending modes which are obviously
affected by hydrogen bonding. Unlikely to IR theoretical 3D crystal spectrum, in Raman
calculated spectrum we still have some relative positions shifts, especially for (4), (5) and
(6) bands, while bands (7) and (8) are well predicted both in terms of frequency and relative
intensities.
Figure 4.47 – Comparison between DFT computed IR spectra of Kevlar for 1D crystal and 3D
crystal (both carried out by B3LYP/6-31G(d, p)) and Kevlar experimental spectrum
1 2 3 4 5
6 7

98
4.4.5.2 Comparison between different computational methods adopted
for 3D crystal simulations
Figure 4.48 - Comparison between DFT computed Kevlar IR spectra for 1D crystal and 3D
crystal (both carried out by B3LYP/6-31G(d, p)) and Kevlar experimental spectrum.
Figure 4.49 – Comparison between DFT computed IR spectrum of Kevlar 3D crystal at
B3LYP/6-31G(d,p), B3LYP/pob-TZVP, PBE0/6-31G(d,p) level of theory and experimental
Kevlar IR spectrum in the range 3700-3000 cm-1 . We adopted the following scaling factor:
0.9614 for B3LYP/6-31G(d,p), 0,9688 for B3LYP/pob-TZVP, 0,9512 PBE0/6-31G(d,p).
1
2
3 4
5 6
7 8

99
As we have already mentioned, 3D crystal calculations have been carried out by means of
two different exchange correlation functionals and two different basis sets. From the 3D
crystal full geometrical optimization we have observed that the best method describing the
Kevlar crystalline structure is B3LYP/6-31G(d, p); now we also check if this level of theory
is again the most reliable also in predicting the vibrational spectra of Kevlar.
In fig. 4.50 we can observe that bands (1), (2) and (3) are well described at B3LYP/6-31G(d,
p) level of theory, even if the relative intensity of the band (3) is more well predicted by the
pob-TZVP basis set. Furthermore, we can notice, that B3LYP/pob-TZVP method presents a
frequency gap between amide I and II bands smaller than in the experimental spectrum.
Relative positions of the bands (4), (5), (6) and (7), also for this case, are well calculated by
means of B3LYP/6-31G(d, p), even if (6) and (7) relative intensities still need an
improvement. Normal modes at lower frequencies are also predicted, but their relative
positions are subjected to a significant redshift.
In figure 4.49 the part of the IR spectrum containing the bands relative to the N-H stretching
modes is reported: the band frequency corresponding to N-H stretching mode is still
overestimated by all theoretical methods, but in this case anharmonic effects have a
significant and well-known role in affecting the vibrational spectrum.
Figure 4.50 – Comparison between DFT computed IR spectrum of Kevlar 3D crystal at
B3LYP/6-31G(d,p), B3LYP/pob-TZVP, PBE0/6-31G(d,p) level of theory and experimental
Kevlar IR spectrum in the range 2200-500 cm-1 . We adopted the following scaling factor:
0.9614 for B3LYP/6-31G(d,p), 0,9688 for B3LYP/pob-TZVP, 0,9512 PBE0/6-31G(d,p).
1 2 3 4 5
6 7

100
Figure 4.51 – Comparison between DFT computed Raman spectrum of Kevlar 3D crystal at
B3LYP/6-31G(d,p), B3LYP/pob-TZVP, PBE0/6-31G(d,p) level of theory and experimental
Kevlar Raman spectrum in the range 2200-500 cm-1 . We adopted the following scaling
factor: 0.9614 for B3LYP/6-31G(d,p), 0,9688 for B3LYP/pob-TZVP, 0,9512 PBE0/6-
31G(d,p).
Figure 4.52 – Comparison between DFT computed IR spectrum of Kevlar 3D crystal at
B3LYP/6-31G(d,p), B3LYP/pob-TZVP, PBE0/6-31G(d,p) level of theory and experimental
Kevlar IR spectrum in the range 3700-3000 cm-1 . We adopted the following scaling factor:
0.9614 for B3LYP/6-31G(d,p), 0,9688 for B3LYP/pob-TZVP, 0,9512 PBE0/6-31G(d,p).
1
2
3 4
5 6
7
a 8

101
In figure 4.51, we can appreciate the reliability of the Raman spectrum obtained by
B3LYP/6-31G(d, p) method, where only few minor discrepancies with respect to the
experimental Raman spectrum are observed, that are: relative positions displacement for
bands (4), (5) and (6), and a relative intensities modulation for the bands (4) and (5).
B3LYP/pob-TZVP is able to describe the frequency gap between bands (2) and (4) more
accurately, but it fails in predicting band (5) relative intensity. At the same time vibrational
calculations carried out at PBE0/6-31G(d, p) level predict with good agreement relative
intensities of bands having frequencies lower than 1400 cm-1, and it’s the only method
predicting band (6) with a lower intensity than band (5).
In figure 4.52 the Raman spectra in the range from 3600 cm-1 to 2700 cm-1 is reported, in
this range we can appreciate the bands group labeled as (a) related to C-H belonging to
aromatic rings stretching modes and band (8) associated to N-H stretching mode. These
calculated bands have a very low relative intensity, and they are not clearly detected in the
experimental spectra.

102
4.4.5.3 Kevlar crystal characterization
In this paragraph a detailed characterization of the IR and Raman spectra of Kevlar is
reported, clarifying the assignments of the most significant bands of vibrational spectra and
their corresponding frequencies and intensities.
IR spectrum characterization
The assignments reported in Table 4.10 are in agreement with the data found in literature,
especially with the work done by P. K. Pim, C. Chang and L. S. Hsu [2]. Except for some
exceptions at high frequencies, many bands are associated to normal modes having many
different contributions and in particular at low frequencies, the complexity and the lacking
of dominating features make the assignment of these bands not so straightforward. A brief
description can be done anyway: bands at 674 and 733 cm-1 have a large contribution due to
N-H and C-H bending and C-C stretching modes, at 811, 871, 996 and 1106 cm-1 are bands
assigned to C-H bending and C-C stretching, bands at 1246 cm-1 is predominantly due to the
in-phase combination of N-H in plane bending and C-H bending vibrations (amide III band),
at 1319 and 1398 cm-1 we find contributions due to skeletal stretching mode and band at
1505 cm-1 has a large contribution from the N-H in-plane bending mode. The band observed
at 1527 cm-1 is assigned to the Amide II vibration, while at 1631 cm-1 we find the Amide I
Figure 4.53 – Comparison between DFT calculated IR spectrum for Kevlar 3D crystal at
B3LYP/6-31G(d, p) level of theory and experimental IR Kevlar spectrum in the range 2200 – 500
cm-1
1631
1527
1398
1319 1246
1106 996 811 733
674
871
1505

103
band related to C=O stretching mode. N-H stretching vibration is observed at higher
frequencies, with the highest band at 3364 cm-1.
Table 4.10 – Bands assignment for the PPTA 3D crystal IR spectrum as obtained by
B3LYP/6-31G(d, p) calculations.
Frequency (cm-1)
(scaling factor of 0.9614)
IR
Intensity ( km/mol )
Normal modes
674
727
Figure 4.54 - Comparison between DFT calculated IR spectrum for Kevlar 3D crystal at
B3LYP/6-31G(d, p) level of theory and experimental IR Kevlar spectrum in the range 3600
– 3100 cm-1
3364

104
733
395
811
134
871
236
996
70

105
1106
33
1246
1343
1319
1230
1398
497

106
1505
974
1527
2449
1631
2316
3364
2152

107
Raman spectrum characterization
Table 4.11 – Bands assignment for the PPTA 3D crystal Raman spectrum as obtained by
B3LYP/6-31G(d, p) calculations.
Frequency (cm-1) (scaling factor of 0.9614)
Raman activity
(A4/amu)
Normal modes
624
10
Figure 4.55 - Comparison between DFT calculated Raman spectrum for Kevlar 3D
crystal at B3LYP/6-31G(d, p) level of theory and experimental Raman Kevlar
spectrum in the range 2200 – 500 cm-1
624 765 1095
1172
1263
1310 1494
1555
1603
1639

108
765
585
1095
737
1172
2097
1263
10900

109
1310
7593
1494
7907
1555
624
1603
17860

110
1639
8314
3151
588
3364
3283
From Table 11 we can propose a characterization of the 3D Kevlar crystal Raman spectrum,
also in this case bands at low frequencies are composed by many contributions, so they
cannot be associated to only one chemical group. Bands in the region between 544 and 1095
cm-1 have a large contribution from C-C and C-H stretching vibration, especially band at
745 cm-1 is also characterized by N-H bending mode. At 1172 cm-1 we find a band mainly
associated to C-H bending mode, bands at 1263, 1310 and 1495 cm-1 are due to C-H and N-
H vibrations. Bands at 1555 cm-1 is related to C-C stretching and C-H bending modes , while
band at 1603 cm-1 corresponds to C-C and N-H stretching vibration and C-H bending mode.
We find C=O stretching modes at 1639 cm-1, C-H stretching at 3151 cm-1 and N-H stretching
mode at 3364 cm-1.

111
4.5 Polarized IR spectroscopy of Kevlar
Many physical properties of polymeric materials, such as Young modulus and toughness,
can strongly depend on the degree of orientation of the polymeric chains. There are several
methods available to detect the molecular orientation of a particular polymer, such as X-ray
diffraction, NMR and polarized vibrational spectroscopies (IR and Raman). In this chapter
we will predict by means of DFT calculation polarized IR spectrum of Kevlar.
As explained in previous chapters, molecular vibrations only give rise to infrared absorption
if the molecular dipole moment changes during the vibration. However, to observe an
absorption this could not be enough since this transition dipole moment should have a
nonzero component parallel to the electric field of the incident IR beam. The absorbance will
be proportional to the square of the scalar product of the transition moment and the electric
field vector, which is in turn is proportional to the cosine of the angle between them. If the
molecules are randomly oriented in the material, a non zero scalar product is always obtained
and thus absorption is observed. However, this could not be true for highly oriented fibers:
in this case since the dipole moment vector is fixed for polymeric molecules by varying the
polarization of the incident radiation, we can modulate the absorption properly. Therefore,
by using suitable polarization of the incoming light and the orientation of the dipole moment
change due to the atoms vibrations, we could find a method to determine the orientation of
the chains.
We can label the dipole moment change μ associated with a normal mode of vibration and
E the electric vector associated with the incoming radiation: in a polar coordinate system,
μx, μy, μz are the projections onto the Cartesian axes, μ0 and E0 are the scalar magnitudes of
the vectors μ and E and i, j, and k are the unit vectors along the directions x, y and z.
In a randomly oriented polymer there will be a distribution of the dipole moment directions
in this space, and in order to compute the absorption intensity we need to sum over all the
individual dipole contributions, μi.
(4.1)
This summation is not so straightforward to deal with analytical methods, and it’s usually
converted in an integral using a distribution functions. All the numerical steps to convert 4.1
in an integral go beyond the scope of this work, for this reason we will report the final results
only:
(4.2)

112
(4.3)
(4.4)
Where, g(ϕ, θ) is the polar coordinates function, which is proportional to the number of
dipoles oriented at polar angles (ϕ, θ). For examples, if we have a single unique direction for
all dipoles g(ϕ, θ) = 1 for a specific (ϕ, θ) and equal to zero for all other angles.
The average of A over all the orientations is found to be A0:
(4.5)
A0 is thus defined as the structural absorbance and is orientation independent and
proportional only to the number of oscillators being observed.
When we record an IR spectrum by means of an unpolarized radiation, the final result is
given by summation of all dipoles contributions, but if we perform an experiment by a
polarized laser we will observe absorption only for that normal modes which do posses a
dipole moment with a component parallel to the electric field of the incident radiation. In the
case of an amorphous polymers, where no orientation is present and the molecules are
randomly oriented, there will be always dipole moment vectors parallel to the polarized
radiation. However, for this reason, for a well-oriented polymer such as Kevlar fibers,
peculiar polarization effects could be observed.
4.5.1 Computational method for the prediction of polarized IR
spectra
CRYSTAL14 code, or any other quantum chemical code, must calculate the three cartesian
components of the dipole moment derivatives with respect to each Qi vibrational normal
mode in order to compute the IR crystal spectrum, and on this basis can provide the total
“unpolarised” IR spectrum. In order to predict the IR polarized spectra, the IR intensity
calculation for each dipole moment components should be carried out separately, by using
the dipole moment derivatives already computed by CRYSTAL14. In this way we will be
able to compute the IR spectra for the three polarization directions, which can be then

113
compared with experimental spectra recorded for parallel and perpendicular polarization
with respect to the chain axis.
We have carried out the computation of polarized IR spectra, for the 3D and 1D Kevlar
crystal, by using the dipole moment derivatives obtained at B3LYP/6-31G(d, p) level of
theory.
CRYSTAL14 computes IR intensities by means of the following equation:
(4.6)
(4.7)
where IiIR
is the IR intensity in km/mol, μ is the dipole moment and Qi is the ith vibrational
normal mode. CRYSTAL14 performs IR spectra calculation by taking into account in eqn.
4.7 all the components of dipole moment derivatives with respect to the ith vibrational normal
mode, and this is indeed the case of “unpolarized” incident light. In order to simulated the
IR spectrum behavior with polarized laser, we have to partition the total IR intensity, in the
component parallel to the molecule chain axis, and in the two components perpendicular to
the chain axis. In the first case we will predict the spectra in the case of polarized light having
the electric field direction along the molecular chain axis, while in the second case we will
be able to predict the spectrum for polarization perpendicular to the chain axis. To this aim,
the chains should be oriented along one of the three Cartesian directions. Unfortunately, the
polymer chain axis, in our CRYSTAL14 calculations of Kevlar, was not oriented along one
of the three specific Cartesian directions. To overcome this problem, we had first to find a
proper rotation matrix R, to align the molecular chain axis along the X coordinate. By means
of the R matrix so-determined, we then rotated the dipole moment derivatives in order to
obtain their X, Y and Z components, where now X is the direction parallel to the chain axis
and Y and Z perpendicular to it
(4.8)
Once we have these components of the dipole moment derivatives with respect to the Qi
normal mode, we can now easily calculate the IR intensity parallel to the chain (I// ) and the
perpendicular one (I┴), to be compared with the polarized IR spectra recorded in our
laboratory.

114
(4.9)
(4.10)
4.5.2 Comparison of experimental and DFT computed polarized
IR spectra
In figure 4.56 we show the differences between the IR spectrum of the 3D crystal calculated
by simulating the light polarization of the electric field parallel and perpendicular to the
chain axis. As a check of our calculations, we have also plotted the IR spectrum calculated
as the summation of I// and I┴ and comparing it with the usual “unpolarized” spectrum
calculated by CRYSTAL14.

115
At first, in Figure 4.56 we can notice that CRYSTAL IR spectrum and IR spectrum
calculated as the summation of the two components (parallel and perpendicular) of the total
IR intensity perfectly match, demonstrating that no mistakes are present in our procedure.
Furthermore, we can appreciate the significant differences between the spectra obtained by
simulating the two different polarization orientations, where we observe that many bands
appear only in one of the two spectra. This indicates that many IR active normal modes
generate an instantaneous dipole moment with a cartesian component which prevails over
the others, or that certain dipole moment components annihilate for symmetry reasons due
to the regular packing of the chains in the crystal.
Bands (1), (2) and (7) which are respectively associated to N-H stretching, C=O stretching
and N-H out of plane bending modes, appear only in the IR spectrum calculated with
perpendicular polarization, as expected. Indeed, these vibrations involve a significant
variation of the dipole moment along the y and z directions, for this reason they are observed
in the case of perpendicular polarization only. On the other hand, the IR spectrum computed
for parallel polarization shows a large contribution from bands (3), (4), (5) and (6), which
are related to N-H in-plane bending, C-H in-plane bending, C-C and C-N stretching modes.
All these vibrations induce an instantaneous dipole moment mainly oriented along the x
directions (chain directions), thus giving a predominant contribution in IR spectrum with
electric field polarization parallel to the molecular chain axis.
Figure 4.56 – Comparison between the IR spectra for the 3D Kevlar crystal by simulating
perpendicular and parallel polarization with respect to the molecular chain axis, IR spectrum
for the 3D Kevlar crystal calculated as the summation of the perpendicular and parallel
component of the IR intensity and the standard IR spectrum calculated by CRYSTAL14.
1 2
3
4
5 6
7

116
In figure 4.56, we can appreciate a huge discrepancy between the two spectra calculated with
different polarization orientation, because CRYSTAL14 calculations are carried out by
taking into account perfectly oriented crystal. In the real polymer, even if Kevlar is highly
oriented, domains with a different chains orientation can be present, leading to a non
completely perfect selectivity between parallel and perpendicular spectra (see figure 4.57).
However, also in the experimental spectra, polarization effects are very clear and evident in
very good agreement with our computations. The comparison between experimental and
theoretical spectra shown in figure 4.57 proves the reliability of our calculations and
demonstrates the ability of DFT calculations in predicting also the IR spectra of polymer
materials.
Figure 4.57 - Comparison between the IR spectra of the 3D Kevlar crystal by simulating
perpendicular (90°) and parallel (0°) polarization with respect to the molecular chain axis and
the polarized experimental IR spectra recorded for parallel and perpendicular polarization.

117
Chapter 5
Quantum chemical simulation of Raman spectra of
Kevlar under mechanical stretching
The characterization of mechanical properties is obviously one of the most important tasks
in polymer science and technology. Also in this context vibrational spectroscopy can play a
significant role, helping the understanding of the effects of mechanical deformation on the
molecular structure of the material. Also in the case of Kevlar, a few investigations have
been presented in the literature to analyze the dependence of the Raman spectra on applied
stress or strain [36-40]. Literature reports that most of the Raman bands in the region between
1100 and 1700 cm-1 shift to lower wavenumbers upon the application of a tensile strain. In
particular,in the Raman spectrum the reference band at 1610 cm-1 mainly associated to
aromatic rings and C-N stretching vibrations shifts in frequency (-4.5 cm-1/% for Kevlar 49)
and broaden (2.8 cm-1/ GPa for Kevlar 49) linearly under under tensile stress up to fracture
and an increase in the frequency shift for increasing fiber modulus (higher grade of Kevlar)
has been reported. On the other hand, the stress-induced band broadening factor decreases
with increasing fiber modulus, with Kevlar 149 having the lowest value. This is due to the
higher level of molecular orientation in Kevlar 149 fibers which turns out in a more even
load distribution on molecules within the fibers during tensile deformation. If the broadening
is due to an uneven distribution of molecular stress, then it should fall to zero for a perfect
PPTA crystal, as in the case of our CRYSTAL14 calculations. Values of the stress-induced
band broadening factors and frequency shifts are listed in Table 5.1.
In all the tensile experiments, once the stress has been released, aromatic rings vibrations
bands restore at 1610 cm-1 and a similar behavior is observed for the broadening effect. This
finding, once again, emphasizes the fundamental role played by the highly crystalline
polymeric structure of Kevlar in giving an elastic behavior to this polymer.
Table 5.1 – Values of Raman band shift due to strain and stress for the Kevlar fiber
Fiber Strain-induced Raman Stress-induced Raman Stress-induced Raman
band shift (cm-1/%) band shift (cm-1/GPa) band broadening
(cm-1/GPa)
Kevlar29 -3.2 -3.9 +3.4
Kevlar49 -4.5 -3.9 +2.8
Kevlar149 -5.1 -4.0 +1.1

118
5.1 DFT simulations of stress-dependent Raman spectra
By means of CRYSTAL14, it is possible to carry out simulations of the mechanical
stretching of 1D Kevlar chain. At first, we computed the full geometry optimization by
taking into account the deformations due to the mechanical stretching, followed by further
calculations of IR and Raman spectra on the geometry so obtained. All calculations have
been performed at B3LYP/6-31G(d, p) level of theory, that, as commented before, turned
out to be the best method in describing our system.
In order to simulate the mechanical stretching, we performed full geometry optimization in
ten steps, by increasing at each step the lattice parameter along the chain axis of 0.3%.
During each optimization, lattice parameters are considered as fixed, and only the atomic
Figure 5.1 – Experimental Raman band shift at 1610 cm-1 for Kevlar
Figure 5.2 – Structural differences between Kevlar 29 and Kevlar 149 suggested by Y.
Rao, A.J. Waddon and R.J Farris [48].

119
positions are optimized to find their new minimum energy arrangement inside the deformed
unit cell. The atomic Cartesian coordinates, used as input for each simulation correspond to
the Cartesian coordinates obtained as output of the previous step. As a result of all
calculations, we finally obtain a total strain of 3%, involving structural variations in the
polymer chain. In particular, we can appreciate a remarkable modification of the torsional
angle between the amide group and the teraphthalic segment, ranging from 28° for the
undeformed 1D crystal to in 14° for the 3% deformed chain; a similar behavior is shown by
the angle between the amide group and the p-phenylenediamine, which switches from 2° for
the undeformed 1D crystal to 0,5° for the stretched chain. These data demonstrate that under
certain tensile stress, molecular chains tend to become more planar and this conformation
transitions can significantly affect the vibrational spectra. Furthermore, we also observe an
average bond elongation of a few tenths of angstrom for each bond.
It is important to point out that we are simulating the stretching of a 1D Kevlar chain
stretching, and therefore we are not taking into account the inter-molecular effects due to
crystal chain packing. For this reason, our model is just an approximation of the real system.
When polymer fibers are affected by a tensile stress, material strain is ideally due to two
contributions, one due to the molecular chain elongation itself and the other due to the
relative motions between chains. Since Kevlar is characterized by a highly crystalline
structure, its molecular chains are interacting one with each other by means of strong
hydrogen bonds and its molecules are uniformly oriented along the fiber axis. Therefore
according to Ref.[42] we can assuming that Kevlar fibers elongation is mainly due to
molecular chain deformations. Under this assumption, we can consider our 1D model as a
representative scenario of the real mechanism occurring in this polymeric material upon
mechanical stretching.

120
5.2 DFT computed Raman spectra
In agreement with previous works presented in the literature [36-40, 43], our calculated
Raman spectra show a frequency downshift for increasing strain (see Fig. 5.3). All bands are
characterized by a strain-induced down shift, but not all with the same magnitude. In
particular, the band labeled as (1) in figure 5.4 is affected by a strain-induced Raman band
shift of -3 cm-1/%, bands (2) and (3) are redshifted of 10 cm-1/%, band (4) presents a
frequency downshift of 4.33cm-1/%, band (5) 13 cm-1/%, band (6) shifts downward of 18
cm-1/% and band (7) has a redshift of only 1cm-1/%. Relative frequency shifts are well
appreciable in Fig. 5.3. We can also observe that bands (1) and (7), which are the bands less
susceptible to stretching, are associated respectively to C=O stretching mode and C-H
bending vibrations, and these chemical bonds, are slightly affected by a strain occurring
along the molecular chain axis. On the other hand, the most affected bands are (2), (5) and
(6) associated to aromatic rings vibrations, C-C and C-N stretching modes. These chemical
bonds have a large component along the chain axis, and for this reason they are widely
influenced by the mechanical stretching.
Figure 5.3 – DFT calculated Raman spectra evolution during the simulated
stretching of a 1D Kevlar crystal. The Raman spectrum has been calculated for 10
steps, each of them correspond to a strain increment of 0.3%, from the undeformed
molecular chain to a total strain of 3%.

121
In particular, in Fig. 5.3, we can observe the progressive redshift of band (6), which also
loses intensity and increasingly moves away from band (5), finally merging with band (7).
Certainly, also the molecular planarity change due to the strain, plays an important role on
these trends, but it seems to be less important in the interpretation of strain-dependent Raman
spectrum. From experimental studies (see Table 5.1) it has been found that the strain-induced
Raman band shift increases with the increasing of the molecular orientation (an explanation
has been already proposed in the previous section). We can assume that our 1D Kevlar
crystal is perfectly oriented (even if we cannot speak of a true molecular orientation because
we are considering one single chain only) and for its nature our system is intrinsically free
from uneven molecular stress distribution. For these reasons, the calculated redshift for the
band (2) is almost two times higher than the one found in literature for Kevlar 149 (see Table
5.1). In addition to the Raman frequency shifts, we can observe some relative intensity
modulation. In particular, we can appreciate a relative intensity reduction for the bands (2)
and (3), and a significant increase for the bands (4), (5) and (7).
Figure 5.4 – Comparison between DFT computed Raman spectrum of 1D Kevlar
crystal Raman spectrum at 3% of strain and in its undeformed state.
1
2 3
4 5 6
7
8

122
5.3 Experimental Raman spectra
5.3.1 Experimental details
In order to carry out a comparison with DFT calculations we recorded Raman spectra of
PPTA fibers under tensile stress test in strain control in our laboratories, by means of the
portable i-Raman 785 spectrometer (see paragraph 3.4.3) and the tensile machine. We
performed this kind of test on Twaron strands, which is the trade name of PTTA aramid
fibers produced by Teijin [52]. As in the case of Kevlar, many grade of Twaron exist,
depending on the molecular orientation level, for example the Twaron grade having the less
oriented molecular structure is Twaron LM (low modulus), while the most oriented one is
Twaron HM (high modulus) which has almost the same mechanical properties of Kevlar
149. This investigations has been done in collaboration with Prof. Claudia Marano (Polimi).
In addition to the tensile stress test, a second test composed by two loading cycles alternated
by a full unloading cycle has been performed: it has been done in order to check the presence
of residual deformation and to verify if the polymer completely restores its mechanical
properties after being unloaded. The first test was performed up to fibers breaking, by means
of a strain-rate of 1mm per minute, while at the first stage of the second test we stretched
fibers (at 1mm/min rate) up to a strain of 1.6% suddenly followed by a full unloading cycle,
and at the second stage we load fibers again up to breaking with the same strain-rate. In both
cases we obtained strands failure at a strain equal to 2.1%. In Fig. 5.6 we can observe that
the load-strain curve is not linear for very small deformation, this non-linearity is probably
due to a permanent deformation of the fibers caused by the locations of the fibers within the
woven from which they were extracted.
Figure 5.5- Stress-strain curve of Twaron fibers found in the literature [49]
.

123
Fixing the fibers to the test machine has not been very straightforward, because fibers under
tensile stress can slide between the clamps, and if we fix the sliding of the fibers by coiling
them around a holder, a cutting effect may occur. In order to solve this problem related to
the cutting effect and to the sliding, we prepared samples where the ends of a Twaron strand
are fixed between two fiberglass tabs by means of epoxy resin (see figure 5.7), cured for one
hour at 80°C. By this way samples are fixed to the tensile machine by plunging the
fibersglass tabs inside the clamps, significantly reducing the cutting effects.
Raman spectra has been recorded simultaneously to the tensile test with an acquisition rate
of 10 seconds, on samples 15cm long with an elongation speed of 1mm/min, recording a
spectrum every 0.11% of strand strain. During the test, no pauses have been done, in order
to avoid relaxation phenomena. Raman spectra recorded at different times may present some
absolute intensity discrepancies, due to the fact that the spot dimension of the incident laser
can change as a result of the strand thinning during the test.
Figure 5.6 - Load-strain curve of Twaron fibers carried out in our laboratory
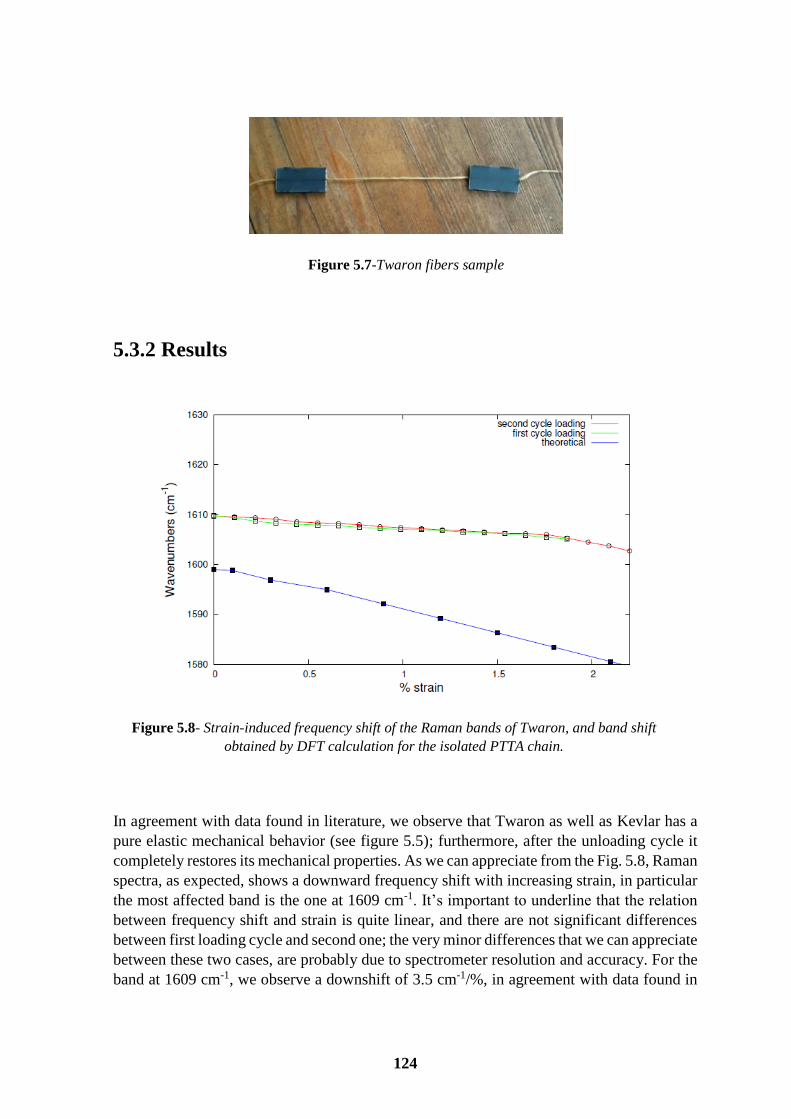
124
5.3.2 Results
In agreement with data found in literature, we observe that Twaron as well as Kevlar has a
pure elastic mechanical behavior (see figure 5.5); furthermore, after the unloading cycle it
completely restores its mechanical properties. As we can appreciate from the Fig. 5.8, Raman
spectra, as expected, shows a downward frequency shift with increasing strain, in particular
the most affected band is the one at 1609 cm-1. It’s important to underline that the relation
between frequency shift and strain is quite linear, and there are not significant differences
between first loading cycle and second one; the very minor differences that we can appreciate
between these two cases, are probably due to spectrometer resolution and accuracy. For the
band at 1609 cm-1, we observe a downshift of 3.5 cm-1/%, in agreement with data found in
Figure 5.7-Twaron fibers sample
Figure 5.8- Strain-induced frequency shift of the Raman bands of Twaron, and band shift
obtained by DFT calculation for the isolated PTTA chain.

125
literature (see table 5.2). We can notice that the frequency downshift obtained by DFT
calculations is higher than the experimental one, and as already explained in the previous
sections, this discrepancy may be due to the fact that Twaron fibers are not perfectly oriented
with respect to the ideal perfect orientation of the simulated 1D PPTA chain; indeed the
higher is the molecular orientation, the larger will be the effect on vibrational frequencies.
By observing the Raman spectra recorded during the tensile test (see figure 5.9 and 5.10), as
we have predicted by means of CRYSTAL14, bands labeled (1) and (6) in figure 5.9 result
to be less sensible to the strain effect than the other bands. In the previous sections we have
already reported that bands (1) and (6) are related to C=O stretching mode and C-H
stretching vibration respectively and since none of these two vibrations has a significant
contribution from back-bone motions they are thus less affected by a mechanical stretching
acting mainly along the chain axis.
Table 5.2 – Values of Raman band shift due to strain and stress for the Twaron fibers
Fiber Strain-induced Raman Stress-induced Raman Stress-induced
Raman
band shift (cm-1/%) band shift (cm-1/GPa) band broadening
(cm-1/GPa)
Twaron LM -3.2 -3.9 +3.4
Twaron IM -3.5 -4.0 +3.5
Twaron HM -3.7 -4.0 +2.5
In ref. [49] C. Chang and S. L. Hsu suggested that the band (1) at 1645 cm-1 (amide I, C=O
stretching mode) should not be strain-dependent, and the frequency change, that is anyway
observed, can be explained by the contraction of the unit cell when the fibers are stressed,
implying a shorter intermolecular distance and a stronger hydrogen bonding between
adjacent molecules. However, in our isolated PPTA chain stretching simulation, where an
isolated molecule and no hydrogen bonding is present, we observed the downward shift of
the band related to the C=O stretching mode (see figure 5.4). This means that the unit cell
contraction is not the main reason to explain the 1645 cm-1 band shift. As already
demonstrated by calculations, when the fibers are stretched they get a more planar
conformation (see paragraph 5.1): the planar conformation promotes a higher molecular
conjugation between the phenyl groups and the amide group which implies a higher C=O
bond charge delocalization. This phenomenon reduces the force constant of C=O bond, thus
explaining the frequently downshift of the related stretching mode. We can also observe a
relative intensity decrease of the band (3) due to stretching, as already found in the Raman
spectrum obtained by DFT calculation. On the other hand, we can notice a relative intensity
increase of the band labeled as (5) in figure 5.10 and a decrease of the band (4), and also in
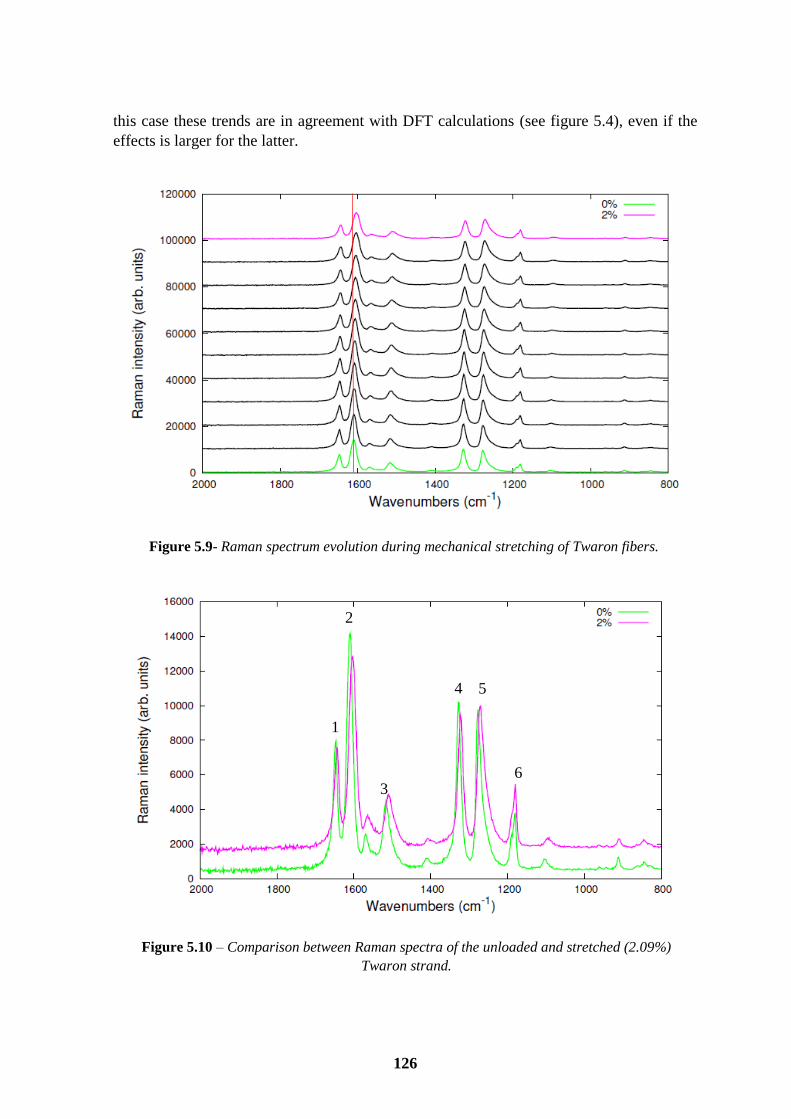
126
this case these trends are in agreement with DFT calculations (see figure 5.4), even if the
effects is larger for the latter.
Figure 5.9- Raman spectrum evolution during mechanical stretching of Twaron fibers.
Figure 5.10 – Comparison between Raman spectra of the unloaded and stretched (2.09%)
Twaron strand.
1
2
3
4 5
6

127
No significant discrepancy exists between the Raman spectra obtained by mechanical
stretching on PPTA and those predicted by CRYSTAL14 by simulating the chain strain, thus
assessing further the validity of our approach and the reliability of the computational method
adopted.
In figure 5.11 it’s shown the comparison between the Twaron Raman spectrum recorded
before the tensile test, during the mechanical stretching of the fibers and after the unloading.
We can observe that Twaron completely restores its molecular structure after the unloading,
since its Raman spectra before and after the mechanical stress perfectly match, both in terms
of relative intensities and relative bands position. This result is a further proof of the highly
crystalline structure of Kevlar, which make this polymer an elastic material.
These experiments, once again, demonstrate the reliability of our procedure for simulating
the mechanical stretching of polymers and the accuracy of CRYSTAL14 code in predicting
the strain effect on the Raman spectra. We have to keep in mind that in this case we have
simulated the mechanical stretching of an isolated infinite PPTA chain, neglecting the
hydrogen bonding and the other effects related to the crystalline packing; despite this
significant lack, our results are in agreement with experiments, with the only minor
exception of the predicted intensity changes which are higher for the DFT calculations than
in the experimental spectra. For a more detailed description of the mechanical stretching
effects on the vibrational spectra, a 3D crystal simulation should be carried out but this is
much more time consuming and not so relevant for Kevlar based on the present findings
Figure 5.11-Comparison between the Raman spectrum of Twaron before the mechanical
stretching, Twaron 1.2% strained and Twaron after the unloading cycle.

128
5.4 DFT calculation of elastic modulus
Most of polymer materials, for their own macromolecular nature, are composed by very long
chains which are not generally straight and conformationally ordered, but tend to form a
random coil. They can be pictured as a mass of intertwined chains, where the binding forces
are the result of van der Waals forces and hydrogen bonding (where possible) between
molecules and mechanical entanglement between chains. When a polymeric material is
subjected to tensile stress, molecular chains tend to orient by sliding one over the other, a
phenomenon which is governed both by intermolecular interactions, and intramolecular
effects due to conformational flexibility. For this reason, in general, polymer elastic modulus
depends both on intramolecular forces but it is also widely affected by the intermolecular
interactions between chains and by the mechanical effects due to entanglements. According
to this reasoning, measuring the elastic modulus of a polymeric materials on the basis of a
perfect crystalline system is a reliable procedure only for highly crystalline systems.
Fortunately, Kevlar, as already shown and explained in previous sections, has a high
crystalline structure and its molecular chains are well oriented along the fibers direction.
Therefore, when Kevlar fibers undergo to a tensile stress, their elastic modulus will mainly
depend on the molecular chain features, while intermolecular forces should play a minor
role. This plausible assumption would explain the almost completely elastic behavior of
Kevlar and its negligible stress relaxation reported in the literature and by our experiments.
By means of CRYSTAL14, we performed elastic modulus calculations both for the 1D
Kevlar chain and for the 3D Kevlar crystal according to the methods implemented in the
code. We have to keep in mind that the elastic constants are the second derivatives of the
energy density with respect to the strain components:
in which V is the unit cell volume.
The energy derivatives are evaluated by performing a perturbation to the lattice vectors of
the equilibrium unit cell.
In a crystalline system a point r is usually defined in terms of its fractional components:
Where 11, l2, l3, are the fundamental vectors of the primitive cell and h the fractional vector.
Under an elastic strain, any particles at r position move microscopically to r’.

129
where ε is the so-called Lagrangian elastic tensor.
According to Voigt convention we can define:
We can calculate the energy of the unit cell in the strain components yields using a Taylor
expansion to second order, where E(0) is the energy of the equilibrium configuration.
Finally, the elastic constants are computed by evaluating the energy as a function of
deformations of the unit cell parameters.
The elastic modulus of Kevlar depends on the grade of molecular order along the fibers
direction and for this reason it varies from 128 GPa for Kevlar 49 to 155 GPa for Kevlar
149, while some researchers found an elastic modulus of 200 GPa for extremely high
oriented Kevlar fibers (by means of heat treatment under tension)[47].
By means of CRYSTAL14 calculations we find out a value of 252 GPa for the 3D Kevlar
crystal and 130 GPa for the isolated Kevlar chain. Our first results are in direct agreement
with the one obtained by R.J. Young and co-workers in [50] and by P.K. Kim, C. Chang and
L.S. Hsu (see reference [4]), who found a value of 241 GPa on the base of longitudinal
acoustic mode (LAM) analysis. They stated that the fibers tensile deformation takes place
by a combinations of chain stretching and crystal rotation, so that the fibers tensile modulus
is controlled by the initial degree of overall orientation plus the additional orientation which
occurs as a result of crystal rotation. Therefore, the value of 252 GPa corresponds to the
situation when there is only crystal stretching and no rotation, and it is practically the crystal
modulus along the chain directions.
The lower calculated value of 130 GPa for the 1D Kevlar crystal may be due to the complete
lack of intermolecular interactions effects which would so play an important role. Indeed, in
a real polymer, chains would form strong hydrogen bonds with adjacent chains in the crystal,
and the stretching of these intermolecular interactions is quite relevant and could be the
reason for the value of the modulus so predicted [4]. A detailed investigation of how adopting
DFT calculations properly for a very precise prediction of the tensile properties of crystalline
polymers is out of the aim of this thesis and will be left for further studies.

130
Chapter 6
Conclusions
This work explored the characterization of poly(p-phenylene terephthalamide) using Raman
and IR spectroscopy by means of both experimental and computational techniques. The goal
of the research is the application of state-of-the-art quantum chemical calculations, in order
to study the structural and spectroscopic properties of the crystal phase of aramid fibers,
including also the behavior displayed upon mechanical deformation. This class of materials
such as Kevlar, Twaron and Technora have already reach a wide number of applications in
the technological and industrial field, even if their molecular properties have been not
investigated in details. The rapidly growing applications for Kevlar includes ballistic
protections, truck and bike tyres, and with its lightweight dielectric properties, tension
reinforcement for optic-fibers above ground cables and protective coverings for underground
and underwater optic-fibers cable. From a scientific point of view, there are many questions
which still need an answer, especially related to the Kevlar behavior upon strain,
compression and fatigue, interpreted at the molecular scale. In particular, the direct
connection between mechanical behavior of polymers and molecular phenomena, make us
able, in principle, to obtain guidelines to modify the macroscopic characteristic by means of
a rationale design of the polymer nanostructure. Acting at these scale requires a profound
knowledge of the molecular structure of the polymeric chains and how they affect the
physical-chemical properties of the bulk material. In this context the importance of a detailed
characterization of polymer materials is evident.
A few studies, carried out by different research groups, to understand the mechanical
behavior of Kevlar and their molecular structures have been the starting point of this work
and most of them are based on experimental techniques, such as vibrational spectroscopy or
X-Ray diffraction, while no computational investigation have been carried out for Kevlar.
From the experimental hand, besides the characterization of the Raman and IR spectra for
PPTA fibers, including the effects of polarization, we also performed Raman analysis during
the mechanical stretching of Twaron fibers, exploring the structural changes occurring at the
molecular scale, and the resulting behavior of Raman spectra. In agreement with results
reported in the literature, a frequency red-shift induced by strain on the bands related to
backbone vibrations was observed: it results, in particular, that the most strain-affected
normal mode is the one having frequency 1609 cm-1 being associated to the aromatic rings
vibrations. Furthermore, trough experiments performed with polarized light, it was noticed
that many bands related to vibrations generating a parallel dipole moment with respect to the
chain axis, disappear in the IR spectrum performed with perpendicular polarized light and
viceversa; this fact underlines the high molecular orientation of Kevlar and Twaron fibers,
which turns to be the primary reason these materials exhibit such highly anisotropic elastic
behavior, with very high axial tensile strength. These experiments may provide a foundation
for the development of NDE (non-destructive examination) technologies intended to detect
the in-situ deterioration of Kevlar used for engineering applications that can later be
extended to other materials such as aramid fibers composites.

131
Our experimental investigation of the vibrational properties and spectra was supported by
state-of-the-art DFT calculations, which constituted the main part of this thesis. These kind
of calculations have played a fundamental role in the characterization of complex molecular
systems and proved to be an unavoidable tool for the correct and complete interpretation of
the experimental data and materials properties. In the past, computational investigation
focused on the structural and spectroscopic properties of polymers have been already
reported in the literature, but all of them were based on semi-empirical methods applied only
to small oligomers or on classical molecular dynamics. This limitation was due to the lack
of suitable quantum chemical tools for a detailed prediction of vibrational spectra prediction
of molecular crystals. Recently, the CRYSTAL code, developed to perform quantum-
chemical calculations for crystalline systems described by periodic boundary conditions,
gives us the opportunity to study polymer materials, both as infinite molecular chains (the
so-called 1D crystal) and as an ideal infinite 3D crystal. Our research group has been
particularly active in this context and adopted this code to study in details the structure and
vibrational properties of many polymeric materials.
With this thesis, a further contribution to this line of research is presented: by means of
CRYSTAL14 code we carried out DFT simulations of the Kevlar 3D crystal, isolated infinite
Kevlar chain (the so-called 1D crystal) and Kevlar oligomers (in this case by means of the
Gaussian code), exploring the potentiality of quantum-chemical calculations applied to
polymer materials [14].
In particular, by computing the vibrational frequencies for the PPTA 3D crystal, we were
able to characterize with high accuracy, the Raman and IR spectra, proposing an
unambiguous band assignment in terms of the normal modes in the whole spectrum. By
means of calculations performed on PPTA oligomers, we clarified the effects due both to
intermolecular and intramolecular interactions on the structure and consequently on the
vibrational spectra; in particular, we showed the capability of DFT calculations in predicting
the significant effect of hydrogen bonding in shifting toward lower frequency the band
associated to C=O bond stretching mode, and structural changes due to steric hindrance
between different molecules. The mechanical stretching of Kevlar fibers was also simulated
at the molecular scale, showing the structural changes leading to the modulations of the
vibrational spectra and giving the possibility to rationalize these effects based on intra and
intermolecular phenomena without any arbitrarity or assumption.
The IR polarized spectrum calculations, provided a comparison between the response of
Twaron fibers and the ideally perfect PPTA crystal, demonstrating the highly ordered fibers
structure and the reliability of DFT calculations also in the prediction of the polarized
vibrational spectra. By means of CRYSTAL14 we were also able to compute the PPTA
crystal elastic modulus along the chain direction, which turns out to be 254 GPa in agreement
with the value proposed by other authors. We also carried out PPTA oligomers simulations,
in particular the PPTA monomer, two monomers and dimer models. The comparisons
between their respective vibrational spectra shed light on the fundamental role played by the
intermolecular and conformational phenomena in affecting the spectral features of Kevlar,
leading to a precise rationalization of the material behavior at the molecular scale.

132
From the methodological point of view, we compared the results obtained by means of
different exchange-correlation functionals and basis sets, underlining their weaknesses and
strengths in simulating the real system and thus obtaining information useful in the field of
computational quantum chemistry for the computational setup of periodic DFT calculations
of polymeric systems.
On more general grounds, through a combined experimental-computational approach, this
thesis demonstrated the importance of quantum chemical calculations in materials science
and engineering. These tools are now not only related to the interpretation of the material
properties at the molecular scales, but have outcomes which do possess a much larger
significance and importance. The possibility to give an unambiguous and complete
interpretation of spectroscopic measurements has indeed relevant applications in applied
research and technology, solving the discrepancies and limitations associated to the
employment of experimental techniques only.
Indeed, computational approaches are becoming more and more popular also in the industrial
environment and it is to be expected that in the next future they will probably become a
standard tool both in connection to experimental measurements and also for the design of
new molecular materials with tailored properties.
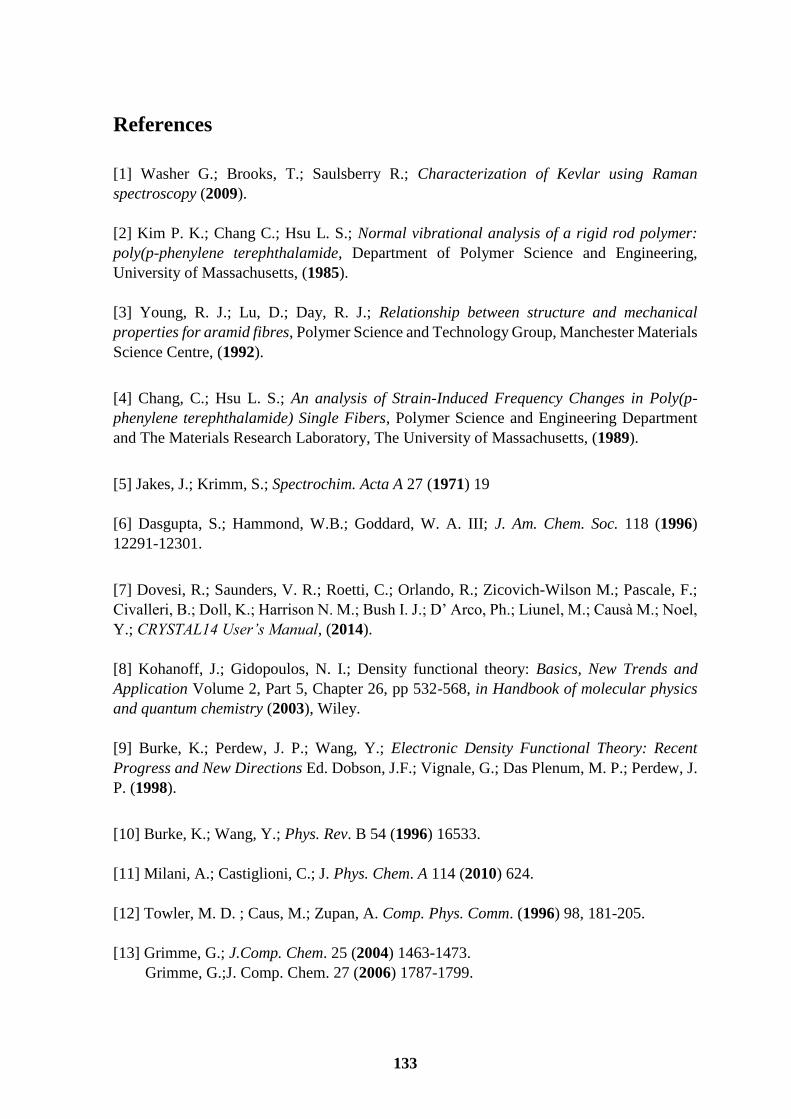
133
References
[1] Washer G.; Brooks, T.; Saulsberry R.; Characterization of Kevlar using Raman
spectroscopy (2009).
[2] Kim P. K.; Chang C.; Hsu L. S.; Normal vibrational analysis of a rigid rod polymer:
poly(p-phenylene terephthalamide, Department of Polymer Science and Engineering,
University of Massachusetts, (1985).
[3] Young, R. J.; Lu, D.; Day, R. J.; Relationship between structure and mechanical
properties for aramid fibres, Polymer Science and Technology Group, Manchester Materials
Science Centre, (1992).
[4] Chang, C.; Hsu L. S.; An analysis of Strain-Induced Frequency Changes in Poly(p-
phenylene terephthalamide) Single Fibers, Polymer Science and Engineering Department
and The Materials Research Laboratory, The University of Massachusetts, (1989).
[5] Jakes, J.; Krimm, S.; Spectrochim. Acta A 27 (1971) 19
[6] Dasgupta, S.; Hammond, W.B.; Goddard, W. A. III; J. Am. Chem. Soc. 118 (1996)
12291-12301.
[7] Dovesi, R.; Saunders, V. R.; Roetti, C.; Orlando, R.; Zicovich-Wilson M.; Pascale, F.;
Civalleri, B.; Doll, K.; Harrison N. M.; Bush I. J.; D’ Arco, Ph.; Liunel, M.; Causà M.; Noel,
Y.; CRYSTAL14 User’s Manual, (2014).
[8] Kohanoff, J.; Gidopoulos, N. I.; Density functional theory: Basics, New Trends and
Application Volume 2, Part 5, Chapter 26, pp 532-568, in Handbook of molecular physics
and quantum chemistry (2003), Wiley.
[9] Burke, K.; Perdew, J. P.; Wang, Y.; Electronic Density Functional Theory: Recent
Progress and New Directions Ed. Dobson, J.F.; Vignale, G.; Das Plenum, M. P.; Perdew, J.
P. (1998).
[10] Burke, K.; Wang, Y.; Phys. Rev. B 54 (1996) 16533.
[11] Milani, A.; Castiglioni, C.; J. Phys. Chem. A 114 (2010) 624.
[12] Towler, M. D. ; Caus, M.; Zupan, A. Comp. Phys. Comm. (1996) 98, 181-205.
[13] Grimme, G.; J.Comp. Chem. 25 (2004) 1463-1473.
Grimme, G.;J. Comp. Chem. 27 (2006) 1787-1799.

134
[14] Quarti, C.; Milani, A.; Orlando, R.; Civalleri, B.; Castiglioni, C.; Ab initio calculations
of the crystalline structure and IR spectrum of polymers: Nylon 6 polymorphs in Journal of
Physical and Chemistry B, 116, 8299-8311, (2012).
[15] Evarestov, R. A. Quantum chemistry of solids. The LCAO first principles treatment of
crystals.
[16] Sweeney, D. J.; Newell, J. A.; Picerno, S.; Kurzeja, T.; High Perform. Polym., 14,
(2002), 133
[17] Dupont; Kevlar Technical Guide, (2012).
[18] Konopasek, L.; Hearle, J.W.S; J. Appl. Polym. Sci., (1979), 21:2791
[19] Stuart B. H.; A Fourier transform Raman study of water sorption by Kevlar-49,
Department of Materials Science, University of Techonology, Sydeney, (2007)
[20] Li, S.L.; Allard, F.; Bigelow W.C.B.; J. Macromol. Sci. Phys. B22; 269 (1983)
[21] Stuart B. H.; Polym. Bull. 33; 681, (1994)
[22] Chatzi E. G.; Ishida H.; Koening L. J.; An FT-IR Study of the Water Absorbed in Kevlar-
49; Appl. Spectrosc. 40, 847-851 (1986)
[23] Marta E.; Mosquera G.; Jamond M.; Matinez-Alonso A.; Tascon J.; Therma
Transformation of Kevlar Aramid Fibers during Pyrolysis: Infra-red and Thermal analysis
Studies; Istituto nacional del Carbon, CSIC, (1994)
[24] Dovesi, R.; Orlando, R.; Roetti, C.; Pisani, C.; Saunders, V.R.; Phys. Stat. sol., 2000,
217, 63
[25] Evarestov, R. A.; Quantum chemistry of solids. The LCAO first principles treatment of
crystals
[26] Dovesi, R.; Civalleri, B.; Orlando, R.; Roetti, C.; Sauders, V. R. Rev. Comput. Chem.
2005, 21, 1-125
[27] Zicovich-Wilson, C. M.; Dovesi, R.; Int. J. Quantum Chem., 1998, 67, 299
[28] Zicovich-Wilson, C. M.; Dovesi, R.; Int. J. Quantum Chem., 1998, 67, 311
[29] Beatson, R.; Greengard, L.; A short course on fast multipole methods, Department of
Mathematics and Statistics, University of Canterbury

135
[30] Greengard, L.; Rokhlin V.; A Fast Algorithm for Particle Simulations. J.Comput. Phys.
73, 325-348 (1987)
[31] Northolt M. G.; X-Ray Diffraction Study of Poly(P-Phenylene Terephtalamide) Fibers;
Akzo Research Laboratories Arnhem, Corporate Research Department, The Netherlands,
(1974)
[32] Cobbledick, R. E.; Small, R. H. W.; Acta crystallogr., B28, 1893, (1972)
[33] Gaussian 09, Revision E.01, Frisch, M. J.; Trucks, G. W.; Schlegel, H. B.; Scuseria, G.
E.; Robb, M. A.; Cheeseman, J. R.; Scalmani, G.; Barone, V.; Mennucci, B.; Petersson, G.
A.; Nakatsuji, H.; Caricato, M.; Li, X.; Hratchian, H. P.; Izmaylov, A. F.; Bloino, J.; Zheng,
G.; Sonnenberg, J. L.; Hada, M.; Ehara, M.; Toyota, K.; Fukuda, R.; Hasegawa, J.; Ishida,
M.; Nakajima, T.; Honda, Y.; Kitao, O.; Nakai, H.; Vreven, T.; Montgomery, J. A., Jr.;
Peralta, J. E.; Ogliaro, F.; Bearpark, M.; Heyd, J. J.; Brothers, E.; Kudin, K. N.; Staroverov,
V. N.; Kobayashi, R.; Normand, J.; Raghavachari, K.; Rendell, A.; Burant, J. C.; Iyengar, S.
S.; Tomasi, J.; Cossi, M.; Rega, N.; Millam, J. M.; Klene, M.; Knox, J. E.; Cross, J. B.;
Bakken, V.; Adamo, C.; Jaramillo, J.; Gomperts, R.; Stratmann, R. E.; Yazyev, O.; Austin,
A. J.; Cammi, R.; Pomelli, C.; Ochterski, J. W.; Martin, R. L.; Morokuma, K.; Zakrzewski,
V. G.; Voth, G. A.; Salvador, P.; Dannenberg, J. J.; Dapprich, S.; Daniels, A. D.; Farkas, Ö.;
Foresman, J. B.; Ortiz, J. V.; Cioslowski, J.; Fox, D. J. Gaussian, Inc., Wallingford CT,
(2009).
[34] CRYSTAL14, R. Dovesi, R. Orlando, A. Erba, C. M. Zicovich-Wilson, B. Civalleri, S.
Casassa, L. Maschio, M. Ferrabone, M. De La Pierre, P. D’Arco, Y. Noel, M. Causa, M.
Rerat, B. Kirtman, Int. J. Quantum Chem. 114, 1287 (2014).
[35] Panar, M.; Avakian, P.; Blume, C.; Gardner, K. H.; Gierke, T. D.; Yang, H. H.;
Morphology of Poly(p-Phenylene Terephthalamide) fibers, E.I du Pont de Nemours and
Company Central Research and Development Department, Delaware, (1983).
[36] Galiotis, C.; Robinson, I. M.; Young, R. J.; Batchelder D. N.; Strain measurements in
aramid fibers and composites using Raman spectroscopy, Engineering applications of new
composites, Omega Scientific, Wallingford, U.K, (1988).
[37] Galiotis, C.; Robinson, I. M.; Young, R. J.; Smith, B.; Batchelder, D. N.; Strain
dependence of the Raman frequencies of a Kevlar 49 fiber, Polym. Commun., 26, 354–355,
(1985).
[38] Parthenios, J.; Katerelos, D. G.; Psarras, G. C.; Galiotis, C.; Aramid fibers: A
multifunctional sensor for monitoring stress/strain fields and damage development in
composite materials. Eng. Fract. Mech., 69, 1067–1087, (2002).
[39*] Prasad, K.; Grubb, D. T.; Deformation behavior of Kevlar fibers studied by Raman
spectroscopy, J. Appl. Polym. Sci., 41, 2189–2198, (1990).

136
[40] Schadler, L. S.; Galiotis, C.; Fundamentals and applications of micro Raman
spectroscopy to strain measurements in fiber reinforced composites, Int. Mater. Rev., 40(3),
116–133, (1995).
[41] Galimberti, D.; Milani, A.; Castiglioni, C.; Infrared intensities and charge mobility in
hydrogen bonded complexes, Dipartimento di Chimica e Ingegneria Chimica “Giulio Natta”,
Politecnico di Milano, (2013).
[42] Young R. J.; Lu, D.; Day, R., J.; Relationship between structure and mechanical
properties for aramid fibers, Polymer science and technology group, Manchester Materials
Science Centre, (1992).
[43] Prasad, K.; Grubb, D., T.; Deformation behavior of Kevlar fibers studied by Raman
Spectroscopy, Department of Material science and Engineering, Cornell University, New
York 14853, (1990).
[44] Galimberti, D.; Milani, A.; Castiglioni, C.; Charge mobility in molecules: Charge fluxes
from second derivatives of the molecular dipole, Galimberti, D.; Milani, A.; Castiglioni, C.;
Dipartimento di Chimica e Ingegneria Chimica “Giulio Natta”, Politecnico di Milano, The
journal of Chemical Physics (2013).
[45] Evarall, N.; Using polarized vibrational spectroscopy to characterise molecular
orientation in polymers: an introduction a tutorial, ICI Technology, Wilton research center,
Cleveland.
[46] Man, C.; Huang M.; A simple explicit formula for the Voigt-Reus-Hill average of elastic
polycrystals with arbitrary crystal texture symmetries; Springer Science+Business Media
B.V. (2011).
[47] Gaymans, R. J.; Tijssen, J.; Harkema, S.; Bantjes, A.; Polymer, 17, 517, (1976).
[48] Rao, Y.; Waddon, A.J.; Farris, R.J.; Structure property relation in poly(p-phenylene
terephthalamide) fibers, Polymer science and engineering department, Silvio O. Conte
National center for Polymer research, University of Massachusetts at Amherst, (2000).
[49] Chang, C.; Hsu, S. L.; An analysis of strain-induced frequency changes in poly(p-
phenylene terephthalamide) single fibers, Polymer science and engineering department and
material research laboratory, The university of Massachusetts, (1989).
[50] Young, J.; Lu, D.; Day, J. R.; Relationship between structure and mechanical properties
of aramid fibres, Polymer science and technology group, Manchester materials science
center, University of Manchester, (1992).

137
[51] Jassal, M.; Ghosh, S.; Aramid fibers - An overview, Departement of Textile Technology,
Indian institute of Technology, New Delhi, India, (2002).
[52] http://www.teijin.com/products/advanced_fibers/