Embed Size (px)
Citation preview
Quantity-Quality and the One ChildPolicy: The postive effect of family size
on education in China
Nancy Qian∗
Dept. of Economics, MITCambridge, MA 02142
October 12, 2004
Abstract
There is a negative correlation between quantity and quality of chil-dren across countries and across households within a country. How-ever, because parents simultaneously choose the quantity and qualityof their children, the observed correlation between family size and childoutcomes cannot be interpreted as causal. This paper exploits exoge-nous changes in family size caused by relaxations in China’s One ChildPolicy to estimate the effect of family size on school enrollment. Specif-ically, it uses the relaxation which allows a rural household to have asecond child if the first is a girl. First, it shows that the “1-son-2-child”rule increased family size for first born girls. Second, it uses this exoge-nous increase in family size to find that an additional sibling increasesschool enrollment of the first child by 8-17%.
1 Introduction
The relationship between quantity and quality of children is a long standing
question in labor economics. The negative correlation between family size∗Comments and suggestions welcome. Please contact [email protected]. I thank Abhijit
Banerjee, Esther Duflo, and Josh Angrist for their guidance and support; Ashley Lesterfor indepth discussions and useful suggestions; the participants at the MIT DevelopementLunch for comments; and Catherine Baird at the Carolina Data Center and Yaer Zhangat the China Insititute for Population Research for data assistance. I would like to ac-knowledge the National Science Foundation Graduate Research Fellowship and the MITSchultz Fund for financial assistance.
1
and child outcomes such as education attainment and school enrollment can
be observed across countries and across households within countries. To-
day, this relationship is especially relevant to developing countries as policy
makers there desire to simultaneously curb population growth and increase
human capital investment. Both China and India, the world’s two most
populous countries, have experimented with different family planning poli-
cies to limit family size. Understanding the tradeoff between quantity and
quality of children is important for evaluating the effects of past policies and
for constructing effective future polices.
The main difficulty in determining the causal relationship of quantity
on quality is that quantity and quality of children are jointly determined
by parents. For example, if parents who value education more choose to
have fewer children, the observed negative correlation between family size
and schooling will be driven by unobserved parental preferences rather than
by family size. This paper addresses the problem of joint determination of
quantity and quality of children by exploiting regional variation in relax-
ations of China’s One Child Policy. Specifically, it uses the relaxation which
allows families to have a second child if the first child is a girl to instrument
for the family size of first born children born before the relaxation was an-
nounced. Three facts are exploited: 1) girls born in relaxed areas are more
likely to have siblings; 2) in areas which experienced the relaxation, only
households where the first born child was a girl was affected; and 3) the re-
laxation increased family size for girls who were affected by the initial One
Child Policy (born 1976 and after) and had no effect on previous cohorts.
The instrument for family size is the triple interaction term of an indi-
vidual’s sex, date of birth and region of birth. Only the combination of the
three is exogenous. The interaction between whether a girl was born in a
relaxed area and whether she was born 1976 or after estimates the effect of
the relaxation of family size. The additional comparison with boys controls
for education quality changes in relaxed regions that affected boys and girls
similarly.
The triple difference instrument has several advantages. Like simple
2
differences-in-differences estimators, cohort-invariant differences across re-
gions are differenced out by the comparison across cohorts and changes
across cohorts which affect different regions similarly are differenced out by
the comparison across regions. The triple difference has the additional ben-
efit that cohort-varying differences across regions in school provision which
affect boys and girls similarly are differenced out by the comparison between
girls and boys. The exclusion restriction is only violated if there are time-
varying differences between regions which experienced the relaxations and
regions which did not that had differential effects on boys and girls. For
example, if relaxations only occurred in areas where the One Child Policy
caused high incidences of female infanticide, parents in relaxed areas who
chose keep girls born after the One Child Policy will not be the same as
parents who chose to keep girls born before the One Child Policy. Namely,
if the former valued education more than the latter, the effect of the relax-
ation on family size will also capture the different values of education. In
this case, the two stage least squares (2SLS) estimate will obtain the upper-
bound effect of family size on school enrollment. To address this problem,
I will construct an alternative sample to estimate the lower-bound effect of
family size.
There are two main benefits in setting this study in China. Relaxations
in the One Child Policy provide a unique natural experiment for family size.
In addition, I can evaluate the effect of the One Child Policy, one of the most
restrictive and large scale family planning policies ever undertaken. While
demographers and sociologists have conducted descriptive studies of the pol-
icy’s impact on sex ratios and fertility, there has been no study examining
the causal effect of the One Child Policy on child outcomes.
The results show that the 1-Son-2-Child relaxation was implemented in
communities with stronger boy-biased sex selection than average. It in-
creased family size for first born girls and had no effect on the family size of
first born boys. It also increased the survival rate of girls amongst first born
children but had no effect on the sex ratios of later born children. Contrary
to previous findings, the results show that an additional sibling increases
3
school enrollment of the first born child by 8-17% on average. This sug-
gests that the tradeoff between quantity and quality is not monotonically
decreasing.
Section 2 discusses the background of the One Child Policy and the
conceptual framework. Section 3 describes the data. Section 4 presents the
empirical results. Section 5 offers concluding remarks.
2 Background
2.1 Past Studies
Empirical findings on the quantity quality trade-off are conflicted. On one
hand, the effect of family size on education has been found to be negative
by Rosenzweig and Wolpin (1980) in India; by Goux and Maurin (2004) in
France; by Conley (2004), Berhman et. al. (1989) and Stafford (1987) in the
U.S. On the other hand, studies by Lee (2003) in Korea, Black et. al. (2004)
in Norway, Kessler (1991) and Guo and VanWey (1991) in the U.S. have
found that family size has no effect on education. Adding to the controversy,
Gomes (1984) found that family size was positively correlated with education
attainment for first born children in Kenya and Iacavou (2004) found that
although family size and education outcomes are negatively correlated in
the U.K., children from one-child families perform worse than children from
two-child families.
To address the problem joint determination, past studies have exploited
the exogenous variation in family size caused by multiple births or the sex
composition of the first two children (Rosenzweig and Wolpin, 1980; Con-
ley, 2004; Lee, 2003). However, both instruments affect child outcomes other
than family size. In a study of Indonesia, Duflo (1998) found that twin births
of younger siblings were correlated with higher mortality rates of the first
born child. She argued that short birth spacing may be a channel through
which an increased number of children lower their average quality. The strain
on resources is especially problematic if the household is credit constrained.
The sibling-sex instrument is equally problematic. Dahl and Moretti (2004)
4
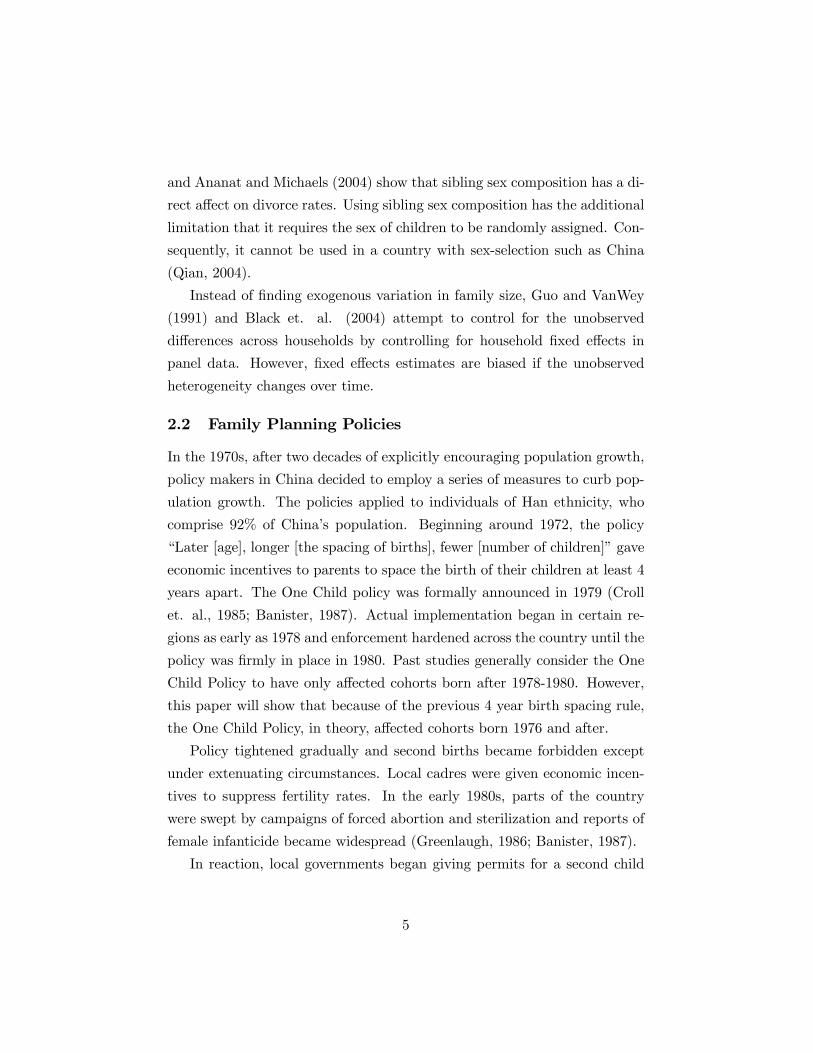
and Ananat and Michaels (2004) show that sibling sex composition has a di-
rect affect on divorce rates. Using sibling sex composition has the additional
limitation that it requires the sex of children to be randomly assigned. Con-
sequently, it cannot be used in a country with sex-selection such as China
(Qian, 2004).
Instead of finding exogenous variation in family size, Guo and VanWey
(1991) and Black et. al. (2004) attempt to control for the unobserved
differences across households by controlling for household fixed effects in
panel data. However, fixed effects estimates are biased if the unobserved
heterogeneity changes over time.
2.2 Family Planning Policies
In the 1970s, after two decades of explicitly encouraging population growth,
policy makers in China decided to employ a series of measures to curb pop-
ulation growth. The policies applied to individuals of Han ethnicity, who
comprise 92% of China’s population. Beginning around 1972, the policy
“Later [age], longer [the spacing of births], fewer [number of children]” gave
economic incentives to parents to space the birth of their children at least 4
years apart. The One Child policy was formally announced in 1979 (Croll
et. al., 1985; Banister, 1987). Actual implementation began in certain re-
gions as early as 1978 and enforcement hardened across the country until the
policy was firmly in place in 1980. Past studies generally consider the One
Child Policy to have only affected cohorts born after 1978-1980. However,
this paper will show that because of the previous 4 year birth spacing rule,
the One Child Policy, in theory, affected cohorts born 1976 and after.
Policy tightened gradually and second births became forbidden except
under extenuating circumstances. Local cadres were given economic incen-
tives to suppress fertility rates. In the early 1980s, parts of the country
were swept by campaigns of forced abortion and sterilization and reports of
female infanticide became widespread (Greenlaugh, 1986; Banister, 1987).
In reaction, local governments began giving permits for a second child
5
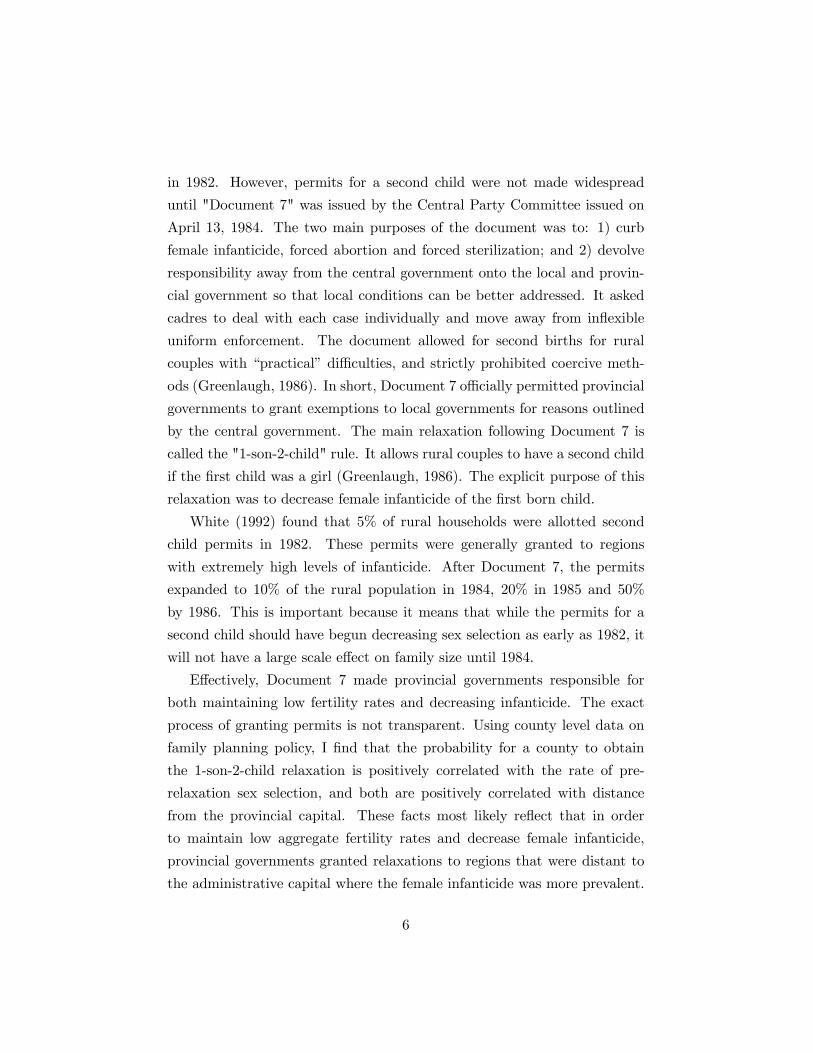
in 1982. However, permits for a second child were not made widespread
until "Document 7" was issued by the Central Party Committee issued on
April 13, 1984. The two main purposes of the document was to: 1) curb
female infanticide, forced abortion and forced sterilization; and 2) devolve
responsibility away from the central government onto the local and provin-
cial government so that local conditions can be better addressed. It asked
cadres to deal with each case individually and move away from inflexible
uniform enforcement. The document allowed for second births for rural
couples with “practical” difficulties, and strictly prohibited coercive meth-
ods (Greenlaugh, 1986). In short, Document 7 officially permitted provincial
governments to grant exemptions to local governments for reasons outlined
by the central government. The main relaxation following Document 7 is
called the "1-son-2-child" rule. It allows rural couples to have a second child
if the first child was a girl (Greenlaugh, 1986). The explicit purpose of this
relaxation was to decrease female infanticide of the first born child.
White (1992) found that 5% of rural households were allotted second
child permits in 1982. These permits were generally granted to regions
with extremely high levels of infanticide. After Document 7, the permits
expanded to 10% of the rural population in 1984, 20% in 1985 and 50%
by 1986. This is important because it means that while the permits for a
second child should have begun decreasing sex selection as early as 1982, it
will not have a large scale effect on family size until 1984.
Effectively, Document 7 made provincial governments responsible for
both maintaining low fertility rates and decreasing infanticide. The exact
process of granting permits is not transparent. Using county level data on
family planning policy, I find that the probability for a county to obtain
the 1-son-2-child relaxation is positively correlated with the rate of pre-
relaxation sex selection, and both are positively correlated with distance
from the provincial capital. These facts most likely reflect that in order
to maintain low aggregate fertility rates and decrease female infanticide,
provincial governments granted relaxations to regions that were distant to
the administrative capital where the female infanticide was more prevalent.
6
The higher prevalence of sex selection in rural areas can be due to both more
boy-preference in distant rural areas and the fact that geographic distance
increases the provincial government’s difficulty of preventing infanticide.1
Issues of identification which arises from the correlation of obtaining a re-
laxation and sex selection will be addressed explicitly later in the paper.
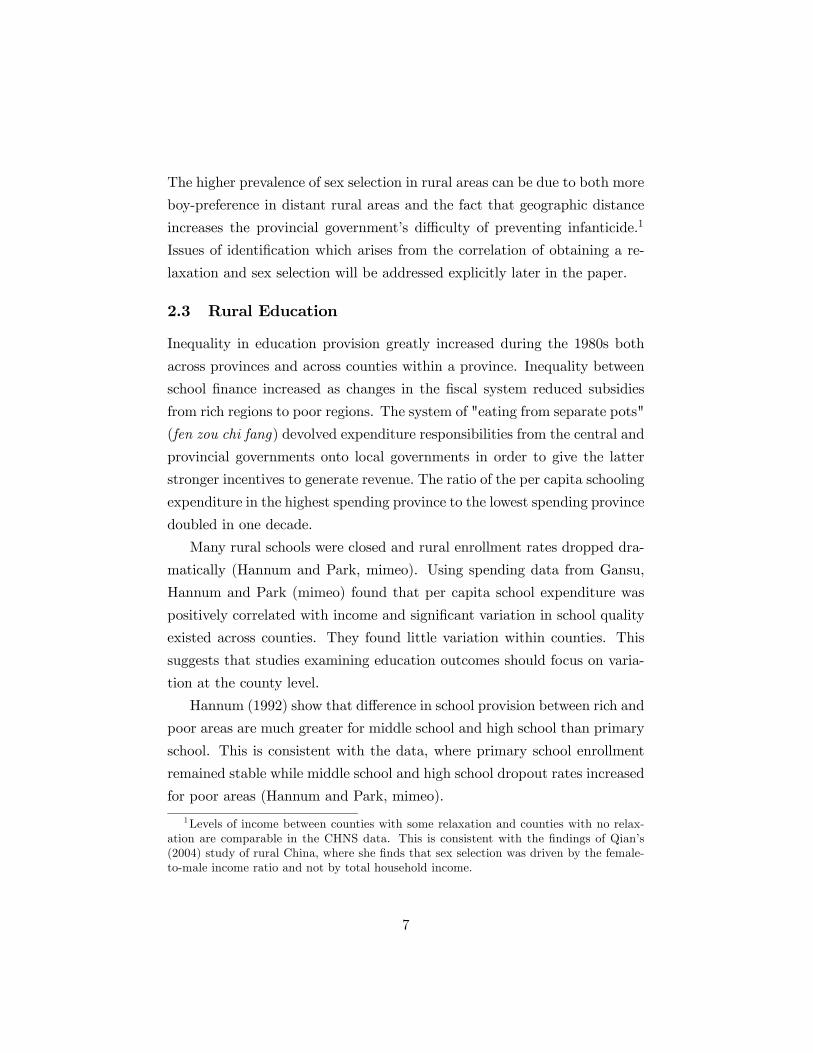
2.3 Rural Education
Inequality in education provision greatly increased during the 1980s both
across provinces and across counties within a province. Inequality between
school finance increased as changes in the fiscal system reduced subsidies
from rich regions to poor regions. The system of "eating from separate pots"
(fen zou chi fang) devolved expenditure responsibilities from the central and
provincial governments onto local governments in order to give the latter
stronger incentives to generate revenue. The ratio of the per capita schooling
expenditure in the highest spending province to the lowest spending province
doubled in one decade.
Many rural schools were closed and rural enrollment rates dropped dra-
matically (Hannum and Park, mimeo). Using spending data from Gansu,
Hannum and Park (mimeo) found that per capita school expenditure was
positively correlated with income and significant variation in school quality
existed across counties. They found little variation within counties. This
suggests that studies examining education outcomes should focus on varia-
tion at the county level.
Hannum (1992) show that difference in school provision between rich and
poor areas are much greater for middle school and high school than primary
school. This is consistent with the data, where primary school enrollment
remained stable while middle school and high school dropout rates increased
for poor areas (Hannum and Park, mimeo).
1Levels of income between counties with some relaxation and counties with no relax-ation are comparable in the CHNS data. This is consistent with the findings of Qian’s(2004) study of rural China, where she finds that sex selection was driven by the female-to-male income ratio and not by total household income.
7
The CHNS data show that counties with some relaxation and counties
with no relaxation have similar geographic access to schooling. However, it
does not report data which reveal quality of schooling. Because relaxed areas
tend to be more rural, it is likely that the quality of schools was declining
in relaxed areas during the same time that the 1-son-2-child relaxation took
effect. In other words, the cohorts in relaxed counties which were affected by
the 1-son-2-child relaxation also experienced a decline in education quality.
To control for this, I will compare outcomes for girls to boys within counties.
The strategy is robust as long as the changes in school quality and the
economic conditions which determine school quality in relaxed areas have
the same impact on boys and girls.
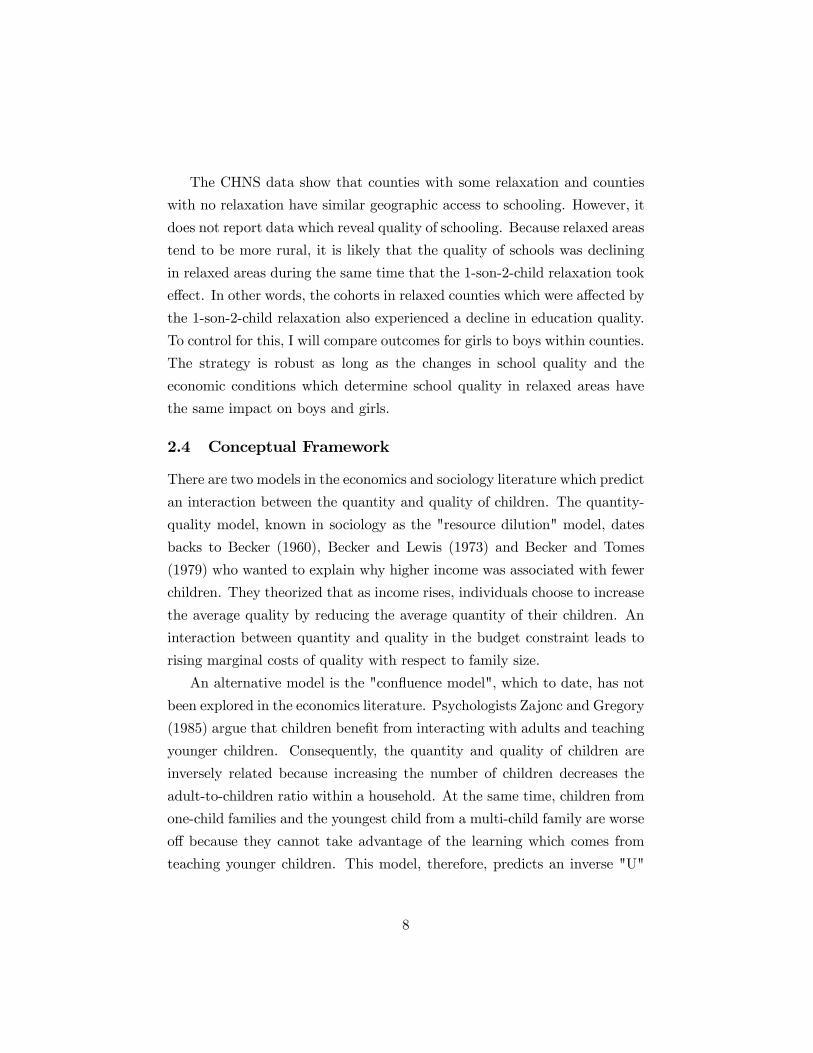
2.4 Conceptual Framework
There are two models in the economics and sociology literature which predict
an interaction between the quantity and quality of children. The quantity-
quality model, known in sociology as the "resource dilution" model, dates
backs to Becker (1960), Becker and Lewis (1973) and Becker and Tomes
(1979) who wanted to explain why higher income was associated with fewer
children. They theorized that as income rises, individuals choose to increase
the average quality by reducing the average quantity of their children. An
interaction between quantity and quality in the budget constraint leads to
rising marginal costs of quality with respect to family size.
An alternative model is the "confluence model", which to date, has not
been explored in the economics literature. Psychologists Zajonc and Gregory
(1985) argue that children benefit from interacting with adults and teaching
younger children. Consequently, the quantity and quality of children are
inversely related because increasing the number of children decreases the
adult-to-children ratio within a household. At the same time, children from
one-child families and the youngest child from a multi-child family are worse
off because they cannot take advantage of the learning which comes from
teaching younger children. This model, therefore, predicts an inverse "U"
8
shape for the relationship between quantity and quality of children. This is
consistent with findings from Iacavou’s (2004) study of children in the U.K.
She finds that although general family size is negatively correlated with
measures of school performance, first born children from one-child families
perform worse than first born children from two-child families. Moreover,
the only-child effect decreases for children who interact more with other
children outside of school.
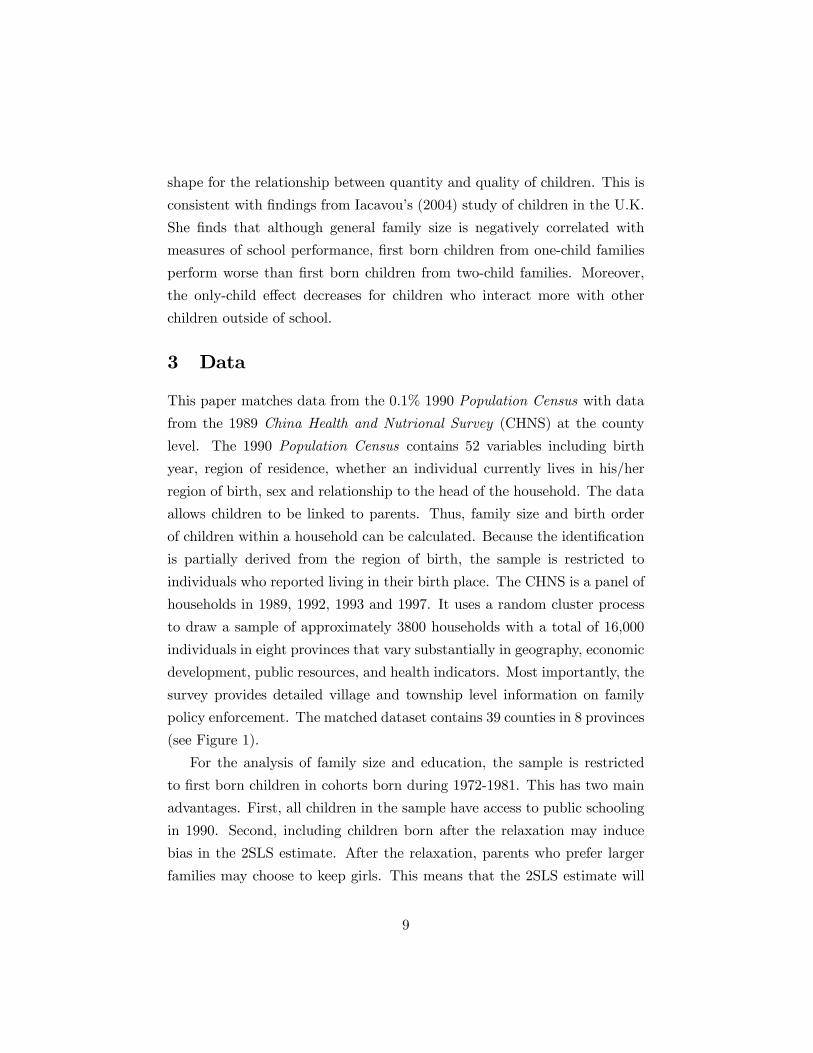
3 Data
This paper matches data from the 0.1% 1990 Population Census with data
from the 1989 China Health and Nutrional Survey (CHNS) at the county
level. The 1990 Population Census contains 52 variables including birth
year, region of residence, whether an individual currently lives in his/her
region of birth, sex and relationship to the head of the household. The data
allows children to be linked to parents. Thus, family size and birth order
of children within a household can be calculated. Because the identification
is partially derived from the region of birth, the sample is restricted to
individuals who reported living in their birth place. The CHNS is a panel of
households in 1989, 1992, 1993 and 1997. It uses a random cluster process
to draw a sample of approximately 3800 households with a total of 16,000
individuals in eight provinces that vary substantially in geography, economic
development, public resources, and health indicators. Most importantly, the
survey provides detailed village and township level information on family
policy enforcement. The matched dataset contains 39 counties in 8 provinces
(see Figure 1).
For the analysis of family size and education, the sample is restricted
to first born children in cohorts born during 1972-1981. This has two main
advantages. First, all children in the sample have access to public schooling
in 1990. Second, including children born after the relaxation may induce
bias in the 2SLS estimate. After the relaxation, parents who prefer larger
families may choose to keep girls. This means that the 2SLS estimate will
9
show that girls with larger family size are better off. But the estimate will
be partially driven by parental preferences. Exclusion of first born children
born after 1981 removes this possibility.
Ideally, the control group for counties with the relaxation is counties
that are similar in all dimensions except the relaxation. The descriptive
statistics in Table 1 Panel A show that counties with no relaxation are very
similar to counties with some relaxation along demographic characteristics.
Each has 52% boys on average and are mainly composed of ethnic Hans.
Children in relaxed counties have on average 1 more sibling than children
from counties without the relaxation. Approximately 85% of children are
enrolled in primary, middle or high school.
The data shows that counties with some relaxation are almost 4 times
as far from the provincial capital as counties with no relaxation. Distance
to school is similar between the two types of counties.
Panel B of Table 1 describes the data for first born children from one-
child families and from families with two or more children. 47% of children
in multi-child families are boys while 60% of one-child families are boys.
Children without siblings are on average enrolled in school 12% more than
children with at least one sibling.
4 Empirical Framework
4.1 Identification
Sex, date of birth and region of birth jointly determine an individual’s ex-
posure to the 1-Son-2-Child relaxation. The relaxation allowed parents to
have a second child only if the first born child was a girl. Therefore, family
size should be positively correlated with being a girl. The One Child Policy,
introduced around 1980, followed family planning polices which encouraged
birth spacing of at least four years. Consequently, the relaxation should only
affect girls born 1976 or after.
The interaction between whether a girl was born in a relaxed area and
whether she was born 1976 or after estimates the effect of the relaxation
10
of family size. The additional comparison with boys controls for educa-
tion provision changes in relaxed regions which affected both boys and girls
similarly. The instrument for family size is the triple interaction of an indi-
vidual’s sex, date and region of birth. Only the combination of the three is
exogenous. The exclusion restriction for the instrument is that it must be
correlated with family size and have no direct effect on school enrollment or
other right hand side variables.
Like simple differences-in-differences estimators, cohort-invariant differ-
ences across regions are differenced out by the comparison across cohorts,
while changes across cohorts which affect different regions similarly are dif-
ferenced out by the comparison across regions. The triple difference adds the
advantage that cohort-varying differences across regions which affect boys
and girls similarly are differenced out by the comparison between girls and
boys. The exclusion restriction is only violated if a change with differential
impacts on relaxed and un-relaxed regions and on boys and girls occurs at
the same time the relaxation took effect. In other words, all else equal, the
2SLS estimate will be biased if a change occurred in relaxed counties for
girls born 1976 and after.
One possible source of bias arises from the variation in the intensity of
relaxation across regions. I find in the next section that the extent of the re-
laxation is strongly correlated with the extent of sex selection for One Child
Policy cohorts (1976-1982). This is consistent with official reports. The
correlation between sex-selection and relaxation can bias the 2SLS estimate
for two reasons. First, the determinants of sex-selection may also affect
education investment differentially for boys and girls. For example, Qian
(2004) shows that increasing male-to-female earnings increase boy-biased
sex-selection. She also shows that increasing male-to-female earnings has no
effect on education investment for boys but decreases education investment
for girls. This means that sex-selection is correlated with lower education
investment for girls and, alternatively, higher education investment for boys.
Consequently, the two stage least squares estimate will underestimate the
11
true effect of family size on education.2
Second, bias may arise because parents who choose to keep girls in the
1976-1982 cohort in relaxed counties may have different preferences from
parents who keep girls in counties without the relaxation. For example,
if parents who decide to keep girls in relaxed counties also value education
more than parents who keep girls in non-relaxed counties, the 2SLS estimate
will overestimate the true effect of family size on school enrollment.
To address the problem of sample selection, I construct an alternative
sample where the "extra" boys from relaxed counties in the actual sample
are taken out and replaced with girls so that for each cohort, the sex ratio is
equivalent between counties with some relaxation and counties without any
relaxation. In addition, I bias the 2SLS downwards by removing only boys
who are not enrolled in school and adding girls who are not in enrolled in
school. This increases the average enrollment rate for boys born 1976-1982
in counties with the relaxation, and decreases average enrollment rate for
girls in counties with the relaxation. 2SLS using this "stacked" sample will
underestimate the true effect of family size on school enrollment. Thus, using
the actual sample and the constructed sample, I will be able to estimate the
upper and lower bounds of the true effect.
4.2 The Effect of the 1-Son-2-Child Relaxation
4.2.1 Effect on Family Size
One benefit of this policy experiment is that it is possible to check whether
the policy was enforced correctly by estimating the effect of the policy on
family size for boys and girls separately. If the policy was correctly enforced,
it should increase the number of siblings for girls born 1976 and after and
have no effect on boys. The following equation separately estimates the effect
of the relaxation on family size for boys and girls born during 1972-1981.
2The CHNS does not have accruate data on individual income within the householdsince much of rural production is conducted at the household level and the income cannotbe accurately assigned to individual members. Consequently, I cannot directly examinethe role of relative earnings in the experiment.
12
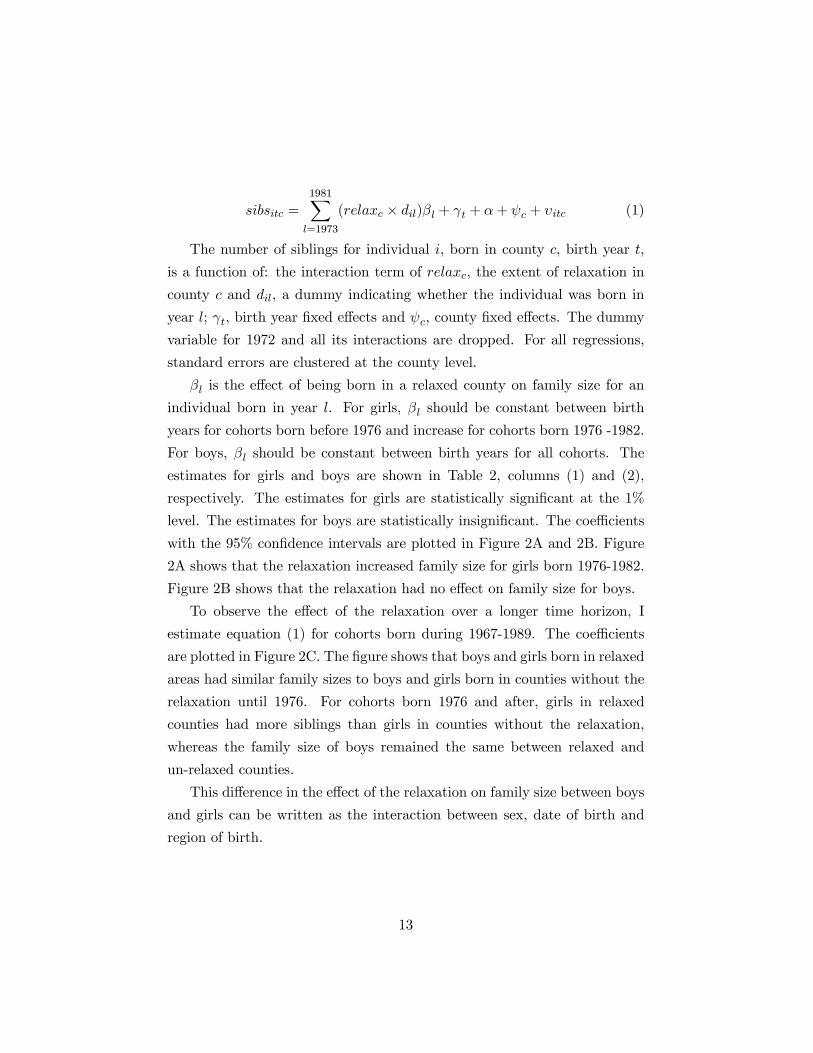
sibsitc =1981Xl=1973
(relaxc × dil)βl + γt + α+ ψc + υitc (1)
The number of siblings for individual i, born in county c, birth year t,
is a function of: the interaction term of relaxc, the extent of relaxation in
county c and dil, a dummy indicating whether the individual was born in
year l; γt, birth year fixed effects and ψc, county fixed effects. The dummy
variable for 1972 and all its interactions are dropped. For all regressions,
standard errors are clustered at the county level.
βl is the effect of being born in a relaxed county on family size for an
individual born in year l. For girls, βl should be constant between birth
years for cohorts born before 1976 and increase for cohorts born 1976 -1982.
For boys, βl should be constant between birth years for all cohorts. The
estimates for girls and boys are shown in Table 2, columns (1) and (2),
respectively. The estimates for girls are statistically significant at the 1%
level. The estimates for boys are statistically insignificant. The coefficients
with the 95% confidence intervals are plotted in Figure 2A and 2B. Figure
2A shows that the relaxation increased family size for girls born 1976-1982.
Figure 2B shows that the relaxation had no effect on family size for boys.
To observe the effect of the relaxation over a longer time horizon, I
estimate equation (1) for cohorts born during 1967-1989. The coefficients
are plotted in Figure 2C. The figure shows that boys and girls born in relaxed
areas had similar family sizes to boys and girls born in counties without the
relaxation until 1976. For cohorts born 1976 and after, girls in relaxed
counties had more siblings than girls in counties without the relaxation,
whereas the family size of boys remained the same between relaxed and
un-relaxed counties.
This difference in the effect of the relaxation on family size between boys
and girls can be written as the interaction between sex, date of birth and
region of birth.
13
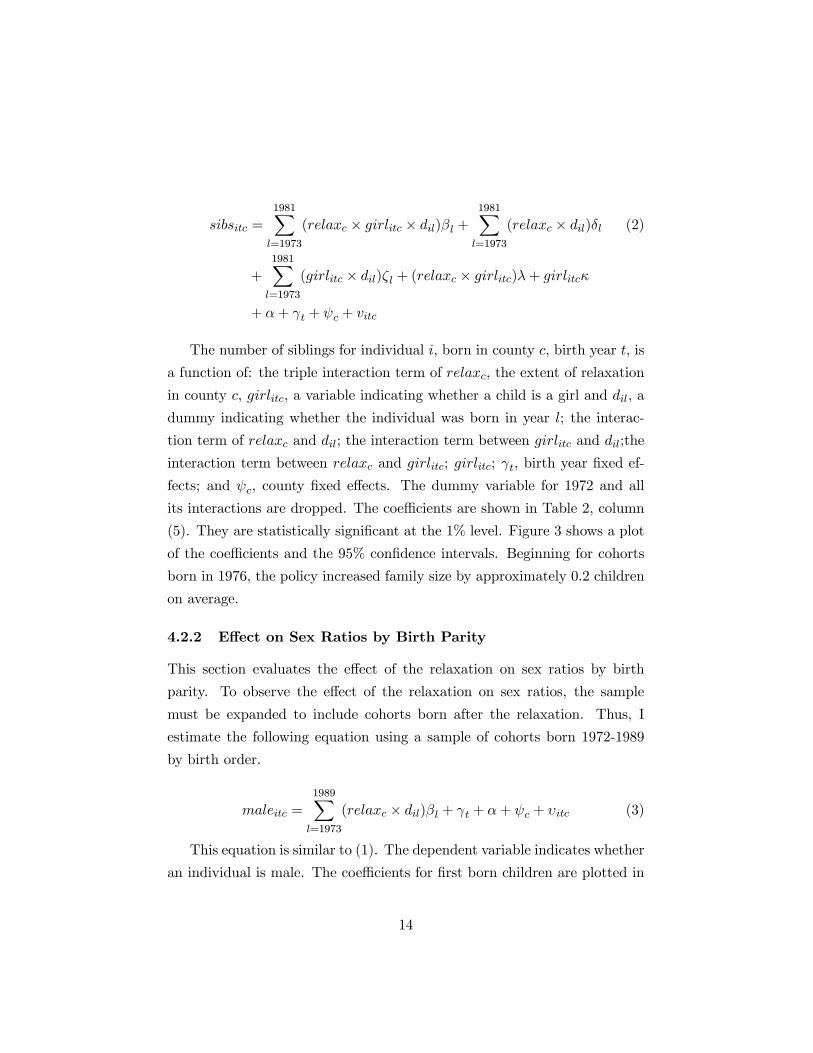
sibsitc =1981Xl=1973
(relaxc × girlitc × dil)βl +1981Xl=1973
(relaxc × dil)δl (2)
+1981Xl=1973
(girlitc × dil)ζ l + (relaxc × girlitc)λ+ girlitcκ
+ α+ γt + ψc + vitc
The number of siblings for individual i, born in county c, birth year t, is
a function of: the triple interaction term of relaxc, the extent of relaxation
in county c, girlitc, a variable indicating whether a child is a girl and dil, a
dummy indicating whether the individual was born in year l; the interac-
tion term of relaxc and dil; the interaction term between girlitc and dil;the
interaction term between relaxc and girlitc; girlitc; γt, birth year fixed ef-
fects; and ψc, county fixed effects. The dummy variable for 1972 and all
its interactions are dropped. The coefficients are shown in Table 2, column
(5). They are statistically significant at the 1% level. Figure 3 shows a plot
of the coefficients and the 95% confidence intervals. Beginning for cohorts
born in 1976, the policy increased family size by approximately 0.2 children
on average.
4.2.2 Effect on Sex Ratios by Birth Parity
This section evaluates the effect of the relaxation on sex ratios by birth
parity. To observe the effect of the relaxation on sex ratios, the sample
must be expanded to include cohorts born after the relaxation. Thus, I
estimate the following equation using a sample of cohorts born 1972-1989
by birth order.
maleitc =1989Xl=1973
(relaxc × dil)βl + γt + α+ ψc + υitc (3)
This equation is similar to (1). The dependent variable indicates whether
an individual is male. The coefficients for first born children are plotted in
14
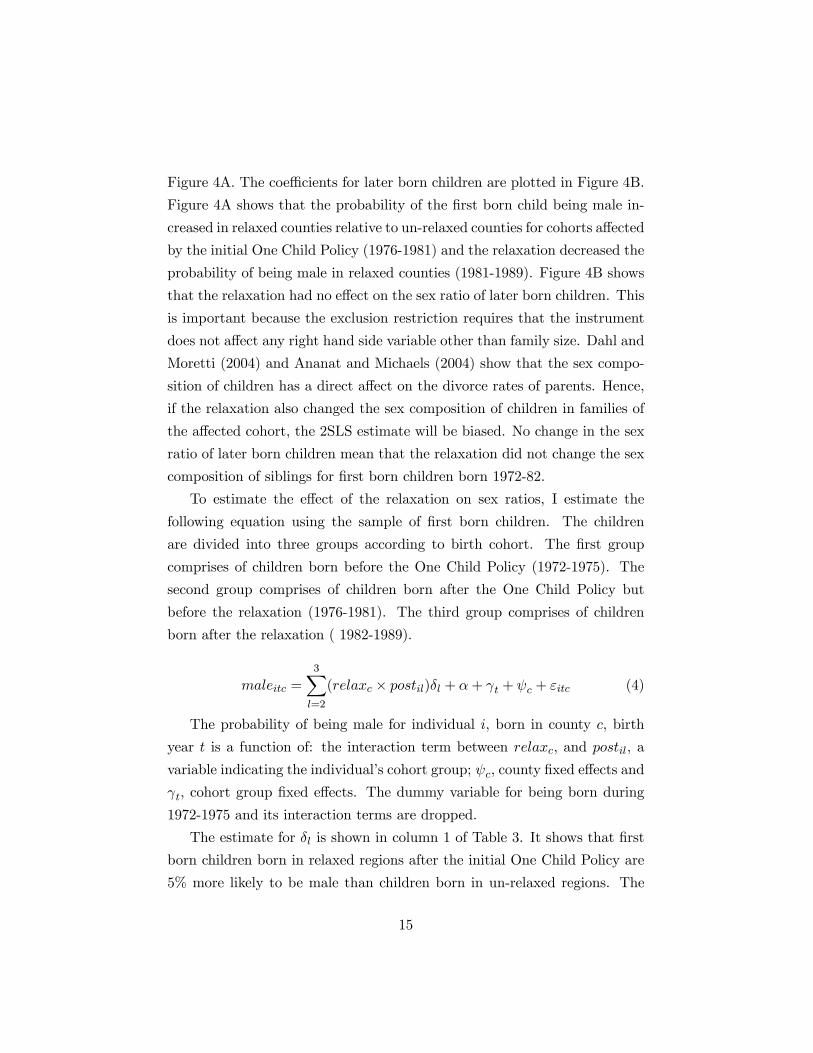
Figure 4A. The coefficients for later born children are plotted in Figure 4B.
Figure 4A shows that the probability of the first born child being male in-
creased in relaxed counties relative to un-relaxed counties for cohorts affected
by the initial One Child Policy (1976-1981) and the relaxation decreased the
probability of being male in relaxed counties (1981-1989). Figure 4B shows
that the relaxation had no effect on the sex ratio of later born children. This
is important because the exclusion restriction requires that the instrument
does not affect any right hand side variable other than family size. Dahl and
Moretti (2004) and Ananat and Michaels (2004) show that the sex compo-
sition of children has a direct affect on the divorce rates of parents. Hence,
if the relaxation also changed the sex composition of children in families of
the affected cohort, the 2SLS estimate will be biased. No change in the sex
ratio of later born children mean that the relaxation did not change the sex
composition of siblings for first born children born 1972-82.
To estimate the effect of the relaxation on sex ratios, I estimate the
following equation using the sample of first born children. The children
are divided into three groups according to birth cohort. The first group
comprises of children born before the One Child Policy (1972-1975). The
second group comprises of children born after the One Child Policy but
before the relaxation (1976-1981). The third group comprises of children
born after the relaxation ( 1982-1989).
maleitc =3Xl=2
(relaxc × postil)δl + α+ γt + ψc + εitc (4)
The probability of being male for individual i, born in county c, birth
year t is a function of: the interaction term between relaxc, and postil, a
variable indicating the individual’s cohort group; ψc, county fixed effects and
γt, cohort group fixed effects. The dummy variable for being born during
1972-1975 and its interaction terms are dropped.
The estimate for δl is shown in column 1 of Table 3. It shows that first
born children born in relaxed regions after the initial One Child Policy are
5% more likely to be male than children born in un-relaxed regions. The
15
estimate is statistically significant at the 5% level. After the relaxation,
first born children born in relaxed areas are only 2% more likely to be male
than children born in areas without the relaxation. The estimate is not
statistically significant.
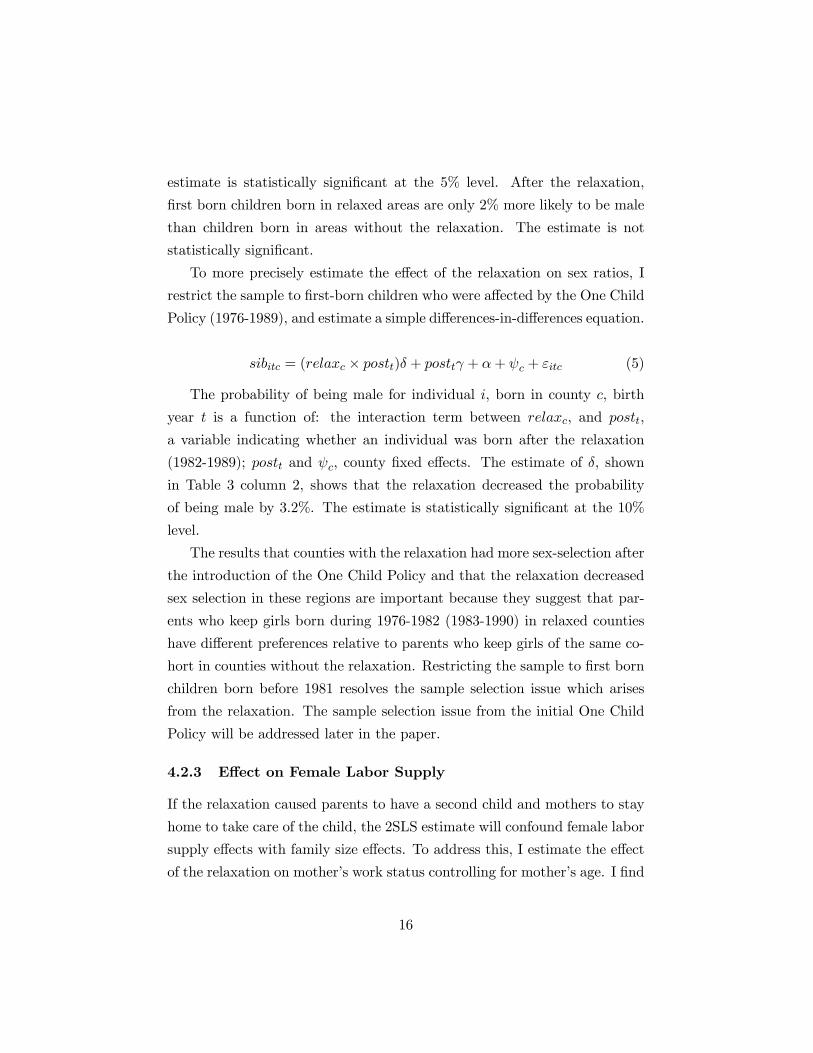
To more precisely estimate the effect of the relaxation on sex ratios, I
restrict the sample to first-born children who were affected by the One Child
Policy (1976-1989), and estimate a simple differences-in-differences equation.
sibitc = (relaxc × postt)δ + posttγ + α+ ψc + εitc (5)
The probability of being male for individual i, born in county c, birth
year t is a function of: the interaction term between relaxc, and postt,
a variable indicating whether an individual was born after the relaxation
(1982-1989); postt and ψc, county fixed effects. The estimate of δ, shown
in Table 3 column 2, shows that the relaxation decreased the probability
of being male by 3.2%. The estimate is statistically significant at the 10%
level.
The results that counties with the relaxation had more sex-selection after
the introduction of the One Child Policy and that the relaxation decreased
sex selection in these regions are important because they suggest that par-
ents who keep girls born during 1976-1982 (1983-1990) in relaxed counties
have different preferences relative to parents who keep girls of the same co-
hort in counties without the relaxation. Restricting the sample to first born
children born before 1981 resolves the sample selection issue which arises
from the relaxation. The sample selection issue from the initial One Child
Policy will be addressed later in the paper.
4.2.3 Effect on Female Labor Supply
If the relaxation caused parents to have a second child and mothers to stay
home to take care of the child, the 2SLS estimate will confound female labor
supply effects with family size effects. To address this, I estimate the effect
of the relaxation on mother’s work status controlling for mother’s age. I find
16
that mothers of affected girls were less likely to stay at home.
4.3 The Effect of Family Size on School Enrollment
4.3.1 Reduced Form Estimates
To illustrate the identification strategy, I will first estimate the effect of
the relaxation on enrollment separately for boys and girls. This can be
characterized by the following equation.
enrollitc =1981Xl=1973
(relaxc × dil)βl + α+ γt + ψc + υitc (6)
The dummy variable for 1972 and all its interactions are dropped. The
coefficients for girls and boys are shown in Table 2, columns (3) and (4), re-
spectively. They are plotted in Figure 6 with the first stage estimates from
equation (2). The figure illustrates several key points. First, the relaxation
has no effect on enrollment for children born after 1978. This is consistent
with the fact that China has compulsory primary education. Hence, the
analysis of the effect of family size on school enrollment in the following sec-
tion is restricted to the sample of children born 1972-1978. This is indicated
by the vertical dotted line. Second, the plot of the first stage shows that the
relaxation affected the family size of cohorts born 1976-1978. This is indi-
cated by the solid vertical line. The two vertical lines captures the cohort
that was both affected by the relaxation and were beyond compulsory edu-
cation in 1990. The cohort to the left of the solid line is the pre-treatment
cohort that was not affected by the relaxation. The plot of the reduced form
shows that for the affected cohort, girls have higher education enrollment
than boys. Conversely, for the pre-treatment cohort, girls had lower school
enrollment rates than boys.
The reduced form estimates also show that relative to areas without the
relaxation, enrollment for both boys and girls decreases after primary school.
This is consistent with the hypothesis that school quality in relaxed regions
relative to regions without the relaxation declined during this period. This
17
is controlled for by comparing the effect of the relaxation on enrollment for
boys with the effect of the relaxation on enrollment for girls, which can be
characterized by an equation similar to equation (2) with school enrollment
as the dependent variable. The coefficients are shown in Table 2, column
(6).
4.3.2 OLS
Because of compulsory primary enrollment, the OLS and 2SLS analysis uses
the sample of first born children born 1972-1978. These children are 12-18
years old in 1990. The average enrollment rate for this sample is 70% . The
correlation between school enrollment and family size can be obtained by
estimating the following equation for the sample of first born children born
during 1972-1978.
enrollitc = sibsitcb+1978Xl=1973
(relaxc × dil)cl +1978Xl=1973
(girli × dil)dl (7)
+(relaxc × girlitc)g + girlitck + α+ γt + ψc + εitc
School enrollment for individual i, born in county c, birth year t, is a
function of: sibitc, the number siblings he or she has; the interaction term of
relaxc and dil; the interaction term between girlitc and dil;the interaction
term between relaxc and girli; girlitc; γt, birth year fixed effects; and ψc,
county fixed effects. The dummy variable for 1972 and all its interactions
are dropped. The estimate, shown in Table 4, column (1) shows that on
average, one additional sibling is correlated with 0.8% less enrollment. The
estimate is not statistically significant.
4.3.3 Two Stage Least Squares
The first stage equation is similar to equation (2). To increase the precision
of the estimate, I collapse the unaffected cohorts into one reference group.
Consequently, for the following equation: l = 1 if an individual is born
18
during 1972-1975, 2 if he/she is born in 1976, 3 if he/she is born in 1977
and 4 if he/she is born in 1978.
sibsitc =4Xl=1
(relaxc × girli × dil)βl +4Xl=1
(relaxc × dil)δl + (8)
4Xl=1
(girli × dil)ζ l + (relaxc × girli)λ+X0ictκ+ α+ γt + ψc + vitc
The 2SLS estimate in Table 4, column (2) shows that contrary to the OLS
estimate, an additional sibling increases school enrollment by 17.4%. The
estimate is statistically significant at the 5% level. I repeat the estimation
for the alternative constructed sample to estimate the lower bound effect of
family size on school enrollment. The result is shown in Table 4, column
(3). It shows that one additional sibling increases school enrollment of the
first born child by 8.5%. The estimate is not statistically significant.
5 Conclusion
This paper has two purposes. It evaluates the effects of the One Child
Policy and the subsequent 1-son-2-child relaxation. Then, it uses exogenous
variation in family size caused by this relaxation to evaluate the causal effect
of family size on school enrollment.
The One Child Policy is one of the most large scale and internationally
controversial policies undertaken by the current Chinese government. It
reportedly increased female infanticide and led to a generation of "spoiled
children". However, the common misunderstanding that the One Child
Policy is uniformly enforced across China and the lack of local enforcement
data has, until recently, prevented researchers from measuring the causal
effects of China’s family planning policies. The lack of transparency in the
policy enforcement decision process added to the difficulty of such studies.
This paper uses local enforcement data of the 1-son-2-child relaxation to
evaluate the effects of the relaxation and the One Child Policy on sex ratio
19
and family size. It showed that although the One Child Policy was enacted
in 1978-1980, previous family planning laws which encouraged birth spacing
meant that the former was actually binding for cohorts born as early as 1976.
The results also indicate that actual policy implementation was consistent
with the official goals of decreasing female infanticide. The 1-son-2-child
relaxation was indeed implemented in regions where sex selection was more
severe after the initial One Child Policy. The relaxation was only partially
successful. It decreased sex selection from post One Child Policy levels.
But sex ratios in these regions did not return to their initial pre-One Child
Policy levels. Finally, I showed that the relaxation significantly increased
the family size of girls born in relaxed regions who were affected by the
initial One Child Policy.
This exogenous increase in family size is then used to evaluate the causal
effect of family size on school enrollment. Contrary to previous findings,
the results show that school enrollment for girls from one-child households
increases by 8.5-17% when parents have an additional child. This is in-
consistent with the quantity quality model which predicts that quality is
monotonically decreasing with quantity. However, it does not reject the
assumption that children compete for resources within the household.
In this framework, children compete for both tangible and intangible
resources such as parental attention. An additional sibling reduces each
child’s share of household resources. If the first child views the new sibling
as competition which threatens her position at home, she may behave badly,
which could increase parents’ desire to send her to school away from the
younger child. Simultaneously, being at school may have an added attraction
relative to being at home for the first child when she gains a sibling, as a
place where her position is not affected by the birth of the latter. In addition,
the first child may be more motivated to attend school because she feels that
academic distinction will increase her stature in the household relative to
the younger child.
Family size can also have a positive effect on school enrollment if other
children are complements in each child’s production function. There may
20
be economies of scale to educating children. For example, text books and
clothes are fixed costs for sending children to school. Once purchased for
the first child, it is costless for the second child to reuse the same books and
clothes. There may also be psychological economies of scale in education,
where children are more enthusiastic about attending school if other children
in the household are in school. Consequently, parents will want their first
child in school more because they know it decreases the "cost" of sending
the younger child to school. Alternatively, psychologists Zajonc and Gregory
(1982) hypothesized that children benefitted from teaching younger children.
Hence, although having larger family size decreases the quality of children
by decreasing their share of household resources, the youngest child and the
only child are disadvantaged.
It is important to note that in China, there is no schooling beyond high
school in rural areas. Universities are highly concentrated in the largest
cities. In fact, rural students with academic potential generally leave their
homes during high school, or even middle school to attend better quality
schools in urban areas.3 The lack of economic opportunities in rural ar-
eas mean that children will not return home after graduating from college.
Knowing this, parents who desire to keep at least one child near them, will
not encourage their only child to purse higher education. Consequently,
when they have a second child, they will be more willing to have the first
child attain more schooling. The latter will be reflected in lower drop out
rates for the first child. Like the hypothesis proposed by Zajonc and Gregory
(1982), this explanation implies that family size effects may be different for
the children of different birth order.
The empirical findings of this paper show that having a second child
increases the school enrollment rates of the first child. The policy impli-
cations are clear. While limiting family size may increase human capital
investment for developing countries, one is not the optimal number of chil-
dren per household. More research on the subject is needed to evaluate
3 In China, many public schools, especially academically elite schools, have boardingstudents.
21

the family size effect beyond the one-child context and for determining the
underlying factors of the family size effect.
.
22
References
[1] Ananat, Elizabeth O. and Michaels, Guy "The effect of marital breakup
on the income and poverty of children." MIT Working Paper, 2004.
[2] Angrist, Joshua D. and Evans, Williams N. "Children and their parents’
labor supply: Evidence from exogenous variation in family size." The
American Economic Review, 88(3), Jun. 1998, pp. 450-477.
[3] Banister, J. (1987) China’s changing population. Stanford, California.,
Stanford University Press.
[4] Becker, Gary S. and Lewis, H. Gregg "On the interaction between the
quantity and quality of children." The Journal of Political Economy,
81(2) Part 2, Mar.-Apr. 1973, pp. S279-S288.
[5] Becker, Gary S. and Tomes, Nigel "Child endowments and the quantity
and quality of children." The Journal of Political Economy, 84(4) Part
2, Aug. 1976, pp. S143-S162.
[6] Berhman, Jeremy; Pollak, Robert A. and Paul Taubman "Family re-
sources, family size and access to financing for education." The Journal
of Political Economy, 97(2), Apr. 1989, pp. 389-419.
[7] Behrman, Jere R. and Taubman, Paul "Birth Order, schooling, and
earnings." Journal of Labor Economics, 4(3) Part 2, Jul. 1986, pp.
S121-S145.
[8] Black, Sandra E.; Devereux, Paul J. and Kjell G. Salvanes "The more
the merrier? The effect of family composition on children’s education."
NBER, Working Paper 10720.
[9] Blake, Judith "Family size and the quality of children." Demography,
18, pp. 421-442.
[10] Brown, Phil and Park, Albert "Education and poverty in rural China."
The Economics of Education Review, Forthcoming.
23
[11] Conley, Dalton "What is the "true" effect of sibship size and birth
order on education? Instrumental variable estimates from exogenous
variation in fertility." New York University, Working Paper.
[12] Croll, E., D. Davin, et. al., Eds. (1985). China’s One Child Family
Policy. London, Macmillan.
[13] Dahl, Gordon and Moretti, Enrico "The demand for sons: evidence
from divorce, fertility, and shotgun marriage." NBER, Working Paper
10281, 2004.
[14] Duflo, Esther "Evaluating the effect of birth-spacing on child mortal-
ity." MIT, Mimeo.
[15] Gomes, Melba "Family size and education attainment in China." Pop-
ulation and Development Review, 10(4), pp. 647-660.
[16] Goux, Dominique, and Maurin, Eric "The effects of overcrowded hous-
ing on children’s performance at school." CEPR Discussion Paper No.
3818.
[17] Greenlaugh, S. (1986). “Shifts in China’s population policy, 1984-1986:
Views from the central, provincial, and local Levels.” Population and
Development Review, 12(3): 493-515.
[18] Guo, Guang and VanWey, Leah K. "Sibship size and intellectual de-
velopment: Is the relationship causal?" American Sociological Review,
64(2), Apr. 1999, pp. 169-187.
[19] Hanushek, Eric "The tradeoff between child quantity and quality." The
Journal of Political Economy, 100(1), Feb. 1992, pp. 84-117.
[20] Iacavou, Maria "Family composition and children’s educational out-
comes." Institute for Social and Economic Research, Working Paper,
2001.
24
[21] Kaufman, J., Z. Shang, et. al. (1989). “Family planning policy and
practice in China: A Study of four rural counties.” Population and
Development Review. 15(4): 707-729.
[22] Kessler, Daniel "Birth order, family size and achievement: Family struc-
ture and wage determination." Journal of Labor Economics, 9(4), Oct.
1991, pp. 413-426.
[23] Lee, Jungmin "Sibling size and investment in children’s education: An
Asian instrument." University of Arkansas at Fayetteville, Working Pa-
per, 2004.
[24] Hannum, Emily and Park, Albert "Educating china’s rural children in
the 21st Century." Mimeo.
[25] Qian, Nancy "Missing women and the price of tea in China: The effect
of income on sex imbalance." MIT, Working Paper, 2004.
[26] Rosenzweig, Mark R. and Wolpin, Kenneth I. "Testing the quantity-
quality fertility model: The use of twins as a natural experiment."
Econometrica, January 1980, 48 (1), pp.227-240.
[27] Rosenzweig, Mark R. and Schultz, T. Paul "Fertility and investments
in human capital: Estimates of the consequence of imperfect fertility
control in Malaysia." Journal of Econometrics, 1987, 36, pp. 163-184.
[28] Stafford, Frank P. "Women’s work, sibling competition and children’s
school performance." The American Economic Review, 77(5), Dec.
1987, pp. 972-980.
[29] White, T. (1992) “Birth planning between plan and market: The im-
pact of reform on China’s One-Child Policy”, China’s Economic Dilem-
mas in the 1990’s: The Problems of Reforms, Modernization, and Inter-
dependence.. Studies in Contemporary China. Armonk, N.Y.U.S.C.J.E.
Committee and London, Sharpe: 252-69.
25
[30] Zajonc, Robert B. and Markus, Gregory B. "Birth order and intellectual
development." Psychological Review, 1982, pp. 74-43.
[31] Zeng, Yi. (1989) “Is the Chinese family planning program “tightening
up?” Population and Development Review, 15(2): 333-37.
26
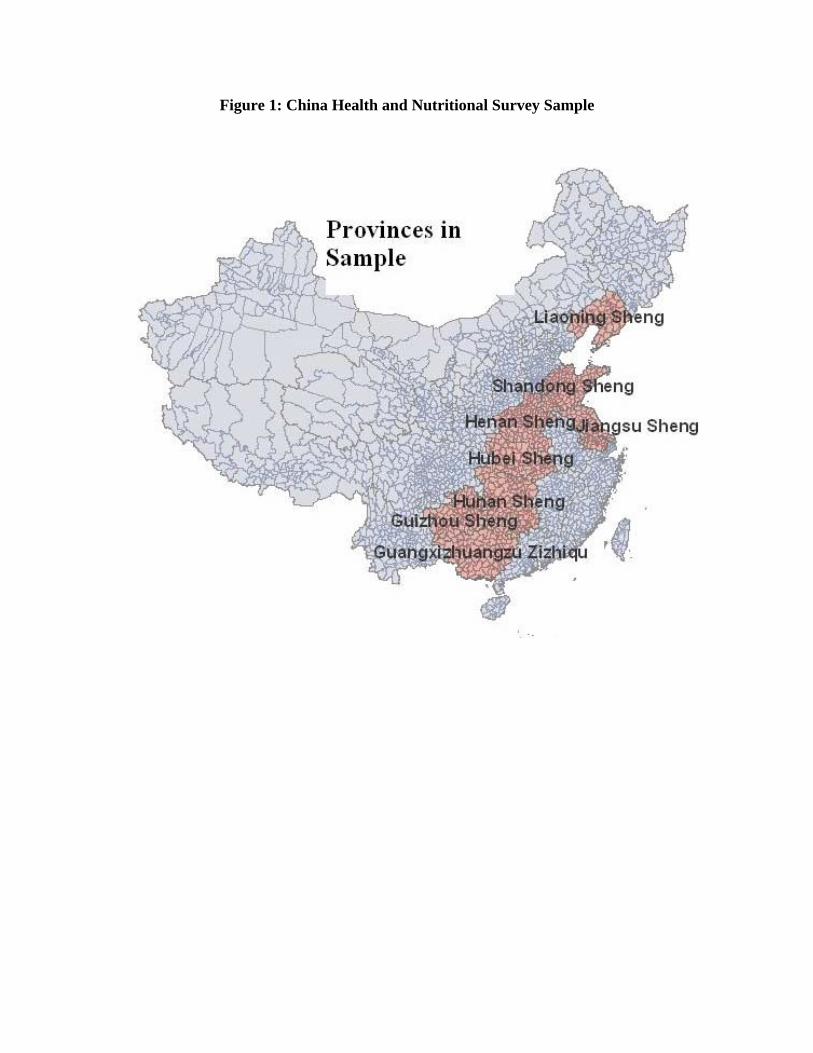
Figure 1: China Health and Nutritional Survey Sample
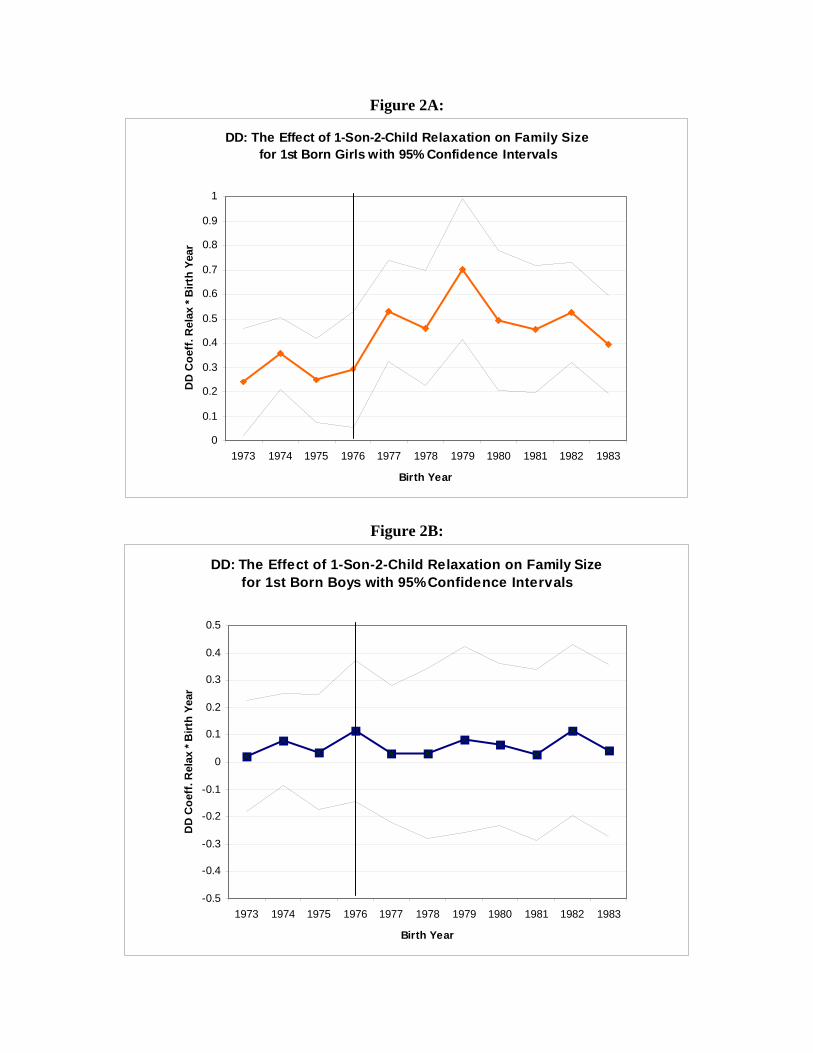
Figure 2A:
DD: The Effect of 1-Son-2-Child Relaxation on Family Sizefor 1st Born Girls with 95% Confidence Intervals
0
0.1
0.2
0.3
0.4
0.5
0.6
0.7
0.8
0.9
1
1973 1974 1975 1976 1977 1978 1979 1980 1981 1982 1983
Birth Year
DD
Coe
ff. R
elax
* B
irth
Year
Figure 2B:
DD: The Effect of 1-Son-2-Child Relaxation on Family Sizefor 1st Born Boys with 95% Confidence Intervals
-0.5
-0.4
-0.3
-0.2
-0.1
0
0.1
0.2
0.3
0.4
0.5
1973 1974 1975 1976 1977 1978 1979 1980 1981 1982 1983
Birth Year
DD
Coe
ff. R
elax
* B
irth
Year
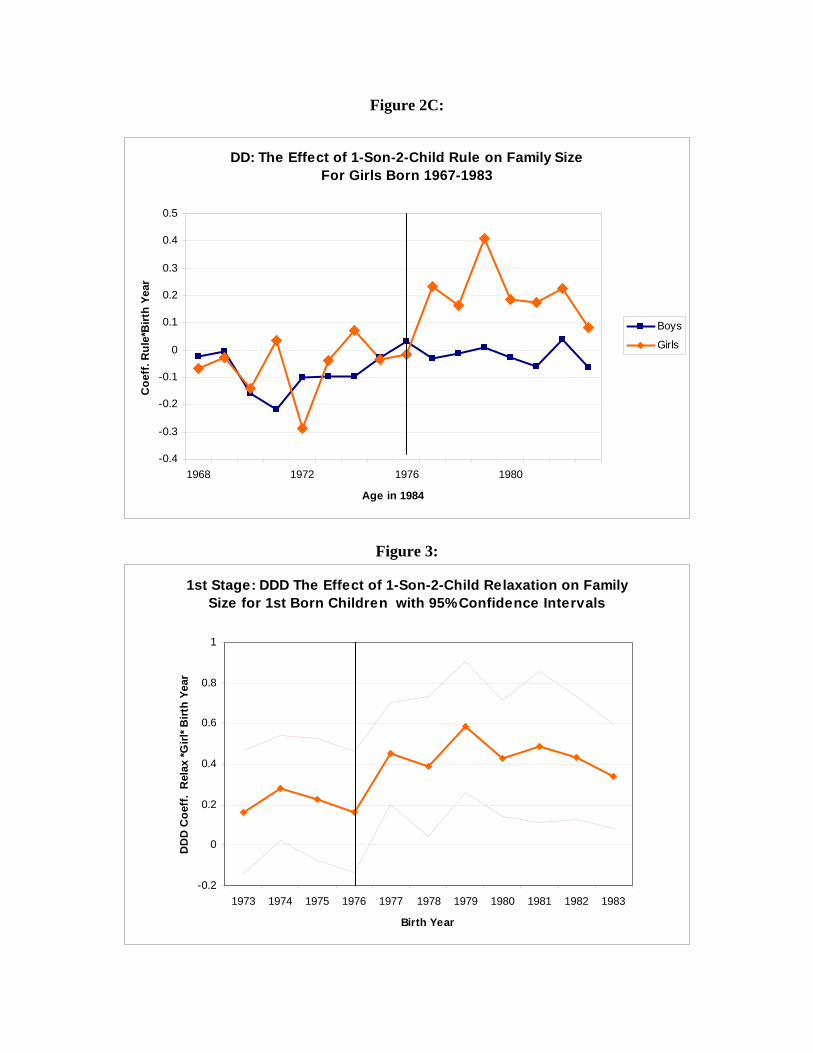
Figure 2C:
DD: The Effect of 1-Son-2-Child Rule on Family SizeFor Girls Born 1967-1983
-0.4
-0.3
-0.2
-0.1
0
0.1
0.2
0.3
0.4
0.5
1968 1972 1976 1980
Age in 1984
Coe
ff. R
ule*
Birt
h Ye
ar
Boys
Girls
Figure 3:
1st Stage: DDD The Effect of 1-Son-2-Child Relaxation on Family Size for 1st Born Children with 95% Confidence Intervals
-0.2
0
0.2
0.4
0.6
0.8
1
1973 1974 1975 1976 1977 1978 1979 1980 1981 1982 1983
Birth Year
DD
D C
oeff
. R
elax
*Girl
* Birt
h Ye
ar
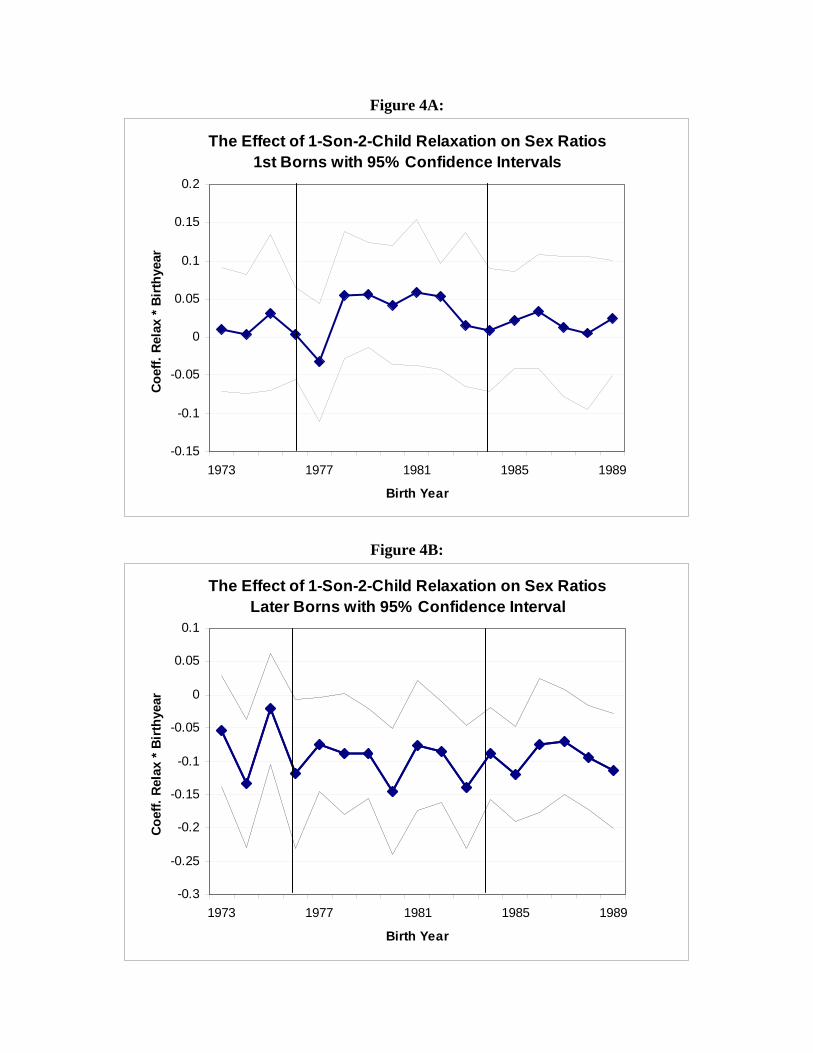
Figure 4A:
The Effect of 1-Son-2-Child Relaxation on Sex Ratios1st Borns with 95% Confidence Intervals
-0.15
-0.1
-0.05
0
0.05
0.1
0.15
0.2
1973 1977 1981 1985 1989
Birth Year
Coef
f. Re
lax
* Birt
hyea
r
Figure 4B:
The Effect of 1-Son-2-Child Relaxation on Sex RatiosLater Borns with 95% Confidence Interval
-0.3
-0.25
-0.2
-0.15
-0.1
-0.05
0
0.05
0.1
1973 1977 1981 1985 1989
Birth Year
Coef
f. R
elax
* B
irth
year
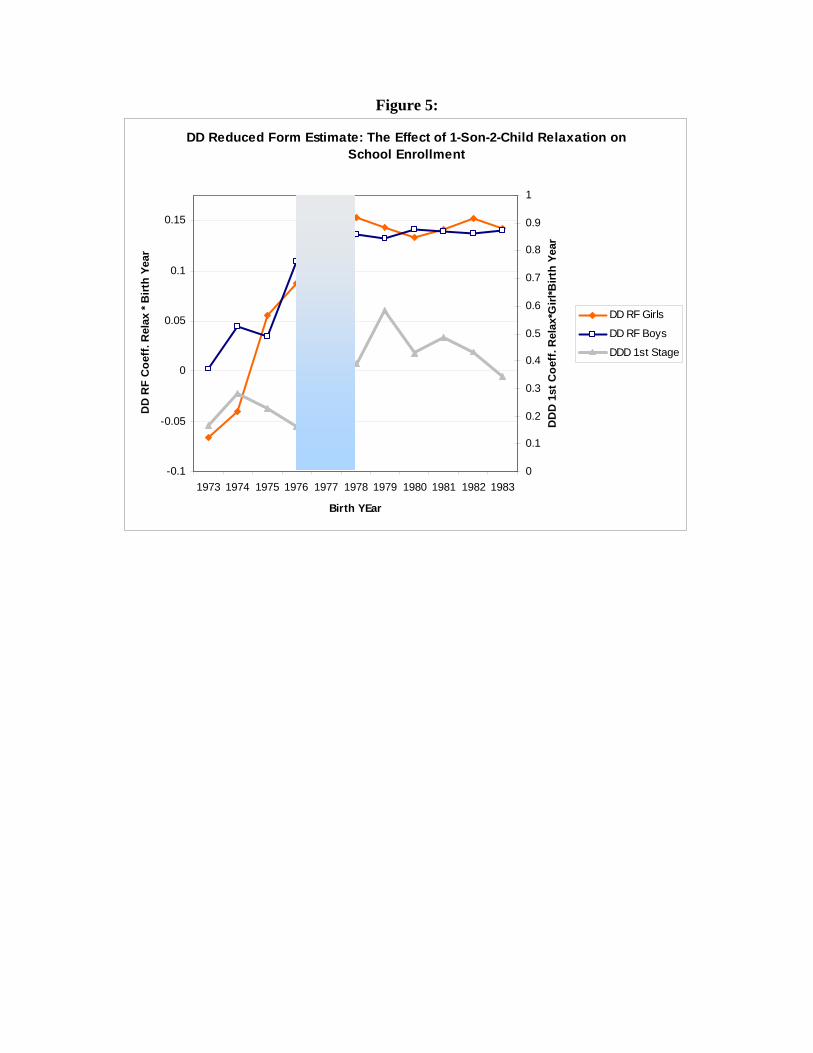
Figure 5:
DD Reduced Form Estimate: The Effect of 1-Son-2-Child Relaxation on School Enrollment
-0.1
-0.05
0
0.05
0.1
0.15
1973 1974 1975 1976 1977 1978 1979 1980 1981 1982 1983
Birth YEar
DD
RF
Coe
ff. R
elax
* B
irth
Year
0
0.1
0.2
0.3
0.4
0.5
0.6
0.7
0.8
0.9
1
DD
D 1
st C
oeff
. Rel
ax*G
irl*B
irth
Year
DD RF Girls
DD RF Boys
DDD 1st Stage
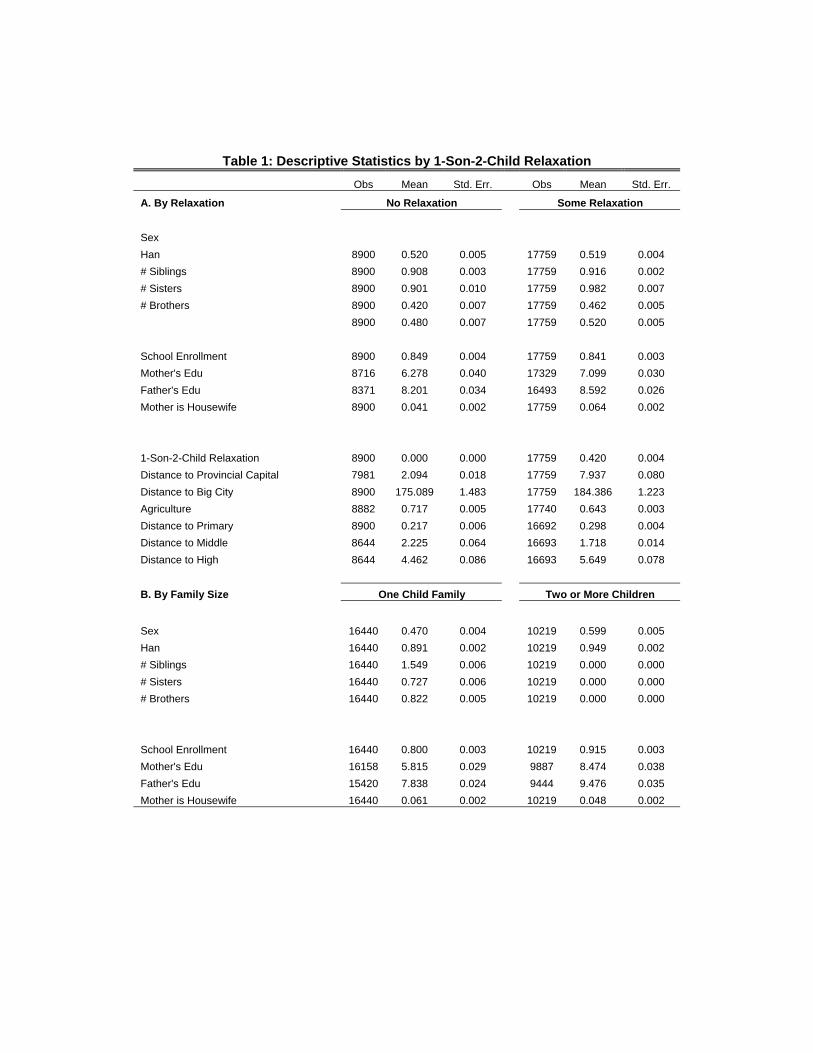
Table 1: Descriptive Statistics by 1-Son-2-Child Relaxation Obs Mean Std. Err. Obs Mean Std. Err.
A. By Relaxation No Relaxation Some Relaxation Sex Han 8900 0.520 0.005 17759 0.519 0.004 # Siblings 8900 0.908 0.003 17759 0.916 0.002 # Sisters 8900 0.901 0.010 17759 0.982 0.007 # Brothers 8900 0.420 0.007 17759 0.462 0.005 8900 0.480 0.007 17759 0.520 0.005 School Enrollment 8900 0.849 0.004 17759 0.841 0.003 Mother's Edu 8716 6.278 0.040 17329 7.099 0.030 Father's Edu 8371 8.201 0.034 16493 8.592 0.026 Mother is Housewife 8900 0.041 0.002 17759 0.064 0.002 1-Son-2-Child Relaxation 8900 0.000 0.000 17759 0.420 0.004 Distance to Provincial Capital 7981 2.094 0.018 17759 7.937 0.080 Distance to Big City 8900 175.089 1.483 17759 184.386 1.223 Agriculture 8882 0.717 0.005 17740 0.643 0.003 Distance to Primary 8900 0.217 0.006 16692 0.298 0.004 Distance to Middle 8644 2.225 0.064 16693 1.718 0.014 Distance to High 8644 4.462 0.086 16693 5.649 0.078
B. By Family Size One Child Family Two or More Children
Sex 16440 0.470 0.004 10219 0.599 0.005 Han 16440 0.891 0.002 10219 0.949 0.002 # Siblings 16440 1.549 0.006 10219 0.000 0.000 # Sisters 16440 0.727 0.006 10219 0.000 0.000 # Brothers 16440 0.822 0.005 10219 0.000 0.000 School Enrollment 16440 0.800 0.003 10219 0.915 0.003 Mother's Edu 16158 5.815 0.029 9887 8.474 0.038 Father's Edu 15420 7.838 0.024 9444 9.476 0.035 Mother is Housewife 16440 0.061 0.002 10219 0.048 0.002
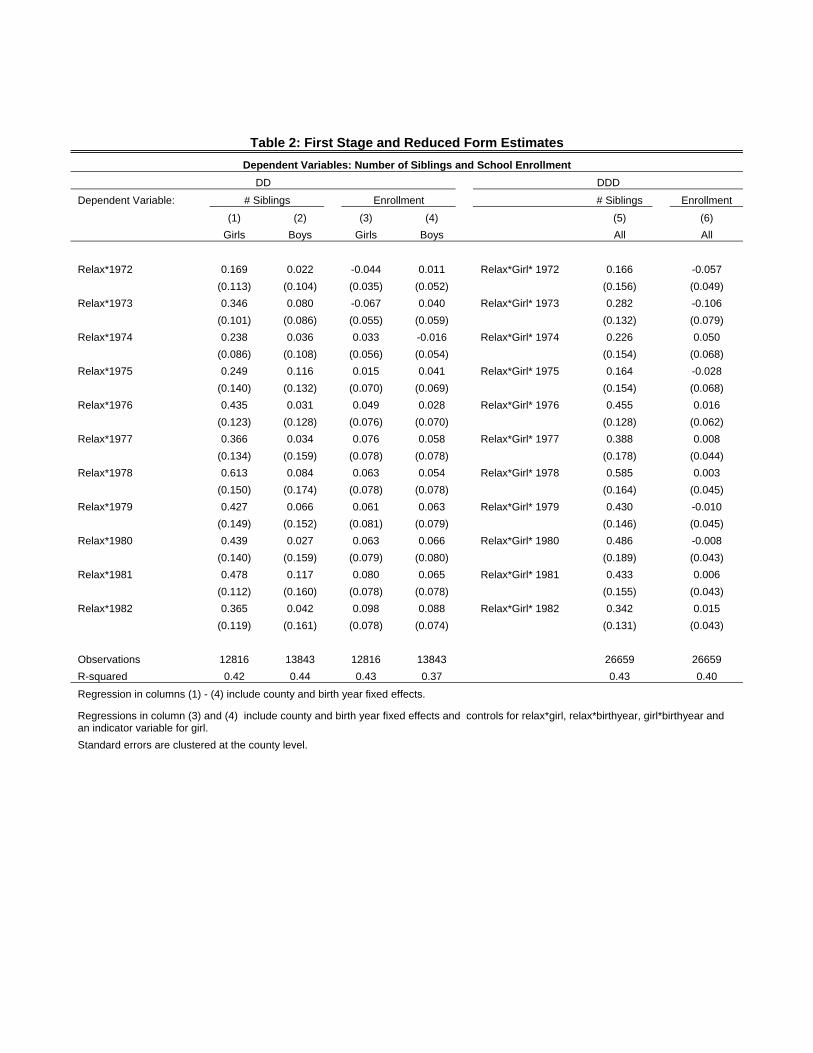
Table 2: First Stage and Reduced Form Estimates Dependent Variables: Number of Siblings and School Enrollment
DD DDD Dependent Variable: # Siblings Enrollment # Siblings Enrollment (1) (2) (3) (4) (5) (6) Girls Boys Girls Boys All All Relax*1972 0.169 0.022 -0.044 0.011 Relax*Girl* 1972 0.166 -0.057 (0.113) (0.104) (0.035) (0.052) (0.156) (0.049) Relax*1973 0.346 0.080 -0.067 0.040 Relax*Girl* 1973 0.282 -0.106 (0.101) (0.086) (0.055) (0.059) (0.132) (0.079) Relax*1974 0.238 0.036 0.033 -0.016 Relax*Girl* 1974 0.226 0.050 (0.086) (0.108) (0.056) (0.054) (0.154) (0.068) Relax*1975 0.249 0.116 0.015 0.041 Relax*Girl* 1975 0.164 -0.028 (0.140) (0.132) (0.070) (0.069) (0.154) (0.068) Relax*1976 0.435 0.031 0.049 0.028 Relax*Girl* 1976 0.455 0.016 (0.123) (0.128) (0.076) (0.070) (0.128) (0.062) Relax*1977 0.366 0.034 0.076 0.058 Relax*Girl* 1977 0.388 0.008 (0.134) (0.159) (0.078) (0.078) (0.178) (0.044) Relax*1978 0.613 0.084 0.063 0.054 Relax*Girl* 1978 0.585 0.003 (0.150) (0.174) (0.078) (0.078) (0.164) (0.045) Relax*1979 0.427 0.066 0.061 0.063 Relax*Girl* 1979 0.430 -0.010 (0.149) (0.152) (0.081) (0.079) (0.146) (0.045) Relax*1980 0.439 0.027 0.063 0.066 Relax*Girl* 1980 0.486 -0.008 (0.140) (0.159) (0.079) (0.080) (0.189) (0.043) Relax*1981 0.478 0.117 0.080 0.065 Relax*Girl* 1981 0.433 0.006 (0.112) (0.160) (0.078) (0.078) (0.155) (0.043) Relax*1982 0.365 0.042 0.098 0.088 Relax*Girl* 1982 0.342 0.015 (0.119) (0.161) (0.078) (0.074) (0.131) (0.043) Observations 12816 13843 12816 13843 26659 26659 R-squared 0.42 0.44 0.43 0.37 0.43 0.40
Regression in columns (1) - (4) include county and birth year fixed effects.
Regressions in column (3) and (4) include county and birth year fixed effects and controls for relax*girl, relax*birthyear, girl*birthyear and an indicator variable for girl. Standard errors are clustered at the county level.

Table 3: The Effect of 1-Son-2-Child Rule on Sex Ratios for 1st Born Children Dependent Variable: Dummy for Male
Sample Born 1972-1989 Sample Born 1976-1989 (1) (2) Relax * Born 1976-1983 0.032 (0.016) Relax * Born 1983-1990 0.007 -0.025 (0.016) (0.013) Constant 0.505 0.517 (0.008) (0.003) Observations 28627 20727 R-squared 0.00 0.00 All regressions include control for Han and county and birth year fixed effects. Standard errors clustered at the county level.
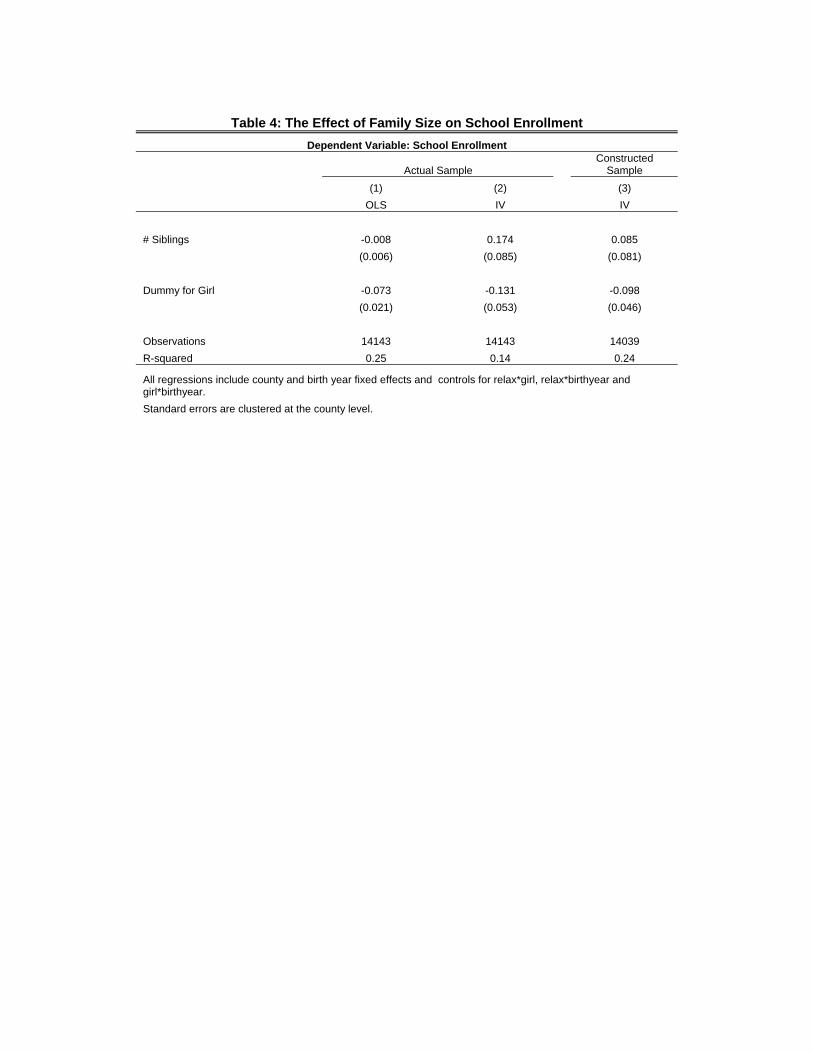
Table 4: The Effect of Family Size on School Enrollment
Dependent Variable: School Enrollment
Actual Sample Constructed
Sample
(1) (2) (3) OLS IV IV
# Siblings -0.008 0.174 0.085 (0.006) (0.085) (0.081) Dummy for Girl -0.073 -0.131 -0.098 (0.021) (0.053) (0.046) Observations 14143 14143 14039 R-squared 0.25 0.14 0.24
All regressions include county and birth year fixed effects and controls for relax*girl, relax*birthyear and girl*birthyear. Standard errors are clustered at the county level.