Embed Size (px)
Citation preview

RESEARCH ARTICLE
Quantitative X-ray measurements of high-pressure fuel spraysfrom a production heavy duty diesel injector
A. I. Ramırez Æ S. Som Æ Suresh K. Aggarwal ÆA. L. Kastengren Æ E. M. El-Hannouny ÆD. E. Longman Æ C. F. Powell
Received: 15 August 2008 / Revised: 5 March 2009 / Accepted: 9 March 2009 / Published online: 25 March 2009
� Springer-Verlag 2009
Abstract A quantitative and time-resolved X-ray radi-
ography technique has been used for detailed measure-
ments of high-pressure fuel sprays in the near-nozzle
region of a diesel engine injector. The technique provides
high spatial and temporal resolution, especially in the rel-
atively dense core region. A single spray plume from a
hydraulically actuated electronically controlled unit injec-
tor model 315B injector with a 6-hole nozzle was isolated
and studied at engine-like densities for two different
injection pressures. Optical spray imaging was also
employed to evaluate the effectiveness of the shield used to
isolate a single spray plume. The steady state fuel distri-
butions for both injection pressures are similar and show a
dense spray region along the axis of the spray, with the on-
axis spray density decreasing as the spray progresses
downstream. The higher injection pressure case exhibits a
larger cone angle and spray broadening at the exit of the
nozzle. For some time periods, the near-nozzle penetration
speed is lower for the high injection pressure case than the
low injection pressure case, which is unexpected, but can
be attributed to the needle and flow dynamics inside the
injector causing slower pressure build-up for the former
case. Rate of injection testing was performed to further
understand near-nozzle behavior. Mass distribution data
were obtained and used to find mass-averaged velocity of
the spray. Comparisons of the radiography data with that
from a common rail single-hole light duty injectors under
similar injection conditions show several significant dif-
ferences. The current data show a larger cone angle and
lower penetration speed than that from the light-duty
injector. Moreover, these data display a Gaussian mass
distribution across the spray near the injector, whereas in
previous light-duty injector measurements, the mass dis-
tribution had steeper sides and a flatter peak. Measurements
are also used to examine the spray models in the STAR-CD
software.
1 Introduction
Diesel engines have been the preferred power train for
heavy-duty applications, especially in trucks, due to their
high efficiency and high power density. During the last
decade, the innovation in high-pressure direct injection
combined with turbo-charging techniques has revolution-
ized the diesel engine technology. Despite these advances,
heavy-duty diesel engines intrinsically generate high soot
and NOx emission, which need to be reduced in order to
fulfill the emission legislations worldwide. Fuel injection
characteristics, in particular the atomization and penetra-
tion of the fuel, are known to affect NOx and particulate
The submitted manuscript has been created by UChicago Argonne,
LLC, Operator of Argonne National Laboratory (‘‘Argonne’’).
Argonne, a US Department of Energy Office of Science laboratory, is
operated under Contract No. DE-AC02-06CH11357. The US
Government retains for itself, and others acting on its behalf, a paid-
up nonexclusive, irrevocable worldwide license in said article to
reproduce, prepare derivative works, distribute copies to the public,
and perform publicly and display publicly, by or on behalf of the
Government.
A. I. Ramırez � S. Som � S. K. Aggarwal (&)
Department of Mechanical and Industrial Engineering,
University of Illinois at Chicago, 842 W. Taylor/MC 251,
Chicago, IL 60607, USA
e-mail: [email protected]
A. L. Kastengren � E. M. El-Hannouny �D. E. Longman � C. F. Powell
Energy Systems Division, Argonne National Laboratory,
9700 S. Cass Avenue, Argonne, IL 60439, USA
123
Exp Fluids (2009) 47:119–134
DOI 10.1007/s00348-009-0643-4

formation in diesel engines (Pierpont and Reitz 1995;
Montgomery et al. 1996).
Improved fuel/air mixing can lead to more efficient
combustion and lower particulate emissions. The mixing
process is governed by injection and spray processes. The
injection characteristics depend on factors such as the
needle lift dynamics and inner nozzle flow behavior, while
the spray processes are influenced by aerodynamics outside
the nozzle. Significant work has been done on character-
izing the influence of various injection parameters such as
nozzle orifice geometry, injection and ambient pressure,
etc., on spray development (Pierpont and Reitz 1995;
Montgomery et al. 1996; Han et al. 2002; Wang et al. 2003;
Gavaises et al. 2006; Giannadakis et al. 2008). Establishing
correlations between near-nozzle flow behavior and diesel
engine performance and emissions will augment the
capability of designing more efficient diesel engines.
Detailed experimental data not only lead to further
understanding of the spray behavior from the injector, but
also provide valuable knowledge to enhance computational
modeling capabilities.
Optical diagnostics have been extensively used to char-
acterize diesel sprays. Siebers (1998) used Mie-scattered
light imaging to perform extensive studies of diesel sprays
with varied injection pressures, nozzle geometry, and
ambient conditions. It was observed that the liquid length of
the spray is more sensitive to ambient conditions (gas
density and temperature) rather than the nozzle geometry
and injection pressure. Arcoumanis et al. (1990) used laser
techniques to investigate diesel sprays from multi-hole
injectors, and observed spray tip penetration and velocity to
be dependent on the frequency of injection. However,
optical methods while providing valuable information have
intrinsic limitations. Because of the high density of the
droplets near the nozzle, most optical methods are inef-
fective in this area. Visible light is scattered by the dense
fuel, thus causing the measurements to be ineffective until
far downstream from the nozzle. Consequently, for typical
high-speed sprays resulting from a diesel fuel injector, it is
difficult to obtain information with sufficient time and
spatial resolution, since high spray density near the nozzle
prevents the acquisition of such data.
In recent years, X-ray radiography, a measurement
technique based on X-ray absorption, has been well-
established. Since the main interaction between the fuel
and the X-rays is absorption, rather than scattering, the
technique offers an appealing alternative to optical tech-
niques for studying fuel sprays, especially in the dense
near-nozzle region. While both X-ray radiography and
optical images can provide global spray characteristics like
penetration and cone angle, the X-ray technique provides
quantitative data with high spatial and temporal resolu-
tions. The X-ray radiography is perhaps the only technique
that allows for measurement of the fuel mass distribution in
the spray, permitting analyses that cannot be performed
using optical spray data.
This X-ray radiography technique has been used previ-
ously to analyze the spray characteristics for single-hole
research nozzles injecting into ambient pressure lower than
typical of diesel engines (Kastengren et al. 2007a, b; Yue
et al. 2001; Cheong et al. 2004; Powell et al. 2003). The
use of higher pressure was restricted by design limitations
of the X-ray windows and significant X-ray extinction
caused by the fill gas (Ciatti et al. 2004; Powell et al. 2003).
While these lower pressure experiments provide useful
insights into the spray development characteristics, the
effects of injecting into gas at heavy-duty engine-like
density has not been investigated in previous studies.
Multi-hole nozzles are commonly used to improve the
mixing in the engine cylinder. Spray from a multi-hole
nozzle differs from that of a single-hole nozzle due to
internal flow differences inside the nozzle. Soteriou et al.
(1995) investigated cavitation in nozzles using large-scale
and standard nozzles. The onset of cavitation in the nozzle
was found to be asymmetrical and eventually propagates
down the orifice and fills the hole. Increased turbulence was
also found in the case of multiple holes over single holes.
Chaves et al. (1995) performed studies of fuel spray using a
real-scale transparent nozzle using optical techniques. Payri
et al. (2008a, b) used optical techniques to examine the
global spray behavior in the first 15 mm of the spray from a
non-isolated 6-hole common rail injector. The spray tip
penetration in the transient region was observed to behave
differently than in the steady state region. Application of X-
ray radiography to multi-hole nozzles is quite challenging
due to the difficulty of obtaining adequate spray isolation. It
is desired that only a single plume of interest sprays freely
in the direction normal to the X-ray beam without inter-
ference from neighboring spray plumes. This requires
significant design considerations. Leick et al. (2007) used a
multi-hole, common rail, single fluid injection system
where a single plume was isolated and investigated spray
behavior using X-ray radiography under ambient density
conditions corresponding to those in a typical automobile
engine. They used a near production nozzle to investigate
the spray from three orifices at two different gas densities,
and observed that the ambient density has a relatively small
effect on the mass distribution. In addition, the mass dis-
tributions obtained in this study indicated the absence of a
pure liquid core in the spray, suggesting rapid mixing of gas
and liquid near the nozzle.
The present study uses X-ray radiography technique to
explore the near-nozzle region of a production multi-hole
injector, and obtain quantitative measurements of high-
pressure nonevaporating sprays at heavy-duty diesel
engine-like densities. The entire spray event, including the
120 Exp Fluids (2009) 47:119–134
123

transient region of the spray where needle lift plays a
significant role in fuel penetration is investigated. It focuses
on the isolation of a single spray plume of a full production
6-hole injector in order to obtain data in the near-nozzle
region. Geometry deviations, surface irregularities, and
production flaws can all affect the operation of the injector.
A production nozzle includes these effects and provides a
more realistic representation of actual spray events. In
addition, the use of a production nozzle facilitates direct
correlations between X-ray spray studies and subsequent
engine performance and emission investigations using the
same injector and nozzle tip. In the present experiments,
the geometrical effects of multiple holes are preserved by
employing a specially designed isolation shield. This shield
enables line-of-sight measurement of the plume of interest
by deflecting the remaining five spray plumes. This tech-
nique therefore allows a more accurate study of the spray
as it exits the nozzle.
While many experimental techniques have provided
global spray characteristics such as cone angle and pene-
tration, X-ray radiography is also able to measure the mass
distribution in the spray, especially near the nozzle exit.
This comprehensive experimental data can be used for the
validation and further improvements in the spray models.
Also from a modeling perspective, non-evaporating sprays
provide a more stringent test for liquid breakup and
atomization models in the near-nozzle region, since the
uncertainties related to reacting flow models (such as
evaporation, ignition, combustion, etc.) can be isolated.
Some recent studies have attempted to use X-ray data for
spray model validation. Tanner et al. (2004, 2006)
employed a Cascade atomization and droplet breakup
(CAB) model and compared the liquid penetration and
transverse mass distribution with X-ray measurements.
However, the rate of injection (ROI) profile was not known
for injection conditions and injection velocities were
determined by an iterative process to match the spray
penetration. In the present study, the ROI was determined
from a Bosch rate meter coupled with X-ray measurements,
thus reducing the uncertainty associated with injection
velocities.
To the best of our knowledge, the present study reports
the first detailed evaluation of a full production multi-hole
nozzle under engine-like ambient densities, and provides
quantitative measurements in the near-nozzle region using
X-ray radiography. Measurements include spray shape and
liquid penetration as function of time, spray cone angle,
ROI profile, as well as liquid mass distribution and spray
velocity. These measurements are also used to examine the
spray models in a CFD software STAR-CD. The current
investigation thus further expands the available data for the
validation and improvement of nonevaporating spray
models that are currently used in diesel spray simulations.
2 Experimental setup
2.1 X-ray absorption
The X-ray measurements were performed at Argonne
National Laboratory using the Advanced Photon Source
(APS) facility, which generates a highly intense X-ray
beam (approximately 4 9 108 photons/s). The X-ray
radiography technique is based on the absorption of the
monochromatic X-ray beam passing through the spray. The
monochromaticity of the beam allows a straightforward
application of the Beer–Lambert law relating the measured
X-ray intensities to the mass of the fuel in the path of the
beam, expressed as
I
I0
¼ e�lM ð1Þ
here l is the absorption coefficient of the fuel in mm2/lg,
M the projected density of the fuel in the beam path in lg/
mm2, and I and I0 the X-ray intensities during and before
the spray event, respectively.
Schematic and top-view image of the experimental setup
are shown in Fig. 1. The X-ray energy of 8 keV with a
narrow range (2% bandwidth) of X-ray wavelengths was
selected using a monochromator. This energy provides a
good compromise between absorption and penetrating
power, allowing significant absorption due to the spray
while maintaining sufficient intensity through the spray
chamber. Vertical and horizontal X-ray slits were used to
limit the beam size. Full width half maximum (FWHM)
values of the beam size were 260 lm in the axial direction
and 50 lm in the transverse direction.
An avalanche photodiode (APD) with a time response
faster than 5 ns is used to monitor the X-ray intensity. The
APD output, which is proportional to the X-ray intensity,
was recorded using a fast digitizing oscilloscope every 1 ns
for a duration of 4 ms, which encompasses the entire spray
event. At each position, the X-ray intensity from 128
successive spray events was averaged at every measure-
ment position in order to improve signal to noise ratio. The
time-resolved behavior of the spray is maintained as the
sprays are averaged. Data were recorded, and Eq. 1 was
then used to convert the X-ray intensity to projected den-
sity in the spray. X-ray measurements are a projection of
the three-dimensional fuel density along the X-ray beam
path, giving units of mass per unit area. The standard
deviation of measurement is approximately 1.1 lg/mm2, or
2.5%, based on a mean value of 45 lg/mm2. The posi-
tioning of the nozzle is accurate to within about 3–5
microns in the vertical direction and 10–20 microns in the
horizontal direction. More detailed descriptions of the
technique can be found in other works (Kastengren et al.
2007a, b; Powell et al. 2001; Yue et al. 2001).
Exp Fluids (2009) 47:119–134 121
123

The spray chamber was mounted on high-precision
translation stages that moved it in two dimensions in
the plane perpendicular to the X-ray beam. For each
measurement condition, measurements were made at
approximately 980 spatial locations. Figure 2 shows the
measurement grid used in these experiments. The spatial
resolution of the measurement is a function of both the size
of the X-ray beam and the spacing between successive
measurement points. The size of the X-ray beam is
260 lm 9 50 lm. The spacing between measurement
points varies across the measurement domain. Closest to
the nozzle, measurements were taken each 0.2 mm in the
axial direction and 0.03 mm in the transverse direction,
eventually progressing to 1 mm axial and 0.07 transverse
separation further downstream. It should be noted that
these measurements are composite data from many dif-
ferent spray events. Thus, the radiography data show the
persistent, ensemble average features of the spray, rather
than the details of any particular spray event.
2.2 Injection system
In the present experiments a Caterpillar 315B hydraulically
actuated electronically controlled unit injector (HEUI) was
used. Unlike other injection systems, the HEUI 315 B
requires both engine oil and fuel for operation. The HEUI
injection system uses hydraulic pressure from the oil to
raise the fuel pressure to the desired level for direct
injection. This is done by an internal differential piston,
which multiplies the relatively modest oil rail pressure to a
high fuel injection pressure. This injector uses a pressure
intensification ratio of approximately 6.6 between the oil
rail pressure and injection pressure. Parameters such as the
injection timing, duration, and quantity are controlled by a
solenoid that is connected to the engine’s Electronic
Control Unit (ECU) (Yudanov 1995). More detailed
description of the HEUI injection system can be found in
(Mulemane et al. 2004; Glassey et al. 1993; Stockner et al.
1993).
2.3 Spray isolation
The full-production, mini-sac nozzle investigated in this
study is shown schematically in Fig. 3a. It has six cylin-
drical holes each with a diameter of 169 lm separated by
126�. One orifice was carefully isolated in order to study
the dynamics of a single spray plume. An isolation shield,
shown in Fig. 3b deflected the remaining plumes, allowing
the plume of interest to spray freely through the spray
chamber in the direction indicated. Figure 3c provides a
closer view of the isolation shield and the single hole in the
opening. This isolation shield was designed in such a way
that it does not block the remaining plumes; rather it
deflects them after they emerge from the orifice without
restriction.
The use of a full-production six-orifice injector is an
advantage of this work since it represents equipment that is
physically used in an engine. Because of the line-of-sight
APD
x-ray Windows
Oil Rail
x-ray Windows
Slits
Spray Chamber
Injector
Spray
x-ray Beam
Ionization Chamber
(a)
APDx-ray Beam
IoI
N2 Flow
x-ray Window
X-Y Slits
Fuel Injector
(b)
Fig. 1 a Top view image of experimental setup at APS, b schematic
of experimental setup
Fig. 2 Measurement grid showing the position of the X-ray beam in
the line-of-sight coordinate system of the spray
122 Exp Fluids (2009) 47:119–134
123

nature of the X-ray technique, spray plumes that are not
desired for measurement must be removed from the mea-
surement domain. This has been done in the past by
plugging orifices adjacent to the plume-of-interest. Using
an isolation shield to deflect the remaining spray plumes
allows for the internal flow inside the nozzle to remain
unaltered as it would be in the engine. However, the
isolation shield may interact with the spray and change the
aerodynamics slightly inside the spray chamber. In future
work this injector will be used to perform engine testing
and it is therefore desirable not to alter the injector when
performing the X-ray testing.
2.4 Rate of injection measurements
To further understand the initial dynamics of the fuel spray,
ROI studies were conducted using a Bosch ROI indicator
(Bosch 1966). The ROI is not only important in under-
standing the spray dynamics, but is also essential for
computational fluid dynamics (CFD) modeling as it pro-
vides boundary conditions for fuel injection into the
combustion chamber.
Figure 4 shows a schematic of the ROI test rig used in
the present study. Signals from the pressure transducer on
the rate meter, the high-frequency pressure sensor on the
oil rail, and a meter monitoring the current supplied to
the injector solenoid were registered on a digitizing
oscilloscope. In the present experiments, the injection
ambient pressure was maintained constant at 3 MPa for
all tests to simulate X-ray test conditions. The pressure
signal from the ROI meter was low-pass filtered at
30 kHz and ensemble averaged over 512 traces. 3,750
injections were used to measure the total injected quan-
tity for each condition, which is used to scale the ROI
plots obtained. For both conditions the commanded fuel
delivery was set to 100 mm3 per stroke. Rate profiles
were obtained for a range of oil rail pressures and
injection deliveries. It is important to note that all six
spray plumes were measured in the ROI experiments,
while spray isolation was only used for the X-ray testing.
For the work presented in this paper, it is assumed that
an average of one-sixth the total fuel quantity is injected
Fig. 3 a Schematic of injector nozzle tip, b isolation shield with
arrow indicating direction of spray, the direction of the X-ray beam
would be going into the plane of the page. c Zoomed image of nozzle
tip and hole of interest in isolation shield
Fig. 4 Schematic of rate of injection (ROI) test setup
Exp Fluids (2009) 47:119–134 123
123

per orifice. This is done for comparisons with measure-
ments taken with the X-ray studying only one of the six
orifices.
2.5 X-ray radiography test conditions
Sprays in diesel engines encounter an environment of high
pressure, temperature, and density. Unfortunately, it is not
currently possible to replicate these conditions in an X-ray
radiography experiment. The X-ray transparent windows
used in these experiments are of polyimide film that cannot
withstand high temperature. Nitrogen at room temperature
was used as fill gas at 3 MPa pressure. Minimal evapora-
tion of the fuel is expected to occur at these conditions.
Expansion tubes were utilized on both of the X-ray win-
dows to allow for elevated pressure in the spray chamber.
Since the polyimide windows are the weakest points in the
spray chamber, these tubes were attached to the windows
as a safety precaution in the event of a rupture due to high
pressures. The increased chamber pressure, and thus
chamber density, along with the long path-length cause
significant extinction of the X-rays. Therefore, increased
number of averages was taken at each coordinate to
improve the quality of the measurements. While the tem-
perature and pressure levels in these experiments are far
from those in a diesel engine, the density is 34.13 kg/m3,
which is comparable to engine density, an important
parameter for fuel spray.
Two oil rail pressures were selected: 17 and 21 MPa,
which correspond to peak injection pressures of about 110
and 135 MPa according to the injector pressure intensifi-
cation ratio, 6.6, mentioned earlier. A fuel injection
quantity of 100 mm3/stroke was specified in the injector
control software for both oil rail pressures. These param-
eters were used in the present study due to their consistency
with known part-load turbo-charged heavy-duty engine test
conditions. Table 1 lists other specific parameters of the
experiments.
2.6 Numerical model
Standard models available with STAR-CD were used to
perform simulations examining external spray from one
orifice of the 6-hole nozzle. The gas phase is described
using the Navier–Stokes equations in conjunction with
RNG k - e turbulence model. The length and time scale
for the spray is too small to be resolved; hence sub-grid
scale modeling was necessary to describe the spray phys-
ics. Spray models used are Reitz and Diwakar model for
atomization and droplet breakup (Reitz and Diwakar 1987),
advanced collision model (Schmidt and Rutland 2000;
Aamir and Watkins 1999), spray evaporation model (Ranz
and Marshall 1952), standard turbulent dispersion model
(Gossman and Ioannides 1983), RNG k - e turbulence
model, and standard drag model (Liu et al. 1993). In
addition, the injected fuel spray was represented by a
stochastic system of a discrete number of parcels. These
injected parcels were of the size of the nozzle orifice
diameter with the injection velocity determined from ROI
profile. Post-processing codes were written to calculate the
liquid penetration and radial mass distributions at a given
time. The computational domain simulating the spray
chamber is of 50-mm diameter and 200-mm length. An
O-mesh was generated with cells near the center forming a
cube so that no acute angles are present between adjacent
sides. This O-mesh is better than a radial mesh as used in
previous STAR-CD simulations (Larmi et al. 2002) since it
avoids narrow wedge-shaped cells near the center of the
spray chamber. A mesh with 14 9 14 grids in the square
and 14 9 56 in the circle outside was generated. 110 grid
points were used in the direction of injection (?Z) and
using a geometric distribution, the grids near the injector
were 1 mm as shown in Fig. 5.
Table 1 X-ray radiography test conditions
Parameter Quantity
Injection system Caterpillar HEUI 315B
Number of orifices 6
Orifice diameter (lm) 169 with L/D = 4.412
Oil rail pressure (MPa) Case 1: 17/case 2: 21
Oil temperature (�C) 60
Fill gas Nitrogen (N2)
Chamber density (kg/m3) 34.13
Fuel Viscor and cerium blend
Fuel temperature (�C) 40
Fuel injection quantity (mm3/stroke) 100Fig. 5 Computational mesh
124 Exp Fluids (2009) 47:119–134
123

3 Results and discussion
3.1 Rate of injection
The ROI profiles for the oil rail pressures of 17 and
21 MPa are shown in Fig. 6. Both cases show similar delay
between commanded start of injection (SOI) and apparent
SOI, and have comparable rate shapes. As expected, the
higher rail pressure yields a higher peak value of ROI with
a slightly quicker initial rise than the 17 MPa case. A
notable feature of both rate profiles is the slower rise to the
‘‘steady state’’ injection period than that with single-fluid,
single-hole common rail injection systems (Naber and
Siebers 1996). It should be mentioned that the ROI profiles
shown are for a combination of all six orifices.
Using ROI profile for the early transition region
(t = 2.2–2.4 ms), as shown in Fig. 6, as an input to the
numerical model yields gross underprediction of penetra-
tion lengths in comparison to the X-ray data (cf. Fig. 8).
Note that only one hole of the injector was studied using X-
ray radiography, whereas all six were used with the rate
meter. It has been shown in previous work that there is
hole-to-hole variation seen in multi-hole nozzles (Wang
et al. 2003; Warrick et al. 1996). Therefore, directly scaling
the injection rate from six-sprays to a single spray in the
transition region might cause this underprediction.
According to the control volume analysis in Kastengren
et al. (2007a, b), X-ray radiography can be used to compute
the total spray mass and hence ROI, until the spray has
reached the downstream end of the measurement domain.
This ROI computed from the X-ray data represents the
activity of the single observed spray plume, rather than the
behavior of all of the fuel exiting the injector. Figure 7a
presents the ROI obtained from the X-ray data up to
0.15 ms at the first measurement location (0.283 mm). The
lines represent a linear fit to the data.
We believe that the X-ray ROI measurements are
potentially more reliable, because in the near-nozzle
region, these measurements depend on a relatively simple
physical process (X-ray absorption). The Bosch rate meter,
in contrast, is based on the mass flow generating a quasi-
one dimensional flow in a duct, which causes changes in
the liquid pressure, which is measured a few centimeters
from the nozzle and then correlated to ROI (Bosch 1966).
Moreover, several artifacts can be seen in Bosch rate
measurements including values less than zero immediately
before SOI and oscillatory behavior near the end of
Fig. 6 Rate of injection profiles for 17 and 21 MPa oil rail pressures,
30 bar ambient pressure, 100 mm3 per stroke fuel delivery. The
transition period of rapid increase to quasi-steady injection is marked
Fig. 7 a Rate of injection as measured from X-ray data for different
rail pressures along with the respective linear fits. b Hybrid ROI
profile of a single orifice used for input in numerical simulation
Exp Fluids (2009) 47:119–134 125
123

injection. Payri et al. (2008a, b) investigated the correction
of rate profile measurements obtained from a Bosch fuel
rate meter. In this study, a methodology was proposed to
correct signal cumulative phenomenon that distorts the
measured profile. Although the technique proposed could
not be applied to the HEUI system, Payri’s study indicates
limitations of using the rate meter for ROI measurements.
Other than random noise, the X-ray ROI does not suffer
from these artifacts.
For the STAR-CD simulations, the initial ROI was
obtained from X-ray data and was combined with the
steady state ROI obtained from the Bosch meter to con-
struct an injection rate for the duration of injection. The
total mass injected through the single hole of the nozzle
was one-sixth of the total mass injected. The hybrid ROI
profile inputted into the numerical model is shown in
Fig. 7b. The regions obtained from X-ray and from the rate
meter are indicated on the plot.
3.2 Liquid penetration
Comprehensive data analysis was performed to investigate
the near-nozzle spray characteristics using the X-ray radi-
ography measurements. Liquid penetration was obtained
by determining the time at which the leading edge of the
fuel arrives at each axial location. This was done by
recording the time at which the X-ray intensity decreases
by a threshold value of 25%, indicating absorption by the
fuel at each axial location in the experimental domain.
Figure 8 presents the measured and predicted liquid
penetration lengths plotted versus time for oil rail pressures
of 17 and 21 MPa. The scale is adjusted so that zero is the
instant when the first amount of fuel is visible for each
spray. There are several observations from this figure. For
both rail pressures, a slow penetration region up to 0.1 ms
is followed by a faster penetration region (where penetra-
tion scales linearly with time) up to 0.2 ms. The last
measured point for the 17-MPa case suggests that the spray
may be entering a region where penetration scales as
square root of time; however, more measurements would
be necessary to verify this trend. These spray penetration
characteristics are consistent with the observations of pre-
vious researchers (Hiroyasu and Arai 1990; Naber and
Siebers 1996).
Validation of STAR-CD simulations against penetration
data is also presented in Fig. 8. The differences in pene-
tration lengths resulting from the various ROI profiles can
be clearly observed. When the profile from the rate meter is
used in the simulations, the predicted penetration lengths
are significantly smaller than those measured in X-ray
experiments. Better agreement is observed when the ROI
profile from X-ray data is mated with that from the rate
meter (cf. Fig. 7b). In general there is an excellent match
for both injection pressures, except for small differences
observed earlier (\0.1 ms).
For the higher rail pressure case, the penetration speed
increases more gradually and continues increasing
throughout the measurements. For both pressures, the
maximum speeds achieved are notably lower than those
achieved at similar conditions with a single-hole injector
(Kastengren et al. 2008). Further examination indicated
that the single-hole injector with the single-fluid common
rail injection system used in the cited study shows a much
steeper rise in mass flow rate during the initial stage of
injection than the HEUI system. This slower ramp in ROI
for the HEUI system may account for the slower penetra-
tion speeds observed in the present experiments.
Another notable observation from Fig. 8 is that the
higher oil rail pressure case shows lower penetration speeds
than the lower oil rail pressure case for some parts of the
spray. This is unexpected, since other studies indicate that a
higher injection pressure usually yields faster penetration
(Payri et al. 2008a, b; Kastengren et al. 2008). Moreover,
correlations in the literature show that the penetration
scales with the square root of the difference in the injection
and ambient pressures (Payri et al. 2008a, b; Naber and
Siebers 1996). The ROI profiles measured with the Bosch
rate meter also indicate a faster rise in mass flow for the
higher oil rail pressure. Figure 9 presents the projected
liquid fuel density distributions at 0.122 ms after apparent
SOI for the two pressure cases. As indicated, the penetra-
tion for the 21 MPa rail pressure case is smaller than for
the lower pressure case during this transient period.
The slightly faster penetration for the lower rail pressure
case is unexpected. It should be noted, however, that the
current measurements have been performed closer to the
nozzle than most penetration measurements in the literature
Fig. 8 Validation of spray models in STAR-CD against X-ray
penetration data for oil rail pressures of 17 and 21 MPs, 30 bar
ambient pressure, 100 mm3/stroke fuel delivery. Predicted and
measured (using ROI obtained from X-ray and rate meter) liquid
penetration lengths are plotted versus time
126 Exp Fluids (2009) 47:119–134
123

and therefore cover a significantly shorter time than most
penetration measurements. The penetration in this region
depends highly on the needle motion and pressure buildup
dynamics of the injector, which appear to be slower for the
injection conditions at 21 MPa than at 17 MPa. The
authors believe that this is due to needle and flow dynamics
inside the injector for the particular injection conditions
selected, rather than an artifact of the measurements, and
that more extensive penetration measurements would fol-
low the conventional trend of faster penetration with higher
injection pressure. This also provides further evidence
based on our X-ray measurements that the near-nozzle
spray characteristics are very strongly influenced by
internal injector dynamics, which is consistent with pre-
vious studies (Arcoumanis and Gavaises 1998; Gavaises
et al. 2002).
The simulations also show a similar trend, i.e., the 17-
MPa rail pressure case yields higher penetration speed
compared to that for the 21-MPa rail pressure case. When
only the data acquired from the rate meter are used for the
ROI input, the simulations indicate that the higher oil rail
pressure case yields a higher penetration. This is because
the ROI for the early transition region is taken from the
X-ray data. In the region this close to the nozzle, only the
upstream conditions affect spray penetration rather than the
details of the spray models. As seen in Fig. 7, the 17-MPa
rail pressure case yields higher injection rates and thus
higher injection velocities. This is the reason as to why the
17-MPa rail pressure case has faster penetration than the
21-MPa rail pressure case in both experiments and
simulations.
Previous researchers have measured diesel spray pene-
tration, and provided correlations for penetration behavior.
Payri et al. (2008a, b) derived a correlation based on
studies from a multi-hole nozzle, which is more represen-
tative of the injector used in the present study. He reported
the following correlation in the transition region:
S ¼ ð0:018ÞðqaÞ�0:256ðDPÞ0:516ðtÞ1:044: ð2Þ
The coefficients were obtained through curve fitting to
match penetration length in the first 15 mm region of the
spray. In the short-time limit, Naber and Siebers (1996)
reported the following correlation:
S ¼ CvðtÞffiffiffiffiffiffiffiffiffiffiffiffiffiffiffiffiffiffiffiffiffiffiffiffiffiffiffiffi
2� ðPf � PaÞqf
s
: ð3Þ
Figure 10 presents the X-ray data for rail pressure of
17 MPa and the above penetration correlations. For our
case Cv was not measured. Extensive cavitation simulations
(Som et al. 2009) yielded Cv = 0.85, which is comparable
to typical values for diesel injection nozzles. Even if a
smaller value of Cv were used, Fig. 10 indicates that the
Naber and Siebers correlation predicts much higher
penetration than the current data. This can be attributed
to the fact that the initial gradient in the measured injection
rate upon which the Naber and Siebers correlation is based
is much higher than that in the current experiments. This
yields high injection velocities earlier in the spray event,
and hence faster penetration.
The penetration based on the Payri et al. (2008a, b)
correlation is much closer to that obtained from the present
X-ray data. It is important to note that this correlation was
derived using a multi-hole nozzle, while Naber and Siebers
(1996) used a single-hole nozzle. A closer comparison of
the injection rates used by Payri et al. (2008a, b) and those
used in the present study (cf. Fig. 6) shows that the
injection rates are close to each other. However, the gra-
dient in the ROI in Payri et al. (2008a, b) experiments was
higher than that in the current experiments, resulting in a
slight overprediction by the Payri et al. (2008a, b)
Fig. 9 Full field spray projected density versus axial position at
0.122 ms after SOI for 17 and 21 MPa oil rail pressures, 30 bar
ambient pressure, 100 mm3/stroke fuel delivery
Fig. 10 Comparison of X-ray data at 17 MPa oil rail pressure with
penetration correlations available in literature
Exp Fluids (2009) 47:119–134 127
123

correlation. Because of differences between the HEUI
injection system and the injections systems used in the
development of the aforementioned correlations, deviations
are expected in the comparisons. In addition, the experi-
ments presented here are in the near-nozzle region. Given
the slower response time of the HEUI, it is not surprising
that the data do not match the correlations very well.
For the 17-MPa case (cf. Fig. 8), downstream of
x = 12 mm, simulations exhibit the long-time limit
behavior (Naber and Siebers 1996) with the penetration
length scaling with the square root of time. However, for
the 21-MPa case this transition occurs at x & 14 mm.
Naber and Siebers (1996) used a characteristic length (x?)
for this transition region, such that the penetration varies
linearly with time upstream of this point (x?), and as square
root of time downstream of this point. They used the fol-
lowing equation for the characteristic length:
xþ ¼ d
a tanðh=2Þ
ffiffiffiffiffi
qf
qa
r
: ð4Þ
Nozzle orifice diameter was 169 lm and a was assumed
to be 0.66 (Naber and Siebers 1996). Optical cone angle
was calculated as
tanh2
� �
¼ 0:31qa
qf
!0:19
: ð5Þ
A value of about 13 mm was obtained for both the rail
pressures, which is in good agreement with the value
predicted by present simulations.
3.3 Fuel distribution
X-ray radiography has the unique capacity to obtain the
liquid mass distribution in the spray. As previously men-
tioned, the measurement obtained by X-ray radiography is
a measure of the density of the spray (in mass per unit
volume) integrated over the path length of the beam, giving
data in mass per unit area. Figure 11 presents a typical
projected density profile in the transverse direction,
obtained from X-ray measurements, at an axial position of
0.283 mm from the nozzle and 0.1 ms after SOI for the
21 MPa rail pressure case. The black rectangle at the
bottom of the figure is provided to indicate the injector
nozzle size (169 lm diameter). The projected density
profile shows a Gaussian distribution even very near the
nozzle. Other investigations using multi-hole nozzles show
mass distribution profiles somewhat similar in shape to the
system presented here; however, the spreading is less than
that shown by the HEUI injection system (Leick et al.
2007; Malave et al. 2006). Studies using single-hole
common rail injectors have observed that close to the
nozzle, the mass distribution has a more square shape and
develops to Gaussian distributions at further downstream
locations (Kastengren et al. 2008).
Figure 12 presents X-ray measurements and simulations
using STAR-CD in terms of the transverse projected density
distribution at an axial position of 2.883 mm from the
nozzle and 1.05 ms after SOI for the two pressure cases.
Post-processing tool was developed to obtain results, which
can be directly compared with the line-of-sight measure-
ments from X-ray data. All the droplets at a given time in
0
20
40
60
80
100
-1 -0.5 0 0.5 1
Pro
ject
ed D
ensi
ty [
µg
/mm
2 ]
Transverse Position [mm]
X-Ray Data
Gaussian Fit
Fig. 11 Transverse mass distribution profile at axial posi-
tion = 0.283 mm and 0.1 ms after SOI for the 21 MPa oil rail
pressure case
0
20
40
60
80
100
-1 -0.75 -0.5 -0.25 0 0.25 0.5 0.75 1
Pro
ject
ed D
ensi
ty [
µg
/mm
2 ]
Transverse position [mm]
X-Ray Data (P_rail = 17 MPa) X-Ray Data (P_rail = 21 MPa)
Simulations (P_rail = 17 MPa) Simulations (P_rail = 21 MPa)
Gaussian Fit (P_rail = 17 MPa) Gaussian Fit (P_rail = 21 MPa)
Fig. 12 Comparison of X-ray measurements and simulations using
STAR-CD in terms of the transverse mass density distribution at an
axial position 2.883 mm from the nozzle and 1.05 ms after SOI
128 Exp Fluids (2009) 47:119–134
123
the spray were projected to a two-dimensional plane. These
droplets were then accounted for based on their axial and
transverse location to obtain projected density profiles. Both
the simulations and measurements exhibit Gaussian distri-
butions for the two pressure cases. While simulations fairly
reproduce the X-ray data qualitatively, the spray density is
overpredicted for both the cases. This over-prediction yields
a difference of peak mass value of about 40%, resulting in a
50% over-prediction of the transverse integrated mass
(TIM) at the 2.883 mm axial location. However, the
agreement becomes more satisfactory away from the center
in the transverse direction for both the cases. In general, the
comparison clearly indicates the need for additional work to
further improve the spray models.
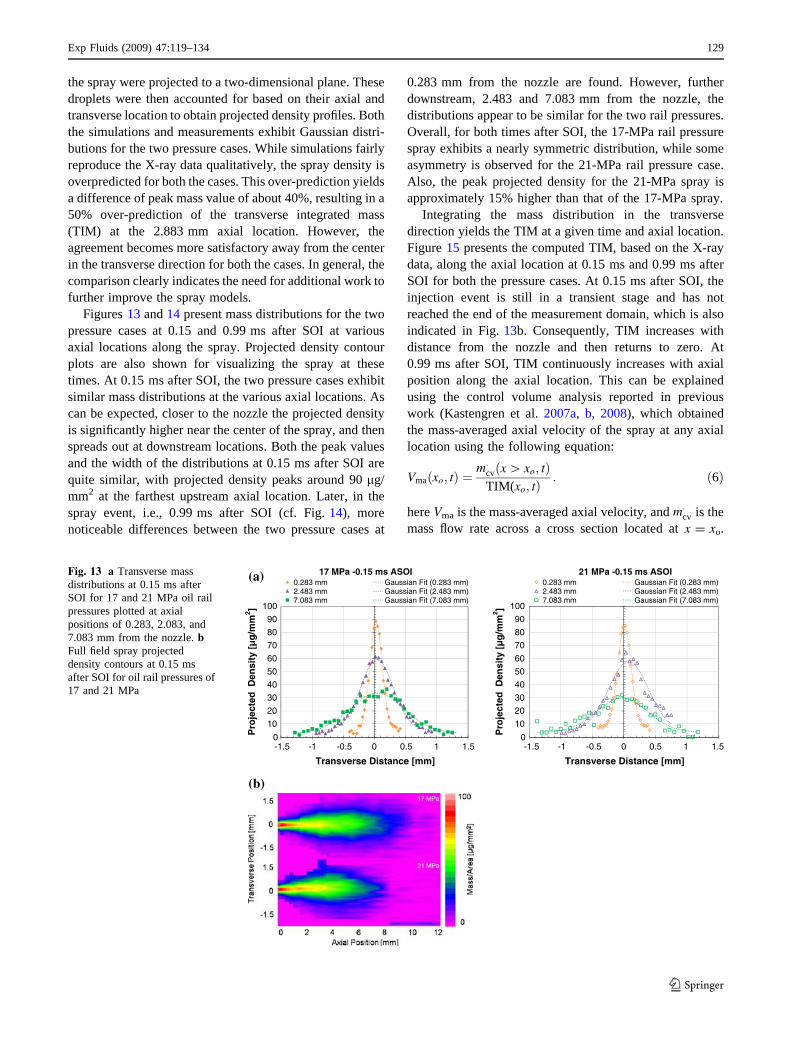
Figures 13 and 14 present mass distributions for the two
pressure cases at 0.15 and 0.99 ms after SOI at various
axial locations along the spray. Projected density contour
plots are also shown for visualizing the spray at these
times. At 0.15 ms after SOI, the two pressure cases exhibit
similar mass distributions at the various axial locations. As
can be expected, closer to the nozzle the projected density
is significantly higher near the center of the spray, and then
spreads out at downstream locations. Both the peak values
and the width of the distributions at 0.15 ms after SOI are
quite similar, with projected density peaks around 90 lg/
mm2 at the farthest upstream axial location. Later, in the
spray event, i.e., 0.99 ms after SOI (cf. Fig. 14), more
noticeable differences between the two pressure cases at
0.283 mm from the nozzle are found. However, further
downstream, 2.483 and 7.083 mm from the nozzle, the
distributions appear to be similar for the two rail pressures.
Overall, for both times after SOI, the 17-MPa rail pressure
spray exhibits a nearly symmetric distribution, while some
asymmetry is observed for the 21-MPa rail pressure case.
Also, the peak projected density for the 21-MPa spray is
approximately 15% higher than that of the 17-MPa spray.
Integrating the mass distribution in the transverse
direction yields the TIM at a given time and axial location.
Figure 15 presents the computed TIM, based on the X-ray
data, along the axial location at 0.15 ms and 0.99 ms after
SOI for both the pressure cases. At 0.15 ms after SOI, the
injection event is still in a transient stage and has not
reached the end of the measurement domain, which is also
indicated in Fig. 13b. Consequently, TIM increases with
distance from the nozzle and then returns to zero. At
0.99 ms after SOI, TIM continuously increases with axial
position along the axial location. This can be explained
using the control volume analysis reported in previous
work (Kastengren et al. 2007a, b, 2008), which obtained
the mass-averaged axial velocity of the spray at any axial
location using the following equation:
Vmaðxo; tÞ ¼m�cvðx [ xo; tÞ
TIM(xo; tÞ: ð6Þ
here Vma is the mass-averaged axial velocity, and m�cv is the
mass flow rate across a cross section located at x = xo.
0
10
20
30
40
50
60
70
80
90
100
-1.5 -1 -0.5 0 0.5 1 1.5
Pro
ject
ed D
ensi
ty [
µg
/mm
2 ]
0
10
20
30
40
50
60
70
80
90
100
Pro
ject
ed D
ensi
ty [
µg
/mm
2 ]
Transverse Distance [mm]
-1.5 -1 -0.5 0 0.5 1 1.5
Transverse Distance [mm]
17 MPa -0.15 ms ASOI0.283 mm Gaussian Fit (0.283 mm)2.483 mm Gaussian Fit (2.483 mm)7.083 mm Gaussian Fit (7.083 mm)
21 MPa -0.15 ms ASOI0.283 mm Gaussian Fit (0.283 mm)2.483 mm Gaussian Fit (2.483 mm)7.083 mm Gaussian Fit (7.083 mm)
(a)
(b)
Fig. 13 a Transverse mass
distributions at 0.15 ms after
SOI for 17 and 21 MPa oil rail
pressures plotted at axial
positions of 0.283, 2.083, and
7.083 mm from the nozzle. bFull field spray projected
density contours at 0.15 ms
after SOI for oil rail pressures of
17 and 21 MPa
Exp Fluids (2009) 47:119–134 129
123

Using this information, the mass-averaged axial velocity at
any location normalized by the corresponding value at xo
can be determined using the following equation:
Vmaðx ¼ x0; tÞVmaðx ¼ 0:283 mm; tÞ ¼
TIMðx ¼ 0:283 mm; tÞTIM(x ¼ x0; tÞ
: ð7Þ
Figure 15b presents the normalized axial velocity versus
x0 obtained using the above equation for the 17-MPa rail
pressure case at 0.99 ms after SOI. The spray velocity
decays quite rapidly in the downstream direction,
decreasing to half its initial value in the first 5 mm of
spray. These results are qualitatively consistent with the
study of Roisman et al. (2007), who observed a strong
dependence of the spray tip velocity on the ambient
pressure, and a more rapid decrease in this velocity at
higher ambient pressures.
3.4 Spray isolation
Figure 16 presents the variation of projected spray density
with respect to the axial position. As seen in Fig. 16a, the
two sprays exhibit similar structures initially (i.e., 0.7 ms
after SOI). The 21-MPa rail pressure case shows interesting
behavior near the nozzle starting around 0.9 ms after SOI.
A broadened region of the spray appears during this time
lasting approximately 0.73 ms (cf. Fig. 16b). Taking a
closer look at the transverse mass distribution at the first
measurement location (0.283 mm from the nozzle) at
various times after SOI, a shift in mass distribution is
observed as shown in Fig. 16c. At 0.7 ms after SOI (before
the broadening is observed) the mass distribution is fairly
symmetric. It then increases at the negative transverse
locations at 0.9 ms after SOI, and increases near the
positive values at 1.64 ms before it vanishes, and then the
mass distribution is again even about the spray axis. This
behavior suggests some hardware interference of the iso-
lation shield with the spray of interest close to the nozzle
tip.
Optical imaging was used to evaluate the effectiveness
of the isolation shield. Visual inspection of the shield
indicated that the hole-of-interest was unobstructed as seen
in Fig. 3c. Nevertheless, interaction, if any, between the
spray and the shield itself that may explain this anomalous
penetration behavior and other interference observed in the
X-ray experiments, was desired to be seen. Both oil rail
pressures were tested; however, due to limitations imposed
by the windows used for optical access, lower ambient
pressure in the spray chamber was necessary. Figure 17
presents an image of an injection event for 17-MPa oil rail
pressure, 0.2 MPa chamber pressure, and a fuel delivery of
100 mm3/stroke. Although some accumulation of mass was
observed on the slanted surface of the shield below the
0
20
40
60
80
100
120
-1.5 -1 -0.5 0 0.5 1 1.5P
roje
cted
Den
sity
[µ
g/m
m2 ]
0
20
40
60
80
100
120
Pro
ject
ed D
ensi
ty [
µg
/mm
2 ]
Transverse Distance [mm]
-1.5 -1 -0.5 0 0.5 1 1.5
Transverse Distance [mm]
17 MPa -0.99 ms ASOI0.283 mm Gaussian Fit (0.283 mm)2.483 mm Gaussian Fit (2.483 mm)7.083 mm Gaussian Fit (7.083 mm)
21 MPa -0.99 ms ASOI0.283 mm Gaussian Fit (0.283 mm)2.483 mm Gaussian Fit (2.483 mm)7.083 mm Gaussian Fit (7.083 mm)
(a)
(b)
Fig. 14 a Transverse mass
distributions at 0.99 ms after
SOI for 17 and 21 MPa oil rail
pressures plotted at axial
positions of 0.283 mm,
2.083 mm, and 7.083 mm from
the nozzle. b Full field spray
projected density contours
position at 0.99 ms after SOI
for oil rail pressures of 17
and 21 MPa
130 Exp Fluids (2009) 47:119–134
123

spray, no errant interference with the spray was observed.
However, future improvements to the shield design would
include a more drastic slope on the angled surface.
3.5 Cone angle
The spray cone angle is computed from X-ray measure-
ments by measuring the FWHM of Gaussian fits to the
transverse mass distributions at each axial location and
time step in the measurements. The cone angle is then
calculated from a linear fit to the FWHM locations, and
plotted as a function of time in Fig. 18a. If the transverse
mass distribution were perfectly axisymmetric and Gauss-
ian, this cone angle value would define a volume
containing half the total mass in the spray. By definition,
using the FWHM to compute cone angle, X-ray radiogra-
phy focuses on the core of the spray, while optical
techniques focus on the spray periphery. Thus, the X-ray
cone angle is expected to be smaller than the optical cone
angle (Ciatti et al. 2004).
Although there is no noticeable difference in the cone
angle values between the two rail pressures, the cone angle
tends to be higher for the 21-MPa rail pressure case than
Fig. 15 a Transverse integrated mass (TIM) versus axial position at
0.15 and 0.99 ms after SOI for 17 and 21 MPa oil rail pressures. bTrend in mass-averaged axial velocity versus axial position at
0.99 ms ASOI for 17 MPa oil rail pressure
(b)
0
20
40
60
80
100
-1 -0.5 0 0.5 1
Pro
ject
ed D
ensi
ty [µ
g/m
m2 ]
Transverse Position [mm]
0.7 ms after SOI
0.9 ms after SOI
1.64 ms after SOI
(c)
(a)
Fig. 16 a Full field mass projected density at 0.7 ms after SOI for rail
pressures of 17 and 21 MPa. b Projected density contours in the near-
nozzle region at 1.15 ms after SOI for the 21-MPa rail pressure case.
c Transverse mass distribution at axial position of 0.283 mm from the
nozzle at three different times after SOI for the 21-MPa rail pressure
case
Exp Fluids (2009) 47:119–134 131
123

that for the 17-MPa case, with average quasi-steady state
values of 10.5� and 9.9�, respectively. Figure 18b presents
the cone angle versus time in the initial transient part of the
spray along with a polynomial fit to the data. The spray
cone angle for the 21-MPa rail pressure case is consistently
larger compared to that of the lower pressure case in this
transient region as well. This is consistent with the pro-
jected density results discussed earlier in the context of
Fig. 9, which presented the projected density for both
sprays during the transient period of injection. These cone
angle values are higher than those observed for single-hole
common rail injectors under similar conditions (Kasten-
gren et al. 2008). Internal flow dynamics are significantly
different between multi-hole and single-hole nozzles. For
multi-hole nozzles, the fuel undergoes a change in flow
direction, which increases cavitation and turbulence, and
thus causes broader cone angle. In single-hole nozzles,
there is less motion of the fuel upstream of the nozzle exit,
resulting in less cavitation and smaller cone angle.
4 Conclusions
Sprays from an unaltered tip of a production HEUI injector
were investigated at engine-like ambient density using X-
ray radiography for two oil rail pressures. Spray charac-
teristics in terms of the fuel penetration, spray mass
distribution, mass-averaged axial spray velocity, and cone
angle were reported.
Rate of injection testing was also performed to supple-
ment the X-ray experiments. The ROI profile from the rate
meter exhibited a slow initial rise compared to that from
X-ray measurements during the transient stages of injec-
tion. Using ROI profile from the rate meter yielded gross
underprediction in the simulations. Consequently, the X-
ray radiography data are judged to be a more accurate
measure of ROI when fed as input to the simulations.
Although a direct comparison cannot be made between
the performance of the HEUI dual-fluid multi-hole injec-
tion system and common rail single-fluid, single-hole
injection system, on a bulk level they show several dis-
similarities. Naturally, the differences in fluid dynamics of
a single and multi-hole injector contribute to these differ-
ences. In addition, some of these could be attributed to
dissimilarities in the initial transient rise in ROI between
the two systems.
Fig. 17 Optical image of injection event for oil rail pressure of
17 MPa, chamber pressure of 2 bar, and fuel delivery of 100 mm3/
stroke
Fig. 18 a Measured cone angle versus time for 17 MPa and 21 MPa
oil rail pressures. b Zoomed cone angle versus time during the initial
transition period
132 Exp Fluids (2009) 47:119–134
123

Measurements were used for the validation of spray
atomization and dispersion models in STAR-CD software.
Simulations indicated good agreement with experiments in
terms of the fuel penetration. While the trends in mass
distribution were captured, simulations noticeably under-
predict the transverse projected density profiles,
demonstrating the need for improved spray models in the
near-nozzle region.
Some anomalous behavior was observed regarding
penetration in that the lower oil rail pressure case exhibited
faster penetration than the higher rail pressure case. Further
analysis suggested that this is due to the slower pressure
build-up in the injector, which can be attributed to the
needle and flow dynamics inside the injector, for the latter
case. Detailed analysis based on the mass distribution
measurements in the region close to nozzle exit also indi-
cated some spray broadening for the higher rail pressure
case, implying some interference of neighboring sprays.
While optical images of the spray indicated that the shield
performed effectively, improvements will be made for
subsequent measurements.
To the best of our knowledge, this is the first time that
quantitative measurements of sprays using X-ray radiog-
raphy have been obtained from a single plume of a 6-hole,
full production nozzle at realistic engine-like densities.
Acknowledgments This work is supported by the US Department
of Energy Office of Vehicle Technology under the management of
Gurpreet Singh. The experiments were performed at the 1-BM beam-
line of the APS. Use of the APS is supported by the US Department of
Energy under contract DE-AC02-06CH11357. The authors would like
to thank Rick Zadoks and Robert McDavid from Caterpillar Inc. and
Anthony Dennis from Test Development Innovators L.L.C. for their
help.
References
Aamir MA, Awais MM, Watkins AP, Lockwood FC (1999) CFD and
neural network modelling of dense propane spray. In: Proceed-
ings of the 15th ILASS-Europe annual conference
Arcoumanis C, Gavaises M (1998) Linking nozzle flow with spray
characteristics in a diesel fuel injection system. Atomization
Sprays 8(3):307–347
Arcoumanis C, Cossali E, Paal G, Whitelaw JH (1990) Transient
characteristics of multi-hole diesel sprays. SAE Paper 900480
Bosch W (1966) The fuel rate indicator: a new measuring instrument
for display of the characteristics of individual injection. SAE
Paper 660749
Chaves H, Knapp M, Kubitzek A, Obermeier F, Schneider T (1995)
Experimental study of cavitation in the nozzle of diesel injectors
using transparent nozzles. SAE Paper 950290
Cheong SK, Liu J, Shu D, Wang J, Powell CF (2004) Effects of
ambient pressure on dynamics of near-nozzle diesel sprays
studied by ultrafast X-radiography. SAE Paper 2004-01-2026
Ciatti SA, Powell CF, Cheong SK, Liu J, Tanner FX (2004)
Comparison of X-ray based fuel spray measurements with
computer simulation using the CAB model. CIMAC congress.
Kyoto, Japan
Gavaises M, Arcoumanis C, Roth H, Choi YS, Theodorakakos A
(2002) Nozzle flow and spray development from VCO diesel
injector nozzles. In: Thiesel conference on thermo and fluid
dynamic processes in diesel engines. Valencia, Spain
Gavaises M, Tonini S, Arcoumanis C (2006) Prediction of liquid and
vapor penetration of high pressure diesel sprays. SAE Paper
2006-01-0242
Giannadakis E, Gavaises M, Arcoumanis C (2008) Modelling of
cavitation in diesel injector nozzles. J Fluid Mech 616:153–193
Glassey SF, Stockner AR, Flinn MA (1993) Development of the
HEUI fuel injection system—integration of design, simulation,
test, and manufacturing. SAE Paper 930271
Han J-S, Lu P-H, Xie X-B, Lai M-C, Nenein N (2002) Investigation
of diesel spray primary break-up and development for different
nozzle geometries. SAE Paper 2002-01-2775
Hiroyasu H, Arai M (1990) Structures of fuel sprays in diesel engines.
Trans SAE 99(3):1050–1061
Kastengren AL, Powell CF, Cheong SK, Wang Y, Im KS, Liu Xin,
Wang J (2007a) Determination of diesel spray axial velocity
using X-ray radiography. SAE Paper 2007-01-0666
Kastengren AL, Powell CF, Wang Y-J, Wang J (2007b) Study of
diesel jet variability using single-shot X-ray radiography. In:
Proceedings of the ASME internal combustion engine division,
Charleston, USA, October 2007
Kastengren AL, Powell CF, Wang Y, Im KS, Wang J (2008) X-ray
radiography measurements of diesel spray structure at engine-
like ambient density. In: Proceedings of the 21st ILASS annual
conference, Orlando, FL, May 2008
Larmi M, Rantanen P, Tiainen J, Kiijarvi J, Tanner FX, Zarling KS
(2002) Simulation of non-evaporating diesel spray and verifica-
tion with experimental data. SAE Paper 2002-01-0946
Leick P, Reidel T, Bittlinger G, Powell CF, Kastengren AL, Wang J,
Wang J (2007) X-ray measurements of the mass distribution in
the dense primary break-up region of the spray from a standard
multi-hole common-rail diesel injection system. In: Proceedings
of the 21st ILASS-Europe meeting
Liu AB, Mather DK, Reitz RD (1993) Effects of drop drag and
breakup on fuel sprays. SAE Paper 930072
Malave A, Farrell P, Powell CF, Cheong S-K, Wang J (2006) Near-
nozzle diesel spray imaging using X-rays. In: Proceedings of
19th annual conference on liquid atomization and spray systems
Montgomery DR, Chan M, Chang CT, Farrell PV, Reitz RD (1996)
Effect of injector nozzle hole size and number spray character-
istics and the performance of a heavy duty D.I. diesel engine.
SAE Paper 962002
Mulemane A, Han J-S, Lu P-H, Yoon S-J, Lai M-C (2004) Modeling
dynamic behavior of diesel fuel injection systems. SAE Paper
2004-01-0536
Naber JD, Siebers DL (1996) Effects of gas density and vaporization
on penetration and dispersion of diesel sprays. SAE Paper
960034
Payri R, Salvador FJ, Gimeno J, Morena J (2008a) Macroscopic
behavior of diesel sprays in the near-nozzle field. SAE Paper
2008-01-0929
Payri R, Salvador FJ, Gimeno J, Bracho G (2008b) A new
methodology for correcting the signal cumulative phenomenon
on injection rate measurements. Experimental techniques, Jan-
uary/February 2008
Pierpont DA, Reitz RD (1995) Effects of injection pressure and
nozzle geometry on D.I. diesel emissions and performance. SAE
Paper 950604
Powell CF, Yue Y, Poola R, Wang J, Lai MC, Schaller J (2001) X-ray
measurements of high pressure diesel sprays. SAE Paper 2001-
01-0531
Powell CF, Yue Y, Cheong S-K, Narayanan S, Cuenca R, Ciatti SA,
Shu D, Wang J (2003) Effects of ambient pressure on fuel sprays
Exp Fluids (2009) 47:119–134 133
123

as measured using X-ray absorption. In: Proceedings of the 16th
ILASS annual conference, Monterey, CA, May 2003
Ranz WE, Marshall WR (1952) Evaporation of drops. Chem Eng
Prog 48(3):141–145
Reitz RD, Diwakar D (1987) Structure of high-pressure fuel sprays.
SAE Paper 870598
Roisman IV, Araneo L, Tropea C (2007) Effect of ambient pressure
on penetration of a diesel spray. Int J Multiphase Flow 33:904–
920
Schmidt DP, Rutland CJ (2000) A new droplet collision algorithm. J
Comput Phys 164:62–80
Siebers DL (1998) Liquid-phase fuel penetration in diesel sprays.
SAE Paper 980809
Som S, Ramırez AI, Aggarwal SK, El-Hannouny EM, Longman DE
(2009) Investigating the nozzle flow and cavitation characteris-
tics in a production diesel injector. J Eng Gas Turbine Power
(submitted)
Soteriou C, Andrews R, Smith M (1995) Direct injection diesel sprays
and the effect of cavitation and hydraulic flip on atomisation.
SAE Paper 950080
Stockner AR, Flinn MS, Camplin FA (1993) HEUI—a new direction
for diesel engine fuel systems. SAE Paper 930270
Tanner FX, Feigl KA, Ciatti SA, Powell CF, Cheong SK, Liu J, Wang
J (2004) Analysis of X-ray-based computer simulations of diesel
fuel sprays. In: Proceedings of the 17th ILASS-Europe annual
conference, Arlington, USA, May 2004
Tanner FX, Feigl KA, Ciatti SA, Powell CF, Cheong SK, Liu J, Wang
J (2006) The structure of high-velocity dense sprays in the near-
nozzle region. Atomization Sprays 16:579–597
Wang T-C, Han J-S, Xie X-B, Lai M-C, Henein NA (2003) Trans
ASME
Warrick CB, Su TF, Farrell PV (1996) Temperature effects on fuel
sprays from a multi-hole nozzle injector. SAE Paper 962005
Yudanov SV (1995) Hydraulically activated electronically controlled
unit injector for diesel engines. SAE Paper 952057
Yue Y, Powell CF, Poola R, Wang J, Schaller J (2001) Quantitative
measurements of diesel fuel spray characteristics in the near-
nozzle region using X-ray absorption. Atomization Sprays
11:471–490
134 Exp Fluids (2009) 47:119–134
123


![Affine analysis for quantitative PCR measurements · Introduction Quantitative polymerase chain-reaction measurements (qPCR) are the mainstay tool diagnosing COVID-19 [1], since they](https://img.pdfslide.us/doc/110x75/600aea1d09382918294a28b4/affine-analysis-for-quantitative-pcr-measurements-introduction-quantitative-polymerase.jpg)