Embed Size (px)
Citation preview
7/21/2014
1
Quantitative Imaging:
Techniques, Applications and
Challenges -- MR
Yue Cao, Ph.D.
Departments of Radiation Oncology,
Radiology and Biomedical Engineering
University of Michigan
Acknowledgments Radiation Oncology James Balter, Ph.D. Avraham Eisbruch, MD Mary Feng, M.D. Felix Feng, MD Theodore S. Lawrence, MD, Ph.D Choonik Lee, Ph.D. Randall Ten Haken, Ph.D. Matthew Stenmark, MD Matthew Schipper, Ph.D. Christina I. Tsien, MD Clinical Coordinators Functional imaging Lab Chris Chapman, B.S. Reza Farjam, Ph.D. Antonis Matakos, Ph.D. Mohammad Nazemzadeh, Ph.D. Priyanka Pramanik, MS Hesheng Wang, Ph.D. Peng Wang, Ph.D.
Radiology Thomas L. Chenevert, Ph.D. Hero Hussain, M.D. Diana Gomez-Hassan, M.D., Ph.D. Suresh Mukherji, MD Pia Maly Sundgren, MD, Ph.D. Ashok Srivasan, MD Hemant Parmar, MD Radiology staffs
STATISTICS Tim Johnson, Ph.D. Dan Normolle, Ph.D. Matt Schipper, Ph.D.
NIH grants RO1 NS064973 (Cao) RO1 CA132834 (Cao) RO1 EB016079 (Balter) UO1 CA183848 (Cao) 4 PO1 CA059827 (Ten Haken) Siemens Research Grant (Balter)
Cao AAPM 2014 2 Patients
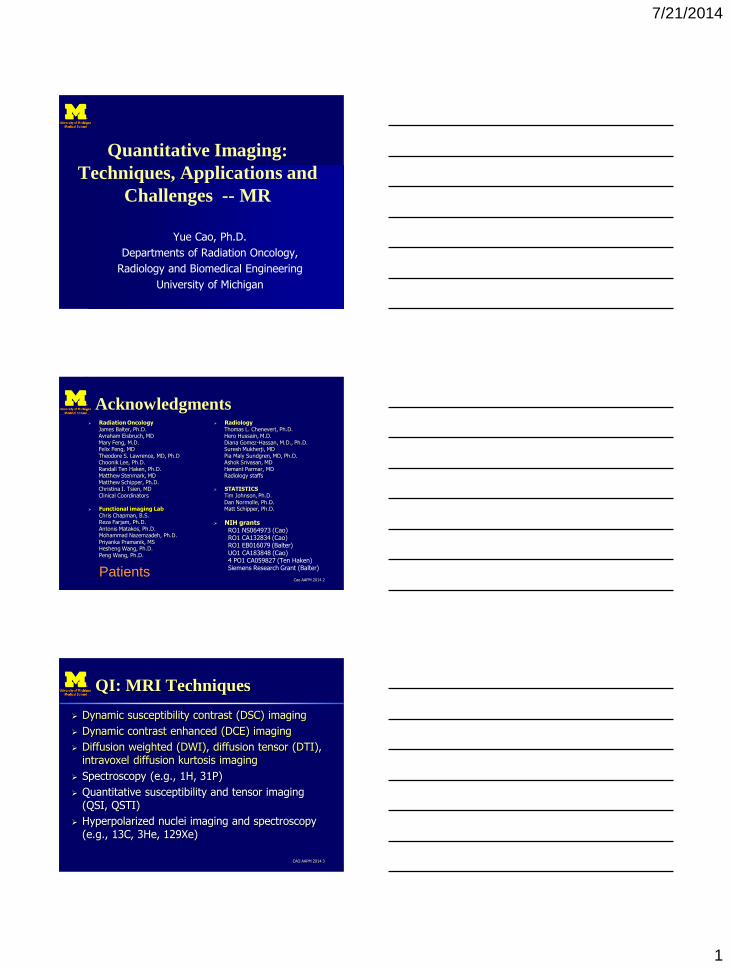
QI: MRI Techniques
Dynamic susceptibility contrast (DSC) imaging
Dynamic contrast enhanced (DCE) imaging
Diffusion weighted (DWI), diffusion tensor (DTI), intravoxel diffusion kurtosis imaging
Spectroscopy (e.g., 1H, 31P)
Quantitative susceptibility and tensor imaging (QSI, QSTI)
Hyperpolarized nuclei imaging and spectroscopy (e.g., 13C, 3He, 129Xe)
CAO AAPM 2014 3
7/21/2014
2
MR QIB
MR image acquisition protocols • Optimized, harmonized, following QIBA profiles
• QA/QC
Physiological parameter quantification from raw image data
Application in clinical problems • Algorithms to extract meaningful “features”/metrics
• Models in relating quantitative image metrics with clinical endpoints
Cao AAPM 2014 4
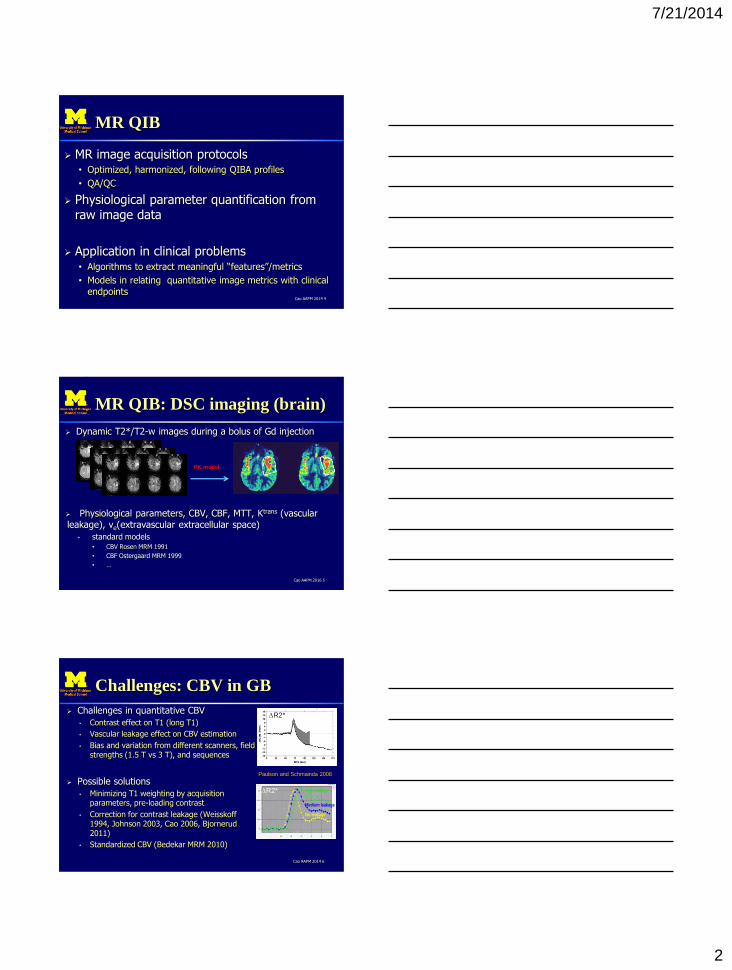
MR QIB: DSC imaging (brain)
Cao AAPM 2016 5
Dynamic T2*/T2-w images during a bolus of Gd injection
Physiological parameters, CBV, CBF, MTT, Ktrans (vascular leakage), ve(extravascular extracellular space)
• standard models • CBV Rosen MRM 1991
• CBF Ostergaard MRM 1999
• …
PK model
Challenges: CBV in GB
Cao AAPM 2014 6
Challenges in quantitative CBV
• Contrast effect on T1 (long T1)
• Vascular leakage effect on CBV estimation
• Bias and variation from different scanners, field strengths (1.5 T vs 3 T), and sequences
Possible solutions
• Minimizing T1 weighting by acquisition parameters, pre-loading contrast
• Correction for contrast leakage (Weisskoff 1994, Johnson 2003, Cao 2006, Bjornerud 2011)
• Standardized CBV (Bedekar MRM 2010)
Paulson and Schmainda 2008
DR2*
High leakage
Medium leakage
No leakage
High leakage
Medium leakage
No leakage
DR2*
7/21/2014
3
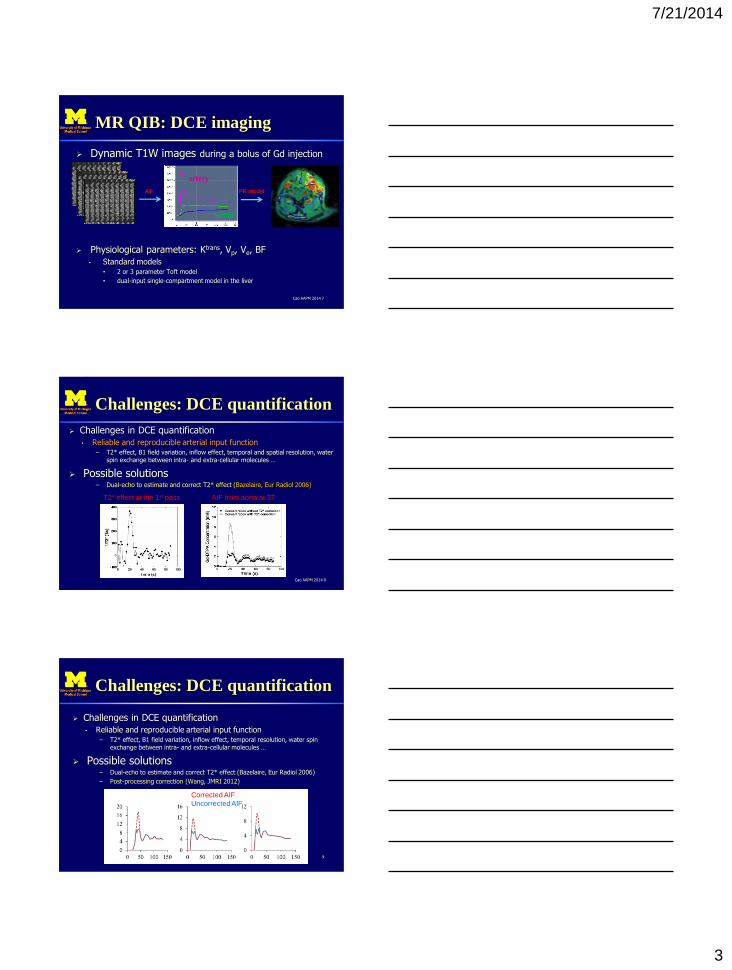
MR QIB: DCE imaging
Dynamic T1W images during a bolus of Gd injection
Physiological parameters: Ktrans, Vp, Ve, BF
• Standard models • 2 or 3 parameter Toft model
• dual-input single-compartment model in the liver
Cao AAPM 2014 7
PK model
artery
tumor
AIF
Challenges: DCE quantification
Challenges in DCE quantification
• Reliable and reproducible arterial input function – T2* effect, B1 field variation, inflow effect, temporal and spatial resolution, water
spin exchange between intra- and extra-cellular molecules …
Possible solutions – Dual-echo to estimate and correct T2* effect (Bazelaire, Eur Radiol 2006)
Cao AAPM 2014 8
T2* effect at the 1st pass AIF from aorta at 3T
Challenges: DCE quantification
Challenges in DCE quantification
• Reliable and reproducible arterial input function – T2* effect, B1 field variation, inflow effect, temporal resolution, water spin
exchange between intra- and extra-cellular molecules …
Possible solutions – Dual-echo to estimate and correct T2* effect (Bazelaire, Eur Radiol 2006)
– Post-processing correction (Wang, JMRI 2012)
9
Corrected AIF
Uncorrected AIF

7/21/2014
4
Challenges: DCE quantification
Challenges in DCE quantification
• Reliable and reproducible arterial input function – T2* effect, B1 field variation, inflow effect, temporal resolution, water spin
exchange between intra- and extra-cellular molecules …
Possible solutions – Dual-echo to estimate and correct T2* effect
– Post-processing correction (Wang, JMRI 2012)
– Contrast agent Phase-effect (Akbudak MRM 1997)
Cao AAPM 2014 10
AIFphase from MRI vs AIF from CT
12 patients with prostate DCE MRI and CT
Cao AAPM 2014 11 Korporaal and van der Heide, MRM 2011
Challenges: DCE quantification
Challenges in DCE quantification
• Reliable and reproducible arterial input function – T2* effect, B1 field variation, inflow effect, temporal resolution, water spin
exchange between intra- and extra-cellular molecules …
Possible solutions – Dual-echo to estimate and correct T2* effect
– Post-processing (Wang, JMRI 2012)
– Contrast agent Phase-effect (Akbudak MRM 1997)
– Slow contrast injection rate to reduce T2* effect
– Universal AIF
Cao AAPM 2014 12
Trade-off! Simple and practical
vs fundamentally sound, accurate

7/21/2014
5
MR QIB: DW Imaging
DW images acquired with multiple b values and gradient directions
Physiological parameters: ADC, Anisotropy diffusion indices (FA, AD, RD), IDK indices
Cao AAPM 2014 13
model
ADC FA
Challenges: ADC quantification
Challenges • Non-monoexponential -> what b values should be?
• Separation of diffusion from perfusion
• High noise
• Geometric distortion and artifact from EPI acquisition
Possible solutions • Intravoxel incohent motion model (Le Bihan 1988)
• Using low b (100-500) values instead b=0 for two-point fitting
Cao AAPM 2014 14
QIB for Therapy Assessment
To develop a QIB for predicting tumor tx failure/progression or response/outcome
Sensitivity and specificity
• Clinical end points
• Specific for tumor and therapy types
Repeatability and Reproducibility
• Separation of a true change from variation • Barnhart, Barboriak, Trans Oncol 2009, & Stat Methods Med Res
Cao AAPM 2014 15
7/21/2014
6
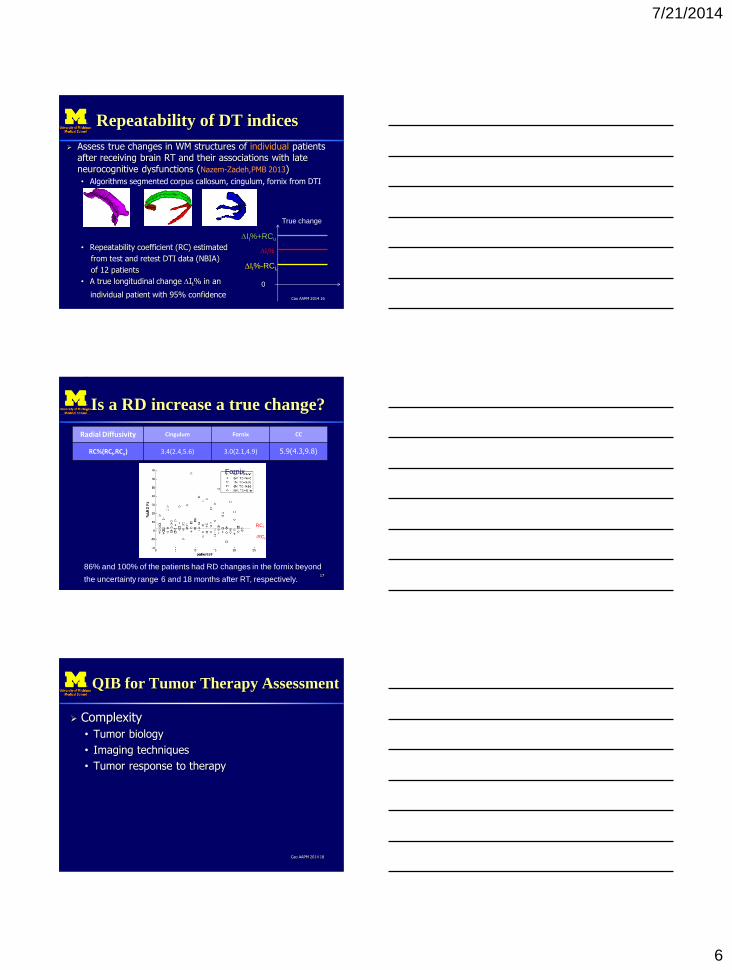
Repeatability of DT indices
Assess true changes in WM structures of individual patients after receiving brain RT and their associations with late neurocognitive dysfunctions (Nazem-Zadeh,PMB 2013)
• Algorithms segmented corpus callosum, cingulum, fornix from DTI
• Repeatability coefficient (RC) estimated
from test and retest DTI data (NBIA)
of 12 patients
• A true longitudinal change DIt% in an
individual patient with 95% confidence Cao AAPM 2014 16
DIt%-RCL
DIt%+RCu
DIt%
0
True change
Is a RD increase a true change?
Radial Diffusivity Cingulum Fornix CC
RC%(RCl,RCu) 3.4(2.4,5.6) 3.0(2.1,4.9) 5.9(4.3,9.8)
17
RCl
-RCu
Fornix
86% and 100% of the patients had RD changes in the fornix beyond
the uncertainty range 6 and 18 months after RT, respectively.
QIB for Tumor Therapy Assessment
Complexity
• Tumor biology
• Imaging techniques
• Tumor response to therapy
Cao AAPM 2014 18

7/21/2014
7
High CBV: Prognostic Indicator
in Gliomas
Cao AAPM 2014 19
(month)
P=0.002
Small fractional TV w High-CBV
Great fractional TV w High-CBV
Cao, IJROPB, 2006 Law, Radiology 2008
High-grade gliomas
Mean rCBV
Gliomas
Vascular Permeability: Prognostic
indicator for high-grade gliomas
Large vascular leakage volume, reflecting angiogenesis, was associated with worse OS.
Cao AAPM 2014 20
0.1 mi
n-1
0.005 min-1
0.05 min-1
Cao, Cancer Research, 2006
Vascular leakage volume
Vascular Normalization Index
Patients: recurrent GB Therapy: cediranib, anti-
VEGF agent VNI
– Changes in Ktrans, CBV, and plasma collagen IV 1 d after the first treatment
Predictors for OS and TPS
Cao AAPM 2014 21
Sorensen, Cancer Research 2009
]logloglog[ collIVcCBVbKaVNI trans DDD
Pre Post

7/21/2014
8
Non-enhanced Hypercellularity
Component in Glioblastoma The non-enhanced, hypercellularity component of GB could
be treated inadequately
• Surgical resection and radiation therapy could be limited to the enhanced gross tumor volume, due to the ill-differentiation of non-enhanced tumor, edema and normal tissue, and concerns of complications.
• The undisrupted blood-brain-barrier can result in a low concentration of TZM in the non-enhanced tumor region.
Incapable to detect non-enhanced hypercellularity components might cause mis-diagnosis of response and progression
Cao AAPM 2014 22
Challenges
To differentiate hypercellularity components of GB from high-vascular components, edema, and normal tissue using conventional MRI and ADC (b= or < 1000 s/mm2)
Cao AAPM 2014 23
Post-Gd T1WI FLAIR Conventional ADC
Hypercellularity by high b DWI
Cao AAPM 2014 24 DWI b=2000 DWI b=1000 DWI b=3000
Red: post-Gd GTV Green: FLAIR GTV
Yellow: b3000 HCV
ISMRM Pramanik, Parmar, Cao 2014
7/21/2014
9
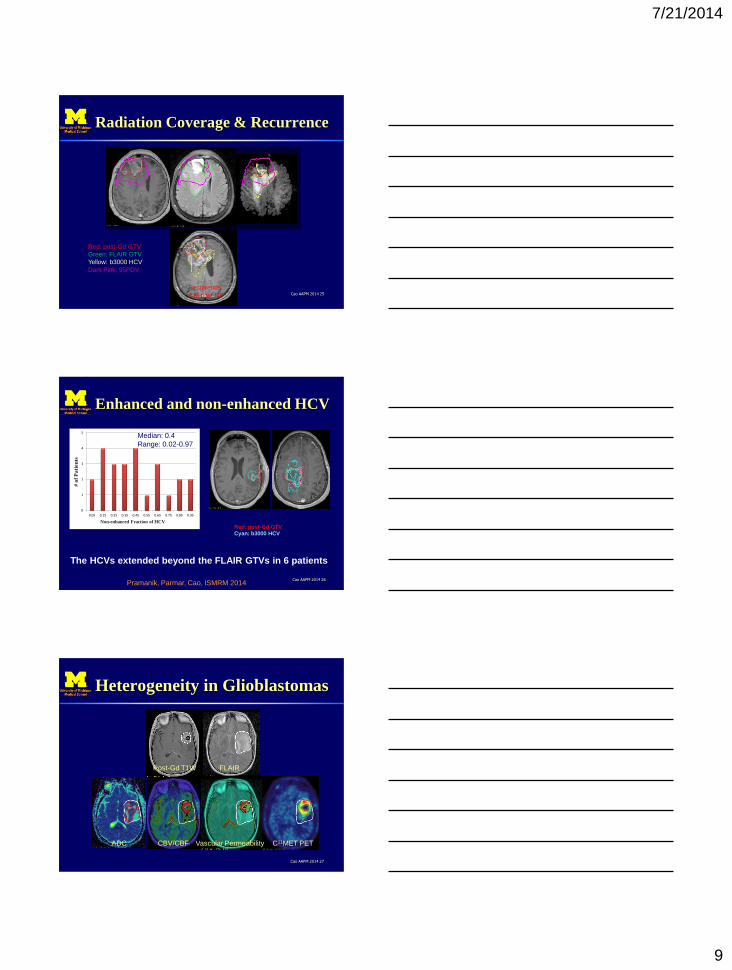
Radiation Coverage & Recurrence
Cao AAPM 2014 25
Recurrence
4 M post RT
Red: post - Gd GTV
Green: FLAIR GTV
Yellow: b3000 HCV
Dark Pink: 95PDV
Enhanced and non-enhanced HCV
Cao AAPM 2014 26
HCV
Median: 7.9 cc
Range: 0.1-67.1 cc
Red: post-Gd GTV Cyan: b3000 HCV
The HCVs extended beyond the FLAIR GTVs in 6 patients
0
1
2
3
4
5
0.05 0.15 0.25 0.35 0.45 0.55 0.65 0.75 0.85 0.95
His
togr
am
Non-enhanced Fraction of HCAV
# o
f P
ati
en
ts
Median: 0.4
Range: 0.02-0.97
Non-enhanced Fraction of HCV
Pramanik, Parmar, Cao, ISMRM 2014
Heterogeneity in Glioblastomas
Cao AAPM 2014 27
Post-Gd T1W FLAIR
ADC C11MET PET CBV/CBF Vascular Permeability
7/21/2014
10
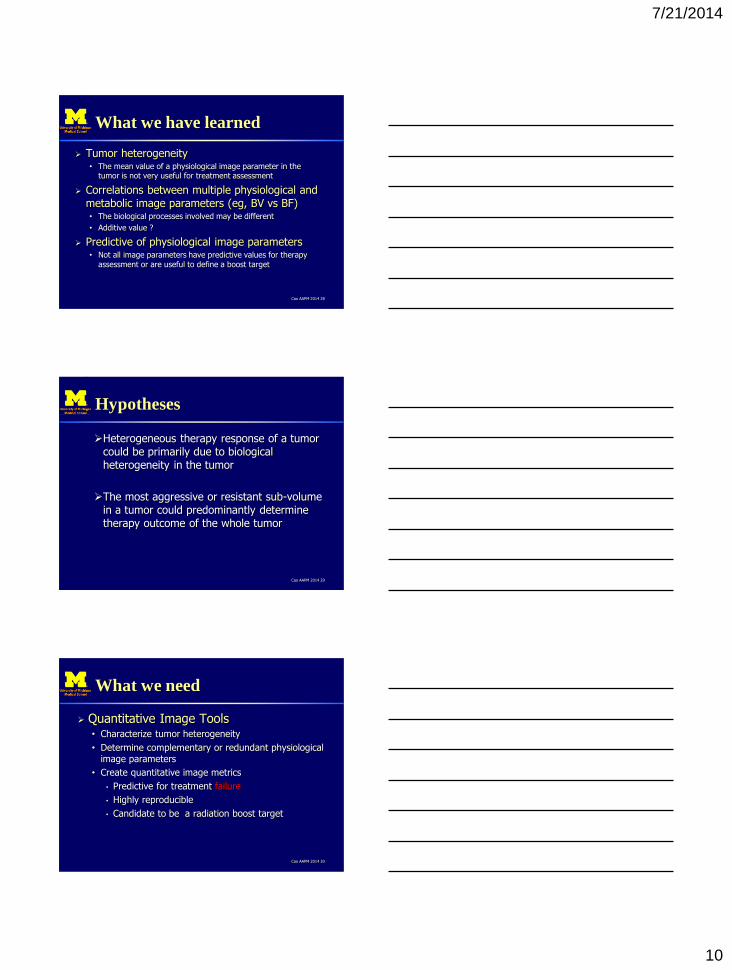
What we have learned
Tumor heterogeneity • The mean value of a physiological image parameter in the
tumor is not very useful for treatment assessment
Correlations between multiple physiological and metabolic image parameters (eg, BV vs BF) • The biological processes involved may be different
• Additive value ?
Predictive of physiological image parameters • Not all image parameters have predictive values for therapy
assessment or are useful to define a boost target
Cao AAPM 2014 28
Hypotheses
Heterogeneous therapy response of a tumor could be primarily due to biological heterogeneity in the tumor
The most aggressive or resistant sub-volume in a tumor could predominantly determine therapy outcome of the whole tumor
Cao AAPM 2014 29
What we need
Quantitative Image Tools • Characterize tumor heterogeneity
• Determine complementary or redundant physiological image parameters
• Create quantitative image metrics
• Predictive for treatment failure
• Highly reproducible
• Candidate to be a radiation boost target
Cao AAPM 2014 30
7/21/2014
11
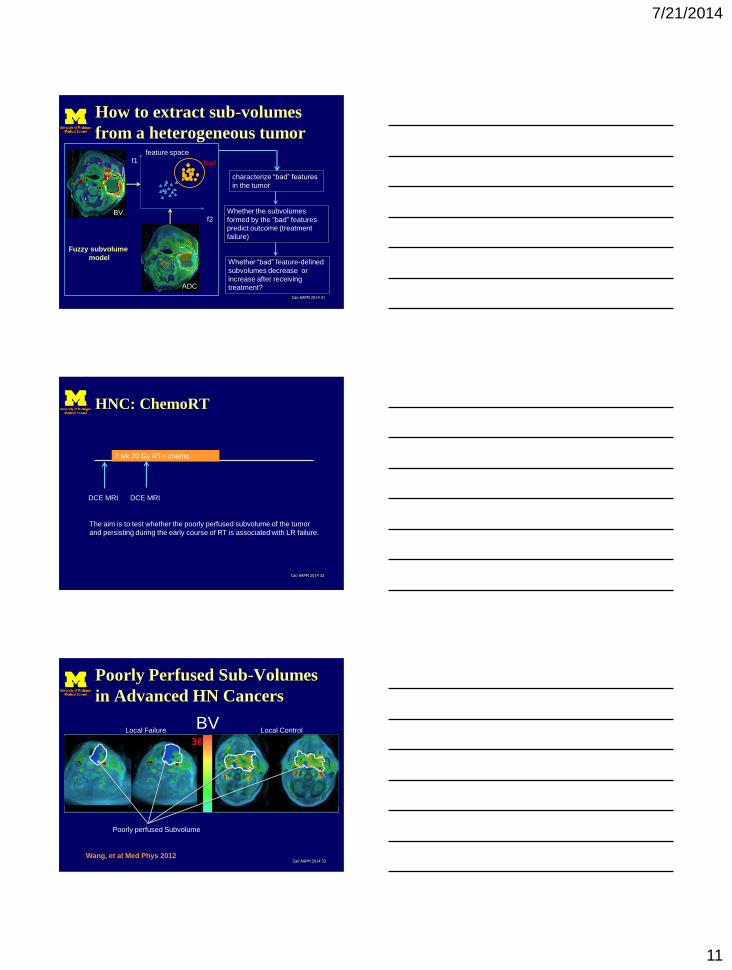
How to extract sub-volumes
from a heterogeneous tumor
Cao AAPM 2014 31
feature space f1
f2 BV
ADC
bad
characterize “bad” features
in the tumor
Whether the subvolumes
formed by the “bad” features
predict outcome (treatment
failure)
Whether “bad” feature-defined
subvolumes decrease or
increase after receiving
treatment?
Fuzzy subvolume
model
HNC: ChemoRT
Cao AAPM 2014 32
7 wk 70 Gy RT+ chemo
DCE MRI DCE MRI
The aim is to test whether the poorly perfused subvolume of the tumor
and persisting during the early course of RT is associated with LR failure.
Poorly Perfused Sub-Volumes
in Advanced HN Cancers
Cao AAPM 2014 33 Wang, et al Med Phys 2012
Local Failure Local Control
Poorly perfused Subvolume
BV
7/21/2014
12
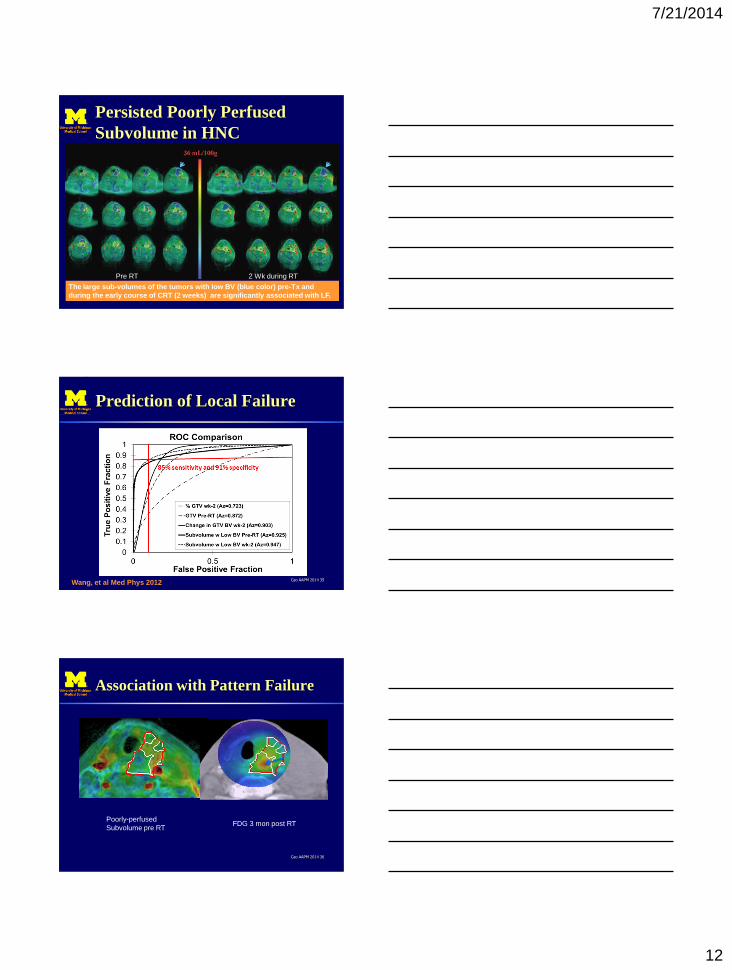
Persisted Poorly Perfused
Subvolume in HNC
Cao ARS 2013 34
Pre RT 2 Wk during RT
The large sub-volumes of the tumors with low BV (blue color) pre-Tx and
during the early course of CRT (2 weeks) are significantly associated with LF.
Prediction of Local Failure
Cao AAPM 2014 35 Wang, et al Med Phys 2012
Association with Pattern Failure
Cao AAPM 2014 36
Poorly-perfused
Subvolume pre RT FDG 3 mon post RT
7/21/2014
13
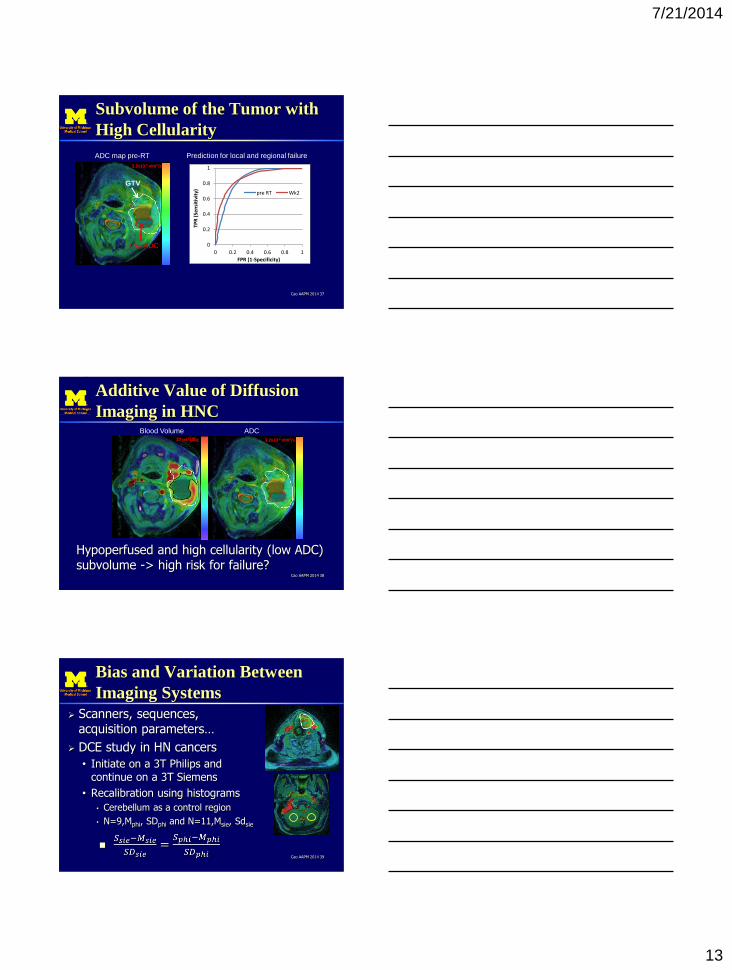
Subvolume of the Tumor with
High Cellularity
Cao AAPM 2014 37
0
0.2
0.4
0.6
0.8
1
0 0.2 0.4 0.6 0.8 1
TPR
(Se
nsi
tivi
ty)
FPR (1-Specificity)
pre RT Wk2
Prediction for local and regional failure
3.2x10⁻³ mm2/s
Low ADC
GTV
ADC map pre-RT
Additive Value of Diffusion
Imaging in HNC
Cao AAPM 2014 38
Hypoperfused and high cellularity (low ADC) subvolume -> high risk for failure?
27 ml/100g 3.2x10⁻³ mm2/s
Blood Volume ADC
Bias and Variation Between
Imaging Systems
Scanners, sequences, acquisition parameters…
DCE study in HN cancers
• Initiate on a 3T Philips and continue on a 3T Siemens
• Recalibration using histograms
• Cerebellum as a control region
• N=9,Mphi, SDphi and N=11,Msie, Sdsie
Cao AAPM 2014 39
7/21/2014
14
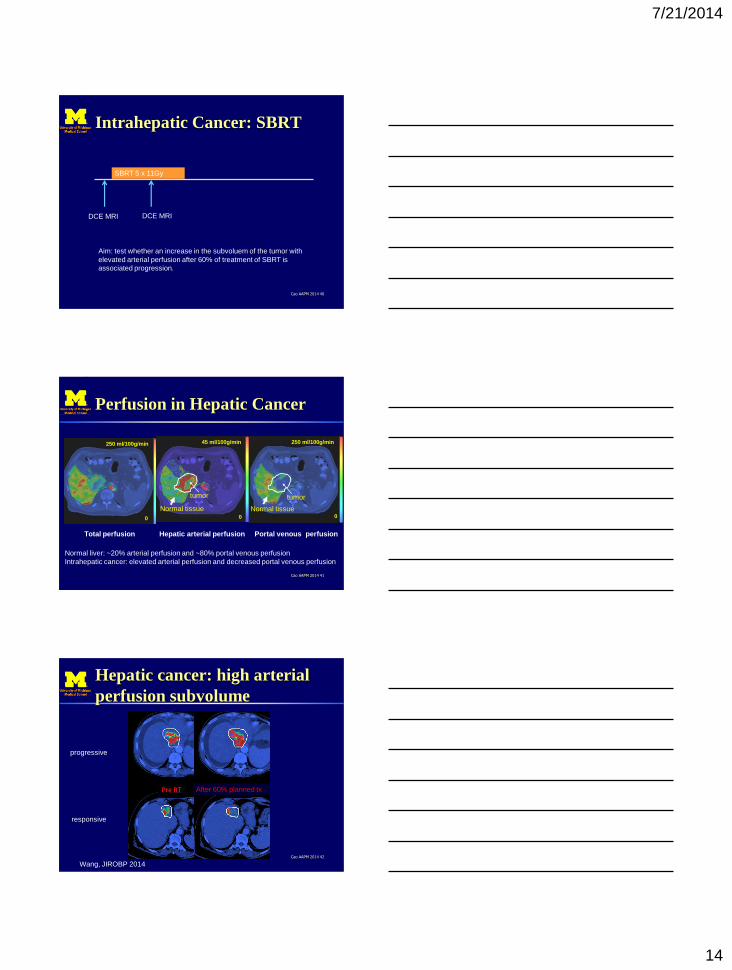
Intrahepatic Cancer: SBRT
Cao AAPM 2014 40
SBRT 5 x 11Gy
DCE MRI DCE MRI
Aim: test whether an increase in the subvoluem of the tumor with
elevated arterial perfusion after 60% of treatment of SBRT is
associated progression.
Perfusion in Hepatic Cancer
Cao AAPM 2014 41
250 ml/100g/min 250 ml/100g/min 45 ml/100g/min
Total perfusion Hepatic arterial perfusion Portal venous perfusion
0
tumor
Normal tissue 0 0
tumor
Normal tissue
Normal liver: ~20% arterial perfusion and ~80% portal venous perfusion
Intrahepatic cancer: elevated arterial perfusion and decreased portal venous perfusion
Hepatic cancer: high arterial
perfusion subvolume
Cao AAPM 2014 42
progressive
responsive
Wang, JIROBP 2014
After 60% planned tx

7/21/2014
15
Sensitivity and Specificity
Cao AAPM 2014 43
Prediction of progression
Summary
Optimize, harmonize and standardize MR image acquisition protocols High quality images
Quantify physiological parameters high repeatability
high sensitivity and specificity
Apply to clinical problems • Algorithms to extract meaningful “features”/metrics
• Statistical and ML models in relating quantitative metrics with clinical endpoints
Cao AAPM 2014 44