Embed Size (px)
Citation preview

Working Paper 2020 June 2020 (Revised May 2021) Research Department https://doi.org/10.24149/wp2020r1
Working papers from the Federal Reserve Bank of Dallas are preliminary drafts circulated for professional comment. The views in this paper are those of the authors and do not necessarily reflect the views of the Federal Reserve Bank of Dallas or the Federal Reserve System. Any errors or omissions are the responsibility of the authors.
Quantitative Easing and Agency MBS Investment and Financing
Choices by Mortgage REITs
W. Scott Frame and Eva Steiner

Quantitative Easing and Agency MBS Investment and Financing Choices by Mortgage REITs*
W. Scott Frame† and Eva Steiner‡
First Draft: June 10, 2020 This Draft: April 27, 2021
Abstract An emerging literature documents a link between central bank quantitative easing (QE) and financial institution credit risk-taking. This paper tests the complementary hypothesis that QE may also affect financial risk-taking. We study Agency MREITs – levered shadow banks that invest in guaranteed U.S. Agency mortgage-backed securities (MBS) and that are principally funded with repo debt. We first show that Agency MREIT asset growth is inversely related to the Federal Reserve’s Agency MBS purchases, reflecting investor portfolio rebalancing. We then document that Agency MREITs increased financial leverage during the later stages of QE, consistent with “reaching for yield” behavior. However, Agency MREITs countered the heightened solvency risk by extending repo maturity and increased hedging of their funding costs to reduce liquidity and interest rate risk. The findings suggest that research linking QE to increased credit risk-taking should account for contemporaneous changes in financing choices and risk management. Keywords: Quantitative Easing, Risk Taking, GSEs, Mortgages, Agency MBS JEL Classifications: E58, G21, G23, G28
*This paper has benefitted from comments by Jose Berrospide, Yongheng Deng, Robert DeYoung (Editor), Stuart Gabriel, Richard Green, Jacob Sagi, Aurel Hizmo, Arito Ono, Rodney Ramcharan, Philip Swagel, Joe Tracy, Emily Williams, John Worth, two anonymous referees, and seminar participants at the Federal Reserve Board, Homer Hoyt Institute, LSU, 2018 Midwest Finance Association Meeting, 2018 ASSA Annual Meeting, 2018 Northern Finance Association Meeting, 2017 AREUEA National Conference, and the 2017 “Unconventional Monetary Policy: Lessons Learned” conference held at the Hong Kong Monetary Authority. We thank Abhijeet Bhalkikar, Manny Dong, and Pam Frisbee for outstanding research assistance; and Ellen Correia Golay and Brett Rose for providing the Federal Reserve data on purchases and holdings of U.S. Treasuries and Agency MBS. The views expressed do not necessarily reflect those of the Federal Reserve Bank of Dallas or any other entities within the Federal Reserve System. †W. Scott Frame, Federal Reserve Bank of Dallas, [email protected] ‡Eva Steiner, Penn State Smeal College of Business, [email protected]

2
1 Introduction
Following the global financial crisis and into the Great Recession, the Federal Reserve reduced its overnight
interest rate effectively to the zero lower bound and engaged in large-scale purchases of long-term U.S. Treasury
and Federal Agency MBS.1 Several empirical studies demonstrate that quantitative easing (QE) lowered long-term
interest rates for U.S. Treasury securities and Agency MBS as intended.2 However, as U.S. monetary policy
accommodation lingered, some policymakers and pundits grew concerned about the emergence of financial
stability risks. For example, former Federal Reserve Chairman Bernanke (2013) noted that “maintaining low
interest rates for too long may create incentives for market participants to take on greater duration or credit risks,
or to employ additional financial leverage,” in an effort to “reach for yield.”3 Consistent with this concern,
Chodorow-Reich (2014), DiMaggio and Kacperczyk (2016), and Choi and Kronlund (2018) provide empirical
evidence of heightened risk taking by U.S. non-bank financial institutions during the Federal Reserve’s QE.4
However, each of these studies focuses exclusively on credit risk-taking in terms of the investment choices made by
money market funds, pension funds, and corporate bond funds.
In this paper, we test the complementary hypothesis that QE influences financial institution risk-taking
through their financing choices. To do so, we study Agency Mortgage REITs (Agency MREITs), which are shadow
banks that focus on investments in mortgage-backed securities (MBS) guaranteed by one of the U.S. government
agencies (Fannie Mae, Freddie Mac, and Ginnie Mae).5 Agency MREIT portfolios are financed by broker-dealers
predominantly using short-term repurchase agreements and with collateral haircuts establishing permissible
leverage. Given their investment focus, Agency MREIT assets are not subject to credit risk. However, these
institutions are exposed to significant solvency, interest rate, and liquidity risks, arising from funding long-term
callable bonds with short-term liabilities. This simple structure allows us to effectively shut off any QE-induced
1 From the start of 2008 through the end of 2017, the Federal Reserve’s balance sheet grew from $0.9 trillion to $4.5
trillion and was then principally comprised of long-term U.S. Treasury notes and bonds ($2.5 trillion) and Federal Agency mortgage-backed securities ($1.8 trillion). Federal Reserve balance sheet information is available weekly from the Federal Reserve Statistical release under https://www.federalreserve.gov/releases/h41/ (H.4.1. Factors Affecting Reserve Balances).
2 See Gagnon, Raskin, Remache, and Sack (2011); Hancock and Passmore (2011); Krishnamurthy and Vissing-Jorgensen (2011); Neely (2012); Hamilton and Wu (2012); D’Amico and King (2013); and Bauer and Rudebusch (2014).
3 While heightened risk taking is seemingly an intended consequence of unconventional monetary policy, recent theoretical research points to it being potentially distorted by agency problems associated with delegated asset management (e.g., Rajan 2005; Feroli, Kashyap, Schoenholtz, and Shin 2014; Acharya and Naqvi 2019; Morris and Shin 2016). Specifically, very low interest rate environments increase asset managers’ sensitivity to relative fund performance, which induces them to take on more risk than would otherwise be the case.
4 This research is part of a broader literature describing a “risk taking channel” of monetary policy, distinct from the interest rate and credit channels (e.g., Adrian and Shin, 2010; Borio and Zhu, 2012). Empirical analyses of bank behavior suggest that they make ex ante riskier loans as monetary policy becomes more accommodative (Jimenez, Ongena, Peydro, and Saurina, 2014; Ioannidou, Ongena, and Peydro, 2015; Dell’Ariccia, Leaven, and Suarez, 2017; Bonfim and Soares, 2018). Related research finds that accommodative monetary policy is associated with tighter yield spreads for U.S. corporate loans – particularly for the riskiest borrowers (Delis, Hasan, and Mylolonidis, 2017; Paligorova and Santos, 2017).
5 See Pellerin, Sabol, and Walter (2013) for a descriptive overview of Agency MREITs.

3
response in terms of credit risk-taking and conduct a clean test of the hypothesis that financial institutions respond
to QE through their capital structure choices.
Agency MREITs experienced a surge in total assets from $79.2 billion to $363.5 billion (equivalent to 459%
growth) during QE1 and QE2, followed by a sharp decline during QE3 and Tapering. During all QE regimes,
Agency MREITs issued and repurchased stock to adjust the size of their balance sheets to market conditions. This
behavior demonstrates how the Federal Reserve’s activity in the Agency MBS market affected investment
opportunities for Agency MREITs. Looking ahead, as the central bank withdraws from the Agency MBS market,
Agency MREITs may emerge as an important investor class. However, the U.S. Financial Stability Oversight
Council (2013) warns about financial stability risks emanating from these institutions, given their reliance on
maturity transformation without access to government liquidity backstops. This current policy concern is an
additional motivating factor for our analysis of the financial risk profile of Agency MREITs.
To identify the effects of QE on institution-level outcomes, we employ a cross-sectional comparison between
Agency MREITs and Non-Agency MREITs. Non-Agency MREITs constitute a natural control group since they
are subject to the same statutory requirements as Agency MREITs but hold a broader portfolio of mortgage-related
assets. As a result, we expect Agency MREITs to be more sensitive to the Federal Reserve’s posture in the Agency
MBS market than Non-Agency MREITs. Our empirical approach is similar to that taken in Rodnyansky and
Darmouni (2017) and Chakraborty, Goldstein, and MacKinlay (2020), both of whom examine lending responses
to QE across U.S. commercial banks with differential exposure to the Agency MBS market.
We begin by conducting a high-frequency event study of equity market reactions by Agency and Non-Agency
MREITs to QE-related central bank communications. Federal Reserve announcements of large-scale purchases of
Treasury and Agency MBS during QE1 had a positive cumulative effect on both types of MREITs, reflecting an
increase in legacy asset values that raised net worth. We further show that Agency MREITs benefitted relatively
less from these announcements than Non-Agency MREITs (2.2% cumulative increase in equity prices for Agency
MREITs versus 4.0% for Non-Agency MREITs), likely owing to the negative convexity profile of Agency MBS.
We document that the announcements regarding QE2, which was limited to Treasury purchases, benefitted Agency
MREITs and Non-Agency MREITs to a similar degree. We also find that Agency MREITs reacted significantly
more negatively than Non-Agency MREITs to the announcements around the so-called Taper Tantrum (–2.5%
versus –1.1% cumulatively). These communications unanchored market expectations about future policy rates
previously tied down by the Federal Reserve’s forward guidance. Agency MREITs likely showed a stronger reaction
to the prospect of rising interest rates due to their heavy reliance on short-term debt. Our results expand on prior
evidence for life insurers, banks, and the stock market presented in Chodorow-Reich (2014).
Next, we turn to an analysis of Agency MREIT asset growth, equity issuance, stock repurchases, and stock
returns over the 2005:Q1—2015:Q4 period. Conditioning on macroeconomic fundamentals, institution
characteristics, and Federal Reserve purchase activity in the Treasury market, we find that Agency MREIT asset
growth responded negatively to the Federal Reserve’s quarterly purchase share of newly issued Agency MBS during

4
that time. We estimate that a one-standard deviation increase in the Federal Reserve’s purchase share of Agency
MBS was associated with a reduction in Agency MREIT asset growth by 3.6 percentage points per quarter, or
approximately 40% of the unconditional mean. These results are predominantly driven by the central banks’
Agency MBS purchases during the Tapering period. We document consistent evidence for Agency MREIT equity
issuance (share repurchases), reflecting investor portfolio rebalancing toward (away from) Agency MREITs in
response to variation in their investment opportunities. We also show how this variation in Agency MREIT
investment opportunities affects their stock returns. Collectively, our results show how the central banks’ activity
in the Agency MBS market crowds out private-sector investment and induces portfolio rebalancing by equity
investors in Agency MREITs.
We then test whether Agency MREITs altered their financing choices in response to QE. We first show that
the Federal Reserve’s purchase share of Agency MBS during QE3 was associated with a significant decline in
Agency MREITs’ equity-to-assets ratio (i.e., increased leverage).6 In economic terms, our estimates suggest that a
one-standard deviation increase in the Federal Reserve’s purchase share of Agency MBS during that time was
associated with a decline in the equity-to-assets ratio of 1.7 percentage points, or more than 12% of the
unconditional mean. This finding is consistent with “reaching for yield” behavior. However, we also show that
Agency MREITs reduced their share of very short-term repo debt (with less than 30 days’ maturity) to reduce
liquidity risk exposure and increased their use of derivatives to hedge interest rate risk in response the central banks’
Agency MBS purchases later in the QE cycle. Taken together, our results represent novel evidence on the effect
of QE on financial institution risk-taking in terms of their capital structure choices. Our findings also highlight
the role of portfolio rebalancing as a possible mitigant to observed increases in financial institution credit risk-
taking in response to QE identified in prior research.
We contribute to the emerging literature on QE-induced risk-taking by financial institutions. Chodorow-Reich
(2014) provides evidence that money market funds with higher expenses reached for higher returns between 2009
and 2011; and that some private defined-benefit pension funds increased their risk taking around the same time.
DiMaggio and Kacperczyk (2017) find that money market funds invested in riskier asset classes during QE. Choi
and Kronlund (2018) study corporate bond funds and find that these institutions generate higher returns and attract
more inflows when they reach for yield during periods of low interest rates, although these yields tend to be
negative on a risk-adjusted basis. We find that Agency MREITs increased their leverage in response to variation in
the Federal Reserve’s purchase share of Agency MBS in the later stages of QE. Our results thus complement the
existing literature, which focuses exclusively on credit risk-taking, by providing novel evidence for QE-induced
risk-taking by financial institutions through their capital structure and risk management choices.
6 Importantly, we check in a robustness test that this result holds after controlling for cash holdings (a measure of internal
liquidity), total accumulated other comprehensive income (an external source of variation in equity), fixed-rate Agency MBS holdings (a proxy for interest rate risk exposure), and MREIT use of derivatives (a measure of interest rate risk hedging).

5
We also contribute to the recent literature linking QE to the investment decisions of financial institutions.
Joyce et al. (2017) report that U.K. insurance companies and pension funds shifted allocations from government
bonds to corporate bonds in response to the Bank of England’s QE. Chakraborty, Goldstein, and MacKinlay
(2020) find that U.S. banks with a high portfolio concentration of Agency MBS increased their mortgage
originations and decreased their holdings of commercial loans (relative to other banks with low Agency MBS
concentrations) in response to the Federal Reserve’s Agency MBS purchase activity. Rodnyansky and Darmouni
(2017) show that U.S. commercial banks with greater Agency MBS holdings expanded their mortgage lending (and
ultimately total lending) during QE1 and QE3. Di Maggio, Kermani, and Palmer (2018) present evidence of a
relationship between QE and mortgage refinancing activity for loans eligible for purchase by the Federal Reserve.
Kandrac and Schlusche (2017) link increased central bank reserves to expanded lending by U.S banks during QE.
We illustrate how the Federal Reserve’s Agency MBS purchases altered the investment opportunities of Agency
MREITs. We expand on this prior work by showing that the central banks’ purchase activity was positively related
to Agency MREIT share repurchases, with investors redeeming shares to rebalance portfolios and deploy capital
elsewhere. Our results also complement those by DiMaggio and Kacperczyk (2016) for the money fund industry.
Our study further relates to the debate on the channels through which QE influences long-term interest rates.7
The “signaling” and “portfolio balance” channels are the most widely discussed. Under the signaling channel large-
scale asset purchases by the central bank act as a commitment device to a low interest rate policy, which lowers
the expected level of future short-term interest rates, similar to forward guidance (e.g., Clouse et. al, 2003;
Eggertsson and Woodford, 2003; Bauer and Rudebusch, 2014). Under the portfolio balance channel, large-scale
asset purchases reduce the amount of long-term, low-risk bonds in private-sector portfolios and thus lower the
term (risk) premium in long duration assets (e.g., Bernanke, 2010). Most recent studies into the response of various
types of financial institutions to QE are inherently about the portfolio balance channel. The evidence we present
for central bank activity in the Agency MBS market crowding out private investment is consistent with this view.
Lastly, our analysis speaks to the future composition of Agency MBS investors. The Federal Reserve became
the largest holder of Agency MBS after QE but has launched a balance sheet normalization plan to reduce its
footprint in this market. Prior to the global financial crisis, Fannie Mae and Freddie Mac had collectively been the
largest holders of Agency MBS, although their role markedly receded after the two institutions were placed into
federal conservatorship.8 This creates an opening for private-sector, non-bank investment in Agency MBS. Our
results documenting the rapid expansion of Agency MREITs suggest that these institutions could become a
prominent investor class in the future and may assume the role of the marginal price-setting investor.9
7 See Krishnamurthy and Vissing Jorgensen (2011) for an overview of the various channels proposed in the literature. 8 The “retained portfolios” at Fannie Mae and Freddie Mac provided little social value (Passmore 2005), led to a build-
up of systemic risk (Eisenbeis, Frame, and Wall, 2007), and were a primary factor in the timing of the federal takeover (Frame, Fuster, Tracy, and Vickery, 2015). Hence, most reform proposals would place permanent limitations on such holdings.
9 Gabaix, Krishnamurthy, and Vigneron (2007) show that the marginal investor in the Agency MBS market is likely to be a specialized arbitrageur, not a diversified representative investor as hypothesized by traditional asset pricing models.
6
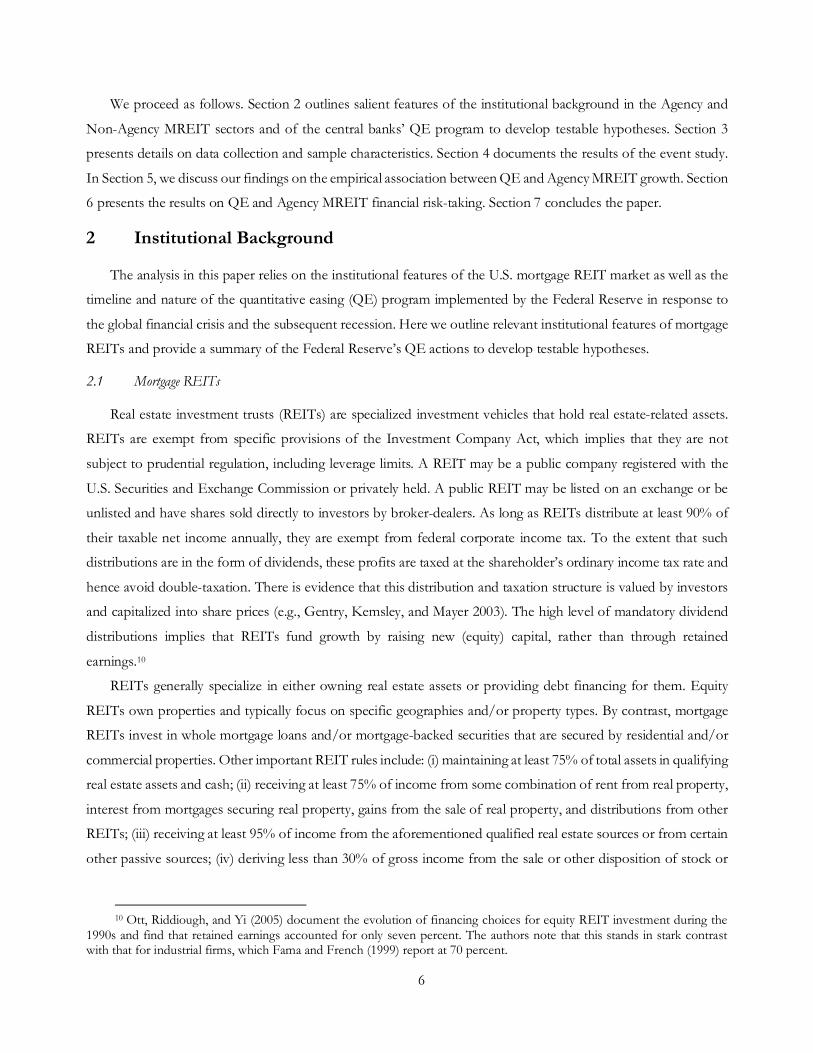
We proceed as follows. Section 2 outlines salient features of the institutional background in the Agency and
Non-Agency MREIT sectors and of the central banks’ QE program to develop testable hypotheses. Section 3
presents details on data collection and sample characteristics. Section 4 documents the results of the event study.
In Section 5, we discuss our findings on the empirical association between QE and Agency MREIT growth. Section
6 presents the results on QE and Agency MREIT financial risk-taking. Section 7 concludes the paper.
2 Institutional Background
The analysis in this paper relies on the institutional features of the U.S. mortgage REIT market as well as the
timeline and nature of the quantitative easing (QE) program implemented by the Federal Reserve in response to
the global financial crisis and the subsequent recession. Here we outline relevant institutional features of mortgage
REITs and provide a summary of the Federal Reserve’s QE actions to develop testable hypotheses.
2.1 Mortgage REITs
Real estate investment trusts (REITs) are specialized investment vehicles that hold real estate-related assets.
REITs are exempt from specific provisions of the Investment Company Act, which implies that they are not
subject to prudential regulation, including leverage limits. A REIT may be a public company registered with the
U.S. Securities and Exchange Commission or privately held. A public REIT may be listed on an exchange or be
unlisted and have shares sold directly to investors by broker-dealers. As long as REITs distribute at least 90% of
their taxable net income annually, they are exempt from federal corporate income tax. To the extent that such
distributions are in the form of dividends, these profits are taxed at the shareholder’s ordinary income tax rate and
hence avoid double-taxation. There is evidence that this distribution and taxation structure is valued by investors
and capitalized into share prices (e.g., Gentry, Kemsley, and Mayer 2003). The high level of mandatory dividend
distributions implies that REITs fund growth by raising new (equity) capital, rather than through retained
earnings.10
REITs generally specialize in either owning real estate assets or providing debt financing for them. Equity
REITs own properties and typically focus on specific geographies and/or property types. By contrast, mortgage
REITs invest in whole mortgage loans and/or mortgage-backed securities that are secured by residential and/or
commercial properties. Other important REIT rules include: (i) maintaining at least 75% of total assets in qualifying
real estate assets and cash; (ii) receiving at least 75% of income from some combination of rent from real property,
interest from mortgages securing real property, gains from the sale of real property, and distributions from other
REITs; (iii) receiving at least 95% of income from the aforementioned qualified real estate sources or from certain
other passive sources; (iv) deriving less than 30% of gross income from the sale or other disposition of stock or
10 Ott, Riddiough, and Yi (2005) document the evolution of financing choices for equity REIT investment during the
1990s and find that retained earnings accounted for only seven percent. The authors note that this stands in stark contrast with that for industrial firms, which Fama and French (1999) report at 70 percent.

7
securities held for less than six months, and real property held for less than four years; and (v) issue transferrable
shares held by at least 100 individuals with no five or fewer owning more than 50% during the last half of the
taxable year.
As shown in Figure 1, based on the Federal Reserve’s Flow of Funds data, a large share of MREIT investment
is in Agency MBS guaranteed by either Fannie Mae, Freddie Mac, or Ginnie Mae. Fannie Mae and Freddie Mac
are U.S. government-sponsored enterprises (GSEs) that securitize “conforming” residential mortgages. Since the
financial crisis these two institutions have enjoyed “effective” federal backing of all obligations (see, e.g., Frame,
Fuster, Tracy, and Vickery, 2015). Ginnie Mae is a government agency within the U.S. Department of Housing
and Urban Development (HUD), created exclusively to securitize government-insured mortgages. All three
institutions provide blanket guarantees on their MBS in exchange for guarantee fees (i.e., insurance premiums)
from mortgage originators. While Agency MBS are viewed as effectively having no credit risk, these instruments
are very long-term and subject to significant prepayment risk arising from borrower refinancing due to changes in
interest rates and routine housing turnover.
[Figure 1 about here.]
Using institution-level data from S&P Global, Panel A of Figure 2 shows that total MREIT investment in
Agency MBS is concentrated in a subset of specialized MREITs. These so-called Agency MREITs are identified
as holding, on average, at least 50% of total assets in Agency MBS. Agency MREITs’ actual portfolio shares average
90%. During the early 2000s, there were only three Agency MREITs of note: Annaly Capital Management,
Anworth Mortgage Asset Corporation, and Capstead Mortgage Corporation. Following the onset of the global
financial crisis, as many as 14 Agency MREITs were in operation (Panel B).
[Figure 2 about here.]
Agency MREITs grew markedly during the Federal Reserve’s QE programs. This dramatic expansion, coupled
with their potentially fragile business model relying on little equity and large amounts of (short-term) repo debt,
caught the attention of the newly created Financial Stability Oversight Council in 2013. Policymakers were
concerned about the vulnerability of these shadow banks to sharp increases in interest rates that would erode the
value of their assets, potentially resulting in a run on their short-term liabilities and a large-scale sell-off in the
Agency MBS market. Despite these conjectures, a systematic empirical analysis of Agency MREIT growth and risk
taking in the context of QE is absent from the literature. This issue may be of ongoing policy interest as the central
bank exits the Agency MBS market under its “portfolio normalization plan.” The recent evidence of rapid Agency
MREIT expansion suggests that these institutions could play a significant role in the Agency MBS market going
forward, especially given the post-conservatorship shrinkage of such holdings by Fannie Mae and Freddie Mac.

8
2.2 Timeline and Nature of the Federal Reserve’s Quantitative Easing Program
The first round of quantitative easing (QE1) implemented by the Federal Reserve was announced in 2008:Q4
and ran through 2010:Q1. It included the purchase of $1.25 trillion in Agency MBS, $300 billion of U.S. Treasury
securities, and $200 billion of Agency debt. QE2 was a short-lived program (2010:Q4—2011:Q2) that involved
the central bank purchasing an additional $600 billion in U.S. Treasury securities but no more Agency MBS. This
was followed by the Maturity Extension Program (2011:Q3—2012:Q4), which included the purchase of another
$400 billion in very long-term U.S. Treasury securities (6–30 years) and the sale of similar amounts of short-term
securities in an effort to “twist” the yield curve. The Federal Reserve also began principal reinvestments of proceeds
from their Agency MBS portfolios back into similar assets. During this period, the Federal Reserve began ratcheting
up its use of “forward guidance” to anchor expectations of the very short-term policy rate at the effective zero
lower bound for up to two years out. QE3 (2012:Q3—2013:Q4) saw a renewal of Federal Reserve purchases of
Agency MBS and the continuation of long-term U.S. Treasury purchases. During the Tapering regime (2013:Q4—
2014:Q3), the Federal Reserve continued, but gradually slowed, the pace of long-term asset purchases.11
The Federal Reserve’s large-scale purchases of Agency MBS during QE was novel. Prior to the global financial
crisis, Fannie Mae and Freddie Mac were large holders of Agency MBS, although their role significantly receded
after the two institutions were placed into federal conservatorship.12 Figure 3 presents the Agency MBS purchases
completed by the Federal Reserve and Fannie Mae/Freddie Mac as a share of newly issued securities (Panel A)
and Federal Reserve and Fannie Mae/Freddie Mac Agency MBS holdings as a share of the total volume of
securities outstanding (Panel B). Panel A of Figure 3 shows that the Federal Reserve absorbed 86% of new issuance
in 2009:Q1 before halting purchases one year later. The central bank renewed its Agency MBS purchases in
2011:Q4. This was initially limited to related principal reinvestments to maintain portfolio size, but later expanded
during QE3. Purchase amounts subsequently declined during the Tapering period, starting in 2013:Q4. Fannie
Mae and Freddie Mac collectively ramped up purchases of Agency MBS during 2008, before reducing them during
QE1. Thereafter, the two GSEs together maintained a mean quarterly purchase share of Agency MBS around 10%
of new issuance. Panel B of Figure 3 shows the share of Agency MBS outstanding held by the Federal Reserve
and Fannie Mae/Freddie Mac. Over the 2008—2015 period, the central bank increased its share from zero to over
30%. The GSEs’ share of aggregate Agency MBS investment declined from about 16% to 4%, as the terms of the
U.S. Treasury’s financing for the conservatorships required that these portfolios shrink.
[Figure 3 about here.]
11 Appendix A provides a comprehensive timeline of the Federal Reserve’s QE program, based on the published minutes
from the Federal Open Market Committee meetings. 12 Holdings by foreign central banks also declined significantly with the onset of the crisis.

9
2.3 Hypothesis Development
Our analysis explores Agency MREIT growth and financial risk-taking during QE. We believe that Agency
and Non-Agency MREITs provide a useful cross-sectional comparison since Non-Agency MREITs are subject to
the same statutory requirements as are Agency MREITs, but they invest in a broader range of mortgage-related
assets. The Federal Reserve’s purchases in the Agency MBS market are intended to reduce mortgage interest rates
and curtail investment opportunities for other investors as per the QE “portfolio balance channel.” These
dynamics may influence Agency MREIT growth and financial risk-taking.
Agency MBS can be thought of as a combination of a long-term government bond coupled with prepayment
options held by individual homeowners whose mortgages underlie the security. Like other callable debt, the price-
yield relationship of Agency MBS is negatively convex. For example, the value of the bond rises as interest rates
fall, but this gain is muted some by the fact that the lower interest rates increase the likelihood of mortgage
prepayment. More concretely, consider the experience of Agency MREITs in 2009 with QE1. The policy
announcement would have resulted in market value gains to their portfolios. But as refinancing-related
unscheduled principal began arriving thereafter, these specialized investors needed to buy new Agency MBS at
lower rates (or return cash to investors).
Given Agency MREITs’ singular investment focus, we expect their growth should be negatively related to the
depth of Agency MBS purchase activity by the Federal Reserve during QE1, QE3, and the Tapering. (Conversely,
we would expect Agency MREITs to grow significantly during QE2 when the central bank halted purchases.)
Furthermore, given Agency MREITs’ investment specialization, we expect their asset growth rates to be more
sensitive to the Federal Reserve’s posture in the Agency MBS market than their Non-Agency counterparts.
Central bank asset purchases act to reduce long-term interest rates, flatten the yield curve, and thus compress
intermediation margins. In order to maintain target returns, investors engaged in long-short carry trades would
naturally attempt to lower their cost of capital by increasing leverage and/or increasing their duration gap by
shortening debt maturity and reducing hedging activity. For Agency MREITs, we expect this behavior to be
especially pronounced during the period in which the Federal Reserve is purchasing a large share of new Agency
MBS issuance and hence limiting Agency MREIT growth opportunities.
3 Data
Our primary data source is S&P Global, which includes quarterly information about MREIT balance sheets,
income statements, and capital market activities. The study period is 2005:Q1—2015:Q4. We start in 2005 due to
data limitations but lose little relevant information as there were only three Agency MREITs prior to that year.
For each MREIT in S&P Global, we obtain quarterly financial reporting data for total assets, total Agency
MBS, total cash and cash equivalents, total equity, total repo debt, repo debt due in 0-30 days, and total accumulated
other comprehensive. We also collect data on the number of shares outstanding, equity issuance, share repurchases,
stock returns, and the share price at the end of each quarter. We further obtain information on. Finally, we hand-

10
collect quarterly data on derivative positions for interest rate swaps and swaptions from MREIT 10-K and 10-Q
reports. As these variables are not required reporting items, this information is only available for a sub-set of
institutions.
We identify Agency MREITs by computing the ratio of Agency MBS to total assets for each institution-quarter
over the study period and classify institutions as Agency MREITs if that ratio exceeds 50% on average. Our results
are robust to defining Agency MREITs based on a range of alternative threshold values.
Based on the data collected, we construct the following set of institution characteristics. Total Assets is the book
value of total assets, in $ billion. Growth in Assets is the quarterly rate of growth in total assets. Agency MBS/Assets
is the total amount of Agency MBS held, scaled by total assets. Issued Equity is an indicator that takes the value of
one if an institution issued equity in a given quarter. Amount Issued is the total amount of equity issued in a given
quarter, scaled by total assets at the beginning of the quarter. We define Repurchased Shares as an indicator that takes
the value of one if an institution repurchased shares in a given quarter. Number Repurchased is the number of shares
repurchased in a given quarter, scaled by the number of shares outstanding at the beginning of the quarter. Market-
to-Book Value is the ratio of the market value of equity, obtained as the product of the number of shares outstanding
multiplied by the end-of-quarter share price, scaled by the book value of equity. We define Equity/Assets as a proxy
for institution leverage using the ratio of book equity to total assets. AOCI/Assets is the ratio of total accumulated
other comprehensive income to total assets. Cash/Assets is the ratio of cash and cash-equivalent securities to total
assets. Repo Debt/Assets is the ratio of repo debt to total assets. We also consider institution exposure to short-term
repo, proxied by the ratio of repo debt maturing within 0-30 days to total repo, and denoted Repo (0-30)/Total Repo.
We proxy for interest rate risk hedging activity using the ratio of swaps plus swaptions to total repurchase
agreements, or Derivatives/Total Repo. Total Return is the quarterly total return on the stock of the MREITs in our
sample.
We further collect data for three interest rate variables that capture the principal drivers of the profitability of
Agency MBS investment. The 3-month and 10-year constant maturity Treasury rates are obtained from the Federal
Reserve Bank of St. Louis. Based on those rates, we construct measures of the level (3-Month CMT) and slope of
the U.S. Treasury yield curve (10-year CMT less 3-month CMT, denoted CMT Term Structure). The option-adjusted
mortgage spread (OAS) measures the attractiveness of Agency MBS investment relative to long-term Treasury
bonds. We use Bloomberg Barclay’s US MBS Fixed Rate Average OAS as a proxy.13 We also collect data for two
variables that are related to the credit-sensitive mortgage investments held by Non-Agency MREITs. The first is
the quarterly spread between Moody’s Seasoned Baa Corporate Bond yield and the yield on the 10-year CMT
(Credit Spread). The second is the quarterly growth rate in the Case-Shiller HPI.
13 The mortgages underlying Agency MBS all have an embedded continuous prepayment option, whose value increases
in the volatility of mortgage rates. The OAS measures the yield spread of the MBS after adjusting for the estimated value of this option. Ideally, one would want to observe an institution-quarter panel of security holdings and collect the related OAS to compute an institution-specific portfolio OAS. Such information is not available for MREITs, which don’t file form 13-f.

11
We supplement the macroeconomic data outlined above with quarterly information from the Federal Reserve
Bank of New York on the central banks’ actual quarterly purchases and holdings of Agency MBS and Treasury
securities in the course of the QE program, as well as the total amount of these securities issued and outstanding.
We compute the Fed MBS (Treasury) Purchase Share as the amount of MBS (Treasury) purchases relative to MBS
(Treasury securities) issued. Lastly, we compute the Fed MBS (Treasury) Holdings Share as the amount of MBS
(Treasury securities) held relative to total MBS (Treasury securities) outstanding.
3.1 Descriptive Statistics
Table 1 presents sample statistics for 1,002 institution-quarter observations from our final sample of 15 Agency
MREITs and 35 Non-Agency MREITs over the 2005:Q1—2015:Q4 period. Agency MREITs are larger on average
than Non-Agency MREITs ($18.0 billion versus $4.3 billion in total assets). Agency MBS account for 84% of
Agency MREIT total assets but only 6% for Non-Agency MREITs. Agency MREITs issue equity in 26% of the
quarters, with the mean amount issued per quarter of about 9% of lagged total assets. For Non-Agency MREITs,
the corresponding statistics are 14% and 6%, respectively. Agency MREITs also repurchase shares more frequently
than Non-Agency MREITs (in 22% of quarters versus 12%) and repurchase more shares (0.4% of shares
outstanding versus 0.2%). The mean equity-to-assets ratio over the study period is 14% for Agency MREITs,
compared to 29% for Non-Agency MREITs. Agency MREITs maintain smaller cash buffers than their Non-
Agency counterparts on average (2% versus 4%). For Agency MREITs, the average share of repo debt to total
assets is 78%, while the short-term repo debt (0-30 days) as a share of total repo debt is 47%. Non-Agency MREITs
utilize repo debt to a smaller extent (16% of total assets). The sub-sample of institutions with available data suggests
that Agency MREITs are more intensive users of interest rate derivatives (swaps and swaptions). Agency MREITs
outperformed Non-Agency MREITs in terms of quarterly stock returns (mean of 2.3% versus 0.3%, respectively).
[Table 1 about here.]
Table 1 also summarizes key macroeconomic variables. The average 3-month constant maturity Treasury rate
is 1%. The slope of the term structure averages 2%, and the mean option-adjusted mortgage spread is 0.49%. The
Federal Reserve’s quarterly mean share of Agency MBS purchases to newly issued securities is 25% but ranges
from 0% to 86%. The corresponding mean share of quarterly Treasury purchases is 9%, ranging from 0% to 28%.
3.2 Time Series Trends in Agency versus Non-Agency Mortgage REIT Characteristics
We next present aggregate time series trends for key MREIT attributes relating to their asset growth rates and
capital structure choices to establish the assumption of common trends in these outcome variables across Agency
and Non-Agency MREITs prior to the inception of the Federal Reserve’s QE program.
Figure 4 presents quarterly data on Agency MBS holdings for both types of MREITs. In the early years of the
study period, Agency MREITs slowly increased their holdings, while those at non-Agency MREITs were flat.

12
However, after the onset of the financial crisis, Agency MREITs rapidly expanded their Agency MBS holdings.
Between 2008:Q4 and 2012:Q3, these holdings rose from $76.2 to $337.6 billion; and Agency MREITs share of
the market increased from 1.5% to 6.4%. These amounts and shares decline thereafter. By contrast, the collective
holdings of Non-Agency MREITs never exceed $50 billion, which corresponds to less than 1% of the Agency
MBS market. In sum, the graphical evidence discussed here suggests that growth in total asset holdings is similar
across Agency and Non-Agency MREITs prior to the Federal Reserve’s QE program and diverged thereafter.
[Figure 4 about here.]
Given that REITs must distribute at least 90% of their taxable net income annually to remain exempt from
federal corporate income tax, significant asset growth requires new equity issuance. Panel A of Figure 5 presents
quarterly equity issuance data for Agency MREITs and Non-Agency MREITs. The figure shows low aggregate
levels of equity issuance for both types of MREITs prior to QE, with quarterly issuance volumes rarely reaching
$1 billion. However, after the inception of QE we see diverging patterns in equity issuance between Agency and
Non-Agency MREITs. New equity issuance by Agency MREITs is clustered between 2010 and 2012, peaking at
$6 billion in 2010:Q4, when the Federal Reserve starts QE2. The Agency MREIT equity issuance pattern
documented here aligns with the asset growth pattern described above. By contrast, Non-Agency MREIT quarterly
equity issuance exhibits little correlation with the Federal Reserve’s stance in the Agency MBS market throughout
the different QE regimes.
Panel B of Figure 5 presents the aggregate equity-to-assets ratio for Agency and Non-Agency MREITs. Agency
MREITs hold approximately 8% equity in the early years of the study period, but this ratio subsequently increases
and to between 12% and 15% after the start of QE. Leverage for Non-Agency MREITs is different. Their share
of equity financing drifts down from 20% to 10% prior to the financial crisis, before reaching a new level of over
40% thereafter. These patterns suggest that the total leverage levels of these institutions exhibit relatively minor
differences prior to the inception of the Federal Reserve’s QE program but diverge markedly thereafter.
[Figure 5 about here.]
Figure 6 illustrates the differences in the debt structures of Agency and Non-Agency MREITs. Panel A shows
that repurchase agreements are the dominant form of Agency MREIT debt financing (80% of total assets since
the early 2000s). Non-Agency MREITs rely significantly less on repo financing, averaging less than 10% of total
assets in the early years of the study period. Despite the difference in levels, the repo debt holdings of Agency and
Non-Agency MREITs exhibit similar trends prior to the Federal Reserve’s QE program. However, the time series
patterns in repo debt holdings diverge some across the two institution types after the inception of QE. Agency
MREIT repo debt holdings decline from a peak of 85% of total assets to 72% of total assets after the Federal
Reserve initiates QE1 and remained below 80% of total assets until the end of the study period. By contrast, Non-

13
Agency MREIT repo debt holdings increase from approximately 3% of total assets in 2008:Q4 and end the sample
period at 10% of total assets. Panel B shows the use of short-term repo debt (< 30 days) as a share of total repo
debt outstanding is consistently much higher and more volatile for Agency MREITs.
[Figure 6 about here.]
The graphical evidence provided above suggests that the time-series of institution asset growth and capital
structure exhibit similar patterns across Agency and Non-Agency MREITs prior to the inception of the Federal
Reserve’s QE program, but diverge thereafter. This supports the assumption of common trends across the two
types of institutions.
4 Event Study
We begin our empirical analysis by conducting a high-frequency event study of the equity market reactions by
Agency and Non-Agency MREITs to the 14 QE announcements identified by Chodorow-Reich (2014). This
analysis has two goals. The first is to illustrate that market participants expected MREITs to be materially affected
by the Federal Reserve’s QE and that MREIT equity prices reacted accordingly. The second goal is to document
the similarities and differences in the reactions across Agency and Non-Agency MREITs, the latter of which we
use as control group in our subsequent analysis of Agency MREIT growth and risk-taking in response to QE.
Following Chodorow-Reich (2014), we obtain high-frequency, tick-by-tick equity price data from TAQ to
construct 5-minute average trading prices from 7 to 2 minutes before QE-related announcements to 18 to 23
minutes after. The rationale is to identify a causal relationship between monetary policy surprises and equity market
movements in a manner that trades off the need for a narrow enough window such that other aggregate shocks
do not influence asset prices, but one long enough so the market can plausibly digest the new information.
Table 2 presents the results for both types of MREITs. For reference, we also report the corresponding results
for insurance companies, commercial banks, and the broader market from Chodorow-Reich (2014, Table 2). Our
estimates show that both types of MREITs reacted to most QE announcements but with significant differences
between Agency and Non-Agency MREITs. During QE1 and QE2, Agency MREITs generally reacted positively
and in-line with the broader market, although the reaction was muted relative to Non-Agency MREITs, life
insurers, and banks. This evidence is consistent with QE increasing legacy asset values, but with fixed-rate Agency
MBS benefitting less due to negative convexity. The two forward guidance announcements during QE2 were
perceived more positively for Agency MREITs than for the other financial institutions. This result is likely due to
the perception that the cost of Agency MREIT short-term repo liabilities would remain low for a considerable
period of time. Agency MREITs reacted more strongly than Non-Agency MREITs and other financial institutions
to the announcements around QE3. The announcements in May and June of 2013, related to the so-called Taper
Tantrum, were negative for Agency MREITs by unanchored expectations about their funding costs previously tied
down by forward guidance. This result is reversed in the September 2013 statement, which delayed tapering.

14
[Table 2 about here.]
This event study serves as additional background for our main empirical analysis to follow. The results suggest
that: (i) market participants clearly expected MREITs to be affected by QE; and (ii) that there are sufficient
similarities, but also important differences, in the equity market reactions across Agency and Non-Agency MREITs
to these announcements. This analysis shows that there is some causal impact from the Federal Reserve’s QE on
MREITs and that Non-Agency MREITs provide a suitable control group for our analysis of Agency MREITs.
5 QE and Agency MREIT Growth
5.1 Empirical Approach
To identify the effects of QE on Agency MREIT asset growth we compare them with Non-Agency MREITs.
As illustrated by the time-series trends analysis in Section 3.2 and the event study in Section 4, Non-Agency
MREITs constitute a natural control group, since they are subject to the same statutory requirements as Agency
MREITs but hold a broader portfolio of mortgage-related debt. Our approach of comparing two types of
institutions with differential exposure to the Agency MBS market is similar to Rodnyansky and Darmouni (2017)
and Chakraborty, Goldstein and MacKinlay (2020), who analyze differences in commercial bank lending responses
to QE by comparing banks with high versus low Agency MBS portfolio holding shares.
We begin our analysis with the regression model for MREIT asset growth shown in Eq. (1):
𝐴𝐴𝐴𝐴𝐴𝐴𝐴𝐴𝐴𝐴 𝐺𝐺𝐺𝐺𝐺𝐺𝐺𝐺𝐴𝐴ℎ𝑖𝑖,𝑡𝑡 = 𝛽𝛽1𝐴𝐴𝐴𝐴𝐴𝐴𝐴𝐴𝐴𝐴𝐴𝐴 𝑀𝑀𝑀𝑀𝑀𝑀𝑀𝑀𝑀𝑀𝑖𝑖 + 𝛽𝛽2𝐹𝐹𝐴𝐴𝐹𝐹 𝑀𝑀𝑀𝑀𝑀𝑀 𝑃𝑃𝑃𝑃𝐺𝐺𝐴𝐴ℎ𝑎𝑎𝐴𝐴𝐴𝐴 𝑀𝑀ℎ𝑎𝑎𝐺𝐺𝐴𝐴𝑡𝑡 + 𝛽𝛽3𝐴𝐴𝐴𝐴𝐴𝐴𝐴𝐴𝐴𝐴𝐴𝐴 𝑀𝑀𝑀𝑀𝑀𝑀𝑀𝑀𝑀𝑀𝑖𝑖 ×
𝐹𝐹𝐴𝐴𝐹𝐹 𝑀𝑀𝑀𝑀𝑀𝑀 𝑃𝑃𝑃𝑃𝐺𝐺𝐴𝐴ℎ𝑎𝑎𝐴𝐴𝐴𝐴 𝑀𝑀ℎ𝑎𝑎𝐺𝐺𝐴𝐴𝑡𝑡 + 𝛽𝛽4𝐌𝐌𝐌𝐌𝐜𝐜𝐜𝐜𝐜𝐜𝐜𝐜𝐜𝐜𝐜𝐜𝐜𝐜𝐜𝐜𝐜𝐜𝐜𝐜𝐜𝐜 𝐂𝐂𝐜𝐜𝐜𝐜𝐂𝐂𝐜𝐜𝐜𝐜𝐂𝐂𝐂𝐂𝐂𝐂 + 𝛽𝛽5𝐈𝐈𝐜𝐜𝐂𝐂𝐂𝐂𝐜𝐜𝐂𝐂𝐈𝐈𝐂𝐂𝐜𝐜𝐜𝐜𝐜𝐜 𝐂𝐂𝐜𝐜𝐜𝐜𝐂𝐂𝐜𝐜𝐜𝐜𝐂𝐂𝐂𝐂𝐜𝐜,𝐂𝐂 + 𝜀𝜀𝑖𝑖,𝑡𝑡 (1)
where Asset Growthi,t denotes the quarterly growth in total assets for institution i at time t. Agency MREIT is an
indicator that takes the value of one if institution i is an Agency MREIT (versus a Non-Agency MREIT). Fed MBS
Purchase Share is the Federal Reserve’s quarterly purchase share of Agency MBS. The regression specification in Eq.
(1) includes an interaction term between the Agency MREIT indicator and the Fed MBS Purchase Share that reflects
any differential response between Agency and Non-Agency MREITs to variation in Fed MBS Purchase Share. We
anticipate that the central banks’ Agency MBS purchases have a larger negative effect on investment growth
opportunities for specialized Agency MREITs than for Non-Agency MREITs with a broader portfolio of
mortgage-related asset holdings (𝛽𝛽3<0).
Macroeconomic Controlst is a matrix containing the level and slope of the term structure, computed as the
3-month constant maturity Treasury rate and the difference between the 10-year and 3-month constant maturity
rates, respectively. We also include the option-adjusted mortgage spread as a measure of the relative attractiveness
of Agency MBS versus Treasury bonds. We further control for the quarterly rate of national house price growth

15
based on the Case-Shiller Index and the credit risk premium to capture drivers of growth specific to Non-Agency
MREITs. Lastly, we account for the Federal Reserve’s purchase share of Treasury securities.
Institution Controlsi,t is a matrix of institution-specific, time-varying characteristics. We include the amount
of new equity issued during the quarter as a percentage of total equity at the beginning of the quarter. This variable
reflects that REITs must distribute a large fraction of their earnings as dividends, hence asset growth must largely
be financed through new equity issuance. Conversely, MREITs may also contract when investment opportunities
decline. Thus, we include the number of shares repurchased during the quarter as a percentage of total shares
outstanding at the beginning of the quarter. We further control for MREIT size, defined as the natural logarithm
of total assets, lagged by one quarter. 𝜀𝜀𝑖𝑖,𝑡𝑡 is the residual. We estimate Eq. (1) via OLS, with standard errors clustered
by institution.
We further examine MREIT responses to central bank Agency MBS purchases across the QE regimes, which
are each defined by different policy objectives. For example, QE1 was especially important for Agency MBS market
functioning and hardening expectations about federal support for Fannie Mae and Freddie Mac (Hancock and
Passmore, 2011). During the Tapering period, by contrast, the Federal Reserve was extremely transparent and
consistent in its monthly asset purchase activity so as to not materially affect markets. We thus estimate an
alternative version of Eq. (1) where we construct interaction terms between Agency MREIT and Fed MBS Purchase
Share where the latter is QE regime specific. We consider the following QE regimes: QE1, Maturity Extension
Program (MEP), QE3, and the Tapering period. The Federal Reserve did not purchase Agency MBS during QE2
and hence we include a simple indicator to control for any unobservable policy effects during this period.
Equity issuance plays an important role in MREIT asset growth given the substantial payout requirements for
these institutions, while share repurchases reflect MREITs’ responses to equity investor demand for their shares.
Therefore, we examine the response in equity issuance and share repurchases to variation in the Federal Reserve’s
posture in the Agency MBS market. Eq. (2) shows the specification of the regression model:
𝑀𝑀𝐴𝐴𝐴𝐴𝑃𝑃𝐴𝐴𝐹𝐹 𝑀𝑀𝐸𝐸𝑃𝑃𝐸𝐸𝐴𝐴𝐴𝐴𝑖𝑖,𝑡𝑡 = 𝛽𝛽1𝐴𝐴𝐴𝐴𝐴𝐴𝐴𝐴𝐴𝐴𝐴𝐴 𝑀𝑀𝑀𝑀𝑀𝑀𝑀𝑀𝑀𝑀𝑖𝑖 + 𝛽𝛽2𝐹𝐹𝐴𝐴𝐹𝐹 𝑀𝑀𝑀𝑀𝑀𝑀 𝑃𝑃𝑃𝑃𝐺𝐺𝐴𝐴ℎ𝑎𝑎𝐴𝐴𝐴𝐴 𝑀𝑀ℎ𝑎𝑎𝐺𝐺𝐴𝐴𝑡𝑡 + 𝛽𝛽3𝐴𝐴𝐴𝐴𝐴𝐴𝐴𝐴𝐴𝐴𝐴𝐴 𝑀𝑀𝑀𝑀𝑀𝑀𝑀𝑀𝑀𝑀𝑖𝑖 ×
𝐹𝐹𝐴𝐴𝐹𝐹 𝑀𝑀𝑀𝑀𝑀𝑀 𝑃𝑃𝑃𝑃𝐺𝐺𝐴𝐴ℎ𝑎𝑎𝐴𝐴𝐴𝐴 𝑀𝑀ℎ𝑎𝑎𝐺𝐺𝐴𝐴𝑡𝑡 + 𝛽𝛽4𝐌𝐌𝐌𝐌𝐜𝐜𝐜𝐜𝐜𝐜𝐜𝐜𝐜𝐜𝐜𝐜𝐜𝐜𝐜𝐜𝐜𝐜𝐜𝐜𝐜𝐜 𝐂𝐂𝐜𝐜𝐜𝐜𝐂𝐂𝐜𝐜𝐜𝐜𝐂𝐂𝐂𝐂𝐂𝐂 + 𝛽𝛽5𝐈𝐈𝐜𝐜𝐂𝐂𝐂𝐂𝐜𝐜𝐂𝐂𝐈𝐈𝐂𝐂𝐜𝐜𝐜𝐜𝐜𝐜 𝐂𝐂𝐜𝐜𝐜𝐜𝐂𝐂𝐜𝐜𝐜𝐜𝐂𝐂𝐂𝐂𝐜𝐜,𝐂𝐂 + 𝜀𝜀𝑖𝑖,𝑡𝑡 (2)
where Issued Equityi,t is an indicator that takes the value of one if institution i issued new equity at time t. The
matrix Macroeconomic Controlst contains the same variables as in Eq. (1). The matrix Institution Controlsi,t
contains institution size (logarithm of total assets) and the ratio of market-to-book value of equity, both lagged one
quarter. The remaining variables and notation are as in Eq. (1). We estimate the same variation, using QE regime-
specific Federal Reserve Agency MBS purchase shares, for this regression as for Eq. (1). Eq. (2) is estimated via
OLS with standard errors clustered by institution. We estimate the likelihood of quarterly share repurchases in the
same framework.

16
MREIT asset growth and their ability to raise equity to finance that growth should be reflected in stock
returns.14 We assess the relationships between MREIT total returns and the Federal Reserve’s activity in the Agency
MBS market using the following econometric specification:
𝑀𝑀𝐺𝐺𝐴𝐴𝑎𝑎𝑇𝑇 𝑀𝑀𝐴𝐴𝐴𝐴𝑃𝑃𝐺𝐺𝐴𝐴𝑖𝑖,𝑡𝑡 = 𝛽𝛽1𝐴𝐴𝐴𝐴𝐴𝐴𝐴𝐴𝐴𝐴𝐴𝐴 𝑀𝑀𝑀𝑀𝑀𝑀𝑀𝑀𝑀𝑀𝑖𝑖 + 𝛽𝛽2𝐹𝐹𝐴𝐴𝐹𝐹 𝑀𝑀𝑀𝑀𝑀𝑀 𝑃𝑃𝑃𝑃𝐺𝐺𝐴𝐴ℎ𝑎𝑎𝐴𝐴𝐴𝐴 𝑀𝑀ℎ𝑎𝑎𝐺𝐺𝐴𝐴𝑡𝑡 + 𝛽𝛽3𝐴𝐴𝐴𝐴𝐴𝐴𝐴𝐴𝐴𝐴𝐴𝐴 𝑀𝑀𝑀𝑀𝑀𝑀𝑀𝑀𝑀𝑀𝑖𝑖 ×
𝐹𝐹𝐴𝐴𝐹𝐹 𝑀𝑀𝑀𝑀𝑀𝑀 𝑃𝑃𝑃𝑃𝐺𝐺𝐴𝐴ℎ𝑎𝑎𝐴𝐴𝐴𝐴 𝑀𝑀ℎ𝑎𝑎𝐺𝐺𝐴𝐴𝑡𝑡 + 𝛽𝛽4𝐌𝐌𝐌𝐌𝐜𝐜𝐜𝐜𝐜𝐜𝐜𝐜𝐜𝐜𝐜𝐜𝐜𝐜𝐜𝐜𝐜𝐜𝐜𝐜𝐜𝐜 𝐂𝐂𝐜𝐜𝐜𝐜𝐂𝐂𝐜𝐜𝐜𝐜𝐂𝐂𝐂𝐂𝐂𝐂 + 𝛽𝛽5𝐈𝐈𝐜𝐜𝐂𝐂𝐂𝐂𝐜𝐜𝐂𝐂𝐈𝐈𝐂𝐂𝐜𝐜𝐜𝐜𝐜𝐜 𝐂𝐂𝐜𝐜𝐜𝐜𝐂𝐂𝐜𝐜𝐜𝐜𝐂𝐂𝐂𝐂𝐜𝐜,𝐂𝐂 + 𝜀𝜀𝑖𝑖,𝑡𝑡 (3)
where Total Returni,t is an is the total quarterly stock return for MREIT i at time t. The macroeconomic and
institution-level control variables as well as the notation are as in Eq. (2). We also estimate the alternative
specifications outlined above, including QE regime-specific Federal Reserve Agency MBS purchase shares. Eq. (3)
is estimated via OLS with standard errors clustered by institution.
5.2 Results
Table 3 presents the results of the asset growth regressions. The estimates in column (1) indicate that Agency
MREITs averaged higher rates of asset growth than Non-Agency MREITs over the sample period. The same
estimates also suggest that MREIT growth was negatively related to the Federal Reserve’s purchase share of Agency
MBS. The results reported in column (2) show that this latter effect is driven by the Agency MREITs in our
sample, consistent with our first testable hypothesis. In economic terms, the estimates in column (2) suggest that
a one-standard deviation increase in the Federal Reserve’s purchase share was associated with a marginal reduction
in Agency MREIT asset growth of 3.6 percentage points per quarter, or approximately 40% of the unconditional
mean.15 The estimates presented in column (3) suggest that Agency MREITs experienced particularly strong asset
growth during QE1 and QE2. As discussed above, QE1 had the effect of driving down long-term interest rates
and resulting in large capital gains for fixed-income investors that would have facilitated some growth in Agency
MREITs. Their further expansion during QE2 can be explained by the central bank halting its purchases of Agency
MBS and no longer crowding out private investment. The results reported in column (3) also indicate that Agency
MREITs experienced significantly negative asset growth during the Tapering period when the Federal Reserve’s
resumed its purchases of Agency MBS.
14 Mortgage REIT investment performance seemingly was only previously explored in one study (Chen and Peiser, 1999).
By contrast, equity REITs have been the subject of numerous studies into their sector dynamics and determinants of investment performance (see Ling et al. (2016), Letdin et al. (2019), and Van Nieuwerburgh (2019), among many others). The evidence we present also broadly relates to the literature on the interest rate sensitivity of REITs (see Chen and Tzang (1988), Bae (1990), Mueller and Pauley (1995), Allen et al. (2000), Swanson et al. (2002), He et al. (2003), and Liow et al. (2003)). This literature is mainly focused on equity REITs, with the notable exception of Liang and Webb (1995). However, the evidence on MREITs in that study predates the financial crisis and does not address the relative importance of interest rate factors and the intervention of the Federal Reserve in the Agency MBS markets.
15 Based on estimates in Table 3, column (2). Coefficient (–0.145) x SD of Federal Reserve Purchase Share (0.2473) = economic effect (–0.0359), rounded to –3.6 percentage points. Dividing this estimated effect (–0.0359) by the unconditional mean Agency MREIT asset growth (0.0888) equals an effect equivalent to approximately –40% of the unconditional mean.

17
[Table 3 about here.]
Given the important role of equity issuance for MREIT growth, we examine this next in Table 4. The estimates
in column (1) show that Agency MREITs are more likely to issue equity than Non-Agency MREITs on average.
The results reported in column (2) indicate that the Federal Reserve’s Agency MBS purchases have a significantly
negative effect on the likelihood of Agency MREIT equity issuance and a significantly positive effect on Non-
Agency MREIT issuance decisions. These two coefficients with opposing signs balance each other out and thus
explain the insignificant coefficient on the Federal Reserve’s Agency MBS purchase share shown in column (1). In
economic terms, the estimates in column (2) imply that a one-standard deviation increase in the Federal Reserve’s
Agency MBS purchase share is associated with a decline in the likelihood of equity issuance by Agency MREITs
of 16 percentage points, or more than 60% of the unconditional mean.16
The estimates reported in column (3) of Table 4 suggest that: (i) the likelihood of Agency MREITs equity
issuance is unaffected by the Federal Reserve’s Agency MBS purchase share during QE1; (ii) that the central bank’s
absence from the Agency MBS market during QE2 is associated with a significant increase in Agency MREIT
equity issuance propensity; and (iii) that the re-entry of the Federal Reserve into the Agency MBS market during
QE3 and Tapering is associated with a significant decline in the likelihood of Agency MREIT equity issuance.
[Table 4 about here.]
Table 5 presents the regression results for quarterly MREIT share repurchases. In column (1), we see that the
two types of MREITs were, on average, equally likely to repurchase shares, and we also find no overall effect of
the Federal Reserve’s Agency MBS purchase share on share repurchases. However, Agency MREIT repurchase
activity increases significantly in response to the Federal Reserve’s Agency MBS purchases (column (2)). When
considering individual QE regimes, we find that Agency MREIT share repurchases (relative to Non-Agency
MREIT share repurchases) decreased significantly in response to the Federal Reserve’s Agency MBS purchase
activity during QE1, QE2, and MEP, and increased during QE3 and the Tapering period. In all, the estimates
reported in Table 5 indicate that the likelihood of Agency MREIT share repurchases mirrors the dynamics of their
equity issuance; and this in turn, follows the time-series patterns of Agency MREIT asset growth.
[Table 5 about here.]
Table 6 explores quarterly MREIT total returns. The results in column (1) show that, conditional on
macroeconomic and institution-level controls, total returns on Agency MREITs were comparable to those on
Non-Agency MREITs and systematically unrelated to the Federal Reserve’s purchase share of Agency MBS. The
16 Based on estimates in Table 4, column (2). Coefficient (–0.636) x SD of Federal Reserve Purchase Share (0.2473) =
economic effect (–0.1573), rounded to –16 percentage points. Dividing this estimated effect (–0.1573) by the unconditional mean likelihood of Agency MREIT equity issuance (0.2573) equals an effect equivalent to –61% of the unconditional mean.

18
estimates in column (2) indicate that Agency MREIT total returns responded negatively to the Federal Reserve’s
purchases of Agency MBS, while returns for Non -Agency MREITs were positively related. The results reported
in column (3) show that this negative response was concentrated in QE3.
[Table 6 about here.]
In sum, our results demonstrate a strong empirical relationship between the Federal Reserve’s QE program
and Agency MREIT growth and performance. These institutions grew rapidly during QE1 and QE2. QE1 was
characterized by a sharp decline in long-term interest rates, generating significant capital gains for fixed income
securities. During QE2, the central bank halted its purchases of Agency MBS, creating investment opportunities
for Agency MREITs. The Federal Reserve’s purchases of Agency MBS during QE3 and the Tapering period, by
contrast, were associated with a contraction in Agency MREIT size due to reduced investment opportunities. The
results for equity issuance and share repurchase activity, as well as total return performance, illustrate the portfolio
rebalancing by equity investors in and out of leveraged investment in Agency MBS during QE. During the later
stages of the central banks’ program, Agency MREITs were less attractive to investors and may thus have sought
to boost expected returns by increasing the risk of their capital structures (more leverage and more short-term
debt). Next, we turn to a formal investigation of this question.
6 QE and Agency MREIT Financial Risk Taking
6.1 Empirical Approach
To identify the effects of QE on Agency MREIT financial risk taking through their capital structure choices,
we again employ the cross-sectional comparison to Non-Agency MREITs. We begin by exploring variation in the
ratio of equity to total assets, a measure of balance sheet leverage. We then turn to two measures of their debt
structure reflecting liquidity/refinancing risk: namely, the ratio of repurchase agreements to assets and the ratio of
short-term repo (< 30 days) to total repo debt. Lastly, we consider MREIT interest rate risk exposure in the form
of their derivatives holdings. Eq. (3) presents the regression specification employed:
𝑀𝑀𝐸𝐸𝐴𝐴𝑅𝑅𝑖𝑖,𝑡𝑡 = 𝛽𝛽1𝐴𝐴𝐴𝐴𝐴𝐴𝐴𝐴𝐴𝐴𝐴𝐴 𝑀𝑀𝑀𝑀𝑀𝑀𝑀𝑀𝑀𝑀𝑖𝑖 + 𝛽𝛽2𝐹𝐹𝐴𝐴𝐹𝐹 𝑀𝑀𝑀𝑀𝑀𝑀 𝑃𝑃𝑃𝑃𝐺𝐺𝐴𝐴ℎ𝑎𝑎𝐴𝐴𝐴𝐴 𝑀𝑀ℎ𝑎𝑎𝐺𝐺𝐴𝐴𝑡𝑡 + 𝛽𝛽3𝐴𝐴𝐴𝐴𝐴𝐴𝐴𝐴𝐴𝐴𝐴𝐴 𝑀𝑀𝑀𝑀𝑀𝑀𝑀𝑀𝑀𝑀𝑖𝑖 ×
𝐹𝐹𝐴𝐴𝐹𝐹 𝑀𝑀𝑀𝑀𝑀𝑀 𝑃𝑃𝑃𝑃𝐺𝐺𝐴𝐴ℎ𝑎𝑎𝐴𝐴𝐴𝐴 𝑀𝑀ℎ𝑎𝑎𝐺𝐺𝐴𝐴𝑡𝑡 + 𝛽𝛽4𝐌𝐌𝐌𝐌𝐜𝐜𝐜𝐜𝐜𝐜𝐜𝐜𝐜𝐜𝐜𝐜𝐜𝐜𝐜𝐜𝐜𝐜𝐜𝐜𝐜𝐜 𝐂𝐂𝐜𝐜𝐜𝐜𝐂𝐂𝐜𝐜𝐜𝐜𝐂𝐂𝐂𝐂𝐂𝐂 + 𝛽𝛽5𝐈𝐈𝐜𝐜𝐂𝐂𝐂𝐂𝐜𝐜𝐂𝐂𝐈𝐈𝐂𝐂𝐜𝐜𝐜𝐜𝐜𝐜 𝐂𝐂𝐜𝐜𝐜𝐜𝐂𝐂𝐜𝐜𝐜𝐜𝐂𝐂𝐂𝐂𝐜𝐜,𝐂𝐂 + 𝜀𝜀𝑖𝑖,𝑡𝑡 (4)
where Riski,t denotes the specific measure of financial risk considered. The Macroeconomic Controls are the
same as in the previous regressions. The Institution Controls in Eq. (4) include institution size, defined as the
natural logarithm of total assets, and institution cash holdings scaled by total assets. Cash holdings represent a
liquidity buffer on the asset-side of the balance sheet that could otherwise insulate MREITs from the risk associated
with their short-term liabilities. Both variables are lagged by one quarter. We also account for contemporaneous
total accumulated other comprehensive income, scaled by total assets, to control for variation in the ratio of equity

19
to assets driven by mark-to-market gains and losses. 𝜀𝜀𝑖𝑖,𝑡𝑡 is the residual. The model in Eq. (4) is estimated via OLS
with standard errors clustered by institution. We then estimate alternative versions of Eq. (4) that include
interaction terms between the period-specific Federal Reserve Agency MBS purchase shares and the Agency
MREIT indicator as previously described.17
6.2 Results
Table 7 presents the results of the MREIT leverage regressions. The estimates in columns (1) through (3)
suggest that Agency MREITs hold less equity, or are more levered, than Non-Agency MREITs on average. The
results reported in column (2) suggest no systematic relationship between the Federal Reserve’s purchase activity
in the Agency MBS and Agency MREIT leverage on average. That said, column (3) suggests that Agency MREITs
significantly increased leverage during QE3 as the Federal Reserve resumed its Agency MBS purchases.
In economic terms, the estimates from column (3) suggest that a one-standard deviation increase in the Federal
Reserve’s purchase share of Agency MBS during QE3 was associated with a decline in the equity-to-assets ratio of
Agency MREITs of over 1.7 percentage points, or approximately 12% of the unconditional mean.18 This result is
consistent with “reaching for yield” behavior by Agency MREITs during a time when investment growth for these
institutions was curtailed by the Federal Reserve’s purchase activity in the Agency MBS market.19
[Table 7 about here.]
Table 8 presents the results for MREIT liquidity risk exposure and risk management. These results are based
on the full econometric specification including separate measures for the Federal Reserve’s Agency MBS purchases
during the different QE regimes and the complete set of interaction terms with the Agency MREIT indicators.
The estimates reported in column (1) suggest that Agency MREITs use repurchase agreements more heavily
than Non-Agency MREITs on average. The coefficients reported also indicate that Agency MREIT overall repo
debt usage was largely unaffected by the central banks’ stance in the Agency MBS market. Column (2) of Table 8
presents the results for MREIT exposure to the ratio of short-term repo (0-30 days) to total repo – a more precise
measure of liquidity risk. The results indicate that Agency MREITs use significantly more short-term repo debt
than their Non-Agency counterparts on average. The estimates also show that Agency MREITs reduced their
17 In unreported regressions, we confirm the robustness of the results from Eq. (4) in the sub-set of MREITs with
available data on interest rate risk exposure and hedging; namely, data on the lagged ratio of fixed rate to total Agency MBS and the lagged ratio of interest rate swaps and swaptions to total liabilities. Including these variables sharpens our inferences about the solvency and liquidity risks associated with MREIT capital structure choices during QE.
18 Based on estimates in Table 6, column (3). Coefficient (–0.151) x SD of Federal Reserve Purchase Share in QE3 (0.1135) = economic effect (–0.0171) in both regimes, rounded to –1.7 percentage points. Dividing this estimated effect by the unconditional mean Agency MREIT equity-to-assets ratio (0.1388) equals an effect equivalent to approximately –12%.
19 When considering the expanded set of institution controls for interest rate risk and hedging, the results are qualitatively similar (results not tabulated for brevity). However, in contrast to those earlier findings, the results suggest that the most statistically significant negative effect of the Federal Reserve’s Agency MBS purchase share on Agency MREIT equity holdings occurred during the Tapering regime.

20
reliance on this type of debt (relative to Non-Agency MREITs) during MEP and QE3. The estimates in Column
(3) of Table 8 refer to the results for MREIT use of swaps and swaptions – derivatives employed to manage interest
rate risk exposure – relative to total repo debt. The results suggest that, in the later stages of QE (MEP, QE3, and
Taper), they also increased their holdings of those derivatives.
[Table 8 about here.]
In all, the results presented in Tables (7) and (8) suggest that the Federal Reserve’s purchases of Agency MBS
during the latter stages of QE materially affected Agency MREIT financial risk-taking. We find that Agency
MREITs exhibit “reaching for yield” behavior through increased leverage during periods when their growth
opportunities and performance are curtailed by central bank asset purchases. At the same time, however, these
institutions seem to have reduced liquidity risk by extending repo maturity and increased related hedging using
swaps and swaptions.
7 Concluding Remarks
The prolonged use of unconventional monetary policy since the financial crisis resulted in concerns about the
potential for such accommodation to undermine financial stability. Recent research presents evidence consistent
with “reaching for yield” by non-bank financial institutions during QE via increased credit risk taking. We test the
complementary hypothesis that QE may also influence financial risk taking. We study Agency Mortgage REITs,
which are shadow banks that hold long-term Agency MBS and financed using repo debt provided by broker-
dealers. This simple intermediation structure allows us to shut off any credit risk taking response to QE and isolate
any potential response in terms of capital structure choices. To identify the effects of QE on institution-level
outcomes, we employ a cross-sectional comparison between Agency MREITs and all other MREITs, which serve
as a control group of institutions holding a broader portfolio of mortgage-related assets.
We first conduct a high-frequency event study of equity market reactions by Agency and Non-Agency MREITs
to QE-related central bank communications. The results suggest a causal impact from the Federal Reserve’s QE
announcements on MREIT valuations. We then estimate panel regressions showing that Agency MREIT asset
growth responded negatively to the Federal Reserve’s purchase share of newly issued Agency MBS during QE.
This dynamic is confirmed by additional analysis studying Agency MREIT equity issuance and share repurchase
behavior, and by further tests on Agency MREIT total stock returns. These results demonstrate that the Federal
Reserve’s Agency MBS purchases directly crowd out private-sector investment and induce portfolio rebalancing
by equity investors in Agency MREITs. We further document that the Federal Reserve’s purchase activity in the
Agency MBS market was associated with a significant increase in Agency MREIT leverage during the late stages
of QE – consistent with “reaching for yield” through riskier capital structure choices. However, we also present
evidence that Agency MREITs took measures to reduce liquidity risk by extending repo maturity and to reduce
interest rate risk exposure by increasing their use of derivatives. Collectively, these findings represent novel

21
evidence that unconventional monetary policy significantly affects institution financial risk taking. Hence, research
linking QE to increased credit risk-taking should account for contemporaneous changes in financing choices and
risk management.
22
Bibliography
Acharya, Viral and Hassan Naqvi, 2019. “On Reaching for Yield and the Coexistence of Bubbles and Negative Bubbles.” Journal of Financial Intermediation, 38: 1-10. https://doi.org/10.1016/j.jfi.2018.08.001
Adrian, Tobias and Hyun Shin, 2010. “Financial Intermediaries and the Price of Risk.” Federal Reserve Bank of New York Staff Reports #398 (May).
Allen, Marcus, Jeff Madura, and Thomas Springer, 2000. “REIT Characteristics and the Sensitivity of REIT Return.” Journal of Real Estate Finance and Economics, 21: 141–152.
Bae, Sung, 1990. “Interest Rate Changes and Common Stock Returns of Financial Institutions: Revisited.” Journal of Financial Research, 13: 71–79. https://doi.org/10.1111/j.1475-6803.1990.tb00537.x
Baker, Malcolm and Jeffrey Wurgler. 2000. “The Equity Share in New Issues and Aggregate Stock Returns.” Journal of Finance, 55(5): 2219-57. https://doi.org/10.1111/0022-1082.00285
Bauer, Michael and Glenn Rudebusch, 2014. “The Signaling Channel for Federal Reserve Bond Purchases.” International Journal of Central Banking, x: 233-289.
Bernanke, Ben, 2010. “The Economic Outlook and Monetary Policy.” Remarks at the Federal Reserve Bank of Kansas City Economic Symposium (August 27).
Bernanke, Ben, 2013. “Testimony before the Joint Economic Committee, U.S. Congress.” (May 22).
Bonfim, Diana and Carla Soares, 2018. “The Risk-Taking Channel of Monetary Policy: Exploring All Avenues.” Journal of Money, Credit, and Banking, 50(7): 1507-1541. https://doi.org/10.1111/jmcb.12500
Borio, Claudio and Haibin Zhu, 2012. “Capital Regulation, Risk Taking and Monetary Policy: A Missing Link in the Transmission Mechanism?” Journal of Financial Stability, 8: 236-251. https://doi.org/10.1016/j.jfs.2011.12.003
Chakraborty, Indraneel, Itay Goldstein, and Andrew MacKinlay, 2020. “Monetary Stimulus and Bank Lending.” Journal of Financial Economics, 136(1): 189-218. https://doi.org/10.1016/j.jfineco.2019.09.007
Chen, Jun, and Richard Peiser, 1999. “The Risk and Return Characteristics of REITs 1993-1997.” Real Estate Finance, 16: 61–68.
Chen, K.C., and Daniel Tzang, 1988. “Interest-Rate Sensitivity of Real Estate Investment Trusts.” Journal of Real Estate Research, 3: 13–22. https://doi.org/10.1080/10835547.1988.12090561
Chodorow-Reich, Gabriel, 2014. “The Effects of Unconventional Monetary Policy on Financial Institutions.” Brookings Papers on Economic Activity (Spring): 155-204. https://doi.org/10.1353/eca.2014.0003
Choi, Jaewon and Mathias Kronlund, 2018. “Reaching for Yield by Corporate Bond Mutual Funds.” Review of Financial Studies, 31(5): 1930-1965. https://doi.org/10.1093/rfs/hhx132
Clouse, James, Dale Henderson, Athanasios Orphanides, David H. Small and P.A. Tinsley, 2003. “Monetary Policy When the Nominal Short-Term Interest Rate is Zero.” B.E. Journal of Macroeconomics, (1): 1-65.
D’Amico, Stefania and Thomas King, 2013. “Flow and Stock Effects of Large-Scale Treasury Purchases: Evidence on the Importance of Local Supply.” Journal of Financial Economics, 108(2): 425-48. https://doi.org/10.1016/j.jfineco.2012.11.007
Delis, Manthos, Iftekhar Hasan, and Nikolas Mylolonidis, 2017. “The Risk-Taking Channel of Monetary Policy in the U.S.: Evidence from Corporate Loan Data,” Journal of Money, Credit, and Banking, 49(1): 187-213. https://doi.org/10.1111/jmcb.12372
23
Dell’Ariccia, Giovanni, Luc Leaven, and Gustavo Suarez, 2016. “Bank Leverage and Monetary Policy’s Risk-Taking Channel: Evidence from the United States,” Journal of Finance, 72(2): 613-654. https://doi.org/10.1111/jofi.12467
DiMaggio, Marco and Marcin Kacperczyk, 2016. “The Unintended Consequences of the Zero Lower Bound Policy,” Journal of Financial Economics, 123(1): 59-80. https://doi.org/10.1016/j.jfineco.2016.09.006
Eggertsson, Gauti B. and Michael Woodford, 2003. “The Zero Bound on Interest Rates and Optimal Monetary Policy.” Brookings Papers on Economic Activity, 2003(1): 139-211.
Eisenbeis, Robert A., W. Scott Frame and Larry D. Wall, 2007. “An Analysis of the Systemic Risks Posed by Fannie Mae and Freddie Mac and An Evaluation of the Policy Options for Reducing Those Risks.” Journal of Financial Services Research, 31(2-3): 75-99. https://doi.org/10.1007/s10693-006-0002-z
Fama, Eugene F. and Kenneth R. French, 1999. “The Corporate Cost of Capital and the Return on Corporate Investment,” Journal of Finance, 54: 1939-1967.
Feroli, Michael, Anil Kashyap, Kermit Schoenholtz, and Hyun Shin, 2014. “Market Tantrums and Monetary Policy,” Chicago Booth Working Paper 14-09.
Frame, W. Scott, Andreas Fuster, Joseph Tracy, and James Vickery, 2015. “The Rescue of Fannie Mae and Freddie Mac.” Journal of Economic Perspectives, 29(2): 25-52.
Gabaix, Xavier, Arvind Krishnamurthy, and Olivier Vigneron, 2007. “Limits of Arbitrage: Theory and Evidence from the Mortgage-Backed Securities Market.” Journal of Finance, 62(2): 557-596. https://doi.org/10.1111/j.1540-6261.2007.01217.x
Gagnon, Joseph, Matthew Raskin, Julie Remache, and Brian Sack, 2010. “Large Scale Asset Purchases by the Federal Reserve: Did They Work?” Federal Reserve Bank of New York Staff Report 441 (March).
Gentry, William, Deen Kemsley, and Christopher Mayer, 2003. “Dividend Taxes and Share Prices: Evidence from Real Estate Investment Trusts.” Journal of Finance, 58(1): 261-282. https://doi.org/10.1111/1540-6261.00524
Hamilton, James and Jing Cynthia Wu, 2012. “The Effectiveness of Alternative Monetary Policy Tools in a Zero Lower Bound Environment.” Journal of Money, Credit, and Banking, 44(1): 3-46. https://doi.org/10.1111/j.1538-4616.2011.00477.x
Hancock, Diana and Wayne Passmore, 2011. “Did the Federal Reserve’s MBS Purchase Program Lower Mortgage Rates?” Journal of Monetary Economics, 58: 498-514. https://doi.org/10.1016/j.jmoneco.2011.05.002
He, Ling, James Webb, and Neil Myer, 2003. “Interest Rate Sensitivities of REIT Returns.” International Real Estate Review, 6: 1–21.
Ioannidou, Vasso, Steven Ongena, and Jose Luis Peydro, 2015. “Monetary Policy, Risk Taking, and Pricing: Evidence from a Quasi-Natural Experiment,” Review of Finance, 19(1): 95-144. https://doi.org/10.1093/rof/rfu035
Jimenez, Gabriel, Steven Ongena, Jose Luis Peydro, and Jesus Saurina, 2014. “Hazardous Times for Monetary Policy: What do 23 Million Loans Say about the Impact of Monetary Policy on Credit Risk Taking?” Econometrica, 82: 463-505. https://doi.org/10.3982/ecta10104
Kandrac, John, and Bernd Schlusche, 2017. “Quantitative Easing and Bank Risk Taking: Evidence from Lending.” FEDS Working Paper No. 2017-125. https://doi.org/10.17016/feds.2017.125

24
Krishnamurthy, Arvind and Annette Vissing-Jorgensen, 2011. “The Effects of Quantitative Easing on Interest Rates: Channels and Implications for Policy.” Brookings Papers on Economic Activity, 215-265. https://doi.org/10.1353/eca.2011.0019
Letdin, Mariya, Corbitt Sirmans, Stacy Sirmans, and Emily Zietz, 2019. “Explaining REIT Returns.” Journal of Real Estate Literature, 27: 1–25. https://doi.org/10.1080/10835547.2019.12090493
Liang, Youguo, and James Webb, 1995. “Pricing Interest-Rate Risk for Mortgage REITs.” Journal of Real Estate Research, 10: 461–469. https://doi.org/10.1080/10835547.1995.12090796
Ling, David, Andy Naranjo, and Benjamin Scheick, 2016. “Geographic Portfolio Allocations, Property Selection and Performance Attribution in Public and Private Real Estate Markets.” Real Estate Economics, 46:404–448. https://doi.org/10.1111/1540-6229.12184
Liow, Kim Hiang, Joseph Ooi, and Loke Kiat Wang, 2003. “Interest Rate Sensitivity and Risk Premium of Property Stocks.” Journal of Property Research, 20: 117–132. https://doi.org/10.1080/0959991032000109508
Morris, Stephen and Hyun Shin, 2016. “Risk Premium Shifts and Monetary Policy: A Coordination Approach” in Monetary Policy through Asset Markets: Lessons from Unconventional Measures and Implications for an Integrated World, edited by Michael Woodford, Diego Saravia and Elias Albagli. Banco Central de Chile.
Mueller, Glenn, and Keith Pauley, 1995. “The Effect of Interest-Rate Movements on Real Estate Investment Trusts.” Journal of Real Estate Research, 10: 319–325. https://doi.org/10.1080/10835547.1995.12090793
Neely, Christopher, 2012. “Unconventional Monetary Policy Had Large International Effects.” Journal of Banking and Finance, 52: 101-111. https://doi.org/10.1016/j.jbankfin.2014.11.019
Ott, Steven, Timothy Riddiough, and Ha-Chin Yi, 2005. “Finance, Investment, and Investment Performance: Evidence from the REIT Sector.” Real Estate Economics, 33: 203–235. https://doi.org/10.1111/j.1080-8620.2005.00117.x
Paligorova, Teodora and Joao Santos, 2017. “Monetary Policy and Bank Risk Taking: Evidence from the Corporate Loan Market” Journal of Financial Intermediation, 30: 35-49. https://doi.org/10.1016/j.jfi.2016.11.003
Passmore Wayne, 2005. “The GSE Implicit Subsidy and the Value of Government Ambiguity.” Real Estate Economics, 33(3): 465-486. https://doi.org/10.1111/j.1540-6229.2005.00126.x
Pellerin, Sabrina, Steven Sabol, and John Walter, 2013. “MBS Real Estate Investment Trusts: A Primer.” Federal Reserve Bank of Richmond Economic Quarterly, 99: 193–227.
Rajan, Raghuram, 2005. “Has Financial Development Made the World Riskier?” NBER Working Paper #11728. https://doi.org/10.3386/w11728
Rodnyansky, Alexander, and Olivier M. Darmouni, 2017. “The Effects of Quantitative Easing on Bank Lending Behavior.” Review of Financial Studies, 30(11): 3858–3887. https://doi.org/10.1093/rfs/hhx063
Swanson, Zane, John Theis, and Michael Casey, 2002. “REIT Risk Premium Sensitivity and Interest Rates.” Journal of Real Estate Finance and Economics, 24: 319–330.
U.S. Financial Stability Oversight Council, 2013. Annual Report.
Van Nieuwerburgh, Stijn, 2019. “Why Are REITS Currently So Expensive?” Real Estate Economics, 47: 18–65. https://doi.org/10.1111/1540-6229.12238

25
Figure 1: Mortgage REIT Investment Shares. The figure shows MREIT investment in Agency MBS and All Other Financial Assets as a share of total assets between 2005:Q1 and 2015:Q4. Data are from the Federal Reserve Flow of Funds Reports.
0%
20%
40%
60%
80%
100%
2005
-Q1
2006
-Q1
2007
-Q1
2008
-Q1
2009
-Q1
2010
-Q1
2011
-Q1
2012
-Q1
2013
-Q1
2014
-Q1
2015
-Q1
Shar
e of
Tot
al A
sset
s
Agency MBS All Other Financial Assets

26
(A) Holdings of Agency MBS (B) Number of Mortgage REITs
Figure 2: Mortgage REIT Agency MBS Holdings and Number of Institutions. The figure shows Agency MBS Holdings as a share of Total Assets for Agency and Non-Agency MREITs (Panel A), alongside the number of active Agency and Non-Agency MREITs (Panel B). Data come from S&P Global and cover between 2005:Q1 and 2015:Q4.
0%
20%
40%
60%
80%
100%
2005
-Q1
2006
-Q1
2007
-Q1
2008
-Q1
2009
-Q1
2010
-Q1
2011
-Q1
2012
-Q1
2013
-Q1
2014
-Q1
2015
-Q1
Age
ncy
MB
S H
oldi
ngs
(% o
f Tot
al A
sset
s)
Agency MREITs Non-Agency MREITs
0
20
40
60
80
100
2005
-Q1
2006
-Q1
2007
-Q1
2008
-Q1
2009
-Q1
2010
-Q1
2011
-Q1
2012
-Q1
2013
-Q1
2014
-Q1
2015
-Q1
Num
ber
of I
nstit
utio
ns
Agency MREITs Non-Agency MREITs

27
(A) Purchase Share (% of Total Agency MBS Issuance) (B) Holdings Share (% of Total Agency MBS Outstanding)
Figure 3: Federal Reserve and GSE Agency MBS Market Shares. The figure shows the shares of Agency MBS purchases (holdings) in Panel A (Panel B) for the Federal Reserve System and Fannie Mae/Freddie Mac between 2005:Q1 and 2015:Q4. Data are from the Federal Reserve Bank of New York.
0%10%20%30%40%50%60%70%80%90%
100%
2005
-Q1
2006
-Q1
2007
-Q1
2008
-Q1
2009
-Q1
2010
-Q1
2011
-Q1
2012
-Q1
2013
-Q1
2014
-Q1
2015
-Q1
Age
ncy
MB
S M
arke
t Sh
are
Federal Reserve PurchasesFannie Mae & Freddie Mac Purchases
0%10%20%30%40%50%60%70%80%90%
100%
2005
-Q1
2006
-Q1
2007
-Q1
2008
-Q1
2009
-Q1
2010
-Q1
2011
-Q1
2012
-Q1
2013
-Q1
2014
-Q1
2015
-Q1
Age
ncy
MB
S M
arke
t Sh
are
Federal Reserve HoldingsFannie Mae & Freddie Mac Holdings

28
Figure 4: Mortgage REIT Agency MBS Holdings. The figure shows total Agency MBS assets held by Agency MREITs and Non-Agency MREITs ($ million) between 2005:Q1 and 2015:Q4. Data are from S&P Global.
0
50,000
100,000
150,000
200,000
250,000
300,000
350,000
2005
-Q1
2006
-Q1
2007
-Q1
2008
-Q1
2009
-Q1
2010
-Q1
2011
-Q1
2012
-Q1
2013
-Q1
2014
-Q1
2015
-Q1
Age
ncy
MB
S H
oldi
ngs
($ m
illio
n)
Agency MREITs Non-Agency MREITs

29
(A) Amount of Equity Issued (B) Amount of Equity Held
Figure 5: Mortgage REIT Equity Issuance and Holdings. The figure shows Agency MREIT and Non-Agency MREIT total equity issuance (in $ million) in Panel A, and the total amount of equity held (scaled by total assets) in Panel B. Data are from S&P Global and cover between 2005:Q1 and 2015:Q4.
0
1,000
2,000
3,000
4,000
5,000
6,000
7,000
2005
-Q1
2006
-Q1
2007
-Q1
2008
-Q1
2009
-Q1
2010
-Q1
2011
-Q1
2012
-Q1
2013
-Q1
2014
-Q1
2015
-Q1
Equ
ity I
ssue
d ($
mill
ion)
Agency MREITs Non-Agency MREITs
0%
20%
40%
60%
80%
100%
2005
-Q1
2006
-Q1
2007
-Q1
2008
-Q1
2009
-Q1
2010
-Q1
2011
-Q1
2012
-Q1
2013
-Q1
2014
-Q1
2015
-Q1
Equ
ity H
eld
(% o
f Tot
al A
sset
s)
Agency MREITs Non-Agency MREITs

30
(A) Repo Debt Holdings (B) Short-Term Repo Debt Holdings
Figure 6: Mortgage REIT Repo Debt Holdings. The figure shows total financing through repo debt, scaled by total assets (Panel A) and total financing through short-term repo debt scaled by total repo debt (Panel B) for Agency and Non-Agency MREITs. Data come from S&P Global and cover 2005:Q1 to 2015:Q4.
0%
20%
40%
60%
80%
100%
2005
-Q1
2006
-Q1
2007
-Q1
2008
-Q1
2009
-Q1
2010
-Q1
2011
-Q1
2012
-Q1
2013
-Q1
2014
-Q1
2015
-Q1
Rep
o D
ebt (
% o
f Tot
al A
sset
s)
Agency MREITs Non-Agency MREITs
0%
20%
40%
60%
80%
100%
2005
-Q1
2006
-Q1
2007
-Q1
2008
-Q1
2009
-Q1
2010
-Q1
2011
-Q1
2012
-Q1
2013
-Q1
2014
-Q1
2015
-Q1
Rep
o D
ebt (
% o
f Tot
al R
epo)
Agency MREITs Non-Agency MREITs

31
Table 1: Descriptive Statistics The table presents descriptive statistics for the variables of interest over the study period 2005—2015. All variables are defined in Section 3. Difference denotes the difference in means between Agency MREITs and Non-Agency MREITs. Significance from a two-sided t-test between the mean values observed for Agency and Non-Agency MREITs is indicated as f
ollows: *** p<0.01, ** p<0.05, * p<0.1.

32
Table 2: Event Study The table presents the estimation results from the event study analysis. Difference is the difference in the estimates for Agency MREITs versus Non-Agency MREITs. Significance is indicated as follows: *** p<0.01, ** p<0.05, * p<0.1, respectively, based on the larger of the conventional or robust standard error from a regression of the change in the asset price on a constant on the date indicated. Periods are defined as follows: Initial QE: 12/16/2008 and 03/18/2009; Taper: 05/22/2013 and 06/19/2013; Sample end: 07/10/2013 and 09/18/2013. Totals may differ due to rounding or sample composition.
Regime Date Treasury Life Insurers Banks MarketAgency
MREITsNon-Agency
MREITs Difference
QE1 12/01/2008 -9.2 -0.4 -0.6*** -0.5*** 0.3 -0.6 0.9*QE1 12/16/2008 -16.8 3.6*** 2.2*** 1.3*** 1.2*** 2.2*** -1.0**QE1 01/28/2009 3.1 -1.2*** -0.3 -0.3*** 0.0 -0.7*** 0.7***QE1 03/18/2009 -22.8 4.0*** 2.5*** 1.5*** 1.0** 1.7** -0.7QE1 09/23/2009 -8.9 0.6*** 0.6*** 0.6*** 0.4*** 0.6*** -0.2*QE2 08/10/2010 -5.8 0.8*** 0.9*** 0.7*** 0.4*** 0.5*** -0.1QE2 09/21/2010 -1.8 0.6*** 0.7*** 0.5*** 0.1** 0.1 0.0FG 08/09/2011 -14.4 -2.0*** -1.7*** -1.4*** 1.7** -0.4 2.1***FG 01/25/2012 -6.3 -0.6*** 0.0 0.3*** 0.6*** 0.3*** 0.3*QE3 09/13/2012 6.4 1.3*** 1.0*** 0.5*** 0.3*** 0.3*** 0.0QE3 05/22/2013 6.6 -0.4*** -0.5*** -0.5*** -1.2*** -0.5*** -0.7**QE3 06/19/2013 7.8 0.1 0.2*** -0.2*** -1.3*** -0.6*** -0.7**QE3 07/10/2013 -7.3 0.3 0.0 0.3*** 0.5 0.5 0.0QE3 09/18/2013 -14.0 0.4 0.9*** 1.0*** 2.8*** 1.8*** 1.0***
Initial QE -39.7 7.6*** 4.5*** 2.9*** 2.2*** 4.0*** -1.9*Taper 14.4 -0.3*** -0.4*** -0.6*** -2.5*** -1.1*** -1.3**Sample end -21.4 0.4 0.9*** 1.2 3.2*** 1.9*** 1.2***

33
Table 3: Quarterly Asset Growth The table presents the panel regression results for Agency versus Non-Agency MREIT asset growth (quarterly percentage change in the book value of assets) as a function of macroeconomic controls (level and slope of the term structure, option-adjusted mortgage spread, credit spread, growth in the Case-Shiller House Price index, and the Federal Reserve purchase share of Treasury securities), institution controls (equity issuance, share repurchases, and lagged institution size), and the Federal Reserve purchase share of Agency MBS. The study period is 2005—2015. All estimates are produced using OLS. Robust standard errors (clustered by institution) are reported in parentheses. Significance is indicated as follows: *** p<0.01; ** p<0.05; * p<0.1.
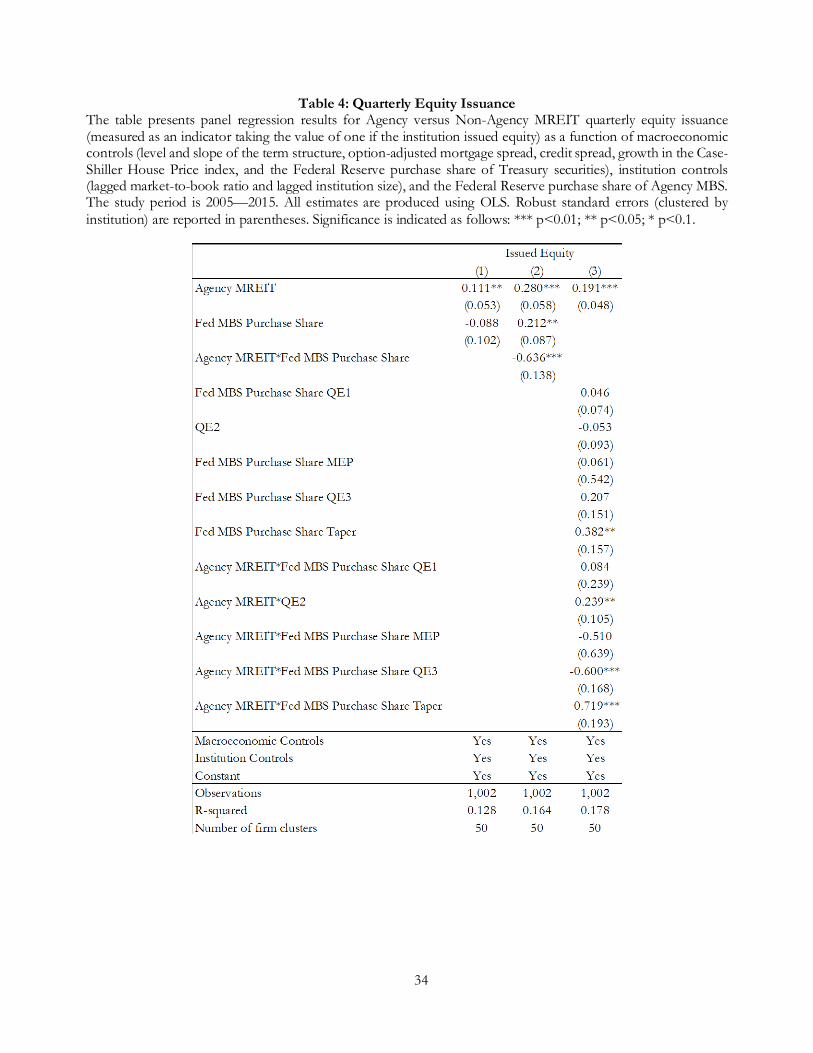
34
Table 4: Quarterly Equity Issuance The table presents panel regression results for Agency versus Non-Agency MREIT quarterly equity issuance (measured as an indicator taking the value of one if the institution issued equity) as a function of macroeconomic controls (level and slope of the term structure, option-adjusted mortgage spread, credit spread, growth in the Case-Shiller House Price index, and the Federal Reserve purchase share of Treasury securities), institution controls (lagged market-to-book ratio and lagged institution size), and the Federal Reserve purchase share of Agency MBS. The study period is 2005—2015. All estimates are produced using OLS. Robust standard errors (clustered by institution) are reported in parentheses. Significance is indicated as follows: *** p<0.01; ** p<0.05; * p<0.1.

35
Table 5: Quarterly Share Repurchases The table presents panel regression results for Agency versus Non-Agency MREIT quarterly share repurchases (measured as an indicator taking the value of one if the institution repurchased shares) as a function of macroeconomic controls (level and slope of the term structure, option-adjusted mortgage spread, credit spread, growth in the Case-Shiller House Price index, and the Federal Reserve purchase share of Treasury securities), institution controls (lagged market-to-book ratio and lagged institution size), and the Federal Reserve purchase share of Agency MBS. The study period is 2005—2015. All estimates are produced using OLS. Robust standard errors (clustered by institution) are reported in parentheses. Significance is indicated as follows: *** p<0.01; ** p<0.05; * p<0.1.
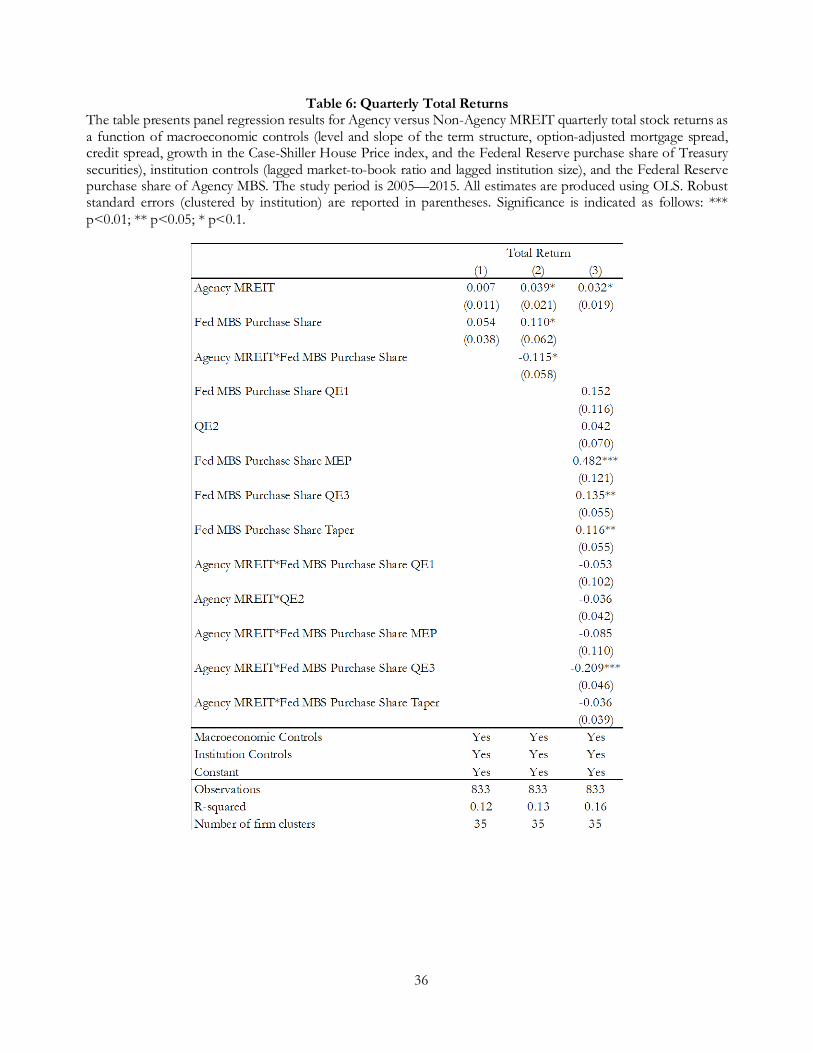
36
Table 6: Quarterly Total Returns The table presents panel regression results for Agency versus Non-Agency MREIT quarterly total stock returns as a function of macroeconomic controls (level and slope of the term structure, option-adjusted mortgage spread, credit spread, growth in the Case-Shiller House Price index, and the Federal Reserve purchase share of Treasury securities), institution controls (lagged market-to-book ratio and lagged institution size), and the Federal Reserve purchase share of Agency MBS. The study period is 2005—2015. All estimates are produced using OLS. Robust standard errors (clustered by institution) are reported in parentheses. Significance is indicated as follows: *** p<0.01; ** p<0.05; * p<0.1.
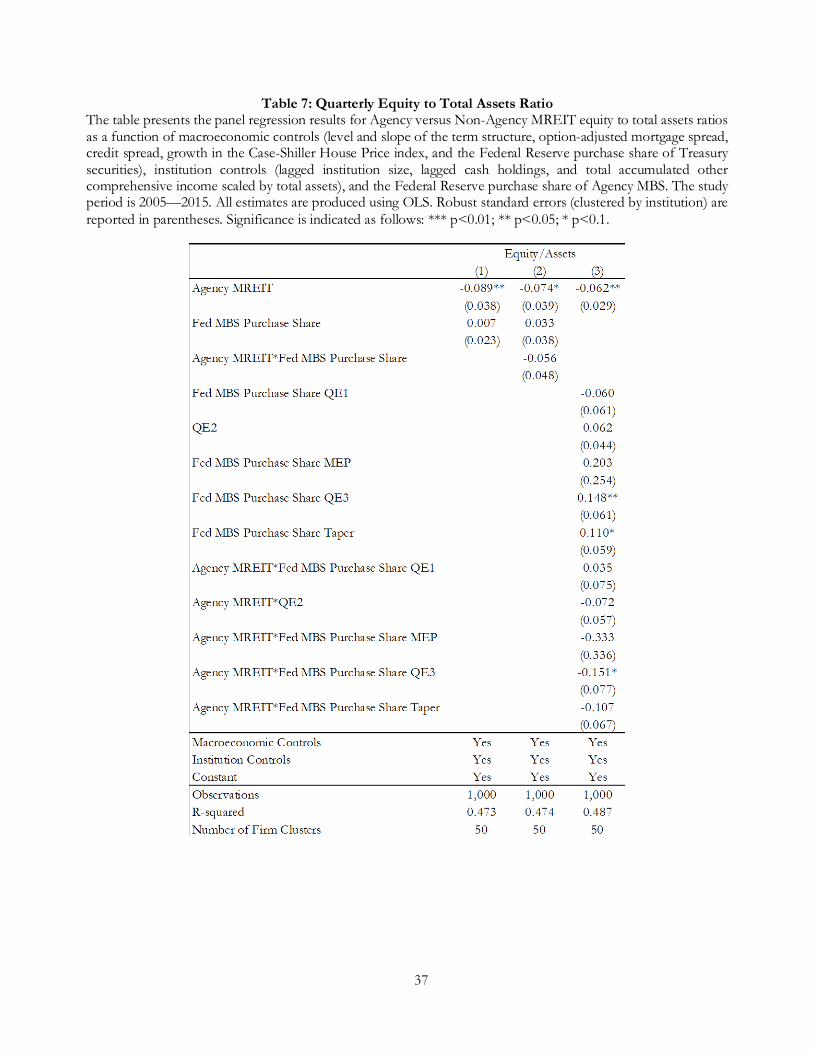
37
Table 7: Quarterly Equity to Total Assets Ratio The table presents the panel regression results for Agency versus Non-Agency MREIT equity to total assets ratios as a function of macroeconomic controls (level and slope of the term structure, option-adjusted mortgage spread, credit spread, growth in the Case-Shiller House Price index, and the Federal Reserve purchase share of Treasury securities), institution controls (lagged institution size, lagged cash holdings, and total accumulated other comprehensive income scaled by total assets), and the Federal Reserve purchase share of Agency MBS. The study period is 2005—2015. All estimates are produced using OLS. Robust standard errors (clustered by institution) are reported in parentheses. Significance is indicated as follows: *** p<0.01; ** p<0.05; * p<0.1.

38
Table 8: Quarterly Measures of MREIT Liquidity Risk Exposure and Risk Management The table presents the panel regression results for Agency versus Non-Agency MREIT measures of financial risk management. The dependent variable in column (1) is the ratio of repurchase agreements to total assets. The dependent variable in column (2) (respectively, column (3)) is the ratio of short-term repurchase agreements (with maturity between 0 and 30 days)) to total repurchase agreements (respectively, the ratio of derivative holdings, including swaps and swaptions, to total repurchase agreements). These variables are estimated as a function of macroeconomic controls (level and slope of the term structure, option-adjusted mortgage spread, credit spread, growth in the Case-Shiller House Price index, and the Federal Reserve purchase share of Treasury securities), institution controls (lagged institution size, lagged cash holdings, and total accumulated other comprehensive income scaled by total assets), and the Federal Reserve purchase share of Agency MBS. The study period is 2005—2015. All estimates are produced using OLS. Robust standard errors (clustered by institution) are reported in parentheses. Significance is indicated as follows: *** p<0.01; ** p<0.05; * p<0.1.
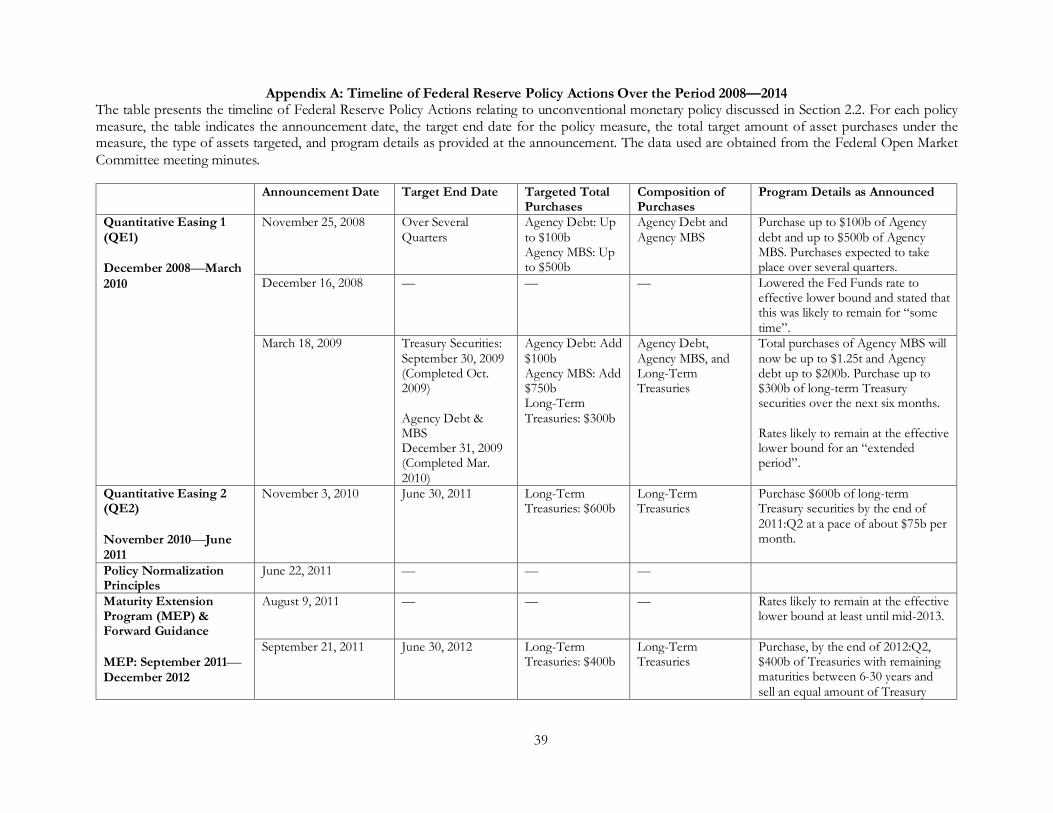
39
Appendix A: Timeline of Federal Reserve Policy Actions Over the Period 2008—2014 The table presents the timeline of Federal Reserve Policy Actions relating to unconventional monetary policy discussed in Section 2.2. For each policy measure, the table indicates the announcement date, the target end date for the policy measure, the total target amount of asset purchases under the measure, the type of assets targeted, and program details as provided at the announcement. The data used are obtained from the Federal Open Market Committee meeting minutes.
Announcement Date Target End Date Targeted Total Purchases
Composition of Purchases
Program Details as Announced
Quantitative Easing 1 (QE1) December 2008—March 2010
November 25, 2008 Over Several Quarters
Agency Debt: Up to $100b Agency MBS: Up to $500b
Agency Debt and Agency MBS
Purchase up to $100b of Agency debt and up to $500b of Agency MBS. Purchases expected to take place over several quarters.
December 16, 2008 — — — Lowered the Fed Funds rate to effective lower bound and stated that this was likely to remain for “some time”.
March 18, 2009 Treasury Securities: September 30, 2009 (Completed Oct. 2009) Agency Debt & MBS December 31, 2009 (Completed Mar. 2010)
Agency Debt: Add $100b Agency MBS: Add $750b Long-Term Treasuries: $300b
Agency Debt, Agency MBS, and Long-Term Treasuries
Total purchases of Agency MBS will now be up to $1.25t and Agency debt up to $200b. Purchase up to $300b of long-term Treasury securities over the next six months. Rates likely to remain at the effective lower bound for an “extended period”.
Quantitative Easing 2 (QE2) November 2010—June 2011
November 3, 2010 June 30, 2011 Long-Term Treasuries: $600b
Long-Term Treasuries
Purchase $600b of long-term Treasury securities by the end of 2011:Q2 at a pace of about $75b per month.
Policy Normalization Principles
June 22, 2011 — — —
Maturity Extension Program (MEP) & Forward Guidance MEP: September 2011—December 2012
August 9, 2011 —
— — Rates likely to remain at the effective lower bound at least until mid-2013.
September 21, 2011 June 30, 2012 Long-Term Treasuries: $400b
Long-Term Treasuries
Purchase, by the end of 2012:Q2, $400b of Treasuries with remaining maturities between 6-30 years and sell an equal amount of Treasury

40
securities with remaining maturities of 3 years or less.
January 25, 2012 — — — Rates likely to remain at the effective lower bound at least through late 2014.
June 20, 2012 December 31, 2012 Amount Limited by Remaining Short-Term Treasuries
Long-Term Treasuries
Purchase Treasuries with remaining maturities between 6-30 years at the current pace and sell or redeem an equal amount of Treasury securities with remaining maturities of approximately 3 years or less.
Quantitative Easing 3 (QE3) September 2012—December 2013
September 13, 2012 None Given None Given Agency MBS and Long-Term Treasuries
Purchase Agency MBS at a pace of $40b per month and continue Twist through year-end, increasing holdings of long-term securities in aggregate by $85b. Rates likely to remain at the effective lower bound at least through mid-2015.
December 12, 2012 None Given None Given Agency MBS and Long-Term Treasuries
Purchase Agency MBS at a pace of $40b per month and long-term Treasuries at a pace of $45b per month after Twist ends at year-end. Rates likely to remain at the effective lower bound, but now conditional on economic indicators.
Tapering December 2013—December 2014
December 18, 2013 None Given None Given Agency MBS and Long-Term Treasuries
Purchase Agency MBS at a pace of $35b per month and long-term Treasuries at a pace of $40b per month after Twist ends at year-end.
January 29, 2014 None Given None Given Agency MBS and Long-Term Treasuries
Purchase Agency MBS at a pace of $30b per month and long-term Treasuries at a pace of $35b per month after Twist ends at year-end.
March 19, 2014 None Given None Given Agency MBS and Long-Term Treasuries
Purchase Agency MBS at a pace of $25b per month and long-term Treasuries at a pace of $30b per month after Twist ends at year-end.

41
April 30, 2014 None Given None Given Agency MBS and Long-Term Treasuries
Purchase Agency MBS at a pace of $20b per month and long-term Treasuries at a pace of $25b per month after Twist ends at year-end.
June 18, 2014 None Given None Given Agency MBS and Long-Term Treasuries
Purchase Agency MBS at a pace of $15b per month and long-term Treasuries at a pace of $20b per month after Twist ends at year-end.
July 30, 2014 None Given None Given Agency MBS and Long-Term Treasuries
Purchase Agency MBS at a pace of $10b per month and long-term Treasuries at a pace of $15b per month after Twist ends at year-end.
September 17, 2014 None Given None Given Agency MBS and Long-Term Treasuries
Purchase Agency MBS at a pace of $5b per month and long-term Treasuries at a pace of $10b per month after Twist ends at year-end. Issue revised Policy Normalization Principles, which suggest that the policy rate will be moved before reducing portfolio size.
October 29, 2014 — — Agency MBS and Long-Term Treasuries
No additional purchases of Agency MBS and long-term Treasuries; maintain balance sheet size through reinvestment (as previous).
Rate Hike December 2015 — — — —