Embed Size (px)
Citation preview
brought to you by COREView metadata, citation and similar papers at core.ac.uk
provided by Elsevier - Publisher Connector
Contents lists available at ScienceDirect
www.elsevier.com/locate/jpa
Journal of Pharmaceutical Analysis
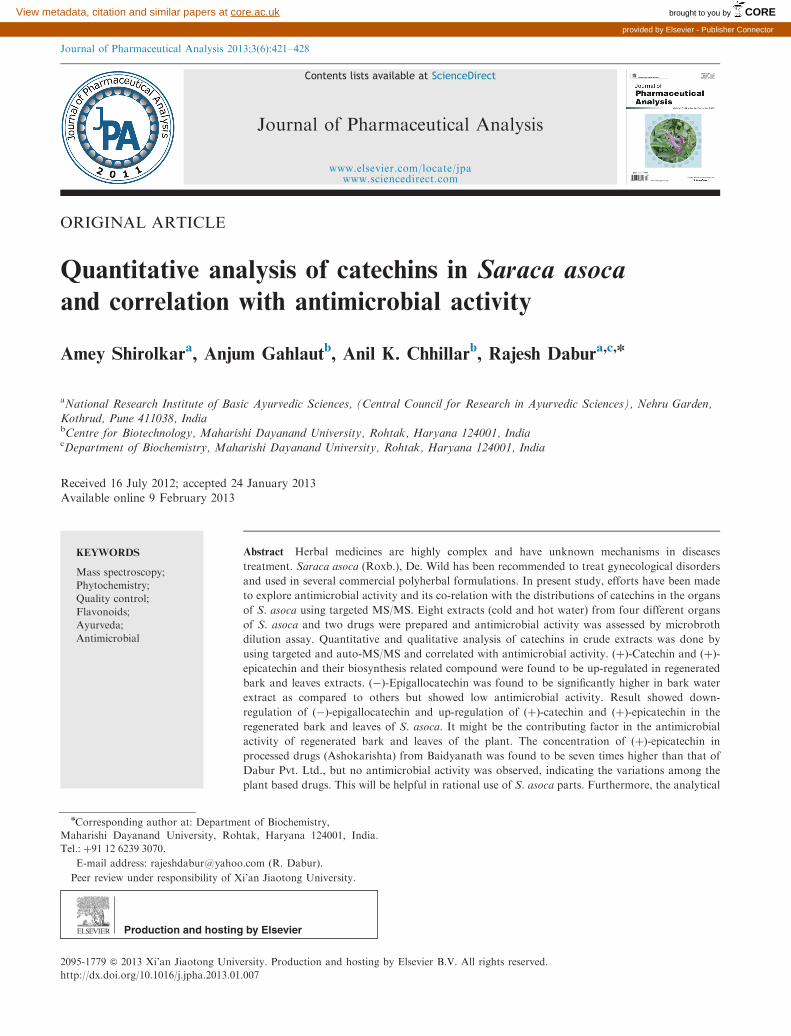
Journal of Pharmaceutical Analysis 2013;3(6):421–428
2095-1779 & 2013 Xi
http://dx.doi.org/10.1
nCorresponding au
Maharishi Dayanan
Tel.: þ91 12 6239 307
E-mail address: r
Peer review under
www.sciencedirect.com
ORIGINAL ARTICLE
Quantitative analysis of catechins in Saraca asocaand correlation with antimicrobial activity
Amey Shirolkara, Anjum Gahlautb, Anil K. Chhillarb, Rajesh Dabura,c,n
aNational Research Institute of Basic Ayurvedic Sciences, (Central Council for Research in Ayurvedic Sciences), Nehru Garden,
Kothrud, Pune 411038, IndiabCentre for Biotechnology, Maharishi Dayanand University, Rohtak, Haryana 124001, IndiacDepartment of Biochemistry, Maharishi Dayanand University, Rohtak, Haryana 124001, India
Received 16 July 2012; accepted 24 January 2013
Available online 9 February 2013
KEYWORDS
Mass spectroscopy;
Phytochemistry;
Quality control;
Flavonoids;
Ayurveda;
Antimicrobial
’an Jiaotong Univ
016/j.jpha.2013.01
thor at: Departme
d University, Roh
0.
ajeshdabur@yahoo
responsibility of X
Abstract Herbal medicines are highly complex and have unknown mechanisms in diseases
treatment. Saraca asoca (Roxb.), De. Wild has been recommended to treat gynecological disorders
and used in several commercial polyherbal formulations. In present study, efforts have been made
to explore antimicrobial activity and its co-relation with the distributions of catechins in the organs
of S. asoca using targeted MS/MS. Eight extracts (cold and hot water) from four different organs
of S. asoca and two drugs were prepared and antimicrobial activity was assessed by microbroth
dilution assay. Quantitative and qualitative analysis of catechins in crude extracts was done by
using targeted and auto-MS/MS and correlated with antimicrobial activity. (þ)-Catechin and (þ)-
epicatechin and their biosynthesis related compound were found to be up-regulated in regenerated
bark and leaves extracts. (�)-Epigallocatechin was found to be significantly higher in bark water
extract as compared to others but showed low antimicrobial activity. Result showed down-
regulation of (�)-epigallocatechin and up-regulation of (þ)-catechin and (þ)-epicatechin in the
regenerated bark and leaves of S. asoca. It might be the contributing factor in the antimicrobial
activity of regenerated bark and leaves of the plant. The concentration of (þ)-epicatechin in
processed drugs (Ashokarishta) from Baidyanath was found to be seven times higher than that of
Dabur Pvt. Ltd., but no antimicrobial activity was observed, indicating the variations among the
plant based drugs. This will be helpful in rational use of S. asoca parts. Furthermore, the analytical
ersity. Production and hosting by Elsevier B.V. All rights reserved.
.007
nt of Biochemistry,
tak, Haryana 124001, India.
.com (R. Dabur).
i’an Jiaotong University.

A. Shirolkar et al.422
method developed is sensitive, repeatable and reliable; therefore, it is suitable for quality control of
herbal drugs.
& 2013 Xi’an Jiaotong University. Production and hosting by Elsevier B.V. All rights reserved.
1. Introduction
Saraca asoca (Roxb.), De. Wild (Ashoka) belongs to family
Caesalpiniaceae. The earliest chronicled mention of this tree is
in the ayurvedic treatise and later in Charka Samhita
(100 A.D.), in which Ashoka has been recommended in
formulations for the management of gynecological disorders
as anodynes. Ashokarista is a very famous formulation from
the bark of this plant which is available commercially from
various reputed companies and used to treat menstrual
disorders. Bark of S. asoca is reported to have stimulating
effect on the endometrium and ovarian tissue and is useful in
menorrhagia during uterine fibroids [1]. Antimicrobial [2],
anti-estrogenic and anti-cancer [3] activities are reported for
the plant. A number of compounds, including (þ)-catechin
(CA), (þ)-epicatechin (EC) and (�)-epigallocatechin (EGC)
[3–5], have been reported from the plant. These compounds
are widely distributed in plant derived foods and herbal
medicines. (þ)-Catechins are well-known flavonoids known
for antioxidant activity and also used for the symptomatic
treatment of several gastrointestinal, respiratory and vascular
diseases.
Most of the herbal medicine preparations are prepared by
the decoction process. Therefore, a number of polar com-
pounds present in the drugs make quality control of herbal
drugs more difficult. Due to this reason, even after existence
and continued use over centuries, traditional medicines have
not been officially recognized in most countries. The quality
data on the safety and efficacy of traditional medicine are far
from sufficient to meet the criteria needed to support its
world-wide use. This is due to lack of adequate or accepted
research methodology to evaluate traditional medicine and use
of adulterants/substituent.
Most recommended techniques for quality control of herbal
drugs are chemical fingerprints obtained by chromatographic
and electrophoretic techniques, since they might represent
appropriately the ‘‘chemical integrities’’ [6]. However, the
combination of chromatographic fingerprints, chemometric
evaluation and quantization of selected metabolites (markers)
of herbal medicines might be a powerful tool for quality
control of herbal products [7]. Qualitative liquid chromato-
graphy mass spectroscopy analysis with principal component
analysis and multivariate statistical analysis predicts the
variations among the raw drug material and final products
[8,9]. In addition, quantitative analysis of biomarkers will
ensure the presence of most of the metabolites related to their
pathways. The liquid chromatography–mass spectrometer
fingerprints and quantized metabolites of clinically proven
efficient drugs may be the best option for the standardization
of herbal drugs.
The present study reports high performance liquid
chromatography–quadruple time of flight mass spectrometry
(HPLC–QTOFMS) method for the qualitative and quantita-
tive analysis of CA, EC and EGC in various parts of plants
and commercial formulations prepared from the bark extracts.
The quantitative analysis of CA, EC and EGC in the extracts
was carried out using external standard calibration which may
further be useful for quality control as well authentication of
plant and plant based drug samples.
2. Materials and methods
2.1. Plant material used
Various plant parts (bark, regenerated bark, leaves and
flowers) of S. asoca were collected in February 2012 from
the garden of National Research Institute of Basic Ayurvedic
Sciences, CCRAS (Department of AYUSH), Nehru Garden,
Kothrud, Pune. The collected plant materials were identified
and voucher specimens (No. 207) were kept at the medicinal
plant museum of the Institute. The Ashokarista formulations
of Baidyanath Pvt. Ltd. (Batch No. 110085, mfg April 2011)
and Dabur Pvt. Ltd. (Batch No. BD1049, mfg Sept 2010) were
purchased from authorized medical stores.
2.2. Chemicals used
Standard compounds lidocaine, D-camphor, 5,7-isoflavone,
(þ)-catechin, (þ)-epicatechin, and (�)-epigallocatechin were
purchased from Sigma-Aldrich. Acetonitrile, formic acid and
water of liquid chromatography–mass spectrometer grade
were purchased from Sigma-Aldrich.
2.3. Method of extraction
The plant materials (20 g each) were washed and crushed.
The crushed material was mixed with equal quantity of
deionized water (Direct-Q, Millipore) and incubated with
continuous shaking overnight at two different temperatures
i.e. 25 1C and 70 1C (which were named water extract and hot
water extract respectively) and this step was repeated three
times to ensure complete recovery. The samples were named as
bark water extract (BWE), bark hot water extract (BHWE),
regenerated bark water extract (RBWE), regenerated bark hot
water extract (RBHWE), leaves water extract (LWE), leaves
hot water extract (LHWE), flower water extract (FEW) and
flower hot water extract (FHWE). Samples were centrifuged at
10,000g for 10 min and filtered through 0.22 mm filters
(Hi-media). The extracts were lyophilized using a lyophilizer
(Freezone 4.5 Labconco, CA, USA) and stored at �80 1C till
further use. The plant extracts were reconstituted in LC/MS
grade water (5 mg/mL) for further analytical study. Ashokar-
ista formulations of Baidyanath (BA) and Dabur (DA) were
purchased from local market and per milliliter residual activity
for both the formulations was measured. The Ashokarista
formulations were centrifuged at 10,000g for 20 min at 4 1C to
get rid of the residues and filtered through 0.22 mm membrane.

Correlation of catechins with antimicrobial activity 423
The filtrates of S. asoca and commercial drugs were used for
metabolomic studies.
2.4. Microorganisms used
Clinical isolates of the microorganisms were used along with the
standard strains. Quality control strains of Aspergillus fumigatus
(ITCC 4517) and Aspergillus flavus (ITCC 5192) were obtained
from Indian Type Culture Collection, IARI, Delhi. Standard
strains of Escherichia coli (MTCCB 82), Pseudomonas aeruginosa
(MTCCB 741), Staphylococcus aureus (MTCCB 737) and
Klebsiella pneumoniae (99/209) were included in each test as
recommended by the National Committee for Clinical Labora-
tories Standards (NCCLS), purchased from Institute of Micro-
bial Technology, Chandigarh, India.
2.5. Antibacterial screening
Antibacterial activities of the extracts were determined by the
microbroth dilution assay [2,10]. The plant extracts were
dissolved in deionized water at a concentration of 2500 mg/mL. Proper controls were kept for each experiment. The
bacterial strains used as inocula were grown at 37 1C to get
OD 0.6 at 600 nm and used in susceptibility testing. The lowest
concentration, which inhibited any visual growth, was con-
sidered to be minimum inhibitory concentration (MIC).
2.6. Antifungal screening
All the extracts were dissolved in water to achieve a
concentration of 2500 mg/mL. Aspergillus species cultures
were grown on Sabouraud dextrose agar at 37 1C until
sporulation occurs, typically for 5 days. The spores were
harvested in sabouraud dextrose broth and the numbers of
colony forming units (CFU) per milliliter were determined by
plating serial dilutions on Sabouraud dextrose agar plates.
For susceptibility tests, serial two-fold dilutions of extracts
were made using Sabouraud dextrose in 100 mL volumes and
were inoculated with 100 mL of the spore suspensions having
2� 104–2� 105 CFU/mL in Sabouraud dextrose broth. The
cultures were incubated for 48 h at 37 1C [11]. MICs were
determined at the lowest concentration that inhibited visible
fungal growth.
2.7. Auto-MS/MS
MS/MS experiments were performed on an Agilent 1290
Infinity Series HPLC interfaced to an Agilent 6538
Accurate-Mass QTOFMS. A volume of 20 mL of each sample
was injected into ZORBAX 300SB reversed phase column
(C-18, 4.5 mm� 250 mm) of 5 mm particle size. The column
temperature was maintained at 40 1C. Mobile phase com-
prised solvent A (water containing 0.1% formic acid) and
solvent B (acetonitrile containing 0.1% formic acid) and
used the following iFn gradient mode {time/concentration
(min/%)} for solvent B: 8/5%; 15/10%; 22/45%; 30/65%;
35/90%; and 40/5%, with flow rate of 0.4 mL/min. The mass
spectrometer was operated in positive ion polarity mode with
following parameters: gas temperature 350 1C, nebulizer
50 psi, gas flow 8 L/min, capillary voltage 3500 V, nozzle
500 V and fragmentor voltage 175 V. The QTOF was operated
in the extended dynamic range (1700m/z, 2 GHz). To assure
the mass accuracy of recorded data, continuous internal
calibration was performed using standards of signals and
lidocaine (234.3 m/z); 5,7-isoflavone (284.3m/z) was infused
with samples as external standards.
2.8. Auto-MS/MS data analysis
Initial processing of HPLC–QTOFMS data e.g., baseline
correction, noise reduction, and background contaminants
removal, were performed by MassHunter Workstation Soft-
ware (Version 3.1 Qualitative Analysis, Agilent Technologies).
The molecular features of spectra were extracted using auto-
MS/MS extraction tool of MassHunter Software. The mole-
cular formulas were generated and searched in a specific
library generated in house at the Institute.
2.9. Targeted QTOF MS/MS
Quantization was done by the standard addition method by
spiking control plant samples with standard solutions of CA,
EC and EGC (ranging from 0.08 to 10 mg/mL). Crude extracts
of various plant parts as well as standard metabolites were
introduced into the HPLC–QTOFMS operated in the positive
mode. Parameters for targeted MS/MS were the same as in
auto-MS/MS. However, collision energies for MS/MS spectra
for CA, EC and EGC were adjusted to 25, 35 and 26 V,
respectively.
2.10. Targeted MS/MS data analysis
All the three standards and metabolites of extracts were
quantified by targeted MS/MS analysis. Agilent Mass Hunter
Qualitative Analysis Software (Version B 2.0.0.2) was used to
process the data. A window of 100 mg/mL was set for fragment
identification. Standards and their corresponding metabolites
in the extracts were quantified using the peak size of the
fragment of the extracted ion chromatogram function. Meta-
bolites were quantified by the formation of metabolite specific
fragments.
3. Results and discussion
3.1. HPLC–QTOFMS
A solution of 5.0 mg/mL of all the samples from S. asoca was
used for targeted and non-targeted analyses. As the water
extracts contained polar compounds, the reversed phase
chromatographic system was employed for rapid separation
of a wide range of compounds. All the metabolites ionizable
and detectable with the ESI (þ)-MS were eluted in 35 min on a
C-18 column of 5 mm particle size. The elution was continued
for additional 10 min to ensure the complete removal of
sample from the column. Retention time variability across
the samples was found to be 3 s or a relative standard
deviation (RSD) of less than 6%. The QTOFMS was
calibrated before analysis and the mass accuracy achieved
was below 2.0 mg/mL calculated by using reference ions.
A visual examination shows the differences between the
total ions chromatograms of samples employed in the study.
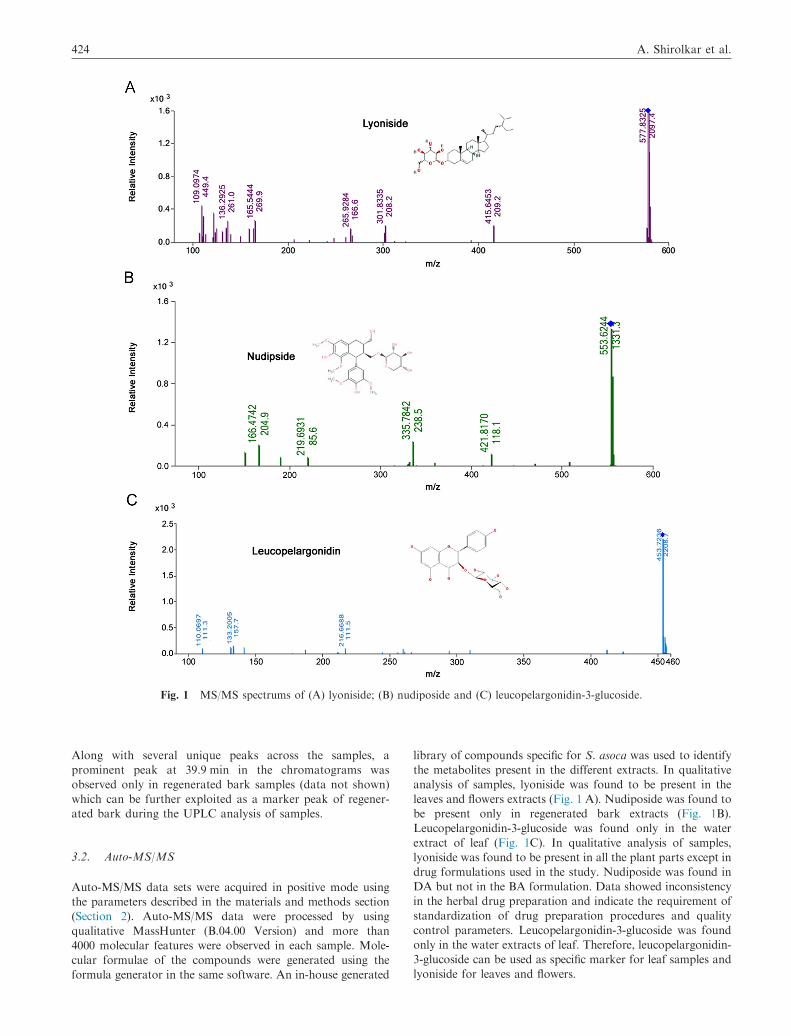
Fig. 1 MS/MS spectrums of (A) lyoniside; (B) nudiposide and (C) leucopelargonidin-3-glucoside.
A. Shirolkar et al.424
Along with several unique peaks across the samples, a
prominent peak at 39.9 min in the chromatograms was
observed only in regenerated bark samples (data not shown)
which can be further exploited as a marker peak of regener-
ated bark during the UPLC analysis of samples.
3.2. Auto-MS/MS
Auto-MS/MS data sets were acquired in positive mode using
the parameters described in the materials and methods section
(Section 2). Auto-MS/MS data were processed by using
qualitative MassHunter (B.04.00 Version) and more than
4000 molecular features were observed in each sample. Mole-
cular formulae of the compounds were generated using the
formula generator in the same software. An in-house generated
library of compounds specific for S. asoca was used to identify
the metabolites present in the different extracts. In qualitative
analysis of samples, lyoniside was found to be present in the
leaves and flowers extracts (Fig. 1 A). Nudiposide was found to
be present only in regenerated bark extracts (Fig. 1B).
Leucopelargonidin-3-glucoside was found only in the water
extract of leaf (Fig. 1C). In qualitative analysis of samples,
lyoniside was found to be present in all the plant parts except in
drug formulations used in the study. Nudiposide was found in
DA but not in the BA formulation. Data showed inconsistency
in the herbal drug preparation and indicate the requirement of
standardization of drug preparation procedures and quality
control parameters. Leucopelargonidin-3-glucoside was found
only in the water extracts of leaf. Therefore, leucopelargonidin-
3-glucoside can be used as specific marker for leaf samples and
lyoniside for leaves and flowers.
Table 1 Transitions, retention time, collision energy, calibration range, regression coefficients and limit of quantization for the
catechins.
Compound Transition Retention
time (min)
Collision
energy (V)
Test
range (ng)
R2 LOD (ng)
(þ)-Epicatechin 291.27-139.2374 25.261 25 0.78–10.0 0.9837 0.781
(þ)-Catechin 291.27-139.2387 24.447 25 0.78–10.0 0.9407 1.5625
(�)-Epigallocatechin 307.27-163.4057 23.800 26 0.78–10.0 0.9874 0.781
LOD¼ limit of detection.
Correlation of catechins with antimicrobial activity 425
3.3. Targeted MS/MS
To quantify (þ)-catechin and (�)-epigallocatechin from
different parts of S. asoca along with Ashokarista, targeted
MS/MS was used successfully. Accurate MS/MS spectra of
the compound provide a high level of confidence for the
identification and quantification of raw and processed plant
based drugs, which is rather difficult by other technologies.
The gradient of water containing 0.1% formic acid and
acetonitrile 0.1% formic acid method produced well-shaped
peaks for EC, CA and EGC at 24.447, 25.261 and 23.8 min,
respectively (Fig. 2A, C). The molecular transitions and collision
energy employed in targeted MS/MS for different standards are
shown in Table 1. Fragmentor voltage 75 V was kept constant
throughout the study. MS/MS peak intensities were found to be
reproducible after normalization to the same molar quantity.
MS/MS revealed that the signals responses for compounds were
comparable, and therefore no correction factor was required. A
linear regression line was calculated for the standards used for
each metabolite to account for the dependence of ionization on
the size (m/z) of the parental ion. (Table 1)
The spectra generated for compounds in positive ion detection
gave the protonated molecules and their transitions ions
[M Hþ] (m/z) 291.27-139.237 for EC and CA (Fig. 2B),
307.27-163.405 for EGC (Fig. 2D). Identification of compounds
was done on the basis of retention time and presence of peak in
the trace compared with those of the standards. EC and CA
isomers of 291.7m/z were successfully separated from the mixture
of three compounds (Fig. 2). Compounds used in the study were
quantified (n¼10) from 10 different samples using a standard
calibration curve (from 0.08 to 10 ppm). Good correlation
coefficients were obtained in the concentration range studied
(Table 1). The results for reproducibility were relative standard
deviations (RSD) of 1.5%, 1.5% and 2% for run-to-run precision,
on CA, EC and EGC concentrations, respectively. The lowest
detection limit based on a signal-to-noise ratio of 3:1 was
calculated through the standard addition curves, giving a value
of compounds studied in the samples.
EC and CA were found to be universally present throughout
the samples. Regenerated bark samples showed significantly
higher amount of EC and CA (4.048 and 2.249 mg/mL) as
compared to other samples. CA was found to be significantly
elevated in BHWE, RBHWE, LWE and LHWE as compared
to other parts of the plant (Fig. 3A). RBWE and RBHWE
contain significantly high amount of EC (Fig. 3B). BHWE also
contains significantly higher amounts of EGC (Fig. 3C). In the
present study, leaf sample was found to have the highest
amount of CA (4.14þ0.698 mg/mL). The regenerated bark was
found to contain 4.048þ0.423 mg/mL EC which is almost two-
fold higher than that CA. EGC was found to be present only in
normal bark extracts. Ashokarista formulations used in the study
did not show antimicrobial activity which may be due to lower
amounts of catechins in drug samples. Besides this, Ashokarishta
formulation from BA was found to have seven times higher EC
than DA, showing the variations among the drugs (Fig. 3).
Targeted MS/MS was found to be more accurate and
sensitive to quantize catechins instead of other reported
methods [14]. The method showed good results in terms of
detection limits, repeatability and linearity (Table 1). As
shown in Fig. 3, CA and EC were found to be elevated in
RBHWE, LWE and LHWE which are crucial for the
flavanoids and cutin biosynthesis. Correlating the above facts,
RBHWE and LHWE were found to have better antimicrobial
activity among the samples (Table 2).
3.4. Antimicrobial activity
Various parts of S. asoca were evaluated for their antimicrobial
potential against six microorganisms using microbroth dilution
assay (Table 2). LHWE and RBHWE were found to have better
activity among the samples and MIC was recorded to be 0.266–
0.5325 mg/mL against the bacterial species. Other samples
showed variable activity in the range of 0.5325–6.25 mg/mL.
MICs against the fungal species were found to be in the range of
12.5–1.065 mg/mL. LWE water extract exhibited better antifun-
gal activity, where MIC was observed to be 1.065 mg/mL.
Catechins are essential components in foods and herbal
medicines and well reported in S. asoca. Along with several
other biological activities S. asoca is also reported for anti-
microbial activity [2]. Puhl and Treutter [12] reported the anti-
infective activity of catechins. However, contradictory reports
have been published by Bais et al. [13]. In the present study,
RBHWE got better activity among the samples may be because
exposure of internal tissue of the plant to external environment
increased the synthesis of molecules to combat infections.
Flavanoids and cutin protect the plant from various infec-
tions and might be elevated in response to infections and to
avoid moisture loss [15]. The EGC was absent in the regener-
ated bark samples indicating the importance of CA and EC
over it, in prevention of infections. However, EGC was present
in significantly higher amounts in the bark hot water extract
having less antimicrobial activity. It shows that down-
regulation of EGC and up-regulation of CA and EC biosynth-
esis during the regeneration process of bark may be important
in the healing process. The accumulation of catechin derived
procyanidins is one fundamental factor inhibiting the growth of

Fig. 2 (A) ESI chromatogram showing separation of isomers 291.27 m/z, (þ)-catechin and (þ)-epicatechin. The earlier peak
represents (þ)-catechin while the later is for (þ)-epicatechin. (B) The product ion spectrum for (þ)-catechin and (þ)-epicatechin.
(C) An ESI chromatogram representing the unique peak of (�)-epigallocatechin (307.27 m/z). (D) A product ion spectrum
for (�)-epigallocatechin.
A. Shirolkar et al.426

Fig. 3 Quantitative analysis of (A) (þ)-catechin, (B) (þ)-epicatechin and (C) (�)-epigallocatchin in mg/mL.
Table 2 MIC (mg/mL) of plant extracts against the
microorganisms by microbroth dilution broth assay.
Extract PA KP SA EC AF AFL
BWE 6.250 6.250 12.500 12.500 – –
HBWE 1.065 1.065 3.125 1.065 6.250 –
RBWE 3.125 3.125 1.065 1.065 6.250 –
RBHWE 0.266 0.532 0.532 0.532 6.250 –
LWE 1.065 1.065 1.065 1.065 6.250 –
LHWE 0.5325 0.5325 0.5325 0.532 1.065 6.250
FEW 3.125 6.250 6.250 6.250 6.250 –
FHWE 1.065 1.065 1.065 1.065 3.125 12.50
DA – – – – – –
BA – – – – – –
PA¼P. aeruginosa, KP¼ K. pneumoniae, SA¼ S. aureus,
EC¼E. coli, AF¼A. fumigatus, and AFL¼ A. flavus.
Correlation of catechins with antimicrobial activity 427
the pathogenic fungus Botrytis cinerea in immature strawberry
fruits [12]. However, Bais et al. [13] contradict the reports. But
in the present study, it is clear that CA and EC levels increase in
the regenerated bark and leaves which shows importance of
these metabolites in the prevention of infection.
4. Conclusion
The study has correlated antimicrobial activity with catechins
present in S. asoca samples. For catechins quantization a
convenient, sensitive, high-throughput, and reliable HPLC–
QTOFMS method was developed which can also be used to
identify morphologically same parts of S. asoca. A careful
examination of data, in particular of LWE, shows that some
other antimicrobial entities along with catechins are also
present in the extracts which need to be explored.
Quality control of herbal drugs which is an important
challenge in present scenario can be addressed with reliable
and sensitive quantization of important biological active meta-
bolites in the sample(s). Present study also demonstrates that
quantization of catechins can be used as a powerful tool to
profile and differentiate phytochemical compositions of
S. asoca samples and herbal drugs. The identified specific marker
compounds from qualitative analysis can be further utilized for
authentication of plant parts. The method can also be used to
separate and quantify CA and EC isomers along with EGC
using a simple solvent scheme. Overall, this work can be utilized
for the evaluation of quality of medicinal herbs having signifi-
cance in the pharmacological and clinical investigation.
Acknowledgments
This study was supported by Central Council for Research
in Ayurvedic Sciences (CCRAS), Department of AYUSH,
Government of India.
References
[1] B.B. Aggarwal, S. Prasad, S. Reuter, et al., Identification of novel
anti-inflammatory agents from ayurvedic medicine for prevention

A. Shirolkar et al.428
of chronic diseases: reverse pharmacology and bedside to bench
approach, Curr, Drug Targets 12 (2011) 1595–1653.
[2] R. Dabur, A. Gupta, T.K. Mandal, et al., Antimicrobial activity
of some Indian medicinal plants, Afr. J. Trad. Compl. Alter.
Med. 4 (2007) 313–318.
[3] P. Pradhan, L. Joseph, V. Gupta, et al., Saraca asoca (Ashoka): a
review, J. Chem. Pharm. Res. 1 (2009) 62–71.
[4] S. Jayita, M. Taniya, G. Kamala, et al., Phytoconstituents and
HPTLC analysis in Saraca asoca (Roxb.)Wilde, Int. J. Pharm.
Pharma. Sci. 4 (2012) 96–99.
[5] A. Gahlaut, P. Taneja, A. Shirolkar, et al., Principal component
and partial least square discriminant based analysis of methanol
extracts of bark and re-generated bark of Saraca asoca, Int. J.
Pharm. Pharma. Sci. 4 (2012) 331–335.
[6] A. Gahlaut, A. Gothwal, R. Dabur, TLC based analysis of
allelopathic effects on tinosporoside contents in Tinospora cordi-
folia, J. Chem. Pharm. Res. 4 (2012) 3082–3088.
[7] Z. Zeng, F.T. Chau, H.Y. Chan, et al., Recent advances in the
compound-oriented and pattern-oriented approaches to
the quality control of herbal medicines, Chin. Med. (2008) 3:9,
10.1186/1749-8546-3-9.
[8] M. Li, X. Hou, J. Zhang, et al., Applications of HPLC/MS in the
analysis of traditional Chinese medicines, J. Pharm. Anal. 1
(2011) 81–91.
[9] X.F. Chen, H.T. Wu, G.G. Tan, et al., Liquid chromatography
coupled with time-of-flight and ion trap mass spectrometry for
qualitative analysis of herbal medicines, J. Pharm. Anal. 1 (2011)
235–245.
[10] A. Tasleem, T.K. Mandal, N. Kumar, et al., In vitro and in vivo
antimicrobial activities of seeds of Caesalpinia bonduc (Lin.)
Roxb, J. Ethnopharma. 123 (2009) 177–180.
[11] R. Dabur, G.L. Sharma, In vitro antifungal activity of 2-(3,4-
dimethyl-2,5-dihydro-1H-pyrrol-2-yl)-1-methylethyl pentanoate, a
dihydropyrrole derivative, J. Med. Microbiol. 54 (2005) 549–552.
[12] I. Puhl, D. Treutter, Ontogenetic variation of catechin biosynthesis
as basis for infection and quiescence of Botrytis cinerea in developing
strawberry fruits, J. Plant Dis. Prot. 115 (2008) 247–251.
[13] H.P. Bais, L. Venkatachalam, M.A. Biedrzycki, Stimulation or
inhibition conflicting evidence for (7)-catechin’s role as a
chemical facilitator and disease protecting agent, Plant Signal.
Behav. 5 (2010) 239–246.
[14] J. Zhanga, J. Yanga, J. Duana, et al., Quantitative and qualitative
analysis of flavonoids in leaves of Adinandra nitida by high
performance liquid chromatography with UV and electrospray
ionization tandem mass spectrometry detection, Anal. Chim.
Acta 532 (2005) 97–104.
[15] M. Irit, F. Faoro, Chemical diversity and defence metabolism:
how plants cope with pathogens and ozone pollution, Int. J. Mol.
Sci. 10 (2009) 3371–3399.


![Chapter Role of Tea Polyphenols in Metabolic Syndrome · tea catechins [9, 11]. Notably, the health-promoting properties of green tea are due to the presence of the catechins mentioned](https://img.pdfslide.us/doc/110x75/5f1048e47e708231d44859c5/chapter-role-of-tea-polyphenols-in-metabolic-syndrome-tea-catechins-9-11-notably.jpg)