Embed Size (px)
Citation preview
ASSESSMENT OF CATECHINS AND OTHER
POLYPHENOLS AS PARAMETERS OF TEA QUALITY IN
SELECTED ECOLOGICAL ZONES IN KENYA
THADDEUS MOSE MANGENYA
MASTER OF SCIENCE
(Biochemistry)
JOMO KENYATTA UNIVERSITY OF
AGRICULTURE AND TECHNOLOGY
2016
Assessment of Catechins and other Polyphenols as Parameters of Tea
Quality in selected Ecological Zones in Kenya
Thaddeus Mose Mangenya
A thesis submitted in partial fulfillment for the Degree of Master of
Science in Biochemistry in the Jomo Kenyatta University of
Agriculture and Technology
2016

ii
DECLARATION
This thesis is my original work and has not been presented for a degree in any other
university.
Signature…………..................................... Date……………………………
Thaddeus Mose Mangenya
This thesis has been submitted for examination with our approval as university
supervisors.
Signature ………………………………… Date……………………………
Dr. Johnson K. Kinyua
JKUAT, Kenya
Signature………………………………… Date…………………………...…
Prof.. Daniel Kariuki
JKUAT, Kenya
Signature ………………………………… Date…………………………….
Prof. Esther N. Magiri
JKUAT, Kenya
Signature ………………………………… Date………………………………..
Prof. Martin A. Obanda
JKUAT, Kenya

iii
DEDICATION
This thesis is dedicated to my beloved daughter Jemimah Moraa Matara Mangenya.
iv
ACKNOWLEDGEMENTS
I am heavily indebted to the Almighty Lord for making this great achievement a reality
and for being with me always in every sphere of life. I would like to express my sincere
and heartfelt gratitude to all my supervisors; Dr. Johnson K. Kinyua, Dr. Daniel Kariuki,
Prof. Esther N. Magiri and Prof. Martin A. Obanda for their invaluable support, constant
advice, guidance and encouragement throughout my research period and writings. I am
heavily indebted to Dr. J. K. Wanyoko, the programme leader, Tea Processing and
Value Adittion (TPVA) Programme of the Tea Research Foundation of Kenya (TRFK)
for allowing me use their research facility at Kericho and the Chemistry departmental
staff at the Coffee Research Foundation (CRF), Ruiru for providing and assisting me the
use of their HPLC to analyse the tea samples. My special thanks also goes to Dr. Joseph
Ng‟ang‟a, of the Biochemistry department at the JKUAT for facilitating my progress in
the Master of Science program. Special thanks to my classmates Shadrack, Justus,
Caroline and Catherine for their encouragement, advice and support.
My mum Elizabeth Kwamboka, Dad the late Mikaeri Manwa, my siblings Dr. William
Gisesa, the late Dr. Charles Ogeto, Paul Ndege, Teresia, Sabina, Mokeira and Asenath
and their wonderful families, I cannot find sufficient words to express my profound
gratitude for your love and deep understanding. My appreciation also goes to my
beloved wife Stella, my children Wendy, Carol, Lisa, Mike and Charles. I also
appreciate with thanks the support of Jane Nyaberi who read and corrected the
manuscript and the ladies who typed this work Doreen Andala and Jacky Ayuka. I also
appreciate the support of Mr Reuben Ngeno, the chief librarian at the TRFK for allowing
me the use of reading materials at the TRFK library.
I express my indebtness to the National Commision for Science and Technology and
Innovation (NACOSTI) and Jomo Kenyatta University of Agriculture and Technology
(JKUAT) for funding this project. I cannot fail to acknowledge the support of the Kenya
Tea Development Authority (KTDA) Management who provided the samples for the

v
research work and to the Managing Director of Tea Brokers East Africa (TBEA), Mr. Z.
Onditi for allowing the tasting of the tea samples to be done at their tea tasting facility in
Mombasa.
To the Almighty God once again, may your Mighty name be glorified always and to the
end of times!
vi
TABLE OF CONTENTS
DECLARATION ............................................................................................................................................... II
DEDICATION .................................................................................................................................................. III
ACKNOWLEDGEMENTS ...........................................................................................................................IV
TABLE OF CONTENTS ...............................................................................................................................VI
LIST OF TABLES ............................................................................................................................................ X
LIST OF FIGURES .........................................................................................................................................XI
APPENDICES ................................................................................................................................................. XII
LIST OF ABBREVIATIONS AND ACRONYMS .............................................................................. XIII
ABSTRACT ....................................................................................................................................................XIV
CHAPTER ONE .................................................................................................................................................1
INTRODUCTION..............................................................................................................................................1
1.1 Background to the study ................................................................................... 1
1.1.1 Tea production in Kenya............................................................................ 3
1.1.2 Economic importance of tea ...................................................................... 5
1.1.3 Chemical constituents of tea ...................................................................... 6
1.2 Statement of the problem.................................................................................. 7
1.3 Objectives ......................................................................................................... 8
1.3.1 General objective ....................................................................................... 8
1.3.2 Specific objectives ..................................................................................... 8
1.4 Null hypothesis ................................................................................................. 9
1.5 Justification....................................................................................................... 9
CHAPTER TWO............................................................................................................................................. 11
LITERATURE REVIEW ............................................................................................................................. 11
2.1 The tea plant ................................................................................................... 11
2.2 Types of commercial teas ............................................................................... 11
2.3 Factors influencing tea quality ....................................................................... 12
vii
2.3.1 Green leaf plucking standards.................................................................. 12
2.3.2 Tea processing.......................................................................................... 14
2.4 Bioactive compounds of tea ........................................................................... 17
2.4.2 Theaflavins and thearubigins ................................................................... 19
2.4.3 Tea alkaloids ............................................................................................ 21
2.4.4 Tea minerals ............................................................................................. 23
2.4.5 Tea amino acids ....................................................................................... 24
2.5 Tea health benefits.......................................................................................... 25
2.5.1 Antioxidant capacity of tea ...................................................................... 26
2.6 Techniques for analyzing bioactive compounds in tea................................... 27
2.6.1 Determination of antioxidant activity in tea. ........................................... 27
2.6.2 Chromatographic methods of analyzing key compounds found in tea. ... 28
2.6.3 Spectrophotometric analysis of tea .......................................................... 30
2.6.4 Organoleptic evaluation of tea ................................................................. 31
2.6.5 Leaf quality plucking determination methods ......................................... 32
2.7 Food safety standards ..................................................................................... 32
CHAPTER THREE ........................................................................................................................................ 34
MATERIALS AND METHODS ................................................................................................................. 34
3.1 Study site ........................................................................................................ 34
3.2 Experimental design ....................................................................................... 35
3.3 Sample collection ........................................................................................... 35
3.4 Leaf quality determination ............................................................................. 35
3.5 Sample pre-treatment...................................................................................... 36
3.6 Reagents and standard solutions..................................................................... 36
3.7 Extraction of polyphenols from the samples .................................................. 37
3.8 Analysis of tea leaf extracts............................................................................ 37
3.8.1 Chromatographic determination of catechins in tea samples .................. 37
3.8.2 Spectrophotometric determination of total polyphenols .......................... 38
3.8.3 Determination of total theaflavins content in the tea samples. ................ 40
viii
3.8.4 Determination of liquor total colour ........................................................ 41
3.8.5 Determination of liquor brightness .......................................................... 41
3.10 Ranking of teas as per tasters‟ organoleptic evaluation ............................... 43
3.11 Analysis of inorganic nutrients in black CTC teas ....................................... 44
3.12 Data analysis................................................................................................. 45
CHAPTER FOUR ........................................................................................................................................... 46
RES ULTS AND DISCUSS ION ................................................................................................................... 46
4.1 Green leaf plucking standards ........................................................................ 46
4.2 Chromatographic and spectophotometric analysis of tea samples ................. 49
4.2.1 The catechins content in clonal tea cultivars grown in the different
ecological zones ................................................................................................ 49
4.2.2 Tea polyphenols ....................................................................................... 53
4.2.3 Total theaflavins (TFs) and Total thearubigins (TRs) levels of black CTC
teas .................................................................................................................... 56
4.2.4. Total colour of black tea samples ........................................................... 56
4.2.5 Percent liquor brightness of black tea samples ........................................ 57
4.3 Antioxidant activity of black CTC teas from three ecological zones in Kenya57
4.4 Taster‟s score and ranking of teas from the three agro-ecological areas ....... 58
4.5 Correlation between biochemical constituents and tasters‟ evaluation of black
teas from three agro-ecological areas ................................................................... 61
4.6 Inorganic nutrient content of black CTC tea .................................................. 65
CHAPTER FIVE ............................................................................................................................................. 68
CONCLUS IONS AND RECOMMENDATIONS .................................................................................. 68
5.1 Conclusions .................................................................................................... 68
5.1.1 Total catechins ......................................................................................... 71
5.1.2 Total polyphenols..................................................................................... 72
5.1.3 Theaflavins (TFs) and thearubigins (TRs) ............................................... 73
5.1.4 Antioxidant activity ................................................................................. 73
ix
5.1.5 Inorganic nutrient content ........................................................................ 75
5.2. Recommendations ......................................................................................... 75
REFERENCES ................................................................................................................................................ 77
APPENDICES ................................................................................................................................................ 103
x
LIST OF TABLES
Table2.1: Compositional quality requirements limits for Kenyan black tea ..............................33
Table 3.1: Selected factories from the Murang’a, Meru and Kisii agro-ecological areas .......34
Table4.1: Percent leaf quality of leaf delivered to the factories for black CTC tea
manufacture, total catechins, individual catechins fractions, gallic acid and
caffeine (Mean ± SD) in black CTC tea from three tea growing agro-ecological
areas.................................................................................................................................................47
Table4.2: Total catechin content in green leaf of the three most popular cultivars of tea in
three agro-ecological areas in Kenya (Mean ± SD)......................................................48
Table4.3: Retention times for the individual catechins fractions, gallic acid and caffeine ..49
Table 4.4: Biochemical composition and characteristics of black CTC tea from three tea
growing ecological areas in Kenya (Mean±SD).............................................................55
Table4.5: Mean sensory quality scores and ranking of tea liquors prepared from black CTC
teas as assessed by professional tea tasters (n = 2; mean ± SD) ...........................60
Table 4.6: Correlation coefficient matrix analysis between aroma briskness, brightness,
strength, gallic acid, caffeine and the individual catechins (+C, EC, EGC, EGCG
and ECG).........................................................................................................................................63
Table4.7: Correlation coefficient matrix analysis between antioxidant capacity, total
polyphenols, total theaflavins, total thearubigins, total colour, aroma,
briskness, brightness and strength ....................................................................................64
Table 4.8: K, P, Ca, Mn, Fe, Zn and Cu in black tea from Murang’a, Meru and Kisii agro-
ecological areas ...........................................................................................................................67
xi
LIST OF FIGURES
Figure1.1: Map of tea growing areas of Kenya (source: KTDA, 2012)..................................... 4
Figure2.1: Schematic diagrams on major steps in tea manufacture and corresponding types of
tea................................................................................................................... 15
Figure2.2: Chemical structures of the major catechins present in tea (Zhao et al., 2014) ......... 18
Figure2.3: Structure and general scheme for the formation of individual theaflavins ............... 21
Figure2.4: Structure of caffeine and other alkaloids (Ashihara et al., 2008) ............................ 23
Figure 4.1: A sample HPLC profile of black tea caffeine, gallic acid and individual catechins at
278 nm ............................................................................................................ 50
xii
APPENDICES
Appendix I: KTDA factories grouped into regions ......................................... 103
Appendix II: A sample Analysis of Variance (ANOVA) output of the test results
(total polyphenols) from the MSTAT statistical analysis package
.................................................................................................. 104
Appendix III: A sample of the Least Significant Difference (LSD) test results
(total polyphenols) output from the MSTAT statistical analysis
package ..................................................................................... 108
Appendix IV: An abstract of a paper published .............................................. 110
xiii
LIST OF ABBREVIATIONS AND ACRONYMS
EC Epicathecin
ECG Epicatechin gallate
EGC Epigallocatechin gallate
EGCG Epigallocatechin- 3 - gallate
CTC Cut, Tear and Curl
TFs Theaflavins
TRs Thearubigins
IBMK Isobutylmethylketone (4-methylpenta-2-one)
TBK Tea Board of Kenya
ITC International Tea Committee
HPLC High Performance Liquid Chromatography
ORAC Oxygen Radical Absorbance Capacity
TBARS Thiobarbituric Acid Reactive Substance
DPPH 2, 2-Diphenyl-2-picrylhydrazyl
TRI Tea Research Institute
CRF Coffee Research Foundation of Kenya
KTDA Kenya Tea Development Agency
ANOVA Analysis of Variance
GMP Good Manufacturing Practices
KTGA Kenya Tea Growers Association
TBEA Tea Brokers of East Africa
xiv
ABSTRACT
Kenya is the third largest producer of tea in the world after China and India and
specializes in the processing and export of black CTC tea. Over 90 % of Kenyan teas
are sold to the world market through an auction based system that is dependent on the
quality of tea on offer. In the tea trade, quality is used to indicate the presence of
special desirable attributes in the tea liquor which are detected by visual, smell and
taste. The chemical composition of tea is very complex and is currently a subject of
broad medicinal and toxicological scientific studies. Previous studies have
extensively shown that catechins together with their oxidation products including
theaflavins and thearubigins are responsible for the sensory characteristics associated
with black tea liquors; astringency or briskness, colour, strength and brightness. This
study determined the biochemical profiles of tea grown by small scale farmers in
Kisii, Murang‟a and Meru ecological zones in Kenya. The levels of catechins were
quantified using reversed phase HPLC while total polyphenols content were
determined by spectrophotometric analysis. Theaflavins and thearubigin contents
were determined by the Flavognost, Roberts and Smith methods respectively.
Antioxidant activity of the tea samples was determined using the method of Brand-
Williams. This study found that teas grown in the three ecological zones differed
significantly in their polyphenols, catechins, theaflavins and thearubigins contents (P
< 0.05). Interestingly, tea samples analyzed exhibited high antioxidant activity which
differed significantly (p < 0.05) across the zones suggesting potential use of the black
teas for medicinal use. Similarities between biochemical profiles and organoleptic
evaluation at level P < 0.01 and at p < 0.05 depicted positive correlation. This study
sets a precedent for the characterization of biochemical profiles of tea from all the tea
growing areas in Kenya…………………………………………………………
1
CHAPTER ONE
INTRODUCTION
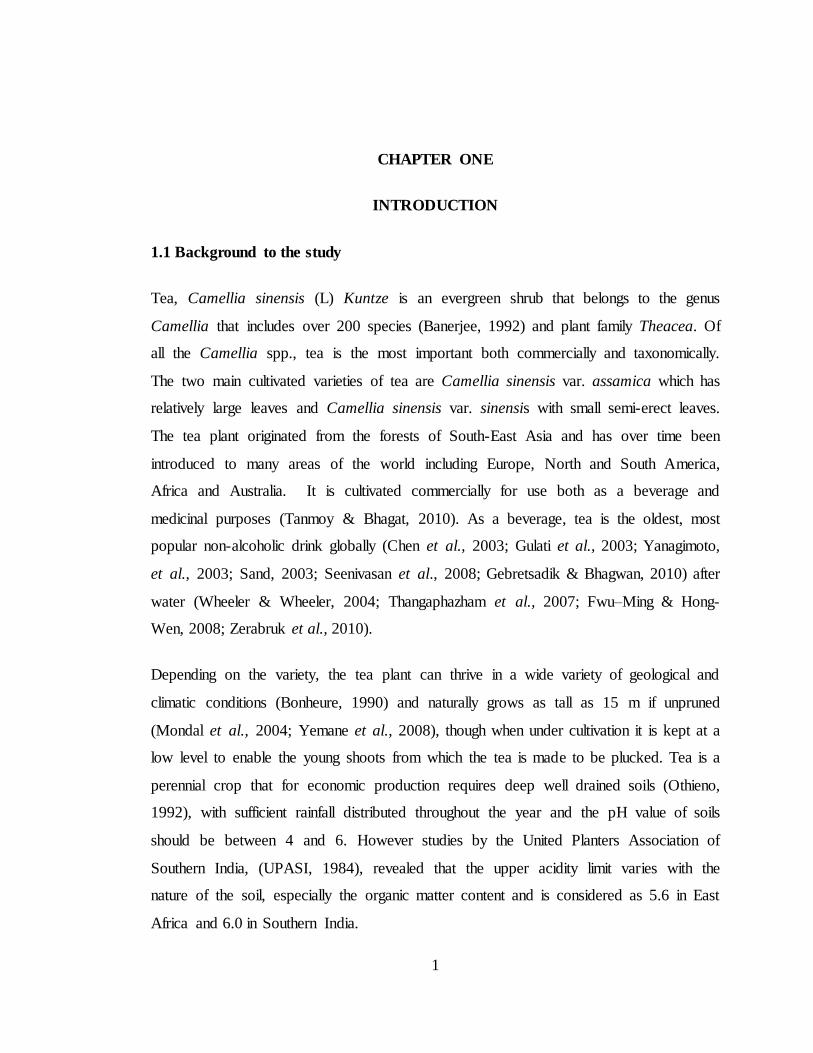
1.1 Background to the study
Tea, Camellia sinensis (L) Kuntze is an evergreen shrub that belongs to the genus
Camellia that includes over 200 species (Banerjee, 1992) and plant family Theacea. Of
all the Camellia spp., tea is the most important both commercially and taxonomically.
The two main cultivated varieties of tea are Camellia sinensis var. assamica which has
relatively large leaves and Camellia sinensis var. sinensis with small semi-erect leaves.
The tea plant originated from the forests of South-East Asia and has over time been
introduced to many areas of the world including Europe, North and South America,
Africa and Australia. It is cultivated commercially for use both as a beverage and
medicinal purposes (Tanmoy & Bhagat, 2010). As a beverage, tea is the oldest, most
popular non-alcoholic drink globally (Chen et al., 2003; Gulati et al., 2003; Yanagimoto,
et al., 2003; Sand, 2003; Seenivasan et al., 2008; Gebretsadik & Bhagwan, 2010) after
water (Wheeler & Wheeler, 2004; Thangaphazham et al., 2007; Fwu–Ming & Hong-
Wen, 2008; Zerabruk et al., 2010).
Depending on the variety, the tea plant can thrive in a wide variety of geological and
climatic conditions (Bonheure, 1990) and naturally grows as tall as 15 m if unpruned
(Mondal et al., 2004; Yemane et al., 2008), though when under cultivation it is kept at a
low level to enable the young shoots from which the tea is made to be plucked. Tea is a
perennial crop that for economic production requires deep well drained soils (Othieno,
1992), with sufficient rainfall distributed throughout the year and the pH value of soils
should be between 4 and 6. However studies by the United Planters Association of
Southern India, (UPASI, 1984), revealed that the upper acidity limit varies with the
nature of the soil, especially the organic matter content and is considered as 5.6 in East
Africa and 6.0 in Southern India.
2
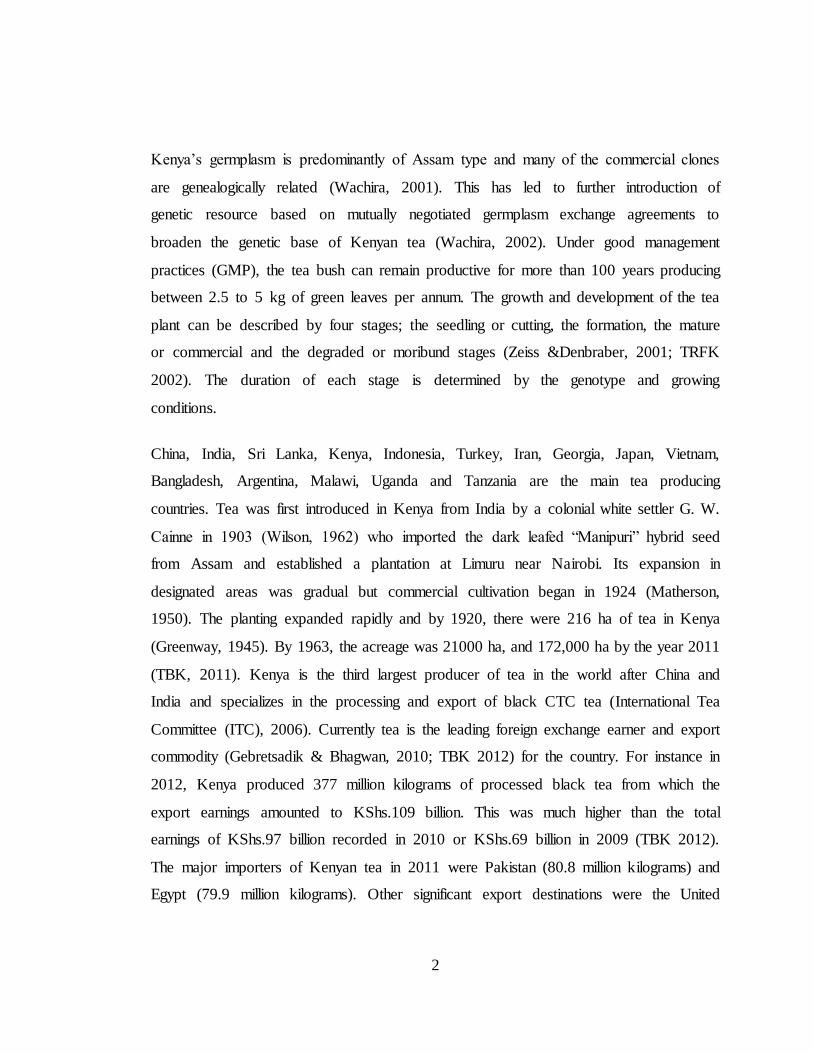
Kenya‟s germplasm is predominantly of Assam type and many of the commercial clones
are genealogically related (Wachira, 2001). This has led to further introduction of
genetic resource based on mutually negotiated germplasm exchange agreements to
broaden the genetic base of Kenyan tea (Wachira, 2002). Under good management
practices (GMP), the tea bush can remain productive for more than 100 years producing
between 2.5 to 5 kg of green leaves per annum. The growth and development of the tea
plant can be described by four stages; the seedling or cutting, the formation, the mature
or commercial and the degraded or moribund stages (Zeiss &Denbraber, 2001; TRFK
2002). The duration of each stage is determined by the genotype and growing
conditions.
China, India, Sri Lanka, Kenya, Indonesia, Turkey, Iran, Georgia, Japan, Vietnam,
Bangladesh, Argentina, Malawi, Uganda and Tanzania are the main tea producing
countries. Tea was first introduced in Kenya from India by a colonial white settler G. W.
Cainne in 1903 (Wilson, 1962) who imported the dark leafed “Manipuri” hybrid seed
from Assam and established a plantation at Limuru near Nairobi. Its expansion in
designated areas was gradual but commercial cultivation began in 1924 (Matherson,
1950). The planting expanded rapidly and by 1920, there were 216 ha of tea in Kenya
(Greenway, 1945). By 1963, the acreage was 21000 ha, and 172,000 ha by the year 2011
(TBK, 2011). Kenya is the third largest producer of tea in the world after China and
India and specializes in the processing and export of black CTC tea (International Tea
Committee (ITC), 2006). Currently tea is the leading foreign exchange earner and export
commodity (Gebretsadik & Bhagwan, 2010; TBK 2012) for the country. For instance in
2012, Kenya produced 377 million kilograms of processed black tea from which the
export earnings amounted to KShs.109 billion. This was much higher than the total
earnings of KShs.97 billion recorded in 2010 or KShs.69 billion in 2009 (TBK 2012).
The major importers of Kenyan tea in 2011 were Pakistan (80.8 million kilograms) and
Egypt (79.9 million kilograms). Other significant export destinations were the United
3
Kingdom (UK), Afghanistan and Sudan. Generally the export earnings have doubled in
the last five years (TBK 2012).
1.1.1 Tea production in Kenya
Kenya is a tropical East African country with varied climatical and geographical regions
(Gesimba et al., 2005). The Kenya tea industry is a rural based enterprise where over 62
% of the crop is produced by small scale farmers.
According to the tea board of Kenya (TBK, 2007), the Kenyan tea industry is generally
structured into two sub-sectors: large estate plantations and smallholder subsector. The
large estate subsector is composed mainly of transnational companies as well as some
local companies with medium to large plantations of over 20 to 700 ha. The small holder
subsector consists of individual farmers with an average holding of about 0.1 to 20 ha
(KTDA, 2003). The small holder subsector accounts for over 62 % of Kenya‟s tea
output and is currently managed by the Kenya Tea Development Agency (KTDA) which
started in 1964 after Kenya gained her independence. On the other hand the large estate
subsector, which accounts for the rest of the 38 % of Kenya tea, is represented by the
Kenya Tea Growers Association (KTGA) and the Nyayo Tea Zones Co-operation
(NTZC). The large plantation subsector has plantations which are managed by trained
personnel whereas the farmers in the small subsector rely on agricultural extension
officers who offer advisory service in managing their fields (Ogola & Kibuku, 2004).
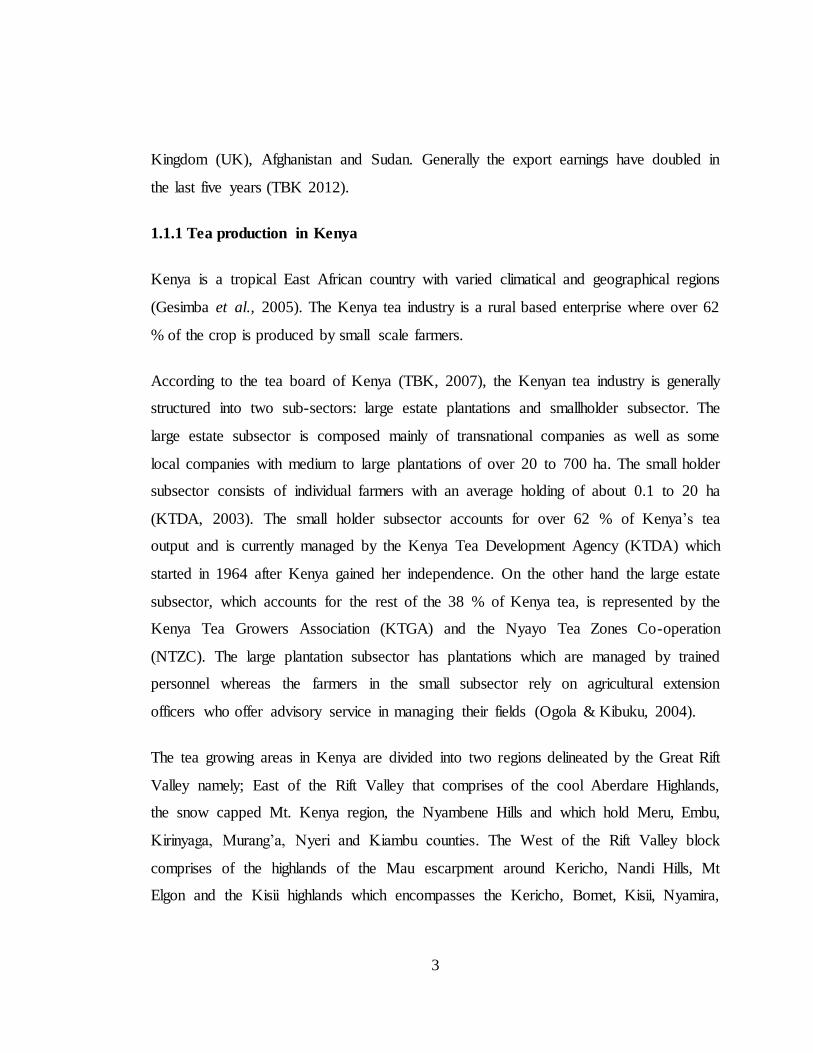
The tea growing areas in Kenya are divided into two regions delineated by the Great Rift
Valley namely; East of the Rift Valley that comprises of the cool Aberdare Highlands,
the snow capped Mt. Kenya region, the Nyambene Hills and which hold Meru, Embu,
Kirinyaga, Murang‟a, Nyeri and Kiambu counties. The West of the Rift Valley block
comprises of the highlands of the Mau escarpment around Kericho, Nandi Hills, Mt
Elgon and the Kisii highlands which encompasses the Kericho, Bomet, Kisii, Nyamira,
4
Nandi, Kitale and Vihiga counties (Fig 1). It is on the slopes of these highlands within
altitudes 1500 and 3100 m above mean sea level that tea is grown (TRFK, 2002).
Figure1.1: Map of tea growing areas of Kenya (source: KTDA, 2012)
There has been a marked rise in the Kenya tea production over the years with notable
replacement of the pioneer seedling tea with improved clonal cultivars that are better
yielding, of good quality and that take about one year from propagation to planting
unlike seed plants that take up to three years. These new varieties are said to have better
attributes like tolerance to drought, pests and diseases (Wachira, 2002; Owuor and
4° S
5
Obanda, 2001; Owuor et al., 2007). Kenyan black teas have been shown to have
between 7 to 27 % more polyphenols when compared with teas from China, Japan and
Taiwan (Wachira & Kamunya, 2005). The Kenyan tea germplasm has also been
observed to be diverse in its polyphenol composition and content (Magoma et al., 2000)
and therefore provides raw material for production of different types of tea products
including health drinks. According to the International Tea Committee, ITC (2009) and
the Kenya Tea Development Agency, KTDA (2011), Kenya mainly produces black Cut,
Tear and Curl (CTC) tea. This type of tea has the advantage of quicker brewing, makes
more cups per kilogram and a large proportion of it is sold in bulk in the export market
(KTDA, 2011). However in the recent years, the world tea prices have declined due to
slowed consumer demand as the costs of production continue to rise. This has resulted in
diminishing returns to the farmers and other stakeholders, creating a major challenge
that needs to be addressed in a multidisciplinary approach by all stakeholders. In
response to the challenge tea industry stakeholders currently are championing value
addition initiatives and product diversification as strategies to enable Kenyan tea to
compete favorably in the global tea market.
1.1.2 Economic importance of tea
The economic importance of Camellia sinensis is primarily due to its use as a beverage
and has received much attention in the entire world because of its attractive aroma and
pleasant taste. These have lately been augmented with numerous medicinal benefit
claims (Tanmoy & Bhagat, 2010). Tea has been socially and habitually consumed by
people since 300 BC (Lin et al., 2003). It is served as a diet drink for two thirds of the
world population (Muktar et al., 2000). Drinking tea is a special tradition common in
many countries such as Japan, China and Vietnam. Tea also cannot be absent in cultural
events such as circumcisions, weddings and funerals in the Eastern African region.
Tea is an important source of revenue for tea producing countries (Grahan, 1992). In
Kenya, tea contributes about 4.0 % of its GDP and about 26% of all foreign exchange
6
income, earning the country KShs. 110 billion in 2012; KShs. 116 billion in 2013
(TBK, 2013). At the household level, the tea plant is called the crop of the poor
especially in tropical mountainous areas. Even with minimal investment, tea can be
planted and the two leaves and a bud from the mature bush harvested on a ten day
period. Tea is grown on hard and sloping soils where other food crops or cash crops do
not grow well (Vo Thai, 2006). The planting of tea on remote mountain areas is also
considered an effective method to cover the sloping lands thus providing a means of soil
conservation and environmental conservation. Cultivation of tea in the remote areas also
provides many jobs to rural communities and certainly contributes to the development of
local infrastructure and consequently poverty eradication.
It also contributes to environmental conservation through enhanced water infiltration;
reduced surface erosion and mitigation of global warming through carbon sequestration.
The tea plant absorbs carbon from the environment. Tea farms can therefore generate
revenue for the farmers from carbon credits in the future once registered with relevant
carbon trading agencies. Factory companies who register their operations as clean
development mechanism (CDM) projects stand to gain revenue through carbon credits
and also safeguard the environment by embracing friendly and sustainable operations.
Green tea leaves are also used as vegetables such as “lappet tea” in Burma and “Meing
tea” in Thailand (Vo Thai, 2006). Tea branches removed during the pruning stage can be
harnessed as a source of energy to light up “jikos „and hence could be a source of
alternate energy for use in villages. Pruned tea branches not used for energy supply are
used in situ to provide organic matter to the soil.
1.1.3 Chemical constituents of tea
The tea leaf is composed of a number of different micronutrients and compounds all of
which are interconnected with the chemical reaction of its processing. Inorganic
components (mainly found as salts in the cell sap) include; K, Ca, P, Mg, Mn, Fe, S, Al,
7
Na, Si, Zn, and Cu. Nitrogen compounds also play a major role in the tea leaf. Three-
quarters of the nitrogen in the leaf is in amino acids like theanine, which is unique to tea.
Theanine is an amino acid found only in tea leaves, which imparts a pleasantly sweet
taste to tea. It is degraded to glutamic acid and has relaxation effects in humans, making
them feel calm, alert and focused. The rest comes from the alkaloid caffeine, a natural
component of all teas. Although a serving of tea usually contains less than half the
caffeine of coffee, actual caffeine levels are dependent on specific blends and the brew
strength. In general green tea contains 3 to 6 % caffeine and black tea contains 2 to 4 %
caffeine on a dry weight basis. Caffeine increases alertness, aids in tasks requiring
focusing ability and vigilance. The leaf also contains carbohydrates which are mostly
pectins and very small amounts of sugars and starches, pigments derived from
chlorophyll and flavones, and vitamins B and C. The most important parts of the leaf in
terms of its chemical reactions are the enzymes and polyphenols. The most important
enzymes are polyphenol oxidase (PPO) and Peroxidase (PO). The polyphenols occurring
in the tea plant are derivatives of gallic acid and catechins. Tea also contains phenolic
acids, mainly caffeic, quinic and Gallic catechins and other polyphenols such as
quercitin, myricitin and kaempferol.
1.2 Statement of the problem
Kenyan teas are grown in different regions that differ in both their soil characteristics
and environmental conditions. The influences of these factors on biochemical
composition and thus plain tea quality parameters are not well understood. In recent
times, tea prices have tended to remain below USD 3 per kilogram. But increased costs
of production and farm inputs have resulted in decreased profitability for the tea
producers. Currently the small holder tea farmers in different tea growing zones in the
country face financial constraints that in the long term shall threaten the tea farming
business. The fact that within the same sector farmers get differing rates of income or
returns from tea sales may make those regions with low rates to start contemplating
going into alternative activities. In order to offer an objective solution to those small
8
scale farmers suffering low prices in different ecological zones due to the quality of teas
from these areas, there is need first to assess and ascertain the variations in the
biochemical compositions in the teas from different ecological zones and illustrate how
they affect organoleptic quality and possibly pricing.This study is the first of its kind in
Kenya and aims to profile biochemical attributes of tea from the different ecological
zones and the effect of environmental conditions on biochemical composition and
subsequently on quality and prices.
1.3 Objectives
1.3.1 General objective
To elucidate the differences in the quality attributes of teas grown and processed by
small scale farmers in three ecological zones represented by Murang‟a, Meru and Kisii
tea growing catchment areas based on biochemical analysis.
1.3.2 Specific objectives
i. To determine the variations in plucking leaf quality standards of harvested leaf
processed in three ecological zones represented by Muranga, Meru and Kisii.
ii. To quantitatively determine the levels of catechins, caffeine, total polyphenols
and inorganic nutrient content in clonal green tea leaf.
iii. To determine the levels of theaflavins, thearubigins and total polyphenols, liquor
brightness, total colour responsible for black tea quality of leaf processed
iv. To determine the radical scavenging properties (antioxidant capacity) of
processed black tea using DPPH radical scavenging technique.
v. To evaluate a correlation between biochemical components of black teas from
different ecological zones and their organoleptic quality.
9
1.4 Null hypothesis
There are no significant differences in the plucking standards of green leaf, individual
catechins, polyphenols, plain quality parameters, antioxidant potential and correlation in
black teas processed in three ecological zones represented by Muranga, Meru and Kisii
1.5 Justification
Kenya is a major producer of black tea. All consumers globally including tea consumers
are keen about the biochemical composition, food safety standards, and health benefits
accrued from the products they consume (Moseti, 2013; Moseti et al., 2013). In this
regard, tea from Kenya being grown in highlands is thus expected to experience slow
growth conditions leading to high polyphenol and catechin contents. In the tea trade,
these growing characteristics are associated with high quality (Owour et al., 1990). For
this reason, Kenyan tea is usually blended with low catechin content teas from other tea
producing nations to enhance their quality. Though Kenyan teas are on average of high
quality, the quality of tea from the different tea growing regions still vary due to myriad
of reasons among them; the various stages of production, soil and fertilizers, climate and
environmental conditions (Robertson,1983; Owour,1995).
Screening of tea for the levels of catechins, caffeine, total polyphenols, TFs and TRs is
aimed at obtaining data on green tea leaf composition and changes during processing at
the factory level that lead to variations in tea quality arising from different growing
zones amongst small scale farmers in Kenya. The knowledge acquired from this study
will add to the body of knowledge necessary in developing an objective way of
assessing and marketing of tea from various ecological zones in Kenya. In addition, it
may offer invaluable information on how variations in ecological conditions of altitude,
soils, and ambient conditions of growth lead to variations in production quality
parameters of leaf harvesting intervals, leaf standards, wither, duration of fermentation
conditions and temperature and the organoleptic quality of the final product.
10
This study will a help in quantifying constituents in teas from different zones that are
unique to them and the development of specific quality attributes of black tea. The data
obtained may provide insight into the processing conditions necessary for production of
quality teas irrespective of ecological zone and growth conditions. In this way, higher
returns may be realized by the individual tea factories which hitherto have tended to
produce less than high quality black tea.
Information obtained from this study will be useful in highlighting the best regions to
obtain tea with desirable levels of polyphenols, caffeine and catechins for value addition
of tea products. Branding may involve stating the types of biochemical composition
present in the teas and in what concentration. Buyers will then be able to source Kenyan
teas from specific regions as per catechins and phenolic contents.
11
CHAPTER TWO
LITERATURE REVIEW
2.1 The tea plant
Botanically, the tea plant has three main varieties based on leaf features such as size,
pose and growth habits (Sealy, 1958). These are the China, the Assam and the Cambodia
or Indo-China tea: Camellia sinensis variety sinensis, Camellia variety Assamica and
Camellia variety Cambodia, respectively. The three main taxa can also be differentiated
by foliar, floral and growth features (Hadfield, 1974; Sealy, 1958) and by biochemical
affinities (Hazarika et al., 1984, Magoma et al., 2000; Owuor et al., 1986, Ozowa et al.,
1969; Roberts et al., 1958; Sanderson, 1963; Takeo, 1983). These tea varieties are
present in all the tea growing zones in Kenya.
2.2 Types of commercial teas
Nowadays hundreds of different types of commercial teas are produced. The different
types of tea products are based on the method of manufacture and consequently their
chemical composition (Reeves et al., 1987). Commercial teas can generally be classified
into three main categories; the non-fermented green teas, the partially fermented oolong
and paochong teas, and the fully fermented black and pu-erh (red) teas (Lin et al., 1998).
In Kenya, the majority of processed teas are categorized as black. The nature and quality
of a given tea product irrespective of its category is mainly dependent on the chemical
composition of the unprocessed tea and the reactions they undergo during the
manufacture process. The cutting technique of manufacture of the mentioned tea
products (green, oolong and black) may be orthodox or non-orthodox and vary
considerably in their impact on the formative and degradative reaction patterns of the
various cellular components (Mahanta & Hemanta, 1992; Wilson & Clifford, 1992). In
the world market, black tea represents approximately 78 % of the global tea production
and is the most common type of tea in the United States of America and Europe (Jian-
12
Min, Yuan, 2007). Though most of the tea produced in the world can be classified as
non-aerated, green and aerated, black tea (Owuor et al., 1986), processing has
diversified leading to production of speciality tea products such as purple, white
flavored, organic, decaffeinated, herbal and various other types of tea. In this present
study, black Cut, Tear, Curl (CTC) tea was used as it is the main product processed,
marketed and consumed in the study area (Kenya).
2.3 Factors influencing tea quality
Many studies have compared the biochemical composition of black teas produced in
different countries. These studies have shown that the composition of the volatile flavor
compounds in black tea (Wickremasinghe et al., 1973; Yamanishi et al., 1968); black tea
aroma (Aisaka et al., 1978; Owuor et al., 1996) and black tea plain quality parameters
(Owuor et al., 1986b) vary with geographical area of production. However it is also
known that the biochemical and quality variations occur due to the variation in the
genetic make-up of the plants (Magoma et al., 2000; Owuor et al., 1995; 1998) and
green leaf quality (Owuor et al., 1987, 1990). Other factors constituting important
influences on the composition of tea include species, seasons, age of the leaves
(plucking position), climate, horticultural conditions (soil,water, minerals and fertilizers)
(Lin et al., 1996) and type of processing.
2.3.1 Green leaf plucking standards
It has been well demonstrated that agronomic practices affect the quality of black tea
from Camellia Sinensis (L) O.Kuntze. One such agronomic/cultural practice reported to
affect black tea quality is plucking standard. Coarse plucking reduces black tea quality
(Owuor et al.,1987, 1990; Owuor,1989,1990) due to the decline in catechin levels
(Forrest and Bendall,1960) and changes in polyphenol oxidase isoenzyme composition
and activity (Takeo & Baker,1973; Thanaraj & Seshadri,1990; Obanda & Owuor.,1992)
leading to a general decline in total TF levels (Owuor et al.,1987; Owuor,1990). There is
13
concomitant increase in unsaturated fatty acids (Owuor et al., 1990) leading to
production of less aromatic black teas (Owuor et al., 1987).
Although the recommended plucking standard in Kenya is two leaves and a bud
(Othieno, 1988), KTDAs minimum leaf quality standard is 75% good quality for its
factories though some farmers are known to pluck coarser leaf. Such a practice is
erroneously thought to lead to higher crop volume, even though it sacrifices quality. The
proponents of the practice argue that the extra crop, obtained by coarse plucking per
plucking round, more than compensates for loss in quality. However, recently it was
demonstrated that, provided plucking rounds are shortened, fine plucking can be carried
out at shorter interval, resulting in improved yields (Odhiambo, 1989; Owuor &
Odhiambo, 1984) and quality (Owuor et al., 1990).
Despite the knowledge that green leaf catechin levels and composition (Forrest &
Bendall, 1966; Obanda & Owuor, 1992), and /or polyphenol oxidase activity (Takeo &
Baker, 1973; Thanaraj &Seshadri,1990 ) decline with coarse plucking standards, black
tea manufacturers normally set the same fermentation time, with changes only being
instituted to take into account the variations in ambient temperatures. Thus fermentation
times are shortened during hot conditions and lengthened during cold conditions.
Variations do not normally take into account the standard of plucking of the leaf. This is
so as fermentation conditions of time, temperature, and humidity have been documented
to cause changes in the chemical compositions and hence quality of black tea at two
leaves and a bud plucking standard (Cloughley, 1979; Owour & Reeves, 1986). As a
result fermentation is normally very closely monitored during black tea processing.
In this study which compared variations in biochemical compositions of tea from three
ecological zones, an attempt was made to relate whether the variations in plucking
standards in the zones contribute to the quality of black teas emanating from them.
14
2.3.2 Tea processing
Tea is obtained from the processing of young shoots of the tea plant. The young plants
are raised from cuttings obtained from mother bushes and are carefully tendered in
nursery beds until they are 12 to 15 months old. They are then planted out in tea fields
with a spacing of between 1.0 to 1.5 m (KTDA, 2011). This practice of raising tea is
standard across the smallholder sector in Kenya. Unlike most herbs that only need to be
dried, commercial tea must be “processed”. Tea is harvested manually or mechanically,
with each pluck taking only the flush (youngest two leaves and a bud), and these tender
and succulent fresh growth is the raw material from which a number of tea products are
processed. Plucking youngest two leaves and a bud represents standard or fine plucking,
the first step towards superior quality tea manufacture. The interval between plucking
and delivery is kept as short as possible and great care is taken when transporting green
leaf to the factory (KTDA, 2012).
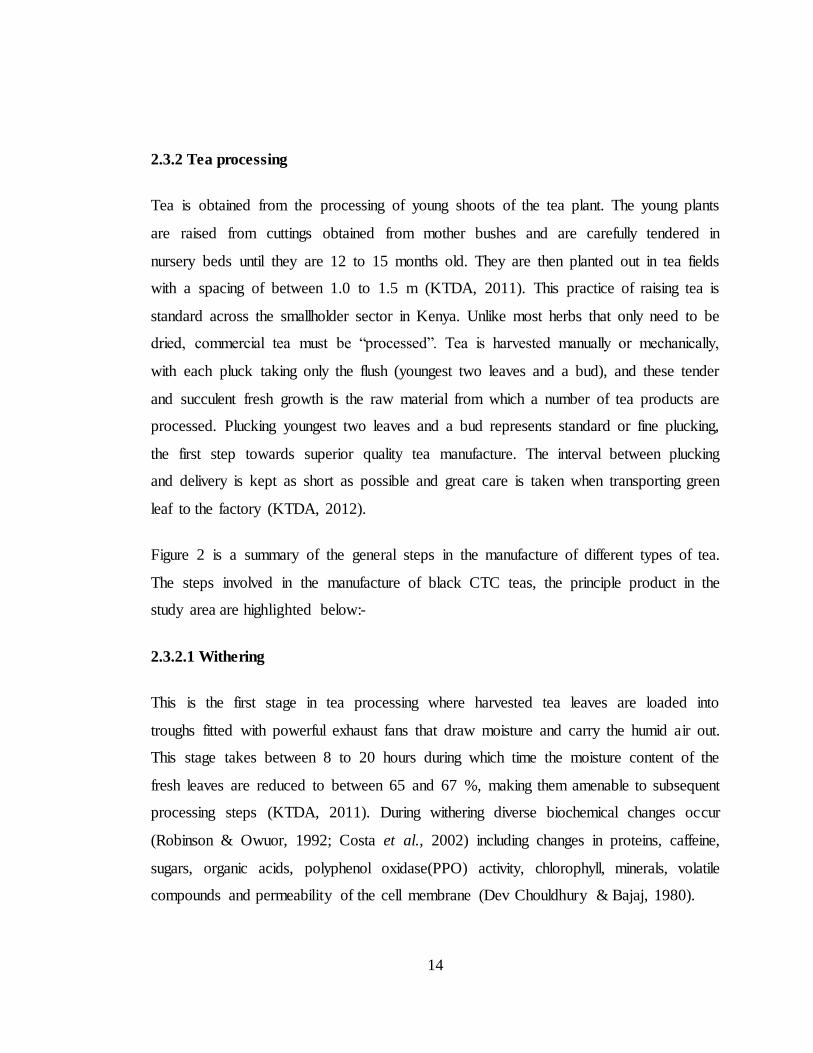
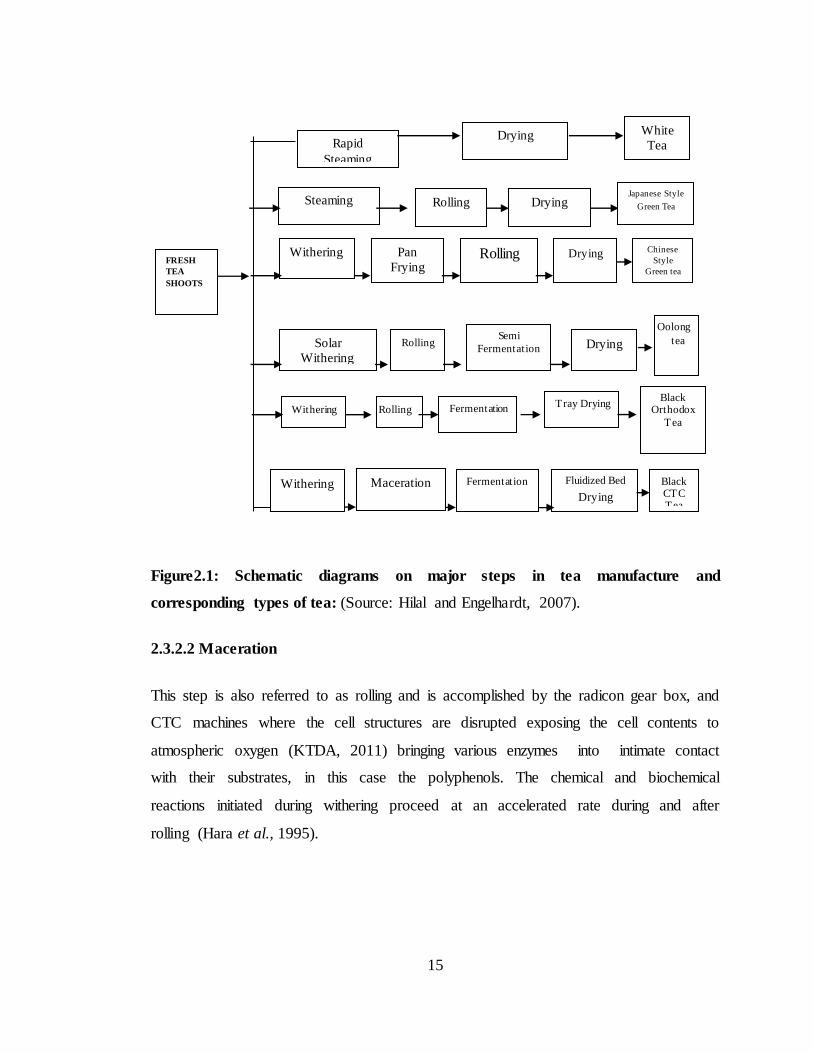
Figure 2 is a summary of the general steps in the manufacture of different types of tea.
The steps involved in the manufacture of black CTC teas, the principle product in the
study area are highlighted below:-
2.3.2.1 Withering
This is the first stage in tea processing where harvested tea leaves are loaded into
troughs fitted with powerful exhaust fans that draw moisture and carry the humid air out.
This stage takes between 8 to 20 hours during which time the moisture content of the
fresh leaves are reduced to between 65 and 67 %, making them amenable to subsequent
processing steps (KTDA, 2011). During withering diverse biochemical changes occur
(Robinson & Owuor, 1992; Costa et al., 2002) including changes in proteins, caffeine,
sugars, organic acids, polyphenol oxidase(PPO) activity, chlorophyll, minerals, volatile
compounds and permeability of the cell membrane (Dev Chouldhury & Bajaj, 1980).
15
Figure2.1: Schematic diagrams on major steps in tea manufacture and
corresponding types of tea: (Source: Hilal and Engelhardt, 2007).
2.3.2.2 Maceration
This step is also referred to as rolling and is accomplished by the radicon gear box, and
CTC machines where the cell structures are disrupted exposing the cell contents to
atmospheric oxygen (KTDA, 2011) bringing various enzymes into intimate contact
with their substrates, in this case the polyphenols. The chemical and biochemical
reactions initiated during withering proceed at an accelerated rate during and after
rolling (Hara et al., 1995).
Drying
Drying
Rolling Drying
Tray Drying
Japanese Style
Green Tea
Chinese
Style
Green tea
Withering
Solar
Withering
Pan
Frying
Rapid
Steaming
White
Tea
Oolong
tea
Withering Rolling Fermentation Black
Orthodox
Tea
Semi
Fermentation
Rolling Drying FRESH
TEA
SHOOTS
Steaming Rolling
Fluidized Bed
Drying
Fermentation Maceration
Withering Black CTC Tea
16
2.3.2.3 Fermentation or aeration
The important reactions that occur during this stage are the development of colour,
strength and flavour quality of tea by the production of non-volatile compounds through
the enzymatic oxidation of catechins and their gallates and the production of volatile
compounds responsible for characteristic aroma of black tea (Tombs &Mashingadze,
1997). These chemical and biochemical reactions make fermentation a most critical step
in black tea manufacture (KTDA, 2011).
2.3.2.4 Drying or firing
This step is primarily intended to cause cessation of enzymic activity and reduce the
moisture content to about 3 % of the dry mass (KTDA, 2011). However other changes
other than removal of moisture that occur during this step include a significant loss of
volatile compounds, an increase in the levels of amino acids and the binding of
polyphenols to other tea components and an increase in carboxylic acids and maillard
reactions (Hara et al., 1995). This stage is also critical in the tea processing as it
contributes to the keeping quality of tea once in the value chain
2.3.2.5 Grading or sizing
After drying the teas, they are then sorted into primary and secondary grades; the criteria
being the size of the leaves and their fiber content, where whole, large tea leaf particles
gain a higher grading (KTDA, 2012). The dry tea is exposed to static electricity charged
PVC rollers that pick up the fibres and the open leaf. Grading facilitates the international
trade in tea and is the central component in attaching a monetary value to the various
grades of tea. Also it is an important tool for tea experts in making evaluations and
comparisons between the different varieties of tea grown and manufactured world over.
Tea is graded into seven grades that are further classified into primary grade teas that
includes Broken Pekoe (BPI), Pekoe Fannings(PF1), Pekoe Dust ( PD) and Dust 1 ( D1)
and secondary grade teas that include Fanning‟s, Dust and Broken Mixed Fibres (BMF).
17
2.4 Bioactive compounds of tea
The chemical composition of fresh tea leaves is complex and includes polyphenolic
compounds, carbohydrates, proteins, lignin, mineral ash, amino acids, lipids, organic
acids, chlorophyll as well as carotenoids and volatile substances (Cabrela et al., 2003).
2.4.1 Tea catechins
The six catechin-derived polyphenols in tea leaves, that is, catechin (+ C), epicatechin
(EC), epicatechin gallate (ECG), gallocatechin (GC), epigallocatechin (EGC) and
epigallocatechin gallate (EGCG), are oxidized by the enzyme Polyphenol oxidase
(PPO). The catechins first form intermediate compounds called orthoquinones that are
very unstable and reactive. The orthoquinones then combine in pairs in a series of
condensation reactions. They can function as either hydrogen acceptors or donors. The
combinations can happen through C-O or C-C bonds. The compounds formed are called
theaflavins (TFs), which are larger molecules and are unique in chemistry.TFs are
brighter and brisker than others and as such, the quality of tea depends not just on the
polyphenol count, but the composition of the catechins and the availability of PPO. TFs
are unstable and further oxidize through the action of PPO to form thearubigins (TRs)
that are much larger and more complex.Their chemical structure is yet to be known.The
compounds though, have a high complexation affinity with metals like aluminium (Al)
and manganese (Mn) and alkaloids like caffeine.TRs are largely responsible for the
flavor, aroma and colour of the liquor; some make it brighter and brisk, others dull.
Catechins are the main bioactive molecules in tea and are the most frequent (Cabrela et
al., 2003; Yilmaz, 2006). Apart from tea, catechins are found in a variety of foods such
as wine, fruits and chocolates (Yilmaz, 2006). The most important catechins in tea are;
epigallocatechin gallate (EGCG), epigallocatechin (EGC), epicatechin gallate (ECG)
and epicatechin (EC) (Fig 3) . Also present in smaller amounts are catechin (+C),
gallocatechin (GC), and gallocatechin gallates. Catechins that contain three hydroxyl
18
groups in the B-ring (position 3‟, 4‟and 5‟) are called gallocatechins while gallic acid
substitution in position 3 of the aliphatic ring is characteristic of gallated catechins
(Pellilo et al., 2002) (Fig 3). Catechins differ in chemical structure, reduction potentials
(Bajaj et al., 1987) and contribution to the astringent taste of tea (Ding et al., 1992; Kuhr
& Engelhardt, 1991) and can be categorized according to the number of hydroxyl groups
on the B-ring or as gallated or nongallated catechins. Catechins in tea can be used to
predict plain black tea quality potential of green and black tea (Owuor & Obanda, 2001).
Catechins account for 6 - 12 % of the dry weight of green tea leaves with EGCG
constituting 10 to 50 % and being the most bio active due to its degree of gallation and
hydroxylation (Stewart et al., 2004). Besides, catechins together with phenolic acids
such as gallic acid constitute up to 30 % of the dry weight of the tea leaf and contribute
significantly to the taste of tea (Forrest & Bendal, 1969; Grahan, 1992; Roberts, 1992).
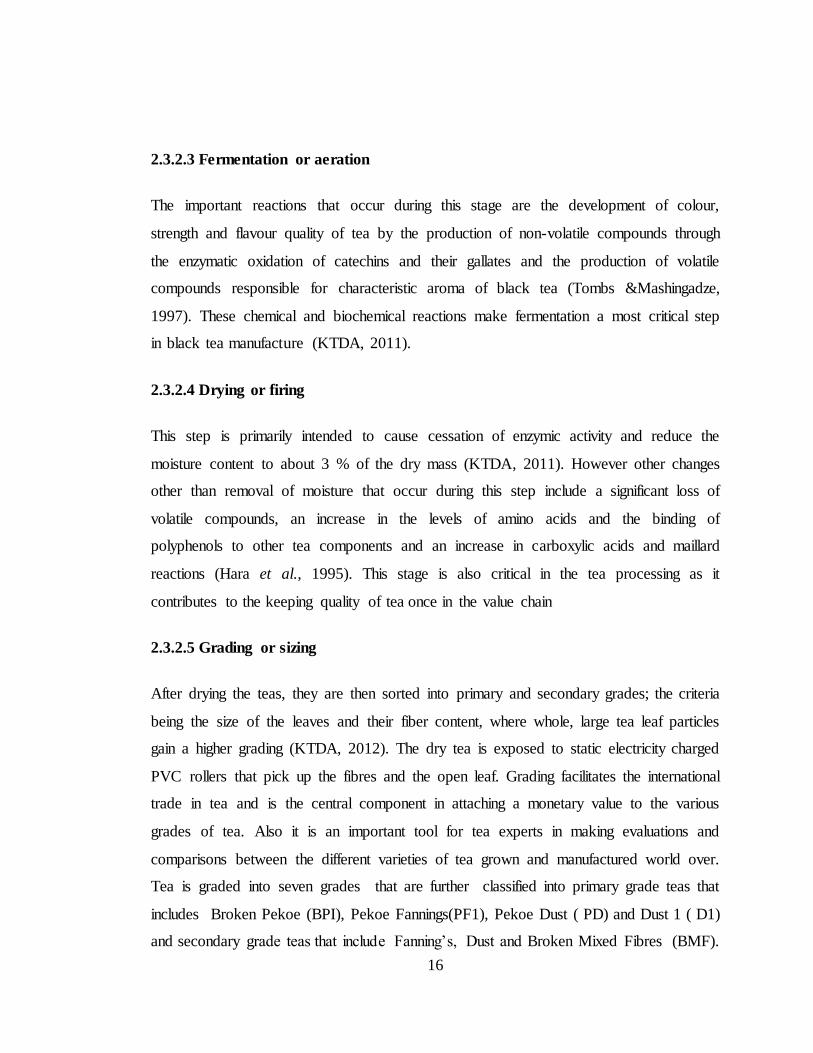
It‟s noteworthy that EC, EGC and +C are simple, non gallated tea catechins while ECG
and EGCG are gallated catechins (Sanderson, 1972; Sanderson & Graham, 1973) (Fig
3).
Figure2.2: Chemical structures of the major catechins present in tea (Zhao et al.,
2014)
19
The simple non gallated tea catechins EC, EGC and +C are not as astringent as the
gallated catechins ECG and EGCG. Apart from their role in tea quality, catechins are
increasingly being identified with a number of diverse properties of benefit to human
health (Obanda, Owuor & Taylor, 1996; Sano et al., 1991). At present it is agreed that
catechins, the major polyphenols in the green tea shoots together with their oxidation
products are responsible for most of the sensory characteristics associated with black tea
liquors (Biswas et al., 1973; Roberts & Smith, 1963; Sanderson et al., 1976). Flavanol
glycosides which are also present in the green tea leaf are believed to contribute
substantially to tea liquor colour (McDowell et al., 1990).
Climatic and agronomic factors have been found to affect both the catechin and other
phenolic contents of the green tea shoot and the composition of the resultant black tea
liquors (Hilton et al., 1973; Owuor et al., 1995; Ramaswoy, 1994). Studies carried out
have shown that the tea germplasm with low catechin and total polyphenol content were
likely to produce low quality black teas (Obanda et al., 1992). However Kenyan tea
germplasm spread throughout the ecological zones under study has been shown to have
between 7 and 27 % more total polyphenols than germplasm from China, Japan and
Taiwan traditionally used for green and oolong tea production (Wachira and Kamunya,
2005). This indicates that Kenyan teas irrespective of ecological zone are rich in
antioxidants as they have high levels of total polyphenols. Studies on catechin
expression in Kenyan teas have revealed that ECG, EGCG, EC and +C range between
0.52 – 5.95, 0.42 – 1.95, 0.00 – 2.19 and 0.00 – 1.55 mmol/g of dry matter respectively
(Magoma et al., 2001).
2.4.2 Theaflavins and thearubigins
During the processing of black tea at the fermentation stage, tea catechins usually
undergo coupled oxidation by the enzymatic action of polyphenol oxidase (PPO)
(Joseph et al., 2005). They are oxidized to homogeneous substances called theaflavins
(TFs), which give a bright/orange, yellow/ red colouration in fermented black tea and
20
contribute to the brightness and briskness of the tea liquor. Theaflavins further act as
oxidizing agents for gallic acid to produce epitheaflavic acid which in turn combine with
the TFs to produce chemically heterogenous substances called thearubigins (TRs) which
tend to be brownish-red (Brown et al., 1966; 1965; Deb & Ullah, 1968; Takino et al.,
1964). These thearubigins are responsible for the colour, body and taste of teas (Obanda
et al., 2001, 2004). Theaflavins and thearubigins are found in black and oolong teas. The
processing of green tea does not include an oxidation step hence catechins remain intact
in the processed product. Together these oxidation products and flavonol glycosides
(McDowell, et al., 1990), give black tea liquors most of its taste and colour. Theaflavins
have astringent tastes and contribute to the briskness of black tea (Deb & Ullah, 1968).
Pure theaflavins have a taste of fierce astringency thereby inducing a mouth drying and
rough astringent oral sensation. The taste thresholds of TFs are much lower than their
precursor catechins, though theaflavin digallate (TFDG) possess the strongest
astringency among the TFs and as a consequence, precursor substances for TFs and TRs
which are the catechins in fresh young shoots. They have been found to positively
correlate with black tea quality parameters (Obanda et al., 1997). The manufacture of
quality black tea is a highly controlled process that optimizes all process variables to
ensure that the right ratios of TFs and TRs are achieved. The chemical structure of
Theaflavins (TFs) and thearubigins (TRs) are shown in Figure 4 below. Theaflavins
consist mainly of four major compounds, which are normally termed Theaflavin (TF1),
Theaflavins-3-gallate (TF2A), Theaflavin-3-gallate (TF2B) and Theaflavins -3, 3‟-
digallate (TF3). Although the structure of theaflavins is very complex, they have the
same hydroxyl substituted benzotropolone ring which is a characteristic structure of
Theaflavins. Theaflavins can also be synthesized through condensation of catechins
between di and tri-hydroxylates B rings of catechins. The reaction of condensation
involves the oxidation of the B-ring of Catechins to the quinones, followed by addition
of the gallocatechin quinine to the catechins quinone, prior to carboxyl addition across
the ring and subsequent decarboxylation.
21
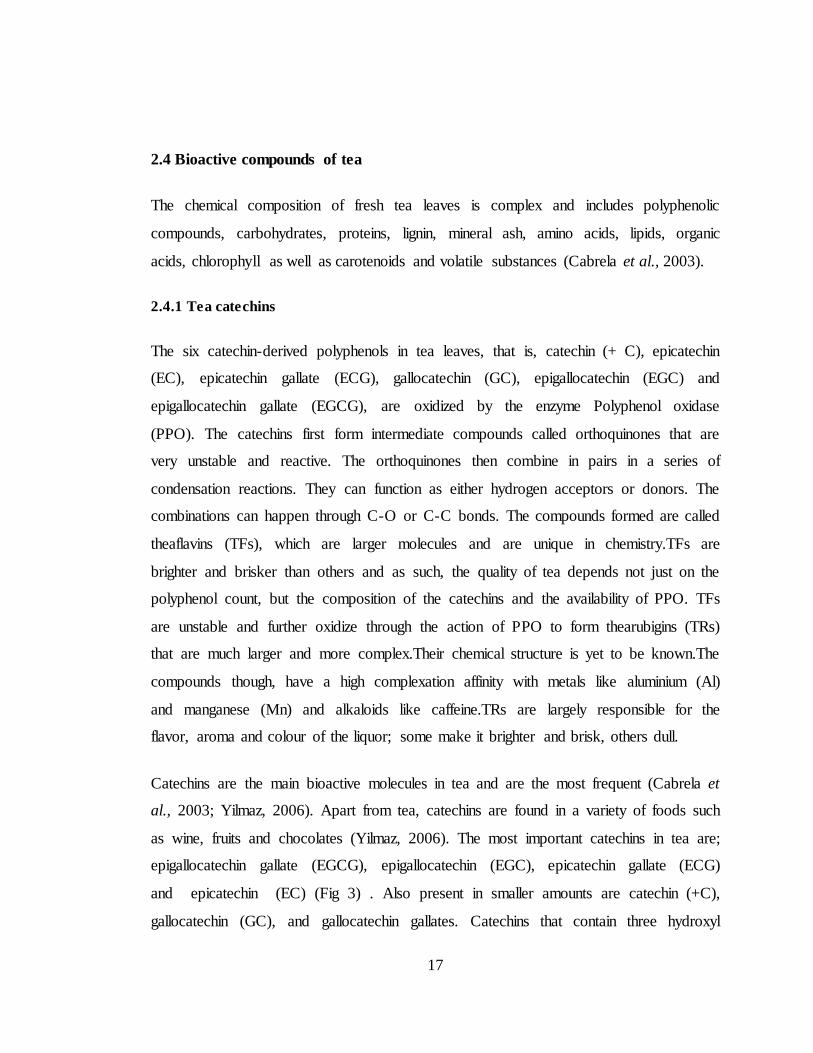
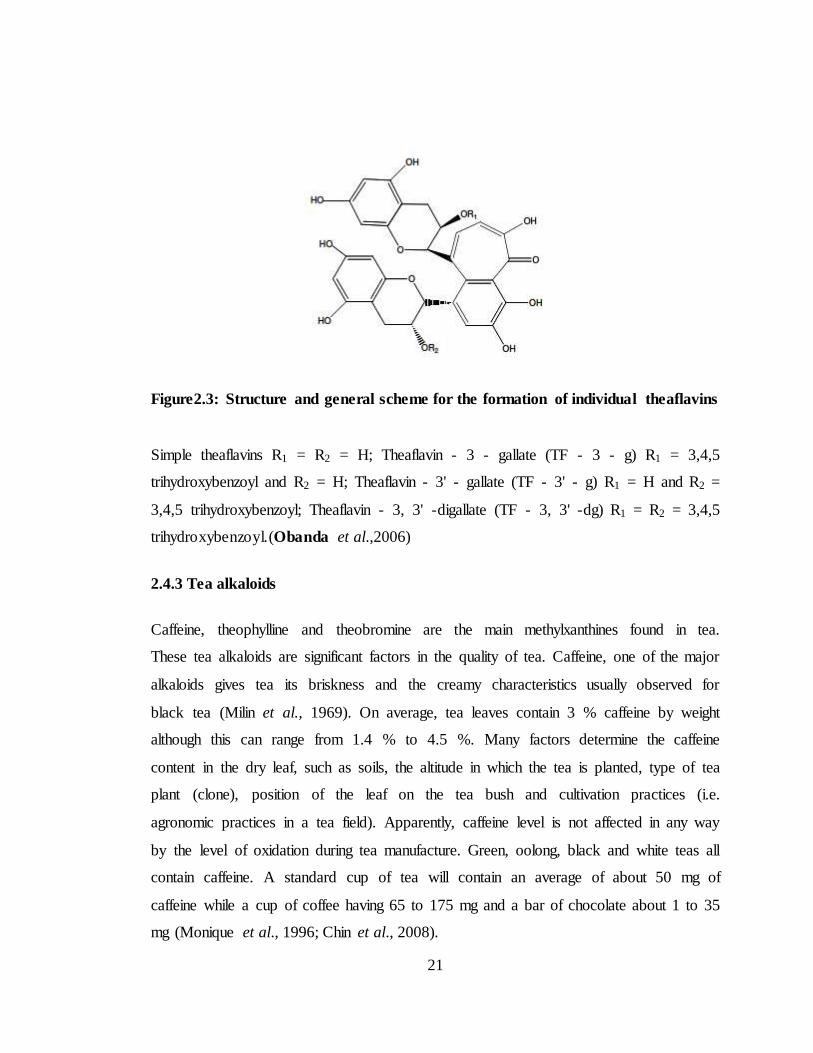
Figure2.3: Structure and general scheme for the formation of individual theaflavins
Simple theaflavins R1 = R2 = H; Theaflavin - 3 - gallate (TF - 3 - g) R1 = 3,4,5
trihydroxybenzoyl and R2 = H; Theaflavin - 3' - gallate (TF - 3' - g) R1 = H and R2 =
3,4,5 trihydroxybenzoyl; Theaflavin - 3, 3' -digallate (TF - 3, 3' -dg) R1 = R2 = 3,4,5
trihydroxybenzoyl.(Obanda et al.,2006)
2.4.3 Tea alkaloids
Caffeine, theophylline and theobromine are the main methylxanthines found in tea.
These tea alkaloids are significant factors in the quality of tea. Caffeine, one of the major
alkaloids gives tea its briskness and the creamy characteristics usually observed for
black tea (Milin et al., 1969). On average, tea leaves contain 3 % caffeine by weight
although this can range from 1.4 % to 4.5 %. Many factors determine the caffeine
content in the dry leaf, such as soils, the altitude in which the tea is planted, type of tea
plant (clone), position of the leaf on the tea bush and cultivation practices (i.e.
agronomic practices in a tea field). Apparently, caffeine level is not affected in any way
by the level of oxidation during tea manufacture. Green, oolong, black and white teas all
contain caffeine. A standard cup of tea will contain an average of about 50 mg of
caffeine while a cup of coffee having 65 to 175 mg and a bar of chocolate about 1 to 35
mg (Monique et al., 1996; Chin et al., 2008).
22
Studies done at the Tea Research Foundation of Kenya (TRFK) have shown that the
contents of caffeine in commercialized tea clones in Kenya range from 1.6 to 4.9 %. The
most popular clone in that smallholder sector, clone TRF 6/8 has caffeine content of
1.65 %. This clone owes its popularity to production of high quality black tea, which
research has shown, is associated with high levels of total polyphenols. Overall most tea
clones cultivated in Kenya and their resultant tea products can be described medium to
low in caffeine content (3.0 %). Efforts to develop naturally caffeine free tea or tea with
trace amount of caffeine are on-going.
Chemically, caffeine (1, 3, 7-trimethylxanthine) is an alkaloid and a member of the
xanthine family. It is odorless, non-toxic, has a bitter taste and is highly soluble in water.
It occurs naturally in coffee, tea, coca, kolanuts and a variety of other plants. Some plant
species that contain caffeine such as tea and coffee may also contain trace amounts of
another alkaloid called theophylline (Nathanson, 1984). Unlike caffeine, theophylline
has only two methyl groups. Theophylline has a stronger effect than caffeine on the
heart and breathing. Some species related to tea, also contain another alkaloid called
theobromine (Nathanson, 1984). This alkaloid is largely found in cocoa where its
concentration is about 7 times that of caffeine. Theobromine has a weaker stimulating
effect than caffeine (Fig 5). Caffeine is bioactive and in moderation, it has beneficial
effects on the body: it increases alertness, serves as a bronchial dilator, stimulates
metabolism and contributes to an increase in dopamine levels in the blood, which
improves mood (Ker et al., 2010). However, at high levels it can cause restlessness,
insomnia and anxiety (Snel et al., 2011). It can also exert some mild withdraw effects
such as transient but persistent headache and inability to concentrate and can be
addictive (Juliano et al., 2004). Caffeine is the most widely consumed stimulant drug in
the world (Nehling et al., 1992; Arnand, 2011)
Research has shown that caffeine is rapidly absorbed following oral consumption. Peak
blood (plasma) levels are achieved usually within 30 minutes. It is metabolized in the
liver. It has a very short half-life of only about 3 to 5 hours in adults and is easily

23
excreted in urine. Because of its short half-life in the body one needs to keep coming
back for more (Arnand, 2011). It causes stimulation by antagonizing the effect of
adenosine (which causes a calming effect). Because of it pharmacological properties,
caffeine is used in the pharmaceutical industry and is often a component of several over
the counter analgesics (Arnand, 2011). It is also added to several types of commercial
drinks including cola and pepper soft drinks, energy drinks, frozen desserts, chocolates
and candies (Chin et al., 2008).
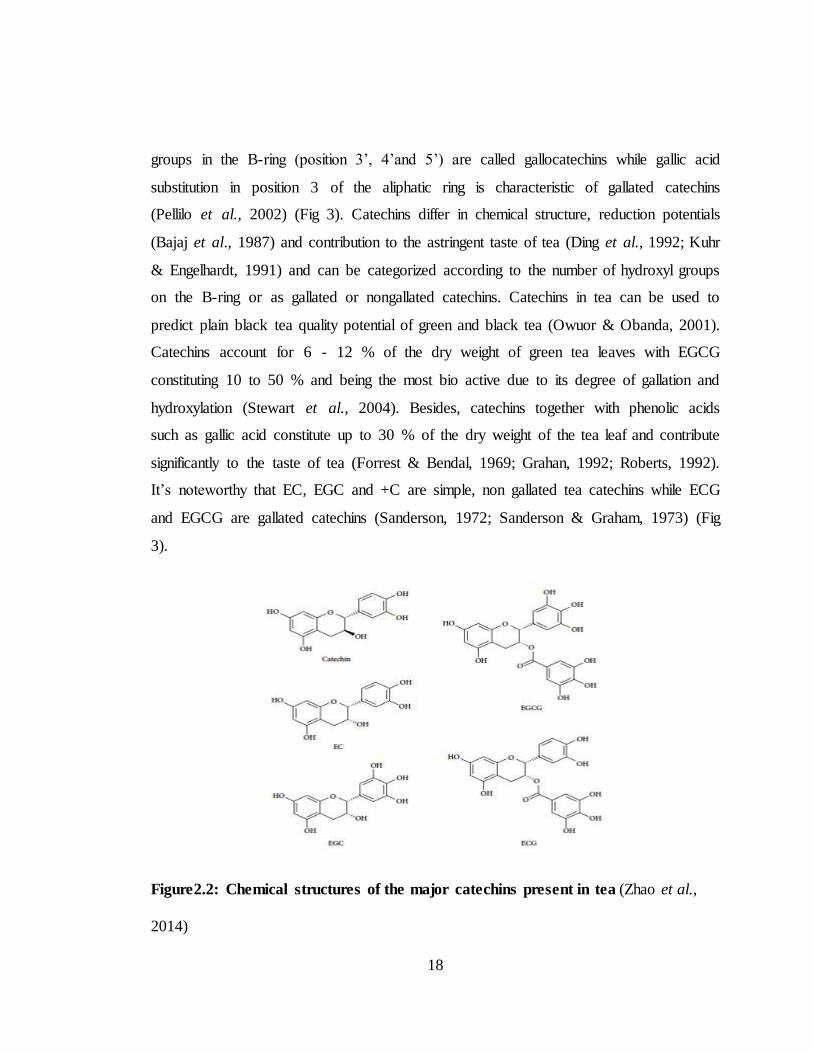
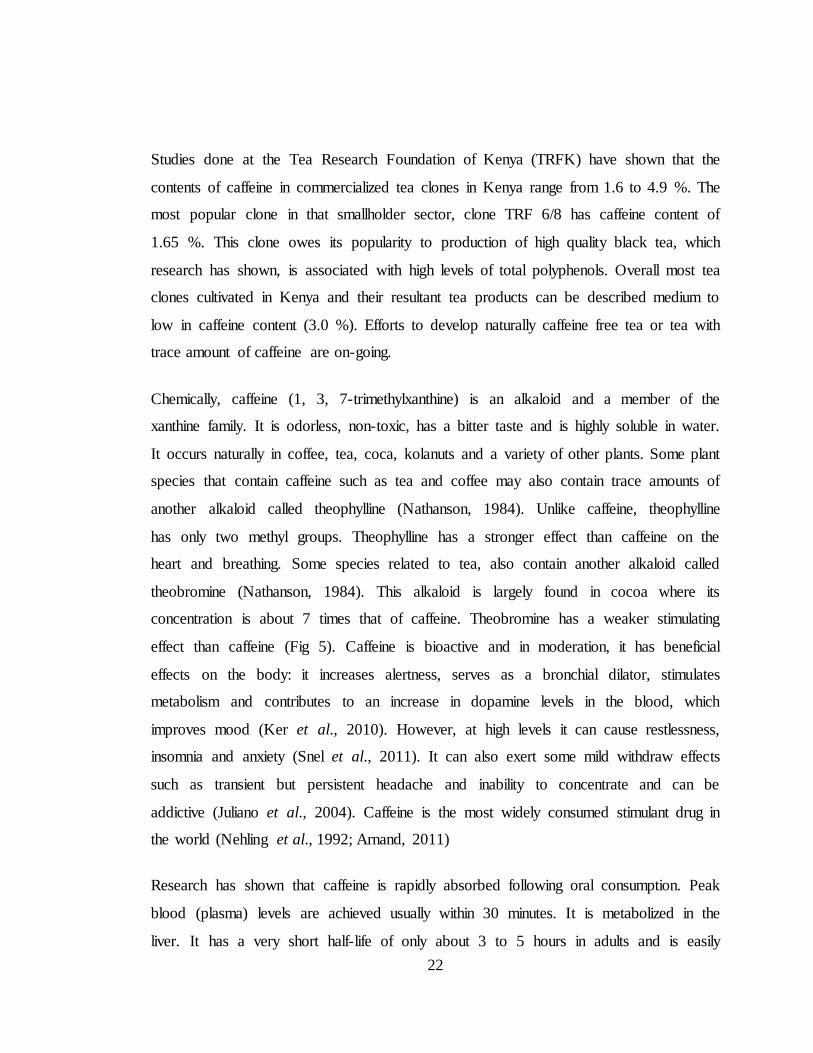
Caffeine Theobromine Theophylline
Figure2.4: Structure of caffeine and other alkaloids (Ashihara et al., 2008)
2.4.4 Tea minerals
Tea contains fluoride, minerals and trace elements such as Fe, Ca, K, Mn, Cr, N and Zn
which are essential to human health (Xie et al., 1998; Cabrela et al., 2003). Some of
these minerals have been found to be adequate in distinguishing teas of different
geographical origin (Marcos et al., 1998; Fernandez et al., 2001, 2004). The main
sources of the heavy metals in plants including tea are the growth media i.e. soil. Other
sources include agro inputs such as insecticides, herbicides and fertilizers that may be
absorbed through the leaves, roots and the barks of the plant (Fwu-Ming & Hong-Wen,
2008) as well as rainfall in atmospheric polluted areas due to high traffic density and
24
industrialization (Lozak et al.,2002; Sobukola et al., 2008) and substandard machinery
during transportation and processing.
Research has also indicated that the content of essential elements in plants is conditional,
the content being mainly affected by the characteristics of the soil and the ability of
plants to selectively accumulate some metals (Divrikli et al., 2006). Also most heavy
metals are not biodegradable, have long biological half-lives and thus persist in different
body organs a phenomenon called bioaccumulation where they eventually lead to
unwanted side effects (Jarup, 2003; Sathawara et al., 2004). Such elements include Pb
and Cd and are toxic to humans even at low concentration and have been associated with
the etiology of a number of diseases especially cardiovascular, kidney, nervous as well
as bone disease (WHO, 1996; Steenland & Boffetta, 2000; Jarup, 2003). Tea has been
found to have different levels of the heavy metals such as iron (Fe), zinc (Zn), copper
(Cu), lead (Pb) and cadmium (Cd) to name just a few. Their levels have been found to
vary across the zones where tea is grown (Moseti, 2013; Moseti et al., 2013). As
explained above, some of these metals have varying biological importance and
toxicological relevance to humans.
2.4.5 Tea amino acids
Amino acids found in tea are attributed to aroma and cream formation and are less cited
in the quality of tea (Davies et al., 1997). Tea contains theanine (لا-glutamylethylamide)
whose many biological uses have been claimed (Ozawa et al., 1969). For instance, it has
been reported that theanine decreases the level of nor epinephrine and serotonin in the
brain (Chu et al., 1997) and in naturally hypertensive rats its administration results in
decreased blood pressure. Recently, cooperative effects of antitumor agents and theanine
have been reported (Sugiyama et al., 1999). Another amino acid of interest contained in
tea is لا-aminobutyric acid (GABA). Normal green tea contains less than 0.1 % of this
aminoacid, while the anaerobic treatment of fresh leaves before the normal
manufacturing process increases the content enormously. The continuous drinking of
25
anaerobically treated tea has been shown to produce a decline in blood pressure
(Hakamata, 1990). And such specially processed teas are sold in Japan to people
suffering from hypertension. Amino acids have been described as sweet and sour
(Nelson et al., 1998).
2.5 Tea health benefits
Based on extensive animal experiments and available epidemiological data, the medical
community recognizes tea as a beverage that may offer several health benefits (Jha et
al., 1996; Moreda-Pineiro et al., 2003; Naithan & Kakkar, 2005). Some of the health
benefits that have been ascribed to regular consumption of tea include; the reduction of
serum cholesterol (Hans et al., 2007), decreased risk of cancers and cardiovascular
diseases (Jankun et al., 1997; Hakim et al., 2004; Zuo et al., 2002; Chan and Han, 2000;
Chung et al., 2003), prevention of a number of diseases including skin cancer
(Katharine, 2001; Lambert et al., 2005), Parkinson‟s disease (Richard, 2001),
Myocardial infarction (Cheng, 2003) and coronary artery disease (Hirano et al., 2003).
Due to its polyphenols, tea has been considered medicinal since the ancient times.
Research on the effects of tea on human health continues to be fuelled by the growing
need to provide natural health diets that include plant derived polyphenols. The health
benefits in tea have been attributed to the strong antioxidant activity of catechins and
other phenolic compounds (Zuo et al., 2002; Karori et al., 2007) that protect the body
against free radical induced oxidative stress (Pourmorad et al., 2006). In addition, tea
polyphenol have been associated with a amelioration of inflammation (Karori et al.,
2008; Paola et al., 2005); inhibition of diabetes (Vinson et al., 2001; Sabu et al., 2002),
prevention of intestinal damage and anti-diarrhea properties (Astar et al., 2003),
enhancement of oral health (Wu & Wei, 2002) and the potential to improved spatial
cognitive learning ability (Hague et al., 2006). Other benefits include anti allergic action
(Yamamoto et al., 2004), anti-hypertensive activities (Henry et al., 1981) antifungal and
antibacterial activities (Clarke et al., 1998; Ann et al., 2004; Koech et al., 2013). Green
26
tea catechins (EGCG and ECG) have also been found to inhibit plasmodium falciparum
growth in vivo, a parasite that has been implicated in causing malaria, the killer disease
in Africa and Asia (Sanella et al., 2007).
The upsurge in the interest in the therapeutic potential of plant polyphenols, especially
tea polyphenols means that human beings are more serious on their health than
previously.
2.5.1 Antioxidant capacity of tea
Tea catechins provide beneficial health effects by protecting the body from the
damaging effects of free radicals (Amie et al., 2003). Free radicals are unstable
molecules that arise from the hydrogen atom, nitric oxide (NO) and molecular oxygen
(reactive oxygen species). Free radicals contribute to chronic and aging diseases such as
cancer, heart diseases, stroke, rheumatoid arthritis, diabetic cataracts, Alzheimer‟s
diseases, central nervous system injury and Acquired Immune Deficiency syndrome
(AIDS) (Pourmorad et al., 2006; Rao et al., 2006).
Antioxidants inhibit oxidation reactions caused by free radicals by preventing or
delaying damage to cells or tissues (Paquay, 2001). Tea has one of the highest total
polyphenol content of all the plants at 6 to 12 % of the leaf by dry weight (Lakebrink,
2000) and it is a major source of the dietary flavonoids which are highly antioxidant.
Tea flavonoids are antioxidant in vitro and many common flavonoids are several times
more potent than vitamin C and E (Vinson, 1995). Currently, the available synthetic
antioxidants are Butylated Hydroxyl Anisole (BHA), Butylated Hydroxyl Toluene
(BHT) and gallic acid esters. These are potentially carcinogenic and hence the need to
substitute them with naturally occurring antioxidants (Pouramorad et al., 2006). The
antioxidant activity of tea flavonoids may account for the results of a number of
epidemiological studies suggesting their protective roles mentioned above. Further
studies have demonstrated that co-administration of drugs with EC and EGCG inhibits
27
glucoronidation and sulfation of orally administerd drugs thereby increasing the
bioavailability of such drugs in the body (Hang et al., 2003; Lambert, 2005). EGCG has
also been reported to be a powerful antagonistic of the human immunodeficiency virus
reverse transcriptase (Nance & Shearer, 2003). TRs were found to suppress the
transcription of HIV in the cell and the gallic acid moiety of TRs can enhance
suppressive activity (Nakane et al., 1994).
2.6 Techniques for analyzing bioactive compounds in tea
There are a number of assays that are used to analyse bioactive compounds present in
tea. These assays include assaying the antioxidant capacity in tea, and analyzing other
bioactive compounds using chromatographic techniques, spectrophotometric analysis
and organoleptic evaluation amongst other methods.
2.6.1 Determination of antioxidant activity in tea.
There are a number of assays that can be used to measure the antioxidant capacity of
foods including tea. These include the Oxygen Radical Absorbance Capacity (ORAC);
Thiobarbituric Acid Reactive Substance (TBARS) and the DPPH method. Among these,
the DPPH method is the most widely used because it is rapid, simple and inexpensive
(Koleva et al., 2001). The assay is used to test the ability of compounds to act as free
radical scavengers and more recently it has also been used to quantify antioxidants in
complex biological systems (Villano et al., 2006). The trend in antioxidant activities
obtained using the DPPH method is comparable to trends found using the other methods
(Koleva et al., 2001). The DPPH method can also be used for solid samples without
prior extraction and concentration hence saving time. The DPPH system is a stable
radical generating procedure since it can accommodate a large number of samples within
a short time and is sensitive to detect samples at low concentration. The antioxidant
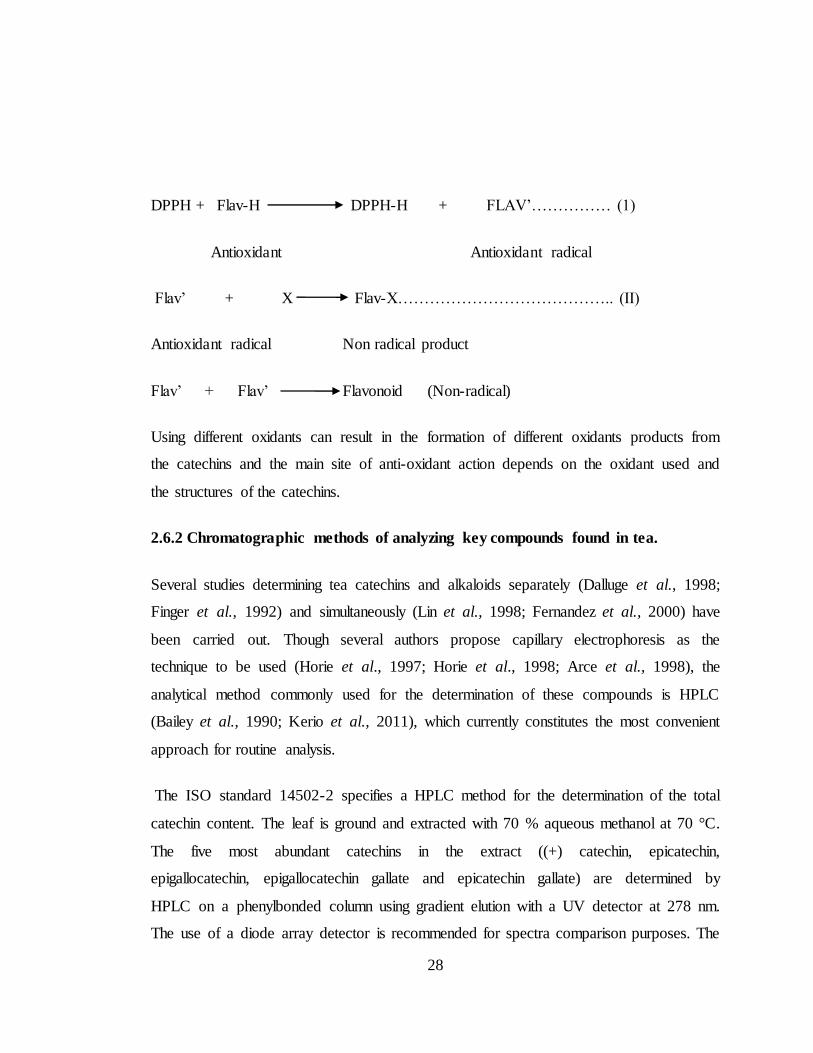
process of DPPH reaction is thought to occur in two stages (Brand-Williams et al.,
1995).
28
DPPH + Flav-H DPPH-H + FLAV‟…………… (1)
Antioxidant Antioxidant radical
Flav‟ + X Flav-X………………………………….. (II)
Antioxidant radical Non radical product
Flav‟ + Flav‟ Flavonoid (Non-radical)
Using different oxidants can result in the formation of different oxidants products from
the catechins and the main site of anti-oxidant action depends on the oxidant used and
the structures of the catechins.
2.6.2 Chromatographic methods of analyzing key compounds found in tea.
Several studies determining tea catechins and alkaloids separately (Dalluge et al., 1998;
Finger et al., 1992) and simultaneously (Lin et al., 1998; Fernandez et al., 2000) have
been carried out. Though several authors propose capillary electrophoresis as the
technique to be used (Horie et al., 1997; Horie et al., 1998; Arce et al., 1998), the
analytical method commonly used for the determination of these compounds is HPLC
(Bailey et al., 1990; Kerio et al., 2011), which currently constitutes the most convenient
approach for routine analysis.
The ISO standard 14502-2 specifies a HPLC method for the determination of the total
catechin content. The leaf is ground and extracted with 70 % aqueous methanol at 70 °C.
The five most abundant catechins in the extract ((+) catechin, epicatechin,
epigallocatechin, epigallocatechin gallate and epicatechin gallate) are determined by
HPLC on a phenylbonded column using gradient elution with a UV detector at 278 nm.
The use of a diode array detector is recommended for spectra comparison purposes. The
29
method has been developed to give good separation of the principal components while
ensuring a short enough run time. A key consideration for ISO at the time the method
was established was to ensure that the method worked on the most readily available fit
for purpose equipment, in this case HPLC with UV detection. External catechin
standards of defined purity and moisture content can be used directly or alternatively,
the much more readily available caffeine may be used as a standard in conjunction with
relative response factors (RRFs) for each individual catechin. The RRFs concept was
developed as individual catechin standards are not always available or costly, they tend
to be unstable and also hygroscopic thus leading to increased errors.These RRFs to
caffeine have been established by an ISO international inter-laboratory ring test and
overcome many of the shortcomings described in using catechin standards.
In this method of analysis, separation of tea catechins is made using a high resolution
silica based 2.2 µm C18 column at a wavelength of 278 nm to separate, detect and
quantify them. In the case of gradient separation, the concetration of acetonitrile or
methanol is gradually increased. Dalluge et al., (1998) compared a variety of stationary
phases and elution conditions, and observed that the stationary phases which utilized
ultrapore silica and maximized coverage of the silica support improved the separation
and that the presence of acid in the mobile phase was essential. According to their
results, the separation using a methanol based mobile phase was poor. Chromatographic
peaks in samples are identified by comparing retention times and UV spectrum with
those of reference standards. Working standard solutions are injected into the HPLC,
and peak area responses are obtained. A standard graph for each component is prepared
by plotting concentration versus area. Quantification is then carried out from integrated
peak areas of the sample and the corresponding standard graph.
30
2.6.3 Spectrophotometric analysis of tea
The polyphenol content can be determined spectroscopically according to ISO 14502-1-
2005 procedure, using the Folin-Ciocalteu phenol reagent as described by Pourmorad et
al., (2006). The new ISO standards ISO parts 1 and 2 (ISO, 2005a, b) have been
developed to facilitate international trade and provide robust validated analytical tools in
cases of dispute. These standards will help to protect consumers and ensure that their
expectations are met. The substances characteristic for tea are measured using the two
recent standards: ISO 14502-1 measures the total polyphenolic content of tea, and ISO
14502-2 measures the catechin content. Tea is rich in polyphenols, and ISO 14502 parts
1 specifies the method for the determination of the total polyphenol content of leaf or
instant tea by a colourimetric assay using Folin–Ciocalteu phenol reagent (Singleton et
al., 1999). It is quite clear that most methods for a determination of a group of
compounds like polyphenols suffer from response factors of the individual compounds.
However, the Folin–Ciocalteu method gives reproducible results. There are almost an
unlimited number of ways tea can be brewed therefore a method that ensures
consistency in analysis and obtains an accurate level was needed. The ISO methodology
provides a standardized method of extraction, the polyphenols are extracted from finely
ground leaf using 70 % methanol at 70 °C. For instant teas they are dissolved in hot
water containing 10 % acetonitrile. The extracted samples are stabilised with
ethylenediaminetetraacetic acid (EDTA) which sequesters the iron ions thus preventing
catechin degradation. Ascorbic acid is also in the stabilisation solution to prevent
oxidation. The total polyphenol content is determined spectrophotometrically by
reaction with the Folin–Ciocalteu reagent, a mixture of phosphor-tungstic acids as
oxidants which on reduction by readily oxidized phenolic hydroxyl groups yields a blue
colour with an absorption maximum around 765 nm. The use of gallic acid as a
calibration standard enables useful total polyphenols data to be obtained. The method is
applicable to both green and black teas with the more complex polyphenols in black tea
also responsive to the Folin–Ciocalteu reagent.
31
2.6.4 Organoleptic evaluation of tea
Sensory quality characteristics of black tea are assessed using either sight, smell and /or
taste of the beverage (Cloughley, 1981; Ding et al., 1992; Sanderson et al., 1976).
Although the use of sensory evaluation is always criticized as being subjective and
influenced by market factors such as demand, supply and consumer preferences (Biswas
et al., 1973) and personal preferences of the individual tasters, it still remains the fastest
and the most practical method of quality assessment in the black tea trade. Several
studies have demonstrated linkages between the sensory quality characteristics of the
resultant black tea, the chemical composition of the green leaf and the black tea
processing parameters (Bendall 1959; Biswas, et al., 1973; Roberts & Smith, 1963). At
present, it is agreed that catechins, the major polyphenols in the green tea shoots,
together with their oxidation products are responsible for most of the sensory
characteristics associated with black tea liquors (Biswas et al., 1973; Roberts & Smith,
1963; Sanderson et al., 1976).
Flavanol glycosides are also present in the green tea leaf and are believed to contribute
substantially to tea liquor colour (Mcdowell, Feakes & Gay, 1990). The non volatile
compounds are responsible for taste, with some of these compounds also being
responsible for the colour. However, the volatile components comprise aroma. Although
many aroma compounds are primary tea metabolites, many volatile flavor compounds in
tea are secondary metabolites derived from carotenes, aminoacids, unsaturated fatty
acids plus other lipids and terpene glycosides during tea processing (Robinson & Owuor,
1992). The composition and concentration of the VFC plays a vital role in the valuation
and pricing of black tea (Owuor, 1992; 1988; Wicremasinghe et al., 1973).
32
2.6.5 Leaf quality plucking determination methods
Though there are two leaf count methods namely leaf count and weighted leaf quality,
the method which is mostly preferred at the factories is the leaf count method (KTDA,
2011). In this method, one goes to the withering troughs collects delivered leaf randomly
from as many troughs as possible and put them in a quality trough. The collected leaf is
then emptied to a leaf count table from whence; one hundred green tea shoots are
counted randomly through shuffling. The collected plucked leaf is then sorted into
different plucking standards of one leaf and a bud (1 + bud), two leaves and a bud (2 +
bud), three leaves and a bud (3 + bud), four leaves and a bud (4 + bud) and all inclusive
of the stems. Good plucking quality leaf constitutes one leaf and a bud or banjhi and
two leaves and a bud or banjhi and the summation of this should be at least 75 out of the
100 shoots collected from the troughs for leaf quality determination for all KTDA
managed tea factories in the study area.
2.7 Food safety standards
Food safety standards are a set of limits that define the Maxima Permittable
Concentrations (MPC‟s) of chemical substances and metal residues that are safe for
human consumption. These guidelines are determined by bodies such as the Kenya
Bureau of Standards (KEBS), the Food and Agriculture Organization (FAO), the World
Health Organization (WHO) among others and their aim is to protect the consumers and
ensure fair practices in the food trade. They deal with detailed requirements related to a
food or group of foods, the operation and management of production processes and the
operation of government regulatory systems for food safety and consumer protection.
The Codex Alimentarius is a collection of standards, codes of practice, guidelines and
other recommendations adopted by the Codex Alimentations Commission (CAC) which
was established by FAO and WHO in the 1960s. It is the single most important
international reference point for development associated with food standards. Table 1,
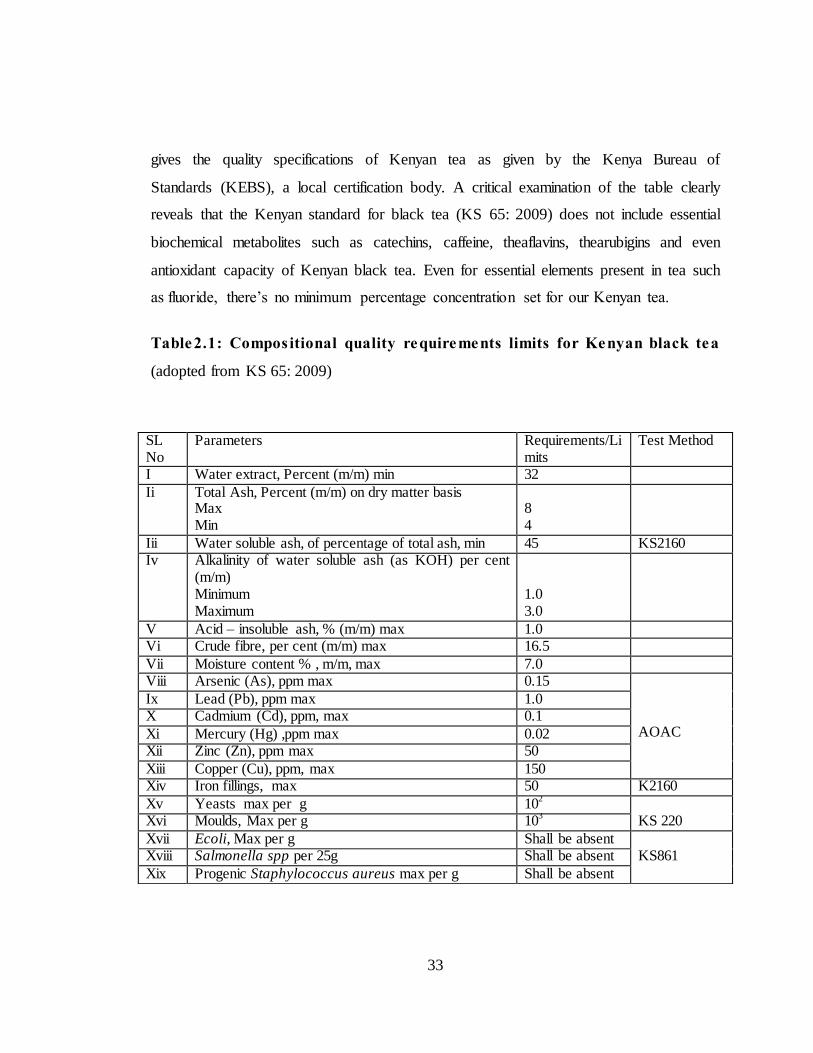
33
gives the quality specifications of Kenyan tea as given by the Kenya Bureau of
Standards (KEBS), a local certification body. A critical examination of the table clearly
reveals that the Kenyan standard for black tea (KS 65: 2009) does not include essential
biochemical metabolites such as catechins, caffeine, theaflavins, thearubigins and even
antioxidant capacity of Kenyan black tea. Even for essential elements present in tea such
as fluoride, there‟s no minimum percentage concentration set for our Kenyan tea.
Table2.1: Compositional quality requirements limits for Kenyan black tea
(adopted from KS 65: 2009)
SL No
Parameters Requirements/Limits
Test Method
I Water extract, Percent (m/m) min 32
Ii Total Ash, Percent (m/m) on dry matter basis Max Min
8 4
Iii Water soluble ash, of percentage of total ash, min 45 KS2160 Iv Alkalinity of water soluble ash (as KOH) per cent
(m/m) Minimum Maximum
1.0 3.0
V Acid – insoluble ash, % (m/m) max 1.0 Vi Crude fibre, per cent (m/m) max 16.5
Vii Moisture content % , m/m, max 7.0 Viii Arsenic (As), ppm max 0.15
AOAC
Ix Lead (Pb), ppm max 1.0 X Cadmium (Cd), ppm, max 0.1
Xi Mercury (Hg) ,ppm max 0.02 Xii Zinc (Zn), ppm max 50
Xiii Copper (Cu), ppm, max 150 Xiv Iron fillings, max 50 K2160
Xv Yeasts max per g 102
KS 220 Xvi Moulds, Max per g 103
Xvii Ecoli, Max per g Shall be absent KS861 Xviii Salmonella spp per 25g Shall be absent
Xix Progenic Staphylococcus aureus max per g Shall be absent
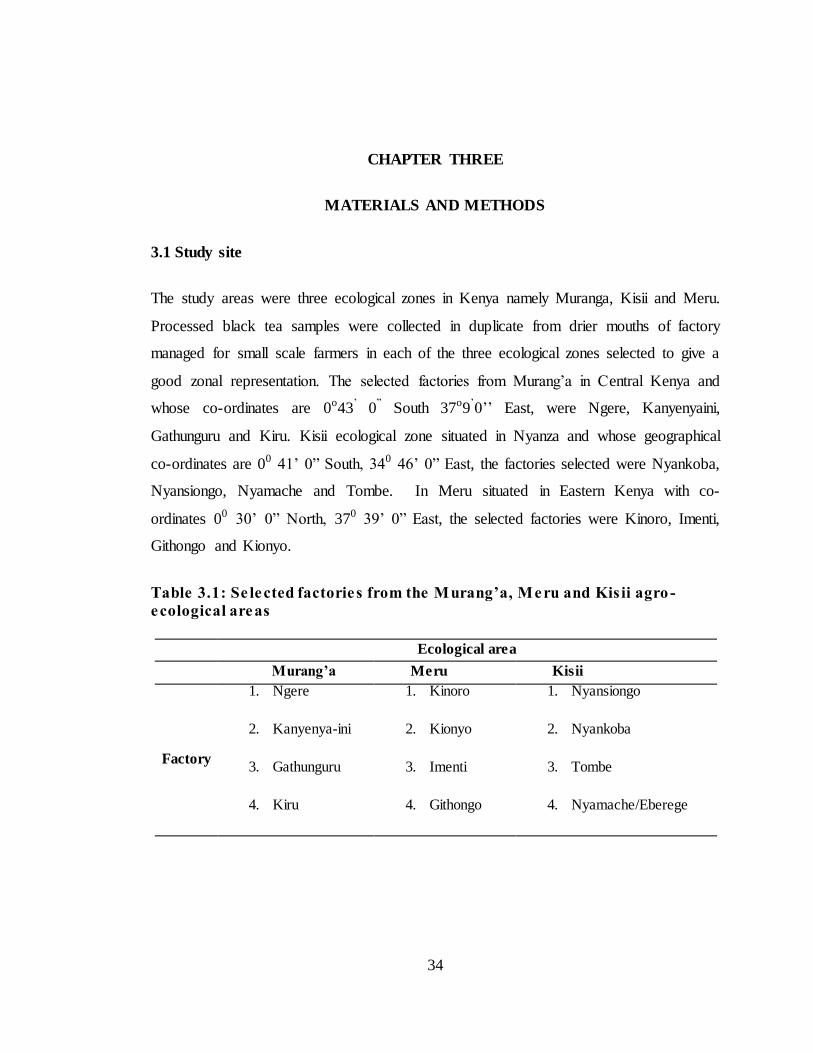
34
CHAPTER THREE
MATERIALS AND METHODS
3.1 Study site
The study areas were three ecological zones in Kenya namely Muranga, Kisii and Meru.
Processed black tea samples were collected in duplicate from drier mouths of factory
managed for small scale farmers in each of the three ecological zones selected to give a
good zonal representation. The selected factories from Murang‟a in Central Kenya and
whose co-ordinates are 0o43‟ 0” South 37o9‟0‟‟ East, were Ngere, Kanyenyaini,
Gathunguru and Kiru. Kisii ecological zone situated in Nyanza and whose geographical
co-ordinates are 00 41‟ 0” South, 340 46‟ 0” East, the factories selected were Nyankoba,
Nyansiongo, Nyamache and Tombe. In Meru situated in Eastern Kenya with co-
ordinates 00 30‟ 0” North, 370 39‟ 0” East, the selected factories were Kinoro, Imenti,
Githongo and Kionyo.
Table 3.1: Se lected factories from the Murang’a, Meru and Kis ii agro -
ecological areas
Ecological area
Murang’a Meru Kisii
Factory
1. Ngere 1. Kinoro 1. Nyansiongo
2. Kanyenya-ini 2. Kionyo 2. Nyankoba
3. Gathunguru 3. Imenti 3. Tombe
4. Kiru 4. Githongo 4. Nyamache/Eberege
35
3.2 Experimental design
In this study a randomized block design approach was used where factories in each area
of study were first treated as homogenous units before they were randomly selected and
samples taken. Similarly for clonal cultivars, farms in each area of study were stratified
into blocks before randomly selecting a block in which a selected clone was plucked and
sample collected.
Black CTC (cut, tear, curl) tea was used as it is the main product processed, marketed
and consumed in the study area (Kenya).
3.3 Sample collection
The factories were randomly selected from each ecological zone. The CTC black teas
collected from these factories were replicated samples picked from different driers in
those factories. In each selected factory, two half kilogram of drier mouth black tea was
sampled. A total of twelve factories were sampled, four from each ecological zone.
For fresh tea shoots, about 2 kg of young shoots, comprising about 75 % two leaves and
a bud and loose leaf were plucked from three clones grown in the three ecological zones.
The clones sampled were 31/8, SFS 150 and 301/577. These were the most popular
clones in the three ecological zones. Farms were randomly stratified into small blocks
within these ecological zones and the fresh shoots plucked from the farms by random
sampling of the selected clone.
3.4 Leaf quality determination
Leaf delivered to each factory in this study was subjected to a random leaf quality test to
ascertain what quality of leaf was delivered for processing. The leaf count method,
which is the most frequently method used for leaf quality determination amongst the
KTDA factories, was used (KTDA, 2011). In this method, from the withering troughs,
36
the delivered leaf randomly collected from as many troughs as possible and put in a
quality trough. The collected leaf was then emptied to a table from where; one hundred
green tea loose tea leaves are counted randomly through shuffling. The collected
plucked leaf from each factory was then sorted into different plucking standards as
described earlier. Good quality leaf constitutes one leaf and a bud or banjhi and two
leaves and a bud or banjhi and the summation of this should be at least 75 out of the 100
leaves counted from the troughs for quality determination in KTDA managed tea
factories.
3.5 Sample pre-treatment
The unprocessed fresh shoots and the black tea samples were placed in clean well
labeled paper bags and preserved in a portable cooler to prevent bruising, oxidation and
contamination. They were transported to the Coffee Research Foundation (CRF)
laboratories in Ruiru, and the Tea Research Foundation of Kenya (TRFK) laboratories in
Kericho, Timbilil Estate for screening and analysis. The samples were oven dried at the
laboratories (Menment, 854 Schwalech Germany) for 12 hours at 103 ± 2 0C. Once dry,
the samples were finely ground using an electric blending device (Moulinex AR 1043,
China) to reduce the particle size and homogenized. Two grams of each sample was
weighed to the nearest 0.001g and placed in an infra red moisture determination machine
for ten minutes after which each sample was dried to a constant weight and the moisture
content of the sample determined automatically.
3.6 Reagents and standard solutions
Formic acid from (Pancreas, Barcelona, Spain), Acetonitrile (Romil, Cambridge, UK)
was of HPLC grade. Double distilled water from reputable commercial suppliers was
used throughout. Gallic acid, (+) catechin, and epicatechin were purchased from Fluka
(Buchs, Switzerland), epigallocatechin and epicatechin gallate were acquired from
Sigma (Steinfein, Germany). These reagents were stored at -20 °C. Caffeine was
37
obtained from Merck Ltd. Stable standard solutions (200 mg/ml) were prepared in
acetonitrile and stored at 4 °C. Working standard solutions were prepared weekly from
the stock solutions by dilution with acetonitrile. All other chemical reagents such as
isobutylmethylketone (IBMK), Flavognost reagent (diphenyl boric acid 2-
aminoethylester) were standard items sourced from reputable commercial sources. All
solvents used for extraction were of analytical grade while water was double distilled.
3.7 Extraction of polyphenols from the samples
The polyphenols were extracted using the following procedure (Zuo et al., 2002) and as
per ISO 14502-2-2005E. A sample of milled tea (0.2gms) was weighed and extracted
with 100 ml of warm methanol. 5.0 ml of methanol were added to each sample and the
mixture warmed in a water bath at 70 °C for 10 minutes with constant stirring using a
vortex mixer. The mixture was then cooled for five minutes and centrifuged at 3500 rpm
for ten minutes after which it was decanted and the sediment extracted again using the
70 % methanol at 70 °C, centrifuged again at 3500 rpm for ten minutes and then added
to the upper solution layer which was then topped up to ten ml with methanol. 1.0 ml of
this extract was put in a 100 ml conical flask and diluted to volume. Aliquots of 10.0 ml
of this solution were transferred to a 25 ml flask. Portions of this solution were filtered
through a disposal 0.45 µm filter unit into a vial ready for HPLC analysis. This
extraction procedure was carried out at room temperature to prevent possible
degradation (Suematsu et al., 1995). Since the results were to be expressed on a dry
matter basis, the moisture of the tea samples was determined before the analysis.
3.8 Analysis of tea leaf extracts
3.8.1 Chromatographic determination of catechins in tea samples
The catechins in the dried non processed tea shoots were analyzed quantitatively by
using high performance liquid chromatography (HPLC) with a reverse phase two solvent
gradient elution (Zuo et al., 2002; Fernandez et al., 2000) systems and as per ISO
38
14502 procedure (ISO, 14502-2- 200 5E). A Knaer Hitachi (Darmstadt, Germany)
HPLC chromatograph, equipped with a L – 7100 pump, a Rheodyne (CATATI, CA)
7725I injection valve with a 20 µL sample loop, and a diode array detector (DAD) L-
7455 operating at 278 nm was used for the catechins determination. All the modules
were controlled by a personal computer equipped with a Knaer Hitachi D-7000 interface
and HPLC system manager software (Merck Hitachi). A 25 cm x 4 mm Lichro CART
RP – 18 5 µm column, 4.0 x 46 mm i.d. was used for the separation.
The mobile phase A comprised of acetonitrile/acetic acid/distilled water (8:2:90) v/v/v
and mobile phase B was acetonitrile/acetic acid/distilled water (80:2:18) v/v/v. The flow
rate was one microlitre/minute and injection volume twenty microlitres. The column
(Gemin C18-005 column, 4.0 mm × 46 mm i.d) was operated at 35 °C and UV detection
peaks were read at 278 nm. 1.0 ml of the sample was pipetted into separate tubes and
diluted to 5.0 ml with stabilizing solution, filtered and loaded into vials. The
identification of individual catechins was carried out by comparing the retention times of
sample peaks with peaks obtained from the mixed known catechin standards (+C, EC,
EGC, ECG, EGCG) under the same conditions Quantification of the catechins was at
278 nm using external calibration curves, R2=0. 9984 together with the consensus
relative response factors (RFS) in respect to caffeine calculated on dry matter basis. The
precision of this method was evaluated by carrying out replicate analysis of a standard
solution on different days.
% Total catechins = % {ECG + % EC + % EGCG + % (+C) + %EGC}
3.8.2 Spectrophotometric determination of total polyphenols
The polyphenol content was determined according to ISO 14502-1-2005 procedure,
using the Folin–Ciocalteu Phenol reagent as described by Pourmorad et al., (2006).
Measurements of optical densities of the tea samples were carried out using a Shimadzu
UV-1800 Series Spectrophotometer.
39
The reagent was used because it contains phosphotungistic acid as oxidant total
polyphenol. About 0.2 grams of each black tea sample collected from each of the
different catchment areas was weighed and extracted using the water/methanol
extraction procedure (Pourmorad et al., 2006). 1.0 ml of the extract was transferred to a
100 ml volumetric flask and distilled water added to the mark and mixed. 1.0 ml of the
diluted extract was then transferred in duplicate into separate tubes. 5.0 ml of ten per
cent (v/v) diluted Folin-Ciocalteu was then pipette into each tube and mixed. Within
three to eight minutes after addition of the Folin-Ciocalteu Phenol reagent, four milliliter
of 7.5 % w/w sodium carbonate solution was added to each tube stoppered and mixed
well. The mixture was then allowed to stand at room temperature for 60 minutes and
then optical densities (OD) measured in one ml cell each using a Shimadzu UV-1800
series Spectrophotometer at 765 nm. A calibration curve was obtained using gallic acid
over a concentration range of 10 to 50 µgml-1. Gallic acid standard solution was
prepared by transferring 1, 2, 3, 4 and 5 ml corresponding to 10, 20, 30, 40 and 50 mg
anhydrous gallic acid into a 100 ml volumetric flask and filled to the mark with distilled
water. The optical density readings of the test samples were referenced to the calibration
curve to determine the total polyphenol content of the tea samples. The amounts of the
total polyphenols was determined from a standard curve generated using gallic acid as a
standard and expressed as the amount of gallic acid equivalent. The total polyphenol
content was expressed as a percentage by mass dry matter following ISO standards
(Karori et al., 2007; Robert and Smith, 1963; 1972).
M= MO X V x WDm std x 10000
100 x 100
Where, Mo – is the standard mass in grams of gallic acid monohydrate used to prepare
the stock solution
40
V – Is the volume in millilitres of Gallic stock standard solution used to prepare the
standard solution A, B, C, D and E.
WDM std - is the dry matter content expressed as a mass fraction % of the gallic acid. The
total polyphenol content expressed as a percentage by mass on sample dry matter basis
was calculated using the formula.
WT = (Dsample –Dintercept) x Vsample x D x 100
Sstd x Msample x 10,000 x WDmsample
Where D sample - is the optical density obtained for the sample test solution
D intercept - is the optical density at point of the last fit linear calibration
M sample - is the mass (g) of the sample test solution
Vsample - is the sample extraction volume in milliliters (10 ml for leaf tea)
D - Is the dilution factor used prior to the calorimetric determination?
WDM Sample - is the dry matter (expressed as mass fraction in percent) of the test
sample.
3.8.3 Determination of total theaflavins content in the tea samples.
The total theaflavin content of the tea samples were assayed for by using the Flavognost
method of Hilton and Palmer Jones (1973). Nine grams of the tea samples was weighed
and infused with 375 ml of boiling water added from an overhead boiler into a tarred
flask. The flask was then agitated in a mechanical shaker for fifty minutes. The infusion
was then filtered through rough cotton wool and allowed to cool to room temperature. 10
ml of the tea infusion was then pipetted into 10 ml of IBMK. The mixture was then
shaken for ten minutes and allowed to stand until layers separated. 2.0 ml of the upper
41
layer was pipette into a test tube, followed by 4.0 ml of ethanol and 2.0 ml of Flavognost
reagent (2g diphenylboric acid-2-amino ethylester) dissolved in 100 ml of ethanol. The
contents were mixed and colour allowed developing for fifteen minutes. The absorbance
at 625 nm was read against a 1BMK/ethanol (1:1 v/v blank).
Total theaflavins was then calculated by the formulae;
TF (µmol/gm) = A625 x 47.9 X 100/DM
Where A625 is the absorbance at 625 nm and DM is the dry matter of the sample.
3.8.4 Determination of liquor total colour
Five milliliters of filtered standard tea infusion for theaflavin analysis was pipette into
forty five milliliters of distilled water in a 100 ml conical flask. The solution was shaken
well to ensure thorough mixing. The absorbance of this solution at 460 nm was read
against distilled water. The result was corrected for dry matter content of the black tea
samples. Total colour was then calculated by the formulae;
TC = E460 × 10 ÷ (DM ÷ 100)
Where E460 is the absorbance at 460 nm and DM is the dry matter of the tea sample.
3.8.5 Determination of liquor brightness
Five milliliters of filtered standard tea infusion for theaflavin analysis was pipette into
forty five milliliters of distilled water in a 100 ml conical flask. The solution was shaken
well to ensure thorough mixing. The absorbance of this solution at 460 nm was read
against distilled water. The result was corrected for dry matter content of the black tea
samples. Total liquor brightness was calculated using the formulae;
Brightness % = 100 x E3 ÷ (E1 +2 E2)
42
Where E3, E1 and E2, are absorbances of the solutions at 460 nm wavelength of the UV -
1800 Shimadzu spectrophotometer.
3.8.6 Determination of total thearubigins in tea samples
The total thearubigins was determined as described by the methods of Roberts and
Smith, (1963). 6.0 ml of 1 % v/v aqueous solution of anhydrous disodium hydrogen
orthophosphate was added to the 6.0 ml of cooled tea infusion. The resulting mixture
was extracted with ten milliliters of ethyl acetate by vigorous shaking for one minute.
The mixture was allowed to settle and the aqueous layer drained off. 5.0 ml of ethyl
acetate was then added to the ethyl acetate extract containing the theaflavin fraction in
the separating funnel. 10 ml of the ethyl acetate extract was then diluted to 25 ml with
methanol in 25 ml volumetric solution (solution E1). 1.0 ml of the tea infusion was
mixed with 9.0 ml of distilled water and made to 25 ml in a volumetric flask with
methanol (solution E2). 1.0 ml of saturated aqueous 10 % oxalic acid was then added to
1.0 ml of tea infusion and 8.0 ml of distilled water and made to 25 ml with methanol
(solution E3). The absorbance of solutions E1, E2 and E3 were obtained at 380 nm and
460 nm respectively using a Shimadzu UV-1800 series spectrophotometer with distilled
water as the blank. Each sample was extracted in duplicate for the determination of
theaflavin (TFs), thearubigin (TRs) fractions and brightness levels. The percent TFs and
TRs values were then calculated using the formulae;
TFs% = 2.25 x E1 x DM
TRs% = 7.06 x (4E3 – E1) ÷ DM %
3.9 Analysis of antioxidant activity of tea sample
The radical scavenging activity of the tea extracts from leaf obtained from each zone
was determined by the 2, 2-diphenyl-2-picrylhydrazyl (DPPH) radical using a modified
method of Brand-Williams et al., 1995. The assay is based on the measurement of the
43
scavenging ability of antioxidants towards the stable DPPH radical (Moreno et al.,
2002). 5.0 g of tea was infused in 100 ml of boiling doubled distilled water followed by
stirring with a magnetic stirrer and additional steeping for 30 minutes at room
temperature. The extracts were strained through a nylon mesh (120 µm) followed by a
filter paper (Whatman No. 54). Aliquots of the extract were kept frozen at -18 0C until
further use. The soluble solid extracts were standardized to give stock solution of 50 mg
soluble solids per 100 ml of 50 % methanol. A 50 µl methanolic solution of tea sample
was place in a curvette and two milliliter of 6.0 X 10⁻⁵ M of 80 % methanolic solution of
DPPH added. The decrease in absorbance at 517 nm was determined using a Shimadzu
UV-1800 series spectrophotometer until the absorbance stabilized. Readings were done
between 15 and 30 minutes interval before the reaction reached a plateau phase. The
DPPH solution was prepared afresh and kept in the dark to minimize the loss of free
radical stock solution. All determinations were performed in triplicate. The percentage
inhibition of the DPPH radical was calculated for the absorbance rate according to the
method of Yen and Duh (1994).
% inhibition against DPPH = [AB - AA] ÷ [AB × 100]
Where AB was absorbance of the blank sample (50 ml double distilled water and 2 ml
DPPH) and AA is the absorbance of the tested sample after 15 minutes.
3.10 Ranking of teas as per tasters’ organoleptic evaluation
The black tea samples were randomly numbered and subjected to organoleptic
evaluation by two experienced tea tasters at the tasting room of Tea Brokers East Africa
(TBEA), Mombasa. The tasters had expert knowledge of black teas, which they auction
regularly. The tasters evaluated liquor briskness, brightness, strength and Aroma. The
scales used to rank the levels of these parameters in the tea liquor were (Obanda et al.,
2001):
Very bright -11, bright -9, fairly bright - 7, a little bright -5, dull -3, very dull -1
44
Very brisk -11, brisk -9, fairly brisk – 7 a little brisk – 5, soft -3, very soft – 1
Very strong - 11, strong -9, fairly strong -7, a little strong -5, weak -3, poor – 1
Pungent - 11, Flavourly-9, aromatic - 7, a little aromatic -5, soft -3, watery -1
The result of this taster‟s evaluation enabled the tea samples to be ranked according to
organoleptic quality. Ranking would be from the highest scores at a maximum of 44 and
lowest at a possible minimum of a score 4. A correlation analysis was then carried out to
relate the taste characteristic to the different biochemical components inherent in the teas
from the different zones.
3.11 Analysis of inorganic nutrients in black CTC teas
Fe, Zn and Cu contents of the tea samples were determined using Flame Atomic
Absorption Spectrophotome- try (FAAS), following the method described by Moseti et
al., (2013). To quantify K, P, Ca and Mn in the teas, 0.25 g of each of the finely ground
oven-dried tea samples were accurately weighed using an analytical balance (BL-3200
HL, Shimadzu, Japan) into separate, clean and dry specimen tubes and ashed in a muffle
furnace (Gallenkamp, England) at 460 ± 2 ºC for 4.5 hours. The ashed samples obtained
were allowed to cool followed by wet digestion using two parts of a 1:1 mixture of
concentrated HNO3 (69 - 70.5 %) and concentrated HCl (37 %) to three parts of H2O2
under reflux to near dryness (Sitienei et al., 2013). Each sample residue obtained was
then dissolved in 25 ml of 0.05 M HCl solution. The clear solution was shaken
thoroughly and allowed to stand for 4 hours prior to analysis. Ca and Mn contents of the
digests were then quantified using an Atomic Absorption Spectrophotometer (Varian,
SPPA-880, and EL98083516). Phosphorus,P was quantified colorimetrically using a
UV-Vis Spectrophotometer (UV-1800, Shimadzu, ENG240V, SOFT) fitted with a
Shimadzu ASC-5 auto sample changer at 400 nm after complexing with a mixture of
ammonium molybdite and ammonium metavanadate whereas K was quantified by flame
emission using a flame photometer (Corning, 400, 2604) (Thomas et al., 1967; Spencer,
45
1950). For quality assurance, two reference tea samples (A and B) were ashed, digested
and analysed for all the inorganic nutrients of interest alongside every batch of samples
daily throughout the analysis. Reagent and sam- ple blanks treated in a similar way as
the samples were also included. Moreover, to check the efficiency of the analytical
methods, the reference samples A and B were spiked with known concentrations of the
respective analytes and recovery tests performed.
3.12 Data analysis
All various groups (treatments) of data obtained were subjected to Analysis of Variance
(ANOVA) using the MSTAT statistical software (Steel et al., 1997) at p ≤ 0.05. Where
statistically significant differences were observed, the Least Significant Difference
(LSD) test was used for mean separation. Data was tabulated as means of the triplicate
determinations ± standard deviations (SD). Correlation analysis by GraphPad Prism 5.0
for Windows was employed to determine the relationship between the biochemical
profiles and sensory quality of the teas.
46
CHAPTER FOUR
RESULTS AND DISCUSSION
4.1 Green leaf plucking standards
Leaf quality plucking data obtained in the study is presented in Table 3. The mean
percent leaf plucking quality for the three agro-ecological areas was 74 ± 1.0 %.
The means for each zone were 75 ± 0.7, 74 ± 0.2 and 73 ± 1.1 % for Murang‟a,
Meru and Kisii zones respectively. This data reveals that farmers in the Murang‟a
zone deliver better plucked tea shoots followed by Meru and Kisii zones. These
differences in mean leaf qualities result in significant differences (p < 0.05) in the
qualities of leaf processed at the factories in these zones studied (Table 3). Whereas
there is not much difference between leaf plucking quality in Murang‟a and Meru
zones, there are significant variations of leaf in the Kisii factories with leaf
standards falling between 72 and 74 % good leaf. It was noted that whereas farmers
in the East of the Rift zones, in this case Murang‟a and Meru, pluck between three
to four rounds per month, farmers in the West of Rift (Kisii) do two plucking
rounds per month. This could be the reason contributing to the poor harvested leaf
being delivered to the factories in this zone. However, the mean leaf plucking
standard delivered to factories within each zone, and interactions thereto were not
statistically significant (p≤0.05) (Table3).
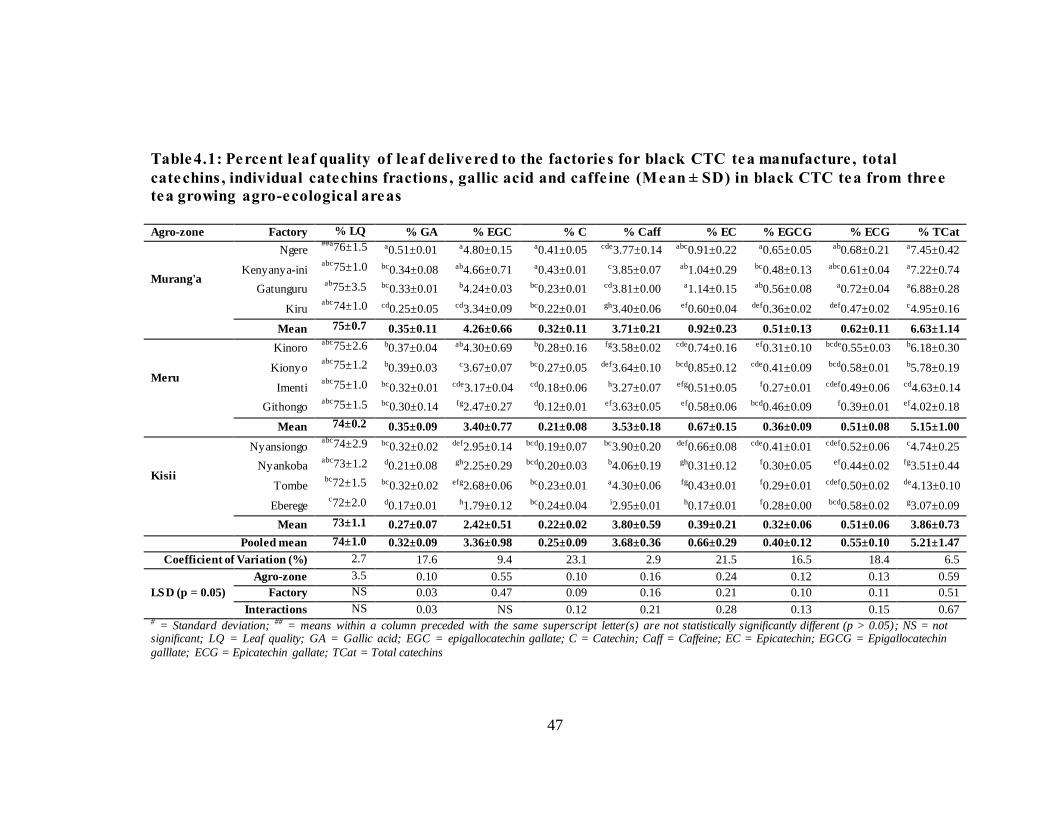
47
Table 4.1: Percent leaf quality of leaf de livered to the factories for black CTC tea manufacture , total
catechins , individual catechins fractions , gallic acid and caffe ine (Mean ± SD) in black CTC tea from three
tea growing agro-ecological areas
Agro-zone Factory % LQ % GA % EGC % C % Caff % EC % EGCG % ECG % TCat
Murang'a
Ngere ##a76±1.5 a0.51±0.01 a4.80±0.15 a0.41±0.05 cde3.77±0.14 abc0.91±0.22 a0.65±0.05 ab0.68±0.21 a7.45±0.42
Kenyanya-ini abc75±1.0 bc0.34±0.08 ab4.66±0.71 a0.43±0.01 c3.85±0.07 ab1.04±0.29 bc0.48±0.13 abc0.61±0.04 a7.22±0.74
Gatunguru ab75±3.5 bc0.33±0.01 b4.24±0.03 bc0.23±0.01 cd3.81±0.00 a1.14±0.15 ab0.56±0.08 a0.72±0.04 a6.88±0.28
Kiru abc74±1.0 cd0.25±0.05 cd3.34±0.09 bc0.22±0.01 gh3.40±0.06 ef0.60±0.04 def0.36±0.02 def0.47±0.02 c4.95±0.16
Mean 75±0.7 0.35±0.11 4.26±0.66 0.32±0.11 3.71±0.21 0.92±0.23 0.51±0.13 0.62±0.11 6.63±1.14
Meru
Kinoro abc75±2.6 b0.37±0.04 ab4.30±0.69 b0.28±0.16 fg3.58±0.02 cde0.74±0.16 ef0.31±0.10 bcde0.55±0.03 b6.18±0.30
Kionyo abc75±1.2 b0.39±0.03 c3.67±0.07 bc0.27±0.05 def3.64±0.10 bcd0.85±0.12 cde0.41±0.09 bcd0.58±0.01 b5.78±0.19
Imenti abc75±1.0 bc0.32±0.01 cde3.17±0.04 cd0.18±0.06 h3.27±0.07 efg0.51±0.05 f0.27±0.01 cdef0.49±0.06 cd4.63±0.14
Githongo abc75±1.5 bc0.30±0.14 fg2.47±0.27 d0.12±0.01 ef3.63±0.05 ef0.58±0.06 bcd0.46±0.09 f0.39±0.01 ef4.02±0.18
Mean 74±0.2 0.35±0.09 3.40±0.77 0.21±0.08 3.53±0.18 0.67±0.15 0.36±0.09 0.51±0.08 5.15±1.00
Kisii
Nyansiongo abc74±2.9 bc0.32±0.02 def2.95±0.14 bcd0.19±0.07 bc3.90±0.20 def0.66±0.08 cde0.41±0.01 cdef0.52±0.06 c4.74±0.25
Nyankoba abc73±1.2 d0.21±0.08 gh2.25±0.29 bcd0.20±0.03 b4.06±0.19 gh0.31±0.12 f0.30±0.05 ef0.44±0.02 fg3.51±0.44
Tombe bc72±1.5 bc0.32±0.02 efg2.68±0.06 bc0.23±0.01 a4.30±0.06 fg0.43±0.01 f0.29±0.01 cdef0.50±0.02 de4.13±0.10
Eberege c72±2.0 d0.17±0.01 h1.79±0.12 bc0.24±0.04 i2.95±0.01 h0.17±0.01 f0.28±0.00 bcd0.58±0.02 g3.07±0.09
Mean 73±1.1 0.27±0.07 2.42±0.51 0.22±0.02 3.80±0.59 0.39±0.21 0.32±0.06 0.51±0.06 3.86±0.73
Pooled mean 74±1.0 0.32±0.09 3.36±0.98 0.25±0.09 3.68±0.36 0.66±0.29 0.40±0.12 0.55±0.10 5.21±1.47
Coefficient of Variation (%) 2.7 17.6 9.4 23.1 2.9 21.5 16.5 18.4 6.5
LSD (p = 0.05)
Agro-zone 3.5 0.10 0.55 0.10 0.16 0.24 0.12 0.13 0.59
Factory NS 0.03 0.47 0.09 0.16 0.21 0.10 0.11 0.51
Interactions NS 0.03 NS 0.12 0.21 0.28 0.13 0.15 0.67 # = Standard deviation; ## = means within a column preceded with the same superscript letter(s) are not statistically significantly different (p > 0.05); NS = not significant; LQ = Leaf quality; GA = Gallic acid; EGC = epigallocatechin gallate; C = Catechin; Caff = Caffeine; EC = Epicatechin; EGCG = Epigallocatechin
galllate; ECG = Epicatechin gallate; TCat = Total catechins
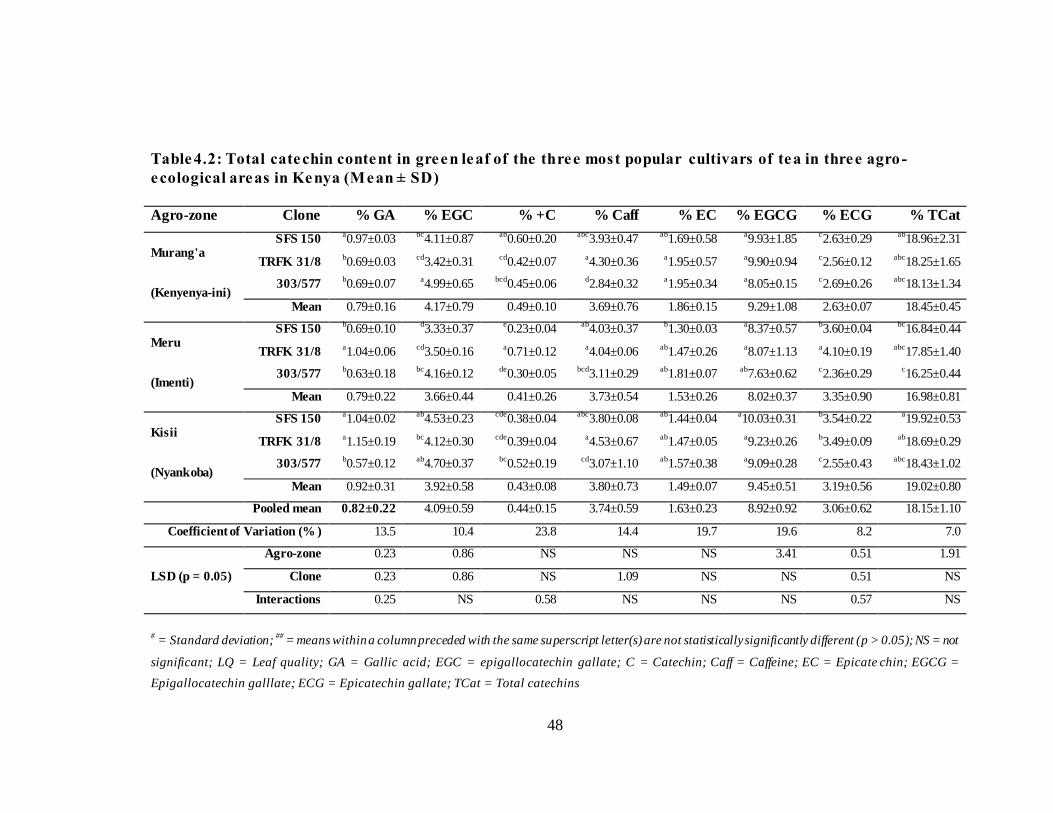
48
Table 4.2: Total catechin content in green leaf of the three most popular cultivars of tea in three agro-
ecological areas in Kenya (Mean ± SD)
Agro-zone Clone % GA % EGC % +C % Caff % EC % EGCG % ECG % TCat
Murang'a
(Kenyenya-ini)
SFS 150 a
0.97±0.03 bc
4.11±0.87 ab
0.60±0.20 abc
3.93±0.47 ab
1.69±0.58 a9.93±1.85
c2.63±0.29
ab18.96±2.31
TRFK 31/8 b
0.69±0.03 cd
3.42±0.31 cd
0.42±0.07 a4.30±0.36
a1.95±0.57
a9.90±0.94
c2.56±0.12
abc18.25±1.65
303/577 b
0.69±0.07 a4.99±0.65
bcd0.45±0.06
d2.84±0.32
a1.95±0.34
a8.05±0.15
c2.69±0.26
abc18.13±1.34
Mean 0.79±0.16 4.17±0.79 0.49±0.10 3.69±0.76 1.86±0.15 9.29±1.08 2.63±0.07 18.45±0.45
Meru
(Imenti)
SFS 150 b
0.69±0.10 d3.33±0.37
e0.23±0.04
ab4.03±0.37
b1.30±0.03
a8.37±0.57
b3.60±0.04
bc16.84±0.44
TRFK 31/8 a
1.04±0.06 cd
3.50±0.16 a0.71±0.12
a4.04±0.06
ab1.47±0.26
a8.07±1.13
a4.10±0.19
abc17.85±1.40
303/577 b
0.63±0.18 bc
4.16±0.12 de
0.30±0.05 bcd
3.11±0.29 ab
1.81±0.07 ab
7.63±0.62 c2.36±0.29
c16.25±0.44
Mean 0.79±0.22 3.66±0.44 0.41±0.26 3.73±0.54 1.53±0.26 8.02±0.37 3.35±0.90 16.98±0.81
Kisii
(Nyankoba)
SFS 150 a
1.04±0.02 ab
4.53±0.23 cde
0.38±0.04 abc
3.80±0.08 ab
1.44±0.04 a10.03±0.31
b3.54±0.22
a19.92±0.53
TRFK 31/8 a
1.15±0.19 bc
4.12±0.30 cde
0.39±0.04 a4.53±0.67
ab1.47±0.05
a9.23±0.26
b3.49±0.09
ab18.69±0.29
303/577 b0.57±0.12
ab4.70±0.37
bc0.52±0.19
cd3.07±1.10
ab1.57±0.38
a9.09±0.28
c2.55±0.43
abc18.43±1.02
Mean 0.92±0.31 3.92±0.58 0.43±0.08 3.80±0.73 1.49±0.07 9.45±0.51 3.19±0.56 19.02±0.80
Pooled mean 0.82±0.22 4.09±0.59 0.44±0.15 3.74±0.59 1.63±0.23 8.92±0.92 3.06±0.62 18.15±1.10
Coefficient of Variation (% ) 13.5 10.4 23.8 14.4 19.7 19.6 8.2 7.0
LSD (p = 0.05)
Agro-zone 0.23 0.86 NS NS NS 3.41 0.51 1.91
Clone 0.23 0.86 NS 1.09 NS NS 0.51 NS
Interactions 0.25 NS 0.58 NS NS NS 0.57 NS
# = Standard deviation;
## = means within a column preceded with the same superscript letter(s) are not statistically significantly different (p > 0.05); NS = not
significant; LQ = Leaf quality; GA = Gallic acid; EGC = epigallocatechin gallate; C = Catechin; Caff = Caffeine; EC = Epicate chin; EGCG =
Epigallocatechin galllate; ECG = Epicatechin gallate; TCat = Total catechins
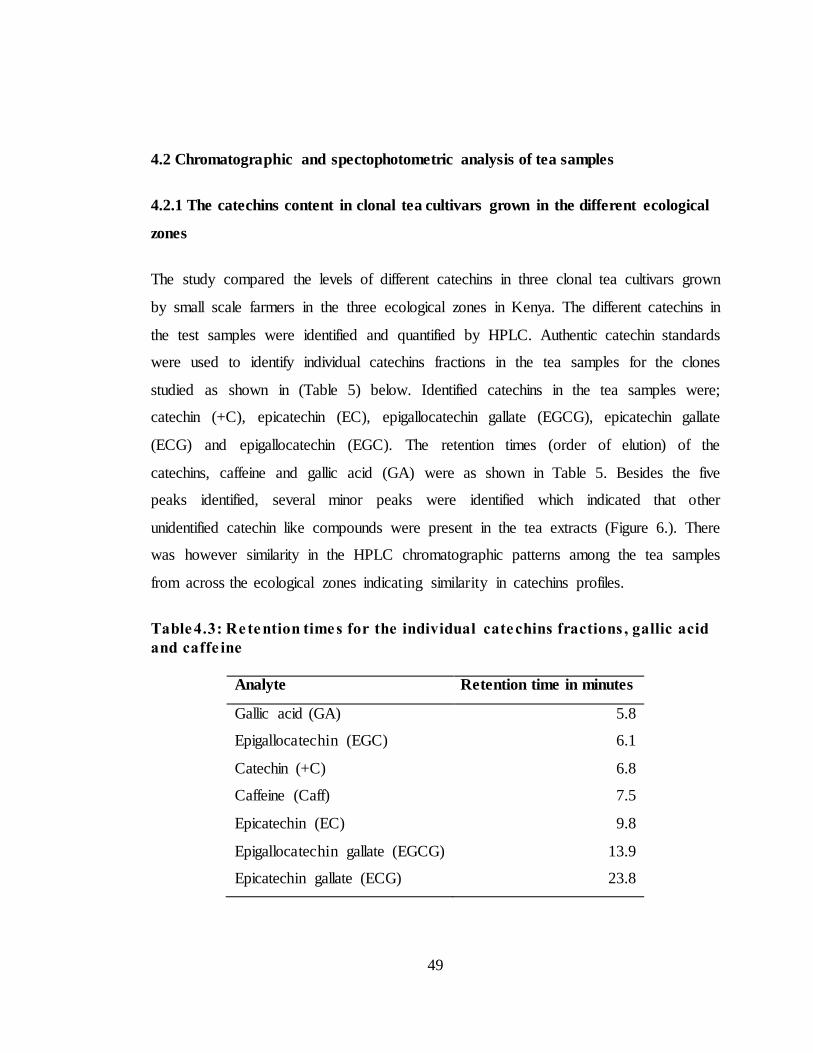
49
4.2 Chromatographic and spectophotometric analysis of tea samples
4.2.1 The catechins content in clonal tea cultivars grown in the different ecological
zones
The study compared the levels of different catechins in three clonal tea cultivars grown
by small scale farmers in the three ecological zones in Kenya. The different catechins in
the test samples were identified and quantified by HPLC. Authentic catechin standards
were used to identify individual catechins fractions in the tea samples for the clones
studied as shown in (Table 5) below. Identified catechins in the tea samples were;
catechin (+C), epicatechin (EC), epigallocatechin gallate (EGCG), epicatechin gallate
(ECG) and epigallocatechin (EGC). The retention times (order of elution) of the
catechins, caffeine and gallic acid (GA) were as shown in Table 5. Besides the five
peaks identified, several minor peaks were identified which indicated that other
unidentified catechin like compounds were present in the tea extracts (Figure 6.). There
was however similarity in the HPLC chromatographic patterns among the tea samples
from across the ecological zones indicating similarity in catechins profiles.
Table4.3: Retention times for the individual catechins fractions , gallic acid
and caffe ine
Analyte Retention time in minutes
Gallic acid (GA) 5.8
Epigallocatechin (EGC) 6.1
Catechin (+C) 6.8
Caffeine (Caff) 7.5
Epicatechin (EC) 9.8
Epigallocatechin gallate (EGCG) 13.9
Epicatechin gallate (ECG) 23.8
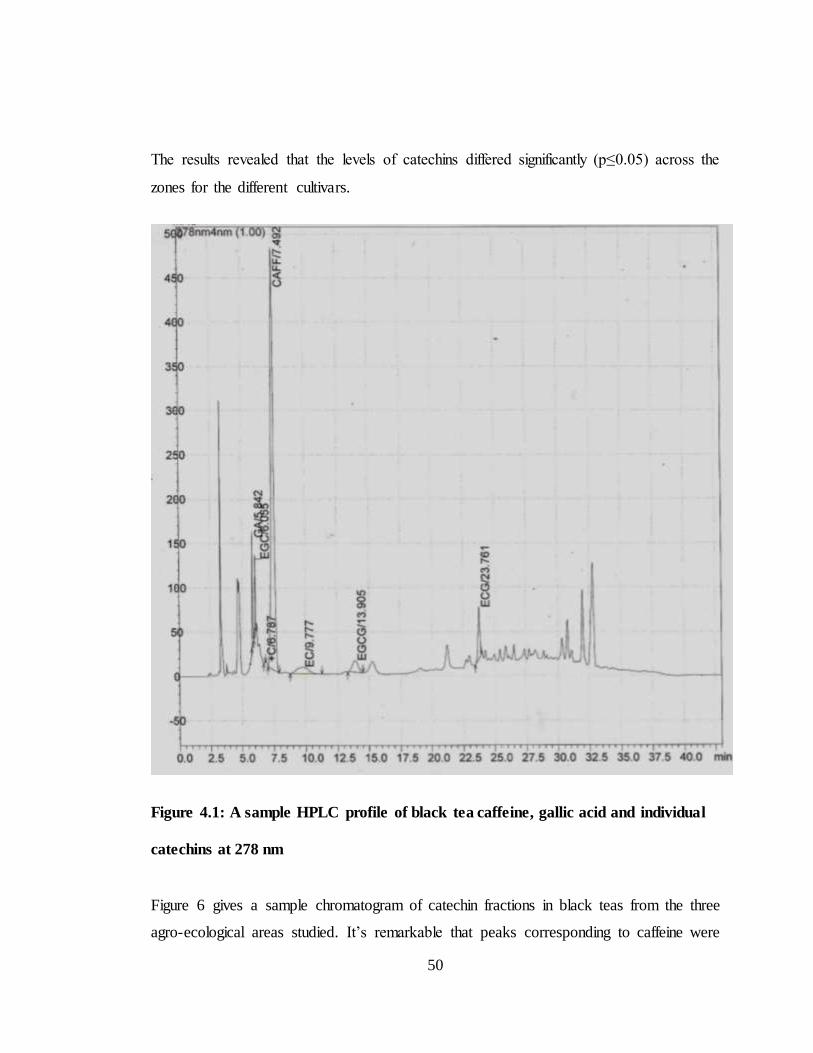
50
The results revealed that the levels of catechins differed significantly (p≤0.05) across the
zones for the different cultivars.
Figure 4.1: A sample HPLC profile of black tea caffeine, gallic acid and individual
catechins at 278 nm
Figure 6 gives a sample chromatogram of catechin fractions in black teas from the three
agro-ecological areas studied. It‟s remarkable that peaks corresponding to caffeine were
51
always higher in all cases. This can be explained by the fact that the amount of caffeine
increases during the fermentation process owing to its liberation from catechins gallates
(Xie et al., 1998). Caffeine is present in higher amounts in the cases of black CTC teas,
showing values between 2.95±0.01 % for Eberege in Kisii to 4.30±0.06 % for Tombe
factory catchment in Kisii, while the average zonal variation was 3.80±0.59 % for Kisii
zone; 3.71±0.21 % for Muranga zone and 3.53±0.18 % for Meru zone.The pooled mean
for the three ecological zone was 3.68±0.36%. The differences in the caffeine levels
among the black teas were statistically significant at p≤0.05 across the three zones,
within the factories and in their intereactions thereof. In the non-fermented clonal green/
fresh shoots cultivars, caffeine levels ranged between 2.84 ± 0.32 % for clone 303/577
from Kanyenyaini factory catchment in Muranga to 4.53±0.67 % for cloneTRFK 31/8
from Nyankoba factory catchment in Kisii. The differences in the caffeine levels
amongst the tea cultivars were not statistically significant across the agro ecological
zones and in their intereactions thereto at p≤0.05, but they were statistically significant
across the three clones studied. This variation in caffeine levels would be due to genetic
factors and the different agronomic practices experienced in these ecological zones,
some of which have been cited such as difference in plucking rounds, leaf quality and
the response to the different ecological zones such as difference in altitudes which
confers on the tea plant varying shoot growths.
For black CTC teas, EGC,EC,EGCG, ECG and +C are the major catechins present in ,
with average contents for the total catechin content being 6.63±1.14% in Muranga Zone
, 5.15±1.00 % in Meru Zone, and 3.86±0.73% in Kisii Zone. EGC average contents were
4.26±0.66 %, 3.40±0.77%, and 2.42±0.51 % for Muranga, Meru and Kisii Zones
respectively. EC average content values across the zones were 0.92±0.23%, 0.67±0.15,
and 0.39±0.21% for Muranga, Meru and Kisii Zone while ECG values across the zones
also follow a similar pattern and are 0.62±0.11, 0.51±0.08 and 0.51±0.06. EGCG
average contents were 0.51±0.13 % for Muranga, 0.36±0.09 % for Meru and 0.32±0.06
% for Kisii Zone. +C levels also followed a similar pattern across the zones and were
52
0.32±0.11% for Muranga, 0.21±0.08 for Meru and 0.22±0.02% for Kisii Zone. All the
catechins assayed were statistically significant at p≤0.05 across the agro zones, within
the factories and in their interactions thereto (Table 3). Black teas in this study had very
low levels of (+) - catechin. This would be due to the fact that (+) - catechin is degraded
by oxidation during manufacturing. The data obtained in this study is comparable to
those reported by other authors (Balentine, 1992; Grahan, 1992; Hara, 1994).
From the results of these data, we can therefore conclude that the levels of catechins in
black teas among the ecological zones were in decreasing order from Muranga
ecological Zone, followed by Meru Zone and then Kisii ecological Zone. These
differences can be attributed to the fact that the three zones are in different ecological
zones that confer on the teas varying conditions resulting into different shoot growth
rates.
Among the clonal cultivars fresh green leaf sample, the total catechin content for each
cultivar differed significantly across the zones as shown in Table 4. The total catechn
content ranged between 16.25±0.44% for clone 303/577 at Imenti in Meru and
19.92±0.53% for clone SFS 150 at Nyankoba in Kisii. The average total catechin
content across the zones was 18.45±0.45% for Muranga zone, 18.15±1.10% for Kisii
zone and 16.98±0.81% for Meru zone. This zonal variation in total cathechin content
was statistically significant at p≤0.05 across the agro ecological zones but was not
statistically significant amongst the clones and in their interactions thereof. The most
dominant catechins in the green leaf were EGCG, EGC, ECG, EC and +C in that order.
EGCG levels were 9.29±1.08% in Muranga, 8.92±0.92% in Kisii zone and 8.02±0.37%
in Meru zone. The variation in EGCG levels was statistically significant across the agro
ecological zone at p≤0.05. EGC levels were 4.17±0.79% ,4.09±0.59% and 3.66±0.44%
respectively for Muranga,Kisii and Meru zones.These levels were statistically significant
across the zones and between the clones at p≤0.05 but not significant in their
interactions thereof. ECG levels were 2.63±0.07% for Muranga.3.35±0.90% for Meru
and 3.06±0.62% for Kisii zone.These variations in ECG levels were statistically
53
significant at p≤0.05 across the zones , within the clones and in their interactions thereof.
EC levels were 1.86±0.15% for Muranga, 1.63±0.23% for Kisii and 1.53±0.26% for
Meru zone. These variations were however not significant across the zones, within the
clones and in their interactions thereof. +C levels were 0.49±0.10% for Muranga,
0.44±0.15% for Kisii zone and 0.41±0.26% for Meru zone.The variations were not
significant across the zones and within the zones but were statistically significant at
p≤0.05 in their interactions thereof. The results for the catechin content in the fresh
shoots agree with earlier studies who found that catechins account for about 15 % of the
plant dry weight and that the major tea catechins are EGCG, EGC, ECG and EC
(Balentine, 1992).
4.2.2 Tea polyphenols
This study compared total polyphenol levels of black tea samples processed from tea
leaf grown by small scale farmers in three ecological zones in Kenya. The data in Table
6 reveals that polyphenol levels across the three ecological zones fall between
13.9±0.4% for Eberege in Kisii zone and 18.7±0.6% for Ngere in Muranga zone.The
average zonal variation in total polyphenol content was 17.8±1.6% for
Muranga,16.5±0.7% for Meru zone and 16.1±1.7% for Kisii zone. The pooled mean
total polyphenol content for the three zones was 16.8±0.9%. These total polyphenol
content of the black teas processed from germplasm in the three zones was statistically
significant at p≤0.05 across the agro zones, within the factories and between their
interactions thereto.The black teas are rich in polyphenols.This compares favourably
with other studies done at the TRFK that established clone 6/8 as a high quality clone
with highest polyphenol content of 24.4 and 19.3 % in both green and black processed
teas respectively. While total polyphenol content for processed purple coloured leaf
cultivars ranged between 16.2 to 18.7 % which is still higher than conventional green
teas from Chinese and Japanese cultivars (Koech et al.,2013). This finding is also in
agreement with data obtained for catechins in the preceding section and confirms zonal
variations in polyphenol contents in black tea. Table 6 clearly shows that the polyphenol

54
contents of black tea vary with the source of the green tea leaf sample.The difference in
the polyphenol content across the zones would be attributed to the different agronomic
practices in the three zones such as plucking rounds, leaf quality and difference in
altitude which are major contributors to the variations in the total polyphenol contents of
the teas from the three zones.
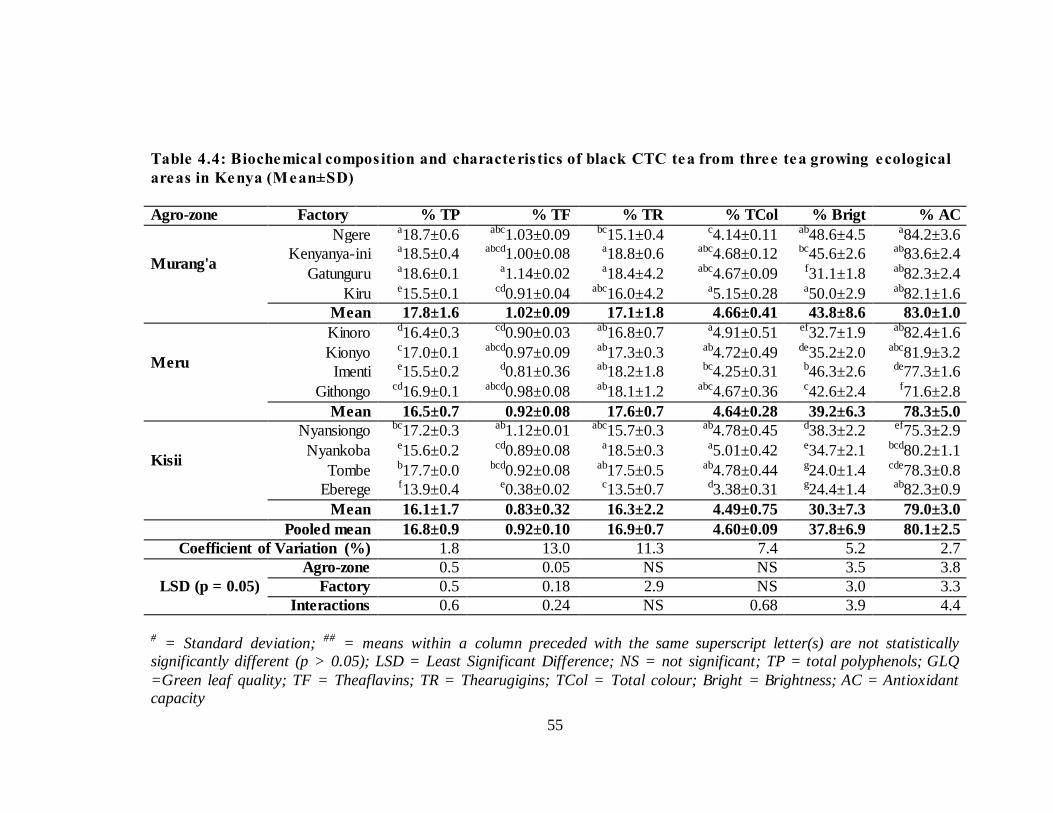
55
Table 4.4: Biochemical composition and characteris tics of black CTC tea from three tea growing ecological
areas in Kenya (Mean±SD)
Agro-zone Factory
% TP % TF % TR % TCol % Brigt % AC
Murang'a
Ngere a18.7±0.6 abc1.03±0.09 bc15.1±0.4 c4.14±0.11 ab48.6±4.5 a84.2±3.6
Kenyanya-ini a18.5±0.4 abcd1.00±0.08 a18.8±0.6 abc4.68±0.12 bc45.6±2.6 ab83.6±2.4
Gatunguru a18.6±0.1 a1.14±0.02 a18.4±4.2 abc4.67±0.09 f31.1±1.8 ab82.3±2.4
Kiru e15.5±0.1 cd0.91±0.04 abc16.0±4.2 a5.15±0.28 a50.0±2.9 ab82.1±1.6
Mean 17.8±1.6 1.02±0.09 17.1±1.8 4.66±0.41 43.8±8.6 83.0±1.0
Meru
Kinoro d16.4±0.3 cd0.90±0.03 ab16.8±0.7 a4.91±0.51 ef32.7±1.9 ab82.4±1.6
Kionyo c17.0±0.1 abcd0.97±0.09 ab17.3±0.3 ab4.72±0.49 de35.2±2.0 abc81.9±3.2
Imenti e15.5±0.2 d0.81±0.36 ab18.2±1.8 bc4.25±0.31 b46.3±2.6 de77.3±1.6
Githongo cd16.9±0.1 abcd0.98±0.08 ab18.1±1.2 abc4.67±0.36 c42.6±2.4 f71.6±2.8
Mean 16.5±0.7 0.92±0.08 17.6±0.7 4.64±0.28 39.2±6.3 78.3±5.0
Kisii
Nyansiongo bc17.2±0.3 ab1.12±0.01 abc15.7±0.3 ab4.78±0.45 d38.3±2.2 ef75.3±2.9
Nyankoba e15.6±0.2 cd0.89±0.08 a18.5±0.3 a5.01±0.42 e34.7±2.1 bcd80.2±1.1
Tombe b17.7±0.0 bcd0.92±0.08 ab17.5±0.5 ab4.78±0.44 g24.0±1.4 cde78.3±0.8
Eberege f13.9±0.4 e0.38±0.02 c13.5±0.7 d3.38±0.31 g24.4±1.4 ab82.3±0.9
Mean 16.1±1.7 0.83±0.32 16.3±2.2 4.49±0.75 30.3±7.3 79.0±3.0
Pooled mean 16.8±0.9 0.92±0.10 16.9±0.7 4.60±0.09 37.8±6.9 80.1±2.5
Coefficient of Variation (%) 1.8 13.0 11.3 7.4 5.2 2.7
LSD (p = 0.05)
Agro-zone 0.5 0.05 NS NS 3.5 3.8
Factory 0.5 0.18 2.9 NS 3.0 3.3
Interactions 0.6 0.24 NS 0.68 3.9 4.4
# = Standard deviation; ## = means within a column preceded with the same superscript letter(s) are not statistically significantly different (p > 0.05); LSD = Least Significant Difference; NS = not significant; TP = total polyphenols; GLQ
=Green leaf quality; TF = Theaflavins; TR = Thearugigins; TCol = Total colour; Bright = Brightness; AC = Antioxidant capacity
56
4.2.3 Total theaflavins (TFs) and Total thearubigins (TRs) levels of black CTC teas
The data on TFs and TRs is shown in Table 6. TFs levels in the three zones fall between
0.38±0.02% for Eberege in Kisii and 1.14±0.02% for Gatunguru in Muranga zone. The
zonal variation was 1.02±0.09% for Muranga, 0.92±0.08% for Meru zone and
0.83±0.32% for Kisii zone. The pooled mean for the three zones was 0.92±0.10%. The
difference in the zonal variation was statistically significant at p≤0.05% across the
agrozones, between the factories and in their interactions thereto.
TRs levels fall between 13.5±0.7% in Eberege in Kisii and 18.8±0.6% for Kanyenyaini
in Muranga. The zonal variation was 17.6±0.7% in Meru, 17.1±1.8% in Muranga and
16.3±2.2% in Kisii zone .The pooled mean for the three zones was 16.9±0.7%. The
difference in the TRs was statistically significant between the factories, but was not
significant across the agro zones and in their interactions thereto.
The TFs and TRs levels obtained in the current study are comparable with those
reported by other researchers elsewhere (Koech et al., 2013). For example in a TRFK
study, TRs levels have been found to be between 14.6 to 17.2 %, with black tea from the
popular high black tea quality clone TRFK 6/8 showing the highest total TFs and the
lowest content of TRs amongst the black tea products(Koech et al.,2013).
4.2.4. Total colour of black tea samples
Table 4.4 shows the variations in the total colour content of the black teas analyzed in
the study from the three ecological zones in Kenya. Colour levels fall between
3.38±0.31% for Eberege in Kisii to 5.15±0.28% in Kiru in Muranga.The zonal variation
was 4.66±0.41% for Muranga, 4.64±0.28% for Meru and 4.49±0.75% for Kisii zone.The
pooled mean colour content for the three zones was 4.60±0.09%.The zonal variations in
the colour content were not statistically significant in the agro ecological zones and
between the factories but were significant at p≤0.05 in their interactions thereto.
57
The data obtained is consistent with the results of other researchers from the TRFK who
have obtained similar data for Kenyan black teas, whose ranges are from 4.0 to 5.0 %.
Since TRs levels in black tea are thought to contribute to the total colour in black tea, it
was expected that the results would mimic those of total TRs, as had been observed by
the results depicted in Table 6.
4.2.5 Percent liquor brightness of black tea samples
Table 4.4 shows the variations in the brightness levels of black teas analyzed in this
study.
Brightness levels fall between 24.0±1.4% for Tombe in Kisii to 50.0±2.9% for Kiru in
Muranga.The zonal variations were 43.8±8.6% for Muranga, 39.2±6.3% for Meru and
30.3±7.3% for Kisii zone.The pooled mean for the three zones was 37.8±6.9%. Zonal
variations are evident in the level of brightness of the tea samples from the three zones
and these are statistically significant at p < 0.05 across the three zones, between the
factories and in their interactions thereto. The obtained data is consistent with results of
other researchers at the TRFK who have obtained similar data for Kenya black teas
whose brightness tend to range between 20% and 50 %. Since TFs levels in black tea
contribute significantly to the liquor brightness, it was expected that the results would
mimic those of TFs as has been observed by the results depicted.
4.3 Antioxidant activity of black CTC teas from three ecological zones in Kenya
The data on percent antioxidant capacity of the different black CTC teas from the three
ecological zones is presented in Table 6. Antioxidant capacities of the black teas assayed
were between 71.6±2.8% for Githongo in Meru and 84.2±3.6% for Ngere in
Muranga.The zonal averages were 83.0±1.0% for Muranga teas followed by 79.0±3.0%
for Kisii teas and 78.3±5.0% for Meru zone.The pooled mean total was 80.1±2.5%. The
variations in antioxidant capacities were statistically significant at p≤0.05 across the
agrozones, between the factories and in their interactions thereto.
58
From these results it appears that Kenyan black teas from the three zones have very
high antioxidant capacity and therefore have effective radical scavenging properties.
Antioxidant activity was highest in teas from Murang‟a followed by Kisii and then
Meru. These results are comparable with other research being carried out at the TRFK of
Kenya which has found out that antioxidant activities is higher in teas which have high
levels of anthocyanins, EGCG, ECG, EC and C implying that the most effective radical
scavengers are catechins with a 3, 4 and 5 -trihydroxylated substitution pattern on the B-
ring and/ or hydroxyl group at the C-3 position of the catechins structure (Kerio et al.,
2012).
4.4 Taster’s score and ranking of teas from the three agro-ecological areas
The organoleptic tasting data is presented in Table 4.5 These results reveal significant
differences (p < 0.05) in the quality of the teas from the three zones with regard to the
plain tea quality parameters tested (aroma, briskness, brightness and strength). The total
overall score had Muranga teas having a score of 41.4±1.9; followed by Meru at
23.3±6.1 and Kisii teas at 15.6±8.6.These overall score variation was statistically
significant at p≤0.05 across the three agrozones, between the factories and in their
interactions thereto. Aroma values were 10.3±0.8 for Muranga, followed by Meru at
5.8±2.0 and Kisii at 3.8±2.4. These variations were statistically significant across the
zones, within the factories and in their interactions thereto. Briskness values were
10.6±0.3 for Muranga, followed by Meru at 5.3±1.6 and then Kisii at 4.0±2.6. The
variations in briskness levels were statistically significant at p≤0.05 across the zones,
within the factories and in their interactions thereto.Brightness levels of the black teas
tasted were 10.1±0.6 for Muranga, followed by Meru at 5.9±1.1 and Kisii at 4.2±2.3.
These levels were statistically significant across the agrozones and in their interactions
thereto, but were not significant within the factories.Strength which is a very strong
indicator of the quality in a cup of tea, was 10.4±0.6 for Muranga tea, followed by Meru
tea at 6.3±1.6 and then Kisii at 3.7±1.7.The variations in strength were statistically
significant at p≤0.05 across the zones, and in their interactions thereto but not significant

59
within the factories.It can therefore be concluded that teas from Murang‟a are of
significantly superior quality, followed by teas from Meru and Kisii zones respectively
according to professional taster evaluations.
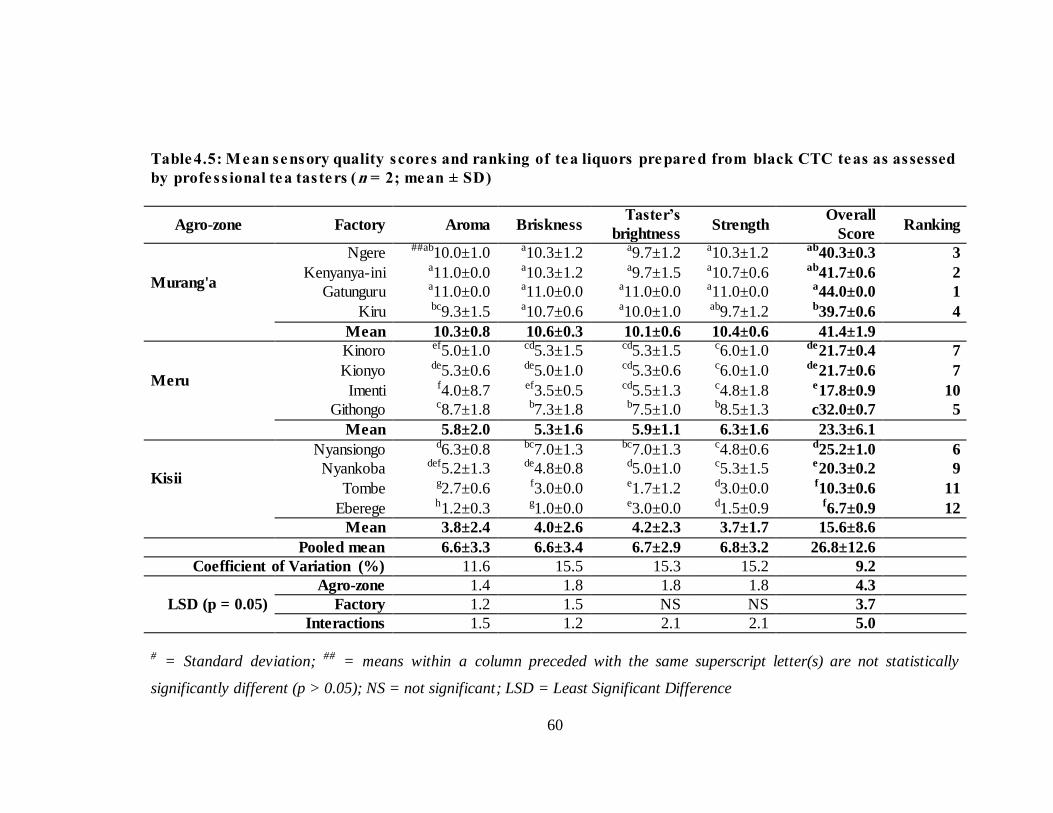
60
Table 4.5: Mean sensory quality scores and ranking of tea liquors prepared from black CTC teas as assessed
by profess ional tea tasters (n = 2; mean ± SD)
Agro-zone Factory Aroma Briskness Taster’s
brightness Strength
Overall
Score Ranking
Murang'a
Ngere ##ab10.0±1.0 a10.3±1.2 a9.7±1.2 a10.3±1.2 ab40.3±0.3 3
Kenyanya-ini a11.0±0.0 a10.3±1.2 a9.7±1.5 a10.7±0.6 ab41.7±0.6 2
Gatunguru a11.0±0.0 a11.0±0.0 a11.0±0.0 a11.0±0.0 a44.0±0.0 1
Kiru bc9.3±1.5 a10.7±0.6 a10.0±1.0 ab9.7±1.2 b39.7±0.6 4
Mean 10.3±0.8 10.6±0.3 10.1±0.6 10.4±0.6 41.4±1.9
Meru
Kinoro ef5.0±1.0 cd5.3±1.5 cd5.3±1.5 c6.0±1.0 de21.7±0.4 7
Kionyo de5.3±0.6 de5.0±1.0 cd5.3±0.6 c6.0±1.0 de21.7±0.6 7
Imenti f4.0±8.7 ef3.5±0.5 cd5.5±1.3 c4.8±1.8 e17.8±0.9 10
Githongo c8.7±1.8 b7.3±1.8 b7.5±1.0 b8.5±1.3 c32.0±0.7 5
Mean 5.8±2.0 5.3±1.6 5.9±1.1 6.3±1.6 23.3±6.1
Kisii
Nyansiongo d6.3±0.8 bc7.0±1.3 bc7.0±1.3 c4.8±0.6 d25.2±1.0 6
Nyankoba def5.2±1.3 de4.8±0.8 d5.0±1.0 c5.3±1.5 e20.3±0.2 9
Tombe g2.7±0.6 f3.0±0.0 e1.7±1.2 d3.0±0.0 f10.3±0.6 11
Eberege h1.2±0.3 g1.0±0.0 e3.0±0.0 d1.5±0.9 f6.7±0.9 12
Mean 3.8±2.4 4.0±2.6 4.2±2.3 3.7±1.7 15.6±8.6
Pooled mean 6.6±3.3 6.6±3.4 6.7±2.9 6.8±3.2 26.8±12.6
Coefficient of Variation (%) 11.6 15.5 15.3 15.2 9.2
LSD (p = 0.05)
Agro-zone 1.4 1.8 1.8 1.8 4.3
Factory 1.2 1.5 NS NS 3.7
Interactions 1.5 1.2 2.1 2.1 5.0
# = Standard deviation; ## = means within a column preceded with the same superscript letter(s) are not statistically
significantly different (p > 0.05); NS = not significant; LSD = Least Significant Difference
61
4.5 Correlation between biochemical constituents and tasters’ evaluation of black
teas from three agro-ecological areas
Correlation analysis was carried out to determine the relationship between biochemical
constituents assayed of the different teas from the three zones and their plain quality
tasters‟ sensory evaluations (Table 4.6 and 4.7).
Aroma depicted a statistically significant correlation with
briskness(r=0.977,p≤0.001),brightness(r=0.956,p≤0.001),strength(r=0.981,p≤0.001),EC(
r=0.671,p≤0.01),+C(r=0.671,p≤0.01),EGCG(r=0.793,p≤0.01) and
EGC(r=0.822,p≤0.001).
Briskness was statistically significant with
brightness(r=0.960,p≤0.001),strength(r=0.957,p≤0.001),EC(r=0.690,p≤0.01),+C(r=0.69
0,p≤0.01),EGCG(r=0.778,p≤0.01),EGC(r=0.790,p≤0.01).
Brightness had a statistically significant correlation with strength (r=0.941, p≤0.001),
EC(r=0.649, p≤0.05), +C(r=0.649, p≤0.05), EGCG(r=0.751, p≤0.01) and EGC(r=0.774,
p≤0.01).
Strength had a positive correlation with EC(r=0.728, p≤0.01), +C(r=0.728, p≤0.01),
EGCG(r=0.804, p≤0.01) and EGC(r=0.794, p≤0.01). The individual catechins also
correlated positively amongst themselves for example EC had a positive correlation with
ECG(r=0.739, p≤0.05), EGCG(r=0.898, p≤0.001) and EGC(r=0.659, p≤0.05). On the
other hand ECG had a positive correlation with +C (r=0.739, p≤0.01), and EGCG
(r=0.538, p≤0.001). It was also noted that +C positively correlated with EGC(r=0.659,
p≤0.05) while EGCG depicted a positive correlation with EGC(r=0.777, p≤0.01).
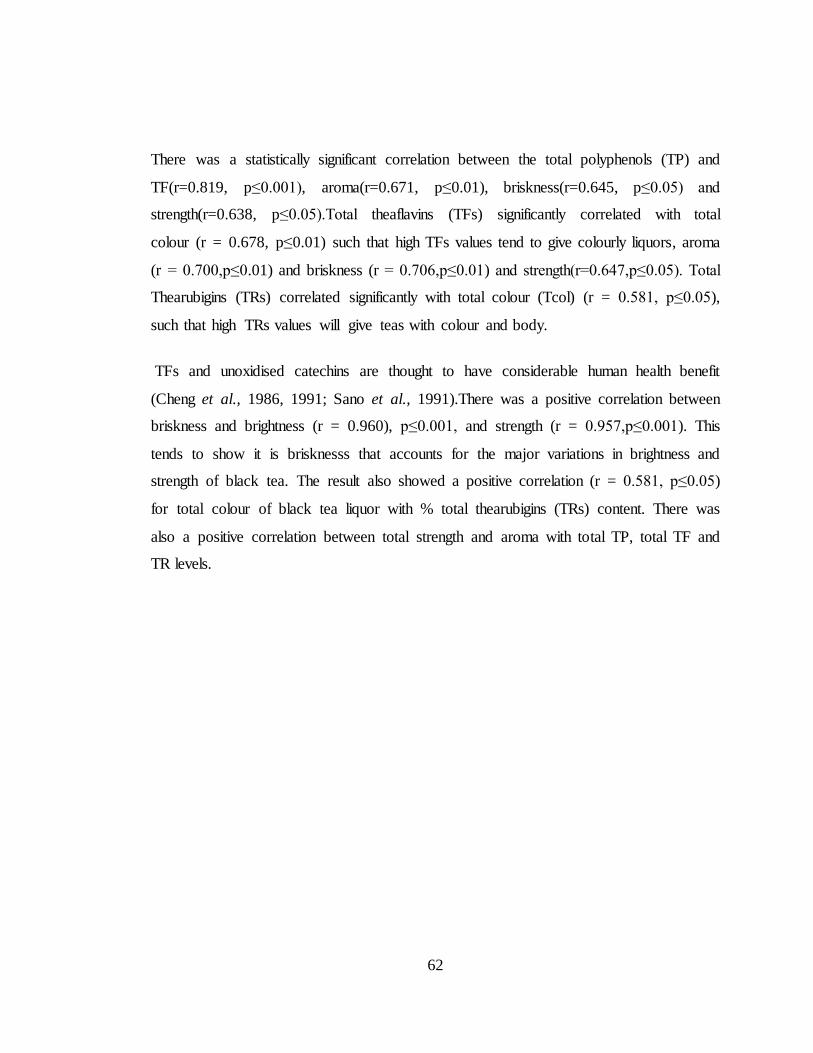
62
There was a statistically significant correlation between the total polyphenols (TP) and
TF(r=0.819, p≤0.001), aroma(r=0.671, p≤0.01), briskness(r=0.645, p≤0.05) and
strength(r=0.638, p≤0.05).Total theaflavins (TFs) significantly correlated with total
colour (r = 0.678, p≤0.01) such that high TFs values tend to give colourly liquors, aroma
(r = 0.700,p≤0.01) and briskness (r = 0.706,p≤0.01) and strength(r=0.647,p≤0.05). Total
Thearubigins (TRs) correlated significantly with total colour (Tcol) (r = 0.581, p≤0.05),
such that high TRs values will give teas with colour and body.
TFs and unoxidised catechins are thought to have considerable human health benefit
(Cheng et al., 1986, 1991; Sano et al., 1991).There was a positive correlation between
briskness and brightness (r = 0.960), p≤0.001, and strength (r = 0.957,p≤0.001). This
tends to show it is brisknesss that accounts for the major variations in brightness and
strength of black tea. The result also showed a positive correlation (r = 0.581, p≤0.05)
for total colour of black tea liquor with % total thearubigins (TRs) content. There was
also a positive correlation between total strength and aroma with total TP, total TF and
TR levels.
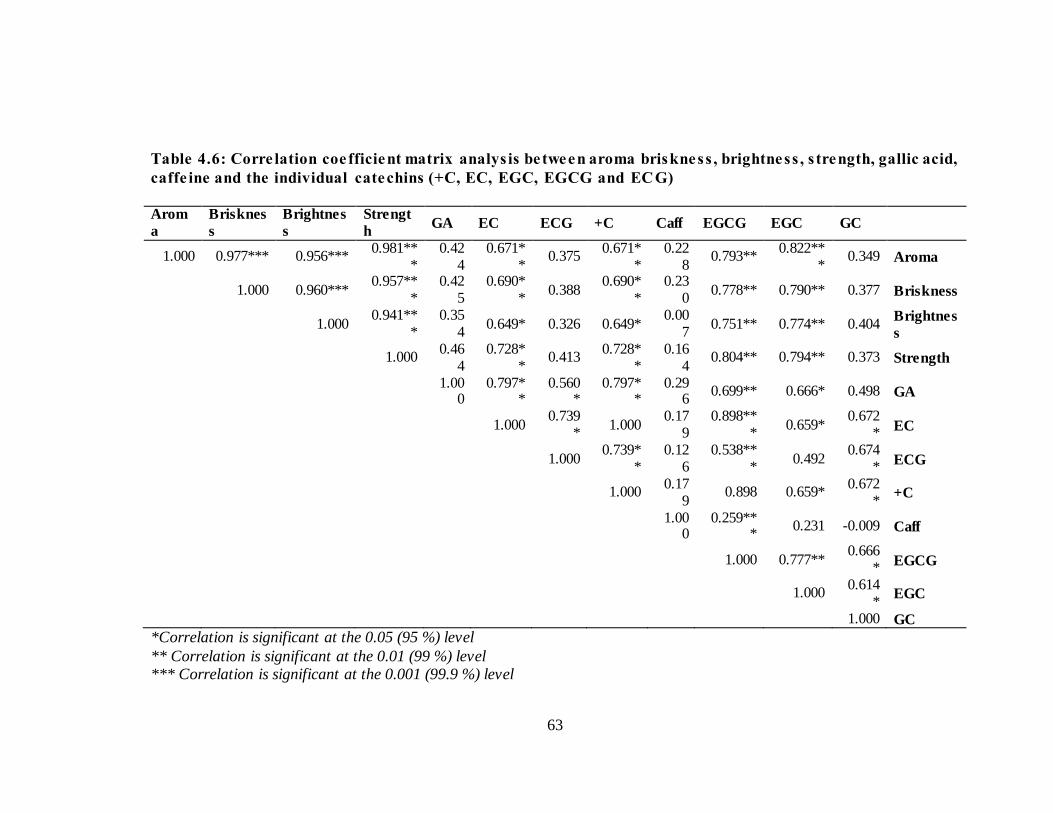
63
Table 4.6: Corre lation coefficient matrix analys is be tween aroma briskness , brightness , s trength, gallic acid,
caffe ine and the individual catechins (+C, EC, EGC, EGCG and ECG)
Arom
a
Brisknes
s
Brightnes
s
Strengt
h GA EC ECG +C Caff EGCG EGC GC
1.000 0.977*** 0.956*** 0.981**
* 0.42
4 0.671*
* 0.375
0.671**
0.228
0.793** 0.822**
* 0.349 Aroma
1.000 0.960***
0.957***
0.425
0.690**
0.388 0.690*
* 0.23
0 0.778** 0.790** 0.377 Briskness
1.000
0.941***
0.354
0.649* 0.326 0.649* 0.00
7 0.751** 0.774** 0.404
Brightnes
s
1.000
0.464
0.728**
0.413 0.728*
* 0.16
4 0.804** 0.794** 0.373 Strength
1.00
0 0.797*
* 0.560
* 0.797*
* 0.29
6 0.699** 0.666* 0.498 GA
1.000
0.739*
1.000 0.17
9 0.898**
* 0.659*
0.672*
EC
1.000
0.739**
0.126
0.538***
0.492 0.674
* ECG
1.000
0.179
0.898 0.659* 0.672
* +C
1.00
0 0.259**
* 0.231 -0.009 Caff
1.000 0.777**
0.666*
EGCG
1.000
0.614*
EGC
1.000 GC
*Correlation is significant at the 0.05 (95 %) level
** Correlation is significant at the 0.01 (99 %) level *** Correlation is significant at the 0.001 (99.9 %) level
64
Table 4.7: Corre lation coefficient matrix analys is be tween antioxidant capacity, total polyphenols , total
theaflavins , total thearubigins , total colour, aroma, briskness , brightness and s trength
AC TP TF TR T Col Aroma Briskness Brightness Strength
1.000 0.118 -0.137 -0.225 -0.145 0.177 0.248 0.236 0.269 AC
1.000 0.819*** 0.387 0.299 0.671** 0.645* 0.513 0.638* TP
1.000 0.514 0.678** 0.700** 0.706** 0.592 0.647* TF
1.000 0.581* 0.328 0.217 0.176 0.349 TR
1.000 0.363 0.408 0.249 0.355 T Col
1.000 0.977*** 0.956*** 0.981*** Aroma
1.000 0.960*** 0.957*** Briskness
1.000 0.941*** Brightness
1.000 Strength
*Correlation is significant at the 0.05 (95 %) level
** Correlation is significant at the 0.01 (99 %) level
*** Correlation is significant at the 0.001 (99.9 %) level
65
4.6 Inorganic nutrient content of black CTC tea
Recent findings (Kwach et al., 2012) revealed that tea leaf nutrients vary with clones
and locations. The results presented herein (Table 4.8) for the inorganic nutrients studied
(K, P, Ca, Mn, Fe, Zn and Cu) agree with this observation since variations with factory
of production as well as the ecological area were evident. For each inorganic nutrient,
the concentration ranges observed varied, demonstrating variations in the factors
influencing their distribution in the different ecological areas as well as the factories of
origin (Omwoyo et al., 2013) and their uptake and accumulation by the tea plant. For
instance, the Fe content ranged between 136 ± 8 and 320 ± 5 µg/g whereas the Ca
content ranged from 0.16 ± 0.01% to 0.62 ± 0.03%. The differences in the levels of each
inorganic nutrient in black tea from the 12 factories were statistically significant (p <
0.05) as can be seen in Table 4.8. This observation is in corroboration with (Kumar et
al., 2005) and (Moseti et al., 2013; Omwoyo et al., 2013), whose recent findings have
demonstrated variations in the micronutrient content of black tea from different locations
in India and different factories in Kenya respectively. Further, comparisons of the mean
inorganic nutrient contents in black tea from the three tea growing ecological areas
reveal statistically significant differences (p < 0.05) in all the inorganic nutrients studied
except for Zn and P as indicated in Table 10. Consequently, the highlighted differences
result in significant (p < 0.05) interaction effects between the ecological areas and
factories for all the inorganic nutrients studied (Table 4.8). Based on the current data, the
inorganic nutrients studied can be arranged in descending order as K > P > Ca > Mn >
Fe > Zn > Cu. K and Cu were the most and least abundant inorganic nutrients in the
black teas with concentrations obtained being in the ranges 1.6 ± 0.05 % to 2.1 ± 0.01 %
and 10 ± 3 % to 16 ± 1 µg/g respectively (Table 4.8). Moreover, these data demonstrates
the different extents to which different micronutrients are accumulated in the tea shoots
of the plant. K, P, Ca and Mn were present in percent levels whereas Fe, Zn and Cu
were present in the parts per million levels (Figure 4.8) on a dry weight basis.
66
The Fe content obtained for the sample from the fourth factory from the Kisii ecological
area, Eberege (320 ± 5 µg/g) was significantly high compared to the obtained mean Fe
contents of 202 and 180 µg/g obtained for black tea from the Kisii ecological area and
all the 12 tea processing factories under study respectively. In the same factory, a similar
observation was made for Ca, where the level obtained (0.62 ± 0.03, Table 10) was
significantly high compared than the mean Ca contents for the ecological area (0.32
µg/g) and the grand mean for all the teas from all regions (0.25 µg/g). High levels of Fe
in tea leaves have been associated with mature leaf (Wanyoko & Njuguuna, 1983),
implying that the high Fe content in black tea from Eberege factory may be attributed to
coarse plucking standards and long plucking intervals among other factors hence the
need for strict adherence to Good Agricultural Practices (GAP). Further, (Moseti et al.,
2013) observed the introduction of additional Fe along the CTC black tea processing
chain. This is possibly due to wear and tear of the CTC segments during the rolling stage
in tea manufacture [Personal Observation]. This observation further underlines the need
for strict adherence to Good Manufacturing Practices (GMP) in the tea industry.

67
Table 4.8: K, P, Ca, Mn, Fe , Zn and Cu in black tea from Murang’a, Meru and Kis ii agro -ecological areas
Agro-zone Factory K (%) P (%) Mn (%) Ca (%) Fe (µg/g) Zn
(µg/g)
Cu
(µg/g)
Murang’a
Ngere *a2.1±0.01 c0.30±0.01 b0.07±0.009 g0.16±0.01 b235±5 b33±1 bc11±3
Kenyenya-ini bc2.0±0.00 abc0.32±0.02 ab0.09±0.003 cd0.23±0.01 c193±2 bc32±4 bc12±5
Gatunguru cd1.9±0.05 ab0.35±0.05 ab0.10±0.001 cdef0.22±0.02 f148±9 c28±2 c10±3
Kiru de1.9±0.05 a0.36±0.02 ab0.10±0.002 cde0.23±0.04 g136±8 ab35±2 abc14±1
Mean 2.0±0.03 0.33±0.03 0.9±0.04 0.21±0.03 178±6 32±2 12±2
Meru
Kinoro c2.0±0.05 abc0.33±0.02 ab0.11±0.004 efg0.18±0.03 de162±5 ab35±0 abc13±2
Kionyo c2.0±0.05 abc0.32±0.01 ab0.11±0.004 fg0.17±0.03 d166±9 b33±3 abc13±2
Imenti e1.8±0.05 bc0.30±0.01 ab0.11±0.005 b0.33±0.02 d170±5 bc31±3 ab15±2
Githongo e1.8±0.03 abc0.33±0.01 ab0.10±0.001 fg0.17±0.01 ef151±4 ab35±1 ab14±1
Mean 1.9±4 0.32±0.01 0.11±0.03 0.21±0.02 162±6 34±2 14±2
Kisii
Nyansiongo ab2.0±0.05 a0.36±0.02 ab0.12±0.003 cdefg0.21±0.03 fg141±9 a39±7 ab14±2
Nyankoba a2.1±0.00 a0.37±0.04 a0.13±0.001 defg0.19±0.02 f149±8 b33±2 ab15±1
Tombe cd1.9±0.05 abc0.34±0.01 a0.13±0.004 c0.25±0.04 c197±9 b34±4 a16±1
Eberege f1.6±0.05 c0.30±0.01 ab0.12±0.003 a0.62±0.03 a320±5 c27±1 ab14±1
Mean 1.9±0.04 0.34±0.02 0.13±0.03 0.31±0.03 201±8 33±3 15±1
Coefficient of Variation (%) 2.2 7.0 3.6 9.7 3.7 9.2 17.5
LSD (p=0.05)
Agrozone 0.032 **NS 0.023 0.023 4.85 NS 1.68
Factories 0.024 0.018 0.018 0.018 3.59 1.62 1.24
Interactions 0.021 0.015 0.015 0.015 3.13 1.42 1.08
* Means within a column preceded with the same letter are not statistically significantly different at p ≤ 0.05; **No significant
difference
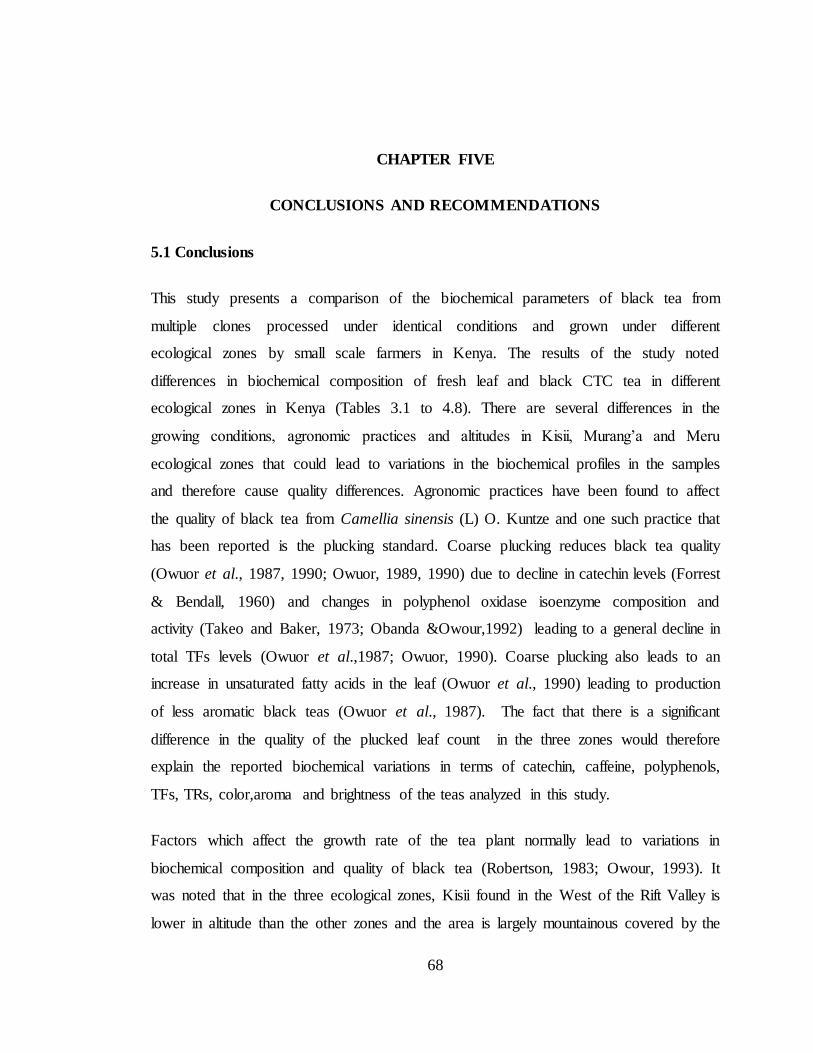
68
CHAPTER FIVE
CONCLUSIONS AND RECOMMENDATIONS
5.1 Conclusions
This study presents a comparison of the biochemical parameters of black tea from
multiple clones processed under identical conditions and grown under different
ecological zones by small scale farmers in Kenya. The results of the study noted
differences in biochemical composition of fresh leaf and black CTC tea in different
ecological zones in Kenya (Tables 3.1 to 4.8). There are several differences in the
growing conditions, agronomic practices and altitudes in Kisii, Murang‟a and Meru
ecological zones that could lead to variations in the biochemical profiles in the samples
and therefore cause quality differences. Agronomic practices have been found to affect
the quality of black tea from Camellia sinensis (L) O. Kuntze and one such practice that
has been reported is the plucking standard. Coarse plucking reduces black tea quality
(Owuor et al., 1987, 1990; Owuor, 1989, 1990) due to decline in catechin levels (Forrest
& Bendall, 1960) and changes in polyphenol oxidase isoenzyme composition and
activity (Takeo and Baker, 1973; Obanda &Owour,1992) leading to a general decline in
total TFs levels (Owuor et al.,1987; Owuor, 1990). Coarse plucking also leads to an
increase in unsaturated fatty acids in the leaf (Owuor et al., 1990) leading to production
of less aromatic black teas (Owuor et al., 1987). The fact that there is a significant
difference in the quality of the plucked leaf count in the three zones would therefore
explain the reported biochemical variations in terms of catechin, caffeine, polyphenols,
TFs, TRs, color,aroma and brightness of the teas analyzed in this study.
Factors which affect the growth rate of the tea plant normally lead to variations in
biochemical composition and quality of black tea (Robertson, 1983; Owour, 1993). It
was noted that in the three ecological zones, Kisii found in the West of the Rift Valley is
lower in altitude than the other zones and the area is largely mountainous covered by the
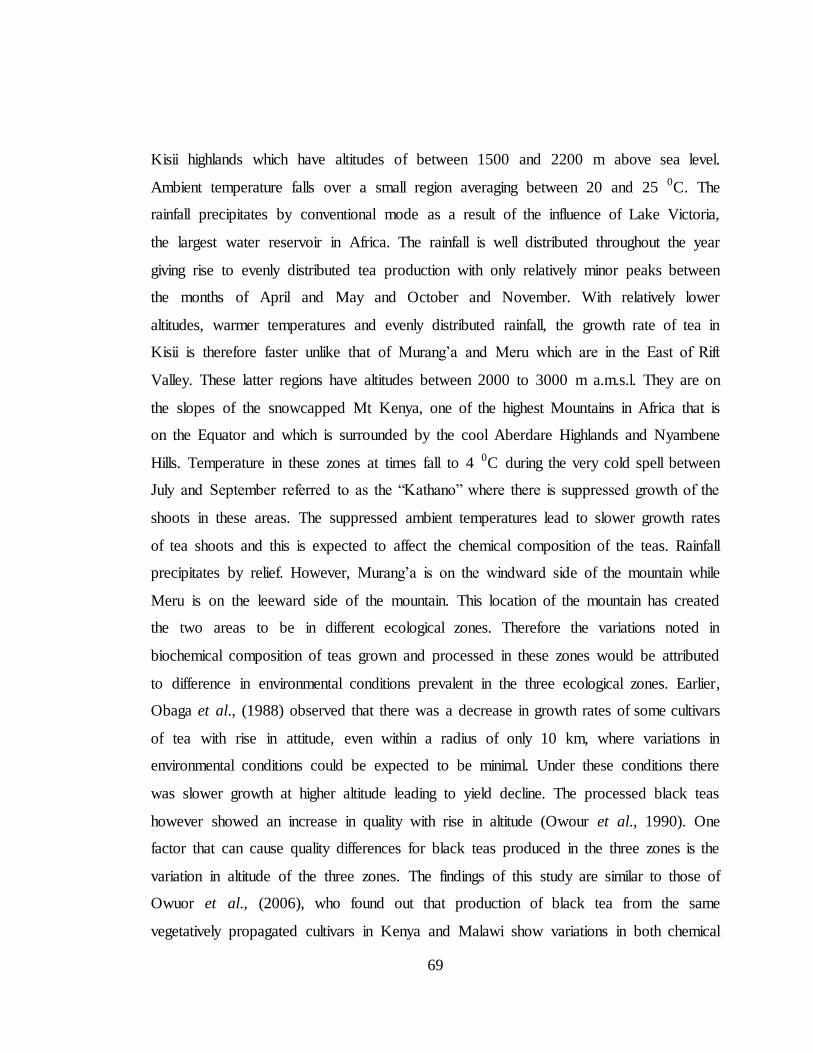
69
Kisii highlands which have altitudes of between 1500 and 2200 m above sea level.
Ambient temperature falls over a small region averaging between 20 and 25 0C. The
rainfall precipitates by conventional mode as a result of the influence of Lake Victoria,
the largest water reservoir in Africa. The rainfall is well distributed throughout the year
giving rise to evenly distributed tea production with only relatively minor peaks between
the months of April and May and October and November. With relatively lower
altitudes, warmer temperatures and evenly distributed rainfall, the growth rate of tea in
Kisii is therefore faster unlike that of Murang‟a and Meru which are in the East of Rift
Valley. These latter regions have altitudes between 2000 to 3000 m a.m.s.l. They are on
the slopes of the snowcapped Mt Kenya, one of the highest Mountains in Africa that is
on the Equator and which is surrounded by the cool Aberdare Highlands and Nyambene
Hills. Temperature in these zones at times fall to 4 0C during the very cold spell between
July and September referred to as the “Kathano” where there is suppressed growth of the
shoots in these areas. The suppressed ambient temperatures lead to slower growth rates
of tea shoots and this is expected to affect the chemical composition of the teas. Rainfall
precipitates by relief. However, Murang‟a is on the windward side of the mountain while
Meru is on the leeward side of the mountain. This location of the mountain has created
the two areas to be in different ecological zones. Therefore the variations noted in
biochemical composition of teas grown and processed in these zones would be attributed
to difference in environmental conditions prevalent in the three ecological zones. Earlier,
Obaga et al., (1988) observed that there was a decrease in growth rates of some cultivars
of tea with rise in attitude, even within a radius of only 10 km, where variations in
environmental conditions could be expected to be minimal. Under these conditions there
was slower growth at higher altitude leading to yield decline. The processed black teas
however showed an increase in quality with rise in altitude (Owour et al., 1990). One
factor that can cause quality differences for black teas produced in the three zones is the
variation in altitude of the three zones. The findings of this study are similar to those of
Owuor et al., (2006), who found out that production of black tea from the same
vegetatively propagated cultivars in Kenya and Malawi show variations in both chemical
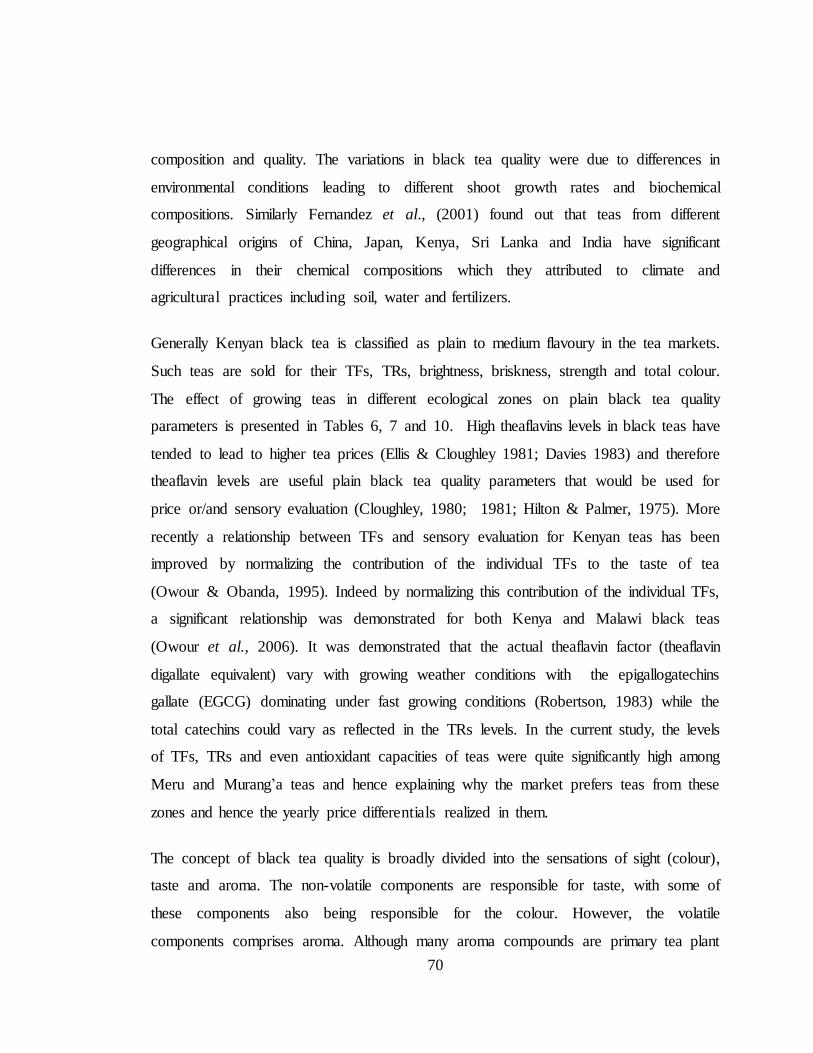
70
composition and quality. The variations in black tea quality were due to differences in
environmental conditions leading to different shoot growth rates and biochemical
compositions. Similarly Fernandez et al., (2001) found out that teas from different
geographical origins of China, Japan, Kenya, Sri Lanka and India have significant
differences in their chemical compositions which they attributed to climate and
agricultural practices including soil, water and fertilizers.
Generally Kenyan black tea is classified as plain to medium flavoury in the tea markets.
Such teas are sold for their TFs, TRs, brightness, briskness, strength and total colour.
The effect of growing teas in different ecological zones on plain black tea quality
parameters is presented in Tables 6, 7 and 10. High theaflavins levels in black teas have
tended to lead to higher tea prices (Ellis & Cloughley 1981; Davies 1983) and therefore
theaflavin levels are useful plain black tea quality parameters that would be used for
price or/and sensory evaluation (Cloughley, 1980; 1981; Hilton & Palmer, 1975). More
recently a relationship between TFs and sensory evaluation for Kenyan teas has been
improved by normalizing the contribution of the individual TFs to the taste of tea
(Owour & Obanda, 1995). Indeed by normalizing this contribution of the individual TFs,
a significant relationship was demonstrated for both Kenya and Malawi black teas
(Owour et al., 2006). It was demonstrated that the actual theaflavin factor (theaflavin
digallate equivalent) vary with growing weather conditions with the epigallogatechins
gallate (EGCG) dominating under fast growing conditions (Robertson, 1983) while the
total catechins could vary as reflected in the TRs levels. In the current study, the levels
of TFs, TRs and even antioxidant capacities of teas were quite significantly high among
Meru and Murang‟a teas and hence explaining why the market prefers teas from these
zones and hence the yearly price differentials realized in them.
The concept of black tea quality is broadly divided into the sensations of sight (colour),
taste and aroma. The non-volatile components are responsible for taste, with some of
these components also being responsible for the colour. However, the volatile
components comprises aroma. Although many aroma compounds are primary tea plant
71
metabolites, many Volatile Flavour Compounds (VFC) in tea are secondary metabolites
derived from carotenes, amino acids, unsaturated fatty acids plus other lipids and terpene
glycosides during tea processing (Robinson & Owour, 1992).The composition and
concentrations of the VFC plays a vital role in the valuation and or pricing of black tea
(Owour, 1992; Owour et al., 1988; Wicremasinghe et al., 1973; Yamanish et al., 1968a,
1968b). Generally teas from the Kisii zone were less aromatic than those from Murang‟a
and Meru. This is probably due to coarse plucking, lower altitude and higher
temperatures in the Kisii ecological zone which result into faster growth rates of teas in
this zone. Factors which increase growth rate e.g. decrease in altitude (Mahanta et al.,
1988; Owour et al., 1990), high rates of nitrogen fertilizers (Owour et al., 1987c), and
pruning (Owour & Lagat, 1988) reduce black tea aroma. The lower aroma in Kisii teas
noted by tasters and in the biochemical analysis of plain tea quality parameters explains
the noted observations in the tea trade that Kisii teas are generally plainer than Murang‟a
and Meru teas.
5.1.1 Total catechins
In general the total catechins contents and individual catechins contents were found to
differ significantly across the ecological zones with EGCG, EGC, ECG, and GC
recording higher levels, with +C being less abundant. The finding of this study
corroborated that of Karori et al., 2007 who researched on the catechins contents of teas
in Kenya. Black teas are obtained by a post-harvest auto oxidation which is catalyzed by
the enzyme polyphenols oxidase (PPO). The enzymatic oxidation of catechins located in
the cell vacuole of the tea leaf is as a result of polymerization of flavan-3-ol monomers
to form TFs and TRs which are compounds that have a significant influence in the
quality of black tea. The catechin content of teas is therefore a very important quality
indicator which may be used to gauge the quality potential of a tea cultivar as has been
demonstrated in this study.
72
Thus it can be concluded that catechins are adequate descriptors to differentiate different
tea samples from different ecological zones in Kenya. The catechin, polyphenol and
caffeine profiles of green leaf can be used to train a classifier accurately discerning the
geographic origin of the teas (Eetu Makela., 2012). Nevertheless further research using a
higher number of samples covering aspects such as the technology used in the
manufacturing and seasonal variation would be necessary to confirm the connection
between the contents of catechins with ecological area of origin.
5.1.2 Total polyphenols
The levels of polyphenols in the different types of tea samples across the three zones
were determined in this study. The results of the study reported superior levels of
polyphenols amongst the black teas across the ecological zones that were statistically
significant (p < 0.05). The rolling and cutting of tea shoots in CTC manufacture causes a
release of the enzyme polyphenol oxidase which interacts with phenolic compounds,
simple catechins, and gallocatechins (GC) to produce TFs and TRs (Mahanta &
Hemanta, 1992). During black tea manufacture, the gallocatechins are first oxidized and
dimerized to TFs and TRs because of their high oxidation potential and high
concentrations in leaves. At the same time several factors have been known to influence
the polyphenols content. These include genotype, geographical origin, soil composition,
harvesting time, post-harvest treatment and physical structure of the leaves (Lin et al.,
2003). The results obtained in this study would therefore vary with seasons and it could
be important to carry out a study to establish the seasonal variations of the total
polyphenols. However owing to the fact that tea contains several polyphenols, it is likely
that even such a proposed study may reveal some derivatives which were more stable
than the others.
73
5.1.3 Theaflavins (TFs) and thearubigins (TRs)
Catechins are the major component of green tea leaves. In black tea, they are oxidized
and dimerized during fermentation to the yellow orange pigments, TFs are polymerized
to the red pigments called TRs. Black teas used in its study had high level of TFs and
TRs across the ecological zones. These results colloborated those of Obanda et al.,
(2004) and Li et al., (2005) who reported that theaflavins are oxidized further to form
thearubigins that are heterogeneous in nature and contribute significantly towards taste,
colour and body of teas. Wilson and Clifford (1992) explained the factors affecting the
formation and degradation of TFs and TRs in black tea and observed that maximum
synthesis of TFs occurs when oxygen is in excess to support benzotropolone ring
formation. This may suggest that TFs are not the only source of TRs. However under a
limiting oxygen concentration, polyphenol oxidase which has higher affinity for the
substrate has a preferential demand for oxygen and TF formation is suppressed at the
expense of catechin quinone formation.
5.1.4 Antioxidant activity
In this study there was a high radical scavenging activity in the DPPH radical by the
black teas across the zones, though there was more inhibition in Murang‟a at 82.6 %,
followed by Kisii at 79.14 % and the Meru teas, at 77.01 %. The antioxidant activity is
mostly attributed to the presence of high levels of bioactive catechins and polyphenols
that have the ability to donate hydrogen ions to stabilize the free radicals. The high
antioxidant effect of polyphenols is due to the presence of the phenolic hydroxyl groups
in their structures that make them protect free radical scavengers (Amie et al., 2003).
The hydroxylation confers a higher degree of stability in the Catechins phenoxyl radical
by participating in electron delocalization that is as an important feature of the anti-
radical potential. This explains why radical scavenging is high in the gallocatechins
including EGCG and EGC that are potent antioxidants (Zhu et al., 2001; Amie et al.,
2003; Rao et al., 2006). These results are similar to those of Karori et al., (2007) who

74
reported the antioxidant effects of black tea. The antioxidant capacity in black tea could
also be augmented by TFs in the teas that have been shown to have higher antioxidant
activity than EGCG, which is the strongest antioxidant among all catechins and a
precursor of TFs (Leung et al., 2001). TFs have more hydroxyl groups which are
considered to be necessarily for exerting radical scavenging activity than do catechins,
since TFs are dimers of catechins.
The antioxidant activity of TRs in black tea can be explained by the presence of three
hydroxyl groups which are more or less esterified by gallic acid in the TRs structure.
However this is a highly speculative hypothesis since to date no definite data on TRs
structure (Li et al., 2005) has been documented. Therefore the high percentage inhibition
exhibited by black teas in this study shows the conversion of the Catechins to TFs and
TRs does not affect the radical scavenging activity of the highly dimerized products.
These findings are in agreement with those of Leung et al, 2001.
The high radical scavenging activities exhibited by EGCG and EGC is due to the
Catechins 3‟3‟ and 5‟ trihydroxylated substitution patterns in the B-ring and /or a
hydroxyl group of the C-3 position of the Catechins. This is an important feature on
them as they confer a high degree of stability of the catechins phenoxyl radical that
participates in electron delocalization (Rao et al., 2006). Kerio et al., (2012) have
reported higher antioxidant activity of the purple coloured variety tea products due to the
high levels of anthocyanins in this type of teas. The antioxidant activity of anthocyanins
can be related to several parameters like the hydroxyl groups in the molecules, the
catechol moiety in the B-ring, the oxonium ion structure in the C-ring, the hydroxylation
and the methylation patterns and to the acylation by phenolic components (Sang et al.,
2002). Many studies have also demonstrated that both catechins and TFs have strong
free radical scavenging activity both in vitro and in vivo.
75
5.1.5 Inorganic nutrient content
Triplicate analyses of all the analytes in all the samples showed that the coefficients of
variation (CV) of the results were within ± 10 % except for Cu whose results gave a CV
of 17.5 % as indicated in Table 4.8. Reagent blank analyses indicated no contamination
or interferences from the reagents used and the calibration curves obtained for all the
elements demonstrated adequate linearity (r2 > 0.999). Being a fundamental element of
method validation, the detection limit for each analyte was also estimated. Limit of
detection (LOD) is the smallest mass of analyte that can be distinguished from the
statistical fluctuations in a blank under specified test conditions (Armbruster & Prry,
2008). LODs of the current method calculated as the concentration corresponding to a
signal three (3) times of the blank analyses were 0.015, 0.031, 0.060, 0.025, 0.074, 0.013
and 0.043 for K, P, Ca, Mn, Fe, Zn and Cu respectively. The average percentage
recovery for the two tea reference samples (A and B) for K, P, Ca, Mn, Fe, Zn and Cu
were 98 ± 2.3%, 98 ± 3.4%, 97 ± 2.8%, 96 ± 1.9%, 95 ± 2.6%, 98 ± 2.3%, and 92 ±
5.7% respectively demonstrating good accuracy of the data obtained.
5.2. Recommendations
The data obtained from this study revealed that different clones/cultivars of tea grown in
different ecological zones have different levels of catechins, polyphenols and inorganic
micronutrients which give them their characteristic biochemical profiles. The different
teas from the different regions have varying levels of bioactive compounds that make
them produce different concentrations of TFs and TRs during processing. This generates
unique quality characteristics in teas emanating from individual factories and therefore
the differing prices realized at the auctions. Arising from these findings, the following
recommendations are made.
i) This knowledge should be fully exploited to engage the individual factory
companies to engage in value addition and diversification of tea products.
76
Cottage industries set up should pack tea and brand them stating the different
catechin, polyphenol content and inorganic micronutrients in their
compositions.In this way, there will be increase of revenue in the factories.
ii) This study has demonstrated the ability of the tea plant to accumulate
micronutrients though in varying proportions. Tea consumers stand to gain
by being furnished with the data on inorganic nutrients necessary for various
biological processes.
iii) For purposes of blending, the study recommends the sourcing of teas from
Murang‟a and Meru zones due to their high phenolic and catechin content,
polyphenol, TFs, TRs, briskness, strength, colour and aroma.
iv) To improve productivity and increase their earnings, farmers in Kisii
ecological zone are encouraged to increase their plucking rounds from the
current two rounds per month to three or four rounds per month as is being
done in Meru and Murang‟a so as to reduce the caffeine content in their teas
and to improve their TFs levels content and productivity from their farms.
v) A review of the current Kenyan black tea quality specifications needs to be
carried out in order to include some parameters that had been left out in
earlier standards such as polyphenol content, caffeine,s antioxidant capacity,
level of amino acids, lipids, etc so as to certify the true status of the Kenyan
tea that enters the world value chain.
vi) It‟s recommended that the Tea Directorate under Agricultural, Fisheries and
Food Authority (AFFA) takes the initiative to get the Kenyan standard KS
65: 2009 revised.Because of variation in tea biochemical components, teas
should be classified and marketed based on plain quality tea parameters such
as briskness, strength, colour, and aroma

77
REFERENCES
Aisaka, H., Kosuge, M., and Yamanishi, T. (1978). Comparison of Chinese
“‟keemum” black tea and Ceylon black tea. Journal of Agriculture and
Biological Chemistry, 44, 2157-2159.
Amie, D., Amie, D. D., Beslo, D. and Trinajstie, N. (2003). Structure radical
scavenging activities relationship of flavanoids. Croat Sica Chemical Acta, 76,
55-61.
Ann, B., Kwak, J., Son, J., Park, J., Lee, J. C. and Bifun, M. (2004). Biological and
antimicrobial activity of irradiated green tea polyphenols. Journal of Food
Chemistry, 68, 549-555.
Arce, L., Rios, A. and Valcarcel, M. (1998). Determination of anti-carcinogenic
polyphenols present in green tea using capillary electrophoresis coupled to a flow
injection system. Journal of Chromatography, 827, 113-120.
Armbruster, D. A. and Prry, T. (2008). Limit of Blank, Limit of Detection and Limit
of Quantification, Clinical Biochemistry Reviews, 29,49-52.
Arnand, M. J. (2011). Pharmacokinetics and metabolism of natural methylxantines in
animals and man. Handbook of experimental pharmacology, 200, 33-91.
Ashihara, H., Sano, H., and Crozier, A. (2008). Caffeine and related purine alkaloids:
biosynthesis, catabolism, function and genetic engineering. Phytochemistry,
69(4), 841–856.
Astar, S., Abdeen, S., Dashti, H., Khoursheed, M., Al-Sayeer, H., Matthew, T. and
Al-Bader, A. (2003). Effect of green tea in the prevention of and reversal of
fasting induced intestinal mucosal damage. Journal of Nutrition, 19(6), 536-540.
78
Baruah, S., Hazarika, M., Mahanta, P. K. Horita, H. and Murai, T. (1986). Effects
of plucking intervals on the chemical constituents of CTC black teas. Journal of
Agricultural and Biological Chemistry, 50(4), 1039-1041.
Balentine, D.A. (1992). Manufacturing and chemistry of tea in: phenolic compounds in
Food and their effects on health. Washington DC: American Chemical Society.
Barnejee, J. (1992). Botanical classification of tea in Wilson K. C and Clifford N, B,
(Eds), Tea; Cultivation to consumption. London: Chapman and Hall.
Bailey, R. G., McDowell, I. and Nurstein, H. E. (1990). Use of HPLC photodiode
array detectors in a study of the nature of black tea liquor. Journal of the Science
of Food Agriculture, 52, 505–525.
Bajaj, K. L., Anan, T., Tsushida, T., and Ikegaya, K. (1987). Effects of - (-)
epicatechin on oxidation of theaflavins by polyphenol oxidase from tea leaves.
Journal of Agriculture, Biology and Chemistry, 51(7), 1767-1777.
Biswas, A. K., Biswas, A. K. and Sarkar, A. R. (1973). Biological and chemical
factors affecting the valuations of North East Indian plain teas. II. Statistical
evaluation of the biochemical constituents and their effects on briskness, quality
and cash valuations of black teas. Journal of Science and Food agriculture, 24,
1457-1477.
Bonheure, D. (1990). Tea. The Tropical Agriculturalist Series. London: CTA,
Macmillan – Education Ltd .
Brand-Williams W., Cuvellier, M. D and Berset, C. (1995). Use of free radical
method to evaluate antioxidant activity. Lebensm wiss Technology, 28, 25-30.
Brown, A. G., Falsaw, C. P., Haslam, E., Hohnes, A., and Ollis, W. D. (1966). The
constitution of theaflavins, Tetrahedron Letters, 11, 1193-1204.
79
Brown, A. G., Eyton, W. B., Hohnes, A., and Ollis, W. D (1969). The identification of
thearubigins as polymeric proanthocyanidins, Phytochemistry, 8, 2333-2340.
Cabrera, C., Artacho, R. and Gimenez, R. (2006). Beneficial effects of green tea. In a
review. Journal of America College of Nutrition, 25, 79-99.
Cabrela, C., Gimenez, R. and Lopez, C. M. (2003). Determination of tea components
with anti-oxidant activity. Journal of Agriculture and Food Chemistry, 51, 4427-
4435.
Chan, J. and Han, C. (2000). The protective effect of tea on cancers. Human evidence.
In phytochemicals as Bioactive Agents: Technomic: Lancaster, 131-150.
Chen, C. N. ., Liang, C. M., Lai, J., Tsai, Y. J., Tsag, J. S. and Lin, J. K. (2003).
Cappilary electrophoretic determination of theanine, caffeine and catechins in
fresh leaves and oolong tea and their effects on rats neurosphere adhesion and
migration. Journal of Agricultural and Food Chemistry, 51,7495-7503.
Cheng, T. O (2003). Why did green tea not protect against coronary artery disease but
protect any myocardial infarction. American Journal of Cardiology, 91, 1290-
1291.
Chin, Jenna, M., Merves, Michel L., Goldberger, Bruce A., Sampson-Cone, Angela.
Cone, Edward J. (2008). Caffeine content of brewed Teas, Journal of Analytical
Toxicology, 32(8), 702-704.
Chu, D. C., Kobayashi, K., Juneja, L. R., and Yamamoto, T. (1997). Chemistry and
applications of green tea. CRC Press, Boca Raton, FL. pg 129.
Chung, F. L., Schwartz, J., Herzog, C. R., and Yang, Y. (2003). Tea and Cancer
prevention: Studies in animals and humans. Journal of Nutrition, 133, 3268-
3274.
80
Clarke, K. J., Grant, P. G., Sarr, A. B., Belakore, J. R., Swaggerty, C. L., Phillips,
T. D. and Woode, G. N. (1998). An in vitro study of theaflavins extracted from
black tea to neutralize bovine rotavirus and bovine coronavirus infections.
Journal of Veternary Microbiology, 63, 147-157.
Cloughley, J. B. (1979). The determination of optimum fermentation in the factory. In
line TF analysis during fermentation. Tea Research Foundation of Central Africa
Quartery Newsletter, 55, 16-18.
Cloughley, J. B. (1981). Storage deterioration of Central Africa teas. Changes in
chemical composition sensory characteristics and price evaluation. Journal of
Science and Food Agriculture, 32, 1213-1223.
Cloughley, J. B. (1982). Factors affecting caffeine content of black tea. Part 1 The field
variables. Food Chemistry, 9, 269-279.
Dalluge, J. J., Nelson, B. C., Thomas, J. B and Sander, L. C. (1998). Selection of
column and gradient elution system for separation of catechins in green teas
using high performance liquid chromatograph and a modified digestion
procedure. Journal of Chromatography, 783, 265 -279.
Davies, A. W., Schubert, R. and Spiro, M. (1997). Chemical and Biological properties
of Tea infusions.U and M, Frankfurt . pg 6.
Deb, S. B., & Ullah M. R. (1968). The role of theaflavins (TF) and Thearubigns (TR) in
the evaluation of black tea. Two and a Bud, 15, 101-102.
DevChouldry, M. N. and Bajaj, K. L. (1980). Biochemical changes during withering
of tea shoots. Two and a Bud, 27, 13-16.
Ding, Z., Kuhr, S., and Engelhardt, U. H. (1992). Influence of catechins and
theaflavins on the astringent taste of black tea brews. Z. Lebensm. Unter Forsch.,
81
U, 195, 108-111.
Divrikli, U., Horzum, N., Soylak, M. and Elci, L. (2006). Trace heavy metal contents
of some spices and herbal plants from western Anatolia, Turkey. International
Journal of Food Science and Technology, 41, 712-716.
Economic Survey (2005), Central Bureau of statistics, Nairobi; Ministry of Planning
and National development.
Eetu Makela., (2012). Uutos Helsinki. Retrieved from http://www.uutos.fi.
Fernadez, P. L., Martin, M. J., Gonzalez, A. G. and Pablos, F. (2000). HPLC
determination of catechins and caffeine in tea. Differention of green, black and
instant teas. The Analyst, 125, 421-425.
Fernandez–Caceres, P. L., Martin, M. J., Pablos, F. and Gonzales, A. G. (2001).
Differentiation of tea (Camellia sinensis) varieties and their geographical origin
according to their metal content. Journal of Agriculture and Food Chemistry, 49,
4775-4779.
Fernandez, P. L., Fernado P., Martin, M., J., and Gonzalez, A. G. (2002). Study of
catechin and Xanthine tea profiles as geographical tracers. Journal of Agriculture
and Food Chemistry, 50, 1833-1839.
Finger, A., Kuhr, S. and Engelhardt, U. H. (1992). Chromatograph of tea constituents.
Journal of Chromatography, 624, 293-315.
Forrest, G. I. and Bendal, D. S. (1969). The distribution of polyphenols in the tea plant
(Camellia sinensis L.). Journal of Biochemistry, 113, 741-755.
82
Fwu-Ming, S. and Hong-Wong, C. (2008). Element composition of tea leaves and tea
liquors and its impact on health. Bulletin of Environmental Contamination and
Toxicology. 80, 300-304.
Gesimba, R. M, Langat, M. C., Liu, G. and Wolukau, J. N. (2005). The tea industry
in Kenya; the challenges and positive developments. Journal of Applied
Sciences, 5, 334-336.
Gebretsadik, D. W. and Bhagwan, S. C. (2010). Levels of metals in commercially
available Ethiopian black teas and their liquors. Bulletin of the Chemical Society
of Ethiopia, 24, 339-349.
Grahan, H. N. (1992). The polyphenols of tea Biochemistry and significance, a review.
In XV Journes Internationates Group Polyphenols DTA: Lisbon, Portugal, 2,
32-43.
Greenway, P. J. (1945). Origins of some East African food plants, East African Food
plants, Part V. East Africa Agriculture Journal, 11, 56-63.
Gulati, A., Rawal, R., Singh, B. and Ravindranath, S. D. (2003). Application of
microwave energy in the manufacture of enhanced quality green tea. Journal of
Agricultural and Food Chemistry, 51, 4764-4768.
Hadfiled, W. (1974). Shade in north East Indian tea plantations II Foliar illumination
and canopy characteristics. Journal of Applied Ecology, 2, 179-199.
Hara, Y., (1994). Prophylactic functions of tea polyphenols in: Food Phytochemicals
for Cancer Prevention, 11, 34.
Hara, Y., Luo, S. J., Wickremashinghe, R. L. and Yamanishi, T. (1995). Botany of
tea. Food Reviews International, 11, 371-374.
83
Hang, L., Meng, X., Chuvan, I., Sang, S., Patten, C., Sheng, S., Hung, J., Winnik, B.
and Yang, S. (2003). Glucoronides of tea catechins: Enzyymology of
biosynthesis and biological activities.Journal of Drug Metabolism Disposal, 31,
452-461.
Hakamata, K. (1990). Amino acids in green tea. Journal of Agricultural Research, 24,
105.
Hakim, I. A. and Chow, S. N (2004). Catechins in tea, polyphenols and cancer
prevention. In: Proceedings international Conference on ocha tea culture and
science No. 4-6, 2004, Shizouka, Japan.
Hans, M. G., Princen, W, Butenhek, R., Cor, B., Lilian, B., Tijburg, M. and
Jacqueline, A. E. L. (2007). No effect on consumption of green and black tea on
plasma lipid antioxidant levels and on LDL oxidation in smokers. Journal of
Arteriosclerosis, Thrombosis and Vascular Biology, 18, 833-841.
Haque, A. M., Hashimoto, M., Katakura, M., Tanabe, Y., Hara, Y and Shido, O.
(2006). Long term administration of green tea catechins improves spatial
cognition learning ability in rats. Journal of Nutrition, 136, 1043-1047.
Hazarika, M., Mahanta, P. K., and Takeo, T. (1984). Studies on some volatile flavor
constituents in orthodox black teas of various and flushes in north-east India.
Journal of Food Agriculture, 23, 227-232.
Henry, J. P. and Stephens-Larson, P. (1981). Reduction of chronic psychosocial
hypertension in mice by decaffeinated tea. Journal of Hypertension, 6, 437-444.
Hicks, M. B., Hsieh, Y. H., and Bell, L. N. (1996). Tea preparation and its influence on
methylxantine concentration. Food Research International. 29(3-4), 325-330.
84
Hilton, P. J. (1973). Tea in F Snell and Elite L. In encyclopedia of industrial chemical
analysis 18, 455-518.
Hilton, P. J. and Palmer, J. W. (1975). Chemical assessment of quality and its relation
to market over extended period. Journal of the Science of Food Agriculture, 26,
1681-1687.
Hirano, R., Momiyama, Y., Takahashi, R., Taniguchi, H., Kondo, K., Nakamura,
H. and Ohsuzu, F. (2003). Comparison of green tea intake in Japanease patients
with and without angiographic coronary artery disease. American Journal of
Cardiology. 36, 64-70.
Ho, C. T., Chen, Q., Shi-Zhan, K. Q. and Rosen, R. T. (1992). Anti-oxidative effect
of polyphenol extract prepared from various Chinese teas. Journal of Preventive
Medicine, 21, 520-525.
Horie, H. and Kohata, K. (1998). Application of capillary electrophoresis to tea quality
estimation. Journal of Chromatography, 882, 219-223.
Horie, H., Mukai, T. and Kohota, K. (1997). Simultaneous determination of
qualitative important components in green tea infusions using capillary
electrophoresis. Journal of Chromatography, 758, 332-335.
International Tea Committee, ITC, 2010. Annual bulleting of statistics, pp 161.
International Tea Committee, ITC, 2009. Annual bulletin statistics,pp 190
Jankun, J., Selman, S. H., Swiercz, R. and Skrzypczk-Jankun, E. (1997). Why
drinking green tea could prevent cancer. Nature, 387, 561.
Jarup, L. (2003). Hazards of heavy metal contamination. British Medical Bulletin, 68,
167-182.
85
Jian-Min, Y. (2007). Urinary biomarkers of tea polyphenols and risk of colorectal
cancer in the Shanghai cohort study. International Journal of Cancer, 120,
1344-1350.
Jha, A., Mann, R. S. and Balachandran, R. (1996). Tea. A refreshing beverage.
Journal of Indian Food Industry, 15, 22-29.
Joseph, L. S., Thomas, J., Pius, P. K., Raj, K. R. and Muraleedhaharan, N. (2005).
A reliable technique to identify superior clones from tea germplasm. Journal of
Food Chemistry, 91, 771-778.
Juliano, L. M. and Griffiths, R. R. (2004). A critical review of caffeine withdraw;
empirical validation of symptoms and signs, incidence, severity and associated
features”. Journal of Neuroscience Education, 176(1), 1-29.
K. T. D. A. (2011). From bush to cup (Tea life cycle) Kenya Tea Development Agency
Limited. Retrieved from, http:// www.ktdateas.com/index .php/the-tea/from bush-
to-cup.
K.T.D.A. (2012). Kenya Tea Development Authority, Annual Report, Nairobi:
Government Printer.
Karori, S. M., Ngure, R. M., Wachira, F. N, Wanyoko, J. K and Mwangi, J. N.
(2008). Different types of tea products attenuate inflammation induced in
trypanosome brucei infected mice. Parasitology International, 57, 325-333.
Karori, S. M., Wachira F. N., Wanyoko, J. K., and Ngure, R. M. (2007). Antioxidant
capacity of different types of tea products. African Journal of Biotechnology, 6,
228
Katharina, P. (2001). Yet more roles for tea in disease prevention. Trends in
Pharmacology Science, 22, 501.
86
Ker, K., Edwards, P. J., Felix, L. M., Blackhall, K. and Roberts, I. (2010). Caffeine
for the prevention of injuries and errors in shift workers Cochrane Database
System Revival, 5, cd008508.
Kerio, L. C, Wachira, F. N., Wanyoko J. K. and Rotich, M. K. (2012).
Characterization of antocyanins in Kenya teas: Extraction and identification.
Food Chemistry, 131, 31-38.
Kerio, L. C. (2008) .Tea antocyanins TFRK Quarterly Bulletin, 15, 3-5.
Kerio, L. C. (2010). Tea product diversification in Kenya. TRFK Quarterly Bulletin, 15,
3-5.
Koech, A. R., Wachira, F. N., Ngure, R., Wanyoko, J. K., Bii, C. C. and Karori, S.
M. (2013). Antibacterial and synergistic activity of different tea crude extracts
against antibiotic resistant S. aureus, E. coli n a clinical isolate of S.typhi.
Science Journal of Microbiology, 9, 115.
Koleva, I. I., Van Beek, T., Linson, P. H. J., Groo, A. and Evstateiva, N. L. (2001).
Screening of plant extracts for antioxidant activity; a comparative study on three
testing methods, Phytochemical Analysis, 13, 8-17.
Kuhr, S., and Engelhardt, V. H. (1991). Determination of flavanols, theogallin, gallic
acid and caffeine in tea using HPLC. Z. Lebensm, Unter Forsc, 192, 526-529.
Kumar, A., Nair, A. G. C., Reddy, A. V. R and Garg, A. N. (2005). Availability of
essential elements in Indian and US tea brands. Food Chemistry, 89, 441-448.
Kumar, A., Nair, A. G. C., Reddyand, A. V. R. and Garg, A. N. (2008). Availability
of Essential Elements in Indian and US Tea Brands, Journal of Food Chemistry,
89, 441-448.
87
Kwach, B. O., Owuor, P. O., Kamau D. M. and Wanyoko, J. K. (2012). Evaluation
of Foliar Analysis as a Diagnostic Tool of Predicting Nutrient Deficiencies of
Clonal Tea in Kenya, Asian Journal of Biological and Life Sciences, 1(1), 8-18.
Lakebrink, C. (2000). Flavonoids and other polyphenols in consumer brews of tea and
other caffeinated beverages. Journal Agriculture and Food Chemistry, 48, 2848-
2852.
Lambert, J. N., Hong, J., Yang, G., Liao, J. and Yang, C. S. (2005) Introduction of
carcino genesis by polyphenol; Evidence from laboratory investigations.
American Journal of Clinical Nutrition, 81, 284-291.
Lambert, P. A. (2005). Bacterial resistance to antibiotics modifies target sites.
Advanced Drug Delivery Reviews, 57, 1471-1485.
Leung, L. K., Yakun, S., Chen, R., Zhang, Z., Hang, Y. U. and Chen, Z. Y. (2001).
Theaflavins in black tea and catechins in green tea are equally effective in
antioxidant activity. Journal of Nutrition, 131, 2248-2251.
Li, D., Wang, N. and Wan, X. (2005). Thearubigins. The complicated polyphenols in
black tea. In: 2005 International symposium on innovation in tea science and
sustainable development in tea industry. Hang Zhou China, PP 647-658.
Lin, J. K., Lin, C. L., Liang, Y. C., Lin shian, S. Y, and Juan, I. M. (1998). Survey of
catechins, gallic acid and methylxanthines in green, oolong, pur-err and black
teas. Journal of Agriculture and Food Chemistry, 46, 3635-3642.
Lin, Y. L., Juan, I. M., Chem, Y. L., Liang, Y. C. and Lin, J. K. (1996). Composition
of polyphenols in fresh tea leaves and associations of their oxygen radical,
absorbing capacity with antiproliferative actions in fibro blast cells. Journal of
Agriculture and Food Chemistry, 44, 1387-1394.
88
Lin, Y. S, Tsai, Y. J., Tsav, J. S. and Lin, J. K. (2003). Factors affecting the level, of
tea polyphenols and caffeine in tea leaves. Journal of Agricultural Food
Chemistry, 51,1864-1873.
Lozak, A., Soltyk K., Ostapczuk, P., Fijalek, Z. (2002). Determination of selected
trace elements in herbs and their infusions. Science of Total Environment, 289,
33-40.
Magoma, G. N., Wachira F. N., Imbuga, M. O. and Agong, S. G. (2003).
Biochemical differentiation in Camellia sinensis and its wild relatives as
revealed by isocyne and catechin patterns. Biochemical Systematics and Ecology,
31, 995-1010.
Magoma, G. N., Wachira, F. N. and Obanda, M. (2001). The pharmacological
potential and catechins diversity inherent in Kenya tea. Tea, 22, 83-93.
Magoma, G. N., Wachira, F. N., Obanda, M. Imbuga, M. and Agong, S. G. (2000).
The use of catechins as biological biochemical markers in diversity studies of tea
(Camellia sinensis). Genetic Resource and Crop Evolution, 47, 107-114.
Mahanta, P. K. and Hemanta, B. K. (1992). Theaflavins pigment formation and
polyphenol oxidase activitiy as a criterion of fermentation in orthodox and CTC
teas. Journal of Agricultural and Food Chemistry, 40, 860-863.
Marcos, A., Fisher, A., Rea, G. and Hill, S. (1998). Preliminary study using trace
element concentrations and a chemometrics approach to determine the
geographical origin of tea. Analytical Atomic Spectrometry, 13, 521-525.
Matherson, J. K and Bovil, E. W. (1950). Tea, East Africa Agriculture. Oxford:
Oxford University Press.
89
McDowell, I., Feakes, J. and Gay, C. (1990). Phenolic composition of black tea liquors
as a means of predicting price and country of origin. Journal of Science, Food
and Agriculture, 55, 627-641.
Millin, R., Marian, N. and Shahidi, F. (1969). Contribution of Phenolic Compounds to
Flavor and Color Characteristics of Foods, Boca Raton: CRC Press.
Mondal, S., Packer, L., Mouse, Y. B. H. and Weirb, O. (2006). Proceedings for the
“Third International conference on Mechanism and Action of Nutraceuticals.‟
Nutritional Biochemistry, 16, 513-520.
Mondal, T. K., Bhattacharya, A., Laxmikumaran, M. and Ahuja, P. S. (2004).
Recent advances of tea (Camellia Sinensis) Biotetechnology. Review of plant
biotechnology and applied genetics. Plant, Cell, Tissue and Organ Culture, 76,
195-254.
Moreno, C. S. (2002). Review. Methods used to evaluate the free radical scavenging
activity of foods and biological systems. Food Science International, 8, 12-137.
Moredo-Pineiro, A., Fisher, A. and Hill, S. J. (2003). The classification of tea
according to the region of origin using pattern recognition techniques and trace
metal data. Journal of Food Composition Analysis, 16, 195-211.
Moseti, K. O., Kinyanjui, T., Wanyoko, J. K., Kurgat, J. K., Too, J. C., Omondi, K.
G. and Wachira, F. N. (2013). Fe, Zn, Cu, Pb and Cd in tea grown and
marketed in Kenya; a quantitative assessment. International Journal of
Environmental Protection, 3(6), 24-30.
Moseti K. O. (2013). Levels of selected heavy metals and fluoride in tea (Camellia
sinensis) grown, processed and marketed in Kenya. UnpublishedM.Sc. Thesis.
Njoro: Egerton University.
90
Mukhtar, H. and Ahmed, N. (2000). Tea polyphenol; prevention of cancer and
optimizing health. Annual Journal of Clinical Nutrition, 1698-1702.
Nance, C. L. and Shearer, W. T. (2003). Is green tea good for HIV – 1 infection?
Journal of Allergy and Clinical Immunology, 112, 851-853.
Nakane, H., Hora, Y, and Ono, K. (1994). Differential inhibition of HIV – reverse
transcriptase and various DNA polymerases by Theaflavins. Cancer Journal of
Clinicians, 120, 100-285.
Nagao, T., Mase, T., and Kokimitsu, I. (2007). A green tea extract high in catechins
reduces body fat and cardiovascular risks in human. Journal of Obesity, 6, 1473-
1483.
Nathanson, J. A. (1984). Caffeine and related methylxanthines; possible naturally
occurring pesticides” Science, 226(4671), 184-187.
Naithan, V. and Kakkar, P. (2005). Evaluation of heavy metals in India herbal teas.
Bulletin of Environmental Contamination and Toxicology, 75, 197-203.
Nelson, B. C., Thomas, J. B., Wise, S. A., and Dalluge, J. J. (1998). The separation of
green tea catechins by micellar electrokinetic chromatography. Journal of
Microcolumn Separations, 10, 671-679.
Nehling, A., Daval, J. L. and Debry, G. (1992). Caffeine and the central nervous
system: Mechanism of action, biochemical, metabolic and psychostimulant
effects: Brain Research Reviews, 17(2), 139-170.
Obaga, S, M., Squire, G. R., Langat, J. K. (1988). Altitude, temperature and growth of
tea shoots. Tea, 9, 28-33.
91
Obanda, M., and Owuor, P. O. (1997). Flavanols composition and caffeine content of
green leaf as quality potential indicators of Kenyan teas. Journal of the Science
of Food Agriculture, 74, 209-215.
Obanda, M., Owuor, P. O. and Mango’ka, R. (2001). Changes in the chemical and
sensory quality parameters of black tea due to variations of fermentation time
and temperature. Food Chemistry, 75, 395-401.
Obanda, M., Owuor, P. O. and Njuguna, C. K. (1992). The impact of clonal variation
of total polyphenol oxidase activity of fresh shoots on plain black tea quality
parameters. Tea, 13, 129-132.
Obanda, M., Owuor, P. O., Mangoka, R. and Kavoi, M. M. (2004). Changes in
thearubigins fractions and theaflavins levels due to variations in processing
conditions and their influence on black tea liquor brightness and total colour.
Food Chemistry, 75(4), 163-173.
Odhiambo, H. O., (1989). Nitrogen rates and plucking frequency on tea: the effect of
plucking frequency and nitrogenous fertilizer rates on yield and yield
components of tea (Camelia sinensis L.) O. Kuntze in Kenya. Tea, 10, 90-96.
Ogola, S. O. and Kibiku, P. N. (2004). Smallholder tea growing enterprise:
productivity and profitability survey report. Nairobi: Tea Board of Kenya.
Omwoyo, W. N., Owuor, P. O., Ongeri, D. M., Kamau, D. M., Kwach, B. O.,
Munyao, P. M. and Otieno, M. O. (2013). Availability of Some Inorganic
Micronutrients and Effects of Grading on Their Levels in East African Black
Teas and Their Infusions, Asian Journal of Biological and Life Sciences, 2(1),
42-49.
92
Othieno, C. O (1992). Soils in Wilson, K. C., Clifford, M. N. (Eds), Tea; Cultivation to
consumption, London: Chapman and Hall.
Owour, P. O., Obaga, S. O. and Othieno, C. O. (1990). Effects of altitude on the
chemical composition of black tea. Journal of the Science of Food and
Agriculture, 50, 9-17.
Owour, P. O., Reeves, S. G. and Wanyoko, J. K. (1986). Correlation of theaflavins
contents and valuations of Kenyan teas. Journal of the Science of Food and
Agriculture, 37, 507-513.
Owuor, P. O. and McDowell (1994). Changes in theaflavins composition and
astringency during black tea fermentation. Food Chemistry, 51, 251-254.
Owuor, P. O. and Obanda, M. (1996). Comparing the aroma quality of some Kenyan
clonal black tea with black teas from various parts of the world. Journal of Food
Agriculture and Technology in Africa, 1, 12-15.
Owuor, P. O. and Odhiambo, H. O. (1984). Response of some black tea quality
parameters to nitrogen fertilizer rates and plucking frequencies. Journal of the
Science of Food and Agriculture, 66, 555-561.
Owuor, P. O. and Otieno, C. O. (1990). Response of black tea quality to locality in
stakeholders tea farms. Tea, 12, 41-45.
Owuor, P. O., and Obanda, M. (1995). Clonal variation in the individual thaflavins
and their impact on astringency and sensory evaluation. Food Chemistry, 54,
273-277.
Owuor, P. O., Horita, H., Tsushida, J., and Murai, T. (1986). Comparison of black
teas from main black tea producing parts of the world. Tea, 7, 71-78.
93
Owuor, P. O., Obanda, M., Apostolides, Z., Wright, L. P., Nyirenda, H. E. and
Mphwangwe, N. I. K. (2006). The relationship between the chemical quality
parameters and black tea colour, brightness and sensory evaluation. Food
Chemistry, 97, 644-653.
Owuor, P. O., Tsushida, T., Horita, H. and Murai, T. (1988). Effects of geographical
area of production on the composition of volatile flavor compound in Kenya
clonal black teas. Journal of Experimental Agriculture, 24, 227-235.
Ozowa, M., Sato, N. and Inatomi, H. (1969). Free amino acids in plants and pipecolic
acid in tea plant (Thea sinesis) seeds. Neij Daigaka, Nogakubu kenkyu Hokoky,
24, 31-35.
Paola, R. D., Mazzon, E., Muia, C., Genovese T., Menegazzi, M., Zaffin, R., Suzuki,
H., and Cuzzocrea, S., (2005). Green tea polyphenols attenuates lung injury in
Carrageen induced pleurisy injury in mice. Journal of Research, 6, 1465-1498.
Paquay, J. B. (2001). Protections against Nitric oxide toxicity by tea. Journal of
Agriculture and Food Chemistry, 48, 5768-5775.
Pelilo, M., Bandini, A. B., Toschi, G. T., Vanzini, M. and Lecker, G. (2002).
Preliminary investigations into development of HPLC with UV and MS
electroscopy detection for analyses of tea catechins. Food Chemistry, 78, 369-
374.
Pourmorad, F., Husseini Mehr, S. J. and Shahabimajd, N. (2006). Antioxidant,
phenol and flavanoid contents of some selected Iranian medicinal plants. African
Journal of Biotechnology, 5, 1142-1145.
94
Ramaswoy, A. (1964). Chemical basis of liquoring characteristics of cylar tea. Effects
of elevation and climatic conditions on the composition of tea liquor. Journal of
Tea Courtesy, 35, 164-167.
Rao, T. P., Lekh, R. J. and Takado, Y. (2006). Green tea catechins against oxidative
stress of renal diseases: In: Protective effects of tea on human health. Navender,
K., Siddick, M. and Burger, J. W., London: CAB.
Reeves, S. G., Owuor, P. O. and Othieno, C. O. (1987). Biochemisrty of black tea
manufacture. Journal of Tropical Science, 27, 121-133.
Richard, R. (2001). Green tea extract may have neuro-protective effects in Parkinsons‟s
disease. Lancet, 358, 391.
Roberts, E. A. and Smith, R. F. (1972). Spectrophotometric determination of
theaflavins and thearubigins in black tea liquor in assessment of quality in tea.
The Analyst, 86, 94-98.
Roberts, E. A. H. and Smith, R. F (1961). Spectrophotometric measurements of
theaflavins and thearubigins in black tea liquors assessment of quality in teas.
The Analyst, 86, 94-98.
Roberts, E. A. H. and Smith, R. F. (1963). Phenolic substances of manufactured tea II.
Spectroscopic evaluation of tea liquors. Journal of the Science of Food
Agriculture, 14, 889-900.
Roberts, E. A. H., Wight, W. and Wood, D. J. (1958). Paper chromatography as an aid
to the identification of Thea camellia. Journal of New Phytology, 57, 211-225.
Robertson, A. R., (1983). Effects of catechin concentration on the formation of black
tea polyphenols during in vitro oxidation. Phytochemistry, 22, 897-903.
95
Robinson, J. M. and Owuor, P. O (1992). Tea aroma in: Wilson K. C., Clifford M. N
(Eds.), Tea: Cultivation to consumption. London: Chapman and Hall.
Sabu, M. C., Smitha, K. and Kuttan, R. (2002). Antidiabetic activity of green tea
polyphenols and their role in reducing oxidative stress in experimental diabetes.
Journal of Ethnopharmacology, 83, 109-116.
Saijo, R., Kato, M. and Takedo, Y. (2004). Changes in the contents of Catechins and
caffeine during leaf development. Proceedings of the intestinal conference and
ocha (Tea) culture and science. Shizuoka Japan, pp 251 -254.
Sanderson, G. W. (1963). The chloroform test. A study of its suitability as a means of
rapidly evaluating fermenting properties of clones. Tea Quarterly, 34, 193-196.
Sanderson, G. W., Ronadine, A. S., Eisenberg, L. S., Farrel, E. J., Simon, L.,
Manley, C. H. and Coggon, P. (1976). Contributions of polyphenolic
compounds to the state of tea. Journal of Academics Symposium Series, 26, 14-
46.
Sanella, A. R., Luigi, M., Angella, C., Franco, F., Vincieri, A., Bilia, R., … and
Carlo, S. (2007). Antimalarial properties of green tea. Biochemical and
Biophysical Research Communications, 353, 177-181.
Sang, S., Lapsley, K., Jeong, W. S., Lachanche, P. A., Ho, C. T. and Rosen, R. T.
(2002). Antioxidant phenolic compounds isolated from almond skins (prunus
amygdalus Batsch). Journal of Agricultural Food Chemistry. 50, 2459-2463.
Sang, S., Tian, S., Wang, H., Stark, R., Rosen, R., Chung, S. Y. and Ho, C. T.
(2002). Chemical studies on antioxidant mechanisms of tea catechins: Analysis
of radical reaction, products of catechin and epicatechin with 2,2-Diphenyl-1-
96
Picrylhydrocyl. Journal of Bio-organic and Medicinal Chemistry, 10, 2233-
2237.
Sathawara, N. G., Parikish, D. J., Agrwal, Y. K. (2004). Essential heavy metals in
environmental samples from western India. Bulletin of Environmental
Contamination and Toxicology, 73, 756-761.
Saud, S. A. (2003). Heavy metal contaminants in tea and herb leaves. Pakistan Journal
of Biological Sciences, 6, 208-212.
Sealy, J. (1958). A revision of genus Camellia. London: Royal Horticultural Society.
Seenivasan, S., Manikandan, N., Muraleedharan, N. N. and Selvasundaram, R.
(2008). Heavy metal content of black teas from south India. Food Control, 19,
746-749.
Shouba, H. (1989). Meteorology of the tea plant in China. A review. Journal
Agriculture and Forestry Meteorology, 47, 19-30.
Sitienei, K., Home, P. G., Kamau, D. M. and Wanyoko, J. K. (2013). Nitrogen and
Potassium Dynamics in Tea Cultivation as Influenced by Fertilizer Type and
Application Rates, American Journal of Plant Sciences, 4, 59-65.
Snel, J., Lorist, M. M. (2011). Effects of caffeine on sleep and cognition. Progress in
Brain Research, 190, 105-117.
Sobukola, O. P., Awonorim, S. O., Idowu, M. A., and Bamiro, F. O. (2008).
Chemical and physical hazards profile of “robo” processing - a street vended
melon snack. International Journal of Food Science and Technology, 43, 237-
242.
Spencer, A. G. (1950). Flame Photometry. Lancet, 2(6639), 623-627.
97
Steel, R. G. D., Torrie, J. H. and Dickey, D. A. (1997). Principles and Procedures of
Statistics A Biometrical Approach, (3rd ed.). NY: McGraw Hill Book Co.
Steenland, K. and Boffeta, P. (2000). Lead and cancer in humans: where are we now?
American Journal of Indigenous Medicine, 38, 2 95-299.
Stewart, J. A., Mullen, W and Crozier, A. (2004). On line high performance liquid
chromatography of the antioxidant phenolics in green and black tea. Molecular
Nutrition Food Research, 49, 52-60.
Suematsu, S., Hisanobu, Y., Sargo, H., Matsuda, R. and Komatsu, Y. (1995). A new
extraction procedure for determination of caffeine and catechins in green tea.
Nippon Shokunin Koguku Karshi, 42, 419-424.
Sugiyama, T. and Sadzuka, Y. (1999). Theanine and cancer. Clinical Cancer
Research, 5, 413.
Tanmoy, K. and Bhagat, R. M. (2010). Trace elements in tea leaves, made tea and tea
infusion: A review. Food Research International, 43, 2234-2252.
Takeo, T. (1983). Effect of withering process on volatile compounds formation during
black tea manufacture. Journal of the Science of Food and Agriculture, 35, 84-
87.
Takeo, T. and Baker, J. E. (1973). Changes in multiple forms of polyphenol oxidase
during maturation of tea leaves. Phytochemistry, 12, 21-24.
Takino, Y., Imagawa, N., Harikawa, H., and Tanaka, A. (1964). Studies on the
mechanism of the oxidation of the catechins, Part III. Formation of a reddish
orange pigment, its spectral relationship to some benzotropoline derivatives.
Journal of Agriculture, Biology and Chemistry, 28(1), 64-71.
98
Tea Board Kenya (TBK), (2007). Fact Sheet on Kenya Tea. Nairobi: Tea Board of
Kenya .
Tea Board Kenya (TBK), (2008). Tea industry Performance in 2007. Nairobi: Tea
Board of Kenya.
Tea Board Kenya (TBK), (2011). Tea Industry performance in 2010. Nairobi: Tea
Board of Kenya.
Tea Board Kenya (TBK), (2012). Kenya Tea Industry Performance Highlights for June
2012, Nairobi:TBK.
Tea Board Kenya (TBK), (2012). Surviving the economic meltdown. Nairobi: Tea
Board of Kenya.
Thanaraj, S. N. S and Seshadri, R. (1990). Influence of polyphenol oxidase activity
and polyphenol content of tea shoot on black tea. The Journal of the Science of
Food and Agriculture, 51, 57-69.
Thangapazham, R. L., Singh, A. K., Sharma, A., Warren, J., Gaddipati, J. P. and
Maheshwari R. K., (2007). Green tea polyphenols and its constituent
epigallocatechin gallate inhibit proliferation of human breast cancer cell in vitro
and in vivo. Cancer Letters, 245, 232-241.
Tea Research Foundation of Kenya, (T.R.F.K) (2002). Tea grower’s handbook 5th
Edition, Kericho: TRFK.
Tombs, K. I. and Mashingaidze, A. (1997). Influence of withering, including leaf
handling, on the manufacturing of quality of black teas. Food Chemistry, 60,
573-580.
99
Vanessa, C., and Williamson, G. (2004). A review of the health effects of green tea
catechins in vivo in animal models. Journal of Nutrition, 134, 3431-3440.
Van dan Vossen, H. A. M and Wessel, M. (2000). Plant resources of South East Asia
(PROSEA) No. 16 stimulants, Leiden: Backhuys Publishers.
Valcic, S., Munders, A., Jacobsen, N. E., Hibler, D. C. and Timmermann, B. N.
(1999). Antioxidant chemistry of green tea Catechins. Identification of products
of the reaction of (-) – epigallocatechin gallate with peroxyl radicals. Journal of
Chemistry Research in Toxicology, 12, 382-386.
Vinson., J. A (1995). Plant flavanoids especially the flavanols are powerful antioxidants
using on in vitro oxidation model for heart disease. Journal of Agriculture and
Food Chemistry, 43, 2800-2802.
Vinson, J.A., Wu, N., Teufel, K., and Zhang, J. (2001). Beneficial effects of green tea
and black tea on animal models on atherosclerosis and diabetes. Proceedings of
the conference on ocha (tea) culture and science: Exploring new possibilities for
o-ocha (tea) in the 21st century, 5th - 10th October, Schizuoka, Japan.
Villano, D., Fernandez-Pacchion, M. S, Moya, M. L Trosonco, A. M and Garcia-
Parilla, M. C (2006). Radical scavenging ability of polyphenolic compounds
towards DPPH free radical. Talanta, 71, 230-235.
Vo Thai, D. (2006). An assessment on genetic diversity in Vietnam tea using
morphology, ISSR and microsatellite. Gottingen, 44.
Wachira, F. N (2002). Detection of genetic Diversity (TGD) Project. TGD final project,
Kericho, Kenya.
100
Wachira, F. N. (2001). Tea improvement in Kenya An overview of research
achievements. Prospects and limitations in TBK Board of Directors Open day
Proceeding, 29, Jan 2001. Tea Research Foundation of Kenya, 12-14.
Wachira, F. N. and Kamunya, S. (2005). Kenya teas are rich in antioxidants. Tea, 26,
81-89.
Wachira, F. N., Okinda, Owuor, Kavoi, M. M. And Ogola, S. O. (2004).
Sustainability of smallholder tea growing in Kenya, Country Report
Wanyoko, J. K. and Njuguna, C. K. (1983). Variation of Foliar Nutrients of Some
Kenyan Tea and Their Relationship with Yield, Tea, 4, 37-43.
Werkhoven, J. (1974). Introduction in FAO, Tea Processing. Rome: Food and
Agriculture Organization of the United Nations.
Wheeler, D. S and Wheeler, W. J (2004). The medicinal chemistry of tea. Drug
Development Research, 61, 45-65.
Wicremasinghe, R. L., Wick, E. L. and Yamanishi, T. (1973). Gas Chromatographic.
Mass spectrometric analysis of flavoury and non flavoury Ceylon black tea
aroma by two different methods. Journal of Chromatography, 79, 75-80.
Williamson, K. and Cliford, M. (1992). Tea-Cultivation to consumption. London:
Chapman and Hall.
Wilson, T S. (1962). Field operations. Historical notes on tea production in Africa. In:
Tea Estates – Africa (Eds), London: Shenval Press.
World Health Organisation (WHO), 1996. Trace elements in human nutrition and
health. Geneva: WHO.

101
Wright, L. P., Mphangiwe, N. K., Ngemecda, H. and Apostolides, Z. (2002).
Analysis of the theaflavin composition in black tea (Camellia sinensis)
predicting the quality of black tea produced in central and southern Africa.
Journal of the Food Science and Agriculture, 82, 517-525.
Wright, W. (1962) .Tea classification revised. Current Science, 31, 295-299.
Wu, C. D and Wei, G. X (2002). Tea as a functional food for oral health. Journal of
Nutrition, 18, 443-444.
Xie, M., Von Bohlen, A., Klockenkamper, R., Jian X. and Gunter, K. (1998).
Multielement analysis of Chinese tea (Camellia sinensis) by total reflection x ray
fluorescence. Z. Lebenon – Unters Forsh, 207, 31-38.
Yanagimoto, K., Ochi, H., Lee, K. G. and Shibamotto, T. (2003) Antioxidant
activities of volatile extract from green tea, oolong and black tea. Journal of
Agricultural and Food Chemistry, 51, 7396-7401.
Yamamoto, M., Inagaki, N., Kitaura, J., Chikumoto, T., Kawahara, H., Kawakami,
Y., Kawakami, T. and Magai H. (2004). O-methylated catechins from tea
leaves inhibit multiple protein kinases in mast cells. Journal of Immunology,
172, 4480-4492.
Yamanishi, T., Kabayeshi, A., Nakamura, H., Uchida, A., Mori, S. and Ohsava, K.
(1968). Flavor of black tea. V. comparison of various black tea. Journal of
Agriculture and Biological Chemistry, 32, 379-386.
Yamanishi, T., Wicremasinghe, R. L., and Perera, K. P. W. C (1986). Studies on
quality and flavor of tea. Part III. Gas chromatographic analyses of aroma
complex. Tea Quarterly, 39, 81-86.
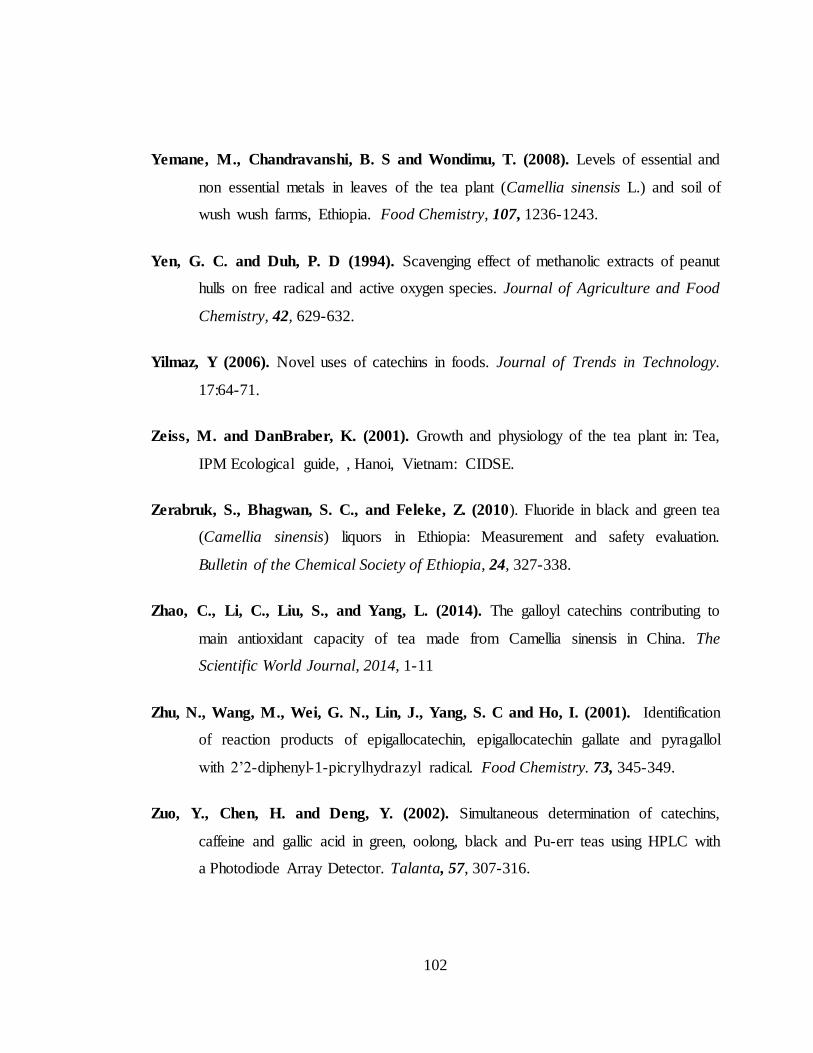
102
Yemane, M., Chandravanshi, B. S and Wondimu, T. (2008). Levels of essential and
non essential metals in leaves of the tea plant (Camellia sinensis L.) and soil of
wush wush farms, Ethiopia. Food Chemistry, 107, 1236-1243.
Yen, G. C. and Duh, P. D (1994). Scavenging effect of methanolic extracts of peanut
hulls on free radical and active oxygen species. Journal of Agriculture and Food
Chemistry, 42, 629-632.
Yilmaz, Y (2006). Novel uses of catechins in foods. Journal of Trends in Technology.
17:64-71.
Zeiss, M. and DanBraber, K. (2001). Growth and physiology of the tea plant in: Tea,
IPM Ecological guide, , Hanoi, Vietnam: CIDSE.
Zerabruk, S., Bhagwan, S. C., and Feleke, Z. (2010). Fluoride in black and green tea
(Camellia sinensis) liquors in Ethiopia: Measurement and safety evaluation.
Bulletin of the Chemical Society of Ethiopia, 24, 327-338.
Zhao, C., Li, C., Liu, S., and Yang, L. (2014). The galloyl catechins contributing to
main antioxidant capacity of tea made from Camellia sinensis in China. The
Scientific World Journal, 2014, 1-11
Zhu, N., Wang, M., Wei, G. N., Lin, J., Yang, S. C and Ho, I. (2001). Identification
of reaction products of epigallocatechin, epigallocatechin gallate and pyragallol
with 2‟2-diphenyl-1-picrylhydrazyl radical. Food Chemistry. 73, 345-349.
Zuo, Y., Chen, H. and Deng, Y. (2002). Simultaneous determination of catechins,
caffeine and gallic acid in green, oolong, black and Pu-err teas using HPLC with
a Photodiode Array Detector. Talanta, 57, 307-316.
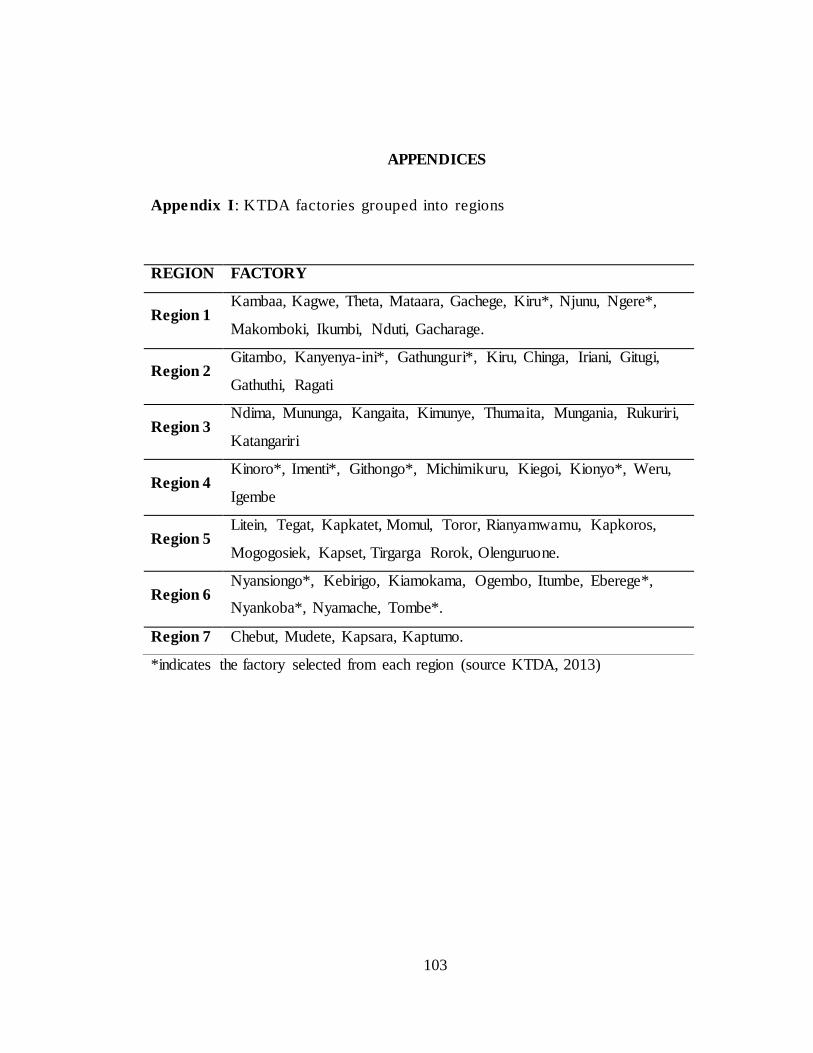
103
APPENDICES
Appendix I: KTDA factories grouped into regions
*indicates the factory selected from each region (source KTDA, 2013)
REGION FACTORY
Region 1 Kambaa, Kagwe, Theta, Mataara, Gachege, Kiru*, Njunu, Ngere*,
Makomboki, Ikumbi, Nduti, Gacharage.
Region 2 Gitambo, Kanyenya-ini*, Gathunguri*, Kiru, Chinga, Iriani, Gitugi,
Gathuthi, Ragati
Region 3 Ndima, Mununga, Kangaita, Kimunye, Thumaita, Mungania, Rukuriri,
Katangariri
Region 4 Kinoro*, Imenti*, Githongo*, Michimikuru, Kiegoi, Kionyo*, Weru,
Igembe
Region 5 Litein, Tegat, Kapkatet, Momul, Toror, Rianyamwamu, Kapkoros,
Mogogosiek, Kapset, Tirgarga Rorok, Olenguruone.
Region 6 Nyansiongo*, Kebirigo, Kiamokama, Ogembo, Itumbe, Eberege*,
Nyankoba*, Nyamache, Tombe*.
Region 7 Chebut, Mudete, Kapsara, Kaptumo.
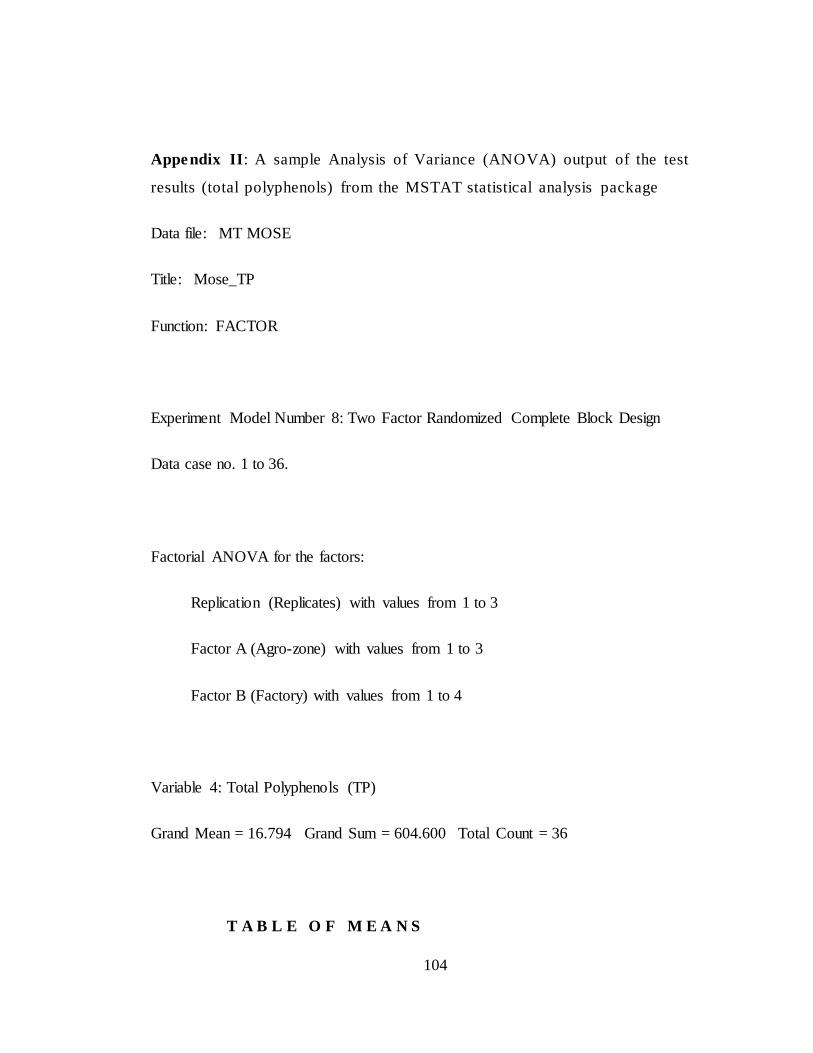
104
Appendix II: A sample Analysis of Variance (ANOVA) output of the test
results (total polyphenols) from the MSTAT statistical analysis package
Data file: MT MOSE
Title: Mose_TP
Function: FACTOR
Experiment Model Number 8: Two Factor Randomized Complete Block Design
Data case no. 1 to 36.
Factorial ANOVA for the factors:
Replication (Replicates) with values from 1 to 3
Factor A (Agro-zone) with values from 1 to 3
Factor B (Factory) with values from 1 to 4
Variable 4: Total Polyphenols (TP)
Grand Mean = 16.794 Grand Sum = 604.600 Total Count = 36
T A B L E O F M E A N S
105
1 2 3 4 Total
-------------------------------------------------------
1 * * 16.742 200.900
2 * * 16.850 202.200
3 * * 16.792 201.500
-------------------------------------------------------
* 1 * 17.833 214.000
* 2 * 16.458 197.500
* 3 * 16.092 193.100
-------------------------------------------------------
* * 1 17.456 157.100
* * 2 17.044 153.400
* * 3 17.244 155.200
* * 4 15.433 138.900
-------------------------------------------------------
* 1 1 18.733 56.200
* 1 2 18.500 55.500
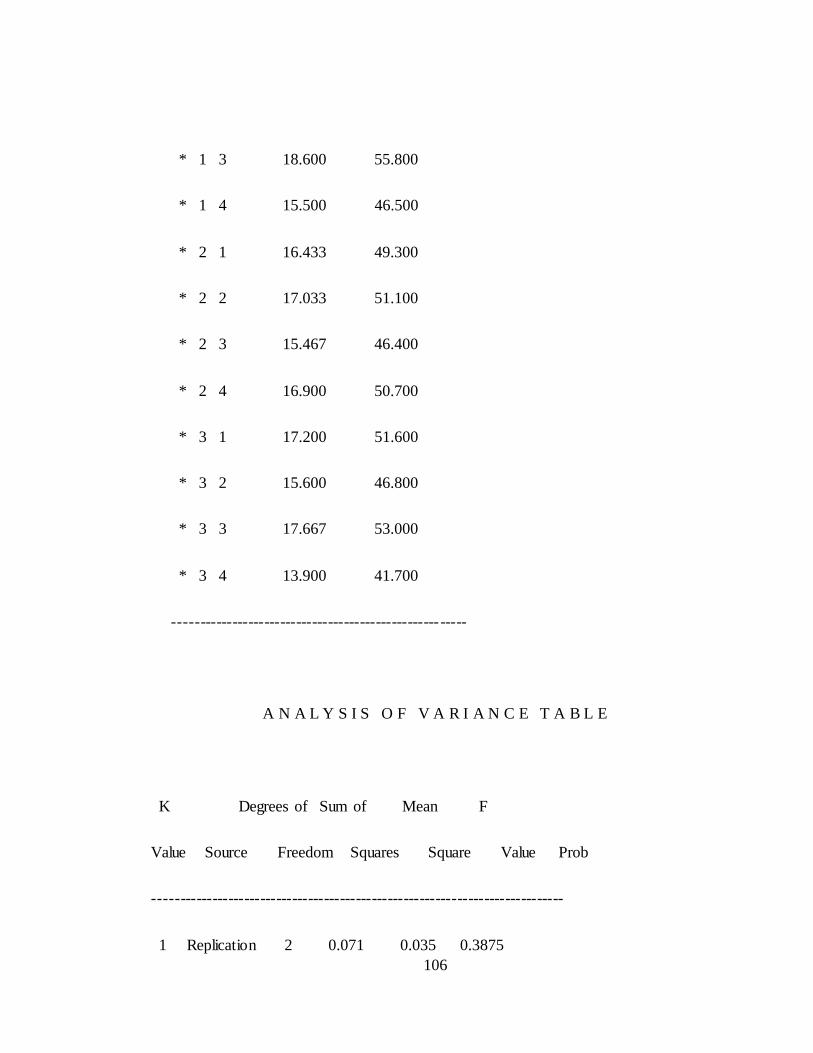
106
* 1 3 18.600 55.800
* 1 4 15.500 46.500
* 2 1 16.433 49.300
* 2 2 17.033 51.100
* 2 3 15.467 46.400
* 2 4 16.900 50.700
* 3 1 17.200 51.600
* 3 2 15.600 46.800
* 3 3 17.667 53.000
* 3 4 13.900 41.700
-------------------------------------------------------
A N A L Y S I S O F V A R I A N C E T A B L E
K Degrees of Sum of Mean F
Value Source Freedom Squares Square Value Prob
-----------------------------------------------------------------------------
1 Replication 2 0.071 0.035 0.3875

107
2 Factor A 2 20.234 10.117 111.1320 0.0000
4 Factor B 3 22.992 7.664 84.1879 0.0000
6 AB 6 29.659 4.943 54.3002 0.0000
-7 Error 22 2.003 0.091
-----------------------------------------------------------------------------
Total 35 74.959
-----------------------------------------------------------------------------
Coefficient of Variation: 1.80%
s_ for means group 1: 0.0871 Number of Observations: 12
y
s_ for means group 2: 0.0871 Number of Observations: 12
y
s_ for means group 4: 0.1006 Number of Observations: 9
y
s_ for means group 6: 0.1742 Number of Observations: 3
y
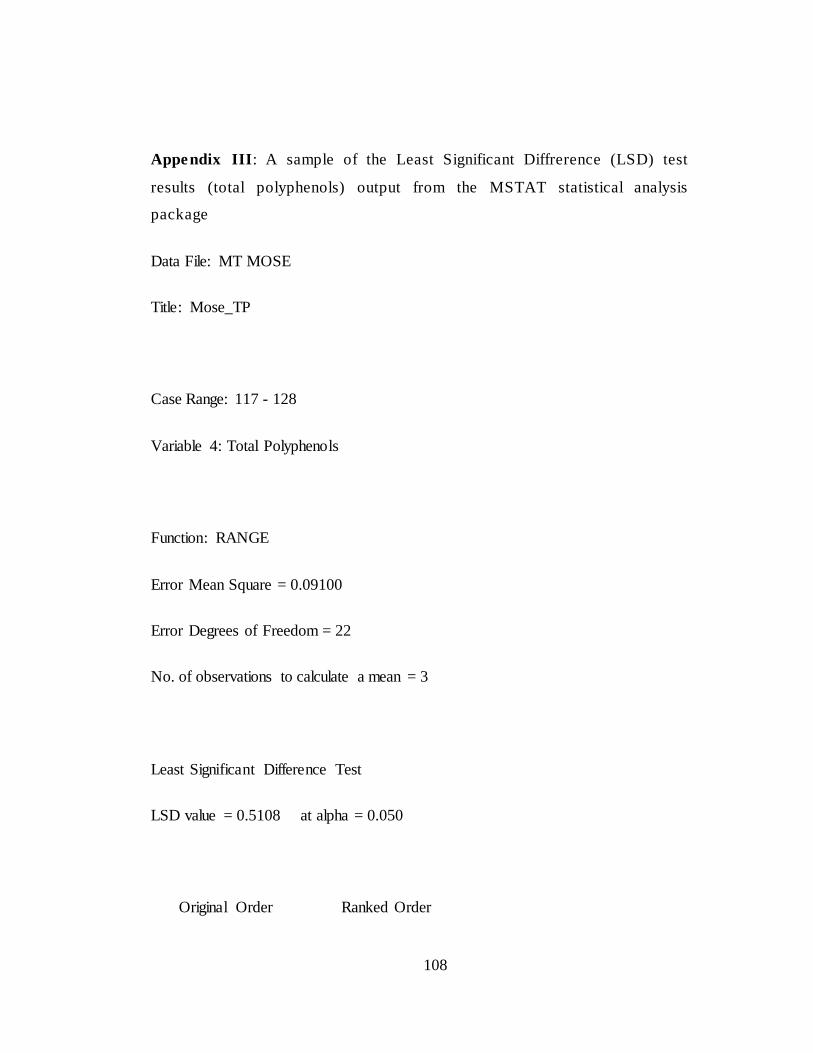
108
Appendix III: A sample of the Least Significant Diffrerence (LSD) test
results (total polyphenols) output from the MSTAT statistical analysis
package
Data File: MT MOSE
Title: Mose_TP
Case Range: 117 - 128
Variable 4: Total Polyphenols
Function: RANGE
Error Mean Square = 0.09100
Error Degrees of Freedom = 22
No. of observations to calculate a mean = 3
Least Significant Difference Test
LSD value = 0.5108 at alpha = 0.050
Original Order Ranked Order
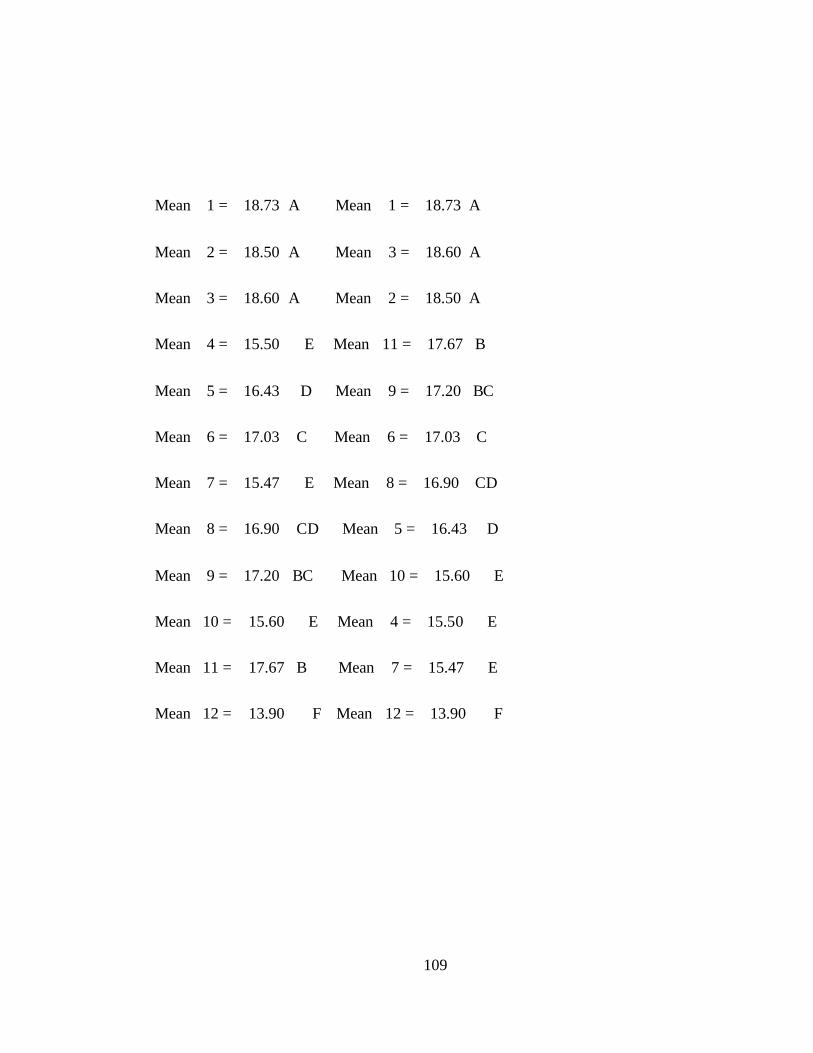
109
Mean 1 = 18.73 A Mean 1 = 18.73 A
Mean 2 = 18.50 A Mean 3 = 18.60 A
Mean 3 = 18.60 A Mean 2 = 18.50 A
Mean 4 = 15.50 E Mean 11 = 17.67 B
Mean 5 = 16.43 D Mean 9 = 17.20 BC
Mean 6 = 17.03 C Mean 6 = 17.03 C
Mean 7 = 15.47 E Mean 8 = 16.90 CD
Mean 8 = 16.90 CD Mean 5 = 16.43 D
Mean 9 = 17.20 BC Mean 10 = 15.60 E
Mean 10 = 15.60 E Mean 4 = 15.50 E
Mean 11 = 17.67 B Mean 7 = 15.47 E
Mean 12 = 13.90 F Mean 12 = 13.90 F
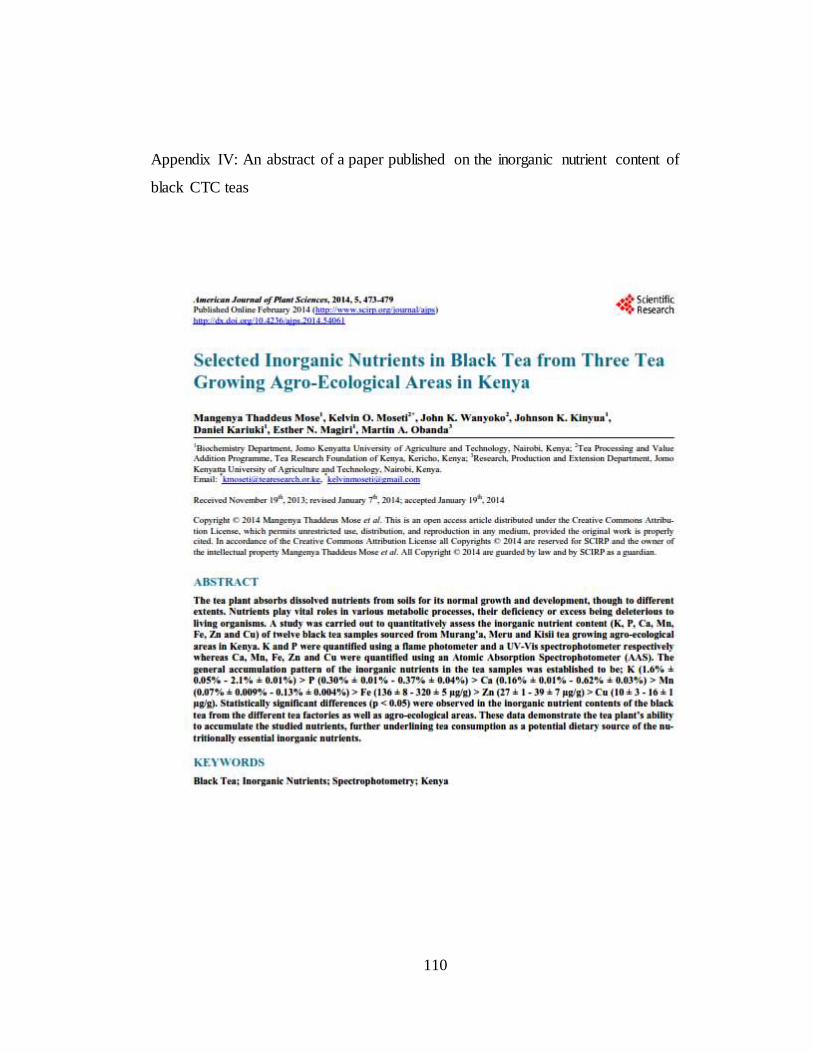
110
Appendix IV: An abstract of a paper published on the inorganic nutrient content of
black CTC teas


![Polyphenolic composition and antioxidant activity of...tea catechins of as described by Kerio et al., [12]. 2.1.3 Determination of total polyphenols in the tea extracts The Folin-Ciocalteu](https://img.pdfslide.us/doc/110x75/60f69679d3dad86e1a7cba12/polyphenolic-composition-and-antioxidant-activity-of-tea-catechins-of-as-described.jpg)