Embed Size (px)
Citation preview
Quantitative Analyses of
Software Vulnerabilities
HyunChul Joh, Ph.D. [email protected]
CS530 Guest Speech
2012-MAR-01
Main idea of the Work
“If you cannot measure it, you cannot improve it.” - Lord Kelvin (William Thomson) –
Measuring Vulnerability Activities
• Comparison of software systems
• Optimal software deployment
• Patch management
• Risk remediation
• Etc.
Lord William Thomson Kelvin (1824
1907)
2 / 41
Qualitative v.s. Quantitative
• Heavily depends on the experts’ opinions.
• Tends to be subjective.
• More like an “Art” which does not depend on definitions[1].
Qualitative approach
• Actual data-driven empirical analysis followed by statistical tests.
• Requires enough datasets.
• More like a “Science” which depends on definitions[1].
Quantitative approach
[1] Jack A. Jones, An introduction to factor analysis of information risk (FAIR), A framework for understanding, analyzing, and measuring risk, Tech Report, Risk Management Insight Inc., 2007 3 / 41

Software Vulnerabilities
• Defects in the security system which might be exploited by malicious users causing loss or harm[2]
Definition
Standards
Public online databases
[2] C. P. Pfleeger and S. L. Pfleeger, Security in Computing, 3rd ed. Prentice Hall PTR, 2003
4 / 41
Vulnerability Discovery Model (VDM)
• Vulnerability Discovery Model (VDM):
– Modeling discovery process of software vulnerabilities
– Estimating number of vulnerabilities
– To be used to assess risk & to evaluate possible mitigation approaches
• Existing models:
– Linear: constant discovery rate
– Exponential: exponentially declining rate
– Alhazmi Malaiya Logistic (AML) model: First S-shaped
– Effort based model
– Etc.
5 / 41
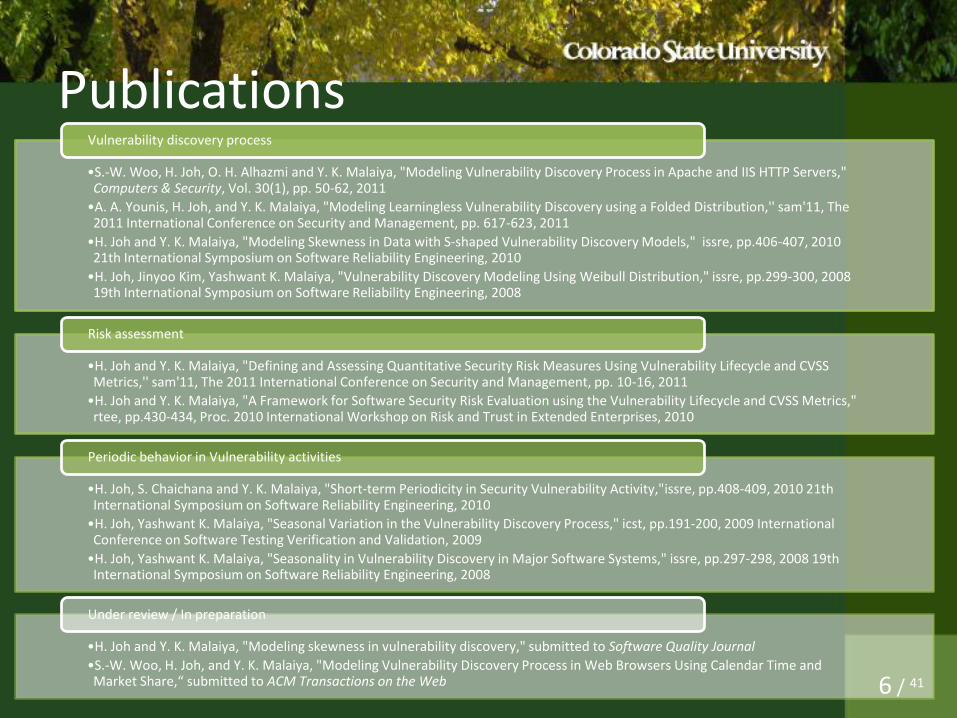
Publications •S.-W. Woo, H. Joh, O. H. Alhazmi and Y. K. Malaiya, "Modeling Vulnerability Discovery Process in Apache and IIS HTTP Servers," Computers & Security, Vol. 30(1), pp. 50-62, 2011
•A. A. Younis, H. Joh, and Y. K. Malaiya, "Modeling Learningless Vulnerability Discovery using a Folded Distribution,'' sam'11, The 2011 International Conference on Security and Management, pp. 617-623, 2011
•H. Joh and Y. K. Malaiya, "Modeling Skewness in Data with S-shaped Vulnerability Discovery Models," issre, pp.406-407, 2010 21th International Symposium on Software Reliability Engineering, 2010
•H. Joh, Jinyoo Kim, Yashwant K. Malaiya, "Vulnerability Discovery Modeling Using Weibull Distribution," issre, pp.299-300, 2008 19th International Symposium on Software Reliability Engineering, 2008
Vulnerability discovery process
•H. Joh and Y. K. Malaiya, "Defining and Assessing Quantitative Security Risk Measures Using Vulnerability Lifecycle and CVSS Metrics,'' sam'11, The 2011 International Conference on Security and Management, pp. 10-16, 2011
•H. Joh and Y. K. Malaiya, "A Framework for Software Security Risk Evaluation using the Vulnerability Lifecycle and CVSS Metrics," rtee, pp.430-434, Proc. 2010 International Workshop on Risk and Trust in Extended Enterprises, 2010
Risk assessment
•H. Joh, S. Chaichana and Y. K. Malaiya, "Short-term Periodicity in Security Vulnerability Activity,"issre, pp.408-409, 2010 21th International Symposium on Software Reliability Engineering, 2010
•H. Joh, Yashwant K. Malaiya, "Seasonal Variation in the Vulnerability Discovery Process," icst, pp.191-200, 2009 International Conference on Software Testing Verification and Validation, 2009
•H. Joh, Yashwant K. Malaiya, "Seasonality in Vulnerability Discovery in Major Software Systems," issre, pp.297-298, 2008 19th International Symposium on Software Reliability Engineering, 2008
Periodic behavior in Vulnerability activities
•H. Joh and Y. K. Malaiya, "Modeling skewness in vulnerability discovery," submitted to Software Quality Journal
•S.-W. Woo, H. Joh, and Y. K. Malaiya, "Modeling Vulnerability Discovery Process in Web Browsers Using Calendar Time and Market Share,“ submitted to ACM Transactions on the Web
Under review / In preparation
6 / 41

Outline
Introduction
Modeling Skewness
Risk Assessment
Periodic Behavior
Summary
1
2
3
4
5
7 / 41
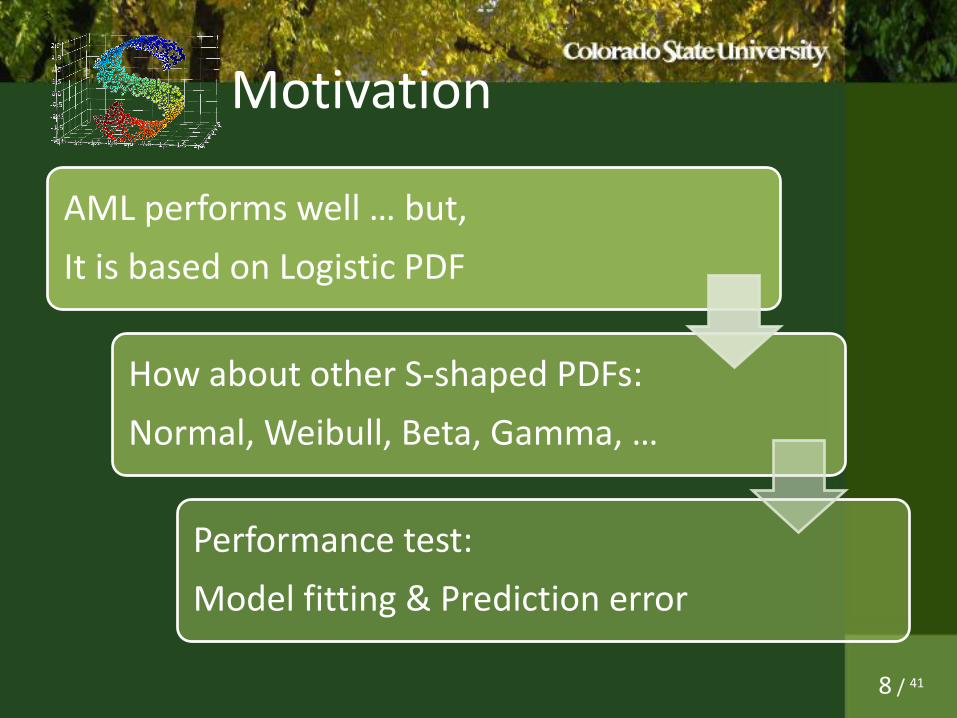
Motivation
AML performs well … but,
It is based on Logistic PDF
How about other S-shaped PDFs:
Normal, Weibull, Beta, Gamma, …
Performance test:
Model fitting & Prediction error
8 / 41
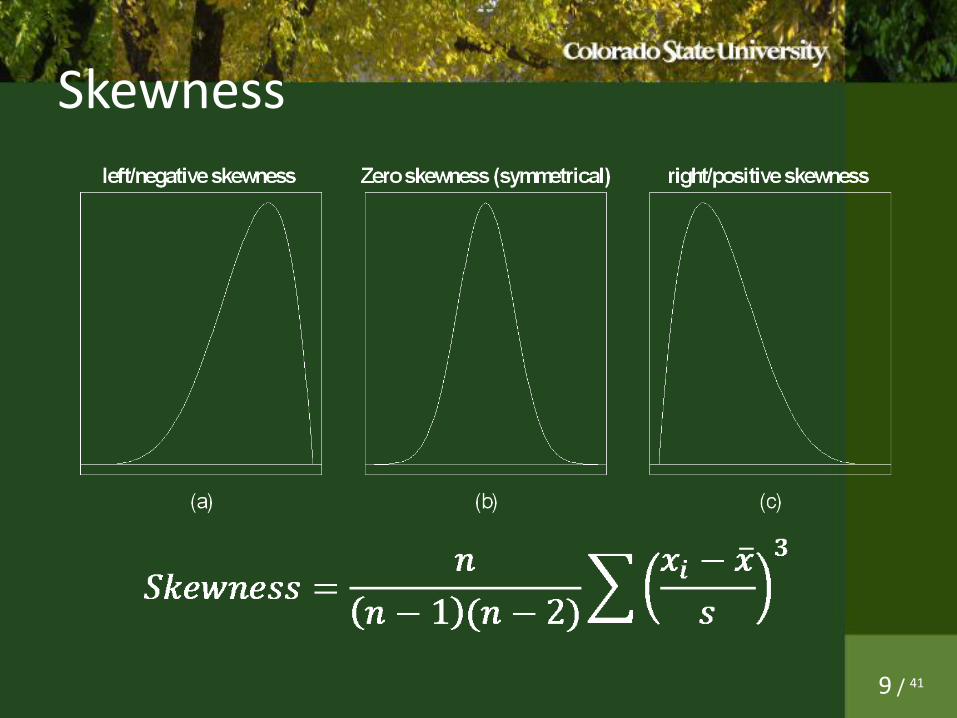
Skewness
9 / 41
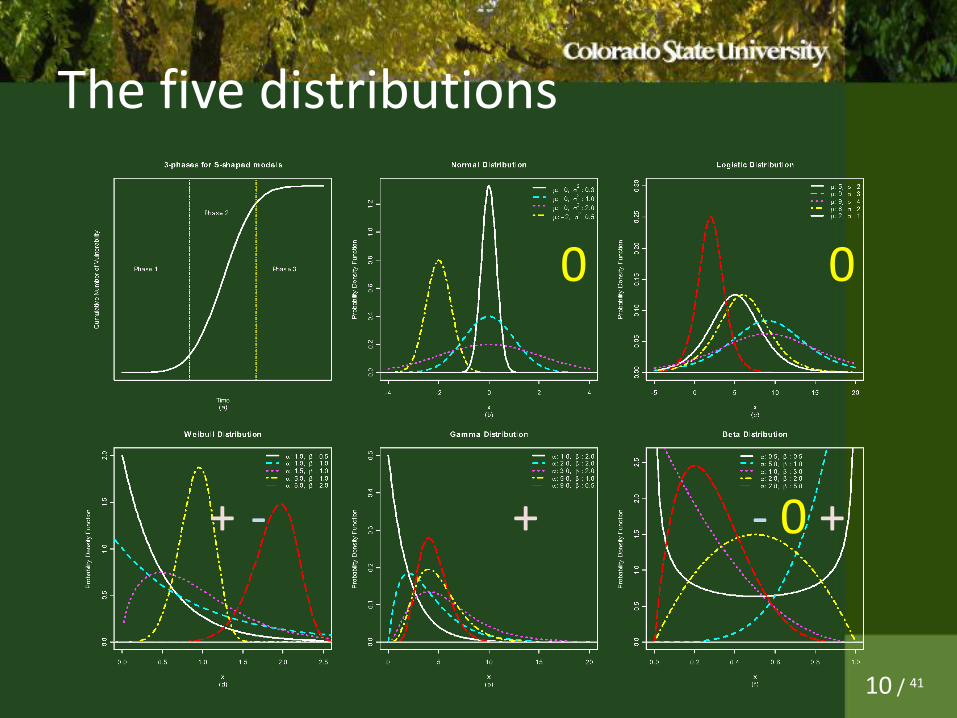
The five distributions
+ - + - 0 +
0 0
10 / 41
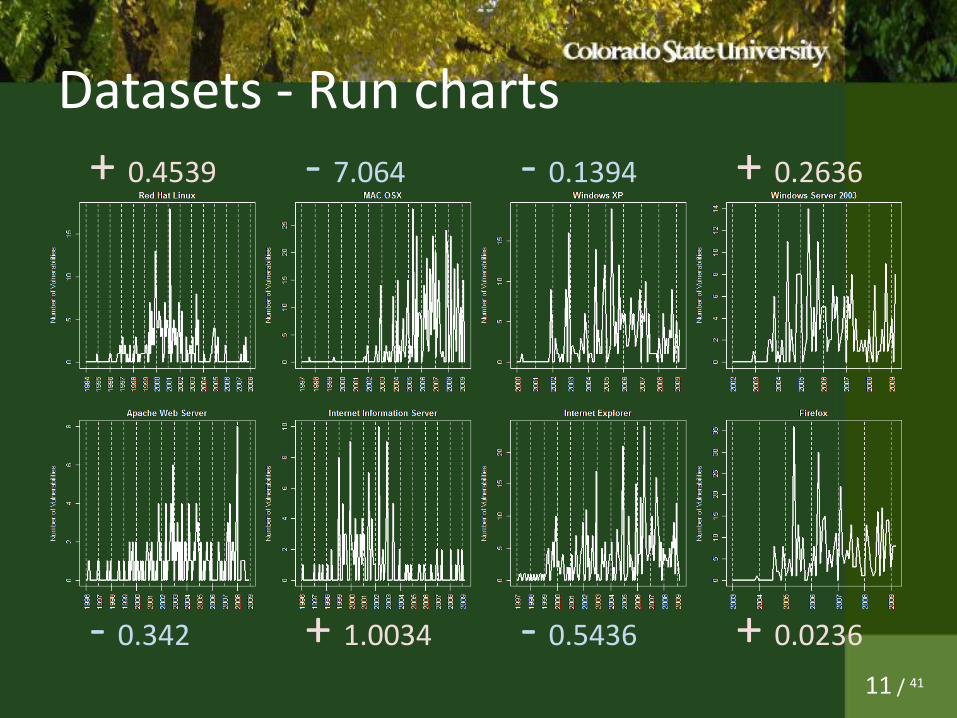
Datasets - Run charts
+ 0.4539 - 7.064 - 0.1394 + 0.2636
- 0.342 + 1.0034 - 0.5436 + 0.0236
11 / 41

Model fitting
+ - - +
- + - +
12 / 41
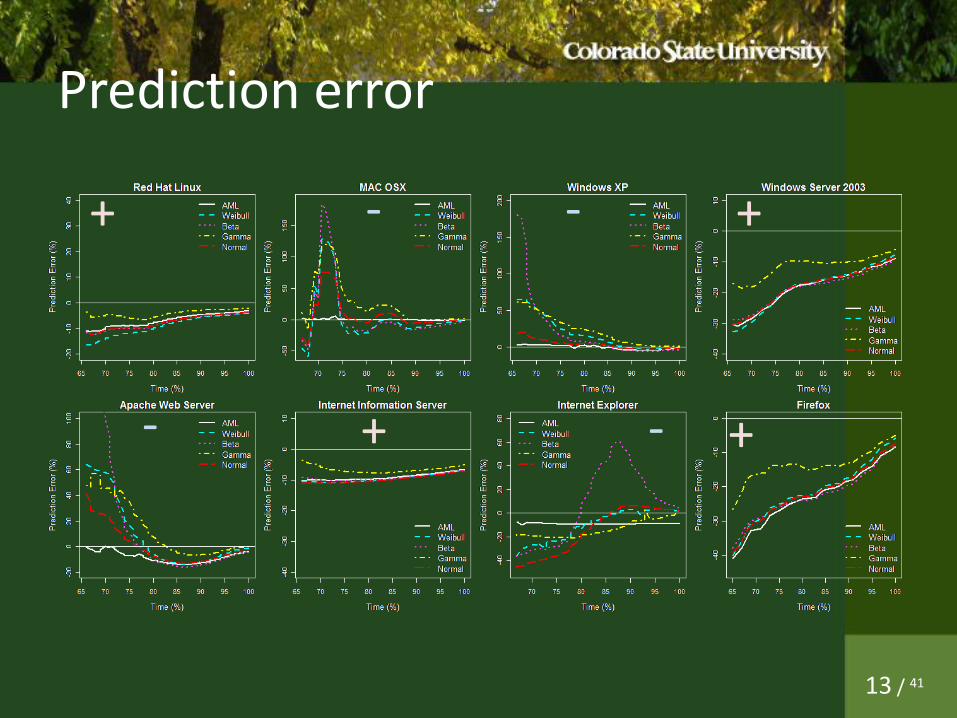
Prediction error
+ - - +
- + - +
13 / 41
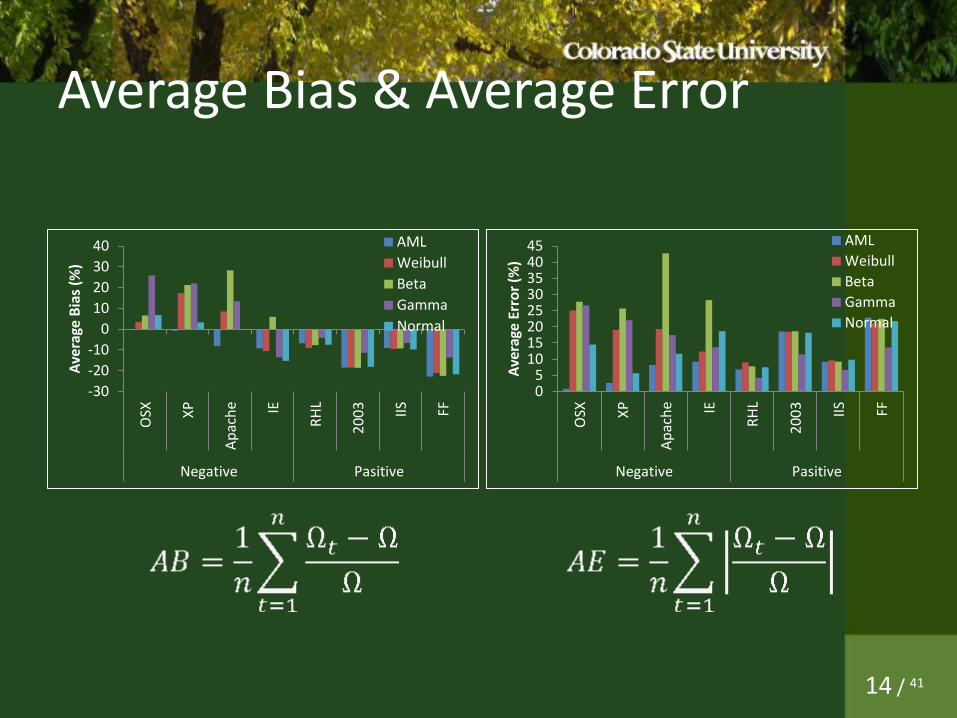
Average Bias & Average Error
-30
-20
-10
0
10
20
30
40
OSX X
P
Ap
ach
e IE
RH
L
20
03 IIS FF
Negative Pasitive
Ave
rage
Bia
s (%
)
AML
Weibull
Beta
Gamma
Normal
05
1015202530354045
OSX X
P
Ap
ach
e IE
RH
L
20
03 IIS FF
Negative Pasitive
Ave
rage
Err
or
(%)
AML
Weibull
Beta
Gamma
Normal
14 / 41
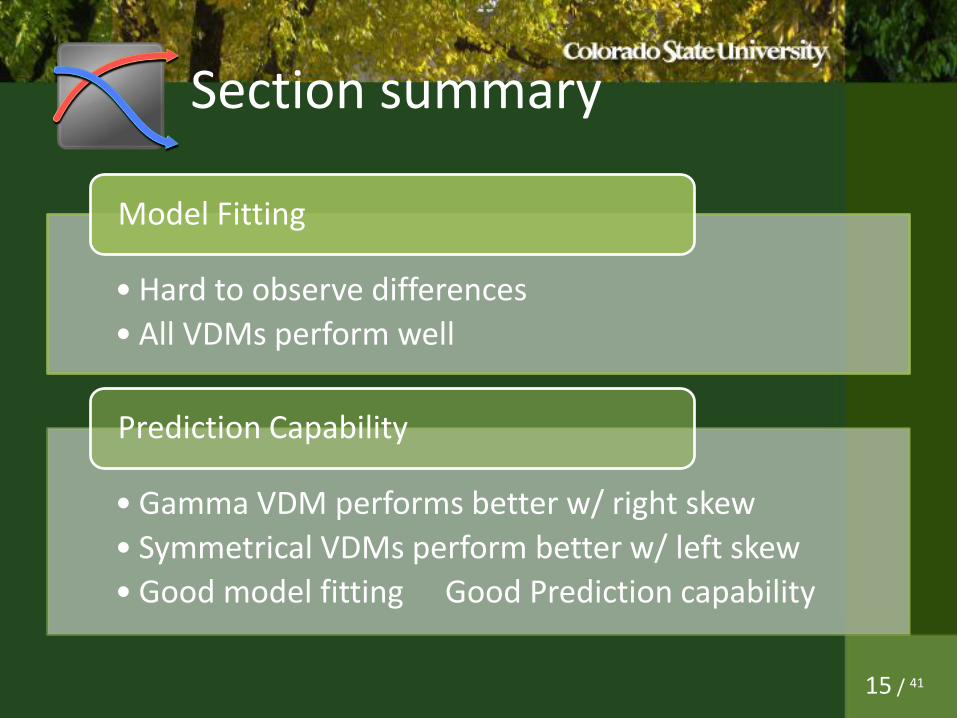
Section summary
• Hard to observe differences
• All VDMs perform well
Model Fitting
• Gamma VDM performs better w/ right skew
• Symmetrical VDMs perform better w/ left skew
• Good model fitting
Good Prediction capability
Prediction Capability
15 / 41
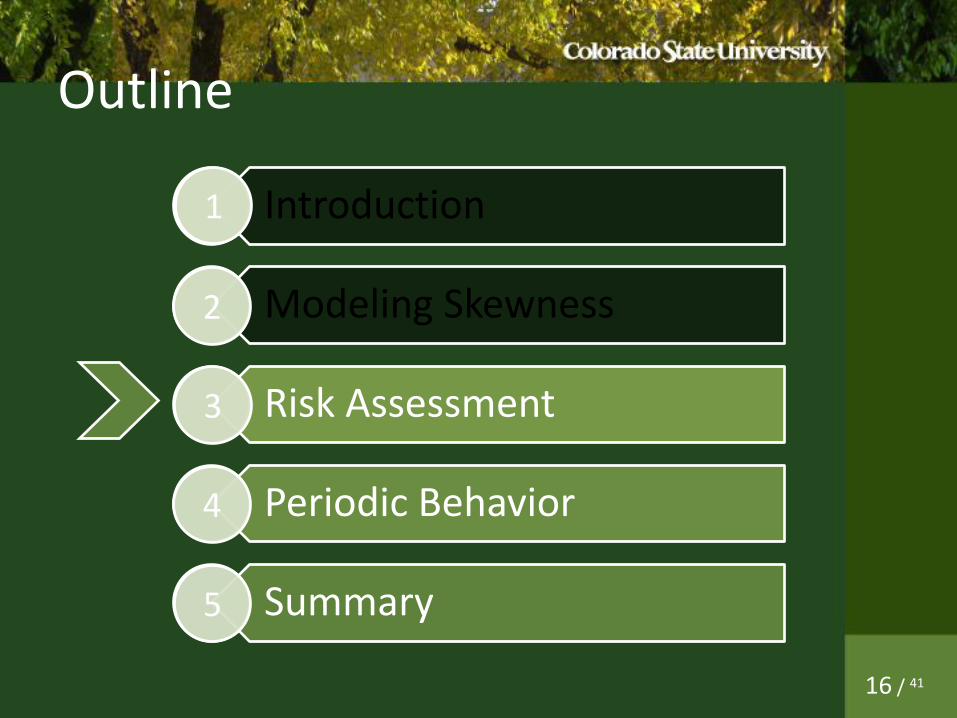
Outline
Introduction
Modeling Skewness
Risk Assessment
Periodic Behavior
Summary
1
2
3
4
5
16 / 41
Risk
•
Definition[3]
• Probability: Internal vulnerability & External threat
• Impact: Value of loss
So… it is
[3] G. Stoneburner et al. “Risk management guide for information technology systems,” NIST, Tech. Rep., 2001
17 / 41
• De facto industry standard for assessing the severity of computer security vulnerabilities
• Ranges 0.0
10.0
• Effort could be prioritized
• Consists three metric groups:
• Base (mandatory) : intrinsic and fundamental
• Temporal : change over time
• Environmental : particular user’s environment
Common Vulnerability Scoring System (CVSS)
18 / 41
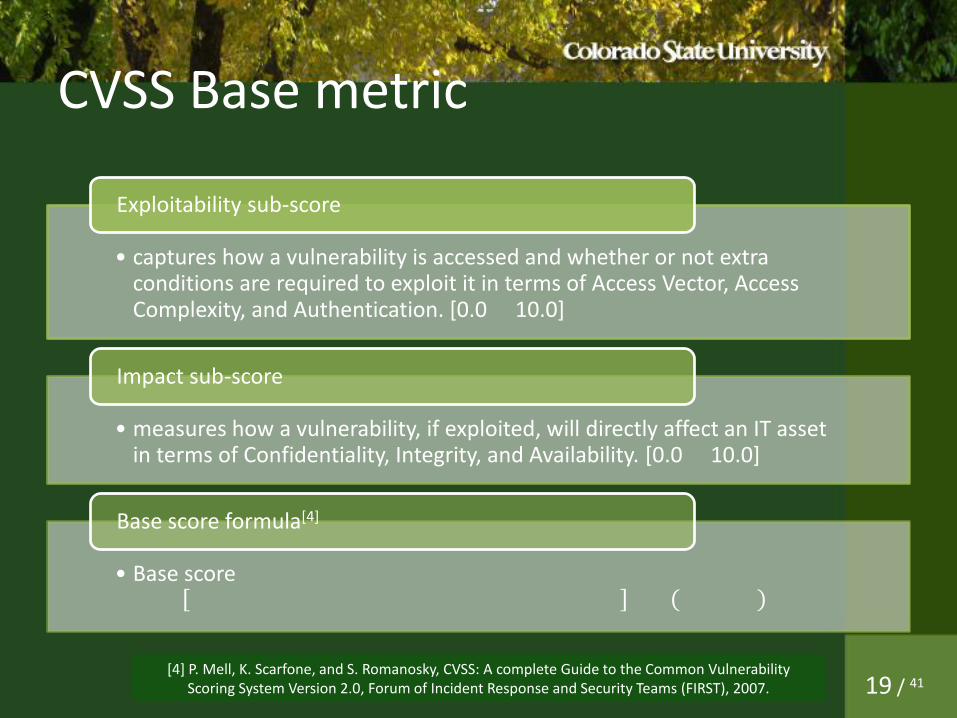
CVSS Base metric
• captures how a vulnerability is accessed and whether or not extra conditions are required to exploit it in terms of Access Vector, Access Complexity, and Authentication. [0.0
10.0]
Exploitability sub-score
• measures how a vulnerability, if exploited, will directly affect an IT asset in terms of Confidentiality, Integrity, and Availability. [0.0
10.0]
Impact sub-score
• Base score
Base score formula[4]
[4] P. Mell, K. Scarfone, and S. Romanosky, CVSS: A complete Guide to the Common Vulnerability Scoring System Version 2.0, Forum of Incident Response and Security Teams (FIRST), 2007.
19 / 41
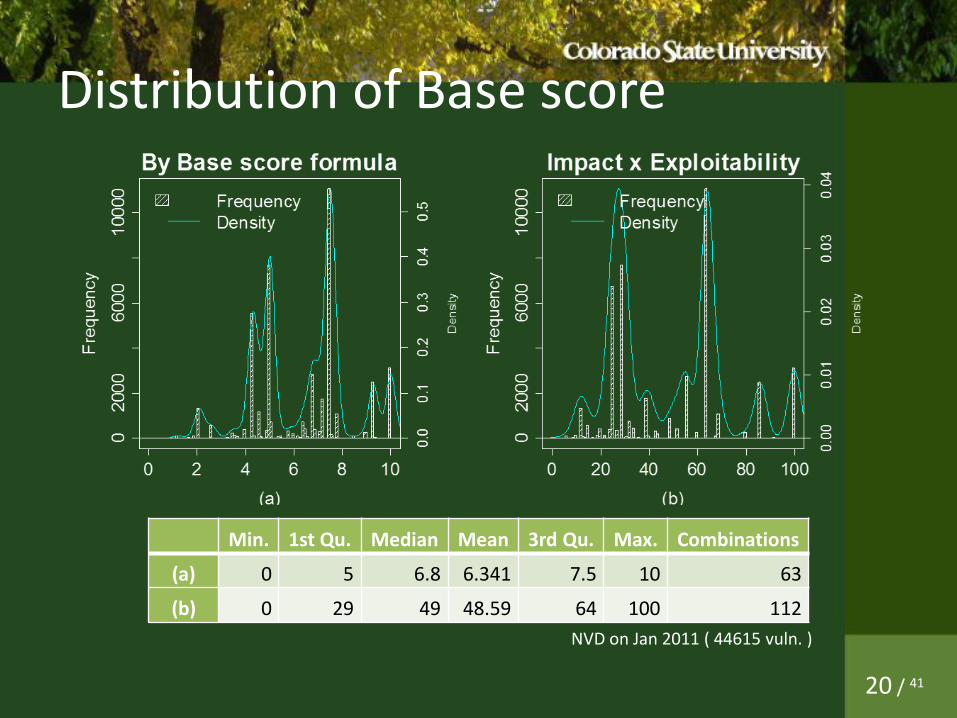
Distribution of Base score
Min. 1st Qu. Median Mean 3rd Qu. Max. Combinations
(a) 0 5 6.8 6.341 7.5 10 63
(b) 0 29 49 48.59 64 100 112 NVD on Jan 2011 ( 44615 vuln. )
20 / 41
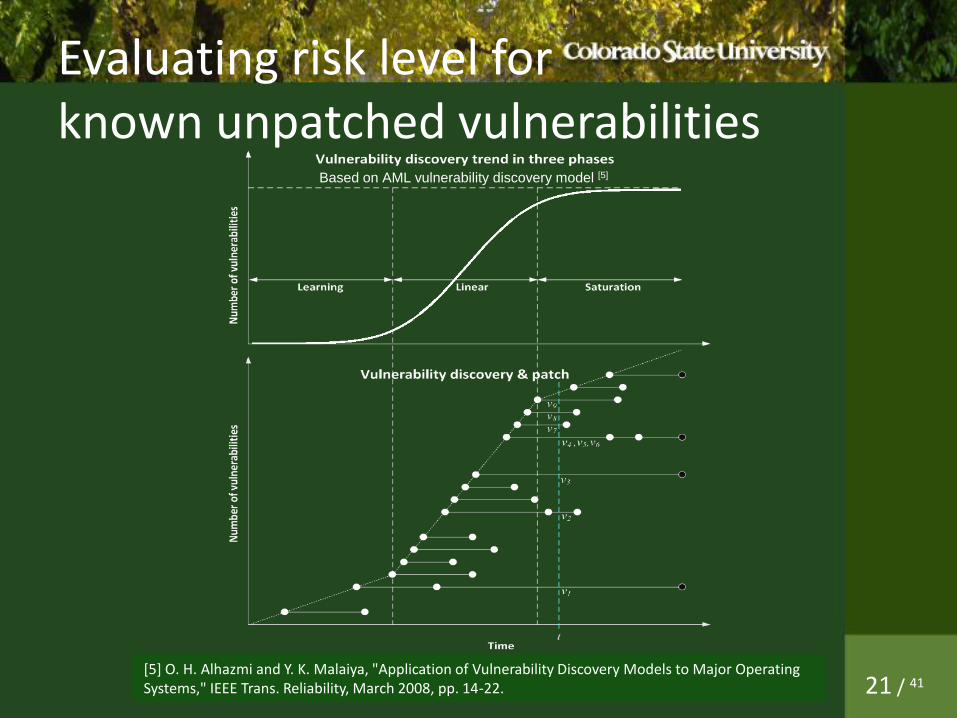
Evaluating risk level for known unpatched vulnerabilities
[5] O. H. Alhazmi and Y. K. Malaiya, "Application of Vulnerability Discovery Models to Major Operating Systems," IEEE Trans. Reliability, March 2008, pp. 14-22.
Based on AML vulnerability discovery model [5]
21 / 41
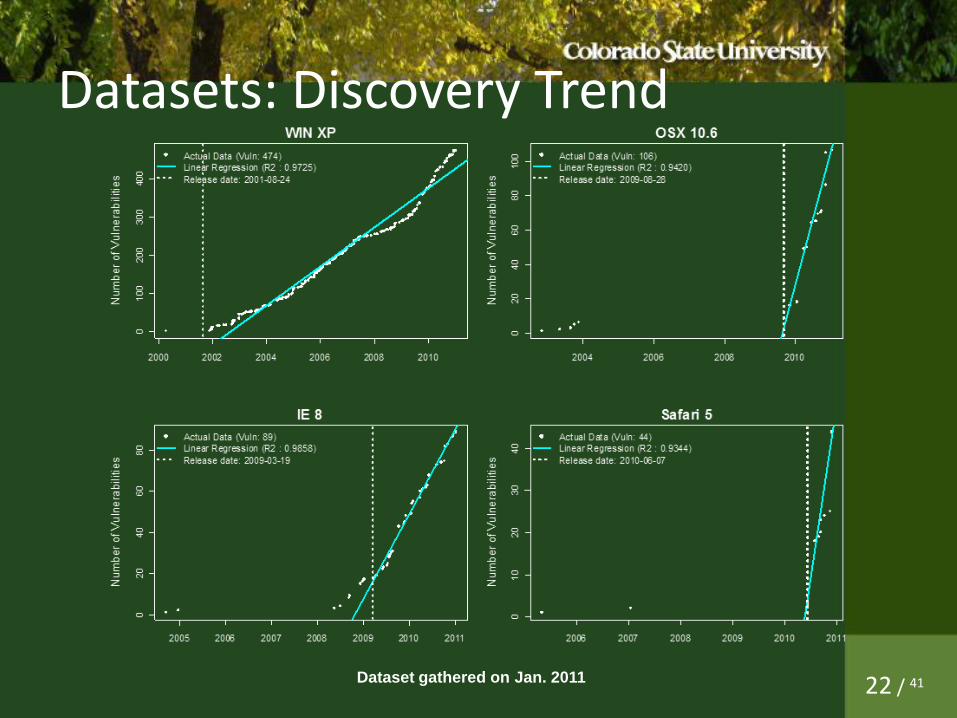
Datasets: Discovery Trend
Dataset gathered on Jan. 2011 22 / 41
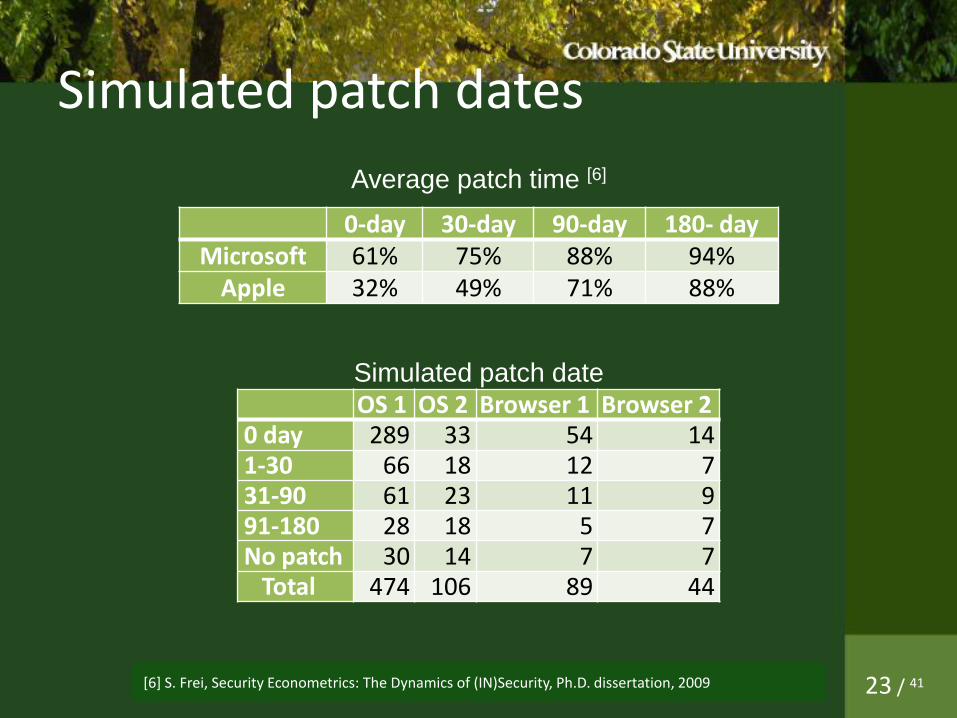
Simulated patch dates
[6] S. Frei, Security Econometrics: The Dynamics of (IN)Security, Ph.D. dissertation, 2009
0-day 30-day 90-day 180- day
Microsoft 61% 75% 88% 94%
Apple 32% 49% 71% 88%
OS 1 OS 2 Browser 1 Browser 2
0 day 289 33 54 14
1-30 66 18 12 7
31-90 61 23 11 9
91-180 28 18 5 7
No patch 30 14 7 7 Total 474 106 89 44
Average patch time [6]
Simulated patch date
23 / 41
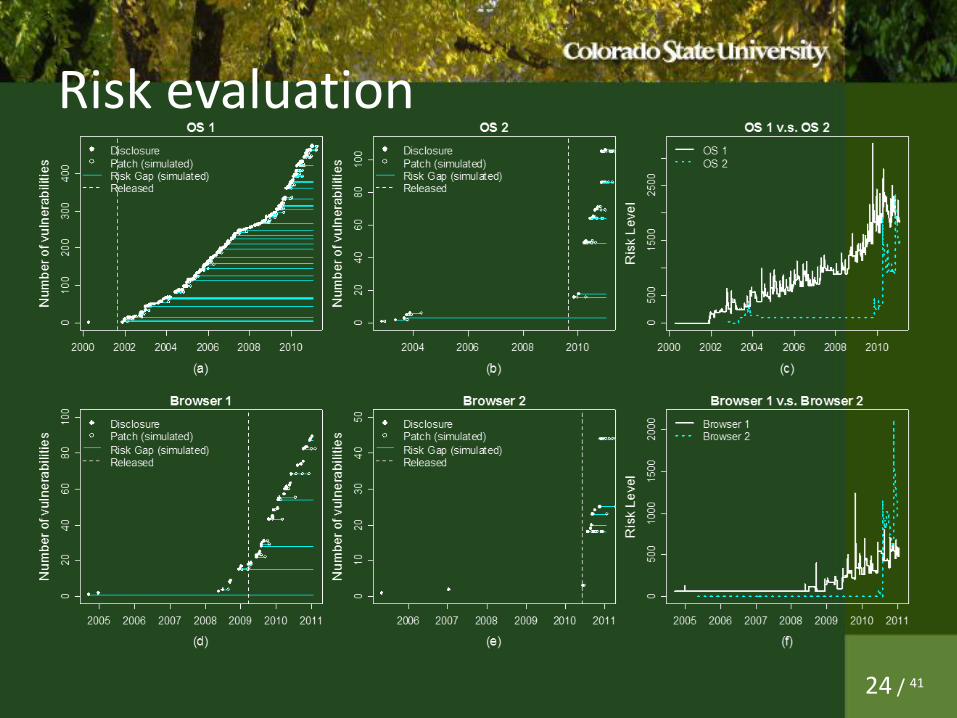
Risk evaluation
24 / 41
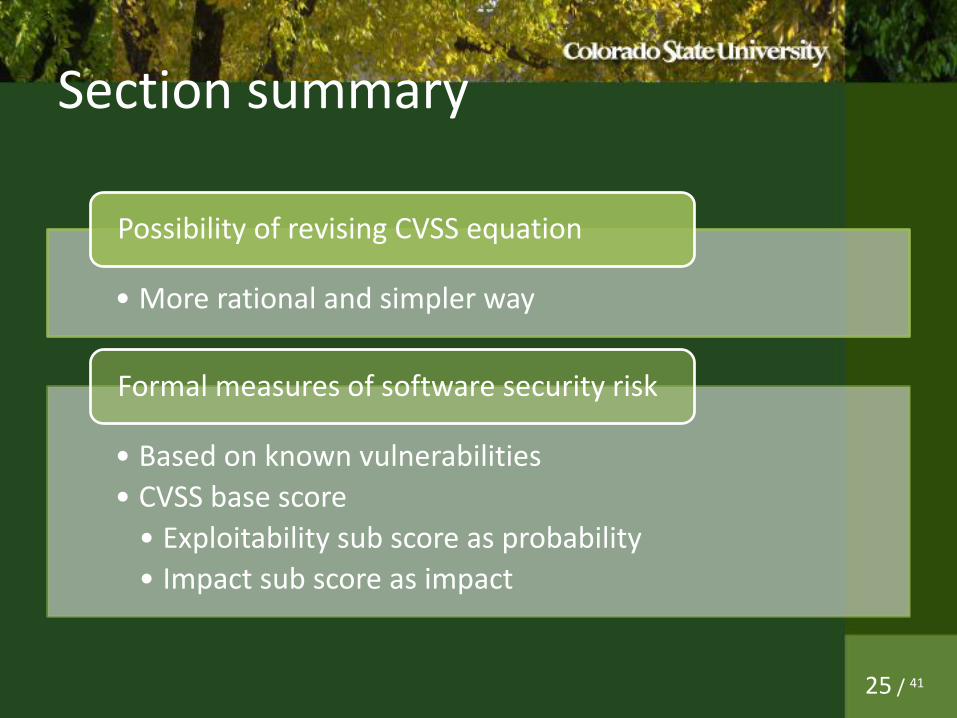
Section summary
• More rational and simpler way
Possibility of revising CVSS equation
• Based on known vulnerabilities
• CVSS base score
• Exploitability sub score as probability
• Impact sub score as impact
Formal measures of software security risk
25 / 41
Outline
Introduction
Modeling Skewness
Risk Assessment
Periodic Behavior
Summary
1
2
3
4
5
26 / 41
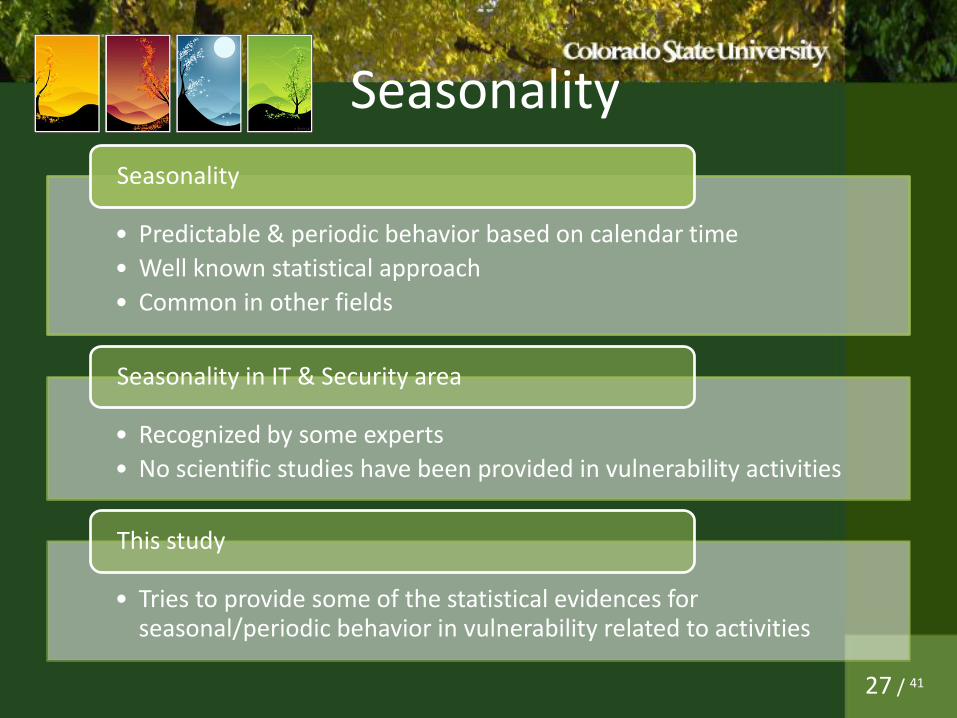
Seasonality
• Predictable & periodic behavior based on calendar time
• Well known statistical approach
• Common in other fields
Seasonality
• Recognized by some experts
• No scientific studies have been provided in vulnerability activities
Seasonality in IT & Security area
• Tries to provide some of the statistical evidences for seasonal/periodic behavior in vulnerability related to activities
This study
27 / 41
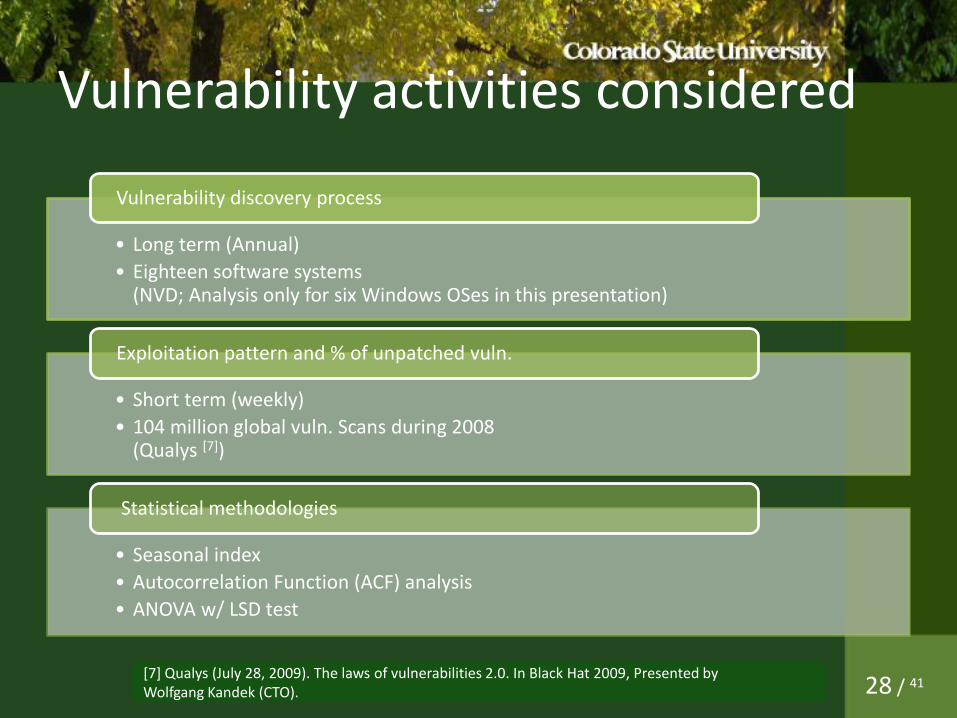
Vulnerability activities considered
• Long term (Annual)
• Eighteen software systems (NVD; Analysis only for six Windows OSes in this presentation)
Vulnerability discovery process
• Short term (weekly)
• 104 million global vuln. Scans during 2008 (Qualys [7])
Exploitation pattern and % of unpatched vuln.
• Seasonal index
• Autocorrelation Function (ACF) analysis
• ANOVA w/ LSD test
Statistical methodologies
[7] Qualys (July 28, 2009). The laws of vulnerabilities 2.0. In Black Hat 2009, Presented by Wolfgang Kandek (CTO). 28 / 41
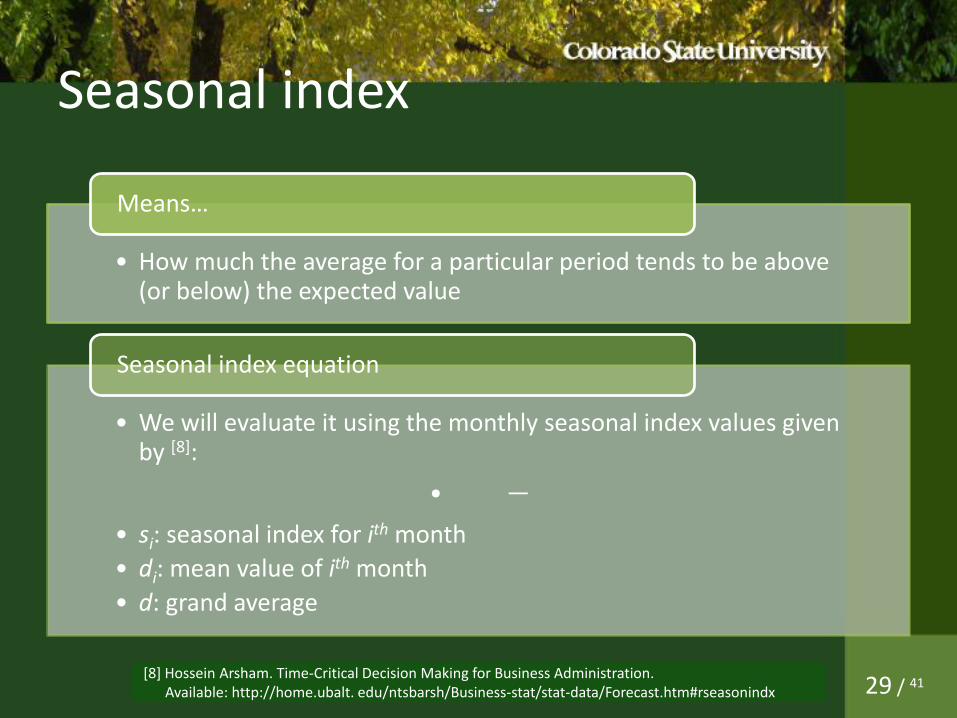
Seasonal index
• How much the average for a particular period tends to be above (or below) the expected value
Means…
• We will evaluate it using the monthly seasonal index values given by [8]:
•
• si: seasonal index for ith month
• di: mean value of ith month
• d: grand average
Seasonal index equation
[8] Hossein Arsham. Time-Critical Decision Making for Business Administration. Available: http://home.ubalt. edu/ntsbarsh/Business-stat/stat-data/Forecast.htm#rseasonindx 29 / 41

Autocorrelation function (ACF)
• With time series values of zb, zb+1, …, zn, the ACF at lag k, denoted by rk, is [9]:
•
, where
Mathematically
• Measures the linear relationship between time series observations separated by a lag of time units
In plain English
• When an ACF value is located outside of confidence intervals at a lag t, it can be thought that every lag t, there is a relationships along with the time line
For the analysis
[9] B. L. Bowerman and R. T. O'connell, Time Series Forecsting: Unified concepts and computer implementation. 2nd Ed., Boston: Duxbury Press, 1987 30 / 41
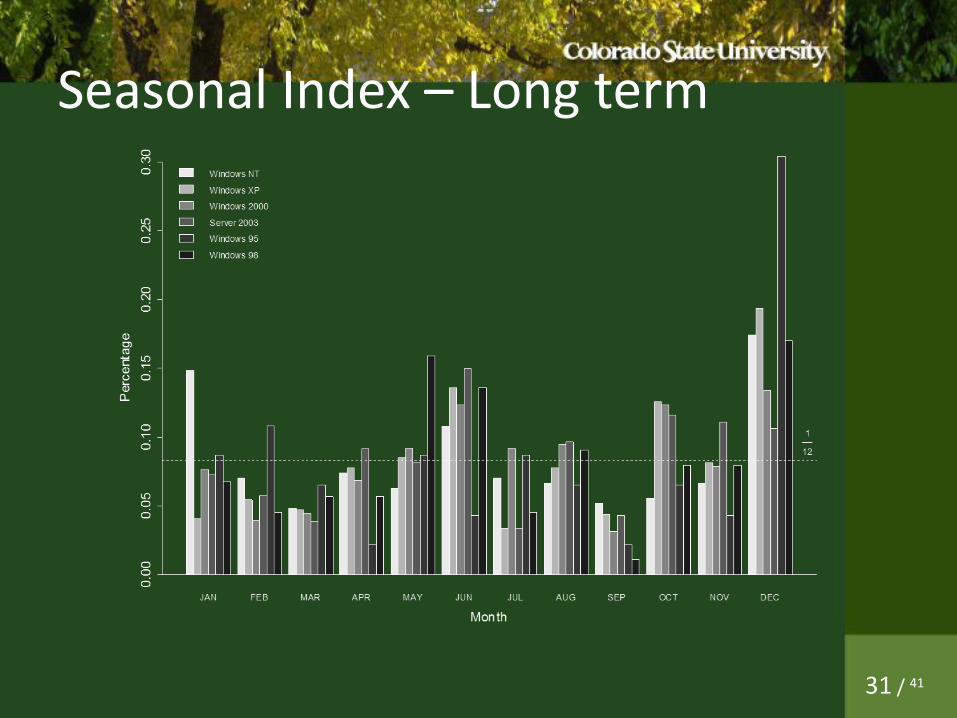
Seasonal Index – Long term
31 / 41
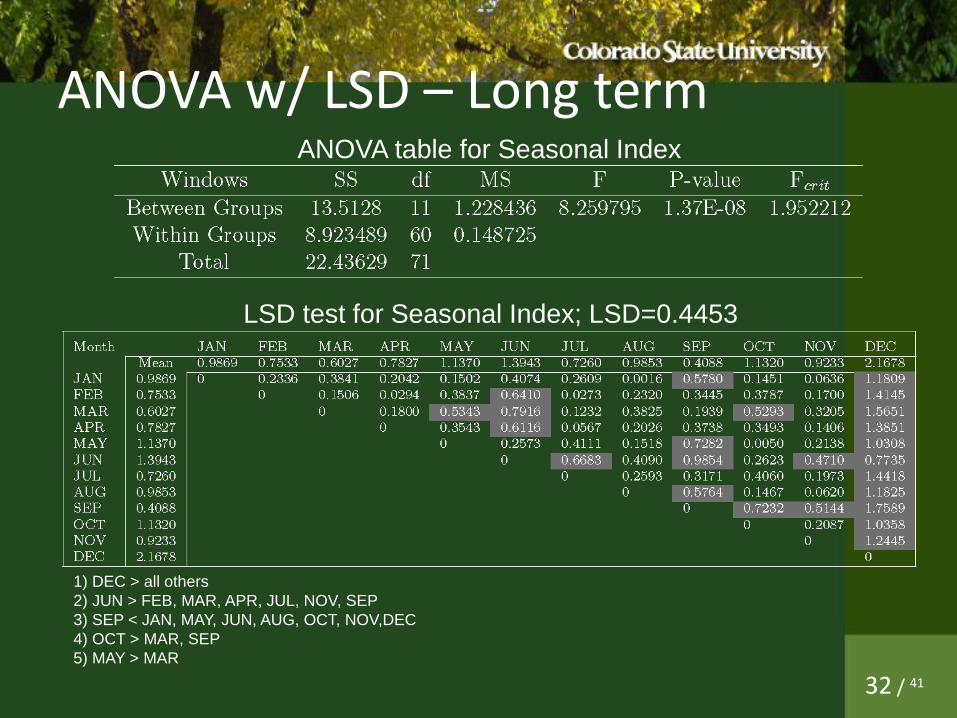
ANOVA w/ LSD – Long term ANOVA table for Seasonal Index
LSD test for Seasonal Index; LSD=0.4453
1) DEC > all others
2) JUN > FEB, MAR, APR, JUL, NOV, SEP
3) SEP < JAN, MAY, JUN, AUG, OCT, NOV,DEC
4) OCT > MAR, SEP
5) MAY > MAR
32 / 41

ACF – Long term
Individual ACF values for Windows OSes
33 / 41
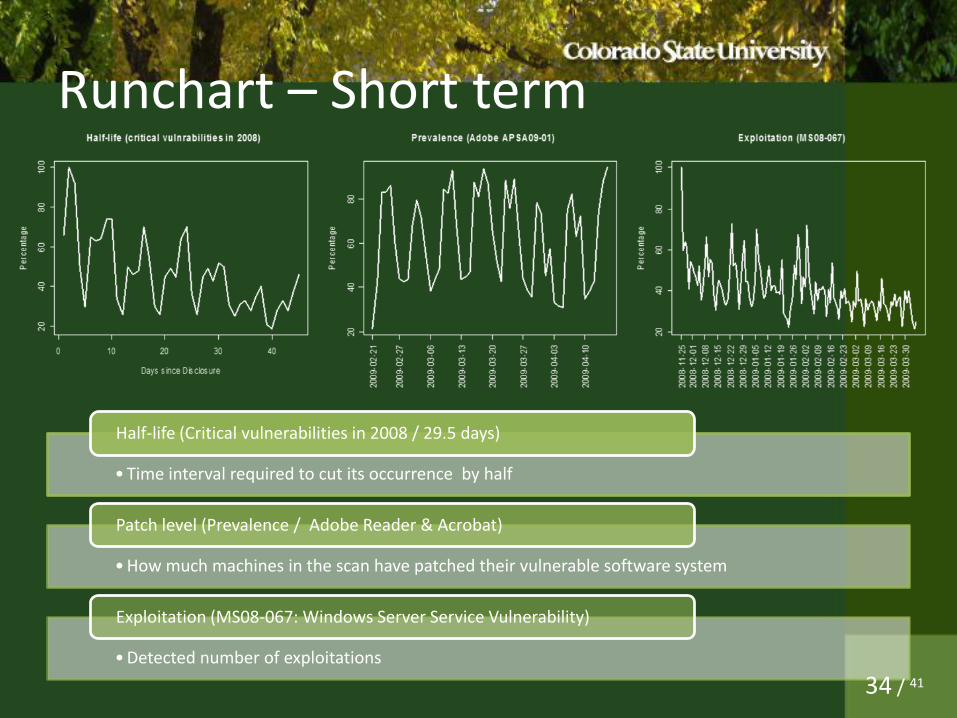
Runchart – Short term
• Time interval required to cut its occurrence by half
Half-life (Critical vulnerabilities in 2008 / 29.5 days)
• How much machines in the scan have patched their vulnerable software system
Patch level (Prevalence / Adobe Reader & Acrobat)
• Detected number of exploitations
Exploitation (MS08-067: Windows Server Service Vulnerability)
34 / 41
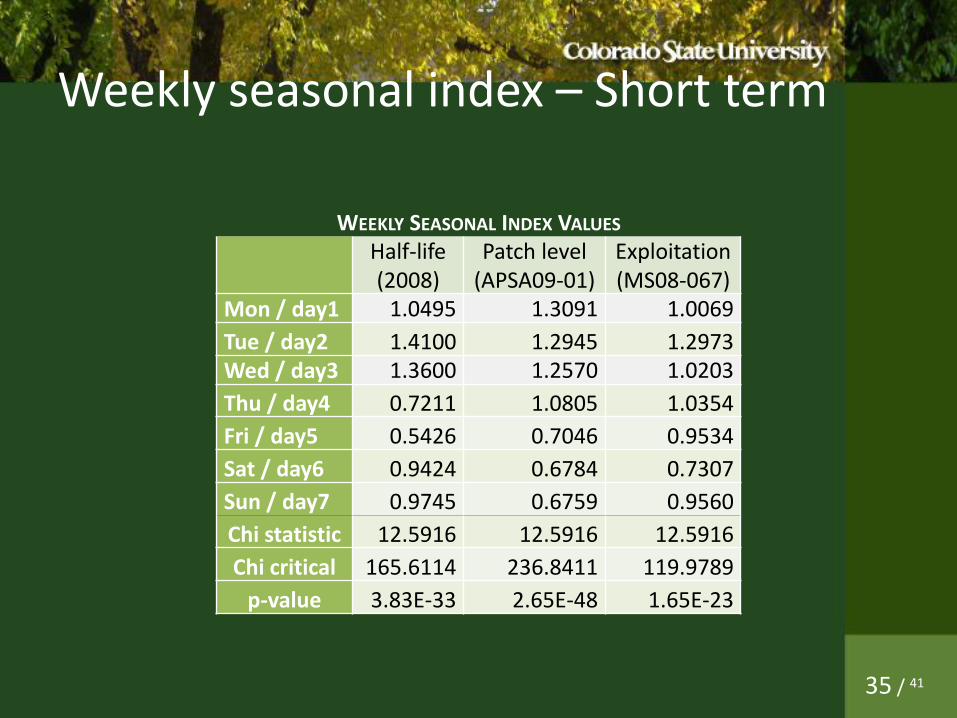
Weekly seasonal index – Short term
WEEKLY SEASONAL INDEX VALUES
Half-life (2008)
Patch level (APSA09-01)
Exploitation (MS08-067)
Mon / day1 1.0495 1.3091 1.0069
Tue / day2 1.4100 1.2945 1.2973
Wed / day3 1.3600 1.2570 1.0203
Thu / day4 0.7211 1.0805 1.0354
Fri / day5 0.5426 0.7046 0.9534
Sat / day6 0.9424 0.6784 0.7307
Sun / day7 0.9745 0.6759 0.9560
Chi statistic 12.5916 12.5916 12.5916
Chi critical 165.6114 236.8411 119.9789
p-value 3.83E-33 2.65E-48 1.65E-23
35 / 41

ACF – Short term
Very strong seven day periodic pattern !
7
14 21
7 14 21
7 14
21
36 / 41
Section summary
• Vulnerability discovery process (peak in mid-year & year-end)
• Percentage of patch level (Peak in Weekdays)
• Exploitation pattern (Peak in Weekdays)
Statistically significant periodic behaviors
37 / 41
Outline
Introduction
Modeling Skewness
Risk Assessment
Periodic Behavior
Summary
1
2
3
4
5
38 / 41
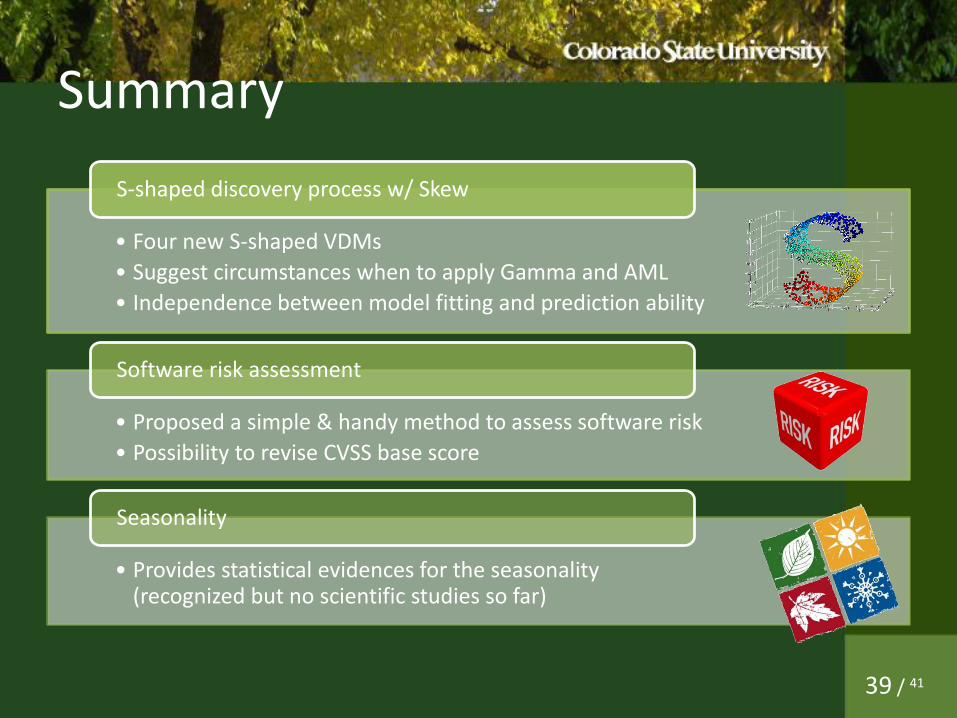
Summary
• Four new S-shaped VDMs
• Suggest circumstances when to apply Gamma and AML
• Independence between model fitting and prediction ability
S-shaped discovery process w/ Skew
• Proposed a simple & handy method to assess software risk
• Possibility to revise CVSS base score
Software risk assessment
• Provides statistical evidences for the seasonality (recognized but no scientific studies so far)
Seasonality
39 / 41

Future works
• Continually observe software vulnerability related activities
In general
• Mathematical analysis on constant discovery growth rates influenced by elements such as market share, software age and evolution, etc.
• Correlations between model parameters & software types
• Applying accurate patch information for assessing the risk model
• Non-homogeneous Semi-Markov process in risk assessment
• Possible enhancement of VDMs’ predicting ability by the longer and shorter seasonal fluctuations
• Etc.
Specifically
40 / 41

•Questions?
•Comments?
•Suggestions?
Thank you.
41 / 41