Embed Size (px)
Citation preview

Computational Quantitative Structure-Activity Relationship Analyses and
Docking to Tubulin of Discodermolide, Dictyostatin-1 and Synthetic Analogues
Tristan R. Richards1,2 and Billy W. Day3
1Department of Bioengineering, The Pennsylvania State University,University Park, PA 16801
2Bioengineering and Bioinformatics Summer Institute, Center for Computational Biology and Bioinformatics, University of Pittsburgh, Pittsburgh, PA 15261
3Departments of Chemistry and Pharmaceutical Sciences, University of Pittsburgh, Pittsburgh, PA 15261

Topics Discussed
• Purpose• Microtubule Stabilizing Structures• Hypothesis• Methods• Results• Conclusions• References• Acknowledgements
Purpose• FACT: the stabilization of microtubules, cytoskeletal polymers that
consist of tubulin heterodimers, leads to altered or blocked cell division, which then leads to apoptosis, cell death
• RESULT: microtubule stabilizers make good anticancer agents

Microtubule Stabilizer Structures
O
O
O
O
HO
O
O O
OH
O
NOH
O O
H
H
O
S
N
O
O
O
R
O
OH
OH
O
O
O
OAc
OH
OH
OC H3
O
N
NH
H
O
O
O ROH
O
N
NH
H
O
O
O
OH
OH
O OH O
NH2
O
HO OH
O
OH
O
OOH
OH
OH
OHO
O
s arc o dic ty inA: R = C H3B: R = H
ep ot hilon eA: R = HB: R = C H3
e leu th e robin
pac litaxe l
(+ )-dis c ode rm olide laulimalide
2-e th oxy -7-ke t o-17β-es t radiol
dic t yo s tatin -1
O
H3C OOH
O
O
OH
OC H3
OH
OCH3
OH
pe lorus ide A
O
OH
HO
OH
OH
O

Microtubule Stabilizing Structures: Smith Analogues

Microtubule Stabilizing Structures: Smith Analogues
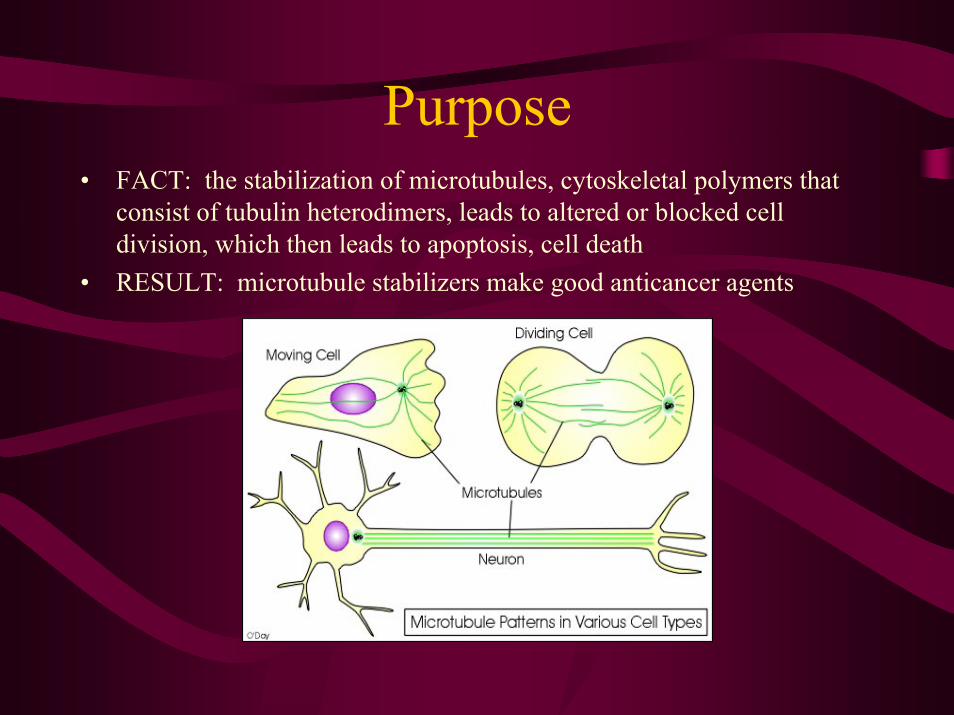
HypothesisDictyostatin 1 is capable of binding to αβ-tubulin at the same site as discodermolide.
• Discodermolide (DCD)– Polyhydroxylated alkatetraene lactone antimitotic natural product isolated
from the marine sponge Discodermia dissolute– Attempts to acquire practically useful quantities have failed; totally
synthetic (+)-discodermolide is necessary• Dictyostatin-1 (DCT1)
– Isolated from Carallistadea sponges and stabilizes microtubules in the same manner as DCD
– Same relative and absolute stereochemistry of DCD
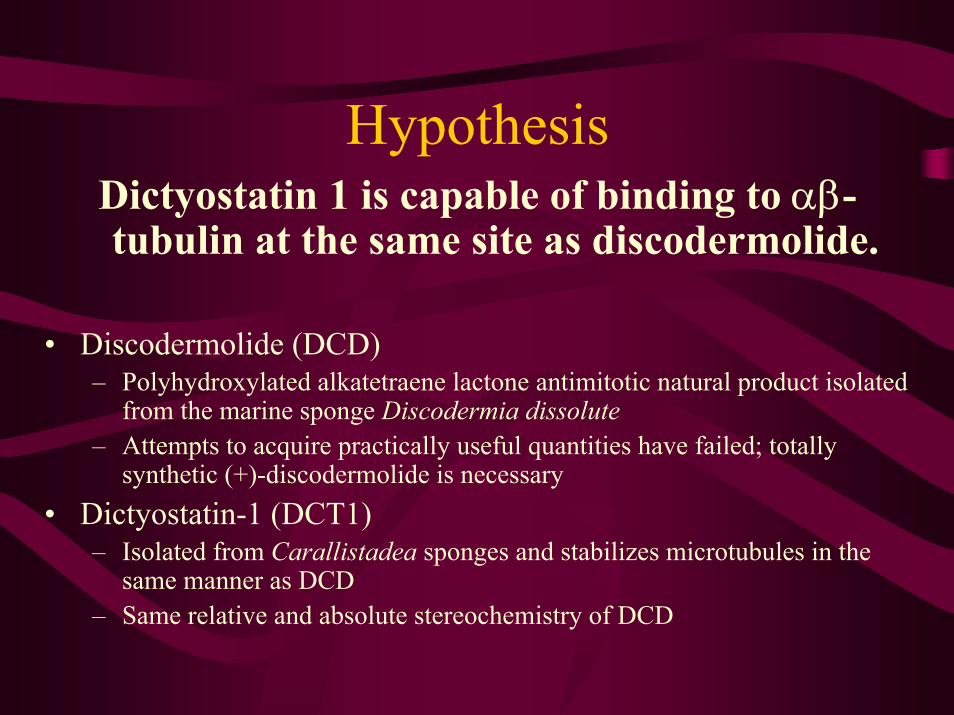
Hypothesis Continued…
• Superimposed image of models of DCD and DCT1
• DCD and DCT1 are very similar in structure– DCD (yellow)– DCT1 (white)
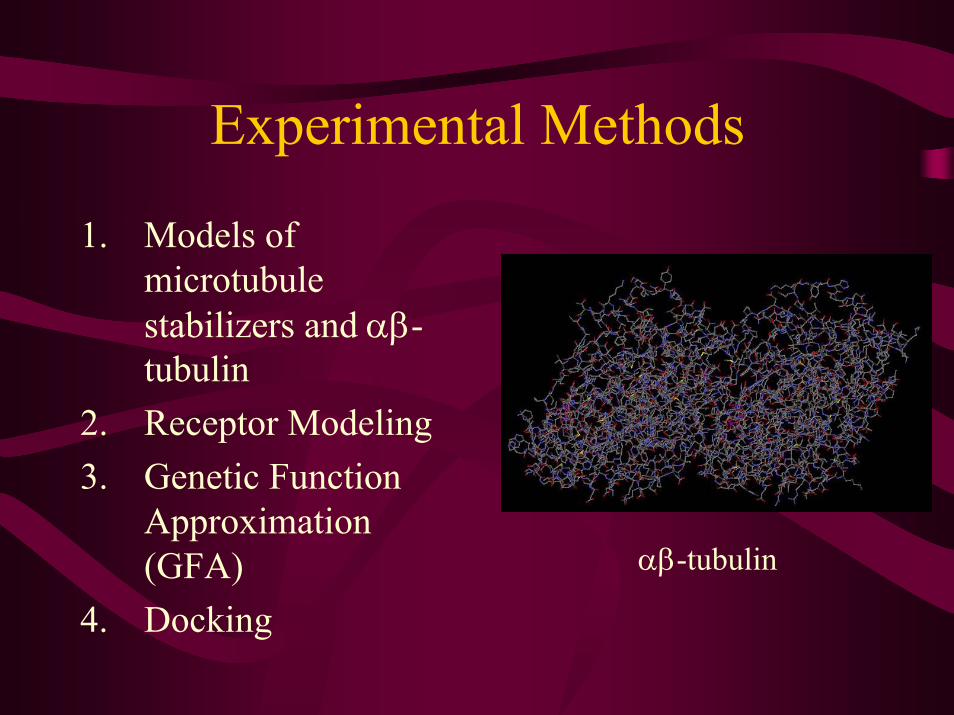
Experimental Methods
1. Models of microtubule stabilizers and αβ-tubulin
2. Receptor Modeling3. Genetic Function
Approximation (GFA)
4. Docking
αβ-tubulin
1. Models of Microtubule Stabilizers and αβ-tubulin
• Using Cerius2 (Accelrys) molecular modeling suite, models of the following related microtubule stabilizers were built:– Dictyostatin-1– Discodermolide– Synthetic discodermolide analogues (ex. Smith1, Smith2, etc.)
• The models were then analyzed for low energy conformers with the Merck Molecular Force Field (MMFF); minimizations were all performed the same way
• Next, a computer model of the highest resolution electron crystallographic structure of αβ-tubulin was made from the coordinates deposited in the Brookhaven Protein Data Bank
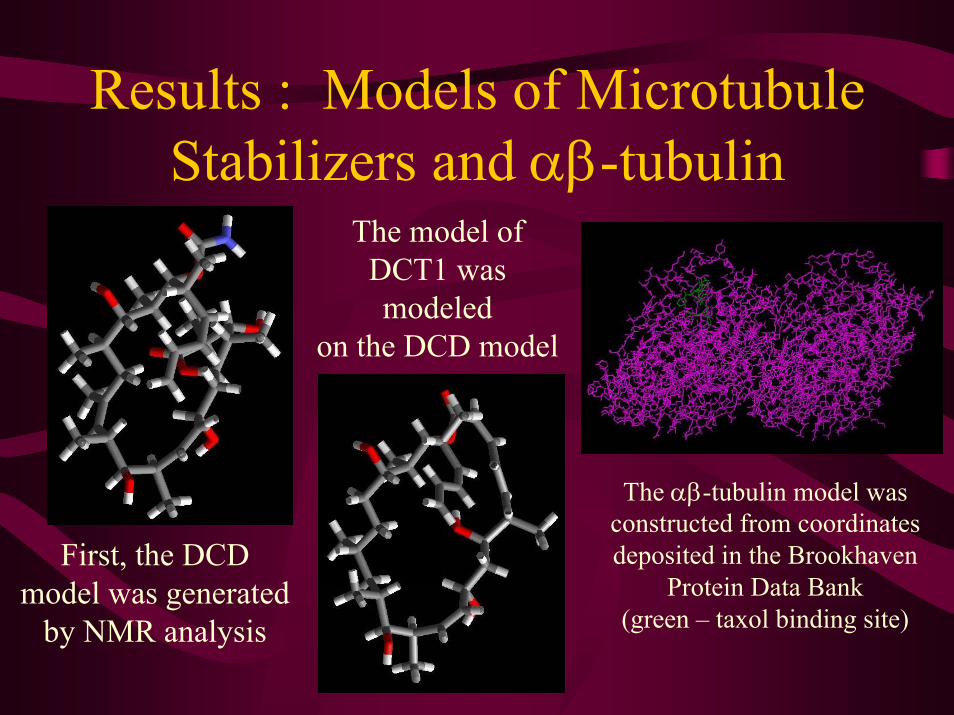
Results : Models of Microtubule Stabilizers and αβ-tubulin
The model of DCT1 was modeled
on the DCD model
The αβ-tubulin model was constructed from coordinates deposited in the Brookhaven
Protein Data Bank(green – taxol binding site)
First, the DCD model was generated
by NMR analysis
2. Receptor Modeling
• After the structures were superimposed and weighted by their respective biological activities (antiproliferative potencies against breast carcinoma cells), a receptor model was generated
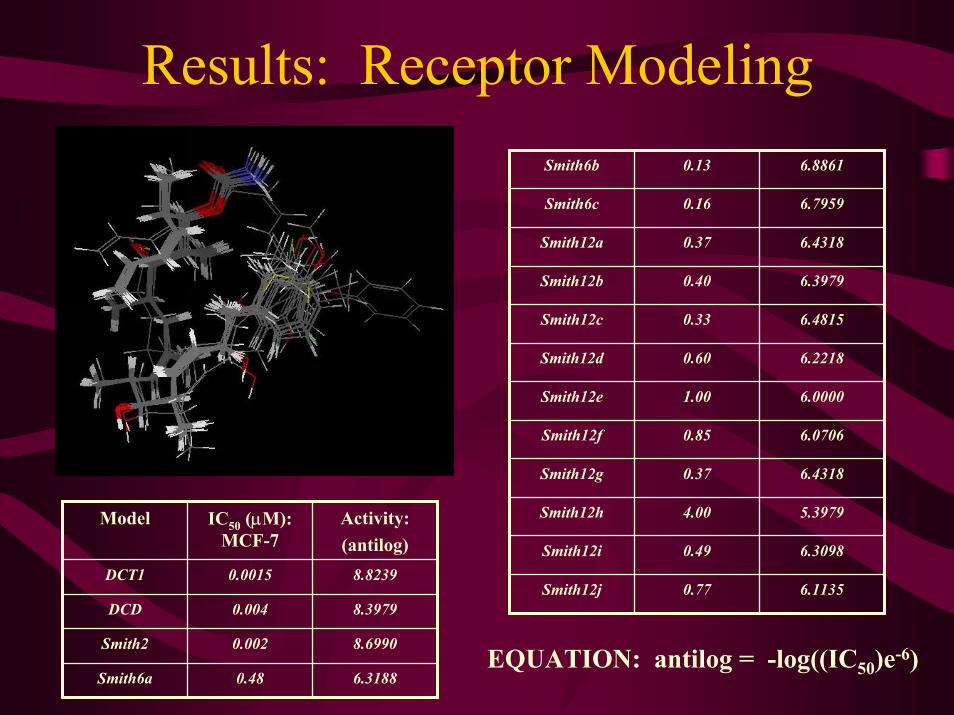
Results: Receptor Modeling6.88610.13Smith6b
6.79590.16Smith6c
6.11350.77Smith12j
6.43180.37Smith12a
6.39790.40Smith12b
6.30980.49Smith12i
5.39794.00Smith12h
6.07060.85Smith12f
6.48150.33Smith12c
6.43180.37Smith12g
6.00001.00Smith12e
6.22180.60Smith12d
8.82390.0015DCT1
Activity:(antilog)
IC50 (µM): MCF-7
Model
6.31880.48Smith6a
8.69900.002Smith2
8.39790.004DCD
EQUATION: antilog = -log((IC50)e-6)
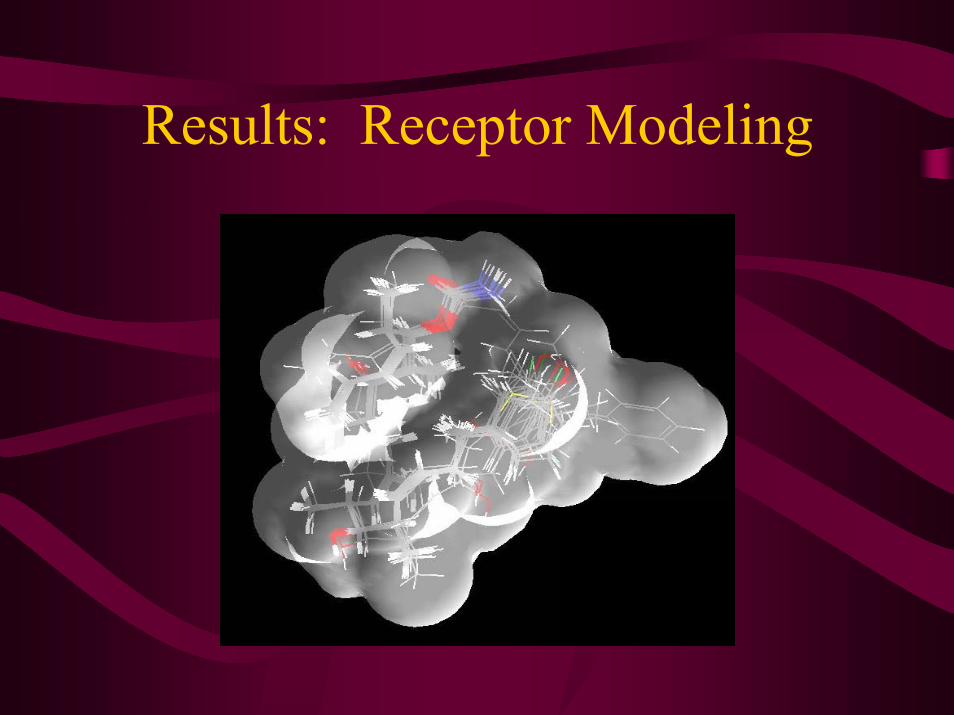
Results: Receptor Modeling
2. Receptor Modeling• Grid point interaction energies were calculated from the model
– “TOT/#” term (InterEnergy)• Grid point interaction energies• Total nonbond energy between molecule and receptor
• Shape, electronic, and thermodynamic descriptors were calculatedfrom the model– HOMO (Highest Occupied Molecular Orbital)
• Highest energy level in the molecule that contains electrons• High HOMOs are more able to donate their electrons and are more reactive
than low HOMOs– LUMO (Lowest Unoccupied Molecular Orbital)
• Lowest energy level in the molecule that contains electrons• Low LUMOs are more able to accept electrons
– AlogP98• Log of the partition coefficient, atom-type value
– Rotlbonds• Number of rotateable bonds
3. Genetic Function Approximation (GFA)
• Genetic function approximation was used to find the quantitative structure-activity relationship (QSAR) equations with the best statistics
• Predictive capacities of these equations gleaned from this learning set were tested on chemicals (with known activities) outside of the learning set
Results: Genetic Function Approximation (GFA)
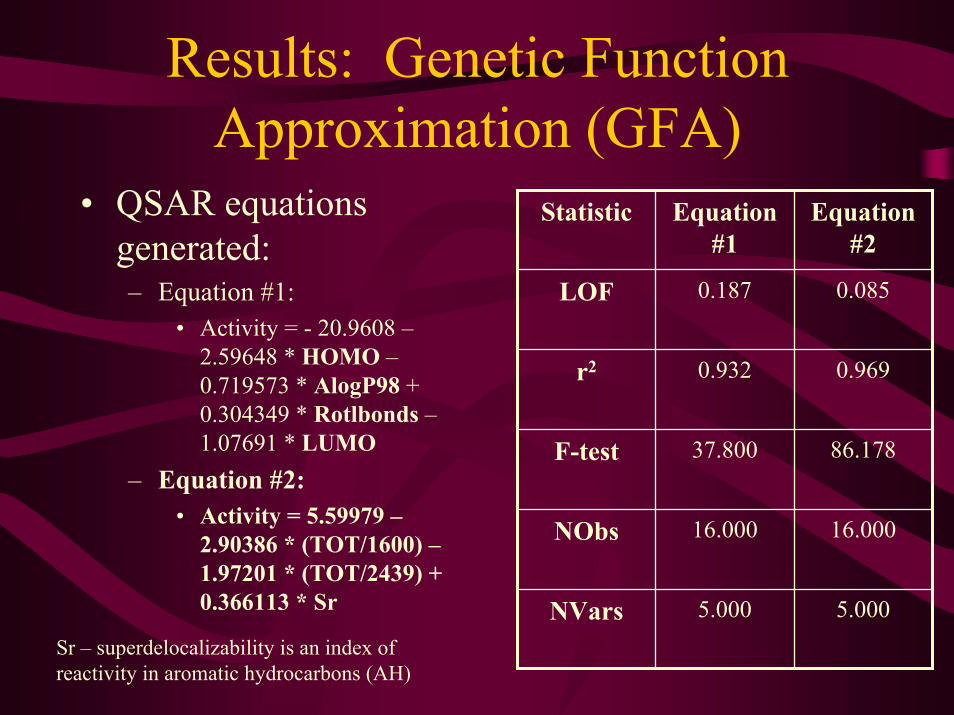
• QSAR equations generated:– Equation #1:
• Activity = - 20.9608 –2.59648 * HOMO –0.719573 * AlogP98 + 0.304349 * Rotlbonds –1.07691 * LUMO
– Equation #2:• Activity = 5.59979 –
2.90386 * (TOT/1600) –1.97201 * (TOT/2439) + 0.366113 * Sr
0.0850.187LOF
Equation #2
Equation #1
Statistic
0.9690.932r2
5.0005.000NVars
16.00016.000NObs
86.17837.800F-test
Sr – superdelocalizability is an index of reactivity in aromatic hydrocarbons (AH)
Results: Genetic Function Approximation (GFA)
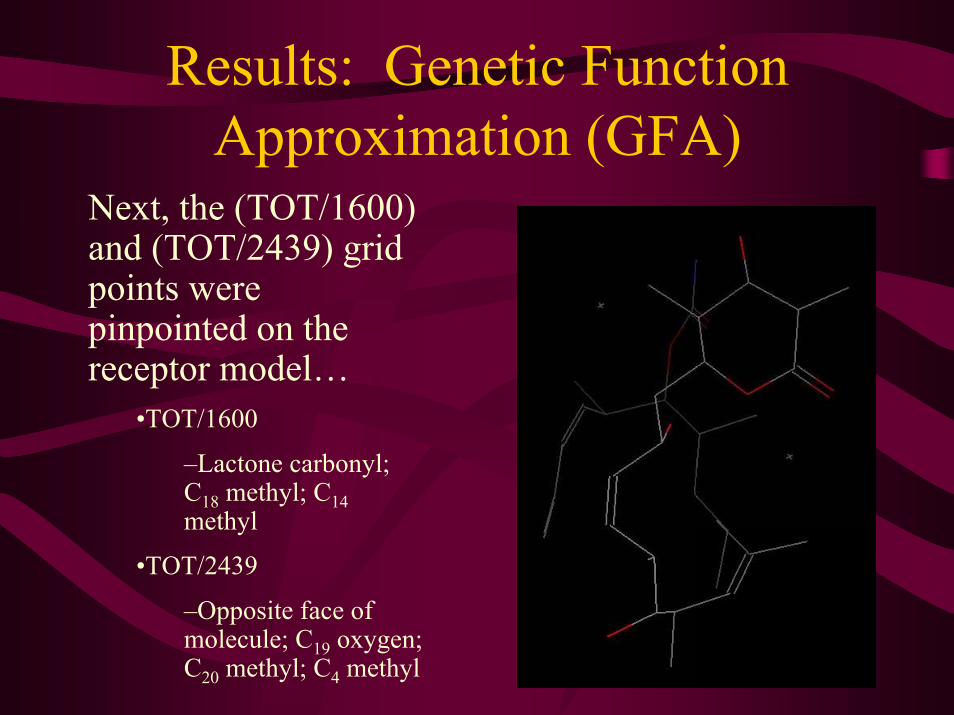
Next, the (TOT/1600) and (TOT/2439) grid points were pinpointed on the receptor model…
•TOT/1600
–Lactone carbonyl; C18 methyl; C14methyl
•TOT/2439
–Opposite face of molecule; C19 oxygen; C20 methyl; C4 methyl
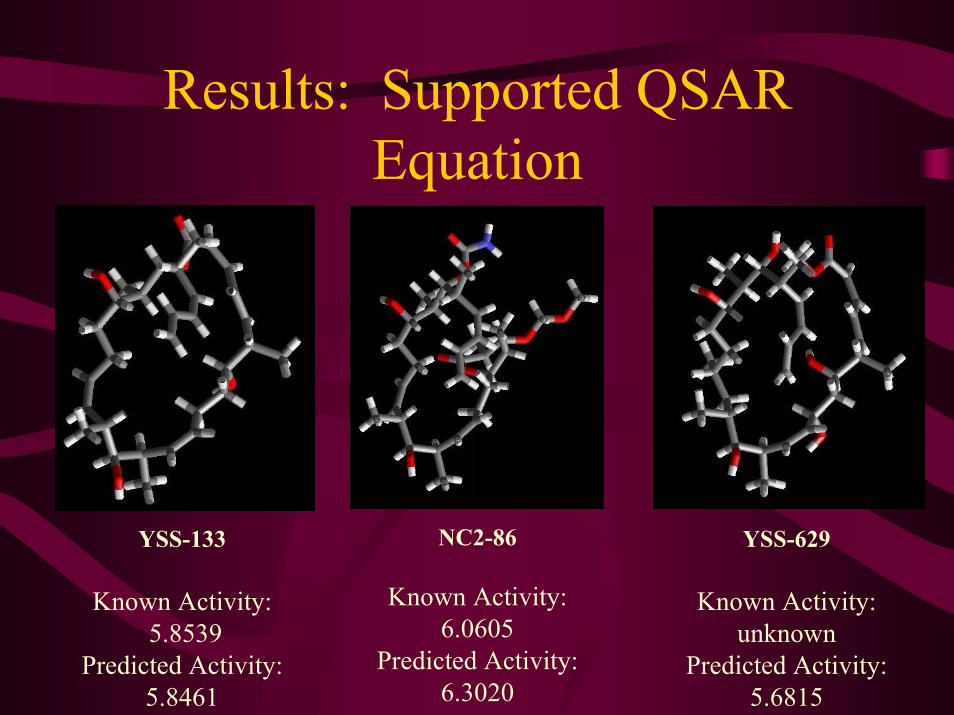
Results: Supported QSAR Equation
NC2-86
Known Activity:6.0605
Predicted Activity:6.3020
YSS-133
Known Activity:5.8539
Predicted Activity:5.8461
YSS-629
Known Activity:unknown
Predicted Activity:5.6815
4. Docking• The GOLD version 2.1 algorithm, which also
employs the genetic function approximation, was used to dock the microtubule stabilizing models to a model of the αβ-tubulin heterodimer built from coordinates determined by high resolution cryoelectron microscopy
• Energetics of the different orientations within the binding site were calculated
• Docking statistics were used with biological activity values in order to form a quantitative relationship
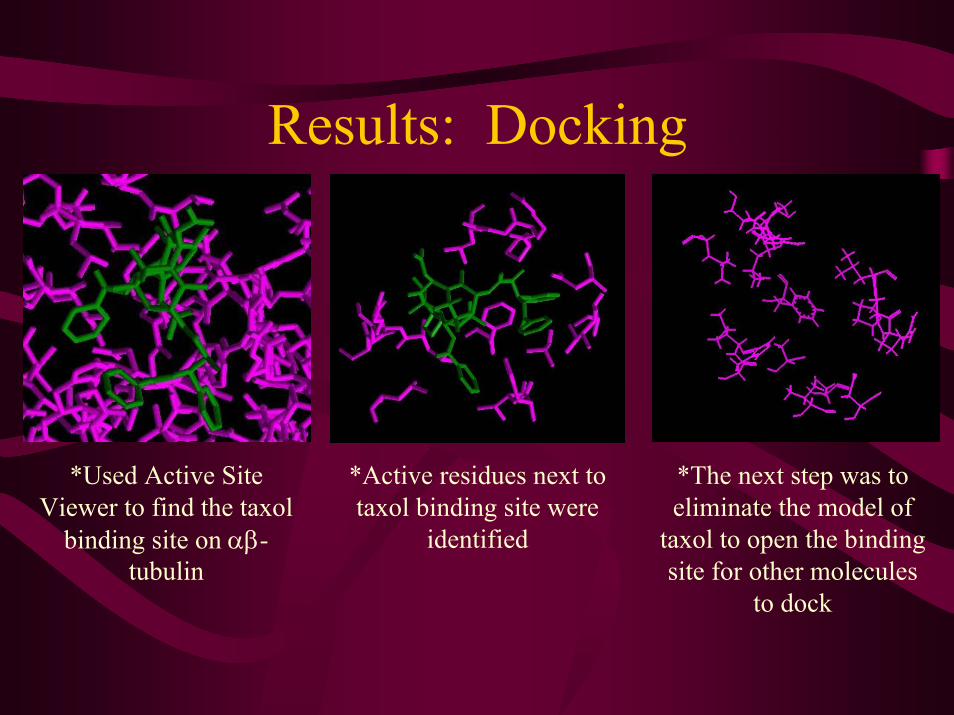
Results: Docking
*Used Active Site Viewer to find the taxol
binding site on αβ-tubulin
*Active residues next to taxol binding site were
identified
*The next step was to eliminate the model of
taxol to open the binding site for other molecules
to dock
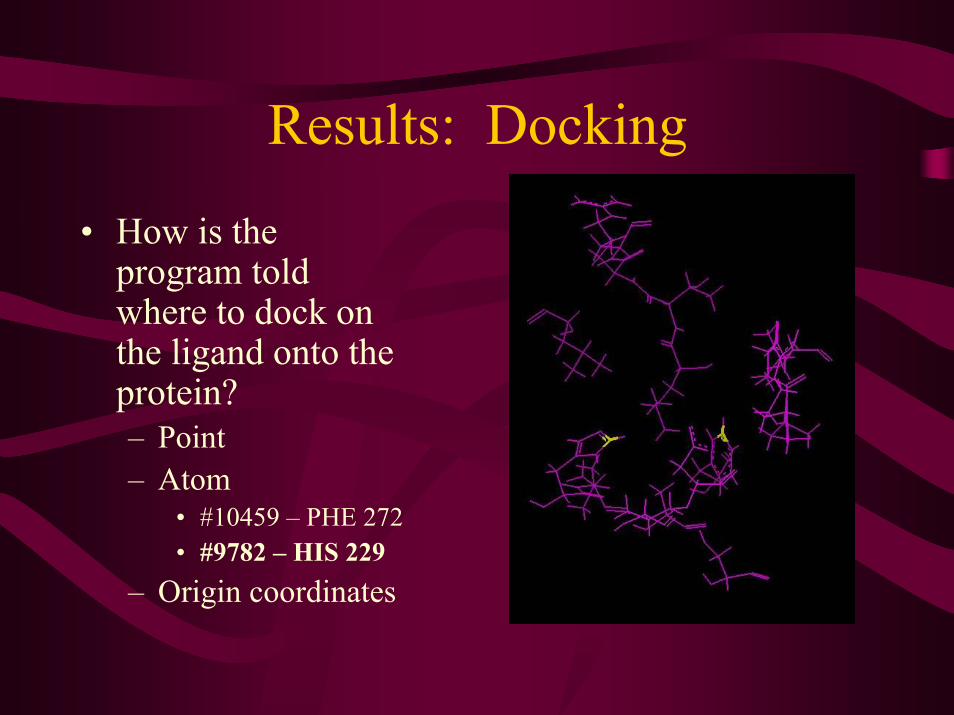
Results: Docking
• How is the program told where to dock on the ligand onto the protein?– Point– Atom
• #10459 – PHE 272• #9782 – HIS 229
– Origin coordinates
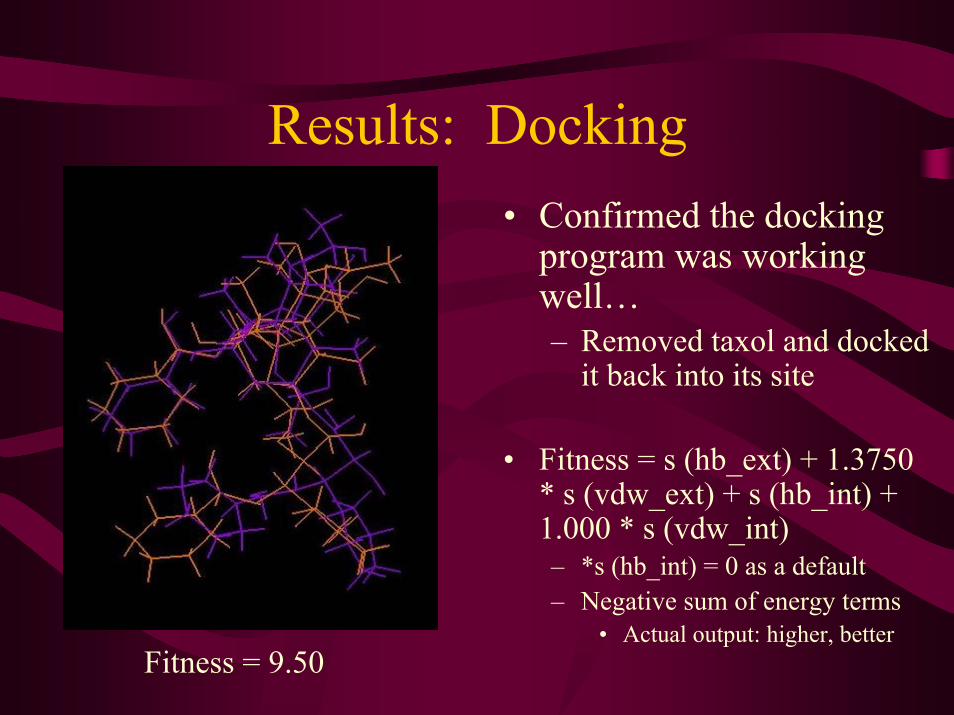
Results: Docking• Confirmed the docking
program was working well…– Removed taxol and docked
it back into its site
• Fitness = s (hb_ext) + 1.3750 * s (vdw_ext) + s (hb_int) + 1.000 * s (vdw_int)– *s (hb_int) = 0 as a default– Negative sum of energy terms
• Actual output: higher, betterFitness = 9.50
Results: Docking
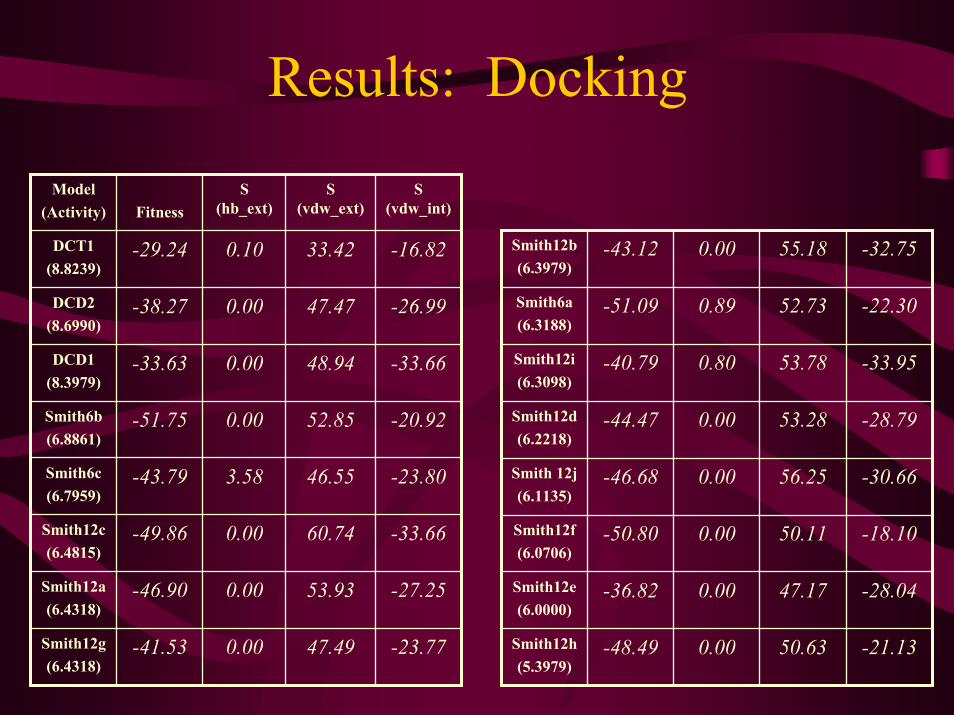
-16.8233.420.10-29.24DCT1(8.8239)
-23.7747.490.00-41.53Smith12g(6.4318)
-27.2553.930.00-46.90Smith12a(6.4318)
-33.6660.740.00-49.86Smith12c(6.4815)
-23.8046.553.58-43.79Smith6c(6.7959)
-20.9252.850.00-51.75Smith6b(6.8861)
S (vdw_int)
S (vdw_ext)
S (hb_ext)Fitness
Model(Activity)
-26.9947.470.00-38.27DCD2(8.6990)
-33.6648.940.00-33.63DCD1(8.3979)
-21.1350.630.00-48.49Smith12h(5.3979)
-22.3052.730.89-51.09Smith6a(6.3188)
-32.7555.180.00-43.12Smith12b(6.3979)
-18.1050.110.00-50.80Smith12f(6.0706)
-30.6656.250.00-46.68Smith 12j(6.1135)
-33.9553.780.80-40.79Smith12i(6.3098)
-28.0447.170.00-36.82Smith12e(6.0000)
-28.7953.280.00-44.47Smith12d(6.2218)
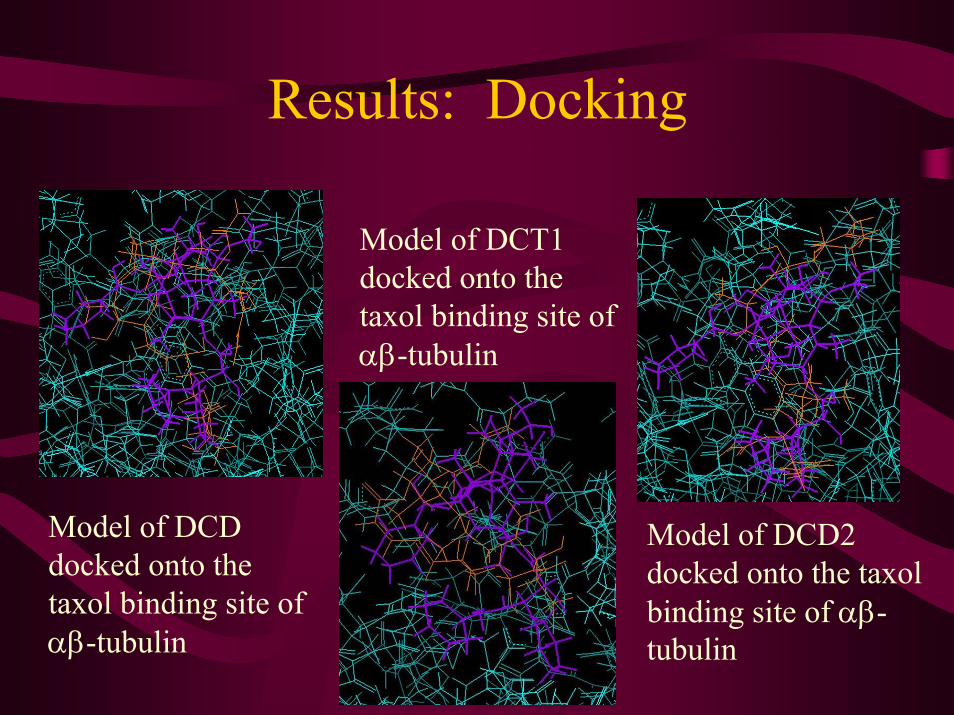
Results: Docking
Model of DCT1 docked onto the taxol binding site of αβ-tubulin
Model of DCD docked onto the taxol binding site of αβ-tubulin
Model of DCD2 docked onto the taxolbinding site of αβ-tubulin
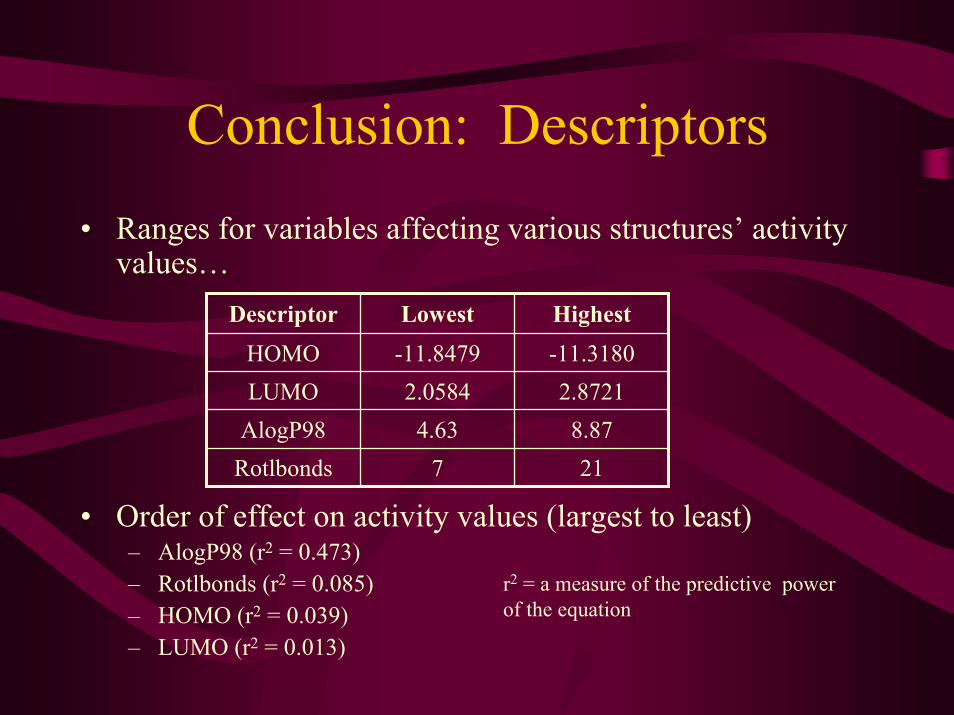
Conclusion: Descriptors• Ranges for variables affecting various structures’ activity
values…
• Order of effect on activity values (largest to least)– AlogP98 (r2 = 0.473)– Rotlbonds (r2 = 0.085)– HOMO (r2 = 0.039)– LUMO (r2 = 0.013)
-11.3180-11.8479HOMO
HighestLowestDescriptor
217Rotlbonds8.874.63AlogP98
2.87212.0584LUMO
r2 = a measure of the predictive power of the equation
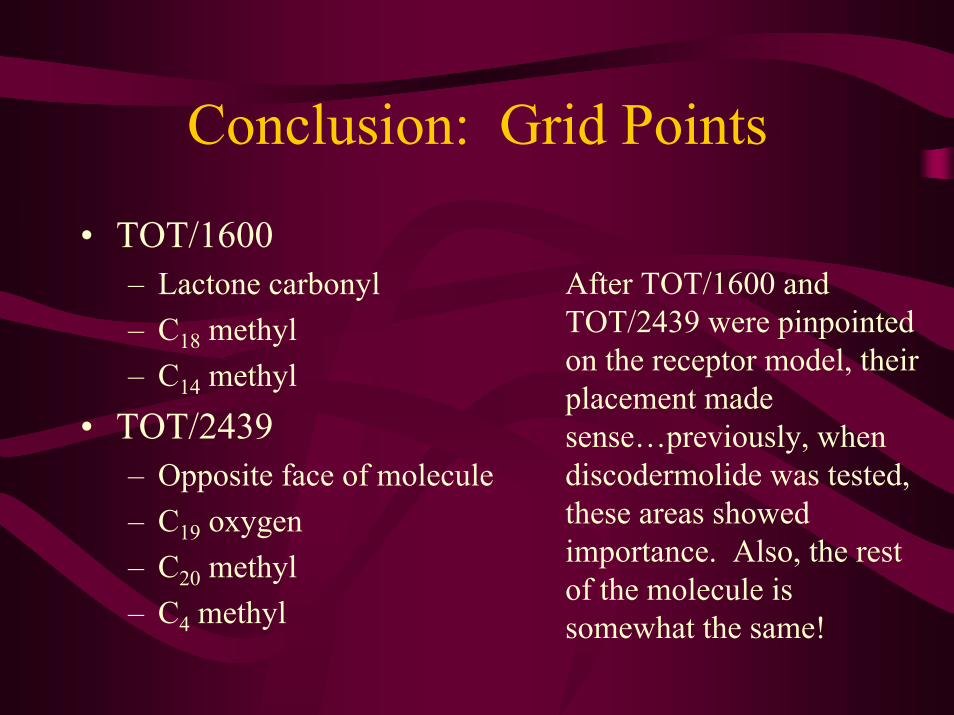
Conclusion: Grid Points
• TOT/1600– Lactone carbonyl– C18 methyl– C14 methyl
• TOT/2439– Opposite face of molecule– C19 oxygen– C20 methyl– C4 methyl
After TOT/1600 and TOT/2439 were pinpointed on the receptor model, their placement made sense…previously, when discodermolide was tested, these areas showed importance. Also, the rest of the molecule is somewhat the same!
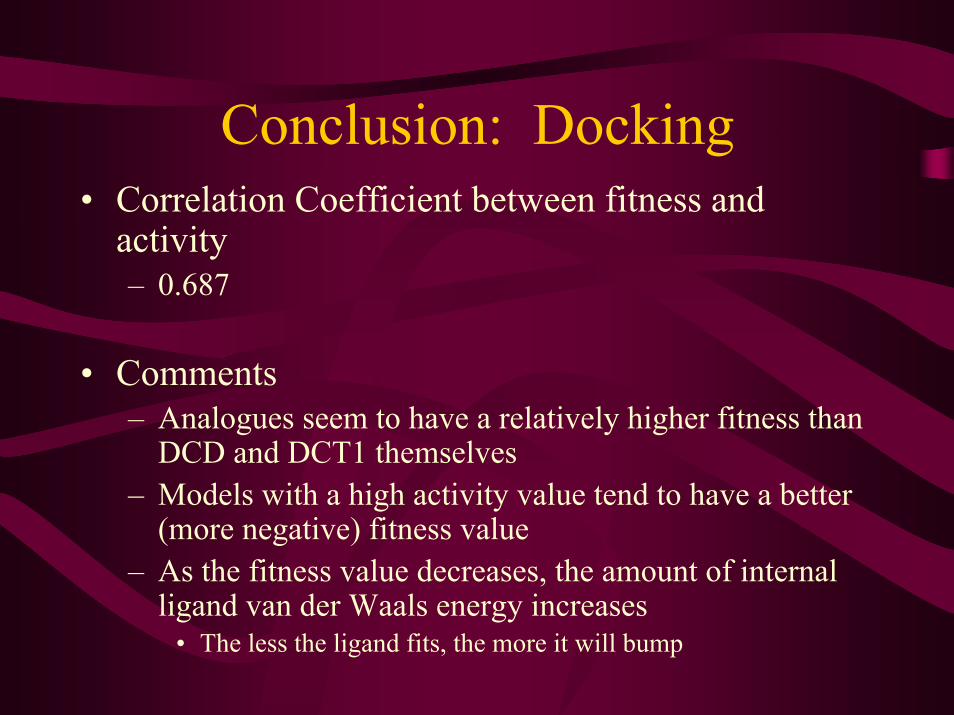
Conclusion: Docking• Correlation Coefficient between fitness and
activity– 0.687
• Comments– Analogues seem to have a relatively higher fitness than
DCD and DCT1 themselves– Models with a high activity value tend to have a better
(more negative) fitness value– As the fitness value decreases, the amount of internal
ligand van der Waals energy increases• The less the ligand fits, the more it will bump
References• Burlingame, M. A.; Shaw, S. J.; Sundermann, K. F.; Zhang, D.; Petryka, J.; Mendoza, E.; Liu, F.;
Myles, D. C.; LeMarche, M. J.; Hirose T.; Freeze, B. S.; Smith, A. B., III. Bioorg. Med. Chem. 2004, 14, 2335-2338.
• Choy, N.; Shin, Y.; Nguyen, P. Q.; Curran, D. P.; Balachandran, R.; Madirqju, C.; Day, B. W. J. Med. Chem. 2003, 46, 2846-2864.
• Cunningham, S.L.; Day, B.W.; Cunningham, A. R. Quantitative Structure Activity Relationships for Two Series of Discodermolide Derivatives. manuscript in preparation.
• Friedman, J., “Multivariate Adaptive Regression Splines”, Technical Report 102, Laboratory for Computational Statistics, Department of Statistics, Standford University: Standford, CA (1998; revised 1990).Gasteiger, J., Marsali, M., Tet. Letters, 34, 3181 (1978).
• Holland, J., Adaptation in Artificial and Natural Systems,University of Michigan Press (1975).• Isbrucker, R. A.; Cummins, J.; Pomponi, S. A.; Longley, R. E.; Wright, A. E. Biochem. Pharm.
2003, 66, 75-82.• Patterson, I.; Britton, R.; Delgado, O.; Meyer, A.; Poullennec, K. G. Angew. Chem. Int. Ed. 2004,
43, 2-6.• Shin, Y.; Choy, N.; Balachandran, R.; Madiraju, C.; Day, B. W.; Curran, D. P. Organic Letters.
2002, 25, 4443-4446.• Shin, Y.; Fournier, J. H.; Fukui, Y.; Brückner, A.M.; Curran, D.P. Total Synthesis of (-)-Dictyostatin
1 Confirms its Relative and Absolute Configuration. Angewandte Chemie, in press.

Acknowledgements
• Billy W. Day• Rajan Munshi• BBSI program & participants• University of Pittsburgh• Duquesne University• NSF/NIH
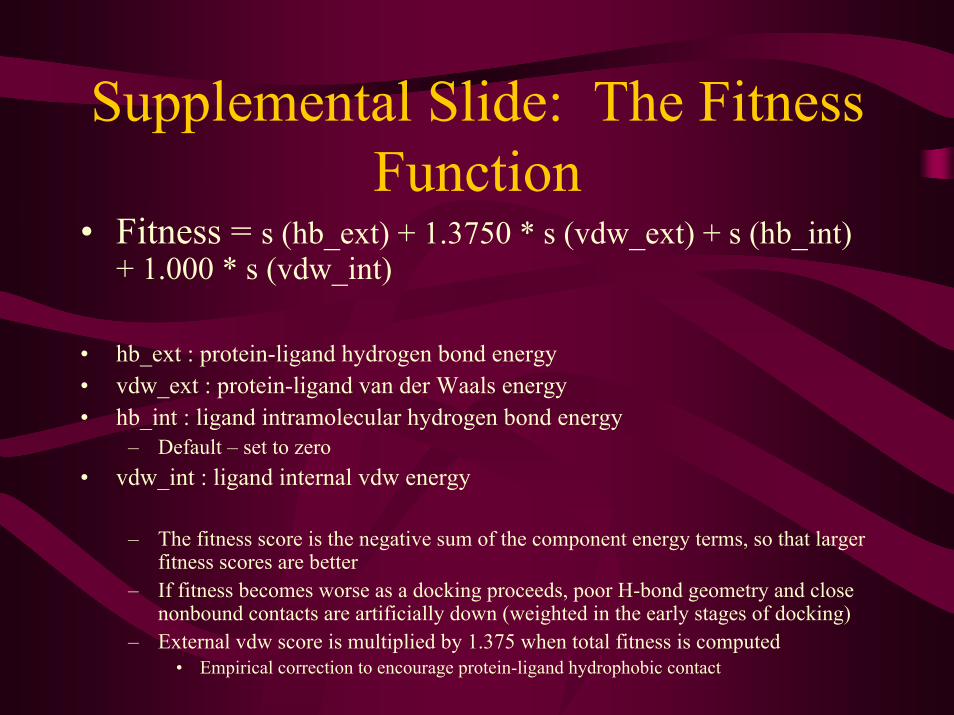
Supplemental Slide: The Fitness Function
• Fitness = s (hb_ext) + 1.3750 * s (vdw_ext) + s (hb_int) + 1.000 * s (vdw_int)
• hb_ext : protein-ligand hydrogen bond energy• vdw_ext : protein-ligand van der Waals energy• hb_int : ligand intramolecular hydrogen bond energy
– Default – set to zero• vdw_int : ligand internal vdw energy
– The fitness score is the negative sum of the component energy terms, so that larger fitness scores are better
– If fitness becomes worse as a docking proceeds, poor H-bond geometry and close nonbound contacts are artificially down (weighted in the early stages of docking)
– External vdw score is multiplied by 1.375 when total fitness is computed• Empirical correction to encourage protein-ligand hydrophobic contact
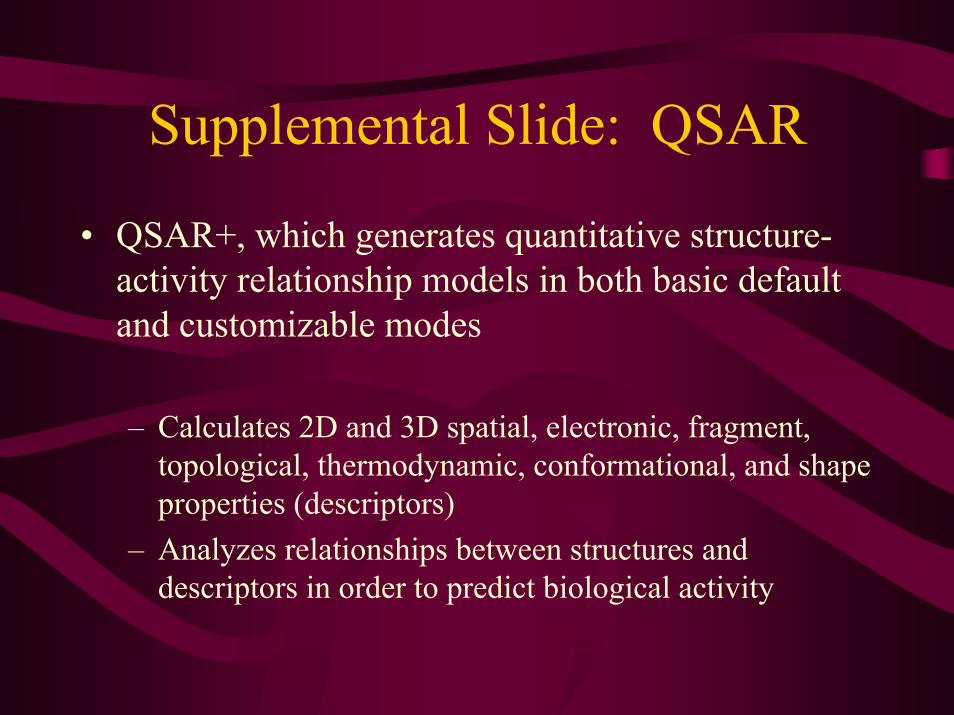
Supplemental Slide: QSAR
• QSAR+, which generates quantitative structure-activity relationship models in both basic default and customizable modes
– Calculates 2D and 3D spatial, electronic, fragment, topological, thermodynamic, conformational, and shape properties (descriptors)
– Analyzes relationships between structures and descriptors in order to predict biological activity
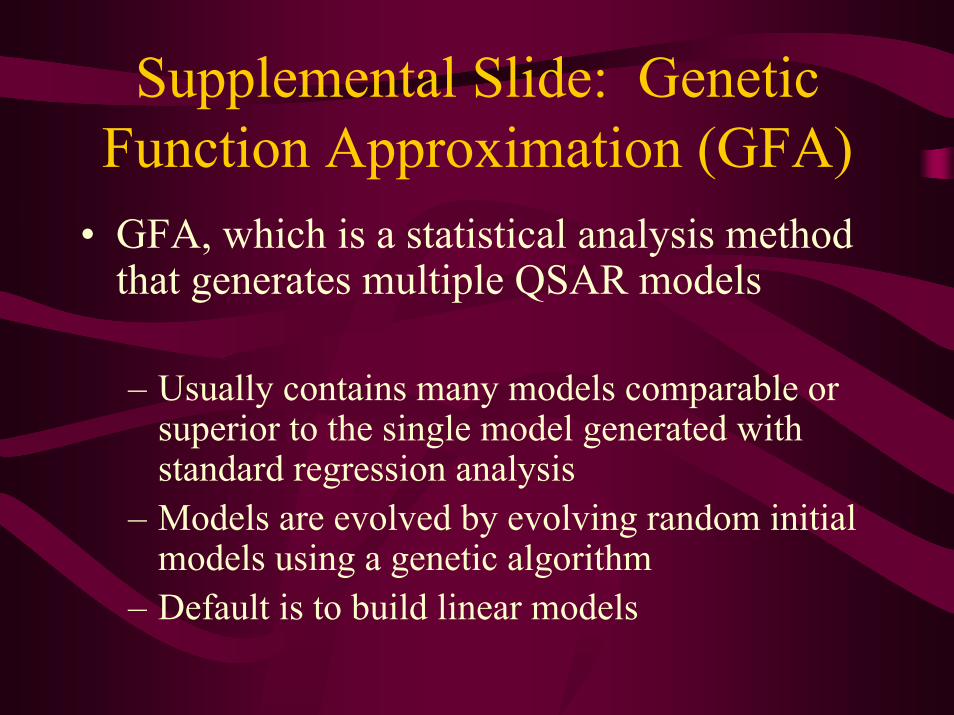
Supplemental Slide: Genetic Function Approximation (GFA)
• GFA, which is a statistical analysis method that generates multiple QSAR models
– Usually contains many models comparable or superior to the single model generated with standard regression analysis
– Models are evolved by evolving random initial models using a genetic algorithm
– Default is to build linear models