Embed Size (px)
Citation preview
Quantile Regression
Roger Koenker and Kevin F. Hallock
W e say that a student scores at the tth quantile of a standardized exam ifhe performs better than the proportion t of the reference group ofstudents and worse than the proportion (1–t). Thus, half of students
perform better than the median student and half perform worse. Similarly, thequartiles divide the population into four segments with equal proportions of thereference population in each segment. The quintiles divide the population into fiveparts; the deciles into ten parts. The quantiles, or percentiles, or occasionallyfractiles, refer to the general case. Quantile regression as introduced by Koenkerand Bassett (1978) seeks to extend these ideas to the estimation of conditionalquantile functions—models in which quantiles of the conditional distribution of theresponse variable are expressed as functions of observed covariates.
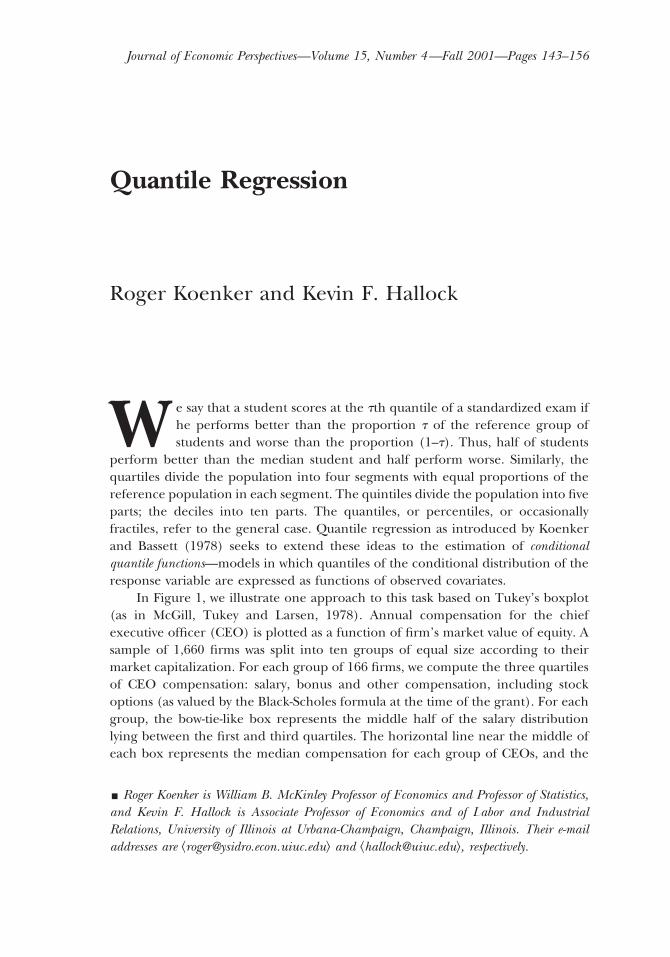
In Figure 1, we illustrate one approach to this task based on Tukey’s boxplot(as in McGill, Tukey and Larsen, 1978). Annual compensation for the chiefexecutive officer (CEO) is plotted as a function of firm’s market value of equity. Asample of 1,660 firms was split into ten groups of equal size according to theirmarket capitalization. For each group of 166 firms, we compute the three quartilesof CEO compensation: salary, bonus and other compensation, including stockoptions (as valued by the Black-Scholes formula at the time of the grant). For eachgroup, the bow-tie-like box represents the middle half of the salary distributionlying between the first and third quartiles. The horizontal line near the middle ofeach box represents the median compensation for each group of CEOs, and the
y Roger Koenker is William B. McKinley Professor of Economics and Professor of Statistics,and Kevin F. Hallock is Associate Professor of Economics and of Labor and IndustrialRelations, University of Illinois at Urbana-Champaign, Champaign, Illinois. Their e-mailaddresses are ^[email protected]& and ^[email protected]&, respectively.
Journal of Economic Perspectives—Volume 15, Number 4—Fall 2001—Pages 143–156

notches represent an estimated confidence interval for each median estimate. Thefull range of the observed salaries in each group is represented by the horizon-tal bars at the end of the dashed “whiskers.” In cases where the whiskers wouldextend more than three times the interquartile range, they are truncated and theremaining outlying points are indicated by open circles. The mean compensationfor each group is also plotted: the geometric mean as a 1 and the arithmetic meanas a *.
There is a clear tendency for compensation to rise with firm size, but one canalso discern several other features from the plot. Even on the log scale, there is atendency for dispersion, as measured by the interquartile range of log compensa-tion, to increase with firm size. This effect is accentuated if we consider the upperand lower tails of the salary distribution. By characterizing the entire distribution ofannual compensation for each group, the plot provides a much more completepicture than would be offered by simply plotting the group means or medians.Here we have the luxury of a moderately large sample size in each group. Had wehad several covariates, grouping observations into homogeneous cells, each with asufficiently large number of observations, would become increasingly difficult.
In classical linear regression, we also abandon the idea of estimating separatemeans for grouped data as in Figure 1, and we assume that these means fall on a lineor some linear surface, and we estimate instead the parameters of this linear model.Least squares estimation provides a convenient method of estimating such condi-
Figure 1Pay of Chief Executive Officers by Firm Size
Notes: The boxplots provide a summary of the distribution of CEO annual compensation for tengroupings of firms ranked by market capitalization. The light gray vertical lines demarcate thedeciles of the firm size groupings. The upper and lower limits of the boxes represent the first andthird quartiles of pay. The median for each group is represented by the horizontal bar in the middleof each box.Source: Data on CEO annual compensation from EXECUCOMP in 1999.
144 Journal of Economic Perspectives

tional mean models. Quantile regression provides an equally convenient methodfor estimating models for conditional quantile functions.
Quantiles via Optimization
Quantiles seem inseparably linked to the operations of ordering and sortingthe sample observations that are usually used to define them. So it comes as a mildsurprise to observe that we can define the quantiles through a simple alternativeexpedient as an optimization problem. Just as we can define the sample mean as thesolution to the problem of minimizing a sum of squared residuals, we can definethe median as the solution to the problem of minimizing a sum of absoluteresiduals. The symmetry of the piecewise linear absolute value function implies thatthe minimization of the sum of absolute residuals must equate the number ofpositive and negative residuals, thus assuring that there are the same number ofobservations above and below the median.
What about the other quantiles? Since the symmetry of the absolute valueyields the median, perhaps minimizing a sum of asymmetrically weighted absoluteresiduals—simply giving differing weights to positive and negative residuals—wouldyield the quantiles. This is indeed the case. Solving
minj[ℜ
O rt ~yi 2 j!,
where the function rt[ is the tilted absolute value function appearing in Figure 2that yields the tth sample quantile as its solution.1
Having succeeded in defining the unconditional quantiles as an optimizationproblem, it is easy to define conditional quantiles in an analogous fashion. Leastsquares regression offers a model for how to proceed. If, presented with a randomsample { y1, y2, . . . , yn}, we solve
minm[ℜ
Oi51
n
~yi 2 m!2,
we obtain the sample mean, an estimate of the unconditional population mean, EY.If we now replace the scalar m by a parametric function m( x, b) and solve
minb[ℜp
Oi51
n
~yi 2 m~xi , b!!2,
we obtain an estimate of the conditional expectation function E(Yux).
1 To see this more formally, one need only compute directional derivatives with respect to j.
Roger Koenker and Kevin F. Hallock 145

In quantile regression, we proceed in exactly the same way. To obtain anestimate of the conditional median function, we simply replace the scalar j in thefirst equation by the parametric function j( xi , b) and set t to 1
2. Variants of this
idea were proposed in the mid-eighteenth century by Boscovich and subsequentlyinvestigated by Laplace and Edgeworth, among others. To obtain estimates of theother conditional quantile functions, we replace absolute values by rt[ and solve
minb[ℜp
O rt ~yi 2 j~xi , b!!.
The resulting minimization problem, when j( x, b) is formulated as a linearfunction of parameters, can be solved very efficiently by linear programmingmethods.
Quantile Engel Curves
To illustrate the basic ideas, we briefly reconsider a classical empirical appli-cation in economics, Engel’s (1857) analysis of the relationship between householdfood expenditure and household income. In Figure 3, we plot Engel’s data takenfrom 235 European working-class households. Superimposed on the plot are sevenestimated quantile regression lines corresponding to the quantiles {0.05, 0.1, 0.25,0.5, 0.75, 0.9, 0.95}. The median t 5 0.5 fit is indicated by the darker solid line; theleast squares estimate of the conditional mean function is plotted as the dashedline.
The plot clearly reveals the tendency of the dispersion of food expenditure toincrease along with its level as household income increases. The spacing of thequantile regression lines also reveals that the conditional distribution of foodexpenditure is skewed to the left: the narrower spacing of the upper quantilesindicating high density and a short upper tail and the wider spacing of the lowerquantiles indicating a lower density and longer lower tail.
Figure 2Quantile Regression r Function
146 Journal of Economic Perspectives

The conditional median and mean fits are quite different in this example, afact that is partially explained by the asymmetry of the conditional density andpartially by the strong effect exerted on the least squares fit by the two unusualpoints with high income and low food expenditure. Note that one consequence ofthis nonrobustness is that the least squares fit provides a rather poor estimate of theconditional mean for the poorest households in the sample. Note that the dashedleast squares line passes above all of the very low income observations.
We have occasionally encountered the faulty notion that something like quan-tile regression could be achieved by segmenting the response variable into subsetsaccording to its unconditional distribution and then doing least squares fitting onthese subsets. Clearly, this form of “truncation on the dependent variable” wouldyield disastrous results in the present example. In general, such strategies aredoomed to failure for all the reasons so carefully laid out in Heckman’s (1979)work on sample selection.
In contrast, segmenting the sample into subsets defined according to theconditioning covariates is always a valid option. Indeed, such local fitting underliesall nonparametric quantile regression approaches. In the most extreme cases, wehave p distinct cells corresponding to different settings of the covariate vector, x,and quantile regression reduces simply to computing ordinary univariate quantilesfor each of these cells. In intermediate cases, we may wish to project these cellestimates onto a more parsimonious (linear) model; see Chamberlain (1994) andKnight, Bassett and Tam (2000) for examples of this approach. Another variant is
Figure 3Engel Curves for Food
Notes: This figure plots data taken from Engel’s (1857) study of the dependence of households’ foodexpenditure on household income. Seven estimated quantile regression lines for different values of t{0.05, 0.1, 0.25, 0.5, 0.75, 0.9, 0.95} are superimposed on the scatterplot. The median t 5 0.5 isindicated by the darker solid line; the least squares estimate of the conditional mean function isindicated by the dashed line.
Quantile Regression 147

the suggestion that instead of estimating linear conditional quantile models, wecould instead estimate a family of binary response models for the probability thatthe response variable exceeded some prespecified cutoff values.2
Quantile Regression and Determinants of Infant Birthweight
In this section, we reconsider a recent investigation by Abrevaya (2001) of theimpact of various demographic characteristics and maternal behavior on the birth-weight of infants born in the United States. Low birthweight is known to beassociated with a wide range of subsequent health problems and has even beenlinked to educational attainment and eventual labor market outcomes. Conse-quently, there has been considerable interest in factors influencing birthweightsand public policy initiatives that might prove effective in reducing the incidence oflow-birthweight infants, which is conventionally defined by whether infants weighless than 2500 grams at birth, about 5 pounds, 9 ounces.
Most of the analysis of birthweights has employed conventional least squaresregression methods. However, it has been recognized that the resulting estimates ofvarious effects on the conditional mean of birthweights were not necessarily indic-ative of the size and nature of these effects on the lower tail of the birthweightdistribution. A more complete picture of covariate effects can be provided byestimating a family of conditional quantile functions.3
Our analysis is based on the June 1997 Detailed Natality Data published by theNational Center for Health Statistics. Like Abrevaya (2001), we limit the sample tolive, singleton births, with mothers recorded as either black or white, between theages of 18 and 45, residing in the United States. Observations with missing data forany of the variables described below were dropped from the analysis. This processyielded a sample of 198,377 babies. Birthweight, the response variable, is recordedin grams. Education of the mother is divided into four categories: less than highschool, high school, some college and college graduate. The omitted category isless than high school so coefficients may be interpreted relative to this category.The prenatal medical care of the mother is also divided into four categories: thosewith no prenatal visit, those whose first prenatal visit was in the first trimester of thepregnancy, those with first visit in the second trimester and those with first visit inthe last trimester. The omitted category is the group with a first visit in the firsttrimester; they constitute almost 85 percent of the sample. An indicator of whether
2 This approach replaces the hypothesis of conditional quantile functions that are linear in parameterswith the hypothesis that some transformation of the various probabilities of exceeding the chosencutoffs, say the logistic, could instead be expressed as linear functions in the observed covariates. In ourview, the conditional quantile assumption is more natural, if only because it nests within it theindependent and identically distributed error location shift model of classical linear regression.3 In an effort to focus attention more directly on the lower tail, several studies have recently exploredbinary response (probit) models for the occurrence of low birthweights.
148 Journal of Economic Perspectives

the mother smoked during pregnancy is included in the model, as well as mother’sreported average number of cigarettes smoked per day. The mother’s reportedweight gain during pregnancy (in pounds) is included (as a quadratic effect).
Figure 4 presents a summary of quantile regression results for this example.Unlike the Engel curve example, where we had only one covariate and the entireempirical analysis could be easily superimposed on the bivariate scatterplot of theobservations, we now have 15 covariates, plus an intercept. For each of the 16coefficients, we plot the 19 distinct quantile regression estimates for t ranging from0.05 to 0.95 as the solid curve with filled dots. For each covariate, these pointestimates may be interpreted as the impact of a one-unit change of the covariate onbirthweight holding other covariates fixed. Thus, each of the plots has a horizontalquantile, or t, scale, and the vertical scale in grams indicates the covariate effect.The dashed line in each figure shows the ordinary least squares estimate of theconditional mean effect. The two dotted lines represent conventional 90 percentconfidence intervals for the least squares estimate. The shaded gray area depicts a90 percent pointwise confidence band for the quantile regression estimates.
In the first panel of the figure, the intercept of the model may be interpretedas the estimated conditional quantile function of the birthweight distribution of agirl born to an unmarried, white mother with less than a high school education,who is 27 years old and had a weight gain of 30 pounds, didn’t smoke, and had herfirst prenatal visit in the first trimester of the pregnancy. The mother’s age andweight gain are chosen to reflect the means of these variables in the sample.4 Notethat the t 5 0.05 quantile of the distribution for this group is just at the margin ofthe conventional definition of a low birthweight baby.
We will confine our discussion to only a few of the covariates. At any chosenquantile we can ask, for example, how different are the corresponding weights ofboys and girls, given a specification of the other conditioning variables. The secondpanel answers this question. Boys are obviously larger than girls, by about 100 gramsaccording to the ordinary least squares estimates of the mean effect, but as is clearfrom the quantile regression results, the disparity is much smaller in the lowerquantiles of the distribution and considerably larger than 100 grams in the uppertail of the distribution. For example, boys are about 45 grams larger at the 0.05quantile but are about 130 grams larger at the 0.95 quantile. The conventional leastsquares confidence interval does a poor job of representing this range ofdisparities.
The disparity between birthweights of infants born to black and white mothersis substantial, particularly at the left tail of the distribution. At the 5th percentile ofthe conditional distribution, the difference is roughly one-third of a kilogram.
4 It is conducive for interpretation to center covariates so that the intercept can be interpreted as theconditional quantile function for some representative case—rather than as an extrapolation of themodel beyond the convex hull of the data. This may be viewed as adhering to John Tukey’s dictum:“Never estimate intercepts, always estimate centercepts!”
Roger Koenker and Kevin F. Hallock 149

Mother’s age enters the model as a quadratic effect, shown in the first twofigures of the second row. At the lower quantiles, the mother’s age tends to be moreconcave, increasing birthweight from age 18 to about age 30, but tending todecrease birthweight when the mother’s age is beyond 30. At higher quantiles, this
Figure 4Ordinary Least Squares and Quantile Regression Estimates for Birthweight Model
150 Journal of Economic Perspectives

“optimal age” becomes gradually older. At the third quantile, it is about 36, and att 5 0.9, it is almost 40.
Education beyond high school is associated with a modest increase in birth-weights. High school graduation has a quite uniform effect over the whole range ofthe distribution of about 15 grams. This is a rare example of an effect that reallydoes appear to exert a pure location shift effect on the conditional distribution. Forthis effect, the quantile regression results are quite consistent with the least squaresresults; but this is the exceptional case, not the rule.
Several of the remaining covariates are of substantial public policy interest.These include the effects of prenatal care, marital status and smoking. However, asin the corresponding least squares analysis, the interpretation of their causal effectsmay be somewhat controversial. For example, although we find (as expected) thatbabies born to mothers with no prenatal care are smaller, we also find that babiesborn to mothers who delayed prenatal visits until the second or third trimester havesubstantially higher birthweights in the lower tail than mothers who had a prenatalvisit in the first trimester. This might be interpreted as the self-selection effect ofmothers confident about favorable outcomes.
In almost all of the panels of Figure 4, with the exception of educationcoefficients, the quantile regression estimates lie at some point outside the confi-dence intervals for the ordinary least squares regression, suggesting that the effectsof these covariates may not be constant across the conditional distribution of theindependent variable. Formal testing of this hypothesis is discussed in Koenker andMachado (1999).
Selected Empirical Examples of Quantile Regression
There is a rapidly expanding empirical quantile regression literature in eco-nomics that, taken as a whole, makes a persuasive case for the value of “goingbeyond models for the conditional mean” in empirical economics. Catalyzed byGary Chamberlain’s (1994) invited address to the 1990 World Congress of theEconometric Society, there has been considerable work in labor economics: onunion wage effects, returns to education and labor market discrimination. Cham-berlain finds, for example, that for manufacturing workers, the union wage pre-mium at the first decile is 28 percent and declines monotonically to a negligible0.3 percent at the upper decile. The least squares estimate of the mean unionpremium of 15.8 percent is thus captured mainly by the lower tail of the conditionaldistribution. The conventional location shift model thus delivers a rather mislead-ing impression of the union effect. Other contributions exploring these issues inthe U.S. labor market include the influential work of Buchinsky (1994, 1997). Arias,Hallock and Sosa-Escudero (2001), using data on identical twins, interpret ob-served heterogeneity in the estimated returns to education over quantiles as
Quantile Regression 151
indicative of an interaction between observed educational attainment and unob-served ability.
There is also a large literature dealing with related issues in labor marketsoutside the United States, including Fitzenberger (1999) on Germany; Machadoand Mata (1999) on Portugal; Garcia, Hernandez and Lopez-Nicolas (2001) onSpain; Schultz and Mwabu (1998) on South Africa; and Kahn (1998) on interna-tional comparisons. The work of Machado and Mata (1999) is particularly notablesince it introduces a useful way to extend the counterfactual wage decompositionapproach of Oaxaca (1973) to quantile regression and provides a general strategyfor simulating marginal distributions from the quantile regression process. Tannuri(2000) has employed this approach in a recent study of assimilation of U.S.immigrants.
In other applied micro areas, Eide and Showalter (1998), Knight, Bassett andTam (2000) and Levin (2001) have addressed school quality issues. Poterba andRueben (1995) and Mueller (2000) study public-private wage differentials in theUnited States and Canada. Abadie, Angrist and Imbens (2001) consider estimationof endogenous treatment effects in program evaluation, and Koenker and Billias(2001) explore quantile regression models for unemployment duration data. Workby Viscusi and Hamilton (1999) considers public decision making regarding haz-ardous waste cleanup.
Deaton (1997) offers a nice introduction to quantile regression for demandanalysis. In a study of Engel curves for food expenditure in Pakistan, he finds thatalthough the median Engel elasticity of 0.906 is similar to the ordinary least squaresestimate of 0.909, the coefficient at the tenth quantile is 0.879 and the estimate atthe 90th percentile is 0.946, indicating a pattern of heteroskedasticity like that ofour Figure 3.
In another demand application, Manning, Blumberg and Moulton (1995)study demand for alcohol using survey data from the National Health InterviewStudy and find considerable heterogeneity in the price and income elasticities overthe full range of the conditional distribution. Hendricks and Koenker (1992)investigate demand for electricity by time of day using a hierarchical model.
Earnings inequality and mobility is a natural arena of applications for quantileregression. Conley and Galenson (1998) explore wealth accumulation in severalU.S. cities in the mid-nineteenth century. Gosling, Machin and Meghir (2000)study the income and wealth distribution in the United Kingdom. Trede (1998)and Morillo (2000) compare earnings mobility in the United States and Germany.
There is also a growing literature in empirical finance employing quantileregression methods. One strand of this literature is the rapidly expanding literatureon value at risk: this connection is developed in Taylor (1999), Chernozhukov andUmantsev (2001) and Engle and Manganelli (1999). Bassett and Chen (2001)consider quantile regression index models to characterize mutual fund investmentstyles.
152 Journal of Economic Perspectives

Software and Standard Errors
The diffusion of technological change throughout statistics is closely tied to itsembodiment in statistical software. This is particularly true of quantile regressionmethods, since the linear programming algorithms that underlie reliable imple-mentations of the methods appear somewhat esoteric to some users. Since the early1950s, it has been recognized that median regression methods based on minimiz-ing sums of absolute residuals can be formulated as linear programming problemsand efficiently solved with some form of the simplex algorithm.5
Among commercial programs in common use in econometrics, Stata and TSPoffer some basic functionality for quantile regression within the central core of thepackage distributed by the vendor. Since the mid-1980s, one of us has maintaineda public domain package of quantile regression software designed for the Slanguage of Becker, Chambers and Wilks (1988) and the related commercialpackage Splus. Recently, this package has been extended to provide a version for R,the impressive public domain dialect of S (Koenker, 1995). This website alsoprovides quantile regression software for Ox and Matlab languages.
It is a basic principle of sound econometrics that every serious estimate deserves areliable assessment of precision. There is now an extensive literature on the asymptoticbehavior of quantile regression estimators and considerable experience with infer-ence methods based on this theory, as well as a variety of resampling schemes. Wehave recently undertaken a comparison of several approaches to the constructionof confidence intervals for a problem typical of current applications in laboreconomics. We find that the discrepancies among competing methods are slight,and inference for quantile regression is, if anything, more robust than for mostother forms of inference commonly encountered in econometrics. Koenker andHallock (2000) describe this exercise in more detail and provide a brief survey ofrecent work on quantile regression for discrete data models, time series, nonpara-metric models and a variety of other areas. Some of these developments have beenslow to percolate into standard econometric software. With the notable exceptionsof Stata and Xplore (Cizek, 2000) and the packages available from the web forSplus and R, none of the implementations of quantile regression in econometricsoftware packages include any functionality for inference.
5 The median regression algorithm of Barrodale and Roberts (1974) has proven particularly influentialand can be easily adapted for general quantile regression. Koenker and d’Orey (1987) describe oneimplementation. For large-scale quantile regression problems, Portnoy and Koenker (1997) have shownthat a combination of interior point methods and effective preprocessing renders quantile regressioncomputation competitive with least squares computations for problems of comparable size.
Roger Koenker and Kevin F. Hallock 153

Conclusion
Much of applied statistics may be viewed as an elaboration of the linearregression model and associated estimation methods of least squares. In beginningto describe these techniques, Mosteller and Tukey (1977, p. 266) remark in theirinfluential text:
What the regression curve does is give a grand summary for the averages ofthe distributions corresponding to the set of x’s. We could go further andcompute several different regression curves corresponding to the variouspercentage points of the distributions and thus get a more complete pictureof the set. Ordinarily this is not done, and so regression often gives a ratherincomplete picture. Just as the mean gives an incomplete picture of a singledistribution, so the regression curve gives a corresponding incomplete picturefor a set of distributions.
We would like to think that quantile regression is gradually developing into acomprehensive strategy for completing the regression picture.
y We would like to thank the editors, as well as Gib Bassett, John DiNardo, Olga Geling,Bernd Fitzenberger and Steve Portnoy for helpful comments on earlier drafts. The research waspartially supported by NSF grant SES-99-11184.
References
Abadie, Alberto, Joshua Angrist and GuidoImbens. 2001. “Instrumental Variables Estima-tion of Quantile Treatment Effects.” Economet-rica. Forthcoming.
Abrevaya, Jason. 2001. “The Effects of Demo-graphics and Maternal Behavior on the Distribu-tion of Birth Outcomes.” Empirical Economics.March, 26:1, pp. 247–57.
Arias, Omar, Kevin Hallock and Walter Sosa-Escudero. 2001. “Individual Heterogeneity inthe Returns to Schooling: Instrumental Vari-ables Quantile Regression Using Twins Data.”Empirical Economics. March, 26:1, pp. 7–40.
Barrodale, I. and F. Roberts. 1974. “Solutionof an Overdetermined System of Equations inthe L1 Norm [F4] (Algorithm 478).” Communi-cations of the ACM. 17:6, pp. 319–20.
Bassett, Gilbert and Hsiu-Lang Chen. 2001.“Quantile Style: Return-Based Attribution UsingRegression Quantiles.” Empirical Economics.March, 26:1, pp. 293–305.
Becker, Richard, John Chambers and AllanWilks. 1988. The New S Language: A ProgrammingEnvironment for Data Analysis and Graphics. PacificGrove: Wadsworth.
Buchinsky, Moshe. 1994. “Changes in U.S.Wage Structure 1963–1987: An Application ofQuantile Regression.” Econometrica. March, 62:2,pp. 405–58.
Buchinsky, Moshe. 1997. “The Dynamics ofChanges in the Female Wage Distribution in theUSA: A Quantile Regression Approach.” Journalof Applied Econometrics. January/February, 13:1,pp. 1–30.
154 Journal of Economic Perspectives

Chamberlain, Gary. 1994. “Quantile Regres-sion, Censoring and the Structure of Wages,” inAdvances in Econometrics. Christopher Sims, ed.New York: Elsevier, pp. 171–209.
Chernozhukov, V. and L. Umantsev. 2001.“Conditional Value-at-Risk: Aspects of Modelingand Estimation.” Empirical Economics. March,26:1, pp. 271–92.
Cizek, Pavel. 2000. “Quantile Regression,” inXploRe Application Guide. Wolfgang Hardle,Zdenk Hlavka and Sigbert Klinke, eds. Heidel-berg: Springer-Verlag, pp. 21–48.
Conley, Timothy and David Galenson. 1998.“Nativity and Wealth in Mid-Nineteenth-CenturyCities.” Journal of Economic History. June, 58:2, pp.468–93.
Deaton, Angus. 1997. The Analysis of HouseholdSurveys. Baltimore: Johns Hopkins.
Eide, Eric and Mark Showalter. 1998. “TheEffect of School Quality on Student Perfor-mance: A Quantile Regression Approach.” Eco-nomics Letters. March, 58:3, pp. 345–50.
Engel, Ernst. 1857. “Die Produktions- undKonsumptionverhaltnisse des Konigreichs Sach-sen.” Reprinted in “Die Lebenkosten BelgischerArbeiter-Familien Fruher und Jetzt.” Interna-tional Statistical Institute Bulletin. 9, pp. 1–125.
Engle, Robert and Simone Manganelli. 1999.“CaViaR: Conditional Autoregressive Value atRisk by Regression Quantiles.” University of Cal-ifornia, San Diego, Department of EconomicsWorking Paper 99/20. October.
Fitzenberger, Bernd. 1999. Wages and Employ-ment Across Skill Groups. Heidelberg: Physica-Verlag.
Garcia, Jaume, Pedro Hernandez and AngelLopez-Nicolas. 2001. “How Wide is the Gap? AnInvestigation of Gender Wage Differences UsingQuantile Regression.” Empirical Economics. March,26:1, pp. 149–67.
Gosling, Amanda, Stephen Machin and CostasMeghir. 2000. “The Changing Distribution ofMale Wages in the U.K.” Review of Economic Stud-ies. October, 67:4, pp. 635–66.
Heckman, James J. 1979. “Sample SelectionBias as a Specification Error.” Econometrica. Jan-uary, 47:1, pp. 153–61.
Hendricks, Wallace and Roger Koenker. 1992.“Hierarchical Spline Models for ConditionalQuantiles and the Demand for Electricity.” Jour-nal of the American Statistical Association. March,87:417, pp. 58–68.
Kahn, Lawrence. 1998. “Collective Bargainingand the Interindustry Wage Structure: Interna-
tional Evidence.” Economica. November, 65:260,pp. 507–34.
Knight, Keith, Gilbert Bassett and Mo-Yin S.Tam. 2000. “Comparing Quantile Estimators forthe Linear Model.” Preprint.
Koenker, Roger. 1995. “Quantile Regres-sion Software.” Available at ^http://www.econ.uiuc.edu/;roger/research/rq/rq.html&.
Koenker, Roger and Gilbert Bassett. 1978.“Regression Quantiles.” Econometrica. January,46:1, pp. 33–50.
Koenker, Roger and Yannis Bilias. 2001.“Quantile Regression for Duration Data: A Re-appraisal of the Pennsylvania Reemployment Bo-nus Experiments.” Empirical Economics. March,26:1, pp. 199–220.
Koenker, Roger and Vasco d’Orey. 1987.“Computing Regression Quantiles.” Applied Sta-tistics. 36, pp. 383–93.
Koenker, Roger and Kevin Hallock. 2000.“Quantile Regression: An Introduction.” Avail-able at ^http://www.econ.uiuc.edu/;roger/research/intro/intro.html&.
Koenker, Roger and Jose Machado. 1999.“Goodness of Fit and Related Inference Pro-cesses for Quantile Regression.” Journal of theAmerican Statistical Association. December,94:448, pp. 1296–310.
Levin, Jesse. 2001. “For Whom the ReductionsCount: A Quantile Regression Analysis of ClassSize on Scholastic Achievement.” Empirical Eco-nomics. March, 26:1, pp. 221–46.
Machado, Jose and Jose Mata. 1999. “Counter-factual Decomposition of Changes in Wage Distri-butions Using Quantile Regression.” Preprint.
Manning, Willard, Linda Blumberg and Law-rence Moulton. 1995. “The Demand for Alcohol:The Differential Response to Price.” Journal ofHealth Economics. June, 14:2, pp. 123–48.
McGill, Robert, John W. Tukey and Wayne A.Larsen. 1978. “Variations of Box Plots.” AmericanStatistician. February, 32, pp. 12–16.
Morillo, Daniel. 2000. “Income Mobility withNonparametric Quantiles: A Comparison of theU.S. and Germany.” Preprint.
Mosteller, Frederick and John Tukey. 1977.Data Analysis and Regression: A Second Course inStatistics. Reading, Mass.: Addison-Wesley.
Mueller, R. 2000. “Public- and Private-SectorWage Differentials in Canada Revisited.” Indus-trial Relations. July, 39:3, pp. 375–400.
Oaxaca, Ronald. 1973. “Male-Female Wage Dif-ferentials in Urban Labor Markets.” InternationalEconomic Review. October, 14:3, pp. 693–709.
Portnoy, Stephen and Roger Koenker. 1997.
Quantile Regression 155

“The Gaussian Hare and the Laplacian Tortoise:Computability of Squared-Error Versus Abso-lute-Error Estimators, with Discussion.” StatisticalScience. 12:4, pp. 279–300.
Poterba, James and Kim Rueben. 1995. “TheDistribution of Public Sector Wage Premia: NewEvidence Using Quantile Regression Methods.”NBER Working Paper No. 4734.
Schultz, T. Paul and Germano Mwabu. 1998.“Labor Unions and the Distribution of Wagesand Employment in South Africa.” Industrial andLabor Relations Review. July, 51:4, pp. 680–703.
Tannuri, Maria. 2000. “Are the AssimilationProcesses of Low and High Income Immigrants
Distinct? A Quantile Regression Approach.” Pre-print.
Taylor, James. 1999. “A Quantile RegressionApproach to Estimating the Distribution of Mul-tiperiod Returns.” Journal of Derivatives. 7:1, pp.64–78.
Trede, Mark. 1998. “Making Mobility Visible:A Graphical Device.” Economics Letters. April,59:1, pp. 77–82.
Viscusi, W. Kip and James Hamilton. 1999.“Are Risk Regulators Rational? Evidence fromHazardous Waste Cleanup Decisions.” Ameri-can Economic Review. September, 89:4, pp.1010 –27.
156 Journal of Economic Perspectives