Embed Size (px)
Citation preview

Quantifying tradeoffs between ecology, economy and climate in the Northern California Current Ecosystem
Jodie E. Little1, R.C. Francis1, M.G. Dalton2 and J.C. Field3
1School of Aquatic & Fishery Sciences, University of Washington, Seattle, WA
2AFSC, NMFS, NOAA, Seattle, WA3Santa Cruz Laboratory, NMFS, NOAA, Santa Cruz, CA

Wash.
Oregon
California
Northern California Current Ecosystem (NCCE)


1960 2000


-
10
20
30
40
ma
mm
als
bir
ds
salm
on
flatfi
sh
rock
fish
rou
nd
fish
ha
ke
fora
ge
fish
cru
sta
cea
ns
zoo
pla
nkt
on
BIO
MA
SS
(m
t/k
m2
)
82.4BIOMASS
-
20
40
60
80
salm
on
tro
ll
fixe
d g
ea
r
bo
ttom
tra
wl
ha
ke tr
aw
l
cra
b p
ot
shri
mp
tra
wl
RE
VE
NU
E (
mill
ion
$)
REVENUE
Baseline: year 2000

how do ecology and economy respond to…
1. different CLIMATE
2. additional FISHING effort
3. CLIMATE & FISHING
*all scenarios for year 2000 and year 1960 systems*
SCENARIOS

SCENARIO 1: Climate

0.6
0.8
1
1.2
1.4
1.6
1960 1970 1980 1990 2000 2010 2020 2030 2040 2050 2060 2070 2080 2090 2100
Bottom Up Index (Logerwell)
Top Down Index (PDO)
SCENARIO 1: Climate

0.6
0.8
1
1.2
1.4
1.6
1960 1970 1980 1990 2000 2010 2020 2030 2040 2050 2060 2070 2080 2090 2100
Bottom Up Index (Logerwell)
Top Down Index (PDO)
…to 2100
Average 1960-2000
SCENARIO 1: Climate

0.6
0.8
1
1.2
1.4
1.6
1960 1970 1980 1990 2000 2010 2020 2030 2040 2050 2060 2070 2080 2090 2100
Bottom Up Index (Logerwell)
Top Down Index (PDO)
…to 2100
0.6
0.8
1
1.2
1.4
1.6
1960 1970 1980 1990 2000 2010 2020 2030 2040 2050 2060 2070 2080 2090 2100
Average 1963-76
SCENARIO 1: Climate

0.6
0.8
1
1.2
1.4
1.6
1960 1970 1980 1990 2000 2010 2020 2030 2040 2050 2060 2070 2080 2090 2100
Bottom Up Index (Logerwell)
Top Down Index (PDO)
…to 2100
0.6
0.8
1
1.2
1.4
1.6
1960 1970 1980 1990 2000 2010 2020 2030 2040 2050 2060 2070 2080 2090 2100
Average 1977-98
SCENARIO 1: Climate
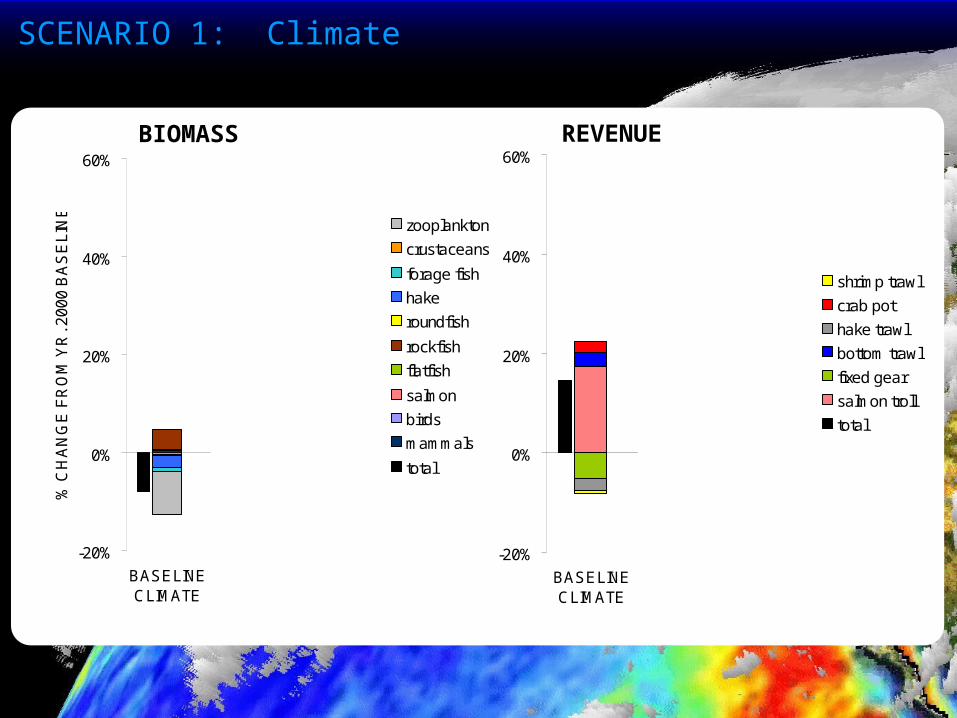
-20%
0%
20%
40%
60%
BASELINECLIMATE
63-76CLIMATE
77-98CLIMATE
% C
HA
NG
E F
RO
M Y
R. 2
00
0 B
AS
EL
INE
zooplankton
crustaceans
forage fish
hake
roundfish
rockfish
flatfish
salmon
birds
mammals
total
-20%
0%
20%
40%
60%
BASELINECLIMATE
63-76CLIMATE
77-98CLIMATE
shrimp trawl
crab pot
hake trawl
bottom trawl
fixed gear
salmon troll
total
BIOMASS REVENUE
SCENARIO 1: Climate

-100%
0%
100%
200%
300%
400%
500%
mam
mal
s
bird
s
salm
on
flatfi
sh
rock
fish
roun
dfis
h
hake
fora
ge fi
sh
crus
tace
ans
zoop
lank
ton
salm
on tr
oll
fixed
gea
r
botto
m tr
awl
hake
traw
l
crab
pot
shrim
p tra
wl
% C
HA
NG
E F
RO
M Y
R. 2
000
BA
SE
LIN
E
-100%
0%
100%
200%
300%
400%
500%
mam
mal
s
bird
s
salm
on
flatfi
sh
rock
fish
roun
dfis
h
hake
fora
ge fi
sh
crus
tace
ans
zoop
lank
ton
salm
on tr
oll
fixed
gea
r
botto
m tr
awl
hake
traw
l
crab
pot
shrim
p tra
wl
63-76 CLIMATE
BASELINE CLIMATE
77-98 CLIMATE
-100%
0%
100%
200%
300%
400%
500%
mam
mal
s
bird
s
salm
on
flatfi
sh
rock
fish
roun
dfis
h
hake
fora
ge fi
sh
crus
tace
ans
zoop
lank
ton
salm
on tr
oll
fixed
gea
r
botto
m tr
awl
hake
traw
l
crab
pot
shrim
p tra
wl
63-76 CLIMATE
BASELINE CLIMATE
77-98 CLIMATE
BIOMASS REVENUE
SCENARIO 1: Climate

Compared to year 1960 system?
SCENARIO 1: Climate

-
10
20
30
40
ma
mm
als
bir
ds
salm
on
flatfi
sh
rock
fish
rou
nd
fish
ha
ke
fora
ge
fish
cru
sta
cea
ns
zoo
pla
nkt
on
BIO
MA
SS
(m
t/k
m2
)
2000 system
1960 system
-
20
40
60
80
salm
on
tro
ll
fixe
d g
ea
r
bo
ttom
tra
wl
ha
ke tr
aw
l
cra
b p
ot
shri
mp
tra
wl
RE
VE
NU
E (
mill
ion
$)
2000 system
1960 system
BIOMASS REVENUE
SCENARIO 1: Climate

-20%
0%
20%
40%
60%
BASELINECLIMATE
63-76CLIMATE
77-98CLIMATE
% C
HA
NG
E F
RO
M Y
R. 2
00
0 B
AS
EL
INE
zooplankton
crustaceans
forage fish
hake
roundfish
rockfish
flatfish
salmon
birds
mammals
total
2000 SYSTEM 1960 SYSTEM
-20%
0%
20%
40%
60%
BASELINECLIMATE
63-76CLIMATE
77-98CLIMATE
zooplankton
salmon
roundfish
rockfish
mammals
hake
forage fish
flatfish
crustaceans
birds
total
-20%
0%
20%
40%
60%
BASELINECLIMATE
63-76CLIMATE
77-98CLIMATE
-20%
0%
20%
40%
60%
BASELINECLIMATE
63-76CLIMATE
77-98CLIMATE
zooplankton
crustaceans
forage fish
hake
roundfish
rockfish
flatfish
salmon
birds
mammals
total
SCENARIO 1: Climate

-20%
0%
20%
40%
60%
BASELINECLIMATE
63-76CLIMATE
77-98CLIMATE
2000 SYSTEM
-20%
0%
20%
40%
60%
BASELINECLIMATE
63-76CLIMATE
77-98CLIMATE
shrimp trawl
crab pot
hake trawl
bottom trawl
fixed gear
salmon troll
total
1960 SYSTEM
-40%
-20%
0%
20%
40%
60%
BA
SE
LIN
EC
LIM
ATE
63-7
6 C
LIM
ATE
77-9
8 C
LIM
ATE
shrimp trawl
crab pot
hake trawl
bottom trawl
fixed gear
salmon
total
-20%
0%
20%
40%
60%
BASELINECLIMATE
63-76CLIMATE
77-98CLIMATE
SCENARIO 1: Climate

SCENARIO 1: Climate
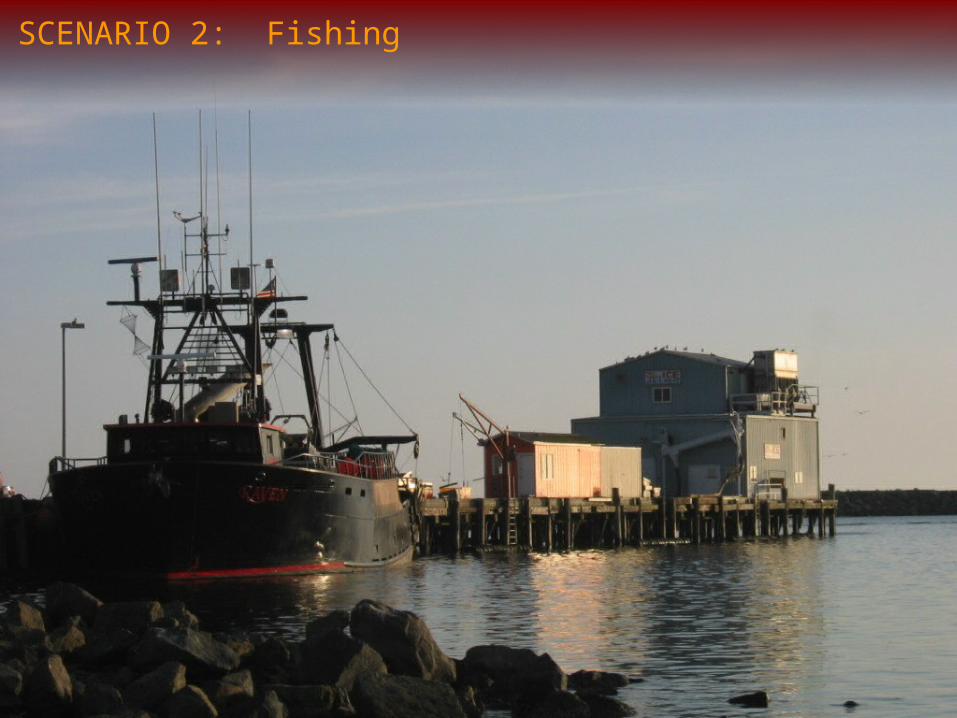
SCENARIO 2: Fishing

Are we measuring
RESILIENCE?
from Walker et al. 04
SCENARIO 2: Fishing

SCENARIO 2: Fishing
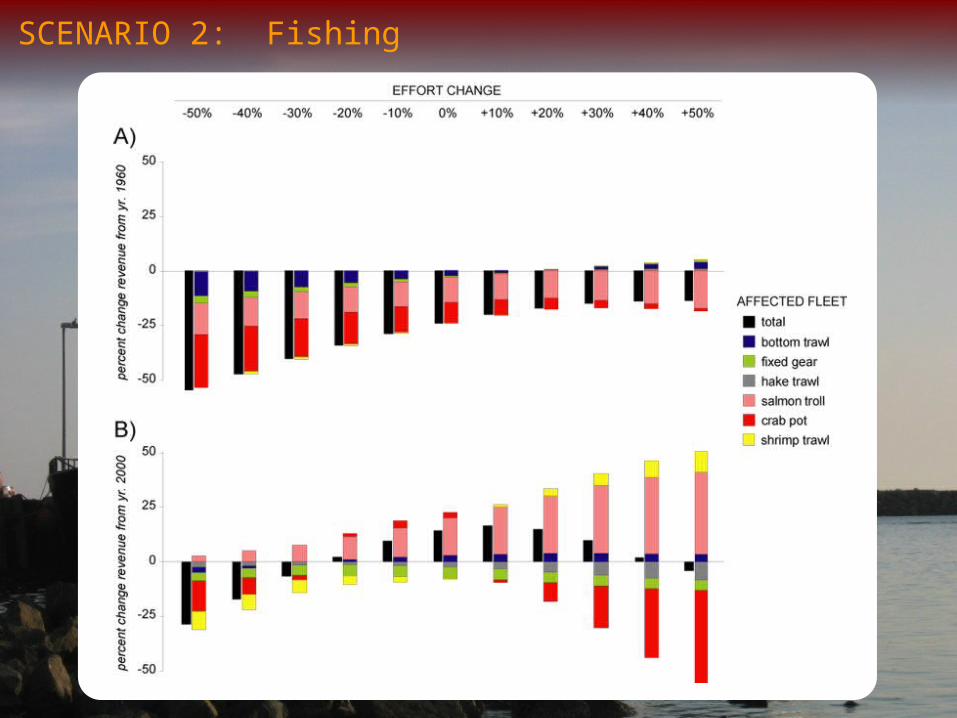
SCENARIO 2: Fishing

SCENARIO 2: Fishing

SCENARIO 2: Fishing

SCENARIO 2: Fishing

SCENARIO 3: Climate & Fishing

SCENARIO 3: Climate & Fishing
-100%
0%
100%
200%
300%
400%
500%
mam
mal
s
bird
s
salm
on
flatfi
sh
rock
fish
roun
dfis
h
hake
fora
ge fi
sh
crus
tace
ans
zoop
lank
ton
salm
on tr
oll
fixed
gea
r
botto
m tr
awl
hake
traw
l
crab
pot
shrim
p tra
wl
% C
HA
NG
E F
RO
M Y
R. 2
000
BA
SE
LIN
E
-1.00
-0.75
-0.50
-0.25
0.00
0.25
0.50
0.75
1.00
50
%-
- cu
rre
nt
40
%-
- cu
rre
nt
30
%-
- cu
rre
nt
20
%-
-cu
rre
nt
10
%-
-cu
rre
nt
Eq
- c
urr
en
t
10
%+
- c
urr
en
t
20
%+
- c
urr
en
t
30
%+
- c
urr
en
t
40
%+
- c
urr
en
t
50
%+
- c
urr
en
t
-1
-0.75
-0.5
-0.25
0
0.25
0.5
0.75
1
-50%
-25%
0%
25%
50%
75%
63-76CLIMATE
77-98CLIMATE
shrimp trawl
crab pot
hake trawl
bottom trawl
fixed gear
salmon
total
REVENUE
-1.00
-0.75
-0.50
-0.25
0.00
0.25
0.50
0.75
1.0050
%-
- cu
rren
t
40%
- -
curr
ent
30%
- -
curr
ent
20%
- -c
urre
nt
10%
- -c
urre
nt
Eq
- cu
rren
t
10%
+ -
cur
rent
20%
+ -
cur
rent
30%
+ -
cur
rent
40%
+ -
cur
rent
50%
+ -
cur
rent
63-76 CLIMATE
-1.00
-0.75
-0.50
-0.25
0.00
0.25
0.50
0.75
1.00
50%
- -cu
rrent
40%
- -cu
rrent
30%
- -cu
rrent
20%
- -cu
rrent
10%
- -cu
rrent
Eq -
curre
nt
10%
+ -
curre
nt20
%+
-cu
rrent
30%
+ -
curre
nt40
%+
-cu
rrent
50%
+ -
curre
nt
-1
-0.75
-0.5
-0.25
0
0.25
0.5
0.75
1
77-98 CLIMATE
SUMMARY
thanks to: WA Sea Grant, IPDES, SAFS