Embed Size (px)
Citation preview

Quantifying the Performance of Garbage Collection vs.
Explicit Memory Management
Matthew HertzCanisius College
Emery BergerUniversity of Massachusetts Amherst
Quantifying the Performance of GC vs. Explicit Memory ManagementQuantifying the Performance of GC vs. Explicit Memory Management
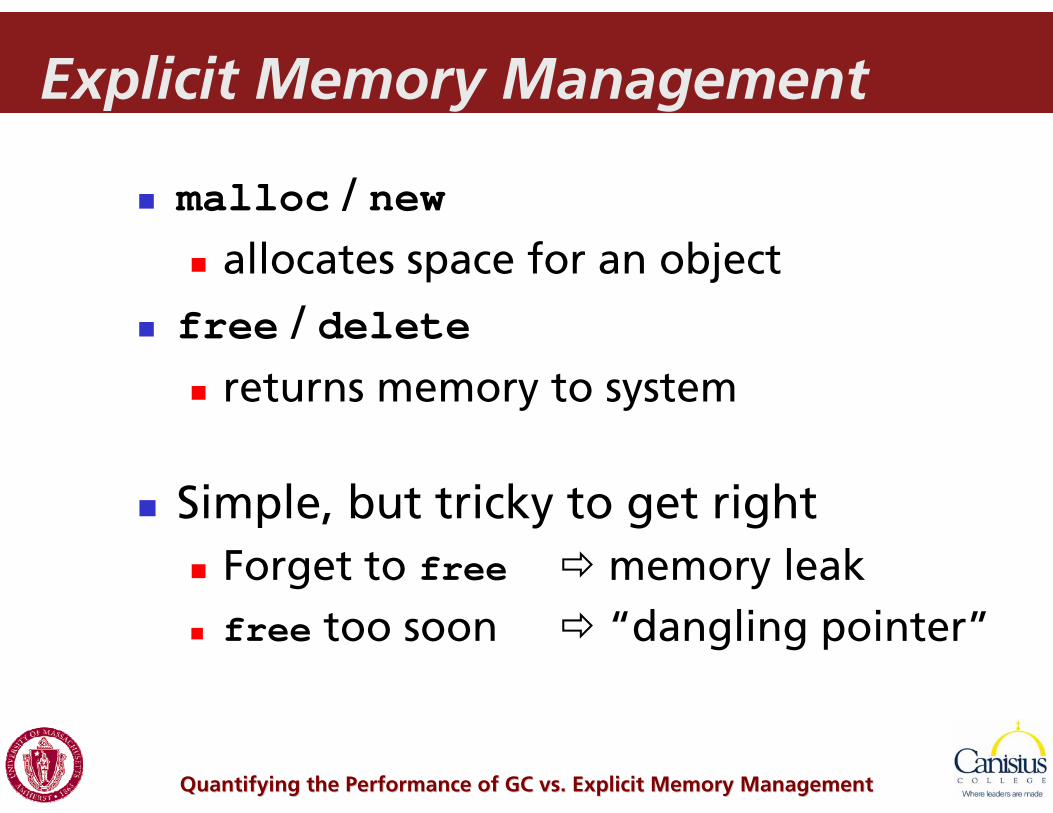
Explicit Memory Management
malloc / newallocates space for an object
free / deletereturns memory to system
Simple, but tricky to get rightForget to free memory leakfree too soon “dangling pointer”
Quantifying the Performance of GC vs. Explicit Memory ManagementQuantifying the Performance of GC vs. Explicit Memory Management
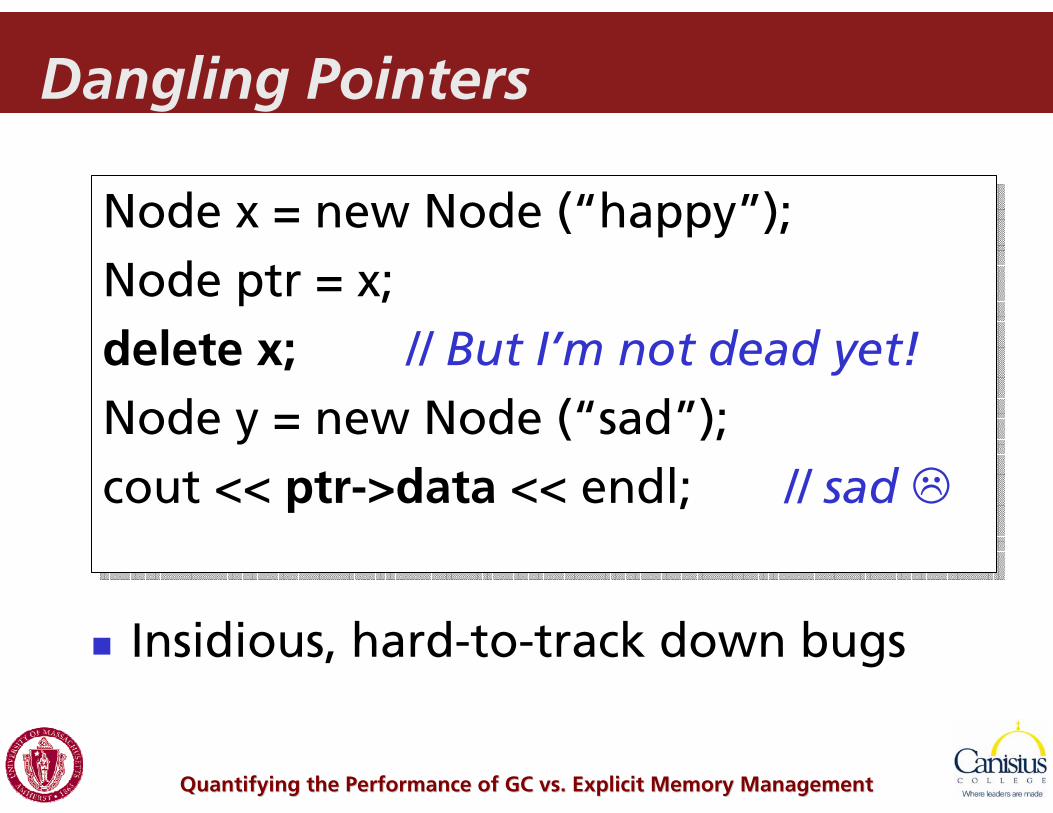
Dangling Pointers
Node x = new Node (“happy”);Node ptr = x;delete x; // But I’m not dead yet!Node y = new Node (“sad”);cout << ptr->data << endl; // sad
Node x = new Node (“happy”);Node ptr = x;delete x; // But I’m not dead yet!Node y = new Node (“sad”);cout << ptr->data << endl; // sad
Insidious, hard-to-track down bugs

Quantifying the Performance of GC vs. Explicit Memory ManagementQuantifying the Performance of GC vs. Explicit Memory Management
Solution: Garbage Collection
No need to call freeGarbage collector periodically scans objects on heapReclaims unreachable objects
Won’t reclaim objects until it can prove object will not be used again

Quantifying the Performance of GC vs. Explicit Memory ManagementQuantifying the Performance of GC vs. Explicit Memory Management
No More Dangling Pointers
Node x = new Node (“happy”);Node ptr = x;// x still live (reachable through ptr) Node y = new Node (“sad”);cout << ptr->data << endl; // happy! ☺
Node x = new Node (“happy”);Node ptr = x;// x still live (reachable through ptr) Node y = new Node (“sad”);cout << ptr->data << endl; // happy! ☺
So why not use GCall the time?

Quantifying the Performance of GC vs. Explicit Memory ManagementQuantifying the Performance of GC vs. Explicit Memory Management
Conventional Wisdom
“GC worse than malloc, because…”Extra processing (collection)Poor cache performance (ibid)Bad page locality (ibid)Increased footprint (delayed reclamation)

Quantifying the Performance of GC vs. Explicit Memory ManagementQuantifying the Performance of GC vs. Explicit Memory Management
Conventional Wisdom
“GC improves performance, by…”Quicker allocation(fast path inlining & bump pointer alloc.)Better cache performance (object reordering)Improved page locality (heap compaction)

Quantifying the Performance of GC vs. Explicit Memory ManagementQuantifying the Performance of GC vs. Explicit Memory Management
Outline
MotivationQuantifying GC performance
A hard problem
Oracular memory managementSelecting & generating the Oracles
Experimental methodologyResults

Quantifying the Performance of GC vs. Explicit Memory ManagementQuantifying the Performance of GC vs. Explicit Memory Management
Quantifying GC Performance
Apples-to-apples comparisonExamine unaltered applicationsRuns differ only in memory manager
Examine impact on time & space

Quantifying the Performance of GC vs. Explicit Memory ManagementQuantifying the Performance of GC vs. Explicit Memory Management
Quantifying GC Performance
Evaluate state-of-art algorithmsGarbage collectors
Generational collectorsCopying collectors
Standard for Java, not compatible with C/C++
Explicit memory managersFast, single-threaded allocators

Quantifying the Performance of GC vs. Explicit Memory ManagementQuantifying the Performance of GC vs. Explicit Memory Management
Comparing Memory Managers
BDWCollector
Node v = malloc(sizeof(Node));v->data= malloc(sizeof(NodeData));memcpy(v->data, old->data,
sizeof(NodeData));free(old->data);v->next = old->next;v->next->prev = v;v->prev = old->prev;v->prev->next = v;free(old);
Using GC in C/C++ is easy:

Quantifying the Performance of GC vs. Explicit Memory ManagementQuantifying the Performance of GC vs. Explicit Memory Management
Comparing Memory Managers
BDWCollector
Node v = malloc(sizeof(Node));v->data= malloc(sizeof(NodeData));memcpy(v->data, old->data,
sizeof(NodeData));free(old->data);v->next = old->next;v->next->prev = v;v->prev = old->prev;v->prev->next = v;free(old);
…ignore calls to free.

Quantifying the Performance of GC vs. Explicit Memory ManagementQuantifying the Performance of GC vs. Explicit Memory Management
Comparing Memory Managers
LeaAllocator
Node node = new Node();node.data = new NodeData();useNode(node);node = null;...node = new Node();...node.data = new NodeData();...
Adding malloc/free to Java: not easy…

Quantifying the Performance of GC vs. Explicit Memory ManagementQuantifying the Performance of GC vs. Explicit Memory Management
Comparing Memory Managers
LeaAllocator
Node node = new Node();node.data = new NodeData();useNode(node);node = null;...node = new Node();...node.data = new NodeData();...
... where should free be inserted?
free(node.data)?
free(node)?

Quantifying the Performance of GC vs. Explicit Memory ManagementQuantifying the Performance of GC vs. Explicit Memory Management
Inserting Free Calls
Do not know where programmer would call free
Hints provided from null-ing pointersRestructure code to avoid memory leaks?
Tests programming skills, not memory manager
Want unaltered applications

Quantifying the Performance of GC vs. Explicit Memory ManagementQuantifying the Performance of GC vs. Explicit Memory Management
Oracular Memory Manager
Java
Simulator
C malloc/free
perform actions atno cost below here
execute program here
allocation
Oracle
Consult oracle to place free callsOracle does not disrupt hardware stateSimulator inserts free…

Quantifying the Performance of GC vs. Explicit Memory ManagementQuantifying the Performance of GC vs. Explicit Memory Management
Object Lifetime & Oracle Placement
Oracles bracket placement of freesLifetime-based: most aggressiveReachability-based: most conservative
unreachable
live dead
reachable
freed bylifetime-basedoracle
freed byreachability-based
oraclecan be collectedfree(obj)
obj =new Object;
obj =new Object;
can be freed
free(obj) free(??)

Quantifying the Performance of GC vs. Explicit Memory ManagementQuantifying the Performance of GC vs. Explicit Memory Management
Reachability Oracle Generation
Java
PowerPCSimulator
C malloc/free
perform actions atno cost below here
execute program here
tracefile
allocations,ptr updates,prog roots
Merlin analysis
Illegal instructions mark heap eventsSimulated identically to legal instructions
Oracle

Quantifying the Performance of GC vs. Explicit Memory ManagementQuantifying the Performance of GC vs. Explicit Memory Management
Liveness Oracle Generation
Java
PowerPCSimulator
C malloc/free
perform actions atno cost below here
execute program here
tracefile
allocations, mem access, prog roots
Post-process
Record allocations, memory accessesPreserve code, type objects, etc.May use objects without accessing them
Oracle

Quantifying the Performance of GC vs. Explicit Memory ManagementQuantifying the Performance of GC vs. Explicit Memory Management
Liveness Oracle Generation
Java
PowerPCSimulator
C malloc/free
perform actions atno cost below here
execute program here
tracefile
allocation, mem access, prog. roots
Post-process
Record allocations, memory accessesPreserve code, type objects, etc.May use objects without accessing them
Oracle
if (f.x == y) { … }
uses address of f.x, but may not touch f.x or f

Quantifying the Performance of GC vs. Explicit Memory ManagementQuantifying the Performance of GC vs. Explicit Memory Management
Oracular Memory Manager
Java
PowerPCSimulator
C malloc/free
perform actions atno cost below here
execute program here
oracle
allocation
Consult oracle before each allocationWhen needed, modify instructions to call freeExtra costs hidden by simulator

Quantifying the Performance of GC vs. Explicit Memory ManagementQuantifying the Performance of GC vs. Explicit Memory Management
Experimental Methodology
Java platform:MMTk/Jikes RVM(2.3.2)
Simulator:Dynamic SimpleScalar (DSS)Simulates 2GHz PowerPC processor
G5 cache configuration

Quantifying the Performance of GC vs. Explicit Memory ManagementQuantifying the Performance of GC vs. Explicit Memory Management
Experimental Methodology
Garbage collectors:GenMS, GenCopy, GenRC, SemiSpace, CopyMS, MarkSweep
Explicit memory managers:Lea, MSExplicit (MS + explicit deallocation)

Quantifying the Performance of GC vs. Explicit Memory ManagementQuantifying the Performance of GC vs. Explicit Memory Management
Experimental Methodology
Perfectly repeatable runsPseudoadaptive compiler
Same sequence of optimizationsAdvice generated from mean of 5 runs
Deterministic thread switchingDeterministic system clockUse “illegal” instructions in all runs

Quantifying the Performance of GC vs. Explicit Memory ManagementQuantifying the Performance of GC vs. Explicit Memory Management
Execution Time for pseudoJBB
GC performance can be competitive

Quantifying the Performance of GC vs. Explicit Memory ManagementQuantifying the Performance of GC vs. Explicit Memory Management
0%
100%
200%
300%
400%
500%
600%
700%
800%
Lea w/ Reach Lea w/ Li f e MSExpl ici tw/ Reach
Kingsley GenMS GenCopy CopyMS SemiSpace Mar kSweep
Footprint at Quickest Run
GC uses much more memory
1.001.38 1.61
5.105.66
4.84
7.697.09
0.63

Quantifying the Performance of GC vs. Explicit Memory ManagementQuantifying the Performance of GC vs. Explicit Memory Management
Avg. Relative Cycles and Footprint
GC trades space for time

Quantifying the Performance of GC vs. Explicit Memory ManagementQuantifying the Performance of GC vs. Explicit Memory Management
Javac Paging Performance
Much slower in limited physical RAM

Quantifying the Performance of GC vs. Explicit Memory ManagementQuantifying the Performance of GC vs. Explicit Memory Management
pseudoJBB Paging Performance
Lifetime analysis adds little

Quantifying the Performance of GC vs. Explicit Memory ManagementQuantifying the Performance of GC vs. Explicit Memory Management
Summary of Results
Best collector equals Lea's performance…
Up to 10% faster on some benchmarks
... but uses more memoryQuickest runs use 5x or more memoryAt least twice mean footprint

Quantifying the Performance of GC vs. Explicit Memory ManagementQuantifying the Performance of GC vs. Explicit Memory Management
Take-home: Practitioners
GC ok if:system has more than 3x needed RAM,and no competition with other processes
GC not so good if:Limited RAMCompetition for physical memoryRelies upon RAM for performance
In-memory databaseSearch engines, etc.

Quantifying the Performance of GC vs. Explicit Memory ManagementQuantifying the Performance of GC vs. Explicit Memory Management
Take-home: Researchers
GC performance already good enoughwith enough RAMProblems:
Paging is a killerPerformance suffers when RAM limited

Quantifying the Performance of GC vs. Explicit Memory ManagementQuantifying the Performance of GC vs. Explicit Memory Management
Future Work
Obvious dimensionsOther collectors:
Bookmarking collector [PLDI 05]Parallel collectors
Other allocators:New version of DLmalloc (2.8.2)VAM [ISMM 05]
Other architectures:Examine impact of cache size

Quantifying the Performance of GC vs. Explicit Memory ManagementQuantifying the Performance of GC vs. Explicit Memory Management
Future Work
Other memory management methodsRegions, reaps

Quantifying the Performance of GC vs. Explicit Memory ManagementQuantifying the Performance of GC vs. Explicit Memory Management
Conclusion
Code available at: http://www-cs.canisius.edu/~hertzm