Embed Size (px)
Citation preview
JVM Garbage Collection Tuning
Heejong Lee
Reference: JVM Garbage Collection Tuning (http://www.oracle.com/technetwork/java/javase/gc-tuning-6-140523.html)
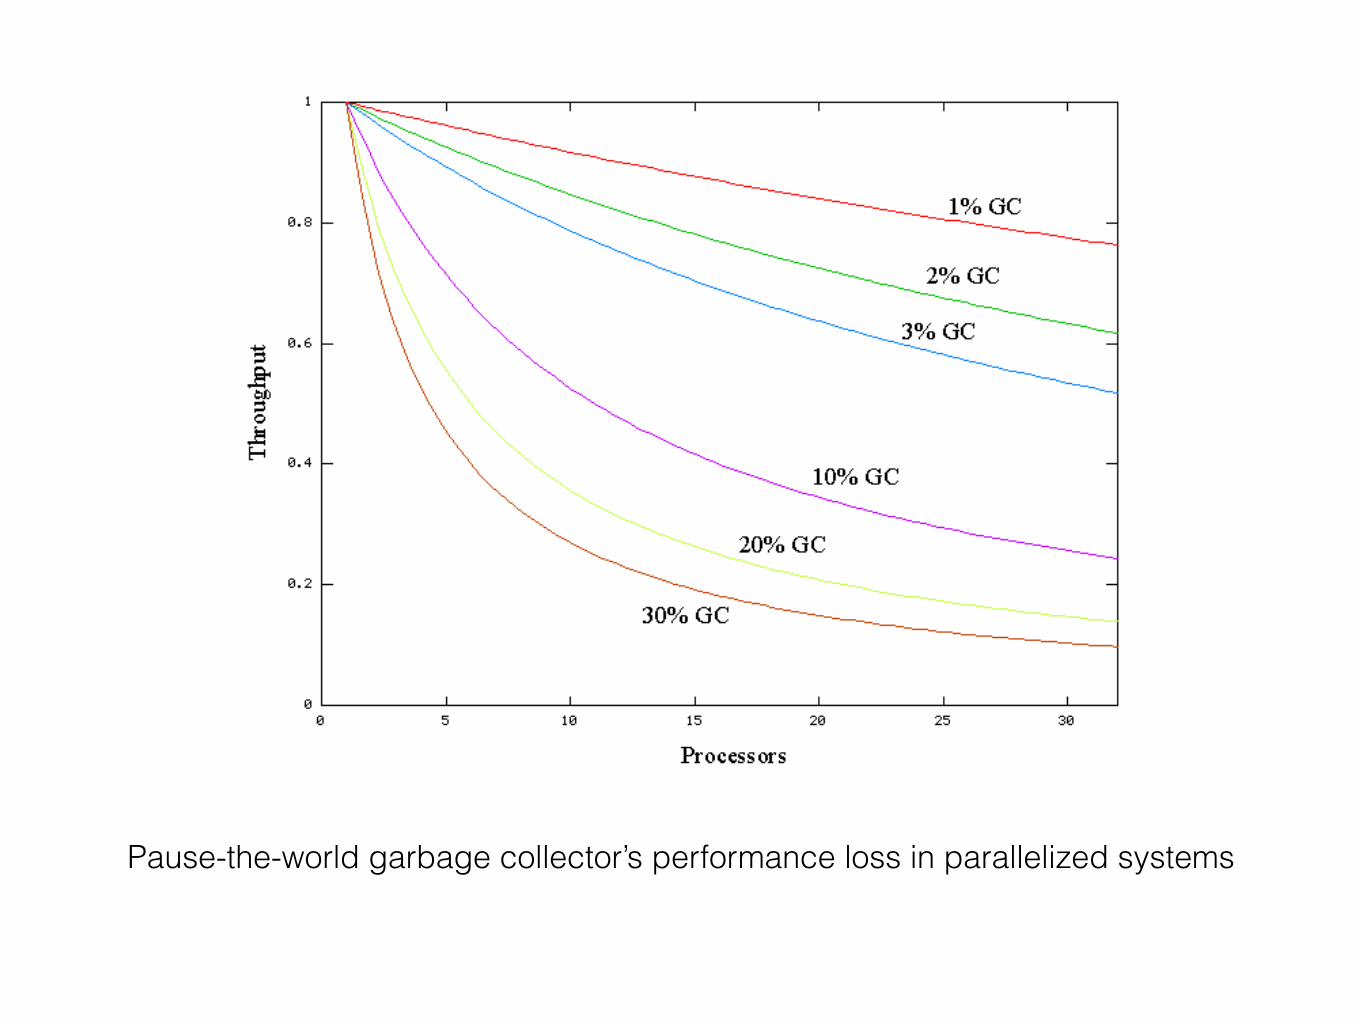
Pause-the-world garbage collector’s performance loss in parallelized systems
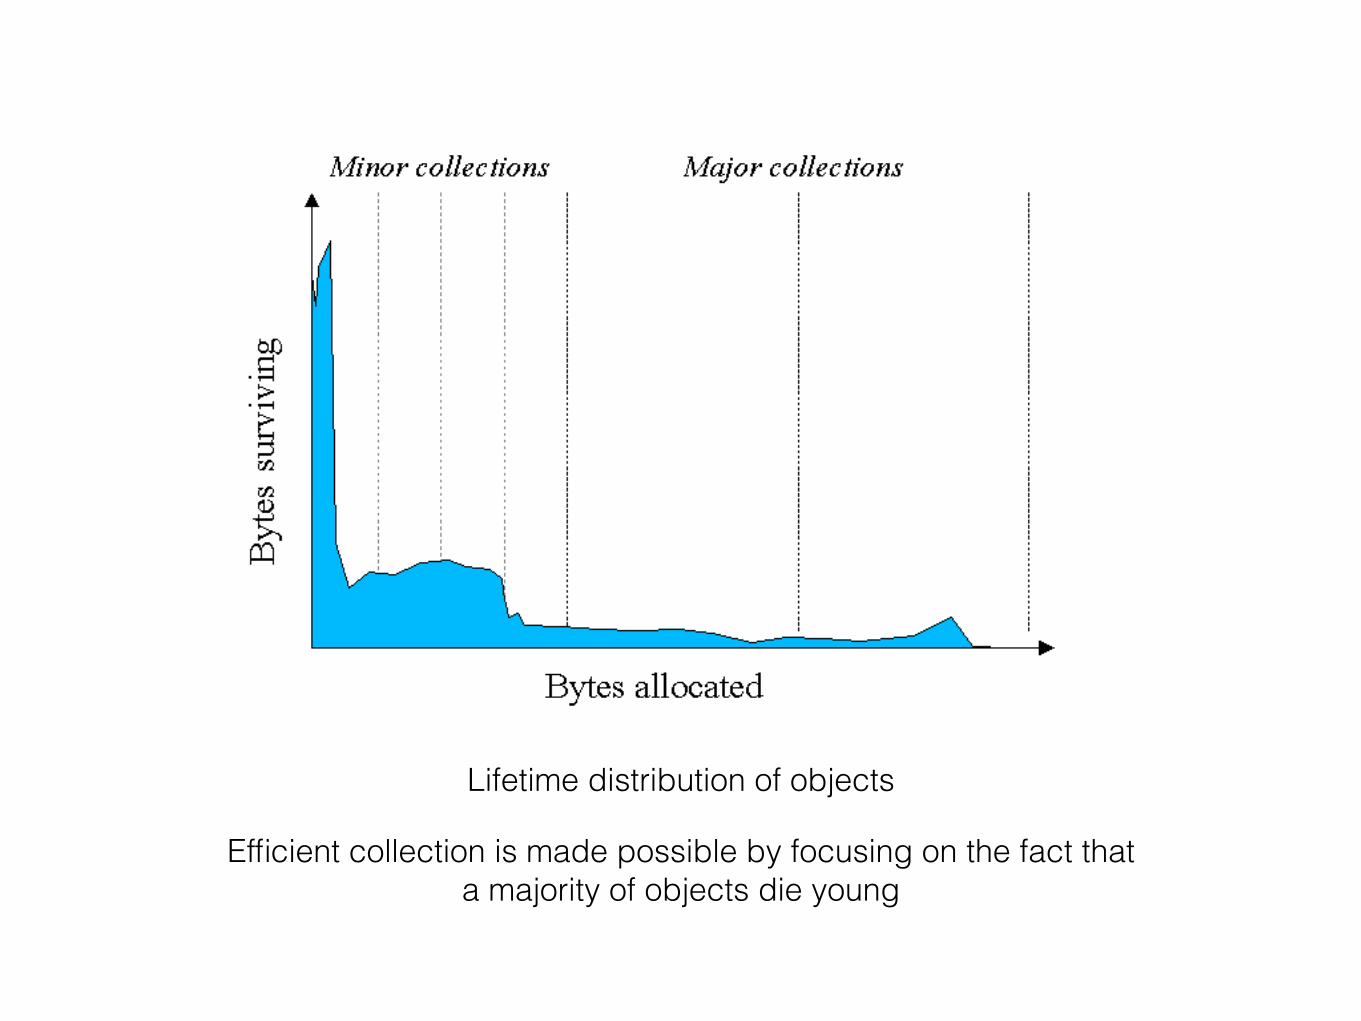
Lifetime distribution of objects
Efficient collection is made possible by focusing on the fact that a majority of objects die young
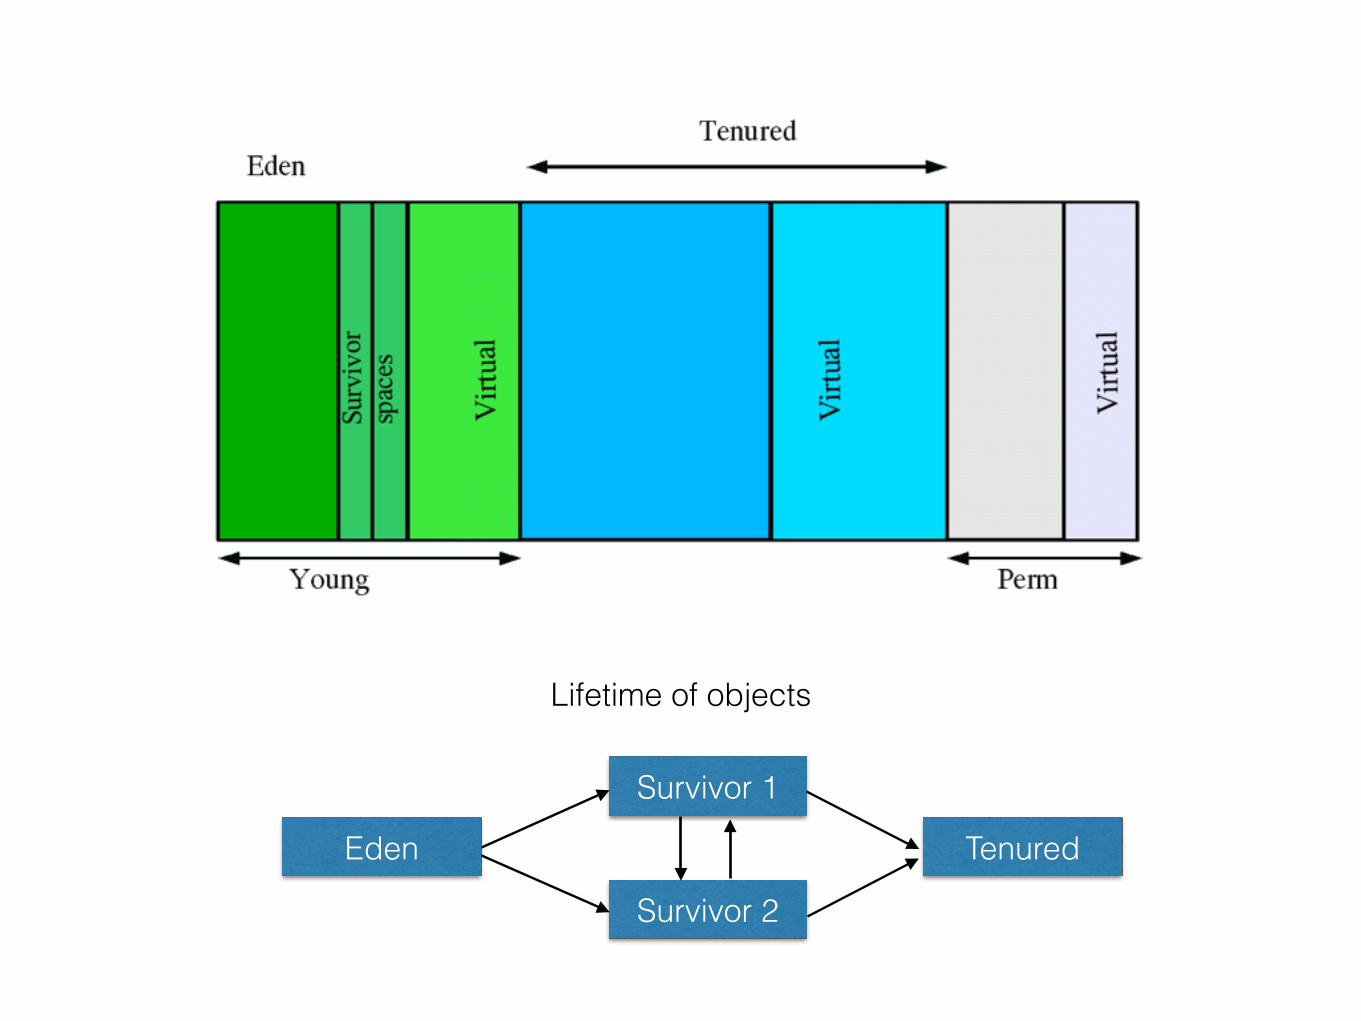
Lifetime of objects
Eden
Survivor 1
Survivor 2
Tenured
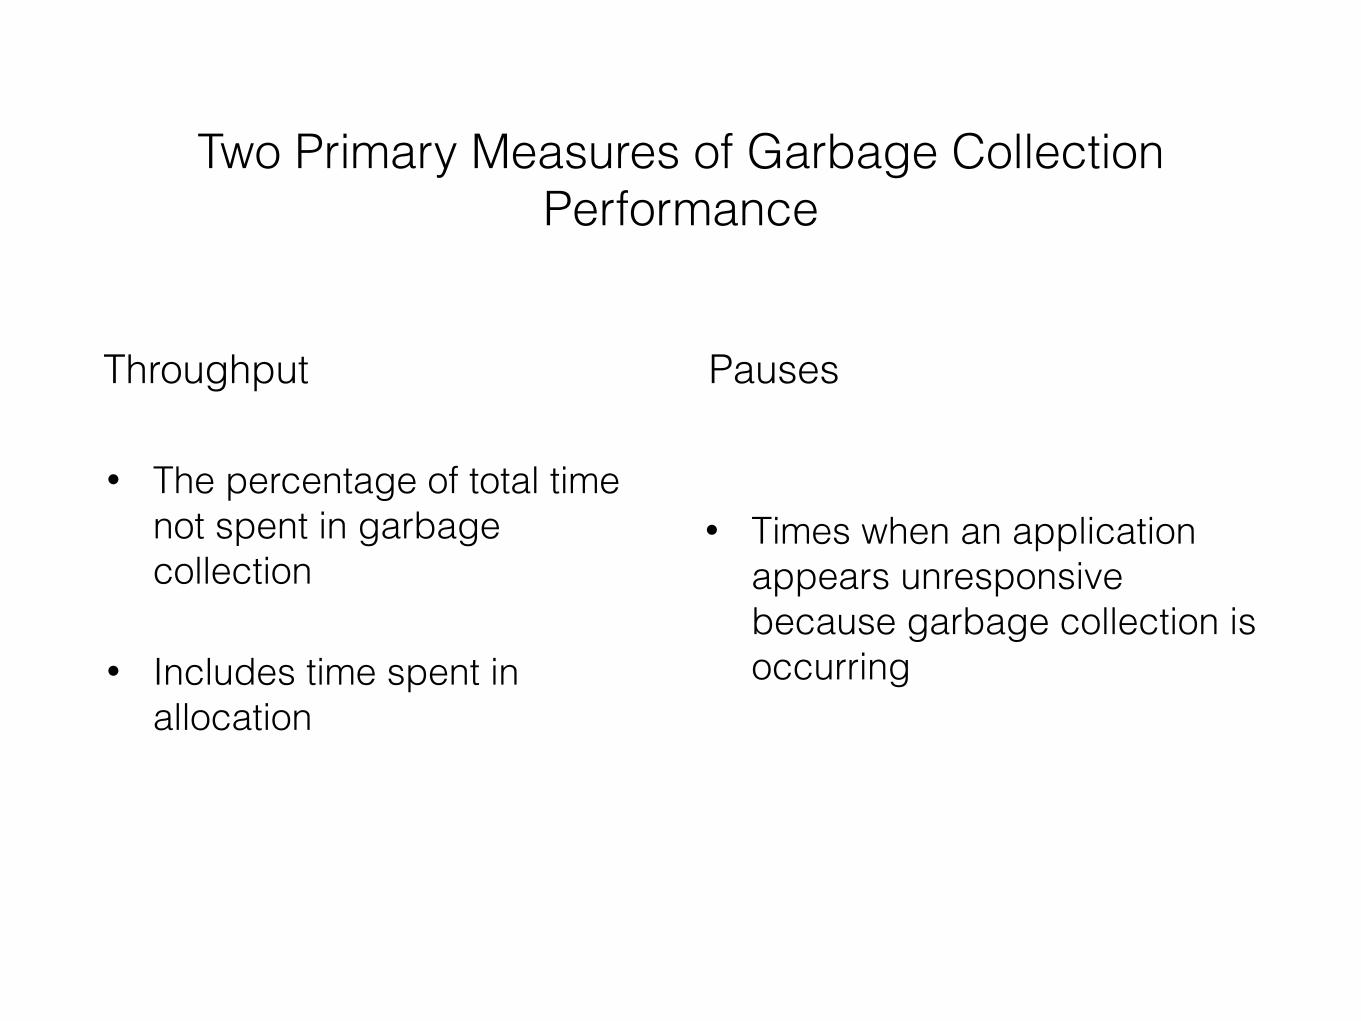
• The percentage of total time not spent in garbage collection
• Includes time spent in allocation
Two Primary Measures of Garbage Collection Performance
• Times when an application appears unresponsive because garbage collection is occurring
Throughput Pauses
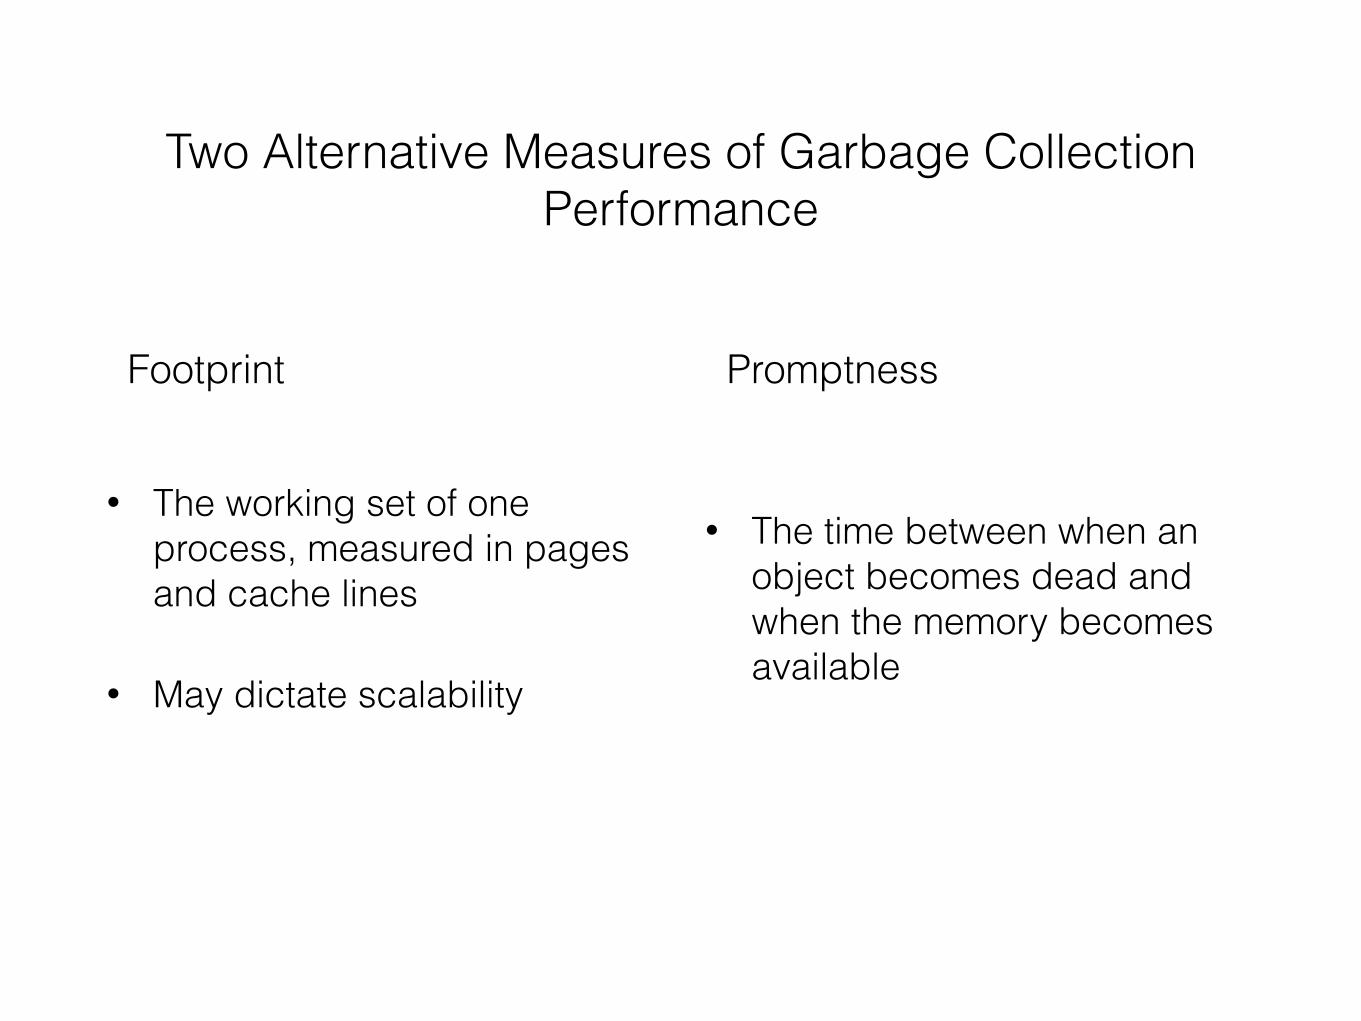
• The working set of one process, measured in pages and cache lines
• May dictate scalability
Two Alternative Measures of Garbage Collection Performance
• The time between when an object becomes dead and when the memory becomes available
Footprint Promptness
Trade-off between Measures of Garbage Collection Performance
• A very large young generation space may maximize throughput, but does so at the expense of footprint, promptness and pause times
• A small young generation space can minimize young generation pauses at the expense of throughput
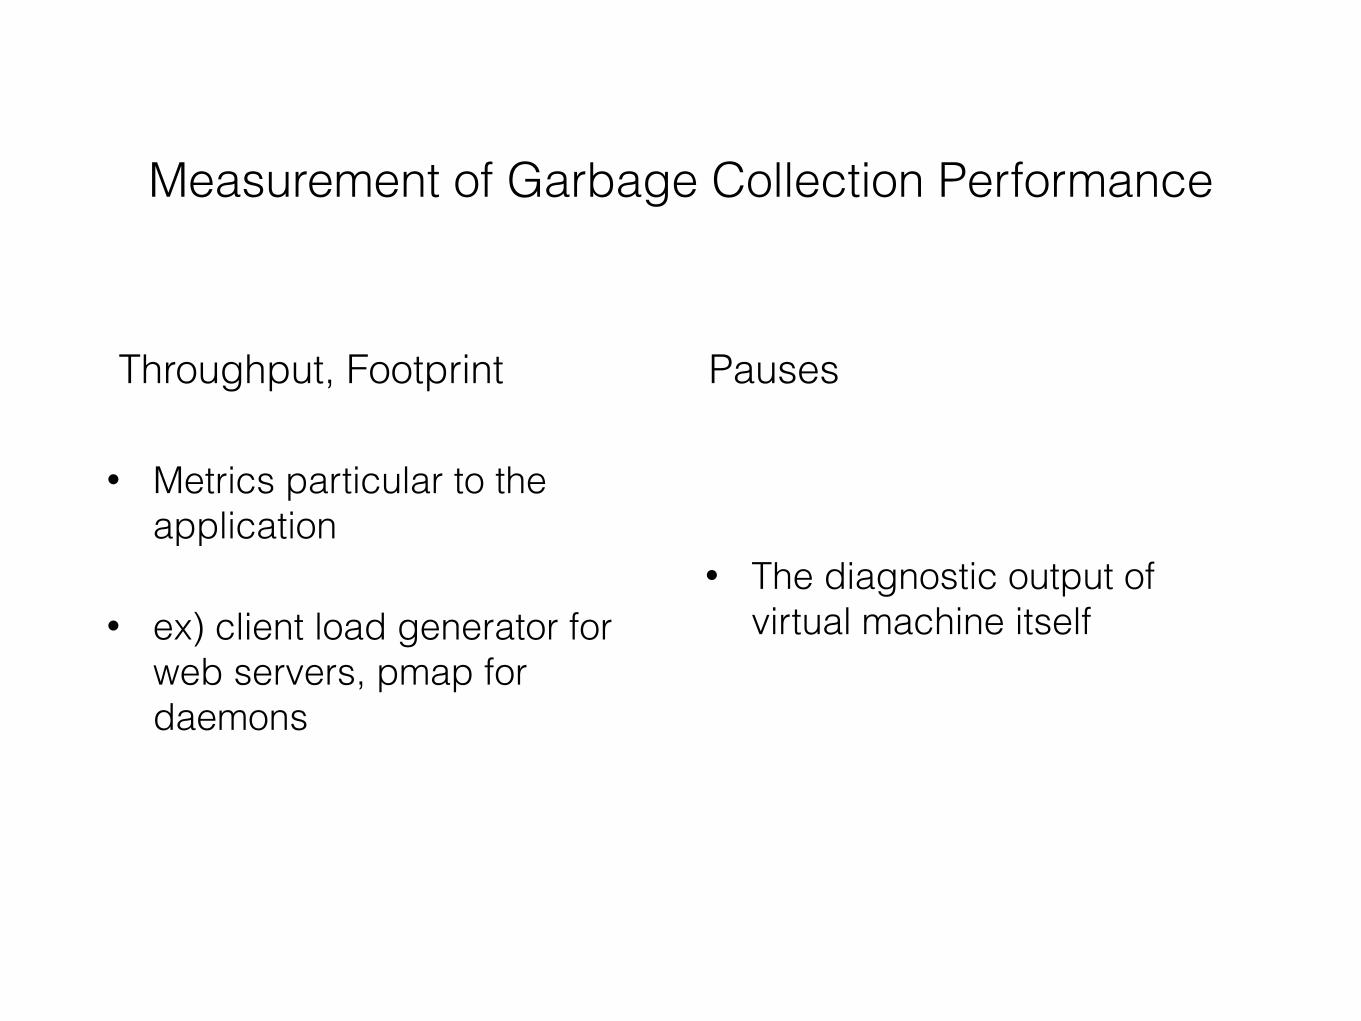
• Metrics particular to the application
• ex) client load generator for web servers, pmap for daemons
Measurement of Garbage Collection Performance
• The diagnostic output of virtual machine itself
Throughput, Footprint Pauses
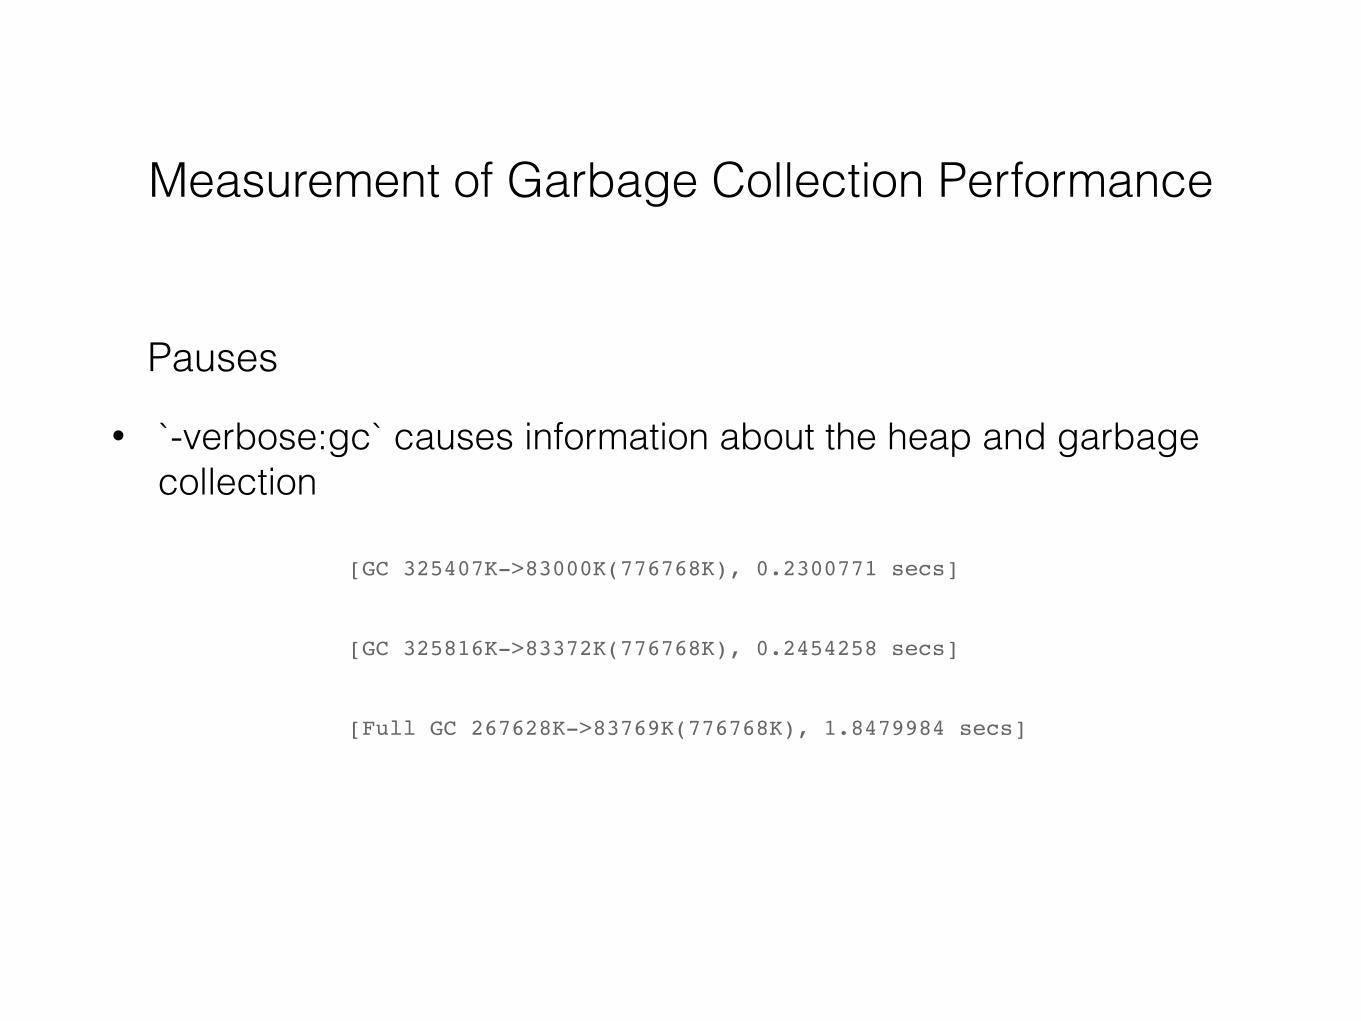
Measurement of Garbage Collection Performance
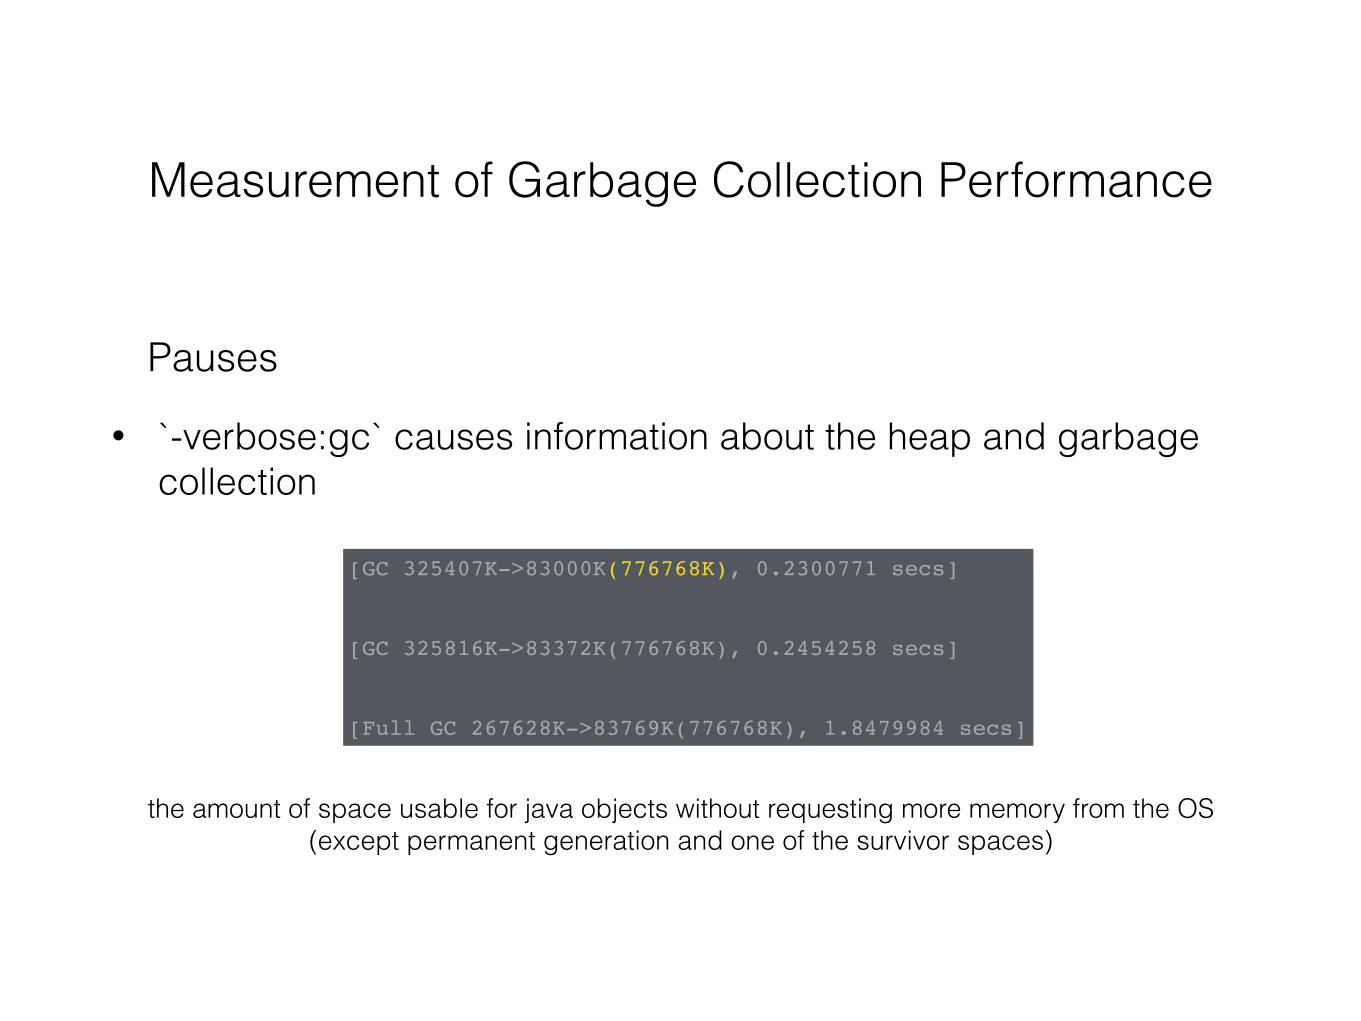
• `-verbose:gc` causes information about the heap and garbage collection
Pauses
[GC 325407K->83000K(776768K), 0.2300771 secs]
[GC 325816K->83372K(776768K), 0.2454258 secs]
[Full GC 267628K->83769K(776768K), 1.8479984 secs]
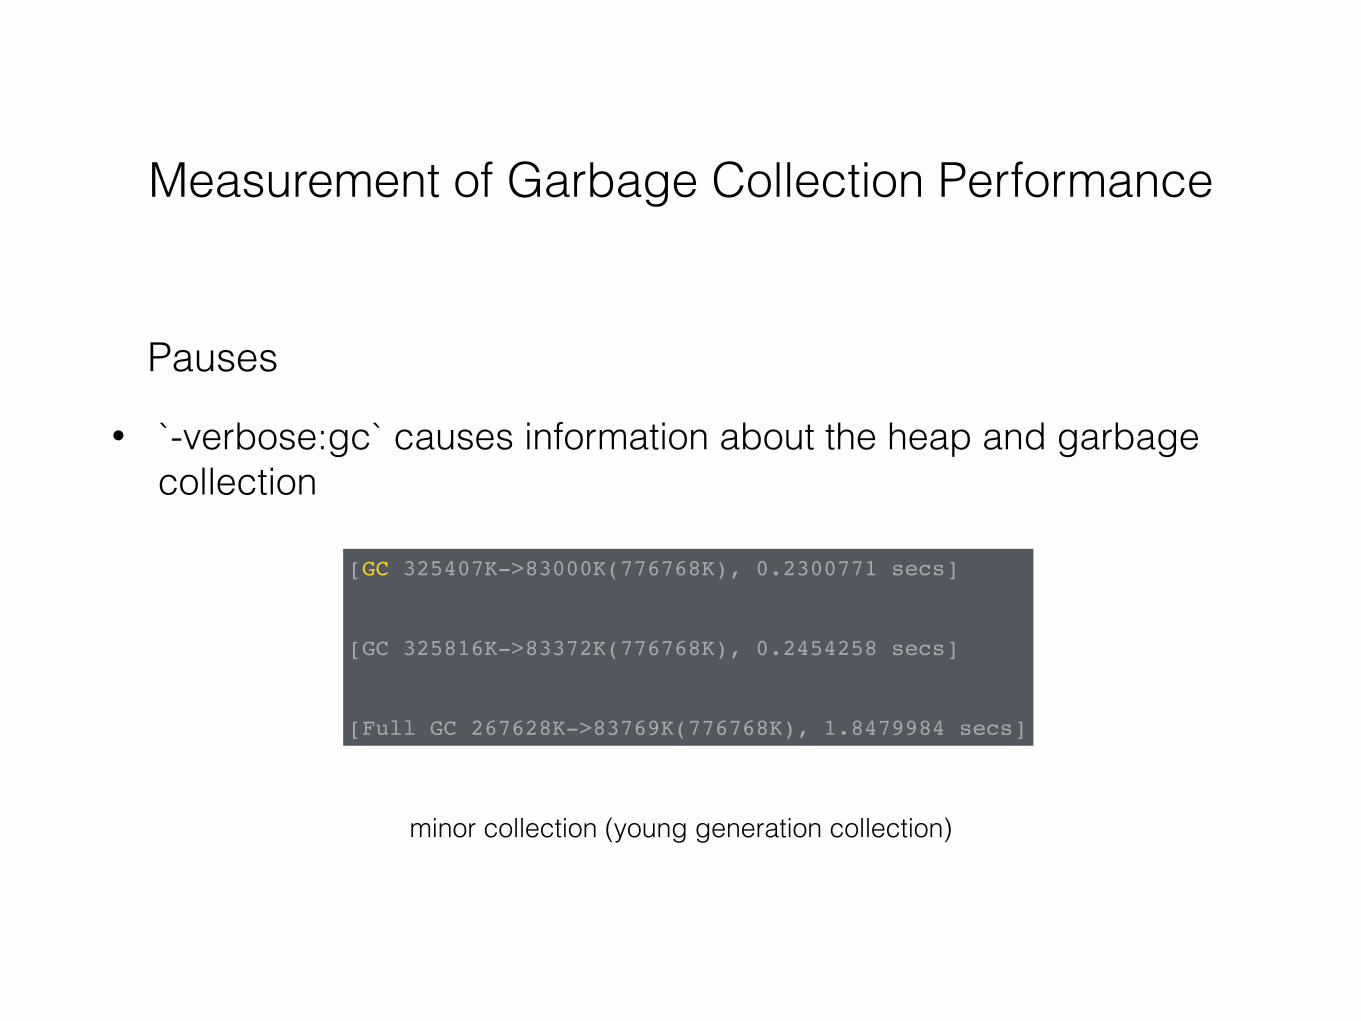
Measurement of Garbage Collection Performance
• `-verbose:gc` causes information about the heap and garbage collection
Pauses
[GC 325407K->83000K(776768K), 0.2300771 secs]
[GC 325816K->83372K(776768K), 0.2454258 secs]
[Full GC 267628K->83769K(776768K), 1.8479984 secs]
minor collection (young generation collection)
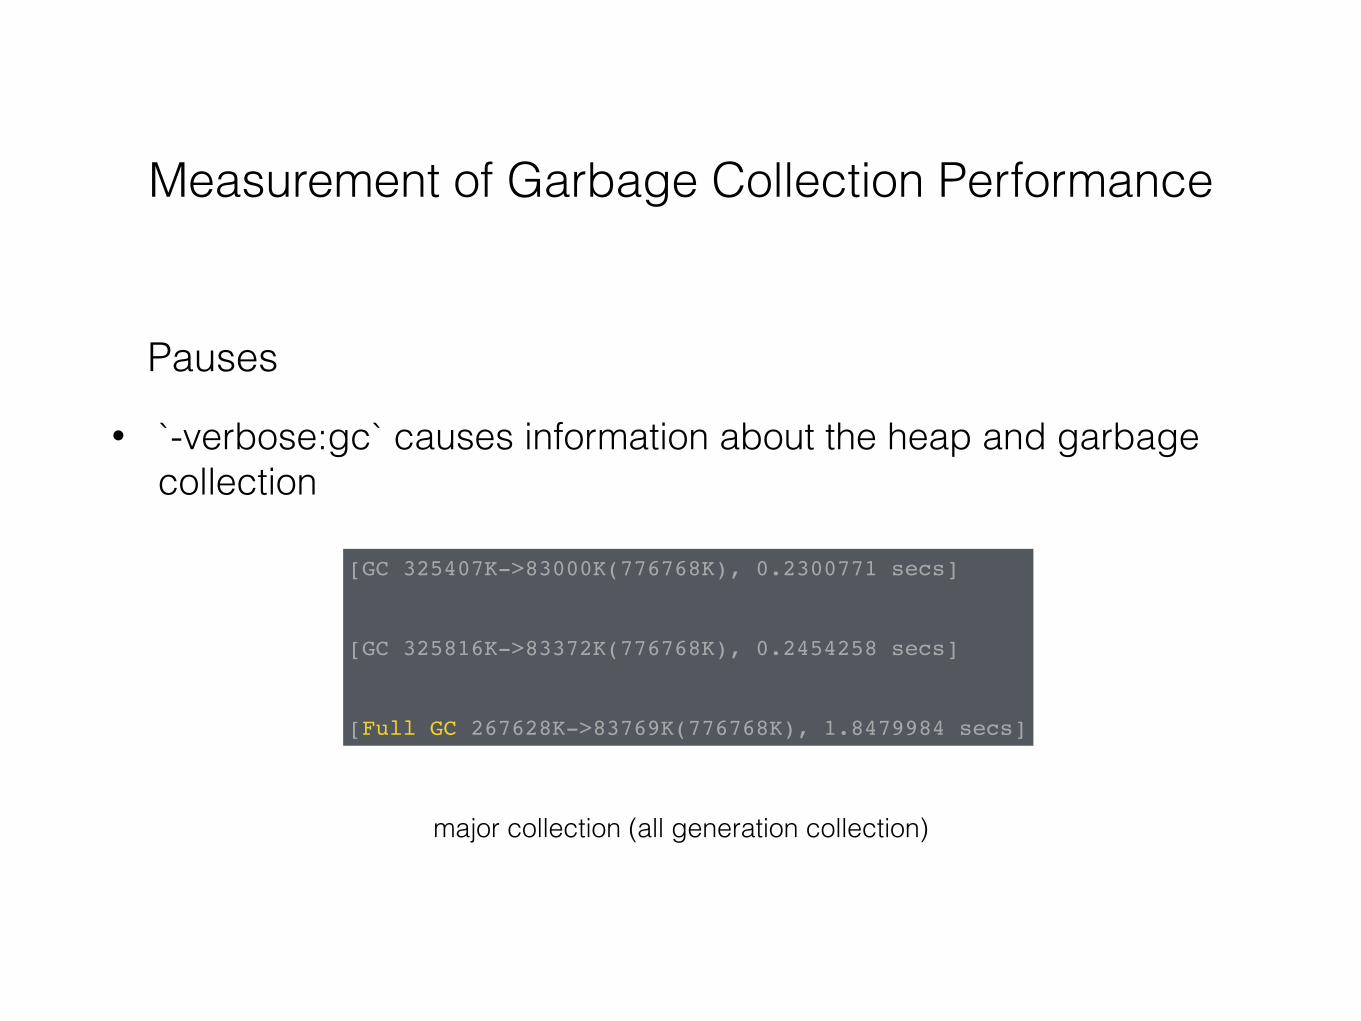
Measurement of Garbage Collection Performance
• `-verbose:gc` causes information about the heap and garbage collection
Pauses
[GC 325407K->83000K(776768K), 0.2300771 secs]
[GC 325816K->83372K(776768K), 0.2454258 secs]
[Full GC 267628K->83769K(776768K), 1.8479984 secs]
major collection (all generation collection)
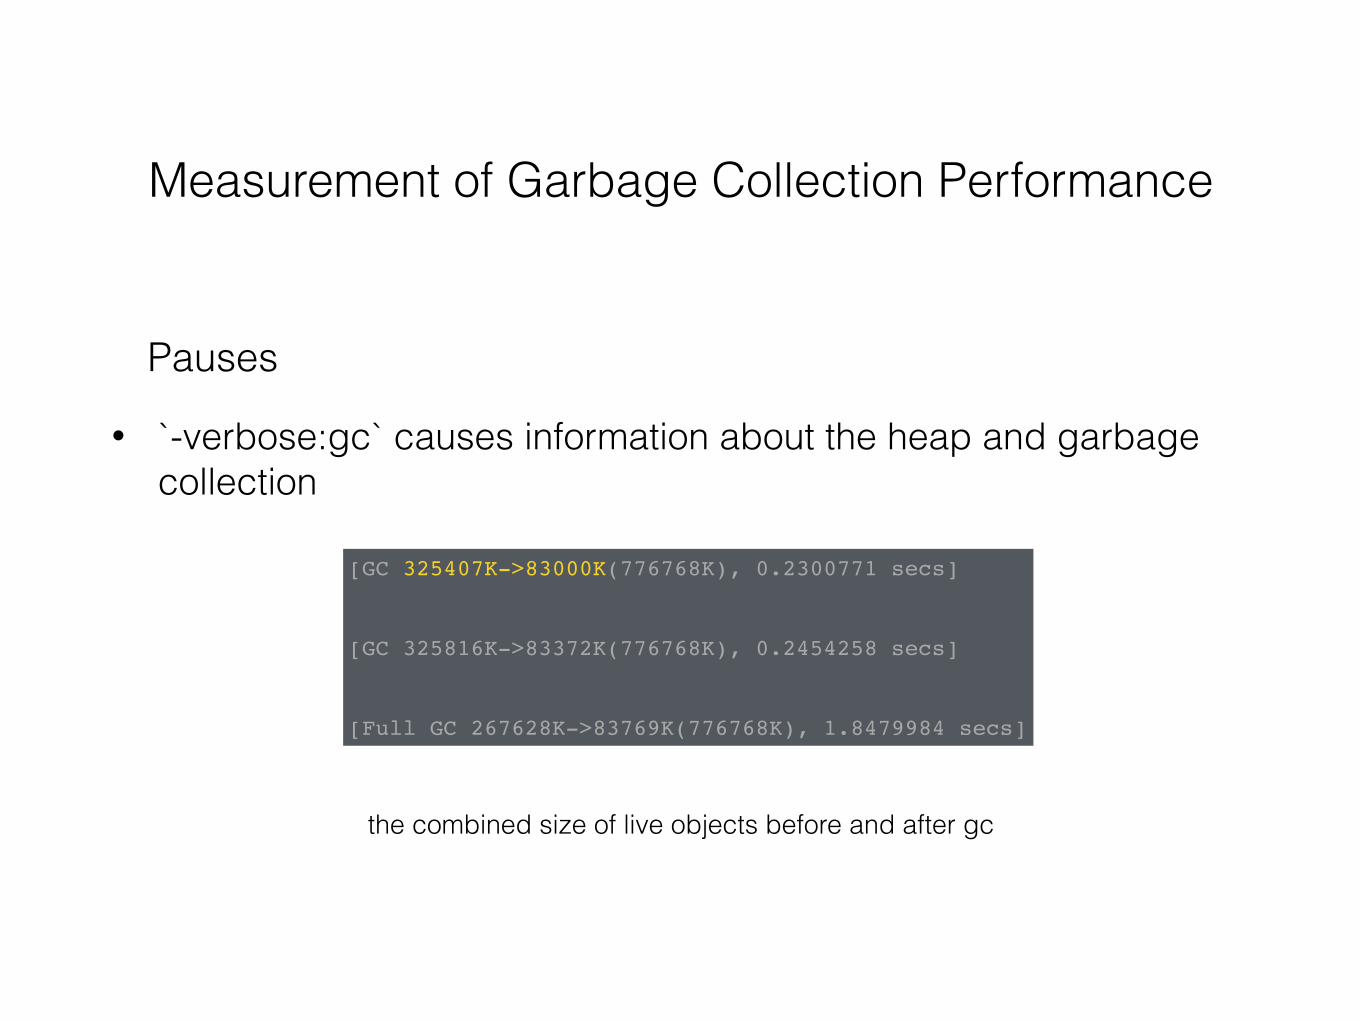
Measurement of Garbage Collection Performance
• `-verbose:gc` causes information about the heap and garbage collection
Pauses
[GC 325407K->83000K(776768K), 0.2300771 secs]
[GC 325816K->83372K(776768K), 0.2454258 secs]
[Full GC 267628K->83769K(776768K), 1.8479984 secs]
the combined size of live objects before and after gc
Measurement of Garbage Collection Performance
• `-verbose:gc` causes information about the heap and garbage collection
Pauses
[GC 325407K->83000K(776768K), 0.2300771 secs]
[GC 325816K->83372K(776768K), 0.2454258 secs]
[Full GC 267628K->83769K(776768K), 1.8479984 secs]
the amount of space usable for java objects without requesting more memory from the OS (except permanent generation and one of the survivor spaces)
Measurement of Garbage Collection Performance
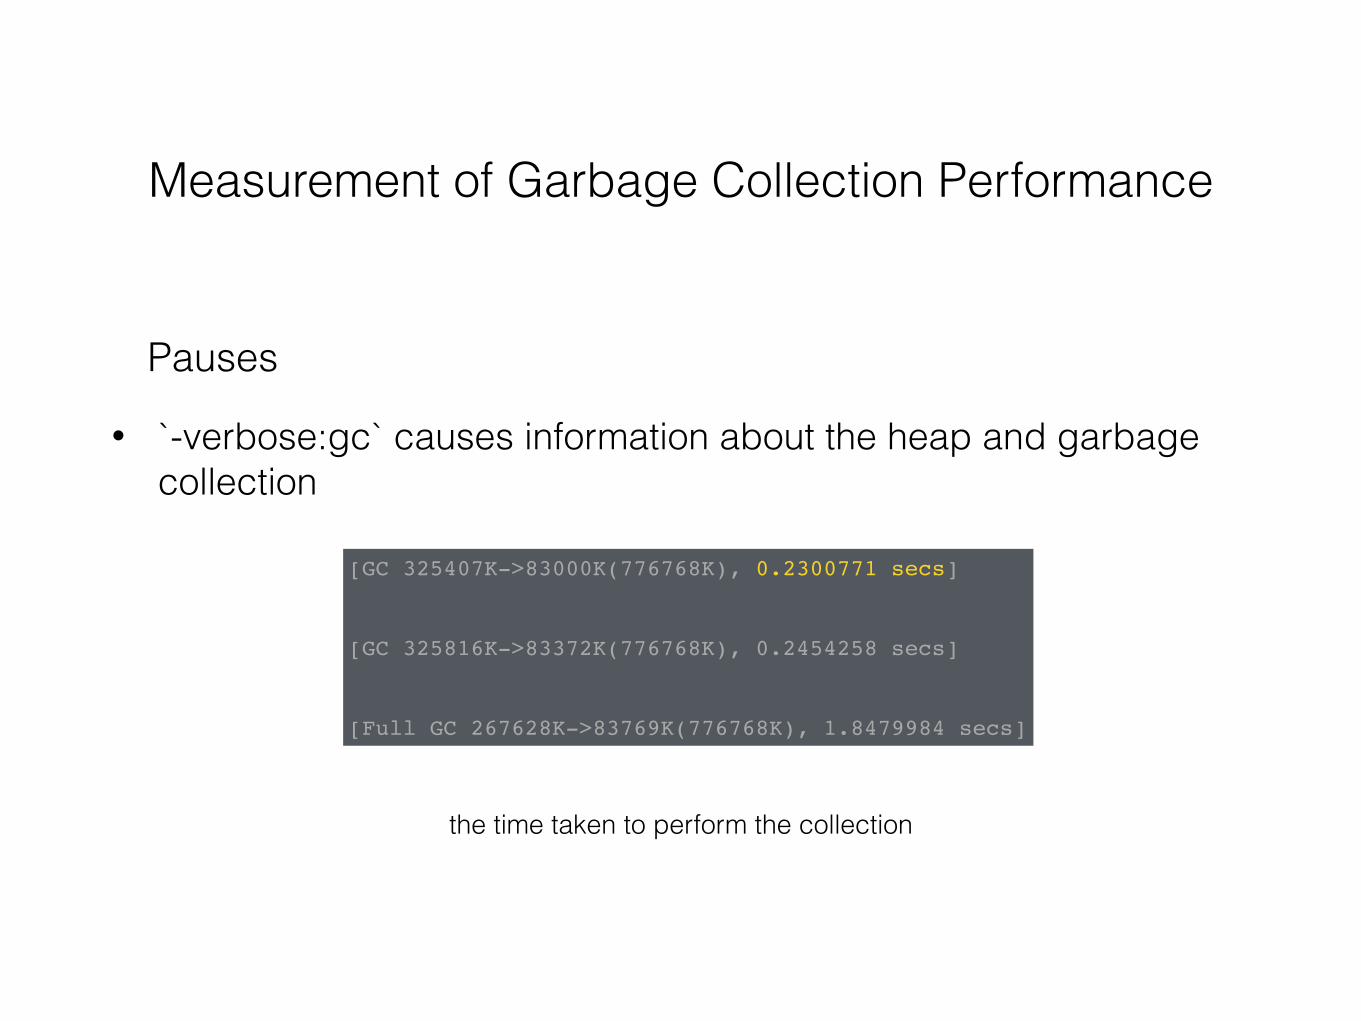
• `-verbose:gc` causes information about the heap and garbage collection
Pauses
[GC 325407K->83000K(776768K), 0.2300771 secs]
[GC 325816K->83372K(776768K), 0.2454258 secs]
[Full GC 267628K->83769K(776768K), 1.8479984 secs]
the time taken to perform the collection
Measurement of Garbage Collection Performance
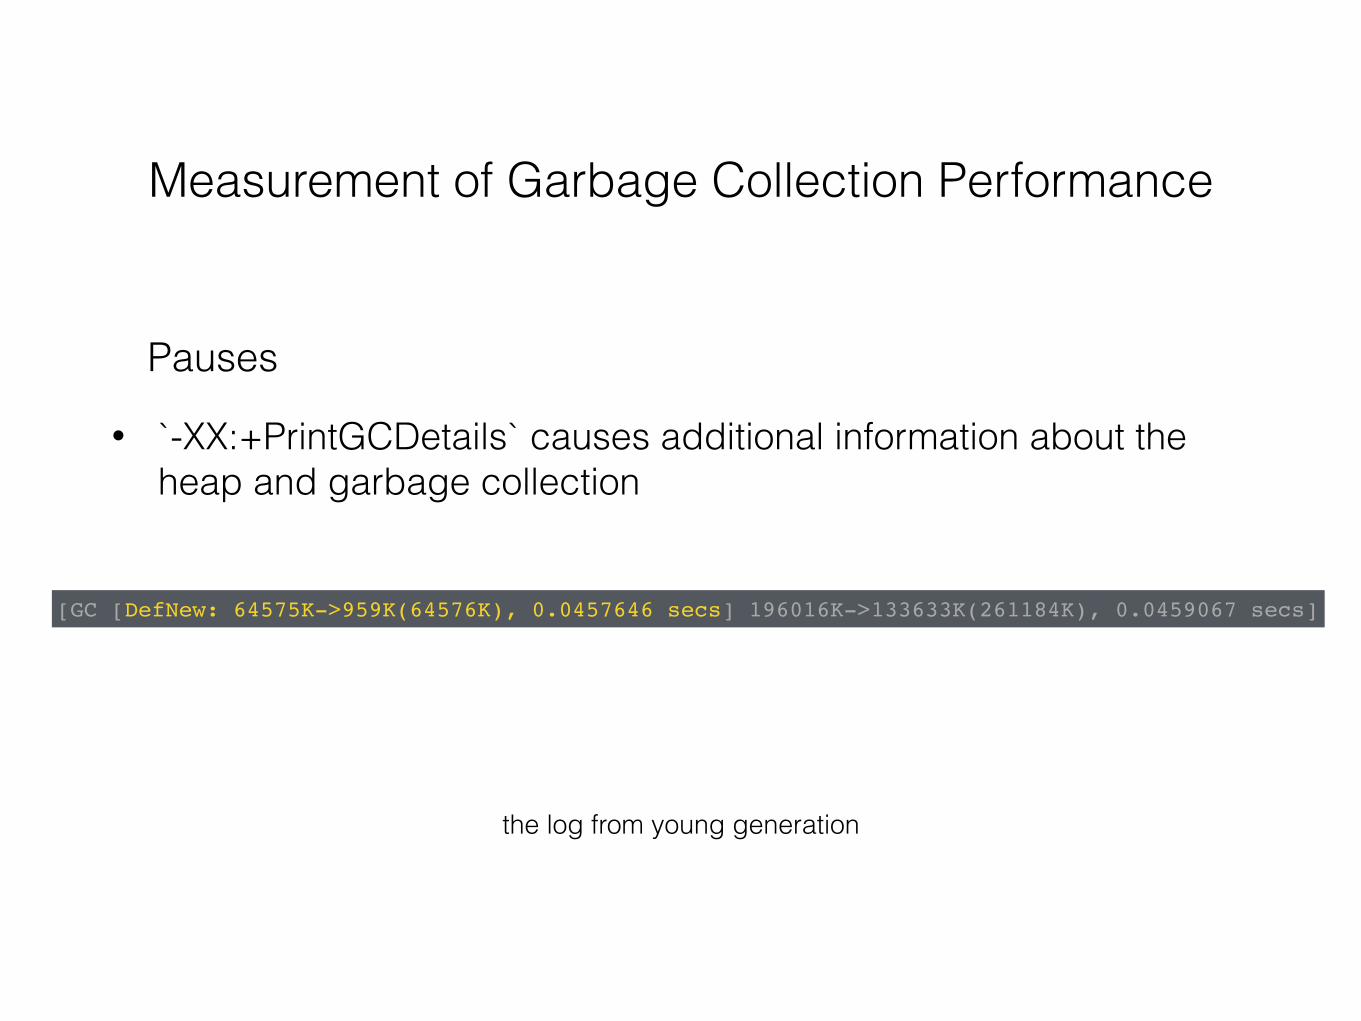
• `-XX:+PrintGCDetails` causes additional information about the heap and garbage collection
Pauses
[GC [DefNew: 64575K->959K(64576K), 0.0457646 secs] 196016K->133633K(261184K), 0.0459067 secs]
the log from young generation
Measurement of Garbage Collection Performance
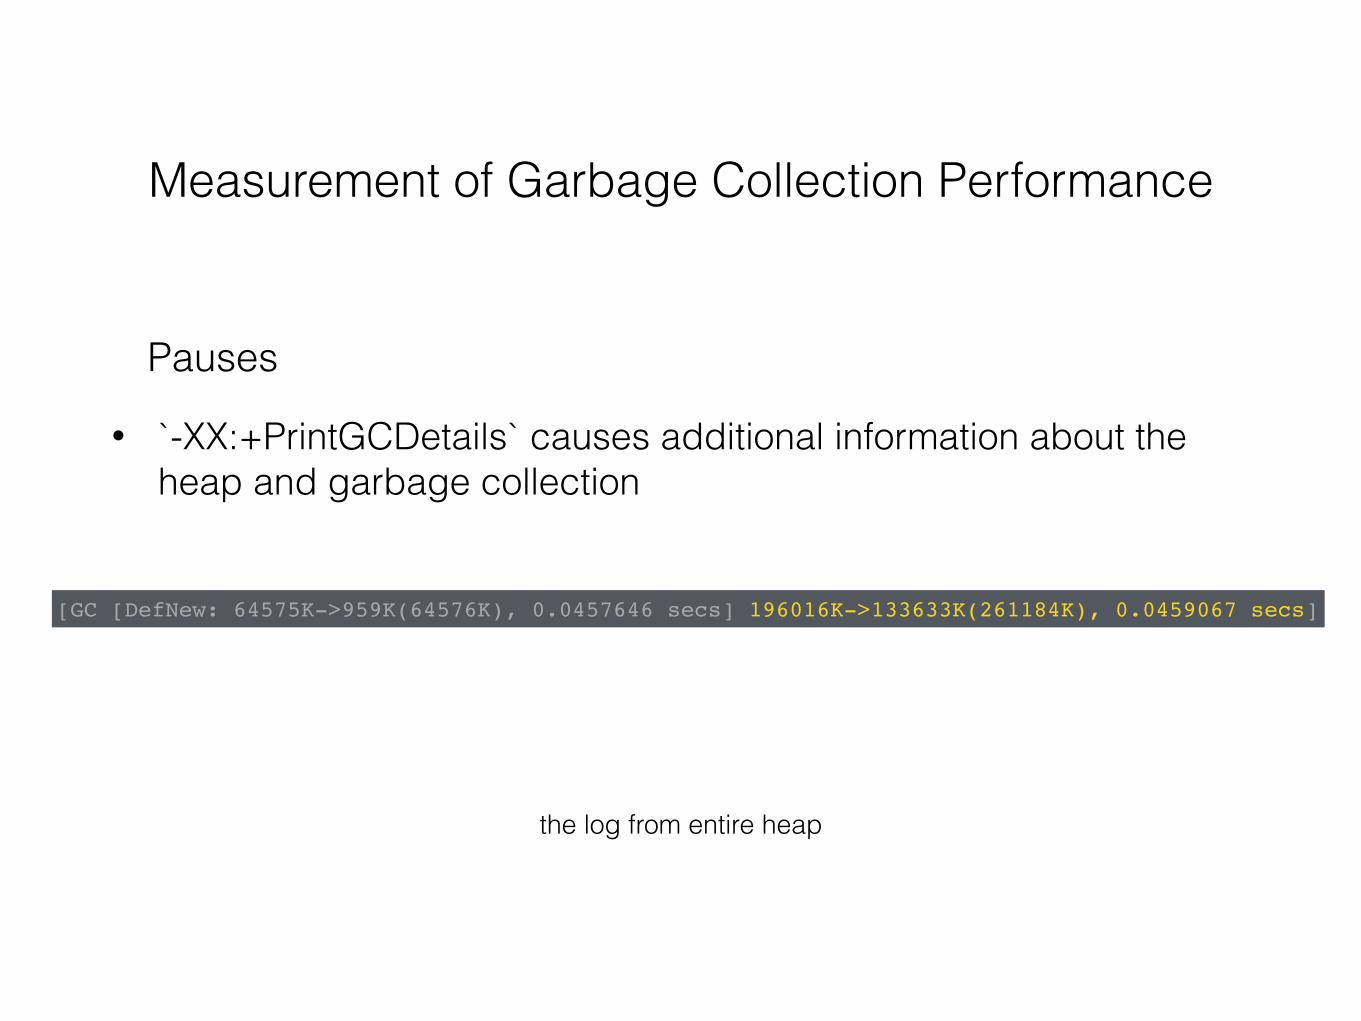
• `-XX:+PrintGCDetails` causes additional information about the heap and garbage collection
Pauses
[GC [DefNew: 64575K->959K(64576K), 0.0457646 secs] 196016K->133633K(261184K), 0.0459067 secs]
the log from entire heap
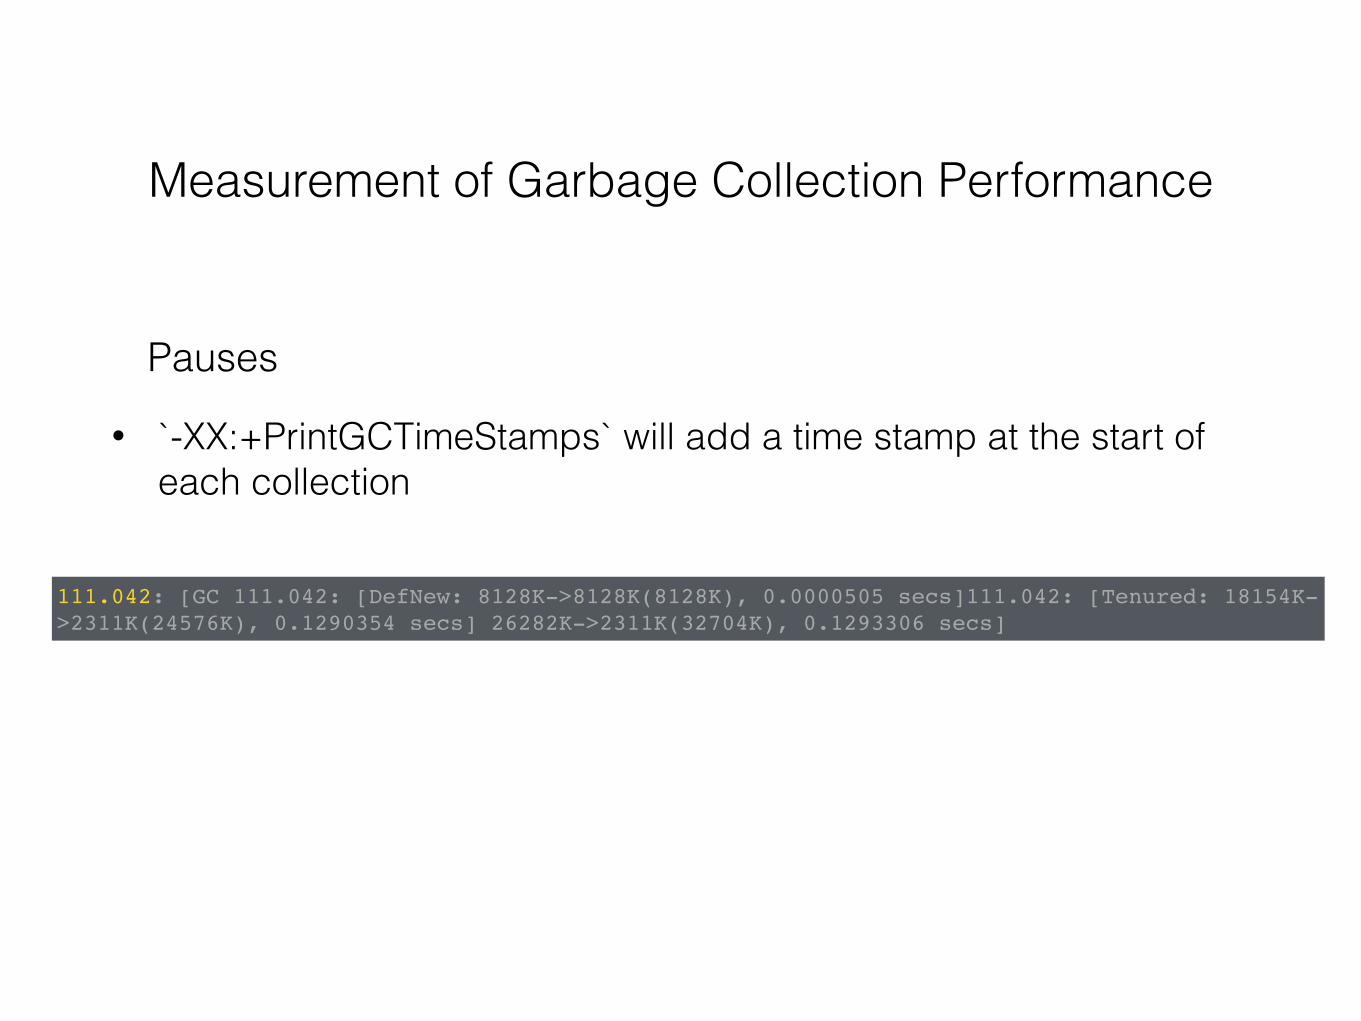
Measurement of Garbage Collection Performance
• `-XX:+PrintGCTimeStamps` will add a time stamp at the start of each collection
Pauses
111.042: [GC 111.042: [DefNew: 8128K->8128K(8128K), 0.0000505 secs]111.042: [Tenured: 18154K->2311K(24576K), 0.1290354 secs] 26282K->2311K(32704K), 0.1293306 secs]
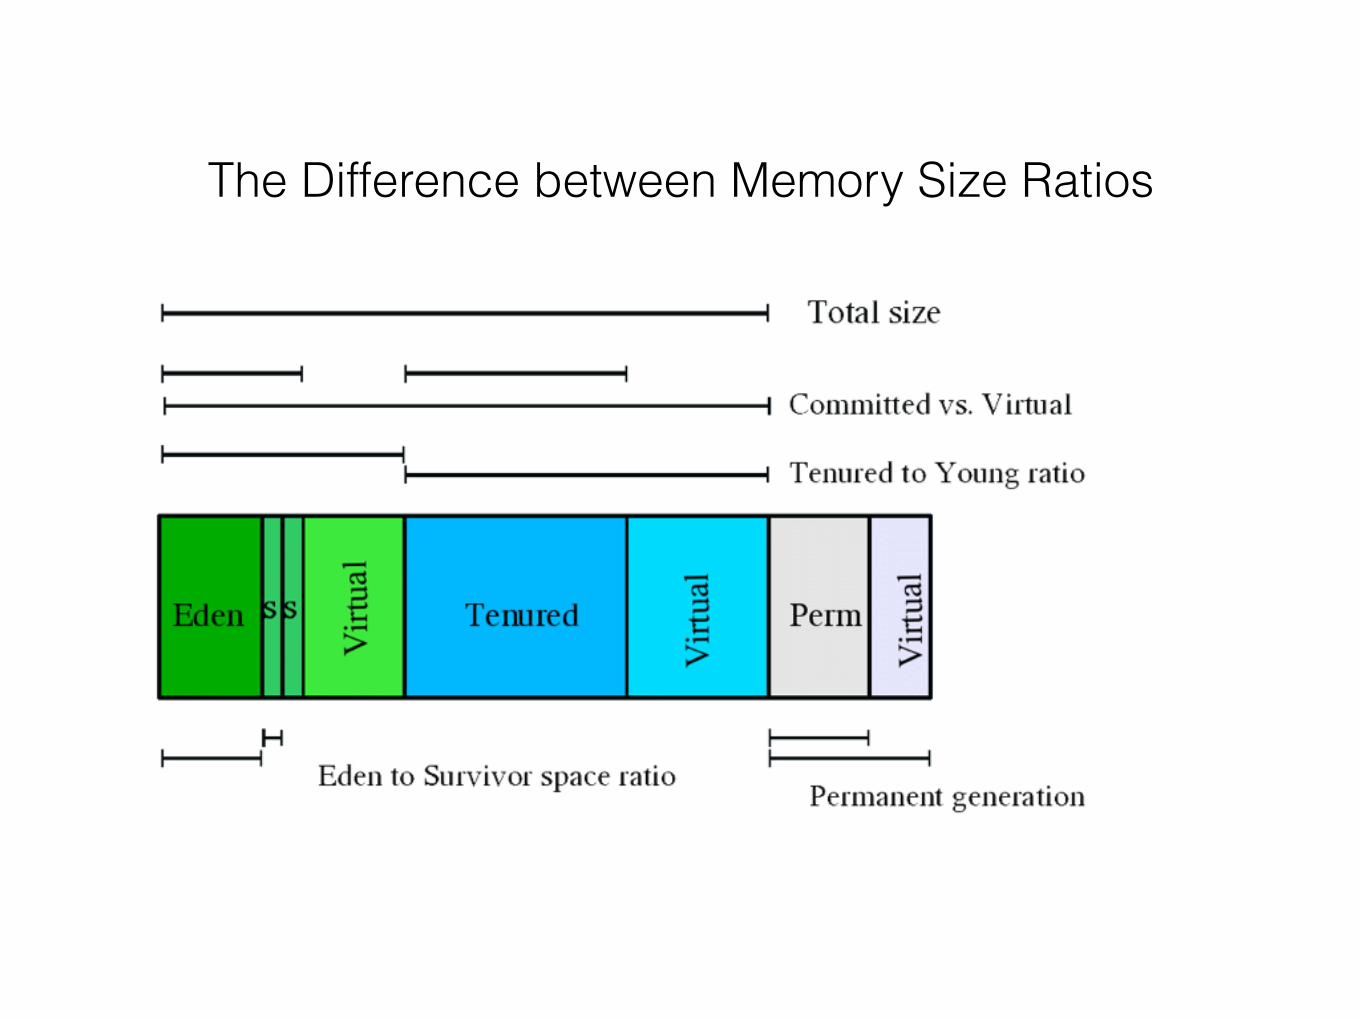
The Difference between Memory Size Ratios
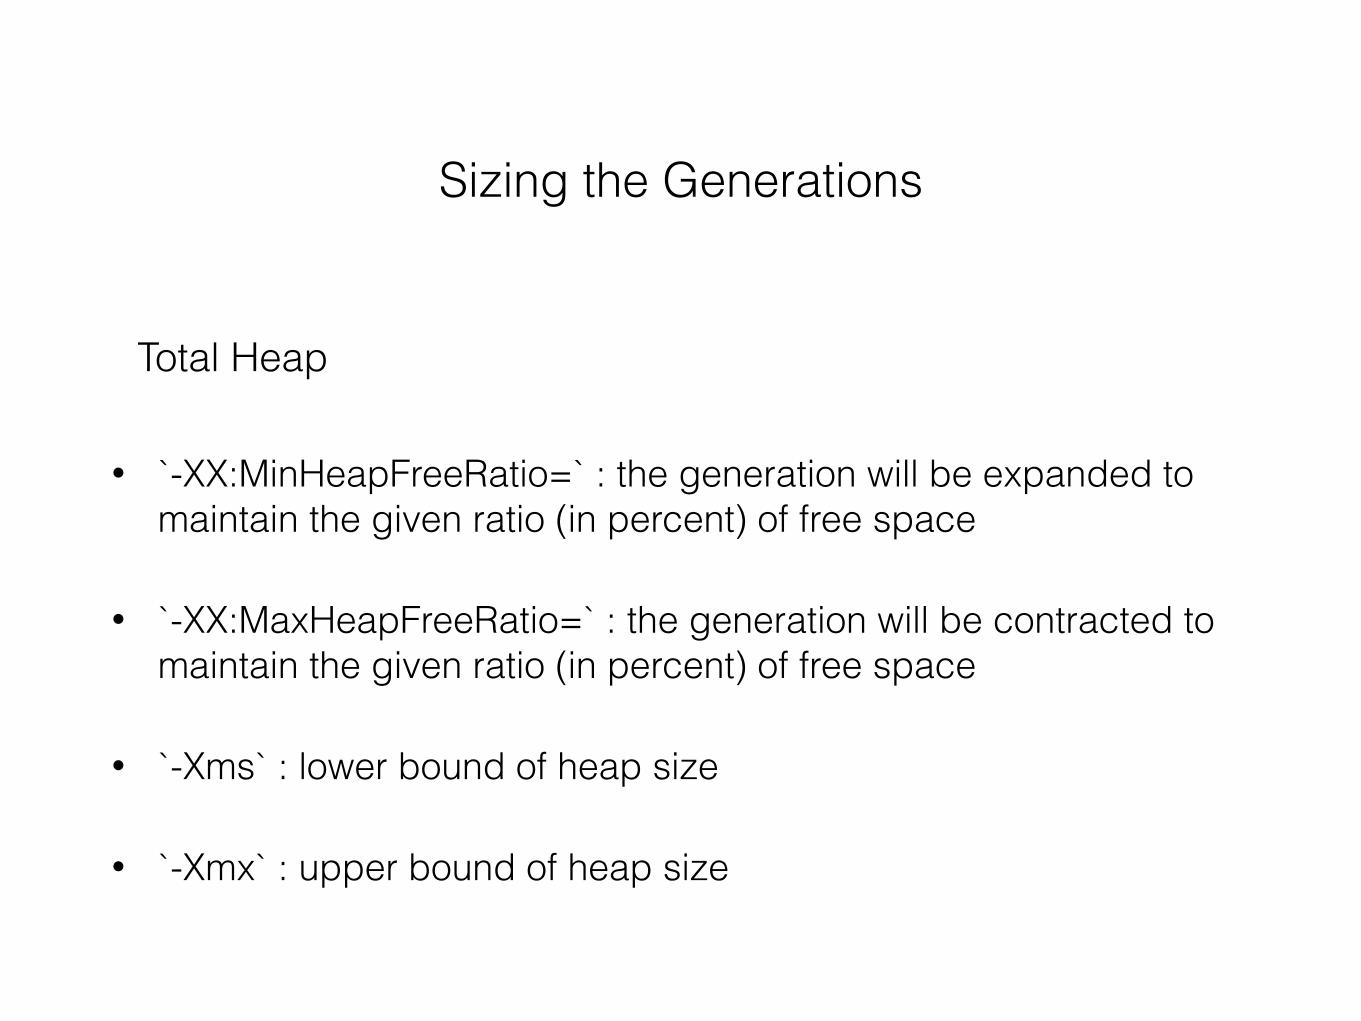
Sizing the Generations
Total Heap
• `-XX:MinHeapFreeRatio=` : the generation will be expanded to maintain the given ratio (in percent) of free space
• `-XX:MaxHeapFreeRatio=` : the generation will be contracted to maintain the given ratio (in percent) of free space
• `-Xms` : lower bound of heap size
• `-Xmx` : upper bound of heap size
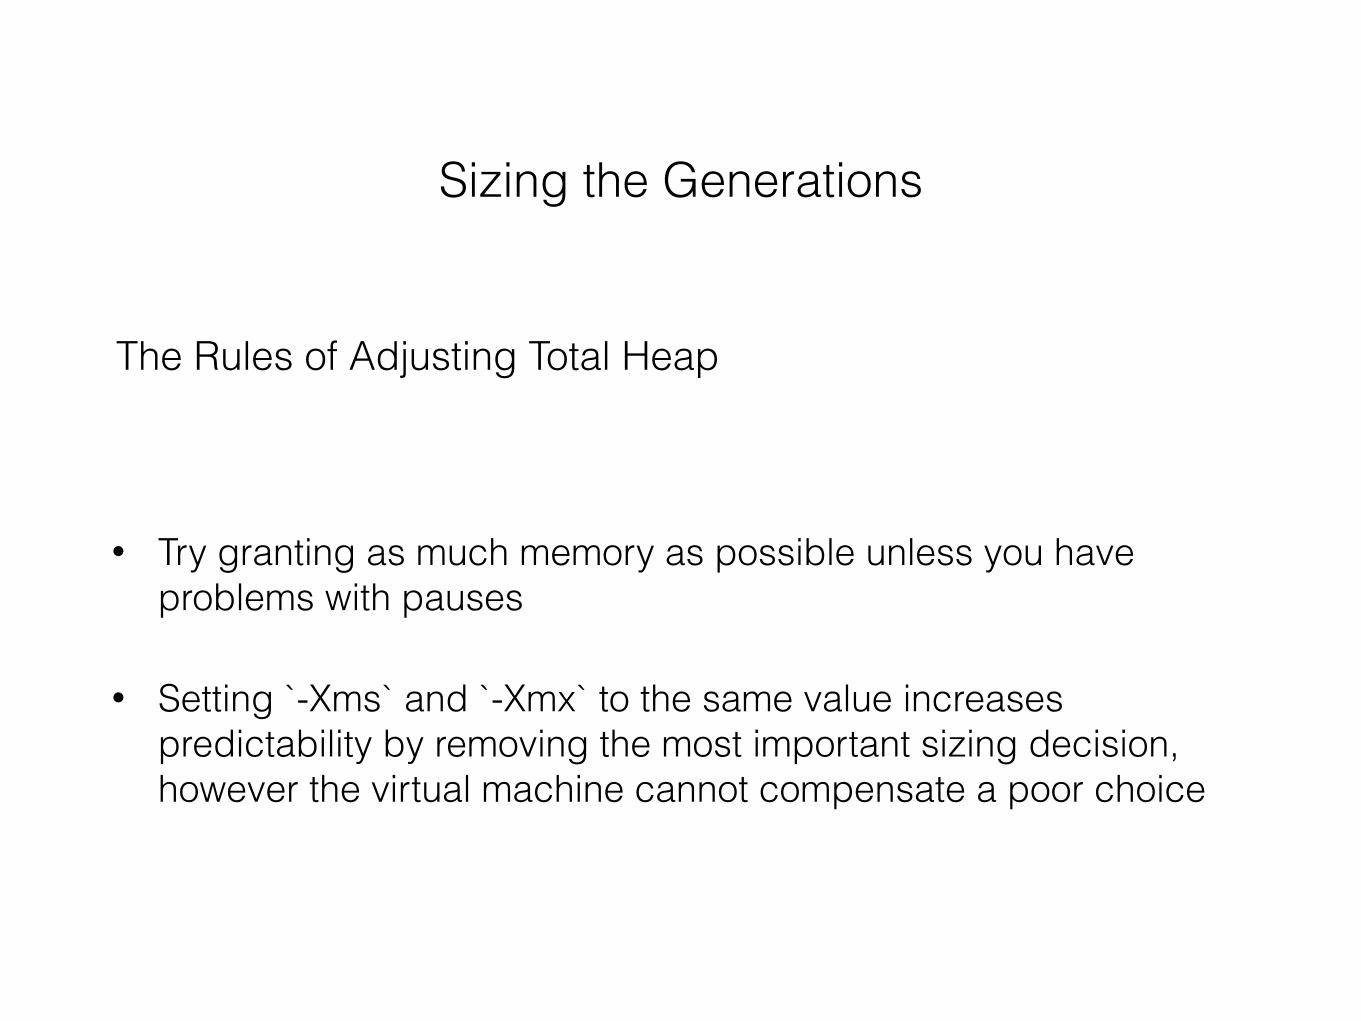
Sizing the Generations
The Rules of Adjusting Total Heap
• Try granting as much memory as possible unless you have problems with pauses
• Setting `-Xms` and `-Xmx` to the same value increases predictability by removing the most important sizing decision, however the virtual machine cannot compensate a poor choice
Sizing the Generations
Young Generation
• `-XX:NewRatio=` : the ratio between young and tenured generations. For example, 3 means the combined size of the eden and survivor spaces will be one fourth of the total heap size
• `-XX:NewSize=` : lower bound of the young generation size
• `-XX:MaxNewSize=` : upper bound of the young generation size
Sizing the Generations
Young Generation
• The bigger the young generation, the less often minor collection occur
• However, (because the total heap size is bounded) which will increase the frequency of major collection
Sizing the Generations
Young Generation (Survivor Space)
• `-XX:SurvivorRatio=` : the ratio between eden and survivor space. For example, 6 means each survivor space will be one sixth the size of eden
• `-XX:+PrintTenuringDistribution` : show tenuring threshold and the ages of objects in the young generation
Sizing the Generations
Young Generation (Survivor Space)
• If survivor spaces are too small, copying collection overflows directly into the tenured generation
• The threshold controlled the number of times an object can be copied before it is tenured is chosen to keep the survivor half full
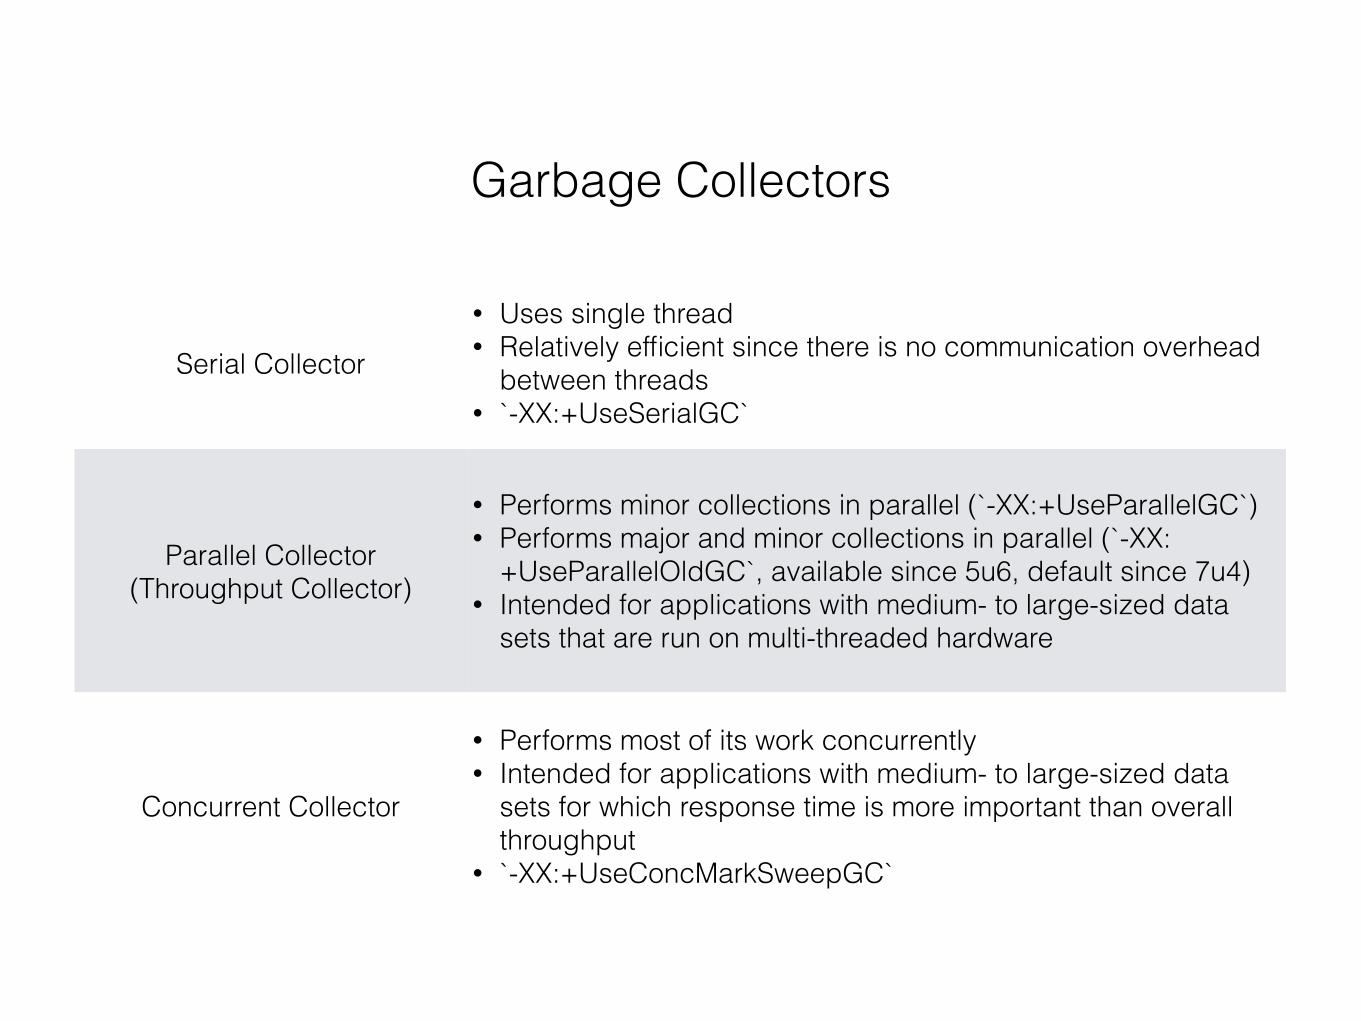
Garbage Collectors
Serial Collector
• Uses single thread • Relatively efficient since there is no communication overhead
between threads • `-XX:+UseSerialGC`
Parallel Collector (Throughput Collector)
• Performs minor collections in parallel (`-XX:+UseParallelGC`) • Performs major and minor collections in parallel (`-XX:
+UseParallelOldGC`, available since 5u6, default since 7u4) • Intended for applications with medium- to large-sized data
sets that are run on multi-threaded hardware
Concurrent Collector
• Performs most of its work concurrently • Intended for applications with medium- to large-sized data
sets for which response time is more important than overall throughput
• `-XX:+UseConcMarkSweepGC`
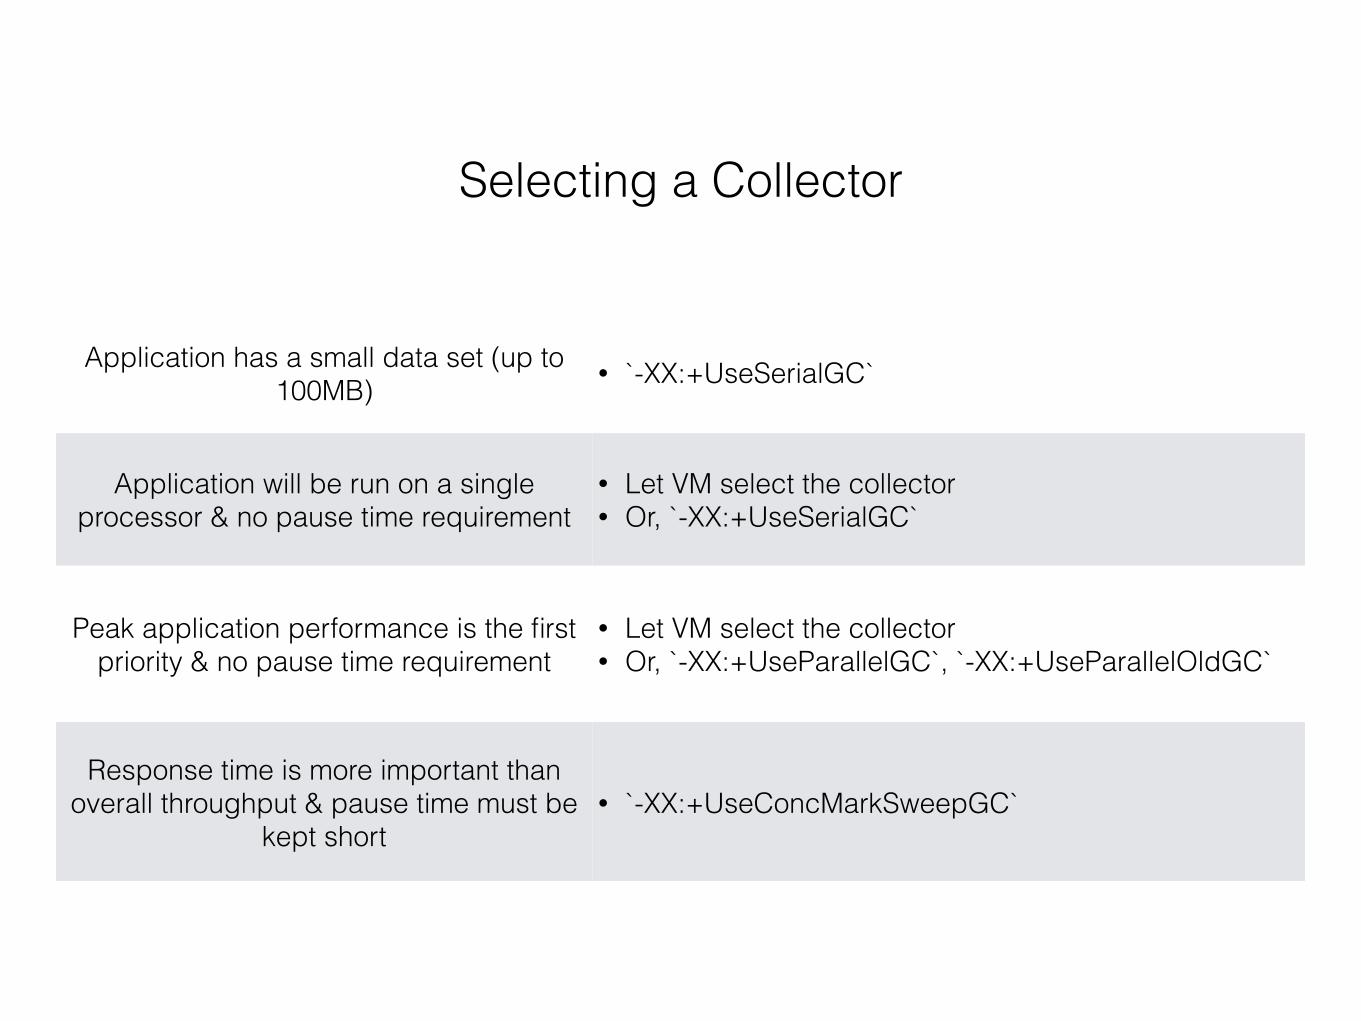
Selecting a Collector
Application has a small data set (up to 100MB) • `-XX:+UseSerialGC`
Application will be run on a single processor & no pause time requirement
• Let VM select the collector • Or, `-XX:+UseSerialGC`
Peak application performance is the first priority & no pause time requirement
• Let VM select the collector • Or, `-XX:+UseParallelGC`, `-XX:+UseParallelOldGC`
Response time is more important than overall throughput & pause time must be
kept short• `-XX:+UseConcMarkSweepGC`

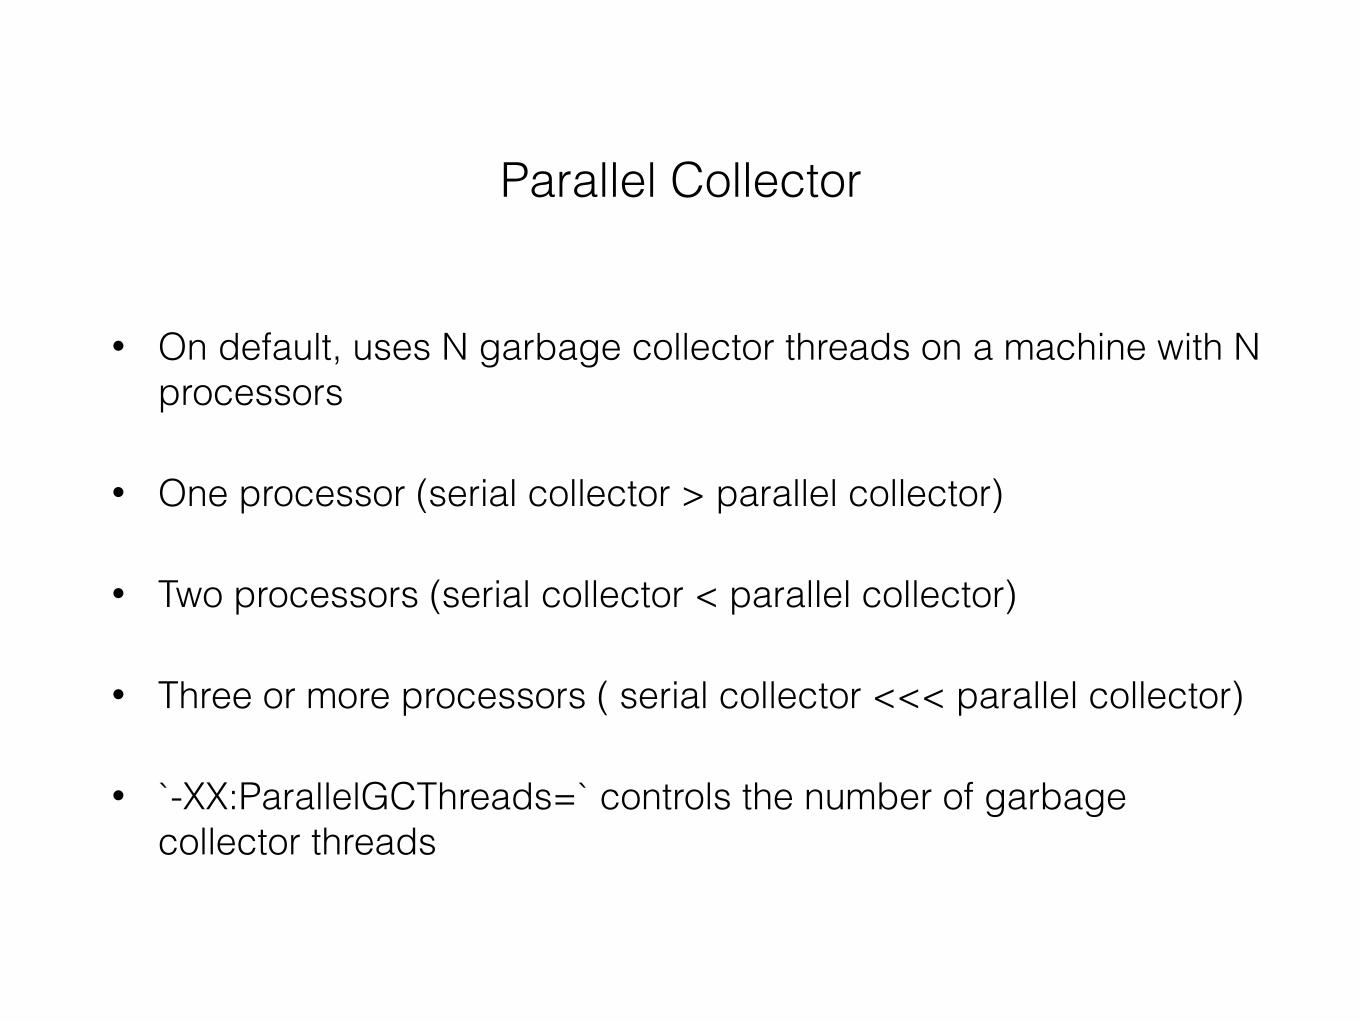
Parallel Collector
• On default, uses N garbage collector threads on a machine with N processors
• One processor (serial collector > parallel collector)
• Two processors (serial collector < parallel collector)
• Three or more processors ( serial collector <<< parallel collector)
• `-XX:ParallelGCThreads=` controls the number of garbage collector threads
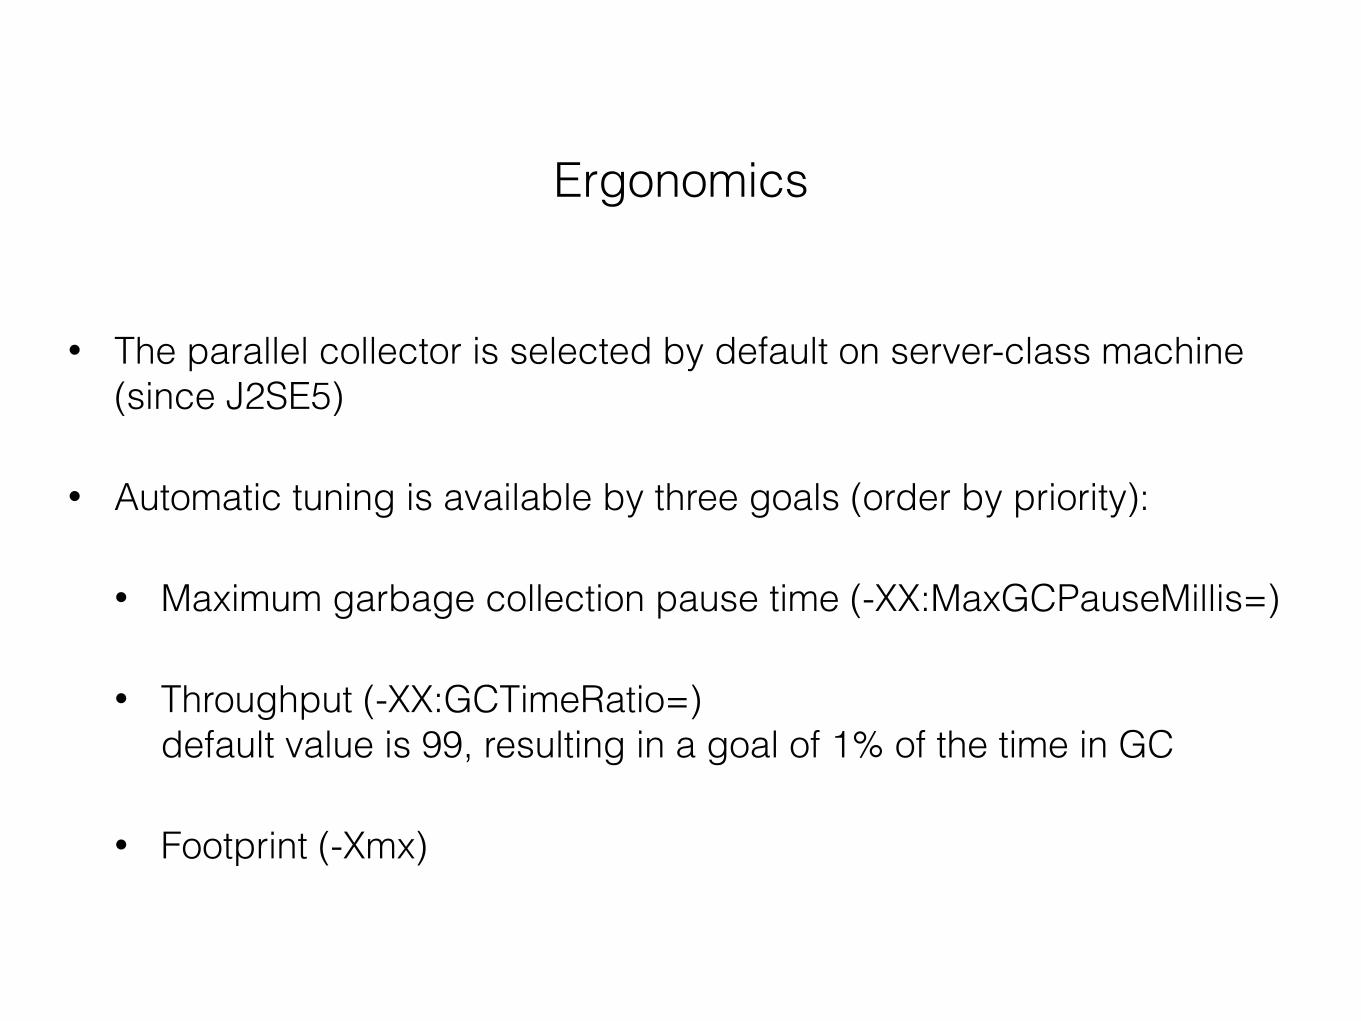
Ergonomics
• The parallel collector is selected by default on server-class machine (since J2SE5)
• Automatic tuning is available by three goals (order by priority):
• Maximum garbage collection pause time (-XX:MaxGCPauseMillis=)
• Throughput (-XX:GCTimeRatio=)default value is 99, resulting in a goal of 1% of the time in GC
• Footprint (-Xmx)
Default Heap Size
• Initial heap size : memory / DefaultInitialRAMFraction (default: memory / 64)
• Maximum heap size : MIN(memory / DefaultMaxRAMFraction, 1GB) (default: MIN(memory / 4), 1GB)
OutOfMemoryError
• If more than 98% of the total time is spent in garbage collection and less than 2% of the heap is recovered
• Can be disabled by `-XX:-UseGCOverheadLimit`
Concurrent Collector
• Reduces the time required for major collection (low pause time): suitable for applications which have a relatively large set of long-lived data and run on machines with two or more processors
• Only two short pause during each major collection (mark and remark)
• Most of the work in the major collection (tracing of live objects, sweeping of unreachable objects) is done concurrently with the application
• Minor collections are done in a manner similar to the parallel collector (the application threads are stopped during the collection)
• Concurrent mode failure when GC fails to completing the collection before either the tenured and permanent generation becomes full
OutOfMemoryError (of Concurrent Collection)
• If more than 98% of the total time is spent in garbage collection and less than 2% of the heap is recovered
• Can be disabled by `-XX:-UseGCOverheadLimit`
• Only collections performed while the application is stopped count toward excessive GC time (typically due to a concurrent mode failure or an explicit call to System.gc())
Floating Garbage (of Concurrent Collection)
• Objects that became unreachable by the time collection finishes and will be collected during the next collection cycle
• A rough rule of thumb: try increasing the size of the tenured generation by 20% to account for the floating garbage
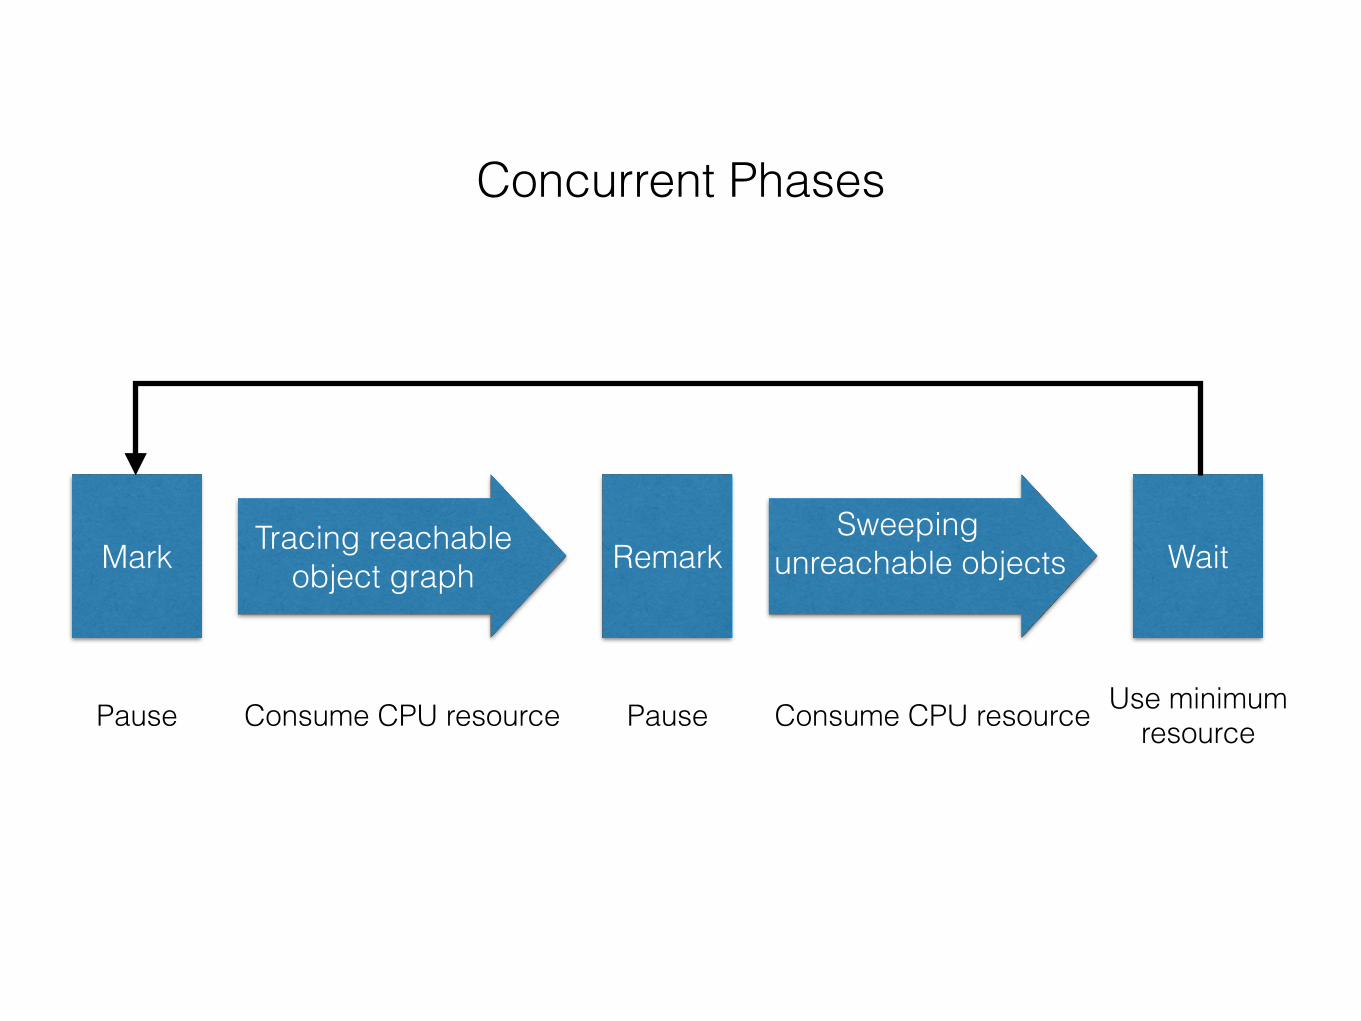
Concurrent Phases
Mark Tracing reachable object graph Remark
Sweeping unreachable objects Wait
Pause Consume CPU resource Pause Consume CPU resource Use minimum resource
Starting Concurrent Collection Cycle
• The concurrent collector maintains estimate time remaining before the tenured generation will be exhausted and of the time needed for a concurrent collection cycle
• A concurrent collection cycle will be started based on these dynamic estimates
• Will also start if the occupancy of the tenured generation exceeds an initiating occupancy. This percentage value can be adjusted with the option `-XX:CMSInitiatingOccupancyFraction=`
Incremental Mode
• Breaking up the concurrent phases into short burst of activity, which are scheduled to occur mid-way between minor pauses
• Especially useful when applications that need the low pause times are run on machines with small numbers of processors (e.g., 1 or 2)
Incremental Mode
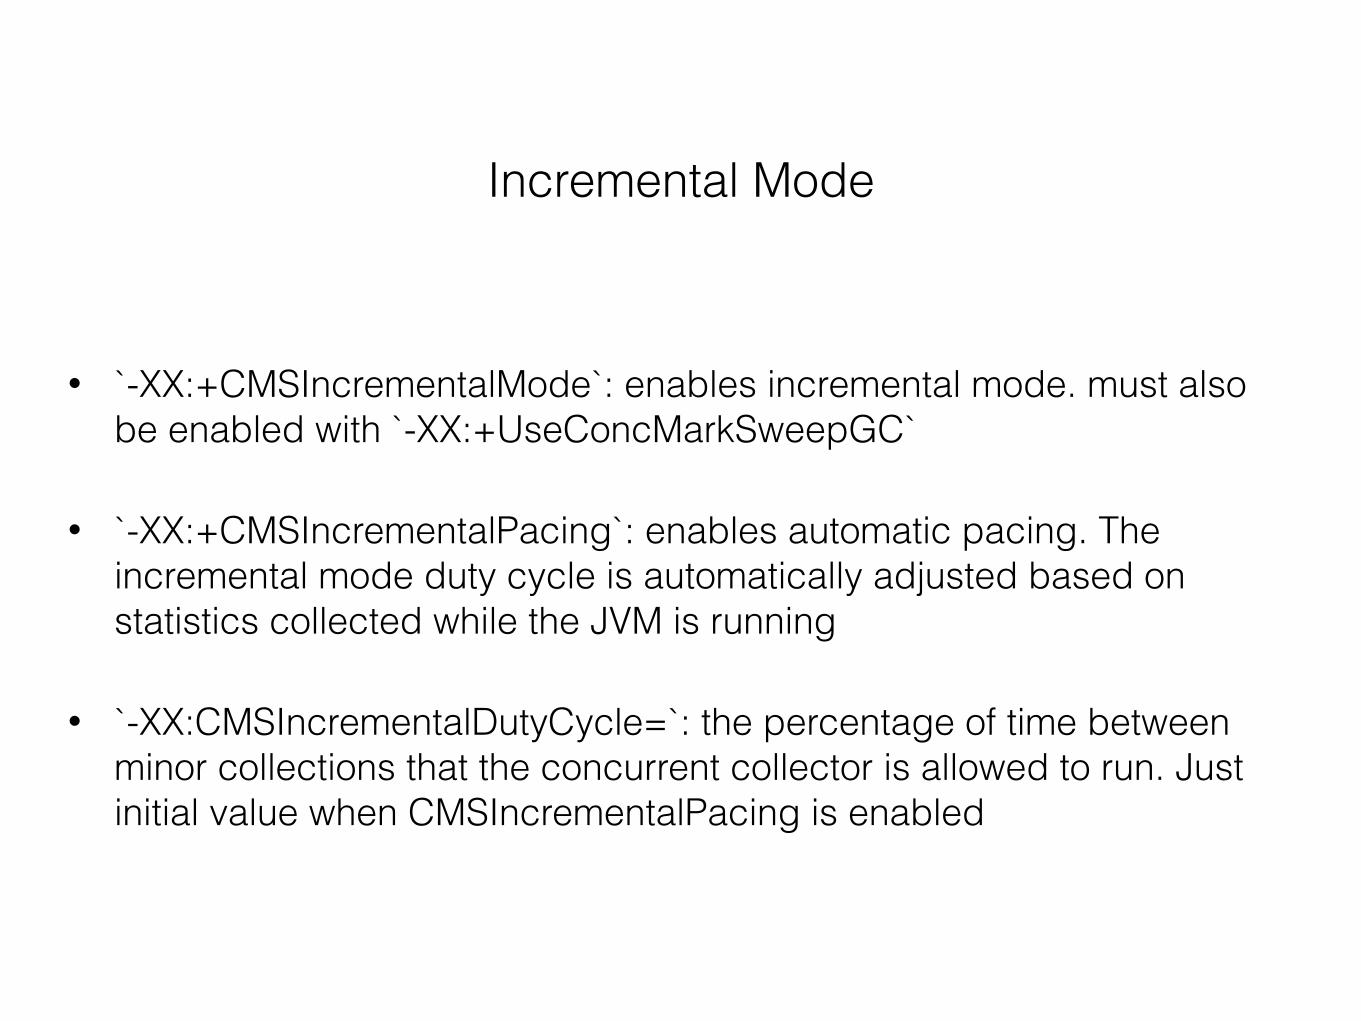
• `-XX:+CMSIncrementalMode`: enables incremental mode. must also be enabled with `-XX:+UseConcMarkSweepGC`
• `-XX:+CMSIncrementalPacing`: enables automatic pacing. The incremental mode duty cycle is automatically adjusted based on statistics collected while the JVM is running
• `-XX:CMSIncrementalDutyCycle=`: the percentage of time between minor collections that the concurrent collector is allowed to run. Just initial value when CMSIncrementalPacing is enabled
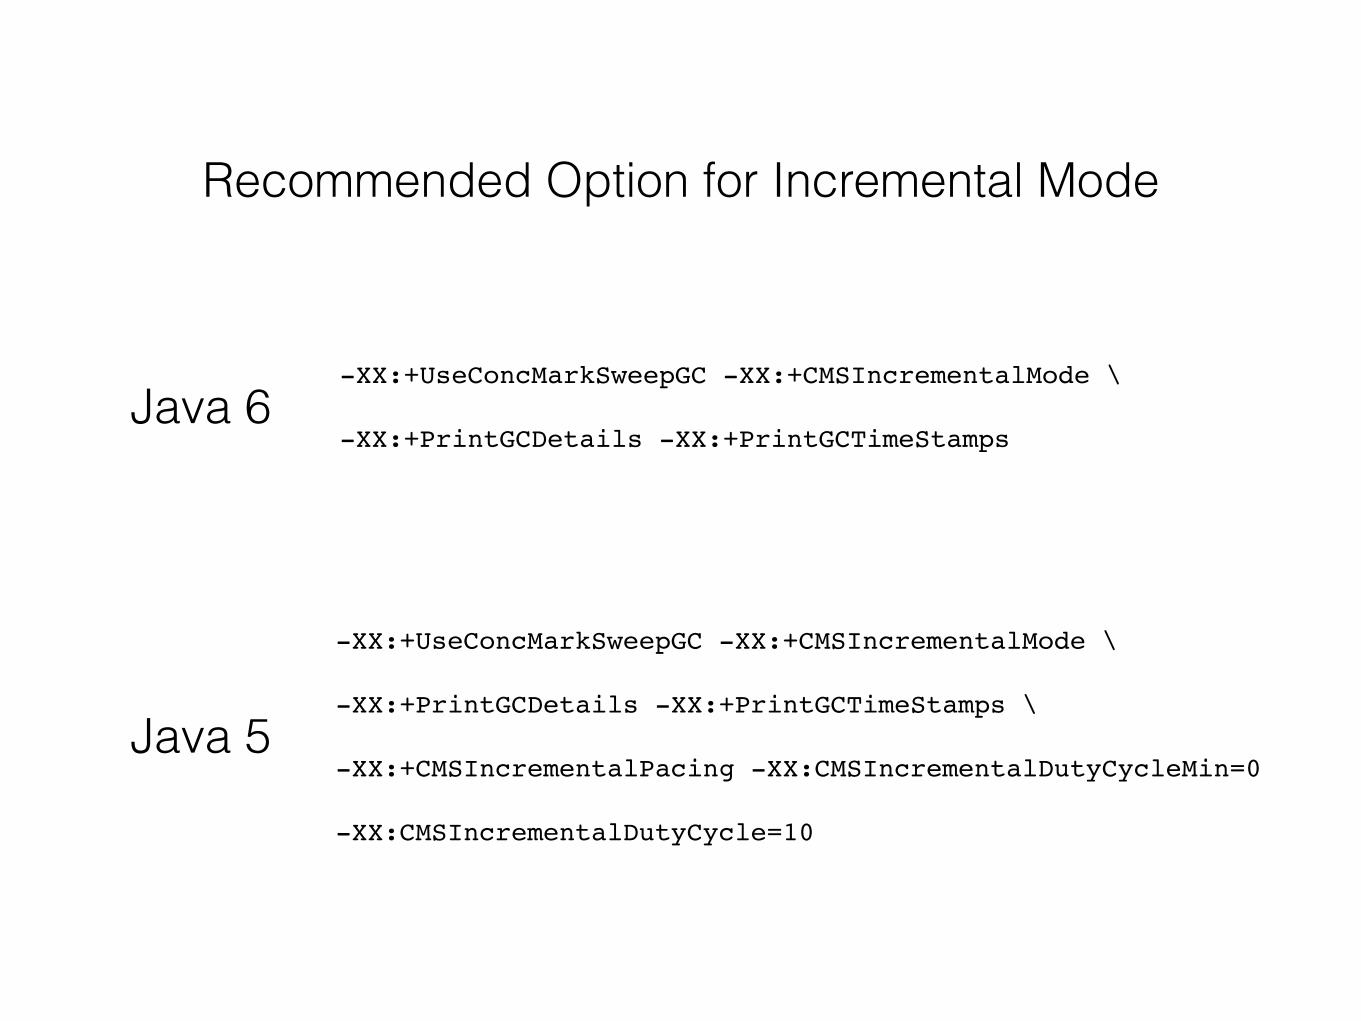
Recommended Option for Incremental Mode
-XX:+UseConcMarkSweepGC -XX:+CMSIncrementalMode \ -XX:+PrintGCDetails -XX:+PrintGCTimeStamps
-XX:+UseConcMarkSweepGC -XX:+CMSIncrementalMode \ -XX:+PrintGCDetails -XX:+PrintGCTimeStamps \
-XX:+CMSIncrementalPacing -XX:CMSIncrementalDutyCycleMin=0 -XX:CMSIncrementalDutyCycle=10
Java 6
Java 5
Explicit Garbage Collection
• `-XX:+DisableExplicitGC` causes the VM to ignore calls to System.gc()