Embed Size (px)
Citation preview

RESEARCH ARTICLE
Quantifying sleep architecture dynamics and
individual differences using big data and
Bayesian networks
Benjamin D. Yetton1, Elizabeth A. McDevitt2, Nicola Cellini1,3, Christian Shelton4, Sara
C. Mednick1*
1 Department of Psychology, University of California, Irvine, Irvine, California, United States of America,
2 Princeton Neuroscience Institute, Princeton University, Princeton, New Jersey, United States of America,
3 Department of General Psychology, University of Padova, Padova, Italy, 4 Department of Computer
Science, University of California, Riverside, Riverside, California, United States of America
Abstract
The pattern of sleep stages across a night (sleep architecture) is influenced by biological,
behavioral, and clinical variables. However, traditional measures of sleep architecture such
as stage proportions, fail to capture sleep dynamics. Here we quantify the impact of individ-
ual differences on the dynamics of sleep architecture and determine which factors or set of
factors best predict the next sleep stage from current stage information. We investigated the
influence of age, sex, body mass index, time of day, and sleep time on static (e.g. minutes in
stage, sleep efficiency) and dynamic measures of sleep architecture (e.g. transition proba-
bilities and stage duration distributions) using a large dataset of 3202 nights from a non-clini-
cal population. Multi-level regressions show that sex effects duration of all Non-Rapid Eye
Movement (NREM) stages, and age has a curvilinear relationship for Wake After Sleep
Onset (WASO) and slow wave sleep (SWS) minutes. Bayesian network modeling reveals
sleep architecture depends on time of day, total sleep time, age and sex, but not BMI. Older
adults, and particularly males, have shorter bouts (more fragmentation) of Stage 2, SWS,
and they transition less frequently to these stages. Additionally, we showed that the next
sleep stage and its duration can be optimally predicted by the prior 2 stages and age. Our
results demonstrate the potential benefit of big data and Bayesian network approaches in
quantifying static and dynamic architecture of normal sleep.
Introduction
Sleep is a dynamic, multi-dimensional process that reflects lifespan developmental changes in
physical and mental health, as well as day-to-day state fluctuations. Alterations in stage pat-
terns and durations (i.e., sleep architecture), are seen in insomnia[1], narcolepsy[2], sleep
apnea[3] as well as depression[4] and schizophrenia[5]. However, not all deviations from pro-
totypical sleep are indicators of pathology; individual factors such as age[6], Body Mass Index
(BMI)[7], and sex[8] contribute to sleep architecture, and differences are also reported after
PLOS ONE | https://doi.org/10.1371/journal.pone.0194604 April 11, 2018 1 / 27
a1111111111
a1111111111
a1111111111
a1111111111
a1111111111
OPENACCESS
Citation: Yetton BD, McDevitt EA, Cellini N, Shelton
C, Mednick SC (2018) Quantifying sleep
architecture dynamics and individual differences
using big data and Bayesian networks. PLoS ONE
13(4): e0194604. https://doi.org/10.1371/journal.
pone.0194604
Editor: Alessandro Silvani, Universita degli Studi di
Bologna, ITALY
Received: November 22, 2017
Accepted: March 6, 2018
Published: April 11, 2018
Copyright: © 2018 Yetton et al. This is an open
access article distributed under the terms of the
Creative Commons Attribution License, which
permits unrestricted use, distribution, and
reproduction in any medium, provided the original
author and source are credited.
Data Availability Statement: The majority of data
used in the current study is open access and can
be directly downloaded or requested through each
dataset’s corresponding website (see S2 Table).
Data from Mednick Sleep and Cognition Lab
(contact: Lexus Hernandez, [email protected]),
Sleep Psychophysiology Lab (contact: Lexus
Hernandez, [email protected]), The Institute of
Medical Psychology and Behavioral Neurobiology
at the University Tubingen (contact: Susanne
Diekelmann, susanne.diekelmann@uni-tuebingen.
de) and the Furman Sleep Lab (contact: Erin

sleep deprivation[9] or drug use (such as caffeine[10], nicotine[11], alcohol and marijuana
[12]). Quantifying the typical variability in sleep architecture and its relation to benign factors,
as opposed to those which may be indicative of illness, is of clinical relevance.
Sleep is classically partitioned into 4 stages: Stage 1, Stage 2, Slow Wave Sleep (SWS) and
Rapid Eye Movement (REM)[13]. These stages are purported to progress in a specific order
across a period of sleep, beginning with Wake! Stage 1, then transitioning into a cyclic repe-
tition of Stage 2! SWS! Stage 2! REM[14] (i.e. Ultradian cycles). Additionally, the pro-
portion of time spent in each sleep stage across a night of sleep has been well-defined. The
durations of Stage 1 and Stage 2 are relatively constant throughout the night, whereas duration
of REM and SWS exhibit a time-dependence, with more SWS at the beginning of the night
and a larger proportion of REM in the morning. Throughout the night, sleep is often inter-
rupted with brief bouts of wake, known as Wake After Sleep Onset (WASO). The detection of
sleep stages and WASO from the raw Polysomnography signal (PSG) generally follows the
Rechtschaffen and Kales (R&K)[15] or American Academy of Sleep Medicine (AASM)[16]
guidelines. Criteria differ subtly, where with the AASM criteria there is increased scoring of
WASO, Stage 1 and SWS, and decrease scoring of Stage 2 [17]. Additionally, R&K proposes
two separate stages for SWS.
A common clinical and research practice is to average the time spent in each sleep stage
across a sleep period, and then normalize them by the total sleep time in order to quantify
sleep stage proportions. While this approach is useful for group level differences, it reduces
important variability in the pattern of stage transitions, and the durations of each sleep stage
are lost[18]. This issue is highlighted in Fig 1 in which two qualitatively different hypnograms
are shown—the first exhibits very fragmented sleep, with shorter bout durations for each stage
and a higher number of stage transitions compared to the second. Nonetheless, when using
stage proportions as a measure, there is no quantitative difference. Thus, considering that
sleep fragmentation is a marker of detrimental, but treatable, health disorders such as obstruc-
tive sleep apnea[19], alternative measures should be considered.
Fig 1. Hypnogram and corresponding stage proportions of fragmented sleep (top) and normal sleep (bottom). Stage proportions are the minutes
in each stage normalized by total sleep time. REM: rapid eye movement sleep; SWS: slow wave sleep; WASO: wake after sleep onset.
https://doi.org/10.1371/journal.pone.0194604.g001
Big data analysis of sleep architecture and the effects of individual differences
PLOS ONE | https://doi.org/10.1371/journal.pone.0194604 April 11, 2018 2 / 27
Wamsley, [email protected]) were
collected with a consent form which did not specify
open access sharing. However, a clause allows this
data to be shared with collaborators in the same
manner as the authors, and any interested parties
should contact the corresponding data owners as
referenced above. The authors did not have any
special access privileges to these data.
Funding: A National Science Foundation Graduate
Research Fellowship Program (https://www.
nsfgrfp.org/) supported Ben Yetton (Fellow
Number GRFP2015211602). The funder had no
role in study design, data collection and analysis,
decision to publish, or preparation of the
manuscript. For Sara Mednick’s R01AG046646
(https://grants.nih.gov/grants/funding/r01.htm)
NIH had no role in study design, data collection and
analysis, decision to publish, or preparation of the
manuscript. Christian Shelton was supported by
the National Science Foundation, IIS 1510741. The
funders had no role in study design, data collection
and analysis, decision to publish, or preparation of
the manuscript.
Competing interests: The authors have declared
that no competing interests exist.

Further, due to homeostatic and circadian processes[20], the distribution of sleep stages
across the night is not uniform, and averaging stage proportions over an entire night of sleep
loses potentially important information. Third, sleep proportion statistics collapse across dura-
tion and transition information, dropping valuable information about sleep fragmentation in
the process. For example, if the proportion of the night spent in SWS decreased towards morn-
ing, sleep proportion statistics are not able to distinguish whether this is because the length of
SWS bouts decreased (fragmented SWS) or if the subject simply transitioned to SWS less
(while bout durations remained constant). If different mechanisms are involved in the transi-
tions between stages and the maintenance of stages, then detection of their differing contribu-
tions is useful, but impossible with sleep proportion statistics. As we and others[18,21–25]
have pointed out, sleep architecture is a time-varying signal, and temporally appropriate mea-
sures should be considered. To address this concern, we utilized two proposed dynamic mea-
sures: stage transition probabilities (the probably of transitioning to a stage from some other
stage) and stage duration distributions (the distribution of time spent in an individual bouts of
a stage)[22–30]. Both measures define parameterizable probability distributions, a desirable
property considering that the complex pattern of sleep stages can only be partiality determined
from observable variables.
Basic models of sleep dynamics already exist, the most popular of which is the two-process
model[31] of sleep regulation. The two-process model defines two orthogonal processes,
namely Process S and Process C, that drive sleep/wake transitions. Process S, or homeostatic
sleep pressure, is a putative signal that rises exponentially during time spent awake and dimin-
ishes during non-REM (NREM) sleep as a function of slow wave activity. Process C, the circa-
dian rhythm, is a cyclic signal based on the approximate 24hr biological clock of humans. The
interaction of these two processes predicts sleep/wake dynamics. A third cyclic “ultradian”
process has been added to the model[20] which deterministically (based on time since sleep
onset) controls transitions between non-REM and REM sleep. While the two-process model
captures global trends, it is a relatively simple model (i.e. does not account for Stage 1, 2 and
SWS separately) and cannot account for many of the individual differences seen in real hypno-
grams. Moreover, the sleep architecture pattern of real sleep is far from deterministic and
often exhibits alternate patterns. Some of these deviations from typical patterns may be indica-
tive of underlying mental or sleep disorders and deserve closer attention while others may be
more benign. A model that captures the probabilistic, temporal pattern of all stages (Stage 1,
Stage 2, SWS, REM and WASO), accounts for individual variability seen in normal sleep archi-
tecture (or abnormal sleep, if trained on abnormal data), and generalizes to new, unseen data,
would have scientific, clinical and translational relevance.
Here, we utilized the power of big data (~3200 nights of sleep) from 14 databases, to quan-
tify the expected changes in sleep due to benign factors in the broader population. We began
with a regression framework to investigate the relationship between age, sex and traditional,
static sleep measures of stage proportions, sleep latency and sleep efficiency. We then moved
onto a combination of Bayesian networks and temporally appropriate sleep architecture mea-
sures to examine sleep pattern dynamics. It is little understood how the dynamic patterns of
sleep are influenced by individual factors. To investigate, we first begin with model selection
algorithms to determine which variables must be considered when modeling sleep architecture
dynamics, and which can be safely excluded to reduce model complexity. Next, we use the best
fitting models determine how these variables modulate sleep dynamics. Subtle differences exist
in the data collection methods of the 14 datasets analyzed in this study (e.g. different recording
devices and alternate sleep scoring procedures). To minimize the effect of these nuisance fac-
tors, data analysis takes a multi-level approach whereby both the variance within and between
datasets is quantified.
Big data analysis of sleep architecture and the effects of individual differences
PLOS ONE | https://doi.org/10.1371/journal.pone.0194604 April 11, 2018 3 / 27

Results
Traditional sleep statistics
Using multi-level regression models, we predicted sleep efficiency, minutes in stage, and REM
latency in a stepwise procedure from age, sex, and higher order terms while controlling for
total sleep time (TST), and sleep onset time. While these analysis fail to capture dynamic
trends, they remain useful as global summary statistics and for comparison with previous liter-
ature[6]. Regression parameters for the final best fitting models are reported in S1 Table, and
each relationship is shown graphically in Fig 2 (where TST and sleep onset are fixed at their
mean). For all relationships, a random slopes model better accounted for the data compared to
a pooled or random intercepts model.
We began with sleep efficiency, which was best predicted with age, but not sex or any higher
order terms (P(Correct Model | Data, Models) = 0.64, P(next best model, with age2) = 0.34). In
general, sleep efficiency decreased with age at a linear rate of 2% per decade (Bage = -0.002,
95%CI = [-0.003, -0.001]).
We then modeled how the minutes in each stage changed as a function of sex and age. For
WASO, a model with age and age2 variables, but not sex was selected (P(Correct Model | Data,
Models) = 0.76; P(next best model, without age2) = 0.22). Here we find that WASO increases
non-linearly across age, beginning at around 60 minutes at 18 years, remaining flat until 45
years, and then increasing sharply throughout middle and older age (Bage = -0.94, 95%CI =
[-1.84, -0.19]; Bage2 = 0.02, 95%CI = [0.01,0.02]). For stage 1, the model with age, sex,
age�sex, age2 and the age2�sex interaction best explained the data (P(Correct Model | Data,
Models) = 0.87; P(next best model, without age2�sex) = 0.08). For females, minutes in stage 1
increase only very slightly throughout their life (Bage = 0.06, CI = [-0.36, 0.50], Bage2 = 0.000
[-0.004,0.004]). Males, on the other hand, increase by over half a minute for each year of life
(Bage = 0.37, 95%CI = [-0.13,0.89]), however, this increase slowed somewhat with age (-0.002,
95%CI = [-0.008,0.003]). Stage 2 was best predicted from age, sex and the age�sex interaction
(P(Correct Model | Data, Models) = 0.85; P(next best model, inc. age2) = 0.07). Minutes in
stage 2 begin around 210 minutes for both sexes, and increase 39 seconds per year for females
(Bage = 0.39, 95%CI = [0.09,0.76]), and faster, at over 1 minute per year for males (Bage�sex =
0.26, [-0.05, 0.57]). For SWS, age, age2, sex and the sex�age interaction were selected in the best
model (P(Correct Model | Data, Models) = 0.86; P(next best model, inc. sex�age2) = 0.14).
Both sexes spend less time in SWS as they age (Bage = -1.67, 95%CI = [-2.36, -0.91]), but this
effect reduces and begins flattening off at ~70 years (Bage = 0.01, [0.00,0.02]). Males have less
SWS than females, and have a sharper reduction of SWS with age than females (Bage�sex =
-0.34, 95%CI = [-0.66, -0.07]). The best model for REM included age and age2 as predictors.
This relationship was interesting, in that REM minutes begin low, and increased through to
mid age, and then began to decrease again (Bage = 1.10, 95%CI = [0.76,1.53], Bage2 = -0.01
[-0.02, -0.01]).
Finally, we investigated REM latency as a function of the same predictors as above. The full
random slopes model, including age, sex, age2, age�sex gave the best fit (P(Correct Model |
Data, Models) = 0.90; P(next best model, inc. sex�age2) = 0.09). Large main effects of sex are
present, with females taking 7 minutes longer to enter REM than males (Bsex = -7.04, 95%CI =
[-25.33,9.91]). REM latency reduces with age (Bage = -2.02, 95%CI = [-2.66, -1.30]), and more
so for males (Bage�sex = -0.14, 95%CI = [-0.59, 0.25], however, the non-linear relation with age
shows that younger and older adults take longer to enter REM than mid age adults (Bage2 =
0.02, 95%CI = [0.01,0.03]).
Taken together, these results suggest that as men age, they spend more time in Stage 1 and
2, and this is offset with less time in SWS. For females, the same pattern exists, but changes
Big data analysis of sleep architecture and the effects of individual differences
PLOS ONE | https://doi.org/10.1371/journal.pone.0194604 April 11, 2018 4 / 27

Fig 2. Static sleep statistics across age and sex. Top row: Sleep Efficiency, Sleep Latency, Bottom row: minutes in each
stage. To show the uncertainly in predictions, regression parameters are randomly sampled 100 times from each
model’s joint parameter distribution and each is used to plot a regression line. REM: rapid eye movement sleep; SWS:
slow wave sleep; WASO: wake after sleep onset.
https://doi.org/10.1371/journal.pone.0194604.g002
Big data analysis of sleep architecture and the effects of individual differences
PLOS ONE | https://doi.org/10.1371/journal.pone.0194604 April 11, 2018 5 / 27

across age are much less pronounced. For both sexes, WASO minutes remain constant in early
life, but then begin increasing at around 45 years of age. REM minutes showed no changes
across sex but a curvilinear relationship was observed where mid age adults have the most
REM. Similarly, mid age adults are quicker to enter REM. Sleep efficiency declined linearly
over the lifetime, driven, in part, by a rise in WASO.
The dynamic pattern of sleep architecture
Next, we turned to analysis using Bayesian networks to investigate the dynamics of sleep. The
pattern of sleep stages over time is semi-deterministic. That is, the likelihood of the current
stage and its duration is a probabilistic function of the stages that came before it, their dura-
tions, as well as factors such as time of day. It is clear from past literature[32] that some transi-
tions are more or less likely (e.g. SWS->REM is unlikely, while SWS->Stage 2 is likely),
therefore the identity of the previous sleep stage influences the current stage. We sought to
determine the temporal structure of sleep architecture by testing the influence of previous
stages (both identity and duration) on the current stage. For this purpose, we used the K2
structural search algorithm to find the best-fitting dynamic Bayesian network over sleep archi-
tecture variables. Three models were tested with varying amounts of previous stage informa-
tion: one back (t-1), two back (t-2) and 3 back (t-3) (Fig 3).
Comparing Fig 3, Models 1B and 1C, we saw the identity of the current stage (at t), is opti-
mally predicted by the two stages before it and the previous stage duration (at t-1). The
Fig 3. Best fitting models to predict the current stage and duration from previous sleep architecture variables. “In dataset” and “out of dataset”
prediction accuracy and prediction error for current stage (top) and current stage duration (bottom) is shown. Model 1A) 1 back model (including t-1
variables), Model 1B) 2 back model (including t-2 variables), Model 1C) 3 back (including t-3 variables). When considering previous sleep archetecture
only, Model 1B gave the best fit and states that the identity of the current stage is dependent on the identity of the previous 2 stages and the duration of
the last stage (blue arrows). The duration of the current stage is dependent on the identity of the current stage (at t) and the previous one (at t-1) (red
arrows).
https://doi.org/10.1371/journal.pone.0194604.g003
Big data analysis of sleep architecture and the effects of individual differences
PLOS ONE | https://doi.org/10.1371/journal.pone.0194604 April 11, 2018 6 / 27

duration of the current stage (at t) was probabilistic function of the identity of the current
stage (at t) and previous stage (t-1). The best model (1B) predicts the next stage at 62.5% accu-
racy and the duration of the next stage at 50.3% accuracy. Out of dataset accuracy is no differ-
ent than in dataset accuracy, suggesting high model generalizability. Adding stage information
from 3 stages back (i.e. t-3, Model 1C) does not aid predictive power (no connections from t-3
to t). Hence, the probability of the current stage may be modeled as a 2nd order Markov Pro-
cess and its duration a first order Markov Process. This is a promising result for future predic-
tive models as it mitigates the computational explosion resulting from higher order processes.
Having concluded that the stages and durations more than 3-back were independent of the
current stage and its duration (given all other variables), we omitted them from future
modeling.
Given the uneven age distribution present in the data (see Dataset section), there is a chance
the model learns to predict sleep in older adults very well, and other age groups poorly, which
averaged together leads to the reported performance metrics. To rule this out, we use the
model to predict the current stage and its duration for each age group separately. Current
stage accuracy was 62.4%, 61.6% and 62.8% and duration was 50.2%, 50.5% and 50.3% for the
younger, mid age and older groups respectively. Given the small differences in these accura-
cies, we conclude the model has not overfit to the older age group.
The influence of Time of Day and Time Slept
We added the Time of Day and Time Slept variables to the model to test their influence on the
current stage and its duration. Three models were run: without previous stage information,
with 1 back stage information, and with 2 back stage information (Fig 4, Models 2A, 2B and
2C).
Fig 4. Effects of Time of Day and Total Sleep Time. Model 2A: When previous stages not included, Model 2B: 1 back included, Model 2C: 2 back
included. Beside each model is the “in dataset” and “out of dataset” prediction accuracy and prediction error for current stage (top) and current stage
duration (bottom). Time of Day influences 0th order transition probabilities (2A) and 1st order transition probabilities (2B). Total Sleep Time influences
both 0th order transition probabilities and duration distributions when no previous stage information is available (2A).
https://doi.org/10.1371/journal.pone.0194604.g004
Big data analysis of sleep architecture and the effects of individual differences
PLOS ONE | https://doi.org/10.1371/journal.pone.0194604 April 11, 2018 7 / 27

We find that Time of Day affected the likelihood of the current stage when no previous
stage information is available (i.e. 0th order transition probabilities, Fig 4, Model 2A) and the
probability of the current stage given the last (i.e. 1st order transition probabilities, Fig 4,
Model 2B). Time of Day did not aid prediction of the current stage when at least the last two
stages were known (Fig 4, Model 2C). Time Slept influenced both the current stage and its
duration, but only when no previous stage information was available (Fig 4, Model 2A). These
findings are not surprising; the two-process model, and experimental observation[14], have
shown variation in sleep architecture based on circadian timing (Time Of Day) and magnitude
of sleep pressure (Time Slept). In addition to the two-process model, our model suggests that
stage duration changes are influenced by the duration of time already spent sleeping, rather
than circadian effects.
As sleep progresses through the night, there is a trade-off between the proportion of NREM
and REM sleep. Prior work using stage proportions was not able to determine whether these
temporal changes are due to an increased propensity to transition into NREM vs. REM or lon-
ger durations of NREM/REM bouts. To answer this question, we used our model (2A) to cal-
culate the 0th order transition probabilities (transition probabilities from any stage) and the
expected duration for each stage at 3 points over the night: start (when Time of Day = 1, TimeSlept = 1, 26% of data), middle (Time of Day = 2, Time Slept = 2, 19% of data) and end (Time ofDay = 3, Time Slept = 3, 26% of data). We then compare these values with the traditional mea-
sure of stage proportions in Fig 5.
Stage proportions were as expected, with decreasing SWS and increasing REM from night
to morning. Model parameters showed that the decrease in SWS proportion was driven by
both a reduced tendency to transfer to this stage (Fig 4, Model 2B), and reduced bout duration
(Fig 4, Model 2C), with the former decreasing sharply towards morning. The REM pattern
across the night mirrored SWS, but overall REM had longer durations, and lower transition
probability than SWS. Another interesting finding was that while WASO bouts became pro-
gressively shorter as the night progressed, they also became more frequent. It is often reported
Fig 5. Effects on model parameters (Model 2A) across the night. A) Stage proportions, B) Transition Probabilities (0th Order—the probability of
transitioning to a particular stage from any stage), C) Stage duration distributions as measured by expected duration. To calculate each statistic, we ran
the model 14 times, each time removing (and then replacing) one of the datasets from the full set of 14 datasets used to train the model. Points are the
mean and error bars are the standard deviation across these 14 runs (see Methods). REM: rapid eye movement sleep; SWS: slow wave sleep; WASO:
wake after sleep onset.
https://doi.org/10.1371/journal.pone.0194604.g005
Big data analysis of sleep architecture and the effects of individual differences
PLOS ONE | https://doi.org/10.1371/journal.pone.0194604 April 11, 2018 8 / 27

that the proportion of Stage 2 is constant across the night. However, our analysis showed Stage
2 transition probabilities decreased, but the durations increased over the night (less fragmenta-
tion towards morning), the effects of which, combined, left relatively flat stage proportions.
Finally, we noted that model predictions do not differ substantially across age groups (< 0.5%
variation for current stage, < 0.7% variation for duration).
Adding individual factors
We added individual variables of Sex, Age and BMI to the models from above (Fig 6). We
found BMI had no influence on stage durations or transition probabilities (when Time of Dayand Time Slept, Sex and Age were accounted for). Sex modulated the probability of the current
stage’s identity (i.e. different 0th order transition probabilities for each sex group). Age, mod-
eled categorically as younger (18–42 years), middle age (43–66 years), and older (67–90 years)
groups, had profound effects on sleep architecture dynamics, influencing 0th order transition
properties (Model 3A), and influenced stage durations even when all previous stages that were
predictive were included (Fig 6, Models 3A, 3B, 3C).
The effects of sex and age on stage proportions, transition probabilities, and expected dura-
tion were captured in the parameters of Model 3A (Fig 6, Model 3A, Model 3B, Model 3C;
Plotted in Fig 7). In general, durations were shorter and underwent less change across the
night for mid age and older adults compared to younger adults (i.e. main effect of age, and an
age�time interaction). Analysis of the duration distribution parameters (Fig 6, Model 3C)
showed that REM duration was up by 50% from night to morning for younger adults, while
REM duration in mid age and older adults only increased approximately 6%. Similar but
flipped patterns existed for Stage 2 and SWS. In older and mid age adults, durations of NREM
(SWS, Stage 2, Stage 1) were shorter, indicating more fragmentations. For Stage 2, SWS and
REM middle age and older adult durations tend to cluster and are dissimilar to younger adults.
Fig 6. Full model including individual factors. Model 3A: No previous stage information, Model 3B: 1 back stage information, Model 3C: 2 back
stage information. Beside each model is the “in dataset” and “out of dataset” prediction accuracy and prediction error for current stage (top) and
current stage duration (bottom). BMI: Body Mass Index.
https://doi.org/10.1371/journal.pone.0194604.g006
Big data analysis of sleep architecture and the effects of individual differences
PLOS ONE | https://doi.org/10.1371/journal.pone.0194604 April 11, 2018 9 / 27
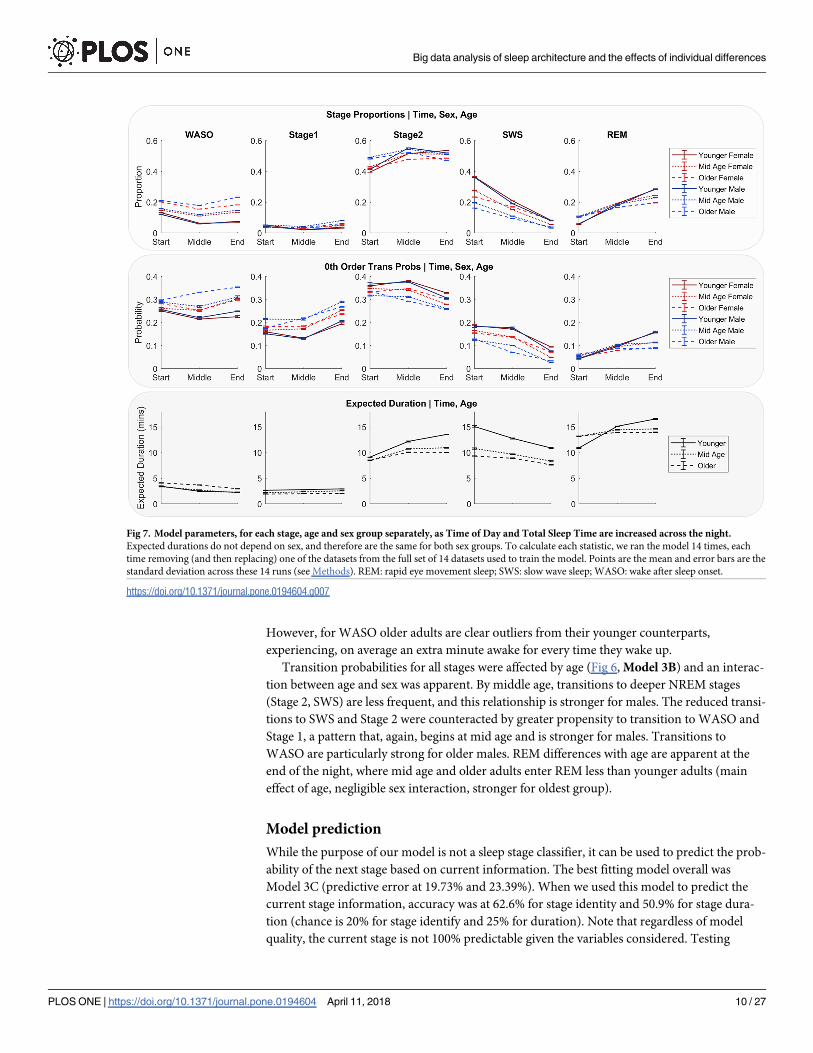
However, for WASO older adults are clear outliers from their younger counterparts,
experiencing, on average an extra minute awake for every time they wake up.
Transition probabilities for all stages were affected by age (Fig 6, Model 3B) and an interac-
tion between age and sex was apparent. By middle age, transitions to deeper NREM stages
(Stage 2, SWS) are less frequent, and this relationship is stronger for males. The reduced transi-
tions to SWS and Stage 2 were counteracted by greater propensity to transition to WASO and
Stage 1, a pattern that, again, begins at mid age and is stronger for males. Transitions to
WASO are particularly strong for older males. REM differences with age are apparent at the
end of the night, where mid age and older adults enter REM less than younger adults (main
effect of age, negligible sex interaction, stronger for oldest group).
Model prediction
While the purpose of our model is not a sleep stage classifier, it can be used to predict the prob-
ability of the next stage based on current information. The best fitting model overall was
Model 3C (predictive error at 19.73% and 23.39%). When we used this model to predict the
current stage information, accuracy was at 62.6% for stage identity and 50.9% for stage dura-
tion (chance is 20% for stage identify and 25% for duration). Note that regardless of model
quality, the current stage is not 100% predictable given the variables considered. Testing
Fig 7. Model parameters, for each stage, age and sex group separately, as Time of Day and Total Sleep Time are increased across the night.
Expected durations do not depend on sex, and therefore are the same for both sex groups. To calculate each statistic, we ran the model 14 times, each
time removing (and then replacing) one of the datasets from the full set of 14 datasets used to train the model. Points are the mean and error bars are the
standard deviation across these 14 runs (see Methods). REM: rapid eye movement sleep; SWS: slow wave sleep; WASO: wake after sleep onset.
https://doi.org/10.1371/journal.pone.0194604.g007
Big data analysis of sleep architecture and the effects of individual differences
PLOS ONE | https://doi.org/10.1371/journal.pone.0194604 April 11, 2018 10 / 27
model prediction accuracy for younger, mid age and older groups separately gives 62.4%,
61.9%, 63.2% for current stage, and 50.9%, 51.2%, 49.8% for duration.
Most of the predictive accuracy for the current stage comes from the stage directly before
it (27.5%, Model 2A vs 2B), with only 1.2% more accuracy when including Time of Day in
the model when 1 previous stage is known (Model 1B vs 2A). Similarly, age and sex produce
a small increase of 1.6% on transition probability accuracy from the model without them
(Model 3A vs 2A). For the current stages duration, accuracy does not improve markedly with
the addition of previous stage identity (0.4%, Model 1A vs 1B), or age (0.7%, Model 2C vs
3C).
Bayesian networks are generative models, and the probability of predictor (parent) variable,
such as age or sex, is easily computed from the outcome sleep architecture variables. Using this
property, we trained the model (Model 3A) on all but 100 “hold-out” subjects, and then pre-
dicted the age group category (younger, mid age or older) of the untrained subjects. Each sleep
data point was added to the model, and the most common age category returned over all data
points was considered the age prediction. This was repeated 3 times, with a different set of
hold-out subjects each time. The model was able to predict the correct age category 68±5% of
the time (chance is ~33%).
Discussion
Using a large multi-source dataset consisting of 3202 overnight recordings from a broad group
of healthy people across a wide age range, we investigated sleep architecture and how it is
affected by individual differences. First, we used static sleep statistics to show that sleep dif-
fered across both age and sex while controlling for total sleep time and sleep start time. Results
match pervious meta-analysis work [6], where minutes in WASO, Stage 1, Stage 2 increased
across age, while Slow Wave Sleep (SWS) and sleep efficiency decrease. For all NREM stages,
we found significant sex�age interaction, where males traded off an increase in lighter NREM
minutes (stage 1, stage 2) for a decrease in SWS minutes. In contrast to previous work [6],
REM minutes, and REM latency both showed curvilinear relationships where mid age adults
had decreased REM and reduced time to first enter this stage. These REM findings may point
to sleep deprivation in this group, where early work schedules restrict morning REM, which in
turn causes early transitions to this stage in subsequent nights.
Using discrete Bayesian networks, we then quantified the patterns and durations of sleep
stages, and potential moderators of this process. In keeping with the two-process model, we
found influence of Time of Day (affected transition probabilities only) and Time Slept
(affected both transition probabilities and stage durations) on sleep architecture. Interestingly,
we showed that relatively flat profile of WASO and Stage 2 usually observed across the night
was a combination of rising transition probabilities and falling durations for WASO, and fall-
ing transition probabilities and rising durations for Stage 2.
When adding individual differences, we found BMI had no effect, and that sex affects tran-
sition probabilities only. Sex’s influence on transition probabilities, as opposed to durations,
suggests that sex differences in sleep architecture are not due to a reduced tendency to stay in
various stages, but difficulty in transitioning to them. Age modulates transition probabilities
and durations, even when all previous stage information is available and, similar to a previous
investigation of transition probabilities[28], we find older adults have a reduced tendency to
transition to SWS, REM and wake more during the night. Considering each age/sex group sep-
arately, we found that middle age and older adults, and males in particular, had a reduced ten-
dency to transition to SWS and shortened SWS durations. A reduction in SWS proportion for
older males compared to older females has been reported elsewhere[6]. Here, we showed that
Big data analysis of sleep architecture and the effects of individual differences
PLOS ONE | https://doi.org/10.1371/journal.pone.0194604 April 11, 2018 11 / 27

this is due to a reduction in transition to SWS as opposed to shorter SWS durations. Mid age
and older adults had more fragmented sleep, exhibited by reduced duration of SWS and morn-
ing REM. This finding may suggest a deterioration in the neural mechanism that sustain SWS
across age.
The current results do support the idea that sleep architectural patterns are semi-determin-
istic—that the current stage’s probability is driven by stages that occurred before it. Even
without considering specific features of PSG, our model could predict the next stage to be tran-
sitioned to, and its duration, approximately 62.6% and 50.9% of the time respectively. Much of
this predictive power was gained by previous sleep architecture information alone, and not
individual differences or time of day/time slept. We conclude that future automatic sleep scor-
ing algorithms should include temporal context (i.e. previous stage information) to maximize
detection accuracy, but temporal context alone is not enough to provide robust scoring. While
age did not add much predictive power to the model, the model was able to predict the age cat-
egory from sleep architecture (68±5% accuracy). Future models may have success taking a sim-
ilar approach to detect illness from a combination of sleep dynamics and other indicators of
pathology.
In Markov Chain models of sleep architecture[18,27,33], the transition to the current stage
is considered a random process and is dependent on only the previous stage (t-1), or no stages
at all. Our work concludes that sleep is a 2nd order Markov Process and the addition of the
stage 2 back (t-2) is important. Further, these data highlight that if predicting the current stage
is the only goal of a model, and previous stage information is given, then Time of Day/TimeSlept information may be irrelevant (but age information remains important). This is likely
because specific patterns of stages (and their durations) occur at different times over the hours
of sleep, and once a specific pattern has initiated, then Time of Day provides no extra informa-
tion to predict the pattern end.
Contrary to previous literature, we found no relationship between BMI and sleep architec-
ture. Rao et al.[34] reported increased BMI associated with decreased proportion of SWS in an
older population (MrOS Study) after controlling for age, sex, clinic location, race, sleep effi-
ciency, sleep disordered breathing and other health variables. Additionally, Redline et al.[8]
found increased lighter sleep stages and reduced SWS associated with low BMI. These studies
had less stringent BMI exclusion criteria, looked at stage proportions rather than duration dis-
tributions and transition probabilities, and summed SWS over the whole night. These differ-
ences may account for our alternative BMI findings. BMI information was missing from some
studies, and the lower number of data points may have contributed to the lack of a BMI find-
ing. However, after removing data without BMI information and running all models without
BMI, the best fitting relationship among variables was unchanged for all, suggesting that a lack
of statistical power was not an issue. Further, while we employed strict exclusion criteria to
remove sleep disorders, some undiagnosed or subthreshold illnesses may be present. It
remains plausible that the pooling of undetected disorders with normal sleepers may have
blurred potential BMI relationships.
Similar to previous work[6,35,36], the current study found large effects of age, particularly
on SWS and WASO. Our Bayesian network and regression analysis both found non-linear age
effects with these stages whereby SWS minutes, proportions, durations and transition proba-
bilities reduced sharply between youth and mid-age, but flattened off in later life. For WASO,
the opposite was true, this stage was more constant up until mid-age, and then increased
abruptly (for both minutes + durations). Existing literature provides several potential explana-
tions for increased WASO with older age, including increased need to urinate during the night
(nocturia)[37], increased anxiety, discomfort or pain from chronic illnesses and change in hor-
mones (such as melatonin)[38]. In particular, previous reports indicating reduced melatonin
Big data analysis of sleep architecture and the effects of individual differences
PLOS ONE | https://doi.org/10.1371/journal.pone.0194604 April 11, 2018 12 / 27

levels[39,40] (a neurohormone related to circadian regulation and initiation of sleep), which
decreases with age, may be one mechanism driving older adults increased tendency to transi-
tion to WASO. Increased presence of b-amyloid and neurofibrillary tangles in the aging brain
[41], which has recently be linked to sleep fragmentation[42], as well as cell and receptor loss
in of brain areas responsible for maintaining sleep homeostasis[36], may also account for the
observed disrupted sleep with age.
Interactions between sex and age were apparent, particularly in both static and dynamic
measure of SWS, and dynamic measures of WASO. Males had greater deficits in SWS as they
age, exhibited by less total minutes in this stage, and reduced proportions, transition probabili-
ties and durations. The sex hormone testosterone plays an import part in healthy, consolidated
sleep[36] where reduced levels of testosterone lead to reductions in SWS[43]. Older males
exhibit reduced levels of testosterone, and this may contribute to shorter durations, increased
fragmentation of SWS and increased transitions to wake for the older male group. Further-
more, in some females, sleep disruption increases after menopause[44]. Postmenopausal
women also exhibit increased SWS[45], which may account for the slight increase in SWS
minutes in older females observed in static measures of SWS. Future studies should classify
females into pre/post menopause, and also consider the hormonal cycle, which has recently
been shown to impact REM architecture[46] and quality of NREM sleep[47].
Limitations
Several limitations of the current study need to be acknowledged. First, there are limitations
introduced by the data used. The data used has multiple levels of hierarchical, nested structure
where subjects are nested in dataset, and many sleep architecture data points within a subject
share that subject’s age, sex and BMI. While the nesting of data points within a dataset was
considered, the nested structure of data points within a subject was ignored, hence our param-
eter estimates may be less accurate. Additionally, by using discrete Bayesian networks, the res-
olution of many naturally continuous variables (stage durations) is lost. However, the loss of
power to detect variable relationships that stems from discretization[48] is, in part, mitigated
by the large sample size used. To reduce predictive error and improve parameter estimates,
future modeling work will focus on a hierarchical continuous model of the same data/
variables.
Sleep stages were quantized into 30 second epoch blocks (already present in the data), a
length which is arbitrary and chosen purely for historical reasons. In reality, sleep stage transi-
tions do not occur only at 30 second boundaries, and future work should consider sleep stages
as continuous. Sleep staging data was smoothed such that REM, SWS and Stage 2 bouts broken
by 1 minute or less of another stage were merged. This ‘theory driven’ as opposed to ‘data
driven’ approach was employed so that modeling tracked the duration of the well understood
ultradian cycles, and smoothed noise created by incorrect scoring. Additionally, it smoothed
over briefly fragmented stages to create a bias towards longer stage bouts. To test if the amount
of smoothing was appropriate, we reran the final model with twice as much smoothing. Model
structure did not change, and the overall pattern of parameters remained unaffected, however,
there was a predictable bias towards longer durations of Stage 2, SWS and REM as more gaps
of Stage 1 and WASO are filled. We also noticed that the transition probabilities of WASO and
Stage 1 trivially reduce as some bouts of these stages have been filled (and therefore cannot be
transitioned too).
In general, the multi-level regression and Bayesian analyses agree with each other. However,
our dynamic Bayesian analysis detected older males transition to WASO far more than their
counterparts, while this age�sex interaction was not clear from static measures. The observed
Big data analysis of sleep architecture and the effects of individual differences
PLOS ONE | https://doi.org/10.1371/journal.pone.0194604 April 11, 2018 13 / 27

discrepancy may be due to differences in these measures (e.g. the way total sleep time, or time
slept is accounted for), or differences in how these model compute parameters from the multi-
ple datasets used to train them. Higher resolution continuous Bayesian models may shed light
on the age�sex interaction of Wake After Sleep Onset.
Potential confounds exist in our data. While we excluded anyone taking sleeping medica-
tion and anti-depressants, as well as anyone with reported neurological, psychiatric or sleep
disorders, other medications or illnesses may affect sleep (e.g. Beta Blockers[49], diabetes[50])
and subjective sleep complaints were not taken into account. It is likely that undiagnosed or
subthreshold, mental, physical or sleep disorders are present in the data. These potentially
unhealthy individuals likely suffer from a range of disorders with differing effects on sleep
architecture, making it impossible to detect or control for. Furthermore, detailed information
of previous sleep history and habits were not available, and napping, chronotypes and circa-
dian alignment were not considered. Napping is likely to be more apparent in the older popu-
lation and may have influenced our results. Sleep scored with R&K vs AASM standards have
shown different sleep architecture profiles[51]. While there is not enough numeracy in the
AASM data to directly compare these two scoring methods, we reran the final model (Fig 6)
without AASM data (4 datasets removed) and the conclusions drawn from this model did not
change. Another issue that may impact differences across age group is that the EEG features
used to visually score sleep change with age[52]. Potentially, some of the observed differences
in sleep in older and young adults may be due to differences in classification of sleep epochs in
these populations. Lastly, Time of Day and Total Sleep Time are two correlated parameters, and
this may have reduced our ability to tease apart their effects. Future models should consider
the addition of data from naps or circadian misalignment studies to add greater Time of Day vs
Total Sleep Time variability. Additionally, a continuous model with more resolution of these
variables may provide insightful information.
Future directions
The addition of EEG variables to the model would greatly improve prediction of sleep stages as
the sleep homeostasis literature has shown Slow Wave Activity is highly predictive of the pro-
pensity for sleep (Process S in the two-process model) and is correlated with NREM/REM
cycles. Other features of the EEG are also indicative of specific sleep patterns (sleep spindles,
K-complexes, REM events, alpha activity). However, by not including EEG explicitly in the
model, we have developed an algorithm that can predict and simulate sleep stages based on
data that is incomplete (missing some previous stage information, i.e. model 3B, 3C, 3B, 2B) or
sensor-less (no previous stage information, i.e. model 3A, 2A). Sensorless models may be of
commercial interest in ‘smart alarm’ products aimed to wake a user in a specific sleep stage to
overcome the negative effects of sleep inertia[53], to architect the perfect nap[54], or to reduce
the risk for early morning cardiovascular events and stroke[55].
Ethnicity information was not available for all datasets, however, given the genetic influence
on sleep[56,57], an investigation of the changes in sleep dynamics with ethnicity is a future
direction.
Our model should be considered a promising initial step towards a full continuous model
of sleep architecture, able to accurately predict and generate the pattern of sleep stages over
the night. One potential extension of our work is the diagnosis of sleep and health disorders
including, but not limited to, excessive drug use, cardiovascular disease, diabetes, depression,
sleep apnea and insomnia[58]. This would be readily achieved using the current modeling
framework with the addition of variables that code for the presence of an illness. After training
the model on a relevant dataset, it would then be possible to query the model on individual
Big data analysis of sleep architecture and the effects of individual differences
PLOS ONE | https://doi.org/10.1371/journal.pone.0194604 April 11, 2018 14 / 27

cases and garner a probability for having the target illness (similar to how we predicted age
from sleep architecture).
Conclusion
Our work demonstrates the high fidelity of Bayesian networks coupled with big data in captur-
ing the dynamics of normal sleep and the influence of individual differences. Our model suc-
cessfully captured the statistics of sleep architecture to predict the current stage. It shows that
time of day, total sleep time, sex, age, but not BMI influence sleep architecture when no previ-
ous stage information is known. Future work will use continuous Bayesian network modeling
on clinical datasets to help diagnose illness.
Materials and methods
Dataset
The 3202 records of sleep (mean age 62.5 years, 60% male) used to train the models in this
study came from the following 14 sources: The University of California, Riverside (now Irvine)
Sleep and Cognition Lab[59], Furman Sleep Lab[60], The Institute of Medical Psychology and
Behavioral Neurobiology at the University Tubingen[61–69], the Sleep Psychophysiology Lab
at University of Padova[70], 6 open-source sleep datasets available on the National Sleep
Research Resource (NSRR)[50,71–83], the Sleep EDF Database[84–86], CAP Study Database
[84,86], St Vincent/University College Dublin Dataset and the Montreal Archive of Sleep Stud-
ies[87] (MASS). The University of California Riverside Institutional Review board determined
no new Ethical Review was required as the original ethics approval of each dataset covered the
reuse of data for the current analysis. For datasets containing multiple nights for the same sub-
jects, only the first night was used. Detailed information on the datasets can be found in sup-
plementary material (S2 Table). Total sleep time is restricted in some studies and controlled
for in analyses. Wake before sleep onset is removed from all records. BMI information was not
available in some studies (see S1 Table for details). Models where BMI is a predictor ignore
subjects without BMI (23% of subjects excluded).
Records from individuals with diagnosed sleep disorders (e.g., narcolepsy, sleep apnea,
sleep disorder breathing, and insomnia) and mental disorders/neurological disease (e.g.,
depression, schizophrenia, Parkinson’s, Alzheimer’s, etc.) were excluded. Subjects who
reported taking anti-depressants or sleep aids were not included. Additionally, people that
exhibited more than mild levels of sleep disordered breathing during the sleep recording were
excluded (if apnea hypopnea Index> 15, obstructive apnea-hypopnea index> 15, obstructive
apnea index > 5, central apnea index> 5, or respiratory disturbance index > 15). In datasets
that contained subjects with known disorders affecting sleep, only control subjects were used
(e.g. sleep-EDF Database). Records from people older than 90 years of age and younger than
18 years of age were excluded due to low numericity. People with extreme BMI values >50kg/
m2, and those in the underweight category (<18.5kg/m2) were not considered. Subjects with
extreme (±2.5 Standard deviations) sleep start times [<18:14, >01:20] and total sleep times
[<285 mins, >650 mins] were considered outliers and removed. While these exclusion
criteria sought to remove any unhealthy subjects, we cannot rule out the presence of some
sub-threshold or undiagnosed mental or sleep disorders. Fig 8 shows distributions for continu-
ous demographic variables for both sexes. Sleep records were scored using a combination of
Rechtschaffen and Kales[15] (R&K) and the American Academy of Sleep Medicine[88]
(AASM) standards (see S1 for each dataset) and Stage 3/Stage 4 Sleep from the R&K criteria
were combined to give SWS. A comparison of PSG variables (Minutes in stages, Sleep Effi-
ciency, Total Sleep Time) across dataset can be seen in S1 Fig.
Big data analysis of sleep architecture and the effects of individual differences
PLOS ONE | https://doi.org/10.1371/journal.pone.0194604 April 11, 2018 15 / 27

Static sleep architecture methods
We investigating the effect of individual differences on static measures of sleep architecture via
a multi-level regression framework. Variables that sum to one are not generally suitable for lin-
ear regression techniques. Therefore, we excluded sleep proportions (the total time spent in a
stage, normalized by total sleep time). Thus, we considered as dependent variables: minutes in
stage, sleep efficiency (i.e., the ratio between total sleep time and the time spent in bed after
sleep onset, proportion) and REM latency (i.e., the time from the first sleep stage to the first
REM stage, minutes). Given the presence of sleep time restrictions in some studies and
changes in sleep architecture across the day, we controlled for total sleep time (z-scored) and
sleep onset (z-scored). Sex is coded 0 = female, 1 = male and age is left uncentered. Regressions
are fit with a sample based Markov Chain Monte Carlo (MCMC) method (No U-Turn Sam-
pler[89]) using the python package PyMC3[90]. The MCMC sampling procedures used 2
chains, a 500 sample burn in period and 2000 samples for parameter distribution estimates.
Gelman-Ruben R[91] and visual inspection were used to monitor convergence.
Fig 8. Distributions of continuous variables. Red dashed lines indicated edges of discretization where relevant (see Discretization section). A) Age (per
subject), B) Time of Day (per data point), C) Body mass index (BMI, per subject), D) Time Slept (per data point—e.g. a subject who slept for 400 mins
will impact the histogram from 0 to 400).
https://doi.org/10.1371/journal.pone.0194604.g008
Big data analysis of sleep architecture and the effects of individual differences
PLOS ONE | https://doi.org/10.1371/journal.pone.0194604 April 11, 2018 16 / 27

To account for possible dataset differences (as seen in S1 Fig), we use a multi-level analysis
and add variables in a stepwise manner, stopping once model fit does not improve. First, we
began with a pooled model (non-multi-level) and test the simplest model, which includes the
intercept term and covariates only (TST and sleep onset), then we add age, sex and finally the
sex�age interaction, age2, and finally the sex�age2 interaction term. Second, we moved to a
random intercept model (intercepts allowed to vary between datasets) and tested the same
variables. Third, and finally, we progressed to random slopes model (slopes allowed to vary
between datasets) with the same stepwise procedure. If including a variable increased model
fit, then that variable is considered a significant predictor of the outcome. The 95% creditable
intervals around parameter estimates are also reported. Models are compared using the Wan-
nabe-Akaike Information Criterion (WAIC)[92], a generalization of the Akaike Information
Criterion[93] (AIC), to measure out of sample fit expectation and control for overfitting. To
select between candidate models, WIAC values are converted to Akaike weights, which give
the probability that a particular model is the best model given the data and the set of candidate
models[94].
To gain an intuitive understanding of relationships defined by the models, we plot predic-
tions of outcome variables across age for male and female (Fig 2). To show the uncertainly in
predictions, regression parameters are randomly sampled 150 times from the model’s joint
parameter distribution (for each sex level), and each is used to plot a regression line.
Dynamic sleep architecture methods
Bayesian network[95] methods proceeded in 3 steps: 1) we modeled the temporal structure of
sleep by fitting a model to predict the current stage and its duration from previous stage infor-
mation. 2) We tested the influence of other variables on sleep architecture by first introducing
Time of Day/Time Slept to the model, and then 3) we tested the individual difference variables
of sex, BMI and age. For 2 and 3, we varied the amount of previous stage information available
to find the optimum predictive model. We sought to determine which candidate variables or
set of candidate variables best predicted sleep architecture. Therefore, for all Bayesian models,
a greedy search algorithm (K2 hill climbing algorithm[96]) was first used to find the best fitting
model over the variables given (described in Structural search and model comparison section)
followed by analysis of model parameters to elucidate the specific effects of age, sex, BMI, and
time. Predictive error and accuracy was used to compare models (see Structural search andmodel comparison).
Dynamic measures: Transition probabilities and stage duration distributions. Stage
transition probabilities have been used previously to detect sleep architecture changes with
illness[23] or age[28] and are defined as the probabilities of transitioning to a specific stage
from any stage i.e. P(Current Stage = i), to a specific stage from a specific stage, i.e. P(Current
Stage = i|Previous Stage = j), or to a specific stage from some history of stages, i.e. P(Current
Stage = i|Previous Stage = j, Previous Previous Stage = k) and are referred to as 0th order, 1st
order, and 2nd order transition probabilities respectively. For example, the 0th order probability
of REM, which is the probability of transitioning to REM from any stage would be low at the
start of the night, and high towards the end of the night. However, the first order probability of
transitioning from SWS to REM would be close to zero across the entire night. Probabilities
were calculated by counting the number of transitions to stage i (or to stage i from stage j, etc.)
and normalizing by the total number of stage transitions. First order transition probabilities
can be seen in Table 1. We were invested in the dynamics of sleep once sleep has begun, rather
than sleep/wake homeostasis, therefore transitions from initial wake or to final wake were not
considered (i.e. WASO transitions includes spontaneous awakenings only).
Big data analysis of sleep architecture and the effects of individual differences
PLOS ONE | https://doi.org/10.1371/journal.pone.0194604 April 11, 2018 17 / 27

Stage duration. Distributions are the distributions of a specific stage’s bout durations.
Here, bout duration refers to an uninterrupted segment of a specific stage. For example, one
can extract all bouts of REM from a person or a group of people, and plot a histogram of their
frequency with respect to duration (see Fig 9 for an example). If REM bouts are shorter (i.e.
more fragmentation), then this histogram will have more probability mass at shorter dura-
tions. Sleep follows an ultradian pattern alternating between NREM and REM, and these ultra-
dian periods, especially REM, may be broken by brief awakenings or transitions to Stage 1. To
ensure that duration distributions account for ultradian period in their entirety, we smooth (in
order) REM, SWS and Stage 2 such that gaps in these stages up to 1 minute in length are filled.
Smoothing employs the “binary close” operation of dilation followed by erosion common in
computer vision[97].
By calculating the transition probabilities and duration distribution histograms at different
times of the day, it was possible to tease apart if a higher stage proportion statistic was due to
increased likelihood to transition to that stage (e.g. more fragmentation) or extended durations
of that stage (more rightward skew of duration distributions). Both of these measures were
contained in the parameters of the Bayesian network when used to predict the current sleep
stage. Note that transition probabilities and stage durations were not significantly correlated
(e.g. in our data for WASO, r = 0.00, p = 0.99, n = 3202).
Variables considered. Before we can use dynamic measures to classify differences in sleep
we needed to understand which variables modulate sleep architecture. Using discrete Bayesian
networks, we tested the influence of various potential moderators (and, implicitly, their inter-
actions) on sleep architecture. These models tested a series of independence assumptions. For
example, we could ask if a model that defines a dependence between time of day and stage
Table 1. 1st order transition probabilities static across whole night.
1st OrderTrans Probs TO STAGE:
WASO Stage 1 Stage 2 SWS REM
FROM STAGE: WASO - 0.64 0.33 0.00 0.02
Stage 1 0.43 - 0.52 0.00 0.05
Stage 2 0.44 0.04 - 0.31 0.21
SWS 0.15 0.00 0.80 - 0.05
REM 0.60 0.09 0.31 0.00 -
Notes: Data from all subjects and across whole night. REM: rapid eye movement sleep; SWS: slow wave sleep; WASO: wake after sleep onset.
https://doi.org/10.1371/journal.pone.0194604.t001
Fig 9. Stage duration distributions. Data from all subjects and across the whole night. REM duration distribution shows less fragmentation (longer
bouts) than SWS. REM: rapid eye movement sleep; SWS: slow wave sleep; WASO: wake after sleep onset.
https://doi.org/10.1371/journal.pone.0194604.g009
Big data analysis of sleep architecture and the effects of individual differences
PLOS ONE | https://doi.org/10.1371/journal.pone.0194604 April 11, 2018 18 / 27

transition probabilities fits our data better than a model where these two variables are indepen-
dent. Furthermore, we could test if the sleep architecture signal is quantitatively different if it
came from younger or older adults, males or females, etc.
The variables tested are broadly categorized into individual differences (BMI, Sex, Age) and
those theoretically derived from the two-process model (circadian cycle, modeled as Time ofDay, and Time Slept). As opposed to Bedtime and Total Sleep Time which are a constant for
each subject, Time of Day and Time Slept are updated across the night and capture the tempo-
ral state of a subject’s sleep. Note that Time of Day and Time Slept were correlated—they both
increased over the night (r = 0.76, p<0.05)
We excluded the following variables: 1) EEG-based variables in the time and frequency
domain (e.g., k-complexes, slow wave activity), which may have aided prediction and classifi-
cation, but were left out of the current model to reduce complexity and allow the prediction of
sleep with no physiological measurement (for models that include no previous sleep stage
information); and 2) Prior sleep information (e.g., morning wake time), which would have
provided additional information about homeostatic sleep pressure, but were not available in
the current dataset.
Bayesian networks
Structural search and model comparison. A Bayesian network is a probabilistic, genera-
tive, graphical model that represents a set of conditional dependences between random vari-
ables. The lack of a relationship between any variable A and any other variable B represents
conditional independence between A and B. For example, if sex influences sleep stage durationand sex also influences BMI, then there will be a relation between BMI and sleep stage durationif sex is not included, but no relation if it is included in the model (i.e., BMI and stage duration
are independent given sex). We used the Bayesian information criterion (BIC) score[98] to
compare relationships between variables. This score captures the best fitting model while
penalizing excess relations between variables to reduce overfitting (see S2 Fig in supplementary
methods for an example). Bayesian networks were implemented using the Bayes Net Toolbox
[99] for MATLAB[100].
The BIC score is only comparable across models with the same variables and data. To facili-
tate comparison across all models, we calculated each model’s predictive error and predictiveaccuracy of the correct current stage and duration from all other variables using a standard k-
fold cross validation procedure (k = 5). This process ensured overfitting did not bias our
results because no data used to train the model is used to estimate accuracies. The data was
randomly shuffled and split into 5 equal folds. Four of these folds (80% of data) were combined
to form a training set, and the remaining 20% of data was used for testing (testing accuracy
reported only). The whole procedure was repeated 3 times with different random shuffles. The
mean and standard deviation for all 5 splits and all 3 shuffles are reported for each model that
appears in the paper.
Predictive error for each data point is the mean of the absolute difference between predicted
stage probabilities and the actual stage observed (in vector form). For example, if the next
stage is REM, the actual stage vector is [0, 0, 0, 0, 1] (here REM is the fifth stage). Our model
may return the probability of the current stage as [0.2, 0.1, 0.1, 0.15, 0.35]. Predictive error for
this data point is the mean of the absolute difference e.g. [0.2, 0.1, 0.1, 0.15, 0.65] = 0.24). Inter-
nally, the way each model attempts to maximize the BIC score and parameter estimates is
equivalent to minimizing the predictive error. Prediction accuracy for each data point is the
most probable stage (or duration bin) compared to the actual stage and takes a value of 1 if the
most probable stage equals the actual stage, and zero otherwise. In the above example, the
Big data analysis of sleep architecture and the effects of individual differences
PLOS ONE | https://doi.org/10.1371/journal.pone.0194604 April 11, 2018 19 / 27

most probable stage is REM (P(REM) = 0.35) and the correct stage is also REM, therefore the
predictive accuracy is 1 for that that data point. Predictive accuracy is the accuracy that could
be expected if this model was used to predict a sequence of sleep stages and their durations.
The models used were built to capture variability in sleep architecture as opposed to prediction
of the next stage, therefore predictive error gives a better measure model quality.
Parameter fitting, generalizability, and significance testing. All variables in the model
were discrete, and therefore the parameters for each variable were the probability of each pos-
sible value of the variable, conditional on each possible value of its parents. This means that
parameters in the models associated with stage identity represent transition probabilities (of
various order), and parameters associated with stage duration were duration distributions. For
example, if the identity of a stage is not influenced by any other variables, then there are 5
parameters representing the probability of transitioning to each stage from any stage (0th
Order Transition Probabilities). If the previous stage influences the current stage, there are 5 x
5 parameters, representing the probability of the current stage given each possible previous
stage (1st Order Transition probabilities, Table 1).
For analysis of stage durations, we were more interested in the change of the expected dura-
tion (a single value per stage) rather than how the distribution changes (4 values per stage, see
Discretization section). For each stage, we converted the 4-parameter duration distribution
back to a single expected (�mean) duration by taking the dot product with the midpoints of
that stages’ discretization bins (as in S3 Table).
To capture the generalizability of our model, we ran every model 14 times, each time
removing (and then replacing) one of the datasets from the full set of datasets used to train the
model. The parameter estimates from each of these runs were noted, and, similar to multi-
level-modeling, we gained a low-resolution distribution of the expected parameter estimates in
the population. Parameter values reported in the paper are the mean of these distributions,
and the standard deviations are shown as error bars. Additionally, we calculated the out-of-dataset predictive accuracy which quantifies the expected accuracy for a new subject from a
new dataset (as opposed to estimates for new subject within a dataset). This was achieved
using that same k-fold technique as in 2.2.3, where each fold was a dataset.
To test parameter significance, we use a standard bootstrapping technique to generate con-
fidence intervals. Exact confidence intervals, as well as a thorough description of the bootstrap-
ping method used, appear in supplementary methods (S4 and S5 Tables). However, due to the
large amount of data used in this study, statistical power increased to the point where trivially
small effect sizes led to significance. Instead of focusing on significance, effect sizes were the
primary statistic of interest in this paper. The Bayesian Network technique allows us to build
in existing knowledge in the form of priors for model parameters. Due to the exploratory
nature of this work, we chose uninformed priors for all model parameters so as not to add any
specific bias to our model. Note that choice of priors is unlikely to have any influence because
of the large amount of data used.
Discretization. To train our models, we broke the record of sleep for each subject into a
set of data points, one for each bout of a sleep stage. Each data-point contained the stage dura-tion, stage identity, stage start time (Time of Day), time since the start of sleep (Time Slept), Sex,
Age and BMI of the subject, as well as durations and identities of previous stage. We refer to
the current stage as t and previous stages as t-1 (one back), t-2 (two back), t-3 (three back). A
thorough explanation of this process appears in S2 Text. To simplify modeling, the hierarchical
structure of this data (i.e., variables created by the sliding window are ‘nested’ within the same
BMI, Sex and Age) was not accounted for in the model.
All variables in our Bayesian network models were discrete valued. By using discrete vari-
able representation, we decreased the complexity of modeling because the exact functional
Big data analysis of sleep architecture and the effects of individual differences
PLOS ONE | https://doi.org/10.1371/journal.pone.0194604 April 11, 2018 20 / 27

relationship between variables could be undefined. Unfortunately, discretizing a naturally con-
tinuous variable (e.g., such as splitting the continuous BMI measure into low BMI and high
BMI) also reduced the resolution model predictions. As a first version of this model, we chose
simplicity over predictive power and as such, continuous variables were discretized. Further-
more, there is conflict in the field over which parametric functions best describe the distribu-
tion of each stage’s durations [22]. Instead of pre-specifying these distributions (as in 28,92),
our discretizing scheme essential fits a multinomial distribution to each stage’s duration distri-
bution, which gives a flexible, albeit low resolution, representation.
Where possible, discretization schemes are principled. BMI was split at 25 kg/m2, the cutoff
for the ‘normal’ category. The age range was split equality into 3 parts, yielding younger (18–
42 years), middle age (43–66 years), and older (67–90 years) groups. Duration of all stages
closely resembled a log-normal distribution, therefore, durations discretization bins were loga-
rithmically spaced from the minimum duration to the 95th quartile duration (not max, because
it would be influenced by outliers. The remaining 5% was included in the last bin). For other
variables, such as Time of Day and Time Slept, discretization could not be made pragmatically.
We follow the common approach for Bayesian networks where data is split into quantiles, with
an equal number of data points in each discretization bin (3 bins used for each). See S3 Table
for exact discretization bin edges.
Supporting information
S1 Fig. Dataset differences between traditional sleep architecture variables. See S2 Table for
more information on each dataset. SWS: slow wave sleep; WASO: wake after sleep onset;
REM: rapid eye movement sleep.
(TIF)
S2 Fig. An example of comparing 4 Bayesian networks. Each defines a different set of
hypotheses over the variables considered (not trained on real data). The model with the Bayes-
ian Information Criterion (BIC) score closest to zero (the 3rd model) is most likely to generate
the observed data. The K2 algorithm searches across the possible relationships between vari-
ables to find the one with the lowest BIC.
(TIF)
S3 Fig. Graphical explanation of conversion from an individual’s sleep architecture pattern
to data points. SWS: slow wave sleep; WASO: wake after sleep onset.
(TIF)
S1 Table. Regression parameters for the relationship between static sleep architecture
measures, sex and age after controlling for total sleep time and sleep onset.
(DOCX)
S2 Table. Data sources.
(DOCX)
S3 Table. Discretization schemes for continuous variables.
(DOCX)
S4 Table. Non-significant confidence intervals values from Fig 9 (Model 2A parameters).
(DOCX)
S5 Table. Non-significant comparisons from Fig 7 (Model 3A parameters).
(DOCX)
Big data analysis of sleep architecture and the effects of individual differences
PLOS ONE | https://doi.org/10.1371/journal.pone.0194604 April 11, 2018 21 / 27
S1 Text. Bootstrapping method for parameter significance.
(DOCX)
S2 Text. Data parsing scheme.
(DOCX)
S3 Text. Data availability.
(DOCX)
Acknowledgments
The authors would like to acknowledge the Juan Antonio, Kevin Zhen, Sehoon Bang and Jesse
Reyes for their efforts in parsing and cleaning much of this data as well as Lauren Whitehurst,
Susanne Diekelmann and Erin Wamsley for generously donating data. Furthermore, we thank
Negin Sattari, Mohsen Naji, Lexus Hernandez and Michael Lee of UC Irvine for valuable dis-
cussion throughout the project.
Author Contributions
Conceptualization: Benjamin D. Yetton, Elizabeth A. McDevitt, Nicola Cellini, Sara C.
Mednick.
Data curation: Benjamin D. Yetton.
Formal analysis: Benjamin D. Yetton.
Funding acquisition: Sara C. Mednick.
Investigation: Benjamin D. Yetton.
Methodology: Benjamin D. Yetton, Christian Shelton, Sara C. Mednick.
Project administration: Benjamin D. Yetton, Sara C. Mednick.
Resources: Benjamin D. Yetton, Sara C. Mednick.
Software: Benjamin D. Yetton.
Supervision: Elizabeth A. McDevitt, Nicola Cellini, Christian Shelton, Sara C. Mednick.
Validation: Benjamin D. Yetton.
Visualization: Benjamin D. Yetton.
Writing – original draft: Benjamin D. Yetton.
Writing – review & editing: Benjamin D. Yetton, Elizabeth A. McDevitt, Nicola Cellini, Sara
C. Mednick.
References1. Drake CL, Roehrs T, Roth T. Insomnia causes, consequences, and therapeutics: An overview.
Depress Anxiety. 2003; 18: 163–176. https://doi.org/10.1002/da.10151 PMID: 14661186
2. Ferrillo F, Donadio S, De Carli F, Garbarino S, Nobili L. A model-based approach to homeostatic and
ultradian aspects of nocturnal sleep structure in narcolepsy. Sleep. 2007; 30: 157–65. PMID:
17326541
3. McArdle N, Douglas NJ. Effect of continuous positive airway pressure on sleep architecture in the
sleep apnea—hypopnea syndrome: a randomized controlled trial. Am J Respir Crit Care Med. Am
Thoracic Soc; 2001; 164: 1459–1463.
4. Kupfer DJ. Application of EEG sleep in the treatment of depression. Electroneurophysiology and Psy-
chopathology. Karger Publishers; 1981. pp. 87–93.
Big data analysis of sleep architecture and the effects of individual differences
PLOS ONE | https://doi.org/10.1371/journal.pone.0194604 April 11, 2018 22 / 27

5. Wilson S, Argyropoulos S. Sleep in schizophrenia: Time for closer attention. Br J Psychiatry. 2012;
200: 273–274. https://doi.org/10.1192/bjp.bp.111.104091 PMID: 22474232
6. Ohayon MM, Carskadon MA, Guilleminault C, Vitiello M V. Meta-Analysis of Quantitative Sleep
Parameters From Childhood to Old Age in Healthy Individuals: Developing Normative Sleep Values
Across the Human Lifespan. Sleep. 2003; 31: 20–23.
7. Taheri S, Lin L, Austin D, Young T, Mignot E. Short sleep duration is associated with reduced leptin,
elevated ghrelin, and increased body mass index. PLoS Med. 2004; 1: 210–217. https://doi.org/10.
1371/journal.pmed.0010062 PMID: 15602591
8. Redline S, Kirchner HL, Quan SF, Gottlieb DJ, Kapur V, Newman A. The Effects of Age, Sex, Ethnicity,
and Sleep-Disordered Breathing on Sleep Architecture. Arch Intern Med. 2004; 164.
9. Daan S, Beersma DG, Borbely A. Timing of human sleep: recovery process gated by a circadian pace-
maker. Am J Physiol. 1984; 246: R161–R183. https://doi.org/10.1152/ajpregu.1984.246.2.R161
PMID: 6696142
10. Drake C, Roehrs T, Shambroom J, Roth T. Caffeine effects on sleep taken 0, 3, or 6 hours before
going to bed. J Clin Sleep Med. 2013; 9: 1195–1200. https://doi.org/10.5664/jcsm.3170 PMID:
24235903
11. Zhang L, Samet J, Caffo B, Punjabi NM. Cigarette smoking and nocturnal sleep architecture. Am J Epi-
demiol. 2006; 164: 529–537. https://doi.org/10.1093/aje/kwj231 PMID: 16829553
12. Cohen-Zion M, Drummond SPA, Padula CB, Winward J, Kanady J, Medina KL, et al. Sleep architec-
ture in adolescent marijuana and alcohol users during acute and extended abstinence. Addict Behav.
2009; 34: 976–979. https://doi.org/10.1016/j.addbeh.2009.05.011 PMID: 19505769
13. American Academy of Sleep Medicine. The international classification of sleep disorders: diagnostic
and coding manual. American Acad. of Sleep Medicine; 2005.
14. Carskadon MA, Dement WC, others. Normal human sleep: an overview. Princ Pract sleep Med. Else-
vier, Philadelphia; 2005; 4: 13–23.
15. Rechtschaffen, Kales A. A manual of standardized terminology, techniques and scoring system for
sleep stages of human subjects. 1968;
16. Berry RB, Brooks R, Gamaldo CE, Harding SM, Marcus CL, Vaughn B V. The AASM manual for the
scoring of sleep and associated events. Rules, Terminol Tech Specif Darien, Illinois, Am Acad Sleep
Med. 2012;
17. Moser D, Anderer P, Gruber G, Parapatics S, Loretz E, Boeck M, et al. Sleep classification according
to AASM and Rechtschaffen & Kales: effects on sleep scoring parameters. Sleep. Oxford University
Press; 2009; 32: 139–149.
18. Bizzotto R, Zamuner S, De Nicolao G, Karlsson MO, Gomeni R. Multinomial logistic estimation of Mar-
kov-chain models for modeling sleep architecture in primary insomnia patients. J Pharmacokinet Phar-
macodyn. 2010; 37: 137–155. https://doi.org/10.1007/s10928-009-9148-2 PMID: 20052524
19. El-Ad B, Lavie P. Effect of sleep apnea on cognition and mood. Int Rev Psychiatry. Taylor & Francis;
2005; 17: 277–282.
20. Achermann P, Borbely A. Sleep Homeostasis and Models of Sleep Regulation. Wien Med
Wochenschr. 1999; 145: 402–406.
21. Bianchi MT, Cash SS, Mietus J, Peng C-K, Thomas R. Obstructive sleep apnea alters sleep stage
transition dynamics. PLoS One. 2010; 5: e11356. https://doi.org/10.1371/journal.pone.0011356
PMID: 20596541
22. Chu-Shore J, Westover MB, Bianchi MT. Power law versus exponential state transition dynamics:
Application to sleep-wake architecture. PLoS One. 2010; 5. https://doi.org/10.1371/journal.pone.
0014204 PMID: 21151998
23. Kishi A, Struzik ZR, Natelson BH, Togo F, Yamamoto Y. Dynamics of sleep stage transitions in healthy
humans and patients with chronic fatigue syndrome. Am J Physiol—Regul Integr Comp Physiol. 2008;
294: R1980–R1987. https://doi.org/10.1152/ajpregu.00925.2007 PMID: 18417644
24. Bianchi MT, Eiseman NA, Cash SS, Mietus J, Peng CK, Thomas RJ. Probabilistic sleep architecture
models in patients with and without sleep apnea. J Sleep Res. 2012; 21: 330–341. https://doi.org/10.
1111/j.1365-2869.2011.00937.x PMID: 21955148
25. Kishi A, Yasuda H, Matsumoto T, Inami Y, Horiguchi J, Tamaki M, et al. NREM Sleep Stage Transi-
tions Control Ultradian REM Sleep Rhythm. Sleep. 2011; 34: 1423–1432. https://doi.org/10.5665/
SLEEP.1292 PMID: 21966074
26. Wei Y, Colombo MA, Ramautar JR, Blanken TF, van der Werf YD, Spiegelhalder K, et al. Sleep stage
transition dynamics reveal specific stage 2 vulnerability in insomnia. Sleep. Oxford University Press
US; 2017; zsx117.
Big data analysis of sleep architecture and the effects of individual differences
PLOS ONE | https://doi.org/10.1371/journal.pone.0194604 April 11, 2018 23 / 27

27. Kemp B, Kamphuisen HAC. Simulation of Human Hypnograms Using a Markov Chain Model. Sleep.
1986; 9: 405–414. PMID: 3764288
28. Schlemmer A, Parlitz U, Luther S, Wessel N, Penzel T. Changes of sleep-stage transitions due to age-
ing and sleep disorder. Phil Trans R Soc. 2015; A373: 1–16. http://dx.doi.org/10.1098/rsta.2014.0093
29. Lo C-C, Chou T, Penzel T, Scammell TE, Strecker RE, Stanley HE, et al. Common scale-invariant pat-
terns of sleep-wake transitions across mammalian species. Proc Natl Acad Sci U S A. 2004; 101:
17545–8. https://doi.org/10.1073/pnas.0408242101 PMID: 15583127
30. Lo C, Nunes Amaral LA, Havlin S, Ivanov PC, Penzel T, Peter JH, et al. Dynamics of sleep-wake tran-
sitions during sleep.pdf. Eur Lett. 2002; 57: 625–631.
31. Borbely AA. A two process model of sleep regulation. Hum Neurobiol. Springer-Verlag; 1982;
32. De Oliveira Alvares L, Crestani AP, Cassini LF, Haubrich J, Santana F, Quillfeldt JA. Reactivation
enables memory updating, precision-keeping and strengthening: Exploring the possible biological
roles of reconsolidation. Neuroscience. IBRO; 2013; 244: 42–48. https://doi.org/10.1016/j.
neuroscience.2013.04.005 PMID: 23587841
33. Kjellsson MC, Ouellet D, Corrigan B, Karlsson MO. Modeling sleep data for a new drug in development
using Markov mixed-effects models. Pharm Res. 2011; 28: 2610–2627. https://doi.org/10.1007/
s11095-011-0490-x PMID: 21681607
34. Rao MN, Blackwell T, Redline S, Stefanick ML, Ancoli-Israel S, Stone KL. Association between sleep
architecture and measures of body composition. Sleep. 2009; 32: 483–490. PMID: 19413142
35. Ehlers CL, Kupfer DJ. Effects of age on delta and REM sleep parameters. Electroencephalogr Clin
Neurophysiol. Elsevier; 1989; 72: 118–125.
36. Mander BA, Winer JR, Walker MP. Review Sleep and Human Aging. Neuron. Elsevier Inc.; 2017; 94:
19–36. https://doi.org/10.1016/j.neuron.2017.02.004 PMID: 28384471
37. Coyne KS, Zhou Z, Bhattacharyya SK, Thompson CL, Dhawan R, Versi E. The prevalence of nocturia
and its effect on health-related quality of life and sleep in a community sample in the USA. BJU Int.
2003; 92: 948–954. https://doi.org/10.1111/j.1464-410X.2003.04527.x PMID: 14632853
38. Moffitt PF, Kalucy EC, Kalucy RS, Baum FE, Cooke RD. Sleep difficulties, pain and other correlates. J
Intern Med. 1991; 230: 245–249. PMID: 1895046
39. Birkeland AJ. Plasma Melatonin Levels and Nocturnal Transitions between Sleep and Wakefulness.
Neuroendocrinology. 1982; 126–131. https://doi.org/10.1159/000123289 PMID: 7070585
40. Sack RL, Lewy AJ, Erb DL, Vollmer WM, Singer CM. Human Melatonin Production Decreases With
Age. J Pineal Res. 1986; 3: 379–388. https://doi.org/10.1111/j.1600-079X.1986.tb00760.x PMID:
3783419
41. Mander BA, Winer JR, Jagust WJ, Walker MP. Sleep: A Novel Mechanistic Pathway, Biomarker, and
Treatment Target in the Pathology of Alzheimer’s Disease? Trends Neurosci. Elsevier Ltd; 2016; 39:
552–566. https://doi.org/10.1016/j.tins.2016.05.002 PMID: 27325209
42. Minakawa EN, Miyazaki K, Maruo K, Yagihara H, Fujita H, Wada K, et al. Chronic sleep fragmentation
exacerbates amyloid β deposition in Alzheimer’s disease model mice. Neurosci Lett. Elsevier Ireland
Ltd; 2017; 653: 362–369. https://doi.org/10.1016/j.neulet.2017.05.054 PMID: 28554860
43. Latta F, Leproult R, Tasali E, Hofmann E, L’Hermite-Baleriaux M, Copinschi G, et al. Sex Differences
in Nocturnal Growth Hormone and Prolactin Secretion in Healthy Older Adults: Relationships With
Sleep EEG Variables. Sleep. 2005; 28: 1519. https://doi.org/10.1093/sleep/28.12.1519 PMID:
16408410
44. Baker FC, Willoughby AR, Sassoon SA, Colrain IM, de Zambotti M. Insomnia in women approaching
menopause: beyond perception. Psychoneuroendocrinology. Elsevier; 2015; 60: 96–104.
45. Young T, Rabago D, Zgierska A, Austin D, Finn L. Objective and subjective sleep quality in premeno-
pausal, perimenopausal, and postmenopausal women in the Wisconsin Sleep Cohort Study. Sleep.
Sleep Research Society; 2003; 26: 667–672.
46. Sattari N, McDevitt EA, Panas D, Niknazar M, Ahmadi M, Naji M, et al. The Effect of Sex and Men-
strual Phase on Memory Formation during Nap. Neurobiol Learn Mem.
47. Mong JA, Baker FC, Mahoney MM, Paul KN, Schwartz MD, Semba K, et al. Sleep, Rhythms, and the
Endocrine Brain: Influence of Sex and Gonadal Hormones. J Neurosci. 2011; 31: 16107–16116.
https://doi.org/10.1523/JNEUROSCI.4175-11.2011 PMID: 22072663
48. McClelland GH, Lynch JG, Irwin JR, Spiller SA, Fitzsimons GJ. Median splits, Type II errors, and
false-positive consumer psychology: Don’t fight the power. J Consum Psychol. Society for Consumer
Psychology; 2015; 25: 679–689. https://doi.org/10.1016/j.jcps.2015.05.006
49. Betts TA, Alford C. β-Blockers and sleep: a controlled trial. Eur J Clin Pharmacol. Springer; 1985; 28:
65–68.
Big data analysis of sleep architecture and the effects of individual differences
PLOS ONE | https://doi.org/10.1371/journal.pone.0194604 April 11, 2018 24 / 27

50. Resnick HE, Redline S, Shahar E, Gilpin A, Newman A, Walter R, et al. Diabetes and sleep distur-
bances: Findings from the Sleep Heart Health Study. Diabetes Care. 2003; 26: 702–709. https://doi.
org/10.2337/diacare.26.3.702 PMID: 12610025
51. Novelli L, Ferri R, Bruni O. Sleep classification according to AASM and Rechtschaffen and Kales:
Effects on sleep scoring parameters of children and adolescents. J Sleep Res. 2010; 19: 238–247.
https://doi.org/10.1111/j.1365-2869.2009.00785.x PMID: 19912509
52. Landolt HP, Dijk DJ, Achermann P, Borbely AA. Effect of age on the sleep EEG: Slow-wave activity
and spindle frequency activity in young and middle-aged men. Brain Res. 1996; 738: 205–212. https://
doi.org/10.1016/S0006-8993(96)00770-6 PMID: 8955514
53. Ko PRT, Kientz JA, Choe EK, Kay M, Landis CA, Watson NF. Consumer sleep technologies: A review
of the landscape. J Clin Sleep Med. 2015; 11: 1455–1461. https://doi.org/10.5664/jcsm.5288 PMID:
26156958
54. Mednick SC, Ehrman M. Take a Nap!: Change Your Life. Workman Publishing; 2006.
55. Suh M, Barksdale DJ, Logan JG. Morning blood pressure surge and nighttime blood pressure in rela-
tion to nocturnal sleep pattern and arterial stiffness. J Cardiovasc Nurs. 2014; 29: E10–E17. https://
doi.org/10.1097/JCN.0b013e318291ee43 PMID: 23612041
56. Heath AC, Kendler KS, Eaves LJ, Martin NG. Evidence for genetic influences on sleep disturbance
and sleep pattern in twins. Sleep. 1990; 13: 318–35. https://doi.org/10.1093/sleep/13.4.318 PMID:
2267475
57. Buckelmuller J, Landolt H-P, Stassen HH, Achermann P. Trait-like individual differences in the human
sleep electroencephalogram. Neuroscience. 2006; 138: 351–356. https://doi.org/10.1016/j.
neuroscience.2005.11.005 PMID: 16388912
58. Wei Y, Colombo MA, Ramautar JR, Blanken TF, van der Werf YD, Spiegelhalder K, et al. Sleep stage
transition dynamics reveal specific stage 2 vulnerability in insomnia. Sleep. 2017; 40: 5–8.
59. Whitehurst LN, Cellini N, McDevitt EA, Duggan KA, Mednick SC. Autonomic activity during sleep pre-
dicts memory consolidation in humans. Proc Natl Acad Sci U S A. 2016; https://doi.org/10.1073/pnas.
1518202113 PMID: 27298366
60. Wamsley EJ, Hamilton K, Graveline Y, Manceor S, Parr E. Test Expectation Enhances Memory Con-
solidation across Both Sleep and Wake. PLoS One. 2016; 11: e0165141. https://doi.org/10.1371/
journal.pone.0165141 PMID: 27760193
61. Seibold M, Rasch B, Born J, Diekelmann S. Reactivation of interference during sleep does not impair
ongoing memory consolidation. Memory. Taylor & Francis; 2017; 1–8.
62. Diekelmann S, Born J, Rasch B. Increasing explicit sequence knowledge by odor cueing during sleep
in men but not women. Front Behav Neurosci. Frontiers Media SA; 2016; 10.
63. Diekelmann S, Wilhelm I, Wagner U, Born J. Sleep improves prospective remembering by facilitating
spontaneous-associative retrieval processes. PLoS One. Public Library of Science; 2013; 8: e77621.
64. Diekelmann S, Wilhelm I, Wagner U, Born J. Sleep to implement an intention. Sleep. Oxford University
Press; 2013; 36: 149–153.
65. Diekelmann S, Biggel S, Rasch B, Born J. Offline consolidation of memory varies with time in slow
wave sleep and can be accelerated by cuing memory reactivations. Neurobiol Learn Mem. Elsevier;
2012; 98: 103–111.
66. Fischer S, Diekelmann S, Born J. Sleep’s role in the processing of unwanted memories. J Sleep Res.
Wiley Online Library; 2011; 20: 267–274.
67. Diekelmann S, Buchel C, Born J, Rasch B. Labile or stable: Opposing consequences for memory
when reactivated during waking and sleep. Neuroforum. Nature Publishing Group; 2011; 17: 74–76.
https://doi.org/10.1038/nn.2744 PMID: 21258327
68. Diekelmann S, Born J, Wagner U. Sleep enhances false memories depending on general memory per-
formance. Behav Brain Res. Elsevier; 2010; 208: 425–429.
69. Nettersheim A, Hallschmid M, Born J, Diekelmann S. The role of sleep in motor sequence consolida-
tion: stabilization rather than enhancement. J Neurosci. Soc Neuroscience; 2015; 35: 6696–6702.
70. Cellini N, de Zambotti M, Covassin N, Sarlo M, Stegagno L. Impaired off-line motor skills consolidation
in young primary insomniacs. Neurobiol Learn Mem. Elsevier Inc.; 2014; 114: 141–147. https://doi.
org/10.1016/j.nlm.2014.06.006 PMID: 24954844
71. Dean DA, Goldberger AL, Mueller R, Kim M, Rueschman M, Mobley D, et al. Scaling up scientific dis-
covery in sleep medicine: The National Sleep Research Resource. 2016;
72. Blank JB, Cawthon PM, Carrion-Petersen M, Harper L, Johnson JP, Mitson E, et al. Overview of
recruitment for the osteoporotic fractures in men study (MrOS). Contemp Clin Trials. Elsevier; 2005;
26: 557–568.
Big data analysis of sleep architecture and the effects of individual differences
PLOS ONE | https://doi.org/10.1371/journal.pone.0194604 April 11, 2018 25 / 27

73. Orwoll E, Blank JB, Barrett-Connor E, Cauley J, Cummings S, Ensrud K, et al. Design and baseline
characteristics of the osteoporotic fractures in men (MrOS) study—a large observational study of the
determinants of fracture in older men. Contemp Clin Trials. Elsevier; 2005; 26: 569–585.
74. Blackwell T, Yaffe K, Ancoli-Israel S, Redline S, Ensrud KE, Stefanick ML, et al. Associations Between
Sleep Architecture and Sleep-Disordered Breathing and Cognition in Older Community-Dwelling Men:
The Osteoporotic Fractures in Men Sleep Study. J Am Geriatr Soc. Wiley Online Library; 2011; 59:
2217–2225.
75. Quan S, Howard B, Iber C, Kiley J, Nieto F, O’Connor G, et al. The Sleep Heart Health Study: design,
rationale, and methods. Sleep. 1997; 20: 1077–1085. PMID: 9493915
76. Redline S, Sanders MH, Lind BK, Quan SF, Iber C, Gottlieb DJ, et al. Methods for obtaining and ana-
lyzing unattended polysomnography data for a multicenter study. Sleep. [New York]: Raven Press;
1998; 21: 759–768.
77. Hibbs AM, Storfer-Isser A, Rosen C, Ievers-Landis CE, Taveras EM, Redline S. Advanced sleep
phase in adolescents born preterm. Behav Sleep Med. Taylor & Francis; 2014; 12: 412–424.
78. Spilsbury JC, Storfer-Isser A, Drotar D, Rosen CL, Kirchner HL, Redline S. Effects of the home envi-
ronment on school-aged children’s sleep. Sleep. Oxford University Press; 2005; 28: 1419–1427.
79. Rosen CL, Larkin EK, Kirchner HL, Emancipator JL, Bivins SF, Surovec SA, et al. Prevalence and risk
factors for sleep-disordered breathing in 8-to 11-year-old children: association with race and prematu-
rity. J Pediatr. Elsevier; 2003; 142: 383–389.
80. Redline S, Tishler P V, Tosteson TD, Williamson J, Kump K, Browner I, et al. The familial aggregation
of obstructive sleep apnea. Am J Respir Crit Care Med. 1995; 151: 682–687. https://doi.org/10.1164/
ajrccm.151.3.7881656 PMID: 7881656
81. Redline S, Tishler P V, Schluchter M, Aylor J, Clark K, Graham G. Risk factors for sleep-disordered
breathing in children: Associations with obesity, race, and respiratory problems. Am J Respir Crit Care
Med. 1999; 159: 1527–1532. https://doi.org/10.1164/ajrccm.159.5.9809079 PMID: 10228121
82. Cummings SR, Black DM, Nevitt MC, Browner WS, Cauley JA, Genant HK, et al. Appendicular bone
density and age predict hip fracture in women. Jama. American Medical Association; 1990; 263: 665–
668.
83. Spira AP, Blackwell T, Stone KL, Redline S, Cauley JA, Ancoli-Israel S, et al. Sleep-Disordered
Breathing and Cognition in Older Women. J Am Geriatr Soc. Wiley Online Library; 2008; 56: 45–50.
84. Goldberger AL, Amaral LAN, Glass L, Hausdorff JM, Ivanov PC, Mark RG, et al. Physiobank, physio-
toolkit, and physionet. Circulation. Am Heart Assoc; 2000; 101: e215—e220.
85. Kemp B, Zwinderman AH, Tuk B, Kamphuisen HAC, Oberye JJL. Analysis of a sleep-dependent neu-
ronal feedback loop: the slow-wave microcontinuity of the EEG. IEEE Trans Biomed Eng. IEEE; 2000;
47: 1185–1194.
86. Terzano MG, Parrino L, Smerieri A, Chervin R, Chokroverty S, Guilleminault C, et al. Atlas, rules, and
recording techniques for the scoring of cyclic alternating pattern (CAP) in human sleep. Sleep Med.
Elsevier; 2002; 3: 187–199.
87. O’Reilly C, Gosselin N, Carrier J, Nielsen T. Montreal archive of sleep studies: An open-access
resource for instrument benchmarking and exploratory research. J Sleep Res. 2014; 23: 628–635.
https://doi.org/10.1111/jsr.12169 PMID: 24909981
88. Iber C, Ancoli-Israel S, Chesson A, Quan SF, others. The AASM manual for the scoring of sleep and
associated events: rules, terminology and technical specifications. American Academy of Sleep Medi-
cine Westchester, IL; 2007.
89. Hoffman MD, Gelman A. The No-U-turn sampler: adaptively setting path lengths in Hamiltonian Monte
Carlo. J Mach Learn Res. 2014; 15: 1593–1623.
90. Salvatier J, Wiecki T V, Fonnesbeck C. Probabilistic programming in Python using PyMC3. PeerJ
Comput Sci. PeerJ Inc.; 2016; 2: e55.
91. Gelman A, Rubin DB. Inference from Iterative Simulation Using Multiple Sequences. Stat Sci. 1992; 7:
457–472. https://doi.org/10.1214/ss/1177011136
92. Watanabe S. Asymptotic equivalence of Bayes cross validation and widely applicable information cri-
terion in singular learning theory. J Mach Learn Res. 2010; 11: 3571–3594.
93. Akaike H. Information theory and an extension of the maximum likelihood principle. Selected Papers
of Hirotugu Akaike. Springer; 1998. pp. 199–213.
94. Wagenmakers E, Farrell S. AIC model selection using Akaike weights. Psychon Bull Rev. 2004; 11:
192–196. https://doi.org/10.3758/BF03206482 PMID: 15117008
95. Pearl J. Probabilistic reasoning in intelligent systems: networks of plausible inference. Morgan Kauf-
mann; 1988.
Big data analysis of sleep architecture and the effects of individual differences
PLOS ONE | https://doi.org/10.1371/journal.pone.0194604 April 11, 2018 26 / 27

96. Cooper GF, Herskovits E. A Bayesian method for the induction of probabilistic networks from data.
Mach Learn. Springer; 1992; 9: 309–347.
97. Serra J. Image analysis and mathematical morphology, v. 1. Academic press; 1982.
98. Schwarz G. Estimating the dimension of a model. Ann Stat. Institute of Mathematical Statistics; 1978;
6: 461–464.
99. Murphy K. The bayes net toolbox for matlab. Comput Sci Stat. 2001; 33: 1024–1034.
100. The MathWorks Inc. MATLAB. Natick, Massachusetts, United States; 2015. p. Inc.
Big data analysis of sleep architecture and the effects of individual differences
PLOS ONE | https://doi.org/10.1371/journal.pone.0194604 April 11, 2018 27 / 27