Embed Size (px)
Citation preview

University of Kentucky University of Kentucky
UKnowledge UKnowledge
Theses and Dissertations--Mechanical Engineering Mechanical Engineering
2019
QUANTIFICATION OF PAPILLARY MUSCLE MOTION AND MITRAL QUANTIFICATION OF PAPILLARY MUSCLE MOTION AND MITRAL
REGURGITATION AFTER MYOCARDIAL INFARCTION REGURGITATION AFTER MYOCARDIAL INFARCTION
Connor R. Ferguson University of Kentucky, [email protected] Author ORCID Identifier:
https://orcid.org/0000-0003-2489-2237 Digital Object Identifier: https://doi.org/10.13023/etd.2019.215
Right click to open a feedback form in a new tab to let us know how this document benefits you. Right click to open a feedback form in a new tab to let us know how this document benefits you.
Recommended Citation Recommended Citation Ferguson, Connor R., "QUANTIFICATION OF PAPILLARY MUSCLE MOTION AND MITRAL REGURGITATION AFTER MYOCARDIAL INFARCTION" (2019). Theses and Dissertations--Mechanical Engineering. 136. https://uknowledge.uky.edu/me_etds/136
This Master's Thesis is brought to you for free and open access by the Mechanical Engineering at UKnowledge. It has been accepted for inclusion in Theses and Dissertations--Mechanical Engineering by an authorized administrator of UKnowledge. For more information, please contact [email protected].

STUDENT AGREEMENT: STUDENT AGREEMENT:
I represent that my thesis or dissertation and abstract are my original work. Proper attribution
has been given to all outside sources. I understand that I am solely responsible for obtaining
any needed copyright permissions. I have obtained needed written permission statement(s)
from the owner(s) of each third-party copyrighted matter to be included in my work, allowing
electronic distribution (if such use is not permitted by the fair use doctrine) which will be
submitted to UKnowledge as Additional File.
I hereby grant to The University of Kentucky and its agents the irrevocable, non-exclusive, and
royalty-free license to archive and make accessible my work in whole or in part in all forms of
media, now or hereafter known. I agree that the document mentioned above may be made
available immediately for worldwide access unless an embargo applies.
I retain all other ownership rights to the copyright of my work. I also retain the right to use in
future works (such as articles or books) all or part of my work. I understand that I am free to
register the copyright to my work.
REVIEW, APPROVAL AND ACCEPTANCE REVIEW, APPROVAL AND ACCEPTANCE
The document mentioned above has been reviewed and accepted by the student’s advisor, on
behalf of the advisory committee, and by the Director of Graduate Studies (DGS), on behalf of
the program; we verify that this is the final, approved version of the student’s thesis including all
changes required by the advisory committee. The undersigned agree to abide by the statements
above.
Connor R. Ferguson, Student
Dr. Jonathan F. Wenk, Major Professor
Dr. Alexandre Martin, Director of Graduate Studies

QUANTIFICATION OF PAPILLARY MUSCLE MOTION AND MITRAL
REGURGITATION AFTER MYOCARDIAL INFARCTION
________________________________________
THESIS
________________________________________
A thesis submitted in partial fulfillment of the
requirements for the degree of Master of Science in Mechanical Engineering in the
College of Engineering
at the University of Kentucky
By
Connor Randolph Ferguson
Lexington, Kentucky
Director: Dr. Jonathan F Wenk, Professor of Mechanical Engineering
Lexington, Kentucky
2019
Copyright © Connor Randolph Ferguson 2019
https://orcid.org/0000-0003-2489-2237
ABSTRACT OF THESIS
QUANTIFICATION OF PAPILLARY MUSCLE MOTION AND MITRAL
REGURGITATION AFTER MYOCARDIAL INFARCTION
Change in papillary muscle motion as a result of left ventricular (LV) remodeling
after posterolateral myocardial infarction is thought to contribute to ischemic mitral
regurgitation. A finite element (FE) model of the LV was created from magnetic resonance
images acquired immediately before myocardial infarction and 8 weeks later in a cohort of
12 sheep. Severity of mitral regurgitation was rated by two-dimensional echocardiography
and regurgitant volume was estimated using MRI. Of the cohort, 6 animals (DC) received
hydrogel injection therapy shown to limit ventricular remodeling after myocardial
infarction while the control group (MI) received a similar pattern of saline injections. LV
pressure was determined by direct invasive measurement and volume was estimated from
MRI. FE models of the LV for each animal included both healthy and infarct tissue regions
as well as a simulated hydrogel injection pattern for the DC group. Constitutive model
material parameters for each region in the FE model were assigned based on results from
previous research. Invasive LV pressure measurements at end diastole and end systole were
used as boundary conditions to drive model simulations for each animal. Passive stiffness
(C) and active material parameter (Tmax) were adjusted to match MRI estimations of LV
volume at end systole and end diastole. Nodal positions of the chordae tendineae (CT) were
determined by measurements obtained from the excised heart of each animal at the terminal
timepoint. Changes in CT nodal displacements between end systole and end diastole at 0
and 8-week timepoints were used to investigate the potential contribution of changes in
papillary muscle motion to the progression of ischemic mitral regurgitation after
myocardial infarction. Nodal displacements were broken down into radial, circumferential,
and longitudinal components relative to the anatomy of the individual animal model. Model
results highlighted an outward radial movement in the infarct region after 8 weeks in
untreated animals, while radial direction of motion observed in the treated animal group
was preserved relative to baseline. Circumferential displacement decreased in the remote
region in the untreated animal group after 8 weeks but was preserved relative to baseline
in the treated animal group. MRI estimates of regurgitant volume increased significantly

in the untreated animal group after 8 weeks but did not increase in the treated group. The
results of this analysis suggest that hydrogel injection treatment may serve to limit changes
in papillary muscle motion and severity of mitral regurgitation after posterolateral
myocardial infarction.
KEYWORDS: Magnetic Resonance Imaging, Finite Element Modeling, Displacement,
Volume Analysis, Mitral Regurgitation
Connor Randolph Ferguson
(Name of Student)
04/18/2019
Date

QUANTIFICATION OF PAPILLARY MUSCLE MOTION AND MITRAL
REGURGITATION AFTER MYOCARDIAL INFARCTION
By
Connor Randolph Ferguson
Jonathan F Wenk
Director of Thesis
Alexandre Martin
Director of Graduate Studies
04/18/2019
Date

DEDICATION
To Abigail, Finley, Tom, Judy, Colin, and Fio.

iii
ACKNOWLEDGMENTS
The work presented here would not have been possible without the guidance of
Dr. Jonathan Wenk. Dr. Wenk’s knowledge and mastery of the fundamental engineering
principles presented in this thesis are truly inspirational. Perhaps the best testament to this
capacity lies in Dr. Wenk’s eagerness and ability to communicate the complex principles
of continuum mechanics and the finite element method in such an effective, easy to
understand, and approachable manner. I thank Dr. Wenk for his patience, time, effort,
many meetings, and in-depth discussions of mechanics and physiology. I thank Dr.
Kenneth Campbell for his support, insight, and discussions of physiology and statistics
throughout the course of this project, as well as his input on this thesis as part of the thesis
committee. Finally, I would like to thank Dr. Hailong Chen for his time and input as part
of the thesis committee.
I would like to thank the members of the computational biomechanics lab for their
help and support throughout this journey. Thank you to Kurtis Mann for sharing most of
this journey with me, and for being there to help each other refine our research. Thank
you to Zhanqiu Liu for your help in so many ways, and your dedication to effectively and
thoroughly teaching the methods of your research to your lab mates. Thank you to Amir,
Hossein, and Dara for making the shared lab space a welcoming and enjoyable place to
work.
iv
TABLE OF CONTENTS
ACKNOWLEDGMENTS ........................................................................................................................... iii
LIST OF TABLES ........................................................................................................................................ v
LIST OF FIGURES .....................................................................................................................................vi
CHAPTER 1. INTRODUCTION ................................................................................................................. 1
1.1 Myocardial Infarction ....................................................................................................................... 1
1.2 Mitral Regurgitation ......................................................................................................................... 2
1.3 Hydrogels .......................................................................................................................................... 5
1.4 Finite Element Modeling ................................................................................................................... 6
CHAPTER 2. ANALYSIS ............................................................................................................................. 8
2.1 Data Overview .................................................................................................................................. 8
2.2 Finite Element Model ...................................................................................................................... 11
2.3 Papillary Muscle Motion ................................................................................................................ 20
2.4 Mitral Regurgitation ....................................................................................................................... 26
CHAPTER 3. RESULTS ............................................................................................................................. 29
3.1 Papillary Muscle Motion ................................................................................................................ 29
3.2 Mitral Regurgitation ....................................................................................................................... 30
CHAPTER 4. DISCUSSION ....................................................................................................................... 34
CHAPTER 5. CONCLUSION .................................................................................................................... 38
REFERENCES ............................................................................................................................................ 40
VITA ............................................................................................................................................................. 44

v
LIST OF TABLES
Table 2.1 Comparison of constitutive model parameters between the MI and DC group in
the remote and infarct regions at 8-weeks post-MI. Data are presented as mean ±
standard deviation where applicable. ................................................................................ 20
Table 3.1 Average left ventricle papillary muscle displacement in the remote tissue
region. Data are presented as mm ± standard deviation. ................................................. 29
Table 3.2 Average left ventricle papillary muscle displacement in the infarct tissue
region. Data are presented as mm ± standard deviation. .................................................. 30
Table 3.3 Comparison between MRI estimates of regurgitant volume, regurgitant
fraction, and rating by two-dimensional echocardiography. Data are presented as mean ±
standard deviation. ............................................................................................................ 31
Table 3.4 Comparison of regurgitant volume and regurgitant fraction between treatment
groups. Data are presented as mean ± standard deviation. .............................................. 32
Table 3.5 Comparison of average mid-LV diameter at end diastole and end systole
between groups and timepoints. Data are presented as mean ± standard deviation. ....... 33
vi
LIST OF FIGURES
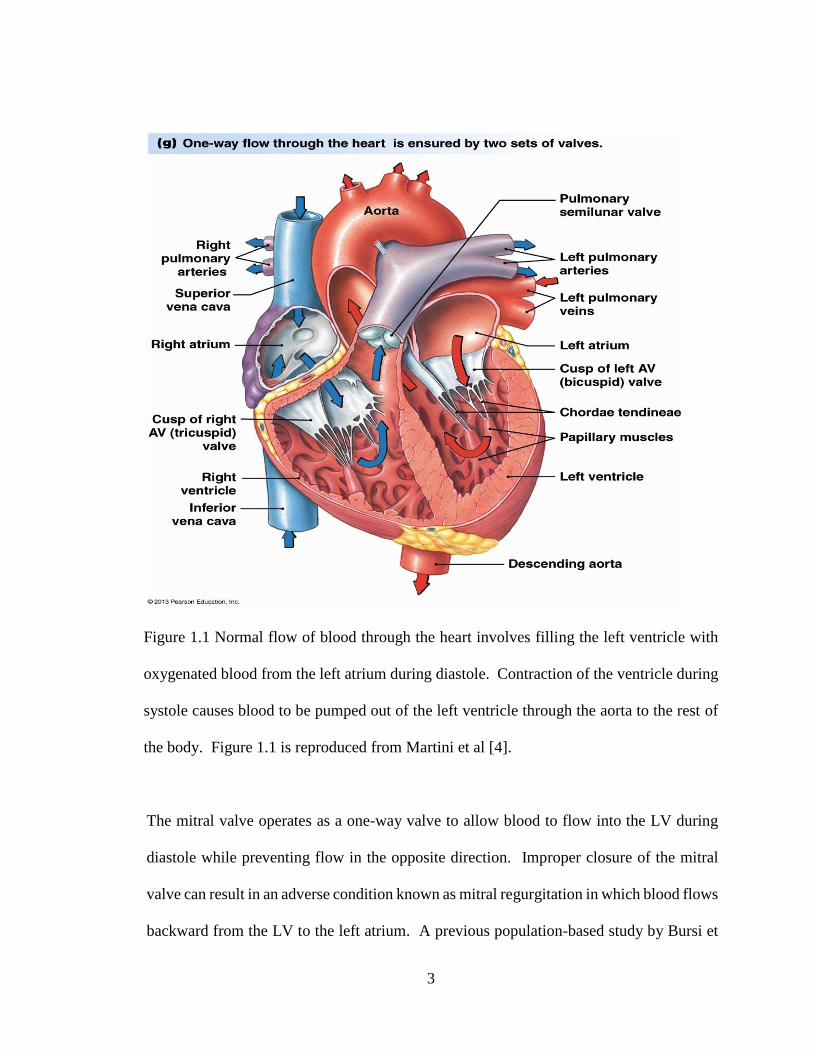
Figure 1.1 Normal flow of blood through the heart involves filling the left ventricle with
oxygenated blood from the left atrium during diastole. Contraction of the ventricle
during systole causes blood to be pumped out of the left ventricle through the aorta to the
rest of the body. Figure 1.1 is reproduced from Martini et al [4]. ..................................... 3
Figure 2.1 Unwrapped left ventricular site map showing ligated obtuse marginal branches
(OM2), ligation site (orange X), infarct outline markers (green O), and injection sites (red
X). ....................................................................................................................................... 9
Figure 2.2 Hydrogel injections can be seen in this cross section of infarcted myocardium
in a DC treatment group excised heart at the 8 week terminal timepoint. ........................ 10
Figure 2.3 LV endocardial contours on one short axis slice (a) immediately before infarct
and (b) 8 weeks later in the same untreated animal. ......................................................... 11
Figure 2.4 Left ventricular endocardial contours assembled in 3D space in MATLAB. . 12
Figure 2.5 Left ventricular endocardial and epicardial IGES surfaces generated from
stack contours and rendered in Creo Parametric 4.0 (PTC, Inc., Boston, MA). ............... 13
Figure 2.6 Full LV FE model (a) and FE model short axis slice (b) immediately before
infarct (1) and 8 weeks later (2) in the same untreated animal. Red elements represent
healthy myocardium while blue elements represent the infarcted myocardium region. .. 14
Figure 2.7 MRI reconstruction of hydrogel injection pattern after initial injection in one
representative animal. This figure is reproduced from Wang et al [33]. ......................... 15

vii
Figure 2.8 Representative DC group animal left ventricle model at 8 weeks showing
healthy myocardium (red), infarct tissue region (blue) and injected hydrogel material in
the mid wall region (green). .............................................................................................. 16
Figure 2.9 Experimentally measured length dependent active tension at different
concentrations of external calcium (a) and time and length dependent active force
generation (b) in cardiac myocytes compared to model estimations (dashed) [13, 14]. .. 19
Figure 2.10 Unwrapped left ventricle from an excised heart highlighting the infarct tissue
region (blue), papillary muscles (green), and chordae tendineae attachment site (red). .. 21
Figure 2.11 Three-dimensional node location (blue), CT node displacement vectors
(orange) from end diastole to end systole, and LV long axis (green) calculated in
MATLAB for the same animal at 0 week (a) and 8 week (b) timepoints. Global z axis is
shown for both end diastolic and end systolic figures but does not apply to the relative
motion figure. .................................................................................................................... 22
Figure 2.12 End diastolic LV endocardial nodes (dark blue) for one model highlighting
CT attachment node locations (light blue), calculated long axis of the ventricle (green),
CT attachment node motion vectors (orange) and local coordinate system for one of the
CT attachment nodes (red). ............................................................................................... 24
Figure 2.13 Closeup view of a small portion of the LV endocardial node cloud (dark
blue) highlighting papillary CT attachment nodes (light blue), motion vectors (orange),
and local coordinate system for one CT attachment node (red). ...................................... 25
Figure 2.14 Two-dimensional echo apical view of a sheep heart after myocardial
infarction showing (a) the left ventricle (LV), left atrium (LA), and aorta LV outflow
tract (Ao); (b) color Doppler overlay of the same view showing an MR rating of 1+. .... 26

viii
Figure 2.15 Two-dimensional echo apical view of a sheep heart after myocardial
infarction showing (a) the left ventricle (LV), left atrium (LA), and aorta LV outflow
tract (Ao); (b) color Dopper overlay of the same view showing an MR rating of 3+. ..... 27

1
CHAPTER 1. INTRODUCTION
1.1 Myocardial Infarction
The term myocardial infarction (MI) is generally used to denote the cell death of
cardiac myocytes as a result of ischemia, the restriction in blood supply to tissue that leads
to a shortage of oxygen needed for cellular metabolism. Non-ischemic cardiomyopathy
or other inflammatory diseases can also lead to loss of functional myocardium. According
to Thygesen et al., approximately one-third of the world population will die as a result of
cardiovascular disease, and the largest portion of these deaths will occur in cases involving
some form of myocardial infarction [31]. The pathophysiology of left ventricular (LV)
remodeling after MI is well documented and is primarily characterized by structural and
functional changes.
Degradation or absolute elimination of contractile function in infarcted tissue
regions due to myocyte death can cause abnormal loading and stress conditions within the
myocardium. These conditions can lead to decreased cardiac output and initiate
biomechanical and biochemical compensatory reparative mechanisms which can result in
dilation, hypertrophy, and scarring. Early remodeling, which may occur within hours to
days of an adverse event, is generally localized to thinning and expansion of the infarcted
tissue region due to degradation of myocyte collagen integrity, while late remodeling is
characterized by global LV dilation, distortion, and deterioration of contractile function
which can continue over weeks and months following MI. Inability to adequately
compensate for increases in myocardium wall stress can eventually lead to a cascade of
progressive dilation and cell death as cells in the border zone myocardium surrounding the
infarcted tissue region are incorporated into the infarct [30].

2
Due to the prevalence of myocardial infarction in cardiovascular disease, treatment
for regulating LV remodeling after MI has been investigated in depth. Traditional
treatment methods to prevent LV remodeling have focused on infarct reperfusion and
pharmacological intervention; however, mechanical surgical countermeasures that focus
on physical reinforcement of the infarcted tissue region via suture rows, ventricle wraps,
balloon inflation, and structural patches have been shown to be effective in limiting LV
remodeling [21]. Expansion of stem cell research has shown that the application of stem
cell differentiation can be used as an effective treatment to regenerate infarcted
myocardium. A 2001 animal study by Orlic et al. reported a 68% occupation of newly
formed myocardium within the infarcted portion of the ventricle 9 days after
transplantation of bone marrows cells in mice [26]. More recent research has focused on
the implementation of injectable hydrogels both for their efficacy as a vehicle for
introduction of regenerative stem cells into the myocardium and for structural
reinforcement due to highly tunable mechanical properties.
1.2 Mitral Regurgitation
Myocardial infarction (MI) is known to cause left ventricular (LV) remodeling
associated with dilatation and distortion of the ventricular shape leading to deterioration
in contractile function [30]. The normal path of blood through the left side of the heart as
shown in Figure 1.1 involves filling of the LV with oxygenated blood from the left atrium
during diastole which is then ejected through the aorta to the rest of the body when the
heart contracts during systole.
3
Figure 1.1 Normal flow of blood through the heart involves filling the left ventricle with
oxygenated blood from the left atrium during diastole. Contraction of the ventricle during
systole causes blood to be pumped out of the left ventricle through the aorta to the rest of
the body. Figure 1.1 is reproduced from Martini et al [4].
The mitral valve operates as a one-way valve to allow blood to flow into the LV during
diastole while preventing flow in the opposite direction. Improper closure of the mitral
valve can result in an adverse condition known as mitral regurgitation in which blood flows
backward from the LV to the left atrium. A previous population-based study by Bursi et
4
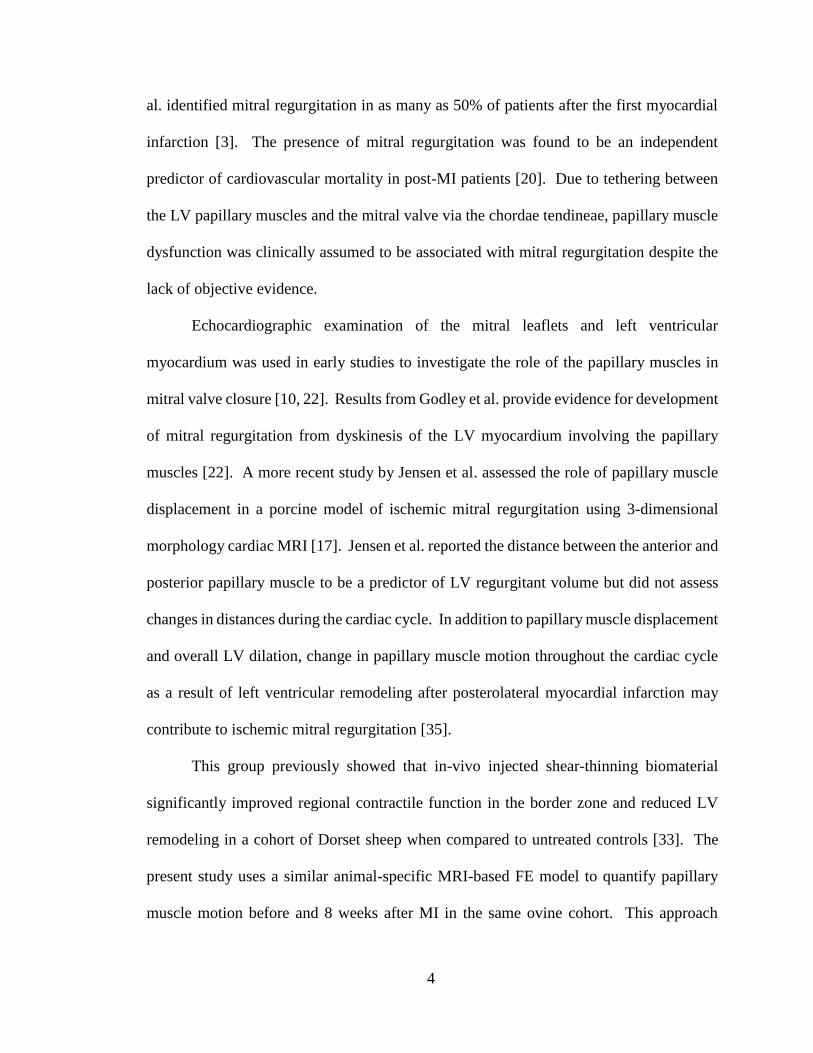
al. identified mitral regurgitation in as many as 50% of patients after the first myocardial
infarction [3]. The presence of mitral regurgitation was found to be an independent
predictor of cardiovascular mortality in post-MI patients [20]. Due to tethering between
the LV papillary muscles and the mitral valve via the chordae tendineae, papillary muscle
dysfunction was clinically assumed to be associated with mitral regurgitation despite the
lack of objective evidence.
Echocardiographic examination of the mitral leaflets and left ventricular
myocardium was used in early studies to investigate the role of the papillary muscles in
mitral valve closure [10, 22]. Results from Godley et al. provide evidence for development
of mitral regurgitation from dyskinesis of the LV myocardium involving the papillary
muscles [22]. A more recent study by Jensen et al. assessed the role of papillary muscle
displacement in a porcine model of ischemic mitral regurgitation using 3-dimensional
morphology cardiac MRI [17]. Jensen et al. reported the distance between the anterior and
posterior papillary muscle to be a predictor of LV regurgitant volume but did not assess
changes in distances during the cardiac cycle. In addition to papillary muscle displacement
and overall LV dilation, change in papillary muscle motion throughout the cardiac cycle
as a result of left ventricular remodeling after posterolateral myocardial infarction may
contribute to ischemic mitral regurgitation [35].
This group previously showed that in-vivo injected shear-thinning biomaterial
significantly improved regional contractile function in the border zone and reduced LV
remodeling in a cohort of Dorset sheep when compared to untreated controls [33]. The
present study uses a similar animal-specific MRI-based FE model to quantify papillary
muscle motion before and 8 weeks after MI in the same ovine cohort. This approach

5
allows us to investigate the potential contribution of changes in papillary muscle motion
to the progression of ischemic mitral regurgitation after myocardial infarction.
1.3 Hydrogels
Synthetic hydrogels have been developed and implemented in a wide range of
applications since their creation in the 1950s by Wichterle et al [1]. A hydrogel consists
of a network of polymer chains with functional crosslinking synthesized from hydrophilic
monomers. Due to the nature of their composition, a hydrogel can swell to accommodate
large quantities of water which allows for flexibility similar to natural biological tissue.
Furthermore, biocompatible hydrogels have been developed using naturally occurring
extracellular matrix components such as hyaluronic acid. The mechanism of cross linking
as well as the type of polymer chain being crosslinked affects the properties of the hydrogel
and allows for the introduction of a diverse range of desirable attributes depending on the
application. As briefly discussed in a previous section of this document, recent research
has investigated several applications of hydrogels in the medical field such as absorbable
sutures, tissue engineering and regeneration, and drug delivery [1, 9]. This thesis will focus
on the use of an injectable biological hydrogel treatment shown to enhance the mechanical
properties of an infarcted tissue region and limit left ventricular remodeling following
myocardial infarction.

6
1.4 Finite Element Modeling
Modelling cardiac mechanical properties in vivo has been a challenging problem
for researchers. While traditional in vitro material property testing methods can provide
useful information about the behavior of cardiac tissue, functional forms and parameters
of the governing constitutive equations used in modeling must describe material properties
for both resting and active, as well as normal and diseased myocardium, in vivo. One of
the most challenging aspects of cardiac tissue modeling is that the constitutive properties
of myocardium are three dimensional, anisotropic, nonlinear, and time dependent [5],
properties that were shown previously via in vitro biaxial tests conducted by Yin and
Demer in 1983 [38].
In order to account for the myofiber structure of the myocardium, Guccione et al.
developed a transversely isotropic exponential strain function which includes a system of
fiber oriented strain components [15]. More recent work by Wenk et al. has expanded on
the Guccione methods to incorporate and investigate regional contractility and stress
differences within a left ventricular finite element model [36, 37]. The capability to
incorporate regional inhomogeneity of material properties into the cardiac model has
enabled the investigation of contractility and stress within the myocardium of a ventricle
that has been compromised by myocardial infarction. Wenk et al. used these methods to
develop a ventricle model with healthy, infarct, and border zone tissue regions in order to
objectively quantify and characterize stress distributions within the border zone region that
potentially drive the recruitment of border zone myocytes into the infarcted tissue region
discussed in an earlier section [37]. In 2009, Wenk et al. published their methods of
simulation and optimization of polymeric injection patterns within a diseased ventricle to

7
reduce adverse myocardium wall stress and limit ventricular remodeling. Furthermore,
Wenk et al. provided insights into the development of ischemic mitral regurgitation using
the first finite element model of the full left ventricle with mitral valve [35].
More recently, Wang et al. used the Guccione methods previously described to
investigate transmural differences in left ventricular contractility [34]. The same group, in
conjunction with the Gorman Cardiovascular Group at the University of Pennsylvania,
developed and implemented animal specific finite element models of the left ventricle with
healthy and infarcted tissue regions as well as a novel hydrogel injection treatment shown
to limit LV remodeling in order to estimate regional myocardial stress and contractility in
a cohort of sheep [33, 27]. The work discussed in this thesis uses these methods to assess
changes in papillary muscle motion and mitral regurgitation following myocardial
infarction in the same cohort of animals. Data collection and analysis methods are
discussed in greater detail in chapter two of this thesis. Results of the analysis and
discussion of the work presented in this thesis are reported in chapters three and four
respectively. Finally, chapter five provides a conclusion of this work as well as prospects
for future study and application.

8
CHAPTER 2. ANALYSIS
2.1 Data Overview
The data presented in this study were previously collected as part of a study by Rodell
et al. [27] in compliance with the University of Pennsylvania’s Institutional Animal Care
and Use Committee and in agreement with the National Institute of Health’s guidelines for
the care and use of laboratory animals (NIH Publication 85-23, revised 1996). In summary,
a cohort of Dorset sheep underwent a left thoracotomy and subsequent posterolateral
infarction produced by suture ligation of obtuse marginal branches to result in an infarct
area of approximately 20% of the LV and involving the posterior papillary. Infarct area
coverage of the papillary muscle was unsatisfactory in one animal from each of the
untreated and treated groups, and those data are excluded from this analysis. Thirty
minutes post ligation, 16 injections (0.3 mL each via ½ mL syringe, with 27G ½” needle)
consisting of saline (MI control) or hydrogel (DC treatment) were administered via direct
injections to the infarct region during thoracotomy. As a proof of concept, the Gorman
group demonstrated successful administration of hydrogel through percutaneous
intramyocardial injection to the inferior and anterior walls of the LV via the right carotid
as well as to the RV septal wall via the internal jugular.
The shear-thinning, self-healing hydrogel treatment investigated in this study is a
modified hyaluronic acid polymer entirely designed and implemented by Rodell et al. The
hydrogel used in this study includes a secondary crosslinking of polymer chains, also
referred to as dual-crosslinking (DC) to enhance mechanical properties and prolong
degradation. A representative ligation site, infarct area, and injection location map for one
animal in the treated DC group are shown in Figure 2.1.
9
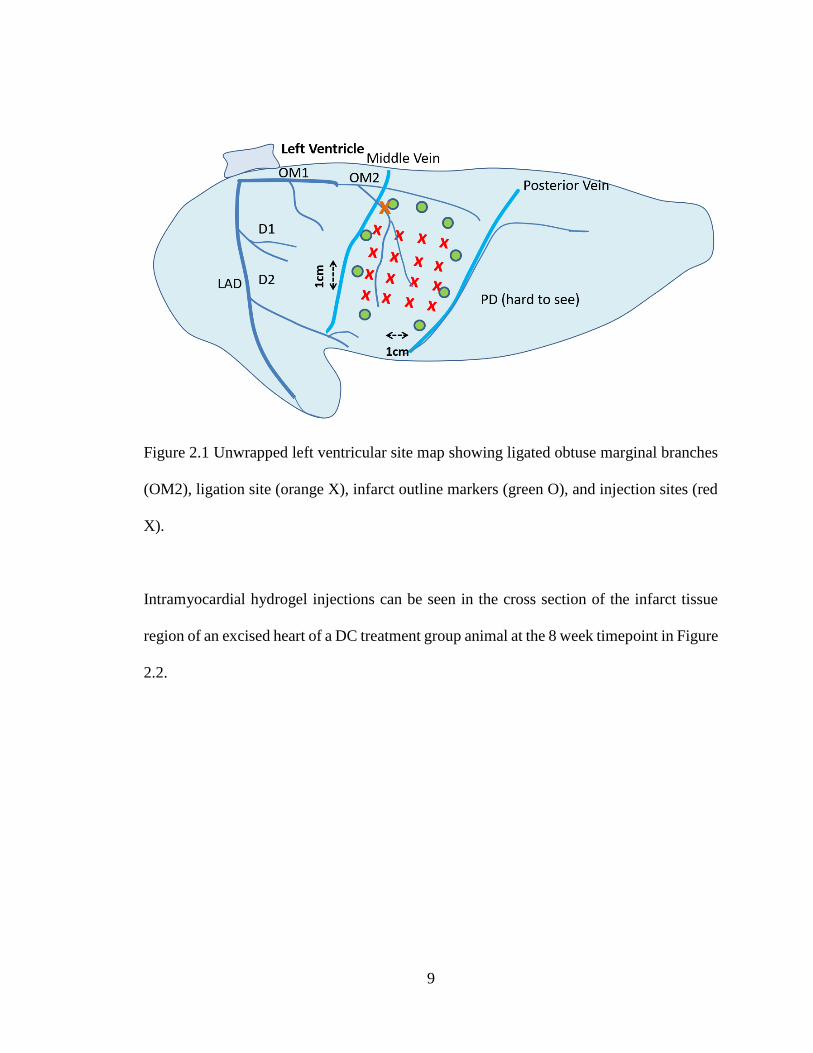
Figure 2.1 Unwrapped left ventricular site map showing ligated obtuse marginal branches
(OM2), ligation site (orange X), infarct outline markers (green O), and injection sites (red
X).
Intramyocardial hydrogel injections can be seen in the cross section of the infarct tissue
region of an excised heart of a DC treatment group animal at the 8 week timepoint in Figure
2.2.

10
Figure 2.2 Hydrogel injections can be seen in this cross section of infarcted myocardium
in a DC treatment group excised heart at the 8 week terminal timepoint.
MRI acquisition was performed at 3T (Tim Magnetom Trio Scanner; Siemens, Inc.)
immediately before infarct as well as 8 weeks post infarct. Cardiac gating was performed
by placement of a pressure catheter (Millar Instruments, Inc.) into the LV. 2D cine MRI
scans were conducted with the following parameters: field of view = 280x166.25mm,
acquisition matrix = 256x152 pixels, repetition time = 27.52 ms, echo time = 1.46 ms, BW
= 930 Hz/pixel, slice thickness = 4mm. Infarct location and geometry was confirmed using
additional late gadolinium enhancement imaging. Severity of mitral regurgitation was

11
rated (scale 0-3) by two-dimensional echocardiography. At 8 weeks post-MI, the animals
were euthanized and the hearts were excised.
2.2 Finite Element Model
Left ventricular geometry in each animal at both timepoints was obtained from 2D
cine image contours using ImageJ. Of importance to note is that contours included both
papillary muscles as shown in Figure 2.3, which is different than certain types of image
analysis.
Figure 2.3 LV endocardial contours on one short axis slice (a) immediately before infarct
and (b) 8 weeks later in the same untreated animal.
A custom MATLAB (MathWorks, Inc., Natick, MA) script was developed to process the
contours from Image J by importing and converting contour point locations for each slice
from voxel dimensions to millimeters. Left ventricular contours can be assembled into a

12
vertical stack to represent the ventricle in three-dimensional space as shown in Figure
2.4.
Figure 2.4 Left ventricular endocardial contours assembled in 3D space in MATLAB.

13
Surfaces were generated from endocardial and epicardial contours as shown in Figure 2.5.
This was accomplished by fitting the contour points with geometric surfaces using the
software Rapidform (INUS Technology, Inc, Sunnyvale, CA).
Figure 2.5 Left ventricular endocardial and epicardial IGES surfaces generated from stack
contours and rendered in Creo Parametric 4.0 (PTC, Inc., Boston, MA).
The IGES surfaces generated from the endocardial and epicardial contour slices were then
used to create individual finite element (FE) models for each animal at the 0 week and 8
week timepoint using trilinear 8-node hexahedral brick elements (TrueGrid, XYZ

14
Scientific, Inc.). The LV wall was divided evenly into three transmural layers from
endocardium to epicardium as shown in Figure 2.6.
Figure 2.6 Full LV FE model (a) and FE model short axis slice (b) immediately before
infarct (1) and 8 weeks later (2) in the same untreated animal. Red elements represent
healthy myocardium while blue elements represent the infarcted myocardium region.
FE models for each animal at the 8 week timepoint included both healthy and infarcted
tissue regions as well as a simulated hydrogel injection pattern for the treated DC group

15
based on previous MRI data [10]. MRI reconstruction of the hydrogel injection pattern
observed in a representative animal after initial injection is shown in Figure 2.7.
Figure 2.7 MRI reconstruction of hydrogel injection pattern after initial injection in one
representative animal. This figure is reproduced from Wang et al [33].
A simulated hydrogel injection pattern was built into the mid wall of the myocardium
within the infarct region of the treated group animal models using the patterns observed in
the MRI reconstruction presented in Figure 2.7. A representative model with hydrogel
injection pattern is shown in Figure 2.8.

16
Figure 2.8 Representative DC group animal left ventricle model at 8 weeks showing
healthy myocardium (red), infarct tissue region (blue) and injected hydrogel material in the
mid wall region (green).

17
Cardiac myofiber distribution within each element was assigned in both infarct and remote
tissue regions based on the results from a previous study [6]. A myofiber distribution of -
37º at epicardium to +83º at endocardium, with respect to the circumferential direction,
was used for the remote tissue region in both groups at all timepoints. At 8 weeks post-
MI, the infarct tissue region in the untreated MI group was assigned a myofiber distribution
of -18º at epicardium to +27º at endocardium, while the treated DC group was assigned a
myofiber distribution of -2º at epicardium to +26º at endocardium.
Each FE model simulation consisted of both a passive diastolic filling phase and an
active systolic contraction phase (LS-DYNA, Livermore Software Technology
Corporation). The methods used in this study to create the finite element models and the
equations used to drive the model simulations were obtained from previous research [33,
37, 27]. The passive myocardium response was represented using a nearly incompressible,
transversely isotropic, hyperelastic material defined by the following strain energy
function [13, 14]:
𝑊𝑚𝑦𝑜𝑐𝑎𝑟𝑑𝑖𝑢𝑚 =𝐶
2× (𝑒𝑏𝑓𝐸𝑓𝑓
2 +𝑏𝑡(𝐸𝑠𝑠2 +𝐸𝑛𝑛
2 +𝐸𝑛𝑠2 +𝐸𝑠𝑛
2 )+𝑏𝑓𝑠(𝐸𝑓𝑠2 +𝐸𝑠𝑓
2 +𝐸𝑓𝑛2 +𝐸𝑛𝑓
2 ) − 1) +𝑘
2(𝐽 − 1)2
(Eq. 2.1)
where Eij are the deviatoric components of the Green-Lagrange strain tensor relative to the
myofiber coordinate system (f = fiber direction, s = cross-fiber in-plane direction, n =
transverse-fiber direction) and J is the determinant of the deformation gradient. The
passive material parameter C scales stress in all directions, while bf scales the fiber
direction stiffness, bt scales the cross-fiber direction stiffness, and bfs scales the transverse-

18
fiber direction stiffness. The response of the hydrogel injections in the DC group was
represented using a nearly incompressible, isotropic, hyperelastic material law defined by
the following strain energy function [33]:
𝑊𝑖𝑛𝑗𝑒𝑐𝑡𝑖𝑜𝑛 =𝐸
2(1+𝑣)tr(𝐄2) +
𝐸
6(1−2𝑣)ln(𝐽)2 (Eq. 2.2)
where E is the deviatoric Green-Lagrange strain tensor and the material parameters for
Young’s modulus (E) of the hydrogel were assigned based on experimental results [27].
Poisson’s ratio (υ) was assigned a value of 0.499 to represent near incompressibility.
Systolic stress in the myocardium, calculated as the sum of the passive stress
derived from the strain energy function given in Equation 2.1 and the active stress
generated along the fiber direction, is given in Equation 2.3.
𝐒 = 𝑝𝐽𝐂−1 + 2𝐽−2/3Dev (𝜕�̅�
𝜕�̅�) + 𝐓𝟎{𝑡, 𝐶𝑎0, 𝑙, 𝑇max} (Eq. 2.3)
where Dev() is the deviatoric operator, and the active stress T0 is a function of time t, peak
intracellular calcium Ca0, sarcomere length l, and maximum isometric tension Tmax.
Specifically, the active contraction T0 is defined by the modified Hill equation given in
Equation 2.4.
𝐓𝟎 =1
2𝑇max
𝐶𝑎02
𝐶𝑎02+𝐸𝐶𝑎50
2 (1 − cos(0.25
𝑚𝑙𝑅√2𝐸𝑓𝑓+1+𝑏+ 1)𝜋) (Eq. 2.4)

19
where m and b are constants, Eff is strain in the fiber direction, and 𝐸𝐶𝑎502 is length-
dependent calcium sensitivity given in Equation 2.5.
𝐸𝐶𝑎502 =
(𝐶𝑎0)max
√exp[𝐵(𝑙𝑅√2𝐸𝑓𝑓+1−𝑙0)]−1 (Eq. 2.5)
where B is a constant, l0 is the length at which the sarcomere does not generate any force,
and lR is the stress-free reference sarcomere length. The equations used to model length
dependent active tension and external calcium concentration for cardiac myocytes were
developed previously [13, 14]. Figure 2.9 shows the comparison between model
estimations and experimental results for active tension.
Figure 2.9 Experimentally measured length dependent active tension at different
concentrations of external calcium (a) and time and length dependent active force
generation (b) in cardiac myocytes compared to model estimations (dashed) [13, 14].

20
Invasive LV pressure measurements at end diastole and end systole were used as
boundary conditions to drive model simulations for each animal. The passive myocardium
and hydrogel material response during the diastolic filling phase were driven by the strain
energy functions provided in Equations 1.1 and 1.2 respectively. Passive stiffness (C) and
maximum myocyte isometric force generation (Tmax) were adjusted such that the model
matched MRI LV volume estimations at end diastole and end systole. Constitutive model
material parameters C, Tmax, bf, bt, bfs, for each region in the FE model were assigned based
on results from previous studies [3, 4, 5, 10, 13] and are provided in Table 2.1. Passive
material parameters bf, bt, and bfs were assigned differently in the remote and infarct region
based on results from previous studies [6, 24, 27, 33].
Table 2.1 Comparison of constitutive model parameters between the MI and DC group in
the remote and infarct regions at 8-weeks post-MI. Data are presented as mean ±
standard deviation where applicable.
C (kPa) Tmax (kPa) bf bt bfs
MI Remote 0.75 ± 0.66 278.7 ± 186.4 22.84 3.46 12.00
Infarct 7.41 ± 6.92 - 15.28 8.32 25.27
DC Remote 0.09 ± 0.06 93.6 ± 43.1 22.84 3.46 12.00
Infarct 3.26 ± 3.32 - 139.26 18.55 25.74
2.3 Papillary Muscle Motion
After completion of the simulations, full LV geometry node locations were exported
at both end diastole and end systole. Nodal positions of the chordae tendineae (CT)
attachment sites on the papillary muscles were determined by measurements obtained from

21
the excised heart of each animal at the terminal timepoint. The left ventricle of an excised
heart showing the infarct tissue region, posterior and anterior papillary muscles, and
chordae tendineae attachment locations can be seen in Figure 2.10.
Figure 2.10 Unwrapped left ventricle from an excised heart highlighting the infarct tissue
region (blue), papillary muscles (green), and chordae tendineae attachment site (red).
A custom MATLAB script was developed to process the exported node files and
extract useful location and motion data of the CT attachment nodes at end diastole and end
systole. A local coordinate system was created for each CT attachment node and nodal
displacement from end diastole to end systole was quantified in terms of the local

22
coordinate system for each corresponding node. The centroid of each ring of elements was
calculated along the entire length of the ventricle, and the long axis of the ventricle was
defined as the best fit line to the set of calculated centroid points and the apex node of the
ventricle. Three-dimensional node and displacement vector plots are shown in Figure 2.11.
Figure 2.11 Three-dimensional node location (blue), CT node displacement vectors
(orange) from end diastole to end systole, and LV long axis (green) calculated in MATLAB
for the same animal at 0 week (a) and 8 week (b) timepoints. Global z axis is shown for
both end diastolic and end systolic figures but does not apply to the relative motion figure.

23
For each CT attachment node, the positive longitudinal direction was defined as the
positive vertical axis relative to the FE model and the positive radial direction was defined
as the outward vector pointing away from the long axis of the ventricle toward the
corresponding CT attachment node. The circumferential direction was defined as the cross
product between the longitudinal and radial vectors. CT attachment node displacements
from each region (remote or infarct) were averaged to obtain radial, circumferential, and
longitudinal displacement values for each papillary muscle within each animal at each
timepoint. Circumferential, longitudinal, and radial local coordinate system vectors for
one of the CT attachment nodes can be seen in Figure 2.12.

24
Figure 2.12 End diastolic LV endocardial nodes (dark blue) for one model highlighting CT
attachment node locations (light blue), calculated long axis of the ventricle (green), CT
attachment node motion vectors (orange) and local coordinate system for one of the CT
attachment nodes (red).

25
Figure 2.13 Closeup view of a small portion of the LV endocardial node cloud (dark blue)
highlighting papillary CT attachment nodes (light blue), motion vectors (orange), and local
coordinate system for one CT attachment node (red).
A repeated-measures ANOVA model was used to calculate test statistics and p-values for
each term in the 3-way full-factorial model, considering the 3-way interaction between
timepoint, region, and treatment, as well as each 2-way interaction and main effect.
Pairwise differences were extracted and reported for effects that were statistically

26
significant. Average displacements for each group, and timepoint for both tissue regions
are provided in Section 3.1 of this document.
2.4 Mitral Regurgitation
As part of the original data collection and analysis by Rodell et al., mitral
regurgitation (MR) was rated on a scale from 0-3 (none to severe) by two-dimensional
echocardiography at both 0 and 8 week timepoints. Assessments of mitral regurgitation by
two-dimensional echocardiography are shown in Figure 2.14 and Figure 2.15.
Figure 2.14 Two-dimensional echo apical view of a sheep heart after myocardial infarction
showing (a) the left ventricle (LV), left atrium (LA), and aorta LV outflow tract (Ao); (b)
color Doppler overlay of the same view showing an MR rating of 1+.

27
Figure 2.15 Two-dimensional echo apical view of a sheep heart after myocardial infarction
showing (a) the left ventricle (LV), left atrium (LA), and aorta LV outflow tract (Ao); (b)
color Dopper overlay of the same view showing an MR rating of 3+.
Additional quantification of MR was performed using short-axis MRI contours of the LV
and RV. Full LV and RV end diastolic and end systolic contours were generated for each
animal at both 0 week and 8 week timepoints in a semi-automated fashion using a custom
MATLAB script. Ventricle volumes were calculated as the sum of voxel volumes
contained within the set of contours for each ventricle. The stroke volume of each
ventricle was calculated as the difference in ventricle volume between end diastole and
end systole. Regurgitant volume and fraction were calculated from the ventricular stroke
volumes based on methods described in previous studies [16, 21]. Regurgitant volume,
VR, was calculated as the difference between the LV and RV stroke volume:

28
𝑉𝑅 = 𝑆𝑉𝐿𝑉 − 𝑆𝑉𝑅𝑉 (Eq 2.6)
and the regurgitant fraction, FR, was calculated as:
𝐹𝑅 = 𝑉𝑅/𝑆𝑉𝐿𝑉 (Eq 2.7)
where VR is the regurgitant volume and SV units are in mL. A comparison between MRI
estimates of regurgitant volume, regurgitant fraction, and MR rating by two-dimensional
echocardiography is shown in the results section of this thesis in Table 3.3. Average
values for regurgitant volume and regurgitant fraction within each treatment group and
timepoint are shown in the results section of this thesis in Table 3.4.
In order to quantify changes in ventricle size between timepoints, the average mid-
ventricle diameter was calculated for each model. The mid-ventricle slice was calculated
as the slice halfway between the first and last slice on which the full LV contours were
drawn. A circle was fit by minimization of the residual sum of squares to the LV contour
on the mid ventricle slice, as well as the slice immediately below and above, and circle
diameter was averaged between the three slices to approximate mid-LV diameter.
Average mid-LV diameter at end diastole and end systole for each group and timepoint
are provided in the results section of this thesis in Table 3.5.

29
CHAPTER 3. RESULTS
3.1 Papillary Muscle Motion
Papillary muscle displacements in each region (remote and infarct), timepoint (0
and 8 weeks), and group (untreated MI and treated DC) are reported in this section. As
previously described in Section 2.3, CT attachment node displacements from each region
(remote or infarct) were averaged to obtain radial, circumferential, and longitudinal
displacement values for each papillary muscle. Average papillary muscle displacements
for the remote tissue region are reported in Table 3.1. It can be seen that the magnitude of
inward radial displacement is significantly greater in the DC treatment group compared to
the MI control group, at both the 0 week and 8 week timepoint. Furthermore,
circumferential displacement in the remote tissue region is preserved relative to the 0 week
timepoint in the DC treatment group, but is significantly less in the MI control group at
the 8 week timepoint.
Table 3.1 Average left ventricle papillary muscle displacement in the remote tissue
region. Data are presented as mm ± standard deviation.
Remote
Radial Circumferential Longitudinal
MI 0wk -5.2 ± 1.9 -3.2 ± 0.5 1.8 ± 1
8wk -4.4 ± 2 -1.1 ± 0.4‡ 1.6 ± 0.6
DC 0wk -7.1 ± 2.2* -3.6 ± 0.9 3.3 ± 1.4
8wk -6.4 ± 2.4* -3.6 ± 1.3* 2.3 ± 0.5
* p < 0.05 compared to MI control, ‡ p < 0.05 compared to 0wk baseline within the same
group, † p < 0.05 compared to remote region within the same group and timepoint.

30
Average papillary muscle displacements for the infarct tissue region are provided in Table
3.2. Radial displacement in the infarct tissue region is significantly greater in the DC
treatment group compared to the MI control group, at both timepoints. Additionally,
average radial displacement in the infarct tissue region is positive for the untreated MI
group, indicating outward movement of the infarcted myocardium during systole, while
the direction of motion inward was preserved in the treated DC group. Circumferential
displacement in the infarct tissue region decreased significantly from 0 weeks to 8 weeks
in both animal groups. Longitudinal displacement in the infarct tissue region was
significantly less at the 8 week timepoint in both groups compared to the 0 week timepoint.
Table 3.2 Average left ventricle papillary muscle displacement in the infarct tissue
region. Data are presented as mm ± standard deviation.
Infarct Radial Circumferential Longitudinal
MI 0wk -5.3 ± 1.1 -3 ± 0.9 3.3 ± 0.3
8wk 1 ± 0.8‡† -1.5 ± 0.6‡ 1.9 ± 0.8‡
DC 0wk -6.9 ± 1.8* -3.1 ± 1.2 4.4 ± 0.7
8wk -1.3 ± 1.4*‡† -1.7 ± 0.3‡† 1.4 ± 0.7‡
* p < 0.05 compared to MI control, ‡ p < 0.05 compared to 0wk baseline within the same
group, † p < 0.05 compared to remote region within the same group and timepoint.
3.2 Mitral Regurgitation
MRI estimates of mitral regurgitation were compared to echo Doppler ratings by
the methods previously discussed in Section 2.4. Table 3.3 shows the comparison of echo
rating, MRI regurgitant volume, and MRI regurgitant fraction. Mitral regurgitation was

31
rated at the 0 week and 8 week timepoint in each animal. Table 3.3 includes the number
of times (n) that a specific echo Doppler rating was assigned across all animals and
timepoints.
Table 3.3 Comparison between MRI estimates of regurgitant volume, regurgitant
fraction, and rating by two-dimensional echocardiography. Data are presented as mean ±
standard deviation.
Echo
Rating
n
MRI Regurgitant Volume
(mL)
MRI Regurgitant
Fraction (%)
0
5
2.4 ± 2.5
4.6 ± 3.9
1
12
4.5 ± 2.6
8.7 ± 3.9
2
5
9 ± 4.2
20.3 ± 8.6
3 2 25.3 ± 19.6 35 ± 20.3
A comparison of MRI estimates of regurgitant volume and regurgitant fraction between
treatment groups for each timepoint is shown in Table 3.4. Regurgitant volume and
regurgitant fraction significantly increased in the untreated MI control group from the 0
week timepoint to the 8 week timepoint. Regurgitant volume and regurgitant fraction did
not change from the 0 week to the 8 week timepoint in the treated DC group. In addition,
these values are associated with echo ratings which imply no leakage of the valve at the 8
week timepoint.

32
Table 3.4 Comparison of regurgitant volume and regurgitant fraction between treatment
groups. Data are presented as mean ± standard deviation.
0wk 8wk
Regurgitant Volume (mL) MI 2.7 ± 1.3 14.8 ± 12.2‡
DC 4.4 ± 3.9 5.0 ± 3.1*
Regurgitant Fraction (%) MI 7.5 ± 3.8 25.7 ± 13.6‡
DC 8.9 ± 4.2 7.8 ± 4.2*
* p < 0.05 compared to MI control, ‡ p < 0.05 compared to 0wk baseline within the same
group.
A comparison of average mid-ventricle end diastolic and end systolic diameter between
treatment groups for each timepoint is shown in Table 3.5. End diastolic diameter and end
systolic diameter significantly increased from the 0 week timepoint to the 8 week timepoint
in both the untreated MI and the treated DC animal groups. While there is no significant
difference in end diastolic diameter between treatment groups, end systolic diameter is
significantly greater in the untreated MI group than the treated DC group at the 8 week
timepoint. This indicates that there is less dilation and greater inward radial motion at end
systole in the treated animal group.

33
Table 3.5 Comparison of average mid-LV diameter at end diastole and end systole
between groups and timepoints. Data are presented as mean ± standard deviation.
0wk 8wk
End Diastolic Diameter (mm) MI 35 ± 2 50.7 ± 6.5† DC 36.2 ± 5.2 44.6 ± 4.3†
End Systolic Diameter (mm) MI 21.8 ± 3.2 42.4 ± 6.8†
DC 21.1 ± 5.4 33.4 ± 5.5*†
* p < 0.05 compared to MI control, † p < 0.05 compared to 0wk baseline within the same
group

34
CHAPTER 4. DISCUSSION
While the relationship between the progression of ischemic mitral regurgitation and
left ventricular remodeling after myocardial infarction has been investigated in depth,
changes in quantifiable metrics of the ventricular wall and papillary muscle motion are not
as readily available. Previous research has shown that chordae tendineae (CT) have an
important role in mitral valve competence as well as left ventricular geometry and function
[10, 18]. Due to tethering between the mitral valve and the papillary muscles in the left
ventricle via CT, it is plausible that changes in left ventricular wall and papillary muscle
motion following myocardial infarction could contribute to the progression of ischemic
mitral regurgitation [10, 11, 17, 21 35]. Previous research from Gorman et al. concluded
that myocardial infarctions that include the anterior papillary muscle do not produce mitral
regurgitation regardless of size, while mitral regurgitation was shown to occur following
an infarct involving the posterior papillary muscle. According to Gorman et al., large
posterior infarcts may result in mitral regurgitation caused in part by discoordination of
papillary muscle relationships to the mitral valve [11]. The current study presents a method
to quantify changes in papillary muscle motion following posterolateral myocardial
infarction which may contribute to the development and progression of ischemic mitral
regurgitation.
In this study, quantifiable changes in CT papillary muscle attachment site
displacements were assumed to be representative of overall papillary muscle motion.
Changes in papillary muscle motion and estimates of mitral regurgitation were compared
between a group of animals that received a hydrogel treatment (DC) shown to limit
ventricular remodeling after myocardial infarction and a control group (MI). Regurgitant

35
volume and regurgitant fraction calculated from MRI estimates of LV and RV stroke
volume (Table 3.4) were not different between the DC and MI groups at the 0 week
baseline timepoint. Both regurgitant volume and regurgitant fraction significantly
increased in the untreated MI group from the 0 week to 8 week timepoint, while no
significant change was observed in the treated DC group. Average CT papillary muscle
attachment node displacement in the radial, circumferential, and longitudinal directions
were compared between treatment groups (MI, DC), region (Remote, Infarct), and
timepoint (0 week, 8 week) as shown in Table 3.1 and Table 3.2.
The magnitude of radial displacement was significantly greater in the treated DC
group than the untreated MI group regardless of timepoint or region. Despite this
systematic difference between groups, it is important to note that the calculated outward
radial displacement of the papillary muscle in the infarct region is indicative of an outward
bulging of the compromised infarcted tissue region at the 8-week timepoint in the untreated
MI group. This outward radial displacement calculated from the FE model simulation is
consistent with recorded observations of left ventricular dyskinesia from MRI and
echocardiography. The mechanism for development of mitral regurgitation from
dyskinesis of the posterior portion of the LV wall is postulated in Godley et al. and Gorman
et al [10, 11]. A posterior displacement of the LV wall that occurs in dyskinesis could
increase the tension on the chordae tendineae connecting the posterior papillary muscle and
the anterior leaflet of the mitral valve, causing the anterior leaflet to be pulled into the LV
cavity. A similar mechanism for the development of MR is outline in a more recent study
by Levine et al [21].

36
The Rodell paper that originally reported on the efficacy of this specific hydrogel
treatment to prevent left ventricular remodeling did not comment on the development of
mitral regurgitation. A previous study from McGarvey et al. under the guidance of the
Gorman group showed that injectable microsphere gels improved ratings of mitral
regurgitation by echocardiography in a porcine model [24]. The work presented in this
thesis provides additional insight into the development of mitral regurgitation following
posterolateral myocardial infarction by providing quantifiable metrics of changes in
papillary muscle movement. While it is possible that future studies may be able to obtain
papillary muscle motion experimentally using 3D displacement-encoded MRI, the
appropriate MRI data to perform this type of analysis was not collected in the present study.
This thesis outlines an effective method for quantification of papillary muscle motion using
3D FE models built from a stack of 2D cine MR images.
Mid-LV diameter was calculated to provide a metric that could be used to gain
additional insight on both global LV remodeling as well as changes in papillary muscle
motion. As can be seen in Table 3.5, end diastolic diameter and end systolic diameter were
not different between the MI control group and the treated DC group at the 0 week
timepoint. At the 8 week timepoint, the end diastolic diameter was not significantly
different between the two groups; however, average mid-LV end systolic diameter was
significantly less in the treated DC group than in the untreated MI group. Due to an
increase in regurgitant volume in the MI group that was not observed in the treated DC
group, similarity in end diastolic diameter between groups at the 8 week timepoint could
suggest that inability to maintain a low systolic diameter relative to end diastolic diameter
is a predictor of mitral regurgitation. Jensen et al. found that anterior to posterior papillary

37
muscle distance at end systole showed the strongest correlation with regurgitant volume of
papillary muscle position parameters that were tested, but did not discuss combinations of
effects [17]. The results of the current study indicate that the DC treatment has both a
global effect, indicated by the smaller end systolic diameter, as well as a local effect,
indicated by the inward radial motion of the infarcted papillary muscle region.
The magnitude of circumferential displacement significantly decreased between 0
week and 8 week timepoints in the infarct region in both groups, as well as the remote
region in the untreated MI group. Circumferential displacement was preserved between 0
and 8 weeks in the remote region of the treated DC group. Longitudinal displacements
similarly decreased in the infarct region between 0 and 8 weeks for both treated and
untreated groups. Although the magnitude of displacement decreases in all directions in
the infarct region for both the MI and DC groups, the positive (outward) motion in the
radial direction of the MI group could contribute to the significant increase in regurgitant
volume. Additionally, circumferential displacement, which is linked to the twisting motion
of the LV, is decreased in both the remote and infarct region of the MI group but is
preserved in the remote region of the DC group. The combination of these two factors may
serve to highlight the role of changes in papillary muscle motion in the progression of
mitral regurgitation. A correlation analysis between measurements of mitral regurgitation
and changes in direction and magnitude of displacement may provide some additional
insight into the results outlined in this study. Regardless of the underlying mechanism, the
results of this study show that regurgitant volume did not increase 8 weeks after myocardial
infarction in the group of animals that received the hydrogel injection therapy in contrast
to the significant increase in regurgitant volume observed in the untreated animal group.

38
CHAPTER 5. CONCLUSION
The purpose of this study, within the scope of this thesis, was to quantify the
differences in papillary muscle motion and progression of mitral regurgitation between a
group of untreated animals and a group of animals treated with hydrogel injection therapy.
As outlined in this thesis, dyskinesis of the LV wall involving one or both papillary muscles
is thought to influence the development of mitral regurgitation due to tethering between
the mitral valve and papillary muscles via the chordae tendineae. Early research used
echocardiography to estimate LV myocardium dyskinesis involving the papillary muscles.
A more recent study employed the use of 3D morphology cardiac MRI to characterize the
spatial location of the papillary muscles in groups of animals with and without FIMR [17].
The current study used FE model simulations constructed from LV contours to show that
while differences in papillary muscle motion occur between 0 and 8 weeks post-MI in both
treated and untreated groups, dyskinesis of the posterior papillary muscle thought to
contribute to MR was only observed in the untreated group of animals.
Estimates of mitral regurgitation from MRI showed a significant increase in
regurgitant volume in the untreated group of animals post-MI while regurgitant volume did
not increase in treated animals. Mid-ventricle diameter increased significantly in both the
treated and untreated groups from 0 to 8 weeks post-MI and there was no difference in end
diastolic diameter between the two groups at 8 weeks; however, mid-LV end systolic
diameter was significantly lower in the treated group than in the untreated group. Lower
systolic diameter in the treated group at 8 weeks post-MI may suggest that systolic motion
from 0 weeks to 8 weeks was preserved better in animals that received the hydrogel
treatment than in those that did not.

39
Existing treatment for limiting mitral regurgitation and posterior LV dyskinesia as a
result of myocardial infarction includes methods such as reinforcement of the wall via
patch device, balloon inflation, or suture rows [21]. Hydrogel injection therapy has been
shown to limit LV remodeling and development of MR 8 weeks post-MI and could serve
as a minimally invasive treatment alternative. This thesis presented methods to quantify
changes in papillary muscle motion after myocardial infarction using FE models built from
2D short-axis LV MR images. In future work, a comparison study between motion data
obtained using animal specific FE models as presented in this thesis and motion data
obtained from 3D DENSE MRI could provide important insights into these results. In
order to better understand the development of mitral regurgitation using the methods
presented here, future research could focus on the development and implementation of a
model that encompasses the entire LV including mitral valve and chordae tendineae in
order to simulate the tethering interaction throughout the cardiac cycle.
40
REFERENCES
[1] Ahmed, Enas M. “Hydrogel: Preparation, Characterization, and Applications: A
Review.” Journal of Advanced Research, vol. 6, no. 2, 18 July 2013, pp. 105–
121., doi:10.1016/j.jare.2013.07.006.
[2] Birnbaum, Yochai, et al. “Mitral Regurgitation Following Acute Myocardial
Infarction.” Coronary Artery Disease, vol. 13, no. 6, 2002, pp. 337–344.,
doi:10.1097/00019501-200209000-00006.
[3] Bursi, Francesca, et al. “Mitral Regurgitation After Myocardial Infarction: A
Review.” The American Journal of Medicine, vol. 119, no. 2, Feb. 2006, pp. 103–
112., doi:10.1016/j.amjmed.2005.08.025.
[4] “Chapter 12: The Cardiovascular System: The Heart.” Essentials of Anatomy
& Physiology, by Frederic Martini and Edwin F. Bartholomew, Pearson
Education, Inc., 2017.
[5] Costa, K. D., et al. “Modelling Cardiac Mechanical Properties in Three
Dimensions.” Philosophical Transactions of the Royal Society of London. Series
A: Mathematical, Physical and Engineering Sciences, vol. 359, no. 1783, 2001,
pp. 1233–1250., doi:10.1098/rsta.2001.0828.
[6] Dorsey, Shauna M., et al. “MRI Evaluation of Injectable Hyaluronic Acid-Based
Hydrogel Therapy to Limit Ventricular Remodeling after Myocardial Infarction.”
Biomaterials, vol. 69, 2015, pp. 65–75., doi:10.1016/j.biomaterials.2015.08.011.
[7] Dujardin, Karl S., et al. “Grading of Mitral Regurgitation by Quantitative Doppler
Echocardiography.” Circulation, vol. 96, no. 10, 18 Nov. 1997, pp. 3409–3415.,
doi:10.1161/01.cir.96.10.3409.
[8] Ge, Liang, et al. “Moderate Ischemic Mitral Regurgitation After Posterolateral
Myocardial Infarction in Sheep Alters Left Ventricular Shear but Not Normal
Strain in the Infarct and Infarct Borderzone.” The Annals of Thoracic Surgery,
vol. 101, no. 5, 2016, pp. 1691–1699., doi:10.1016/j.athoracsur.2015.10.083.
[9] Gibas, Iwona, and Helena Janik. “Review: Synthetic Polymer Hydrogels For
Biomedical Applications.” Chemistry and Chemical Technology, vol. 4, no. 4,
Oct. 2010.
[10] Godley, R W, et al. “Incomplete Mitral Leaflet Closure in Patients with Papillary
Muscle Dysfunction.” Circulation, vol. 63, no. 3, Mar. 1981, pp. 565–571.,
doi:10.1161/01.cir.63.3.565.
[11] Gorman, Joseph H., et al. “Infarct Size And Location Determine Development Of
Mitral Regurgitation In The Sheep Model.” The Journal of Thoracic and
Cardiovascular Surgery, vol. 115, no. 3, 1998, pp. 615–622., doi:10.1016/s0022-
5223(98)70326-5.

41
[12] Grigioni, F, et al. “Ischemic Mitral Regurgitation. Long-Term Outcome and
Prognostic Implications with Quantitative Doppler Assessment.” ACC Current
Journal Review, vol. 10, no. 5, 2001, p. 33., doi:10.1016/s1062-1458(01)00387-7.
[13] Guccione, J. M., and A. D. McCulloch. “Mechanics of Active Contraction in
Cardiac Muscle: Part I—Constitutive Relations for Fiber Stress That Describe
Deactivation.” Journal of Biomechanical Engineering, vol. 115, no. 1, 1993, p.
72., doi:10.1115/1.2895473.
[14] Guccione, J. M., et al. “Mechanics of Active Contraction in Cardiac Muscle: Part
II—Cylindrical Models of the Systolic Left Ventricle.” Journal of Biomechanical
Engineering, vol. 115, no. 1, Feb. 1993, p. 82., doi:10.1115/1.2895474.
[15] Guccione, J. M., et al. “Passive Material Properties of Intact Ventricular
Myocardium Determined From a Cylindrical Model.” Journal of Biomechanical
Engineering, vol. 113, no. 1, Feb. 1991, p. 42., doi:10.1115/1.2894084.
[16] Hundley, W. Gregory, et al. “Magnetic Resonance Imaging Assessment of the
Severity of Mitral Regurgitation.” Circulation, vol. 92, no. 5, Sept. 1995, pp.
1151–1158., doi:10.1161/01.cir.92.5.1151.
[17] Jensen, Henrik, et al. “Three-Dimensional Assessment of Papillary Muscle
Displacement in a Porcine Model of Ischemic Mitral Regurgitation.” The Journal
of Thoracic and Cardiovascular Surgery, vol. 140, no. 6, Mar. 2010, pp. 1312–
1318., doi:10.1016/j.jtcvs.2009.12.042.
[18] Kon, MW. The Journal of Heart Valve Disease, vol. 13, no. 4, July 2004, pp.
600–607.
[19] Kong, Fanwei, et al. “Finite Element Analysis of Annuloplasty and Papillary
Muscle Relocation on a Patient-Specific Mitral Regurgitation Model.” Plos One,
vol. 13, no. 6, 2018, doi:10.1371/journal.pone.0198331.
[20] Lamas, GA. “Clinical Significance of Mitral Regurgitation after Acute
Myocardial Infarction. Survival and Ventricular Enlargement Investigators.”
Circulation, vol. 96, no. 3, 5 Aug. 1997, pp. 827–833.
[21] Levine, Robert A., and Ehud Schwammenthal. “Ischemic Mitral Regurgitation on
the Threshold of a Solution.” Circulation, vol. 112, no. 5, 2005, pp. 745–758.,
doi:10.1161/circulationaha.104.486720.
[22] Marzilli, M., et al. “Role of the Papillary Muscle in Opening and Closure of the
Mitral Valve.” American Journal of Physiology-Heart and Circulatory
Physiology, vol. 238, no. 3, Mar. 1980, doi:10.1152/ajpheart.1980.238.3.h348.
[23] Mcgarvey, Jeremy R., et al. “Injectable Microsphere Gel Progressively Improves
Global Ventricular Function, Regional Contractile Strain, and Mitral
Regurgitation After Myocardial Infarction.” The Annals of Thoracic Surgery, vol.
99, no. 2, 2015, pp. 597–603., doi:10.1016/j.athoracsur.2014.09.014.
[24] Mcgarvey, Jeremy R., et al. “Temporal Changes in Infarct Material Properties: An
In Vivo Assessment Using Magnetic Resonance Imaging and Finite Element

42
Simulations.” The Annals of Thoracic Surgery, vol. 100, no. 2, 2015, pp. 582–
589., doi:10.1016/j.athoracsur.2015.03.015.
[25] Obadia, Jean F., et al. “Mitral Subvalvular Apparatus.” Circulation, vol. 96, no. 9,
1997, pp. 3124–3128., doi:10.1161/01.cir.96.9.3124.
[26] Orlic, Donald, et al. “Bone Marrow Stem Cells Regenerate Infarcted
Myocardium.” Pediatric Transplantation, vol. 7, 2003, pp. 86–88.,
doi:10.1034/j.1399-3046.7.s3.13.x.
[27] Rodell, Christopher B., et al. “Injectable Shear-Thinning Hydrogels for Minimally
Invasive Delivery to Infarcted Myocardium to Limit Left Ventricular
Remodeling.” Circulation: Cardiovascular Interventions, vol. 9, no. 10, Oct. 2016,
doi:10.1161/circinterventions.116.004058.
[28] Rodriguez, F. “Importance of Mitral Valve Second-Order Chordae for Left
Ventricular Geometry, Wall Thickening Mechanics, and Global Systolic
Function.” Circulation, vol. 110, no. 11_suppl_1, 2004,
doi:10.1161/01.cir.0000138580.57971.b4.
[29] Soleimani, Mehrdad, et al. “Moderate Mitral Regurgitation Accelerates Left
Ventricular Remodeling After Posterolateral Myocardial Infarction.” The Annals
of Thoracic Surgery, vol. 92, no. 5, Nov. 2011, pp. 1614–1620.,
doi:10.1016/j.athoracsur.2011.05.117.
[30] Sutton, Martin G. St. John, and Norman Sharpe. “Left Ventricular Remodeling
After Myocardial Infarction.” Circulation, vol. 101, no. 25, 2000, pp. 2981–2988.,
doi:10.1161/01.cir.101.25.2981.
[31] Thygesen, Kristian, et al. “Universal Definition of Myocardial Infarction.”
Journal of the American College of Cardiology, vol. 50, no. 22, 2007, pp. 2173–
2195., doi:10.1016/j.jacc.2007.09.011.
[32] Veronesi, Federico, et al. “Quantification of Mitral Apparatus Dynamics in
Functional and Ischemic Mitral Regurgitation Using Real-Time 3-Dimensional
Echocardiography.” Journal of the American Society of Echocardiography, vol.
21, no. 4, 2008, pp. 347–354., doi:10.1016/j.echo.2007.06.017.
[33] Wang, Hua, et al. “Effects of Hydrogel Injection on Borderzone Contractility
Post-Myocardial Infarction.” Biomechanics and Modeling in Mechanobiology,
vol. 17, no. 5, 2018, pp. 1533–1542., doi:10.1007/s10237-018-1039-2.
[34] Wang, Hua, et al. “Computational Investigation of Transmural Differences in Left
Ventricular Contractility.” Journal of Biomechanical Engineering, vol. 138, no.
11, 2016, p. 114501., doi:10.1115/1.4034558.
[35] Wenk, Jonathan F., et al. “First Finite Element Model of the Left Ventricle With
Mitral Valve: Insights Into Ischemic Mitral Regurgitation.” The Annals of
Thoracic Surgery, vol. 89, no. 5, May 2010, pp. 1546–1553.,
doi:10.1016/j.athoracsur.2010.02.036.
43
[36] Wenk, Jonathan F., et al. “A Method for Automatically Optimizing Medical
Devices for Treating Heart Failure: Designing Polymeric Injection Patterns.”
Journal of Biomechanical Engineering, vol. 131, no. 12, 2009, p. 121011.,
doi:10.1115/1.4000165.
[37] Wenk, Jonathan F., et al. “Regional Left Ventricular Myocardial Contractility and
Stress in a Finite Element Model of Posterobasal Myocardial Infarction.” Journal
of Biomechanical Engineering, vol. 133, no. 4, 2011, p. 044501.,
doi:10.1115/1.4003438.
[38] Yin F C, and L L Demer. “Passive Biaxial Mechanical Properties of Isolated
Canine Myocardium.” The Journal of Physiology, vol. 339, no. 1, 1983, pp. 615–
630., doi:10.1113/jphysiol.1983.sp014738.
[39] Yiu, Siu F., et al. “Determinants of the Degree of Functional Mitral Regurgitation
in Patients With Systolic Left Ventricular Dysfunction.” Circulation, vol. 102, no.
12, 2000, pp. 1400–1406., doi:10.1161/01.cir.102.12.1400.
[40] Zeng, Xin, et al. “Efficacy of Polymer Injection for Ischemic Mitral
Regurgitation.” JACC: Cardiovascular Interventions, vol. 8, no. 2, 2015, pp. 355–
363., doi:10.1016/j.jcin.2014.09.016.
[41] Zhang, Xiaoyan, et al. “Regional Quantification of Myocardial Mechanics in Rat
Using 3D Cine DENSE Cardiovascular Magnetic Resonance.” NMR in
Biomedicine, vol. 30, no. 8, 2017, doi:10.1002/nbm.3733.

44
VITA
EDUCATION
• University of Kentucky, Lexington, KY
o Bachelor of Science in Mechanical Engineering, May 2015
PROFESSIONAL POSITIONS
• NASA Johnson Space Center, Houston, TX
o Engineer, September 2015 – Present
o Intern, May 2014 – August 2014, May 2015 – August 2015
• Wenner-Gren Aeronautical Research Laboratory, Lexington, KY
o Research Technician, May 2011 – May 2014
HONORS AND AWARDS
• National Aeronautics and Space Administration, Houston, TX
o Johnson Space Center Group Achievement Award, December 2016
o Johnson Space Center Group Achievement Award, August 2015
• National Aeronautics and Space Administration, Mountain View, CA
o Ames Research Center Travel Grant Recipient, May 2012
• MEI Technologies, Houston, TX
o Sustained Total Achievement Award, December 2016
• University of Kentucky, Lexington, KY
o Dean’s List, Fall 2011 – Spring 2015
o Honors Program
o Kentucky Educational Excellence Scholarship
o Provost Scholarship
PUBLICATIONS
• Ferguson, CR, Gorman, RC, Wenk, JF. “Quantification of Papillary Muscle Motion
and Mitral Regurgitation after Myocardial Infarction.” Paper accepted for presentation
at annual meeting of the Society for Experimental Mechanics, Reno, NV (2019).
• Ferguson, CR, Gorman, RC, Wenk, JF. “Quantification of Papillary Muscle Motion
and Mitral Regurgitation after Myocardial Infarction.” Poster session presented at UK
College of Engineering Biomedical Research Day, Lexington, KY (2018).
• Laurie, SS, Macias, BR, Ferguson, CR, Dunn, JT, Ebert, D, Lee, SMC, Dulchavsky,
SA, Hargens, AR, Stenger, MB. “Submacular Choroid Thickness Increases During
45
Long-Duration Spaceflight.” Poster session presented at the annual meeting of the
Association for Research in Vision and Ophthalmology, Honolulu, HI (2018).
• Ferguson, CR, Laurie, SS, Macias, BR, Ebert, DJ, Lee, SMC, Stenger, MB.
“Quantification of choroidal folds in an astronaut completing long-duration
spaceflight.” Poster session presented at the annual meeting of the Association for
Research in Vision and Ophthalmology, Baltimore, MD (2017).
• Laurie, S, Vizzeri, G, Taibbi, G, Ferguson, CR, Hu, X, Lee, S, Ploutz-Snyder, R,
Smith, S, Zwart, S, Stenger, M. “Effects of Short-Term Mild Hypercapnia during Head-
Down Tilt on Intracranial Pressure and Ocular Structures in Healthy Human Subjects.”
Physiological Reports (2017).
• Evans, JM, Ribeiro, LC, Moore, FB, Wang, S, Zhang, Q, Kostas, V, Ferguson, CR,
Serrador, J, Falvo, M, Stenger, MB, Goswami, N, Rask, JC, Smith, JD, Knapp, CF.
“Hypovolemic Men and Women Regulate Blood Pressure Differently Following
Exposure to Artificial Gravity.” European Journal of Applied Physiology, vol. 115, no.
12, 2015, pp. 2631-2640., doi:10.1007/s00421-015-3261-2.
• Ferguson, CR, Lee, SMC, Stenger, MB, Laurie, SS. “Measurement of acute changes
in choroid thickness in healthy eyes during posture change using optical coherence
tomography.” NASA Technical Reports Server (2015).
• Ferguson, CR, Laurie, SS, Stenger, MB. “Modelflow Determination of Stroke
Volume.” Paper presented at NASA Johnson Space Center, Houston, TX (2014).
• Ferguson, CR, Lee, SMC, Stenger, MB, Platts, SH, Laurie, SS. “Modelflow Estimates
of Stroke Volume Do Not Correlate With Doppler Ultrasound Estimates During
Upright Posture.” NASA Technical Reports Server (2014).
• Evans, JM, Ferguson, CR, Zhang, Q, Moore, FB, Smith, JD, Stenger, MB, Ribeiro,
LC, Knapp, CF. “Mechanisms of Orthostatic Tolerance Improvement Following
Artificial Gravity Exposure Differ between Men and Women.” The Journal of the
Federation of American Societies for Experimental Biology (2014).
• Evans, JM, Ribeiro, LC, Wang, S, Falvo, MJ, Serrador, J, Ferguson, CR, Moore, FB,
Smith, JD, Rask, JC, Kostas, V, Zhang, Q, Knapp, CF. “Improvement of Hypovolemic
Men’s and Women’s Orthostatic Tolerance by a Short Exposure to Artificial Gravity.”
The Journal of the Federation of American Societies for Experimental Biology (2013).

![[PPT]CORONARY CIRCULATION-ANATOMY HISTORY ... · Web viewThe posterior papillary muscle-dual blood flow from circumflex and terminal branches of RCA. Sinus node-In majority by RCA,](https://img.pdfslide.us/doc/110x75/5ad070187f8b9ae2138dc40f/pptcoronary-circulation-anatomy-history-viewthe-posterior-papillary-muscle-dual.jpg)