Embed Size (px)
Citation preview
Quantification of Quantification of Levee Impacts Levee Impacts
on on Illinois StreamsIllinois Streams
Bill JarrettBill Jarrett2/9/082/9/08
Senior Geography Research Senior Geography Research SeminarSeminar
Geography ClubGeography Club
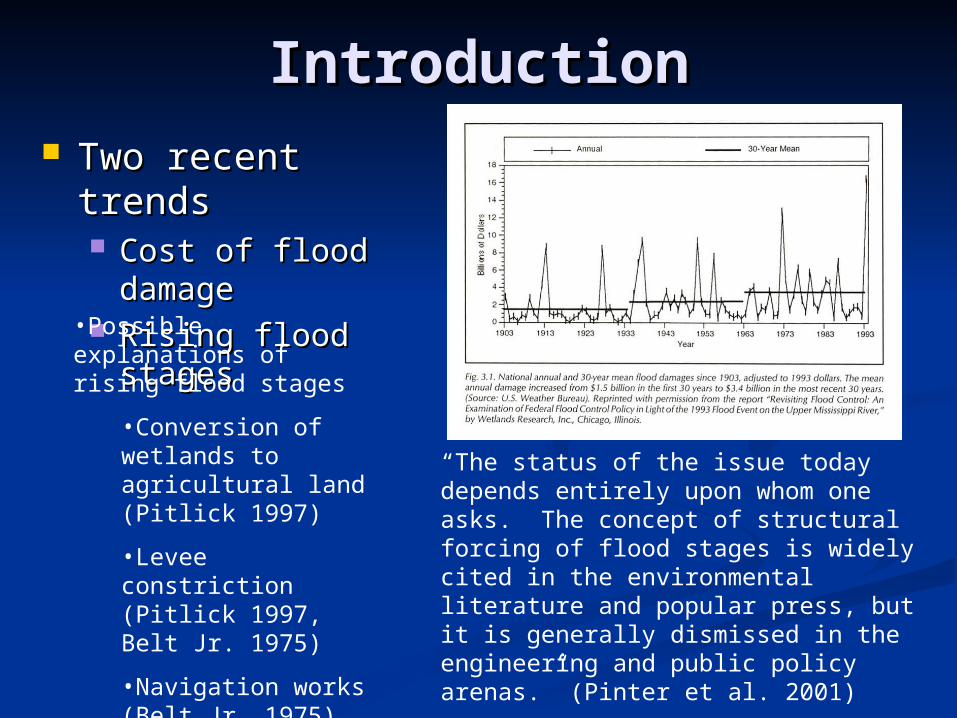
IntroductionIntroduction Two recent trendsTwo recent trends
Cost of flood Cost of flood damagedamage
Rising flood stagesRising flood stages•Possible explanations of rising flood stages
•Conversion of wetlands to agricultural land (Pitlick 1997)
•Levee constriction (Pitlick 1997, Belt Jr. 1975)
•Navigation works (Belt Jr. 1975)
“The status of the issue today depends entirely upon whom one asks. The concept of structural forcing of flood stages is widely cited in the environmental literature and popular press, but it is generally dismissed in the engineering and public policy arenas.” (Pinter et al. 2001)
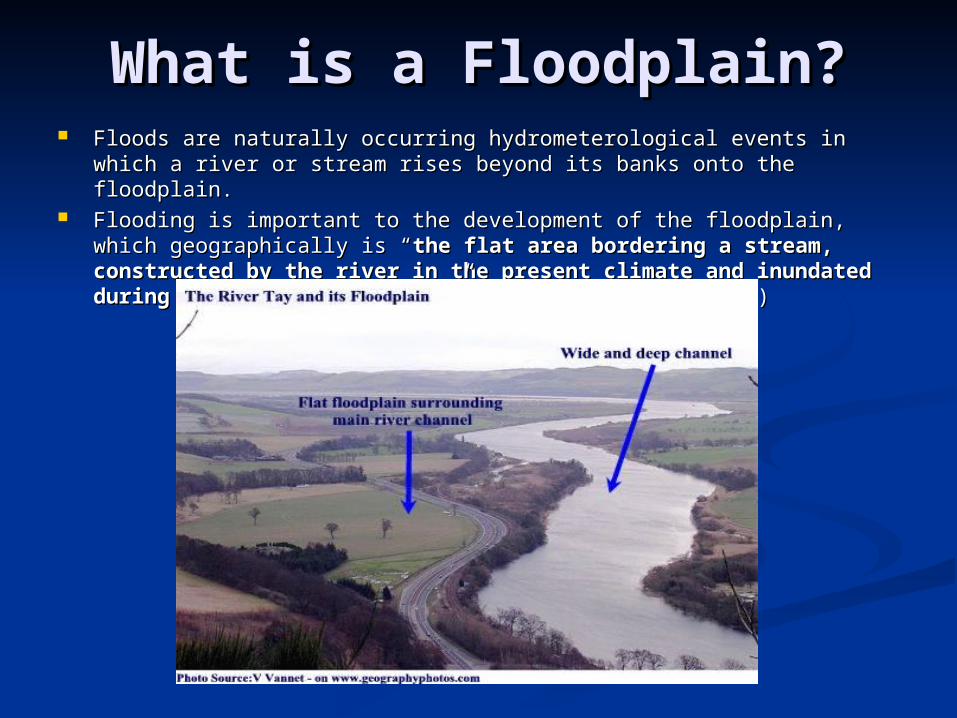
What is a Floodplain?What is a Floodplain? Floods are naturally occurring hydrometerological events in which a river Floods are naturally occurring hydrometerological events in which a river
or stream rises beyond its banks onto the floodplain.or stream rises beyond its banks onto the floodplain. Flooding is important to the development of the floodplain, which Flooding is important to the development of the floodplain, which
geographically is “geographically is “the flat area bordering a stream, constructed by the flat area bordering a stream, constructed by the river in the present climate and inundated during periods of the river in the present climate and inundated during periods of high flowhigh flow.” (Leopold 1997)/ (p105).” (Leopold 1997)/ (p105)
Alteration of the Alteration of the FloodplainFloodplain
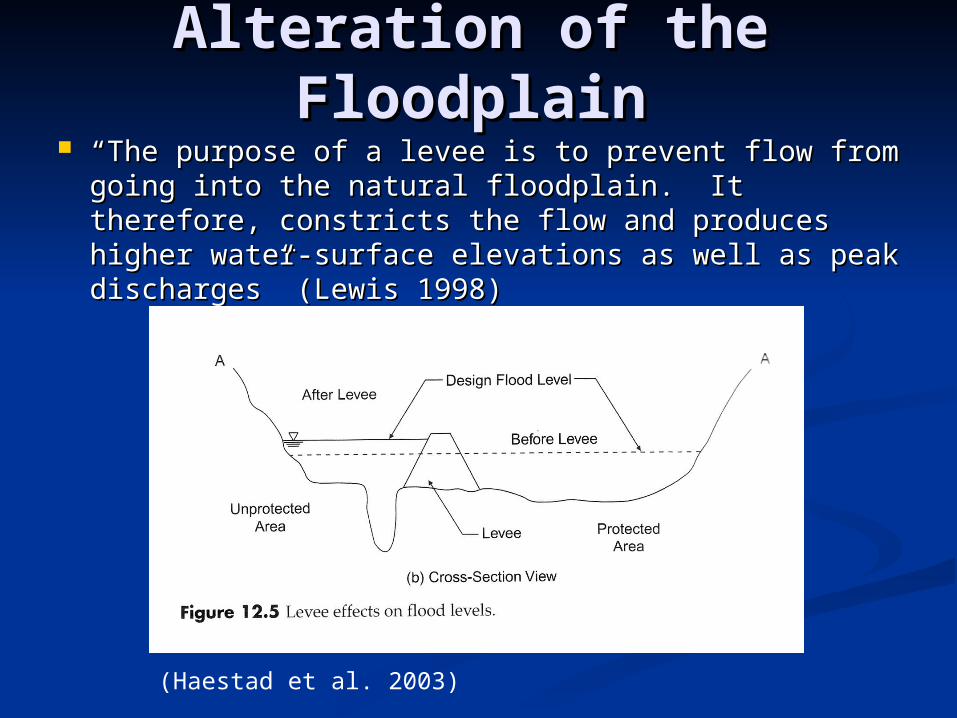
““The purpose of a levee is to prevent flow from going The purpose of a levee is to prevent flow from going into the natural floodplain. It therefore, constricts into the natural floodplain. It therefore, constricts the flow and produces higher water-surface the flow and produces higher water-surface elevations as well as peak discharges” (Lewis 1998)elevations as well as peak discharges” (Lewis 1998)
(Haestad et al. 2003)
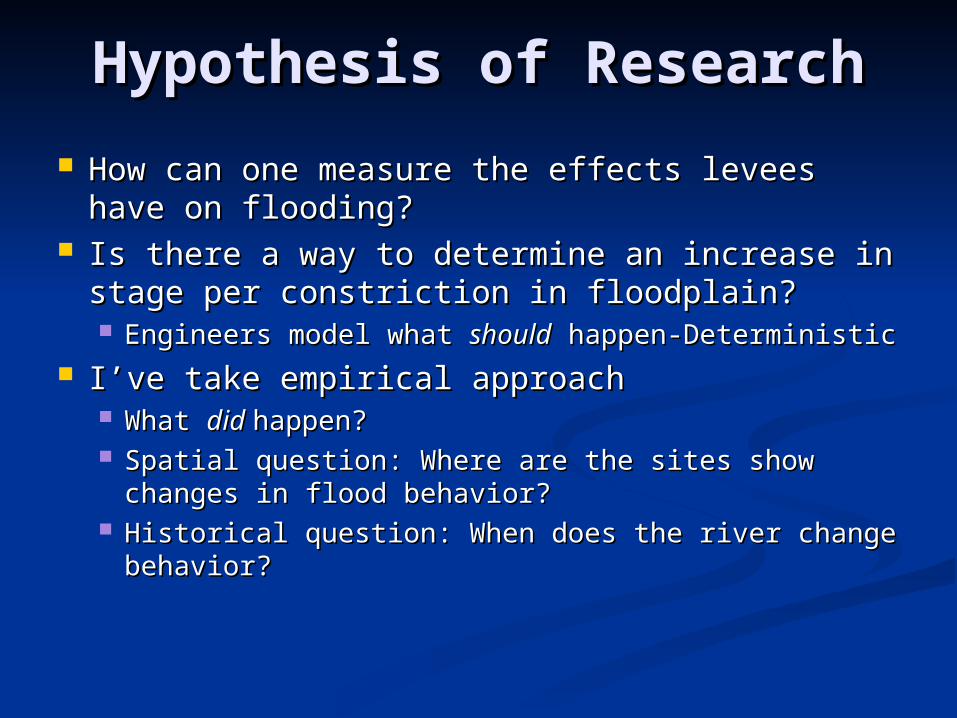
Hypothesis of ResearchHypothesis of Research
How can one measure the effects levees have How can one measure the effects levees have on flooding? on flooding?
Is there a way to determine an increase in Is there a way to determine an increase in stage per constriction in floodplain?stage per constriction in floodplain? Engineers model what Engineers model what shouldshould happen-Deterministic happen-Deterministic
I’ve take empirical approachI’ve take empirical approach What What did did happen?happen? Spatial question: Where are the sites show changes Spatial question: Where are the sites show changes
in flood behavior?in flood behavior? Historical question: When does the river change Historical question: When does the river change
behavior?behavior?
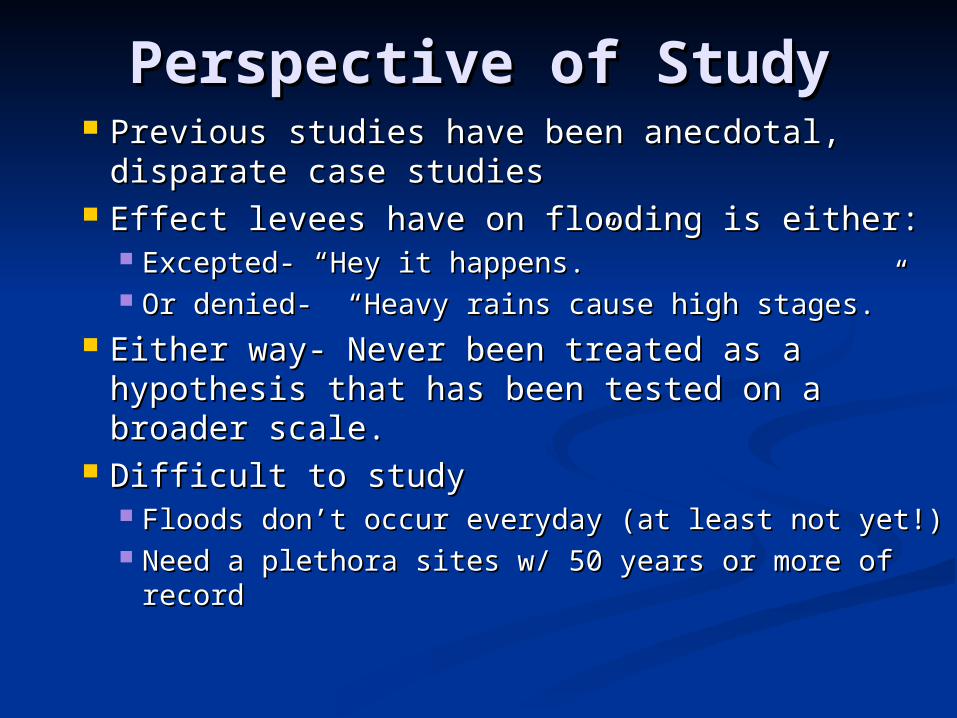
Perspective of StudyPerspective of Study Previous studies have been anecdotal, Previous studies have been anecdotal,
disparate case studiesdisparate case studies Effect levees have on flooding is either: Effect levees have on flooding is either:
Excepted- “Hey it happens.” Excepted- “Hey it happens.” Or denied- “Heavy rains cause high stages.”Or denied- “Heavy rains cause high stages.”
Either way- Never been treated as a Either way- Never been treated as a hypothesis that has been tested on a hypothesis that has been tested on a broader scale.broader scale.
Difficult to study Difficult to study Floods don’t occur everyday (at least not yet!)Floods don’t occur everyday (at least not yet!) Need a plethora sites w/ 50 years or more of Need a plethora sites w/ 50 years or more of
recordrecord
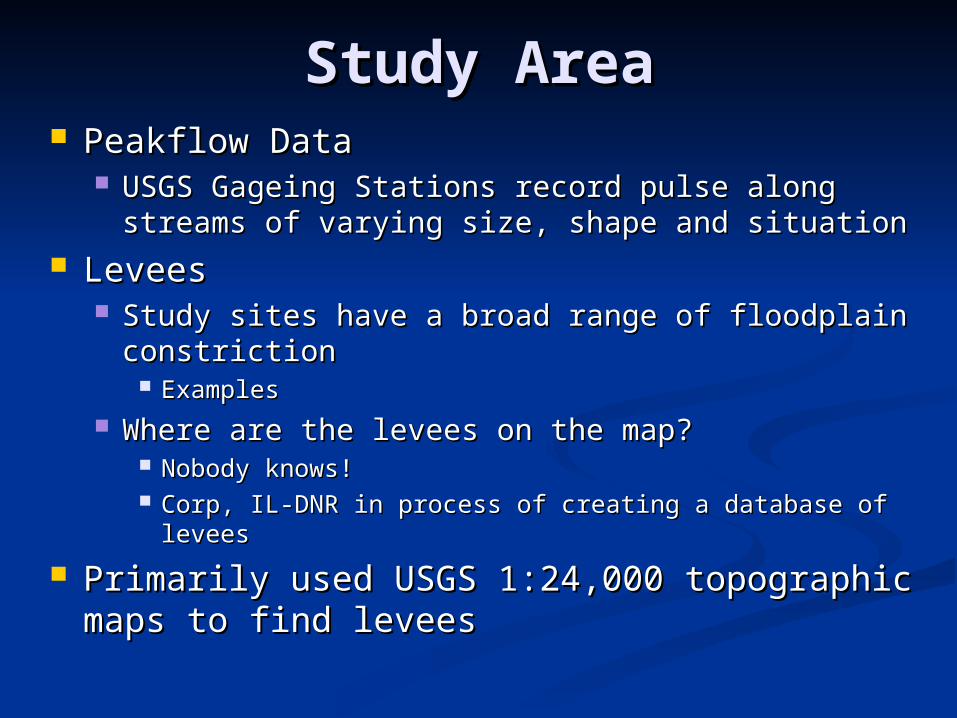
Study AreaStudy Area Peakflow DataPeakflow Data
USGS Gageing Stations record pulse along USGS Gageing Stations record pulse along streams of varying size, shape and situationstreams of varying size, shape and situation
LeveesLevees Study sites have a broad range of floodplain Study sites have a broad range of floodplain
constrictionconstriction ExamplesExamples
Where are the levees on the map? Where are the levees on the map? Nobody knows!Nobody knows! Corp, IL-DNR in process of creating a database of Corp, IL-DNR in process of creating a database of
leveeslevees
Primarily used USGS 1:24,000 topographic Primarily used USGS 1:24,000 topographic maps to find leveesmaps to find levees

MethodologyMethodology
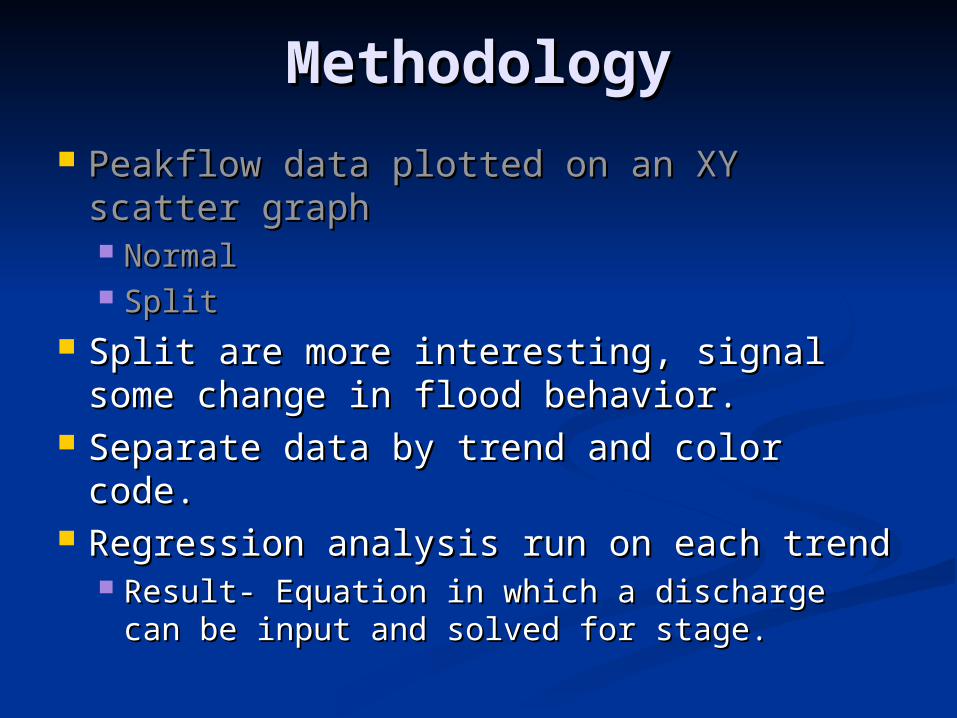
Peakflow data plotted on an XY Peakflow data plotted on an XY scatter graphscatter graph NormalNormal SplitSplit
U

MethodologyMethodology
Peakflow data plotted on an XY Peakflow data plotted on an XY scatter graphscatter graph NormalNormal SplitSplit
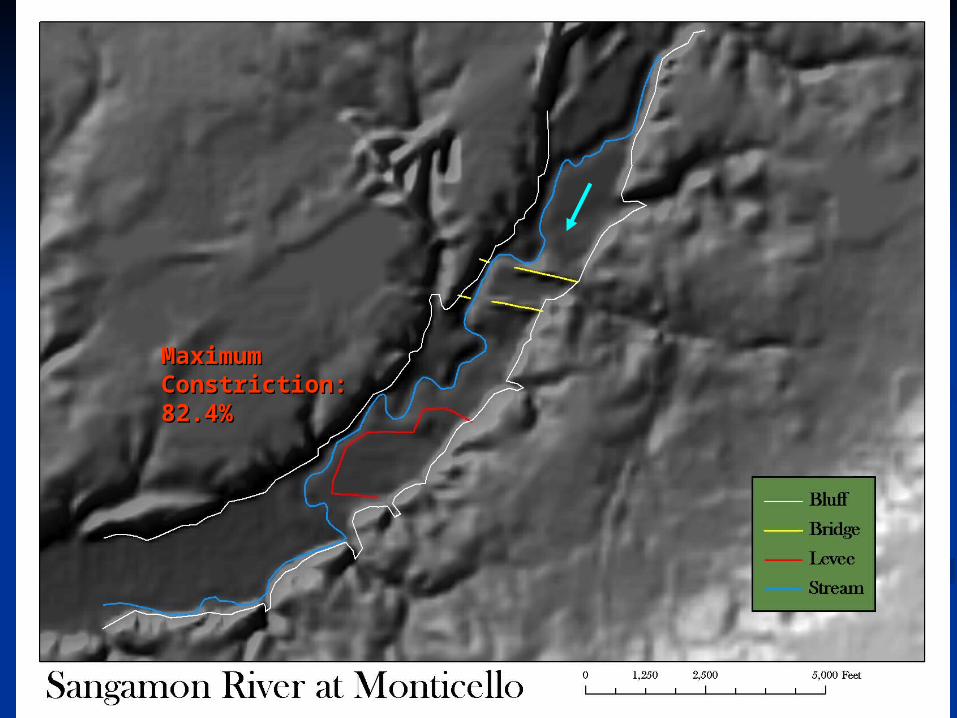
Maximum Maximum Constriction: Constriction: 82.4%82.4%
MethodologyMethodology
Peakflow data plotted on an XY scatter Peakflow data plotted on an XY scatter graphgraph NormalNormal SplitSplit
Split are more interesting, signal some Split are more interesting, signal some change in flood behavior.change in flood behavior.
Separate data by trend and color code.Separate data by trend and color code. Regression analysis run on each trendRegression analysis run on each trend
Result- Equation in which a discharge can Result- Equation in which a discharge can be input and solved for stage.be input and solved for stage.
ResultsResults
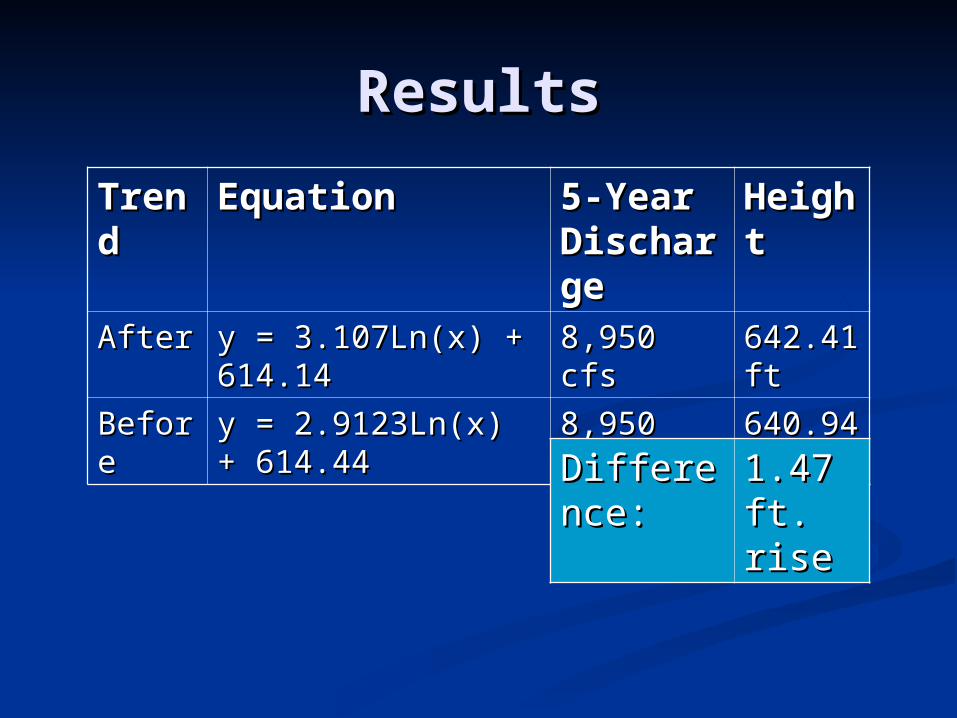
TrenTrendd
EquationEquation 5-Year 5-Year DischarDischargege
HeigHeightht
AfterAfter y = 3.107Ln(x) + y = 3.107Ln(x) + 614.14614.14
8,950 cfs8,950 cfs 642.41 642.41 ftft
BeforBeforee
y = 2.9123Ln(x) + y = 2.9123Ln(x) + 614.44614.44
8,950 cfs8,950 cfs 640.94 640.94 ftftDifferenDifferen
ce:ce:1.47 1.47 ft. ft. riserise
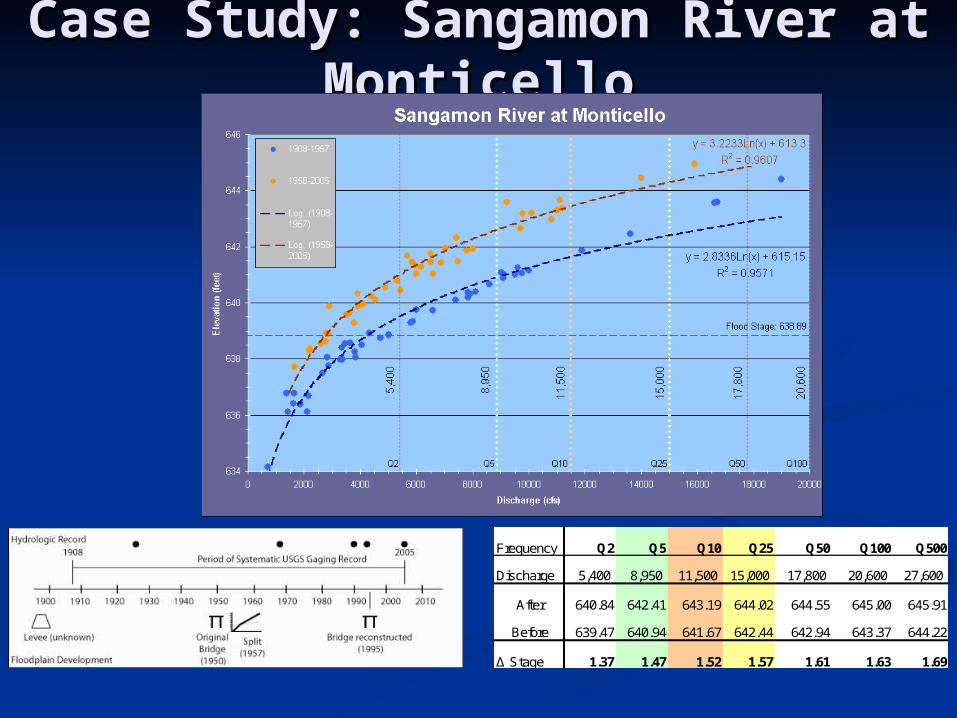
Case Study: Sangamon River at Case Study: Sangamon River at MonticelloMonticello
Frequency Q2 Q5 Q10 Q25 Q50 Q100 Q500
Discharge 5,400 8,950 11,500 15,000 17,800 20,600 27,600
After 640.84 642.41 643.19 644.02 644.55 645.00 645.91
Before 639.47 640.94 641.67 642.44 642.94 643.37 644.22
Δ Stage 1.37 1.47 1.52 1.57 1.61 1.63 1.69
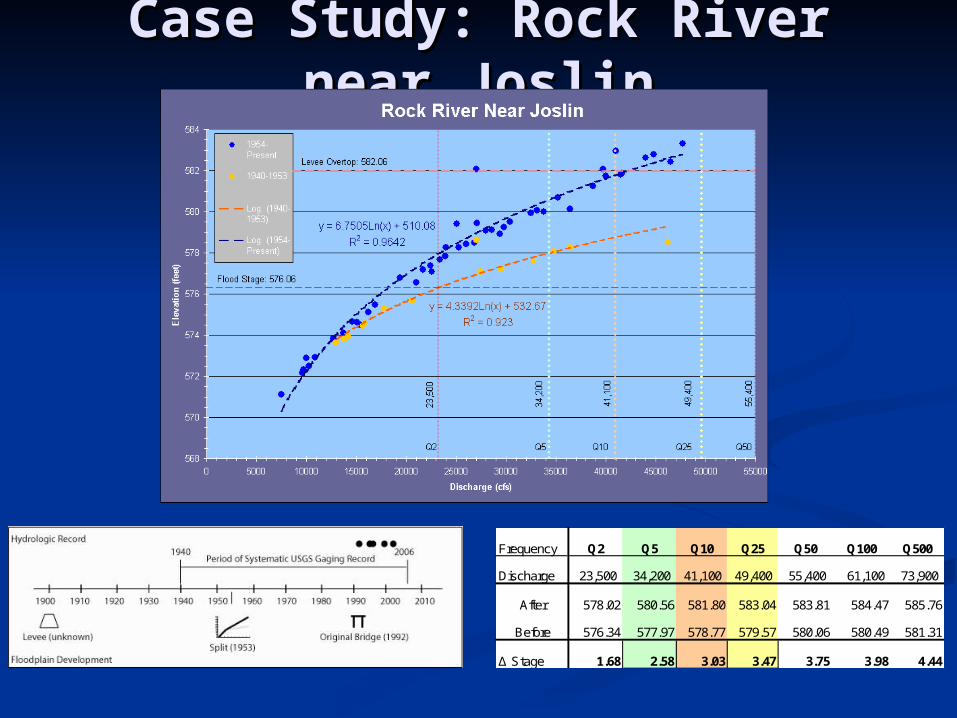
Case Study: Rock River Case Study: Rock River near Joslinnear Joslin
Frequency Q2 Q5 Q10 Q25 Q50 Q100 Q500
Discharge 23,500 34,200 41,100 49,400 55,400 61,100 73,900
After 578.02 580.56 581.80 583.04 583.81 584.47 585.76
Before 576.34 577.97 578.77 579.57 580.06 580.49 581.31
Δ Stage 1.68 2.58 3.03 3.47 3.75 3.98 4.44
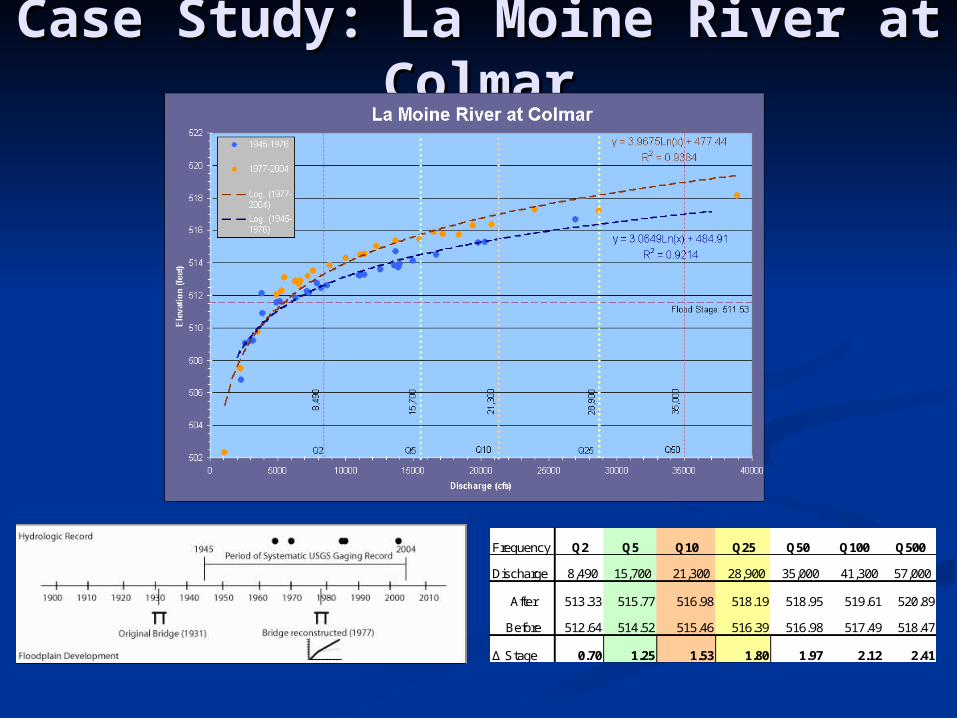
Case Study: La Moine River at Case Study: La Moine River at ColmarColmar
Frequency Q2 Q5 Q10 Q25 Q50 Q100 Q500
Discharge 8,490 15,700 21,300 28,900 35,000 41,300 57,000
After 513.33 515.77 516.98 518.19 518.95 519.61 520.89
Before 512.64 514.52 515.46 516.39 516.98 517.49 518.47
Δ Stage 0.70 1.25 1.53 1.80 1.97 2.12 2.41
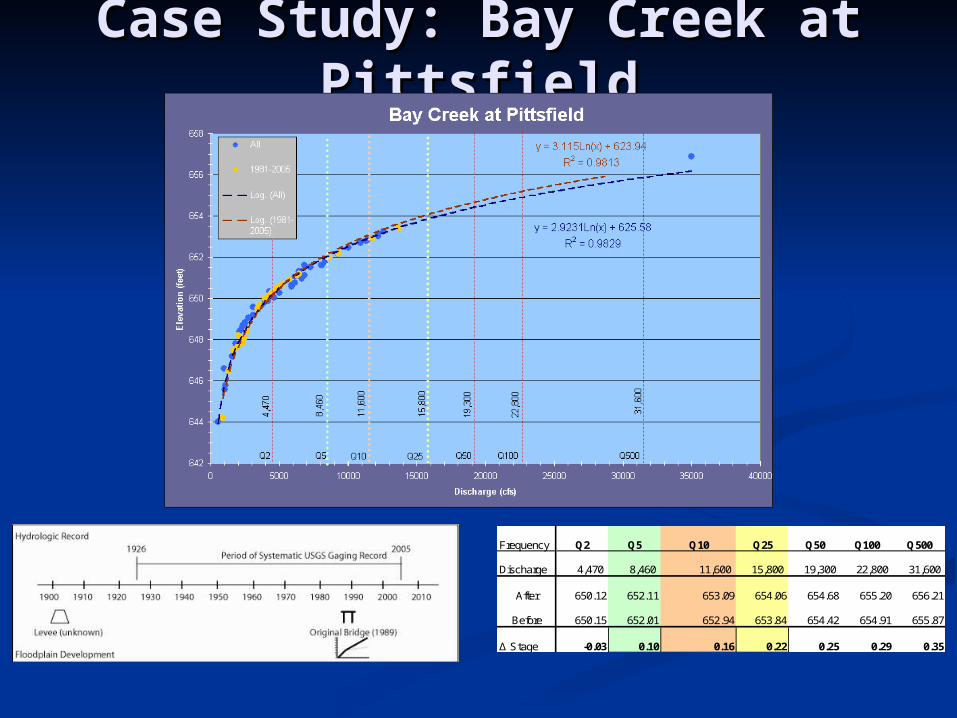
Case Study: Bay Creek at Case Study: Bay Creek at PittsfieldPittsfield
Frequency Q2 Q5 Q10 Q25 Q50 Q100 Q500
Discharge 4,470 8,460 11,600 15,800 19,300 22,800 31,600
After 650.12 652.11 653.09 654.06 654.68 655.20 656.21
Before 650.15 652.01 652.94 653.84 654.42 654.91 655.87
Δ Stage -0.03 0.10 0.16 0.22 0.25 0.29 0.35
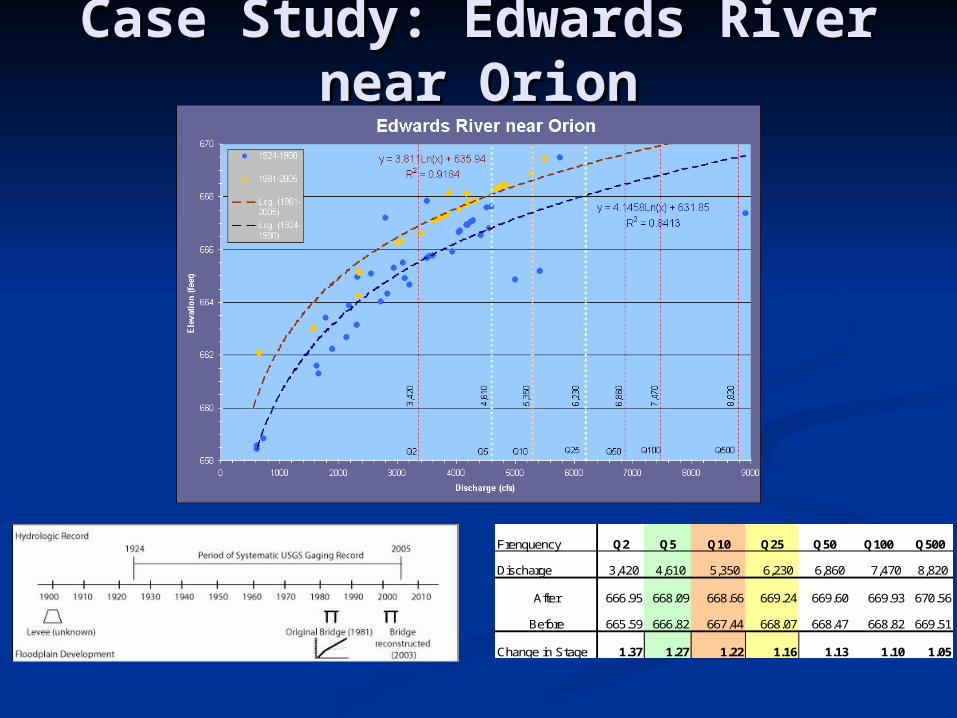
Case Study: Edwards River Case Study: Edwards River near Orionnear Orion
Frenquency Q2 Q5 Q10 Q25 Q50 Q100 Q500
Discharge 3,420 4,610 5,350 6,230 6,860 7,470 8,820
After 666.95 668.09 668.66 669.24 669.60 669.93 670.56
Before 665.59 666.82 667.44 668.07 668.47 668.82 669.51
Change in Stage 1.37 1.27 1.22 1.16 1.13 1.10 1.05
ImplicationsImplications
Quantification of stage increase after Quantification of stage increase after a levee is constructed a levee is constructed
Becomes a model to predict stage Becomes a model to predict stage increase based on percentage of increase based on percentage of constriction and stream magnatudeconstriction and stream magnatude
Future ResearchFuture Research
Model to predict stage increases for Model to predict stage increases for any point of a stream based on any point of a stream based on discharge and constriction.discharge and constriction.
GIS projectGIS project Method to calculate and map Method to calculate and map
constrictions due to leveesconstrictions due to levees Summer workSummer work
GIS Final ProjectGIS Final ProjectSpring 2007Spring 2007
Goal: A method and map showing percent constriction of a floodplain by levees.
Study Area: Whiteside County Illinois USGS did a pilot study to locate
and digitize levees.
FINFIN
Questions? Comments?
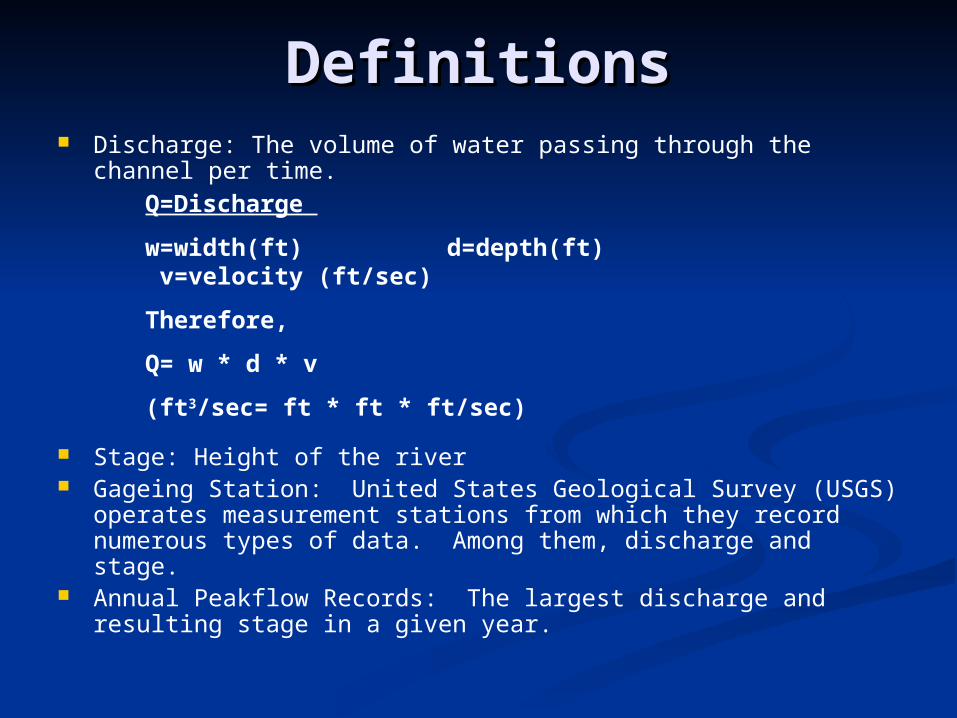
Discharge: The volume of water passing through the channel per time.
Stage: Height of the river Gageing Station: United States Geological Survey (USGS)
operates measurement stations from which they record numerous types of data. Among them, discharge and stage.
Annual Peakflow Records: The largest discharge and resulting stage in a given year.
DefinitionsDefinitions
Q=Discharge
w=width(ft) d=depth(ft) v=velocity (ft/sec)
Therefore,
Q= w * d * v
(ft3/sec= ft * ft * ft/sec)
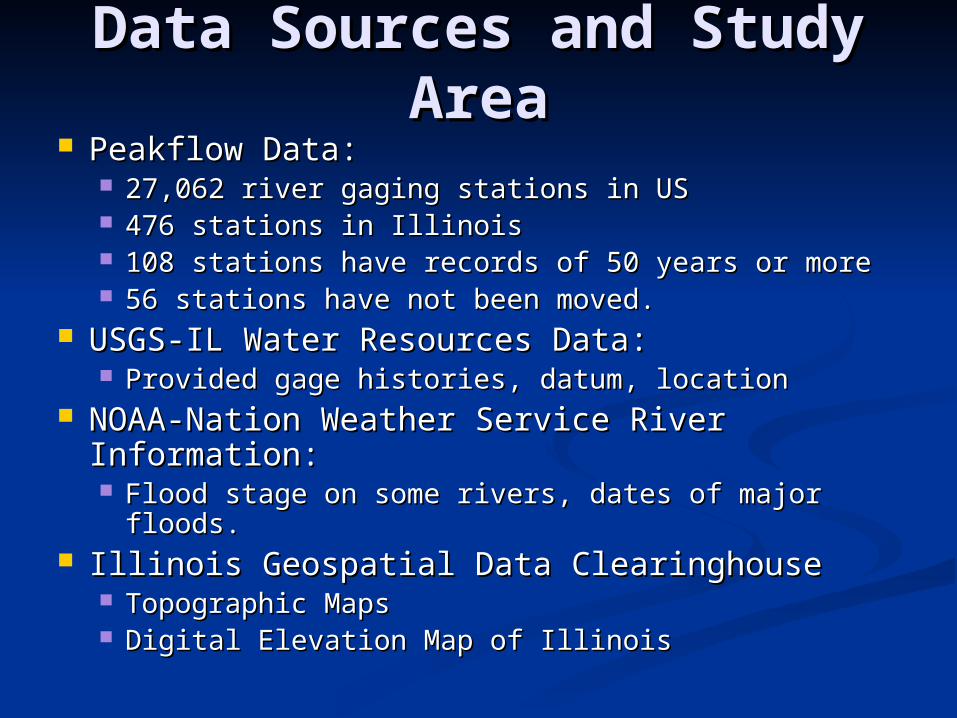
Data Sources and Study Data Sources and Study AreaArea
Peakflow Data: Peakflow Data: 27,062 river gaging stations in US 27,062 river gaging stations in US 476 stations in Illinois476 stations in Illinois 108 stations have records of 50 years or more108 stations have records of 50 years or more 56 stations have not been moved.56 stations have not been moved.
USGS-IL Water Resources Data:USGS-IL Water Resources Data: Provided gage histories, datum, locationProvided gage histories, datum, location
NOAA-Nation Weather Service River NOAA-Nation Weather Service River Information:Information: Flood stage on some rivers, dates of major floods.Flood stage on some rivers, dates of major floods.
Illinois Geospatial Data ClearinghouseIllinois Geospatial Data Clearinghouse Topographic MapsTopographic Maps Digital Elevation Map of IllinoisDigital Elevation Map of Illinois
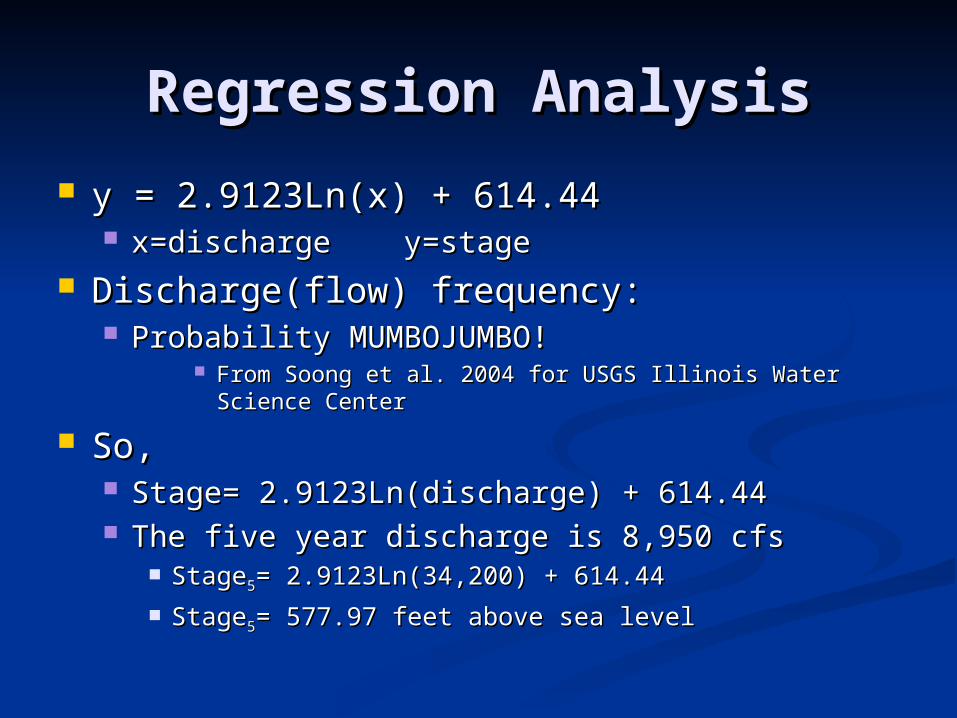
Regression AnalysisRegression Analysis
y = 2.9123Ln(x) + 614.44y = 2.9123Ln(x) + 614.44 x=discharge y=stagex=discharge y=stage
Discharge(flow) frequency: Discharge(flow) frequency: Probability MUMBOJUMBO!Probability MUMBOJUMBO!
From Soong et al. 2004 for USGS Illinois Water Science From Soong et al. 2004 for USGS Illinois Water Science CenterCenter
So,So, Stage= Stage= 2.9123Ln(discharge) + 614.442.9123Ln(discharge) + 614.44 The five year discharge is 8,950 cfsThe five year discharge is 8,950 cfs
StageStage55= 2.9123Ln(34,200) + 614.44= 2.9123Ln(34,200) + 614.44
StageStage55= 577.97 feet above sea level= 577.97 feet above sea level