Embed Size (px)
Citation preview
i
QUANTIFICATION OF HYDROGEN CYANIDE GENERATED AT LOW
TEMPERATURE O-CHLOROBENZYLIDENE MALONONITRILE (CS) DISPERSAL
by
Major Erin Johnson-Kanapathy
Thesis submitted to the Faculty of the PMB Graduate Program
Uniformed Services University of the Health Sciences In partial fulfillment of the requirements for the degree of
Master’s of Science of Public Health
UNIFORMED SERVICES UNIVERSITY, SCHOOL OF MEDICINE GRADUATE PROGRAMS
Graduate Education Office (A 1045), 4301 Jones Bridge Road, Bethesda, MD 20814
DISSERTATION APPROVAL FOR THE MASTER IN SCIENCE IN PUBLIC HEAL TH DISSERTATION IN THE PREVENTIVE MEDICINE AND BIOMETRICS GRADUATE PROGRAM
Title of Dissertation: "Quantification of Hydrogen Cyanide at Low Temperature CS Dispersal"
Name of Candidate: MAJ Erin Johnson-Kanapathy Master of Science in Public Health Degree May 10, 2013
DISSERTATION AND ABSTRACT APPROVED:
,,,,,. -r ·2tV.? {,_ic;_·J t(f1tfi
CDR Micha . St. Jr: DEPARTMENT OF PREVENTIVE MEDICINE AND BIOMETRICS Dissertation Advisor
I . / I ' ' i c /l,\·' t ., rJ,("''""v f •
Dr. Jennifer RUierts -:i\1s\JL'd
DEPARTMENT OF PREVENTIVE MEDICINE AND BIOMETRICS Committee Member
Eleanor S. Metcalf, Ph.D., Associate Dean www.usuhs.rnil/graded ii [email protected]
Toll Free: 800 772-1747 Comrnerc1al: 301·295-3913 I 9474 : DSN· 295-9474 !I Fax: 301-295-6772
---···········--·-----~·--
The author hereby certifies that the use of any copyrighted material in the thesis manuscript entitled:
"QUANTIFICATION OF HYDROGEN CYANIDE GENERATED AT LOW TEMPERATURE
0-CHLOROBENZYLIDENE MALONONITRILE (CS) DISPERSAL"
is appropriately acknowledged and, beyond brief excerpts, is with the permission of the copyright owner.
Erin Johnson-Kanapathy MSPH, PMB Uniformed Services University May 28, 2013
iii
ACKNOWLEDGMENTS
I would like to acknowledge the following persons and agencies:
·MAJ Joseph Hout for his mentorship, guidance, and support.
·My Thesis Committee (CDR Michael Stevens, LTC Alex Stubner, Dr.
Jennifer Roberts) for their guidance and support
·U.S. Army Public Health Command for funding, support, and laboratory
analysis.
·Dr. Chuck Stoner for his assistance with the sampling analysis.
·Navy & Marine Corps Public Health Center Consolidated Industrial
Hygiene Laboratory Detachment Norfolk (CIHL) for funding and
laboratory analysis support.
·CBRNE Staff, EMS, Industrial Hygiene Section, Preventive Medicine
Division Fort Jackson, SC for their support and assistance during the
onsite field sampling.
·Dr Cara Olsen for her assistance in biostatistical analysis.
·Uniformed Services University for funding.

iv
DEDICATION
This thesis is dedicated to Edgar, my husband, and my two children Eli and Elin.
Without their love and support, the completion of this research would not have been
possible.

---···········--·-----~·--
The author hereby certifies that the use of any copyrighted material in the thesis manuscript entitled:
"QUANTIFICATION OF HYDROGEN CYANIDE GENERATED AT LOW TEMPERATURE
0-CHLOROBENZYLIDENE MALONONITRILE (CS) DISPERSAL"
is appropriately acknowledged and, beyond brief excerpts, is with the permission of the copyright owner.
Erin Johnson-Kanapathy MSPH, PMB Uniformed Services University May 28, 2013
vi
ABSTRACT
Quantification of Hydrogen Cyanide Generated at Low Temperature O-
Chlorobenzylidene malononitrile (CS) Dispersal
Erin Johnson-Kanapathy, MSPH, 2013
Thesis directed by: Michael Stevens, Ph.D., Department of Preventive Medicine and
Biometrics
Hydrogen cyanide (HCN) is an acutely toxic airborne chemical compound
[Immediately Dangerous to Life or Health (IDLH) 50 parts per million (ppm)] and has
been previously determined to be a thermal degradation by-product of the riot control
agent o-chlorobenzylidene malononitrile (CS). Previous research and studies conducted
by U.S. Army and Air Force in mask confidence chambers demonstrated quantifiable
airborne HCN levels released into the atmosphere at CS combustion temperatures of 350
to ~800ºC. Presently, many CS confidence chambers exist in the military for training
purposes and CS thermal combustion (aerosolization) processes are known to vary
widely amongst these different sites. As such, the combustion temperature achieved may
be impacted, and thus, the airborne concentration of HCN generated may be impacted,
creating a potentially higher or lower HCN level depending on the combustion
temperature. Given this procedural variability, this study focused on determining the
range of combustion temperatures in which HCN is generated. Particular focus centered
on identifying if HCN is generated at combustion temperatures as low as 100 ºC and if
vii
the levels quantified exceed established occupational exposure limits (OEL), such as the
NIOSH Recommended Exposure Level (REL)-Short Term Exposure Limit (STEL) of 4.7
ppm, and Military Exposure Guidelines (MEGs). This study quantified airborne HCN
levels generated in both the field, at live CS training events at Ft. Jackson, SC, and in the
laboratory using a tube furnace operated at discrete CS combustion temperatures over a
range of 100 ºC to 350 ºC. Study findings indicate that HCN is quantifiable even at 100
ºC, much lower than previously hypothesized, but well below the OEL and MEGs.
Findings may assist in standardizing DoD doctrinal policies related to thermal
combustion processes within CS chambers.
viii
TABLE OF CONTENTS
LIST OF TABLES ...................................................................................................................................... x LIST OF FIGURES ................................................................................................................................... xi CHAPTER 1: Introduction ...................................................................................................................... 1 Background ............................................................................................................................................. 1 Research Objectives ............................................................................................................................. 4 Aim #1 .................................................................................................................................................. 4 Aim #2 .................................................................................................................................................. 4
CHAPTER 2: Literature Review ........................................................................................................... 6 Chemical Properties and Health Effects ...................................................................................... 6 Previous Research on HCN Generation from CS Combustion ........................................ 10
CHAPTER 3: Methods and Materials ............................................................................................. 16 Chamber Regulations ....................................................................................................................... 16 Observed Mask Confidence Chamber Exercise Procedure .............................................. 17 Soldier Grouping (Companies and Platoons) and Chamber Description ............. 18 Exposure Source ............................................................................................................................ 19 Chamber Exercise (Route of Exposure) .............................................................................. 23
Chamber Sampling ............................................................................................................................ 26 Tube Furnace ....................................................................................................................................... 31 Quantitative Analysis .................................................................................................................. 31 Analysis Methods .......................................................................................................................... 33
CHAPTER 4: Results ............................................................................................................................. 34 Chamber ................................................................................................................................................. 34 Overview Results .......................................................................................................................... 34 Modified Wald’s Confidence Interval ................................................................................... 35
Tube Furnace ....................................................................................................................................... 36 Overview Results .......................................................................................................................... 36 Means and Confidence Intervals ............................................................................................ 39 HCN Regression Analysis and Correlations ....................................................................... 39 Particulate CN Linear Regression and Correlations ...................................................... 44 Vapor HCN and Particulate CN Relationship .................................................................... 46 Qualitative Linear Regression and Correlations ............................................................. 47
CHAPTER 5: Discussion ...................................................................................................................... 49 Chamber Sampling ............................................................................................................................ 49 Standards Comparisons ............................................................................................................. 49 Comparison to Past Research .................................................................................................. 52
ix
Limitations ....................................................................................................................................... 53 Tube Furnace ....................................................................................................................................... 54 Observations ................................................................................................................................... 54 Quantification ................................................................................................................................. 55 HCN Degraded from Malononitrile ....................................................................................... 57 HCN Degraded Directly from CS ............................................................................................. 58 Carbon Dioxide Generation ...................................................................................................... 59 Comparison Quantitative to Preliminary Qualitative Data ......................................... 60 Limitations ....................................................................................................................................... 61
CHAPTER 6: Conclusion and Future Research ......................................................................... 63 Conclusion ............................................................................................................................................. 63 Potential Future Research ............................................................................................................. 64 Qualitative and Quantitative Analysis of HCN at Generation Temperatures Below the Melting Point of CS ................................................................................................. 64 Differences in CS Degradation at ≤225 ºC versus ≥250 ºC ......................................... 64 Direct Measurement of HCN in Tube Furnace .................................................................. 64 Field Sampling <200 ºC .............................................................................................................. 65 Quantification with SPME/Comparison to NIOSH Method Results ........................ 65 Other Methods of Quantification ............................................................................................ 65 Biomarkers of exposure ............................................................................................................. 65 Quantification of Malononitrile .............................................................................................. 66 Carbon Dioxide Generation at CS Dispersal Temperature Range 100-‐250 ºC ... 66
APPENDIX A .............................................................................................................................................. 67 Field Sample Results ......................................................................................................................... 67 Tube Furnace Sample Results ...................................................................................................... 70
REFERENCES ............................................................................................................................................ 72
x
LIST OF TABLES
Table 2-‐1: Previous Research Overview ...................................................................................... 15 Table 3-‐1 Overview Sample Size ...................................................................................................... 30 Table 4-‐1 Field Samples Above LOQ Sample Result ................................................................ 34 Table 4-‐2 Field Samples Above LOQ Sample Results .............................................................. 35 Table 4-‐3 Modified Wald Method Confidence Intervals ........................................................ 35 Table 4-‐4 Laboratory NIOSH Method 6010 Results Vapor HCN ........................................ 37 Table 4-‐5 Laboratory NIOSH Method 6010 Results Particulate CN ................................. 38 Table 4-‐6 Tube Furnace Quantitative Analysis Mean and 95% Confidence Interval
for Vapor HCN ................................................................................................................................ 39 Table 4-‐7 Tube Furnace Quantitative Analysis Mean and 95% Confidence Interval
for Particulate CN .......................................................................................................................... 39 Table 4-‐8 Vapor HCN Linear Regression ...................................................................................... 40 Table 4-‐9 Multiple Comparisons Tukey HSD .............................................................................. 41 Table 4-‐10 Particulate CN Linear Regression ............................................................................ 45 Table 4-‐11 Vapor HCN versus Particulate CN Bar Graph Comparison ........................... 46 Table 4-‐12SPME Log Adjusted Linear Regression ................................................................... 47 Table 5-‐1 Military Exposure Guidelines ....................................................................................... 49 Table 5-‐2 Acute Exposure Guideline Levels ................................................................................ 50 Table 5-‐3 Result Comparison ............................................................................................................ 51 Table 5-‐4 Result Comparison ............................................................................................................ 51 Table 5-‐5 Comparison to Previous HCN Quantification Studies Using NIOSH Methods
in the Collection and Analysis of Field Samples ............................................................... 53 Table 5-‐6 Tube Furnace Quantitative Analysis Mean Concentration and 95%
Confidence Interval for Vapor HCN ....................................................................................... 56 Table 5-‐7 Tube Furnace Quantitative Analysis Mean and 95% Confidence Interval
for Particulate CN .......................................................................................................................... 57 Table 5-‐8 Quantitative Data Compared to Qualitative Data ................................................. 60 Table A-‐1: Field NIOSH Method 6010 15 minute sample results ..................................... 67 Table A-‐2: Field NIOSH Method 6010 Blanks ............................................................................ 68 Table A-‐3: Field NIOSH Method 6010 CBRNE NCO samples .............................................. 68 Table A-‐4: Field NIOSH Method 6010 Consecutive Companies Samples ...................... 69 Table A-‐5: Field NIOSH Method 6010 CIHL Samples ............................................................. 69 Table A-‐6 Laboratory NIOSH Method 6010 Results Vapor HCN ........................................ 70 Table A-‐7 Laboratory NIOSH Method 6010 Results Particulate CN ................................. 70 Table A-‐8 Laboratory NIOSH Method 6010 Blanks ................................................................. 71
xi
LIST OF FIGURES
Figure 2-‐ 1: CS hydrolyzed to malononitrile and 2-‐chlorobenzaldehyde ........................ 6 Figure 2-‐2: Hydrogen Cyanide ............................................................................................................ 8 Figure 2-‐3 CS degraded to 3-‐(2-‐chlorophenyl) propynenitrile .......................................... 13 Figure 3-‐1 Chamber Layout ............................................................................................................... 18 Figure 3-‐2 Chamber Setup Looking “Downwind” Towards Exit ........................................ 20 Figure 3-3 Coffee Can on Hotplate .................................................................................................... 20 Figure 3-4 CS Capsules .......................................................................................................................... 21 Figure 3-‐5 CS Placed Into Coffee Can ............................................................................................. 21 Figure 3-6 CS Hand Held Fan .............................................................................................................. 22 Figure 3-‐7 CS Hand Held Fan Dispersal ........................................................................................ 22 Figure 3-‐8 Chamber Entry Preparation ........................................................................................ 23 Figure 3-9 Chamber Entry ..................................................................................................................... 24 Figure 3-‐10 Initial Line Up Inside Chamber ................................................................................ 24 Figure 3-11 Instruction of Chamber Exercise to Soldiers ........................................................... 25 Figure 3-‐12 Preparation for Mask Removal ................................................................................ 25 Figure 3-‐13 Mask Removal ................................................................................................................. 26 Figure 3-‐14 Chamber Exit ................................................................................................................... 26 Figure 3-‐15 Sample Train ................................................................................................................... 28 Figure 3-‐16 Sample Set Up In Confidence Chamber ................................................................ 28 Figure 3-‐17 Tube Furnace .................................................................................................................. 31 Figure 5-‐1 Potential Pathway HCN Genetration from Malononitrile ............................... 58 Figure 5-‐2 Potential Pathway for HCN Generation from CS ................................................. 59 Figure 5-‐3 Possible Mechanism for Release of CO2 .................................................................. 60
1
CHAPTER 1: Introduction
BACKGROUND O-Chlorobenzylidene malononitrile, C10H5ClN2, (CS) was first developed in 1928
by two scientists in Great Britain, Corson and Stoughton, but it was not until 1959 that
CS was adopted as the U.S. Army’s riot control agent (RCA) of choice, replacing
chloroacetophenone.(35) In comparison to chloroacetophenone, CS was found to have a
lower threshold of incapacitation [5 milligrams per cubic meter (mg/m3) for CS and 35
mg/m3 for chloroacetophenone], greater speed of symptom onset, lower toxicity
(estimated lethal dose for CS 60 x 103 mg min/m3 and 10 x 103 mg min/m3 for
chloroacetophenone), less damage to eyes, and a decrease in severe contact
dermatitis.(19) Over 50 years later, CS is still used by civilian law enforcement as a riot
control agent and in the military as both a riot control agent and a training aid for the use
of the currently used military gas mask, the M40 Protective Mask.(35)
CS is an effective irritant and lachrymator that produces a stinging/burning
sensation on exposed skin, heavy production of nasal and sinus mucous, salivation,
coughing, and intense burning sensation of the eyes at what is considered training
concentrations of 1-3 mg/m3 [0.9-2.7 parts per million (ppm)].(2) Higher levels of
exposure [5-10 mg/m3 (4.5-9 ppm)] may produce nausea, vomiting, and increased
irritation of skin in addition to the aforementioned effects. The effects of CS exposure
continue until removal from contaminated atmosphere and generally resolves after 10
minutes of exposure to fresh air.(2) One aspect of the use of training concentrations of
CS is that in normal, healthy persons the effects are temporary. However, in the case of
persons that are affected by asthma, high blood pressure, cardiovascular problems, lung
2
congestion and even a common cold, they can experience an increase in adverse effects
and recovery time may increase.(2)
In military mask confidence training exercises, CS is vaporized by heat (methods
such as propane burners, hotplates, and oxidizing candles are used to generate the heat for
CS combustion) followed by condensation to an aerosol and assisted in dispersal through
the chamber by fans.(35) CS is also able to be dispersed using pyrotechnic mixtures in
burning grenades.(2) Within the last decade, there has been an increase in interest and
concern over the airborne concentration of CS and the thermally generated CS by-
products during training exercises, as indicated by an increase in research within this area
of interest.(16; 17; 20; 21; 35) An impetus for this increased attention on chamber safety
stemmed from an incident where two young officers died from cardiac related issues
shortly after participating in a mask confidence chamber exercise.(41)
Subsequent to this incident, research had hypothesized and found potentially
harmful thermal degradation products at predicted and non-predicted temperatures.(16;
20; 21) Some of the CS by-products that are formed during the thermal aerosolization of
CS have been previously determined and include potentially harmful compounds such as
HCN and malononitrile.(12; 14; 16; 20; 21; 23; 31) These by-products may be more
hazardous than CS, depending on concentration and exposure duration. Previous
research has explored several areas of this problem, with focus on temperature ranges of
CS dispersal. Qualitative analysis of the compounds that are formed during high
temperature CS dispersal (>300 ºC) has been conducted. In addition, quantification of
CS high temperature dispersal by-products such as hydrogen cyanide (HCN) has also
been performed for dispersal temperatures greater than 350 ºC.(14; 20; 21) Efforts
3
researching by-products created as a result of relatively low temperature (<300 ºC) CS
dispersal by Hout et al. have also been performed.(16; 17)
Combined qualitative results from Hout et al. (<300 ºC) and Kluchinsky et al.
(>300 ºC) indicated at least 17 different compounds being identified as produced within a
range of 150-750 ºC.(16; 20) Of these compounds identified, HCN is a significant
compound of human health concern due to its acute toxicity (estimated human LC50 is
546 ppm at 10 minutes of continuous exposure).(5)
While the temperature threshold of several by-products generated has been
investigated and identified, HCN is still unknown. Knowledge of HCN and these other
thermal degradation by-products of CS and the quantification of exposure have both
military and law enforcement relevance. From a militarily standpoint, every soldier must
go through an initial mask confidence chamber exercise to meet basic training
requirements and then must periodically complete chamber training at various time
intervals throughout their respective military careers. Personnel in certain occupational
specialties conduct the training on a more regular, frequent basis for longer duration of
exposure than what other military personnel would be exposed.(2-4; 7; 18) While there
are general required procedures which are implemented at each training site (such as the
amount of CS capsules used), differences in the temperature of CS dispersal (sites may
combust CS below the researched temperatures of ≥350 ºC) and specific procedures vary
(such as the heating instrument).(2-4; 7; 18) The field sampling portion of this study
occurred at Fort Jackson, SC, an Army basic training base, which used a low temperature
of CS dispersal (200 ºC).
4
RESEARCH OBJECTIVES This research focused on the production of HCN at low temperature CS dispersal,
specifically on determining the low temperature threshold in which the CS degradation
by-product, HCN, is generated during CS thermal dispersal, as well as the quantification
of HCN over a range of relatively low CS combustion temperatures in the laboratory.
Additionally, to characterize the potential airborne HCN exposure risk to Soldiers, the
quantification results of HCN samples taken within the Ft. Jackson, SC chamber and their
respective times of exposure were compared to published human health guidelines.
These guidelines included the U.S. Army Public Health Center’s Military Exposure
Guidelines (MEGs)(39), the Environmental Protection Agency’s (EPA) Acute Exposure
Guideline Levels (AEGLs)(40), the National Institute for Occupational Safety and Health
(NIOSH) Recommended Exposure Limit (REL)-Short Term Exposure Level (STEL)(27),
along with the American Conference of Government Industrial Hygienists (ACGIH)
Ceiling Limits(5). A desired benefit of this study would include the determination of a
temperature range of CS dispersal which would generate airborne levels of HCN well
below these established occupational exposure limits.
Aim #1 Quantify HCN during U.S. Army Mask Confidence Training exercises at Ft.
Jackson, SC, a primary training base for the U.S. Army basic trainees, to provide “real
world” observations of HCN concentrations at low temperature CS dispersal (<350 ºC)
within an actual CS training chamber.
Aim #2 Determine the airborne concentrations of HCN generated when utilizing a
commercially available tube furnace over a range of relatively low dispersal temperatures

5
for CS. The temperature range used for the tube furnace experiment have not been
previously investigated (100-350 ºC).
6
CHAPTER 2: Literature Review
CHEMICAL PROPERTIES AND HEALTH EFFECTS
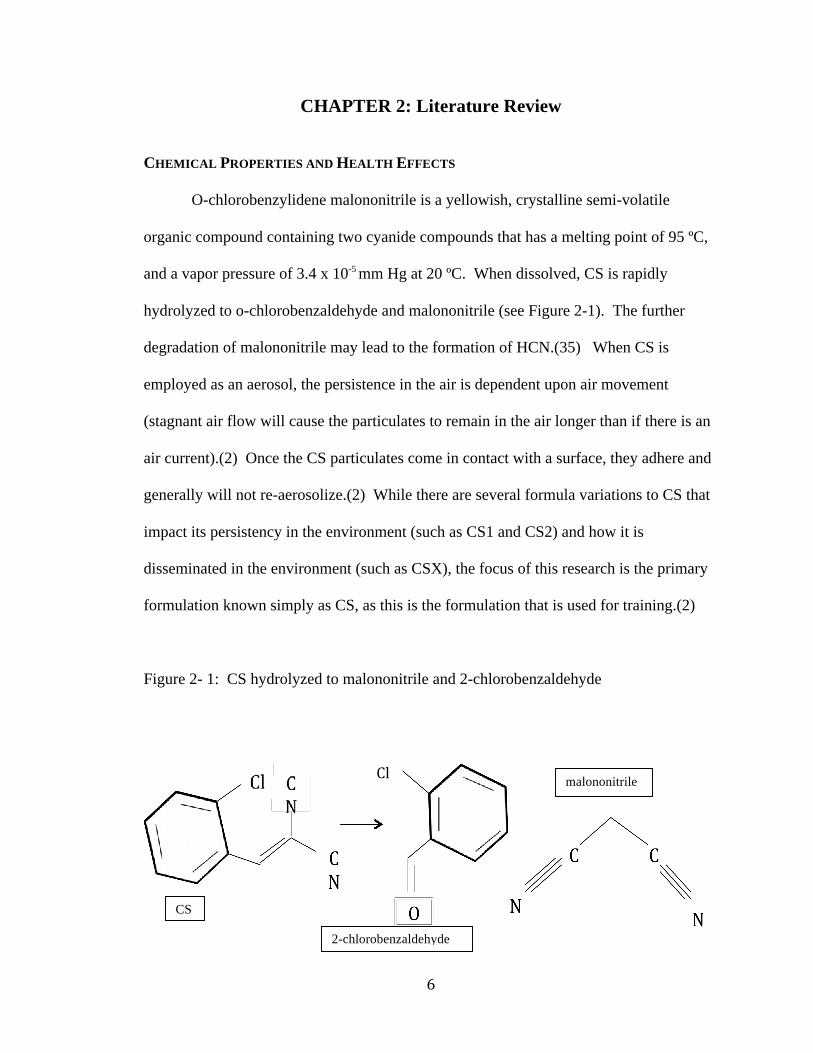
O-chlorobenzylidene malononitrile is a yellowish, crystalline semi-volatile
organic compound containing two cyanide compounds that has a melting point of 95 ºC,
and a vapor pressure of 3.4 x 10⁻⁵ mm Hg at 20 ºC. When dissolved, CS is rapidly
hydrolyzed to o-chlorobenzaldehyde and malononitrile (see Figure 2-1). The further
degradation of malononitrile may lead to the formation of HCN.(35) When CS is
employed as an aerosol, the persistence in the air is dependent upon air movement
(stagnant air flow will cause the particulates to remain in the air longer than if there is an
air current).(2) Once the CS particulates come in contact with a surface, they adhere and
generally will not re-aerosolize.(2) While there are several formula variations to CS that
impact its persistency in the environment (such as CS1 and CS2) and how it is
disseminated in the environment (such as CSX), the focus of this research is the primary
formulation known simply as CS, as this is the formulation that is used for training.(2)
Figure 2- 1: CS hydrolyzed to malononitrile and 2-chlorobenzaldehyde
malononitrile
2-chlorobenzaldehyde
CS
Cl
7
CS has known acute effects on skin, eyes and the respiratory system; creating a
stinging/burning of skin, severe burning sensation of the eyes, copious quantities of
mucous generated in the nose and sinus cavities, coughing, dyspnea, and chest tightness
at levels around 1-3 mg/m3 (0.9-2.7 ppm) (this concentration range is considered to be the
level recommended for training concentrations per Department of the Army Field Manual
3-11.11 Flame, Riot Control, and Herbicide Operations).(2; 35) The National Institute of
Health’s (NIH) TOXNET database also notes cardiovascular, gastrointestinal, renal, and
hepatic effects.(24) While these effects may occur at higher levels of exposure, sensitive
individuals (for example those with preexisting conditions such as respiratory and
cardiovascular conditions) may experience the more severe effects even at lower
concentrations than 1-3 mg/m3 (0.9-2.7 ppm).(2) The Occupational Safety and Health
Administration (OSHA) has set an 8 hour Time Weighted Average (TWA) of 0.05 ppm
(0.39 mg/m3) based upon eye and skin irritation and the Immediately Dangerous to
Health and Life level was set at 2 mg/m3 (0.26 ppm) based upon studies conducted by
Punte et al. that demonstrated that the majority of exposed humans would not be able to
tolerate levels in excessive of 2-10 mg/m3 (0.26-1.3 ppm) for 2 minutes of exposure.(9;
10; 33) The Threshold Limit Value-Ceiling (TLV-C) of 0.05 ppm (0.39 mg/m3) was
developed by the American Conference of Governmental Industrial Hygienists (ACGIH)
to address and minimize eye and respiratory tract irritation, dermal sensitizations,
headaches, and prevent respiratory epithelium damage.(6) Increases in humidity and
temperature creates an increased effect on the skin, potentially from an increase in rate of
hydrolysis and opening of pores on the skin creating an increase in surface area of skin
exposed; an important note to consider when evaluating military training dermal
8
exposures.(33) In military mask confidence training exercises, CS is vaporized by heat
followed by condensation to an aerosol and assisted in dispersal through the chamber by
fans.(35) It is this heat dispersal that serves as a catalyst for the formation of by-
products.(20)
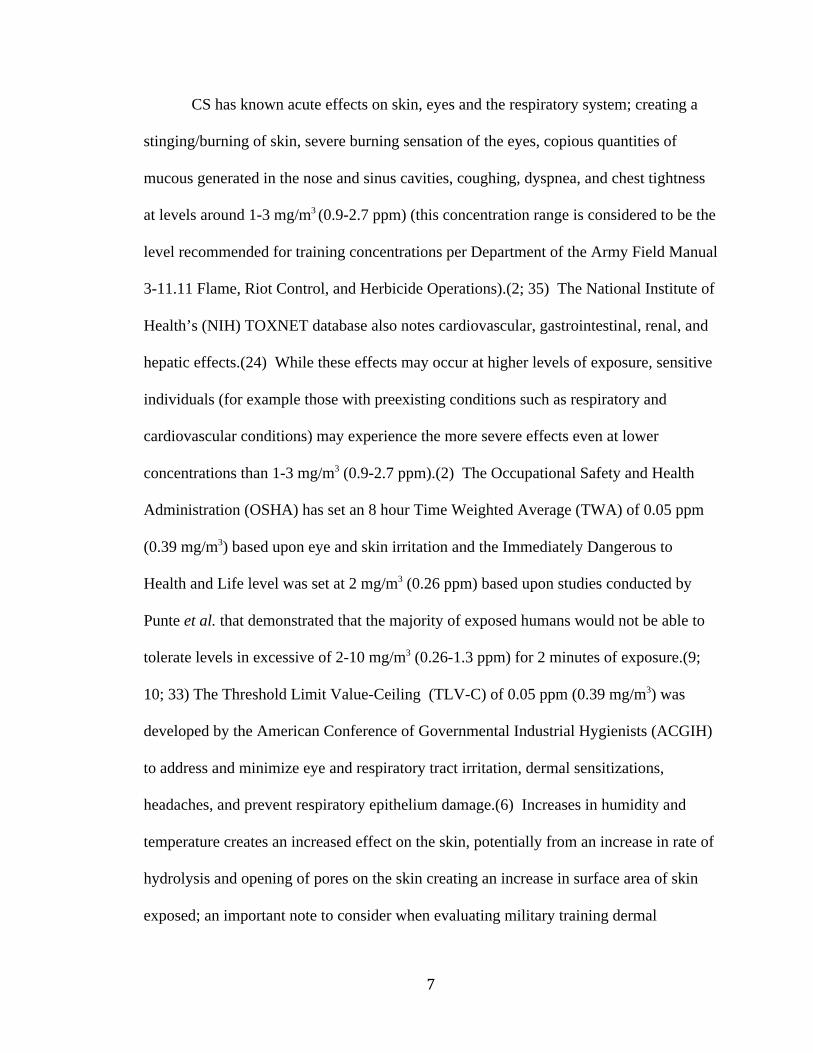
Hydrogen cyanide is a thermal degradation by-product of CS and is a low
molecular weight, volatile, colorless gas with a vapor density of 0.941 and vapor pressure
of 630 mm Hg at 20 ºC (see Figure 2-2).(5; 8) HCN has a faint bitter almond odor that
not all persons can detect.(5) Volatilization is significant for the degradation of HCN
from surfaces and soil. While highly diffusive when in the atmosphere, HCN slowly
degrades (1.4-2.9 years atmospheric half-life and is resistant to photolysis) and can
potentially be transported long distances from the source of emission before reacting with
hydroxyl radicals. Dry and wet deposition is a negligible pathway for removal from the
atmosphere for HCN, but cyanide particles may be removed by those pathways.(8)
Figure 2-2: Hydrogen Cyanide
Hydrogen cyanide can rapidly act as a metabolic asphyxiant, inhibiting
cytochrome oxidase, thus preventing cellular respiration, leading to histiotoxic hypoxia.
HCN can have systemic effects such as cardiac, dermatologic, neurologic and endocrine
effects.(8; 28; 30; 36; 38; 39) Acute effects of exposure to TLV-C levels of HCN include
cardiac irregularities, dermatologic effects, and nervous system effects. Coma and death
H C N
9
can occur with exposure to high concentrations (LC50 of 546 ppm at 10 minutes of
continuous exposure). The primary routes of entry for occupational exposures are
inhalation and dermal absorption, with inhalation having a greater rate of absorption than
dermal exposure.(5; 8; 28; 30; 32; 36; 38; 39) Some of HCN physical effects are similar
to symptoms from CS exposure to include respiratory tract irritation, headaches and
nausea.(5; 6) This is important to note with concurrent exposures with the thermal
dispersal of CS which may impede the determination of the potential source of symptoms
that are experienced.
While the acute effects of HCN are of primary concern when investigating HCN
as a thermal degradation product of CS during military training events, it is worthwhile to
note chronic low level exposure effects. The basis for the NIOSH REL-STEL of 4.7ppm
was based primarily on study that looked at chronic low level exposures in an
occupational setting.(5) The study conducted by El Ghawabi et al., looked at workers
with an average of seven years exposure in a concentration exposure range of 4.2-12.4
ppm. The researchers noted that the symptoms such as throat irritation, vomiting,
salivation, dyspnea, headache, weakness, taste/smell changes, nervous instability,
lacrimation and thyroid enlargement were greater in the exposed population than the
control.(5; 13) Another study conducted by Chandra et al. investigated chronic exposure
concentrations of 0.18-0.72 ppm. The researchers found that the workers presented with
complaints of signs/symptoms of HCN poisoning. Of note, no other chemicals were
reported/investigated and correlation between chronic effects and HCN exposure was not
reported.(5; 11)
10
PREVIOUS RESEARCH ON HCN GENERATION FROM CS COMBUSTION A few years after the military began using CS as a riot control/training agent
research into the chemical’s degradation products began. The first research noted was in
1961, as Porter et al. conducted research into pyrolytic decomposition of CS in an oxygen
environment and found the liberation of detectable levels of cyanide at 595 ºC and 615
ºC.(31) A decade later, continuing with the research into decomposition products of CS,
McNamara (1971) looked at the possibility of cyanide poisoning in the case of fire in a
CS storage area. In his research, McNamara looked at the overall percentage of HCN
obtained in relation to amount of CS combusted. He was able to obtain 0.003% HCN,
burning raw CS, and up to 0.25% HCN, burning raw CS mixed with Napalm B. These
percentages were significantly less than the 28% HCN predicted based on the chemical
formula (the two CN molecules make up to 28% of the molecular weight of CS).(23)
This signified that CS when burned, generated less HCN than predicted (possibly from
other breakdown products and recombination) and demonstrated that the higher
temperature of CS pyrolysis generated a higher percentage of HCN. From the 1970’s to
the early 2000’s, research into HCN as a thermal degradation product of CS stalled.
In 2001, as response to an incident where two young officers died from cardiac
related issues the same day after participating in a mask confidence chamber exercise, the
Fort Knox, Kentucky Industrial Hygiene Office conducted CS and HCN sampling inside
the mask confidence chamber. A propane camp stove was used to combust the CS, and
while the temperature of thermal combustion was not recorded, the authors estimated that
the propane and air mix flame temperature reached levels as high as 1,967 ºC. During the
Fort Knox study two static HCN air samples, utilizing NIOSH Method 7904, and one
bulk sample from the floor for cyanide, unknown analysis method, were taken. The

11
duration of the static air samples were 54 minutes and 14 minutes. All samples for
HCN/cyanide were found to be below detection level of 1.0 µg/m3 (0.0009 ppm) but the
authors hypothesized that this might be due to recombination of HCN with other
compounds that have been formed.(41)
Research into CS concentrations during high temperature dispersal and its
degradation products by Kluchinsky and associates began at the Uniformed Services
University (Bethesda, MD), shortly after the industrial hygiene survey was conducted at
Fort Knox, investigating thermal degradation by-products of CS at high temperature of
dispersal. Specifically, Kluchinsky et al. quantitatively investigated if HCN is formed
during high temperature dispersal of CS. Using two Type 3 CS canisters, CS was
dispersed at a temperatures exceeding 700 ºC in a Riot Control Agent Training Chamber
(RCA) (room volume of 240m3). Four 15 minute air samples were collected for analysis
of HCN using NIOSH Method 7904 (total volume air analyzed 14.94-15.98 L) and an
additional two 3 minute 18 second samples were collected, at a later date, for analysis by
NIOSH Method 6010 (total volume air analyzed 1.66-1.68 L). Results indicated that
HCN concentrations ranged from 3.9-5.4 ppm (NIOSH Method 7904) to 10-15 ppm
(NIOSH Method 6010). The results approached or exceeded the ACGIH Ceiling/NIOSH
REL-STEL of 4.7 ppm.(20)
In a separate study, Gutch et al. investigated multiple forms of benzylidene
malononitrile compounds, with a focus on the chlorine substituted form (CS). Two
experiments were conducted to research thermal degradation products from these
compounds. The first experiment conducted flash vacuum thermolysis in a glass
assembly with analytical grade CS at intervals within reaction temperature between 300-
12
600 ºC with a 30 second contact time. HCN was quantified using a spectrophotometric
method. This study showed that chlorinated benzylidene malononitrile was potentially
stable up to 300 ºC and completely decomposed by 600 ºC. HCN was determined to be
one of the major gas products formed. HCN was found starting at 350 ºC. The percent
of HCN was determined to increase with the increase in temperature. The second
experiment used thermogravimetric analysis in a nitrogen atmosphere for decomposition
of CS. Gutch et al. found that CS had a decomposition range of 125-225 ºC using this
method. They hypothesized that the difference in range of decomposition was potentially
due to the recombination of radicals which would prolong decomposition.(14)
While most previous research focused on high temperatures of CS dispersal (>300
ºC), Hout et al. followed up on the Kluchinsky et al. research by investigating low
temperature dispersal of CS (150-300 ºC) and the thermal degradation products that are
formed. The follow-on research on the thermal degradation by-products was conducted
in a RCA training chamber during a mock up of a training exercise (mock training
exercise is when the policies and procedures are replicated but does not involve the
variables, such as durations and procedure deviations, that may occur with live training
exercises with Soldiers). CS powder from two capsules was aerosolized using an
oxidizing candle as the heat source, producing a measured combustion temperature of
275 ºC. Solid phase microextraction (SPME), a simple and solventless method for
sample collection and injection for gas chromatography, was the collection method used
to passively collect airborne degradation by-products and gas chromatography/mass
spectrometry (GC/MS) for qualitative analysis. Additionally, a tube furnace experiment
in a laboratory setting was used to examine thermal degradation by-products at increasing
13
temperatures of CS generation from 150-300 ºC. One CS capsule was burned for each
sample collected. SPME with GC/MS analysis was utilized to qualitatively determine
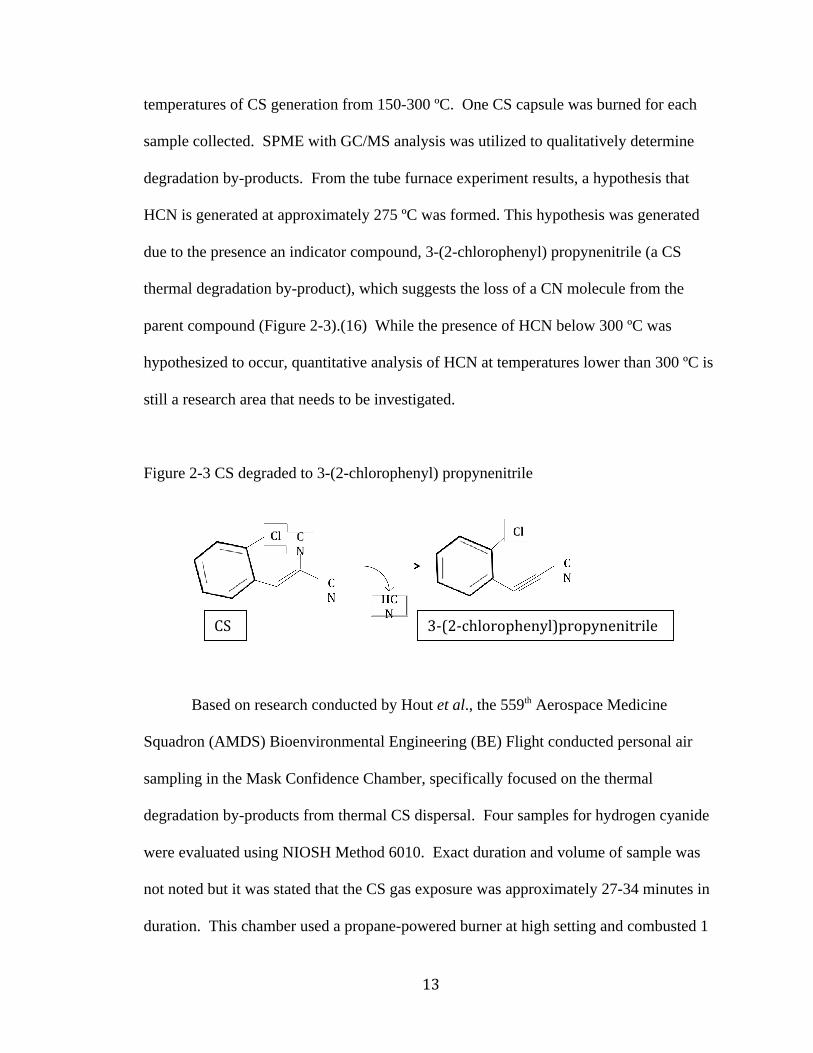
degradation by-products. From the tube furnace experiment results, a hypothesis that
HCN is generated at approximately 275 ºC was formed. This hypothesis was generated
due to the presence an indicator compound, 3-(2-chlorophenyl) propynenitrile (a CS
thermal degradation by-product), which suggests the loss of a CN molecule from the
parent compound (Figure 2-3).(16) While the presence of HCN below 300 ºC was
hypothesized to occur, quantitative analysis of HCN at temperatures lower than 300 ºC is
still a research area that needs to be investigated.
Figure 2-3 CS degraded to 3-(2-chlorophenyl) propynenitrile
Based on research conducted by Hout et al., the 559th Aerospace Medicine
Squadron (AMDS) Bioenvironmental Engineering (BE) Flight conducted personal air
sampling in the Mask Confidence Chamber, specifically focused on the thermal
degradation by-products from thermal CS dispersal. Four samples for hydrogen cyanide
were evaluated using NIOSH Method 6010. Exact duration and volume of sample was
not noted but it was stated that the CS gas exposure was approximately 27-34 minutes in
duration. This chamber used a propane-powered burner at high setting and combusted 1
CS 3-‐(2-‐chlorophenyl)propynenitrile
14
CS capsule on an iron skillet initially, with an additional capsule per each group that
entered the chamber. The burner produced a measured temperature range of 350-700 ºC.
Results for hydrogen cyanide ranged from 0.14 ppm to 0.18 ppm, well below the ACGIH
Ceiling/NIOSH REL-STEL of 4.7 ppm. (12) Similar to previous studies that quantified
HCN, the temperature of dispersal was in excess of 300 ºC. Of important note is that the
amount of CS used was significantly less than what is currently used in Army Mask
Confidence Chambers (volume of the room in which CS was employed for the IH survey
was not noted).
A preliminary study conducted by Hout et al. qualitatively investigating the
presence of HCN was conducted based upon the presence 3-(2-chlorophenyl)
propynenitrile at 275 ºC. Utilizing a commercially available tube furnace (Barnstead-
Thermolyne, Dubuque, Iowa), CS was combusted within a temperature range of 150-300
ºC and the aerosolized CS sampled at 25 ºC intervals. Nitrogen gas was utilized as the
flow gas at a rate of 475-500 ml/min. After three minutes of the CS being exposed to the
heat, a SPME fiber with a Carbowax/Divinlybenzene (CW/DVB) fiber coating was
inserted into a sampling port and exposed for two minutes to the aerosolized CS. This
process was repeated in triplicate. Samples were then analyzed via GC/MS with a Plot-Q
column. At each temperature point, starting from 300 ºC and extending down to 150 ºC,
HCN was detected. An additional part of the preliminary study used a direct reading
instrument known as the Multi Rae (RAE Systems, San Jose, California) during mock
chamber that combusted CS at 275 ºC. HCN was detected at 1 ppm with 1 capsule
combusted and 3 ppm with 2 capsules combusted. HCN was also detected qualitatively
within the mock chamber using SPME and GC/MS analysis.(15)
15
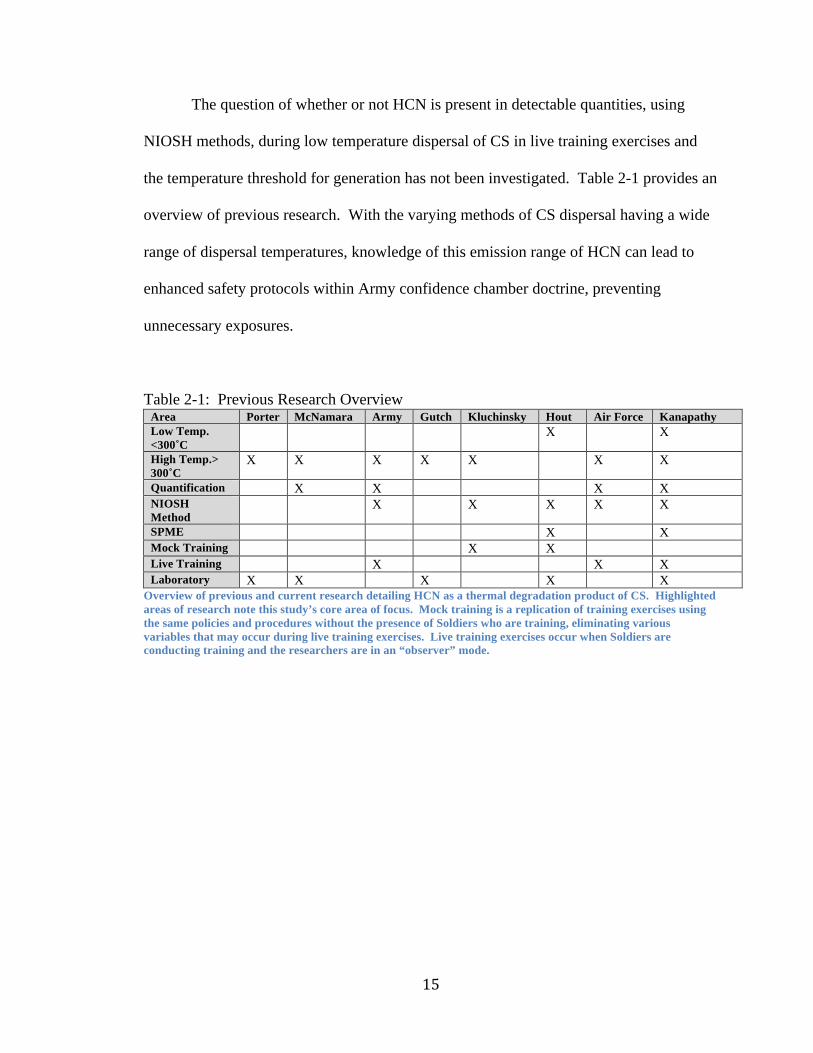
The question of whether or not HCN is present in detectable quantities, using
NIOSH methods, during low temperature dispersal of CS in live training exercises and
the temperature threshold for generation has not been investigated. Table 2-1 provides an
overview of previous research. With the varying methods of CS dispersal having a wide
range of dispersal temperatures, knowledge of this emission range of HCN can lead to
enhanced safety protocols within Army confidence chamber doctrine, preventing
unnecessary exposures.
Table 2-1: Previous Research Overview Area Porter McNamara Army Gutch Kluchinsky Hout Air Force Kanapathy Low Temp. <300˚C
X X
High Temp.> 300˚C
X X X X X X X
Quantification X X X X NIOSH Method
X X X X X
SPME X X Mock Training X X Live Training X X X Laboratory X X X X X
Overview of previous and current research detailing HCN as a thermal degradation product of CS. Highlighted areas of research note this study’s core area of focus. Mock training is a replication of training exercises using the same policies and procedures without the presence of Soldiers who are training, eliminating various variables that may occur during live training exercises. Live training exercises occur when Soldiers are conducting training and the researchers are in an “observer” mode.
16
CHAPTER 3: Methods and Materials
CHAMBER REGULATIONS Current Army regulation limits the use of RCAs in training to using only CS
(capsule form only during chamber exercises). Additionally, CS is not to be employed in
ways that are dangerous to life and/or property.(4) Per the chamber exercise instructions
[Training Support Package (TSP) 805-B-2040 Chemical, Biological, Radiological, and
Nuclear (CBRN) Defense 2], the standard of the exercise is to operate within a chemical
environment by performing the following in order: stay within the chemical environment
for two minutes without adjusting the M40 mask, then when given the command each
Soldier is to, within nine seconds, break the seal of his/her respective mask and then
seal/clear it again, then for an additional one minute remain in the chemical environment
while masked, and lastly, remove the mask and immediately exit from the chemical
environment. This procedure is to ensure the Soldiers are able to properly wear and use
the mask along with understanding that the mask is working in the chemical environment
(thus providing them with “confidence” in the use and function of their mask). Materials
listed in the Training Support Package to be used by the instructors for any Army
Confidence Chamber are 34 CS capsules, hot plate or oxidizing candle (which may
generate different temperatures than the hot plate), a candle lighting device, a coffee can
(to place the CS powder into on top of the heat source), the M40 Protective Mask, and the
chemical protective uniform. The students’ (Soldiers’) material list includes the M40
Protective Mask, chemical protective uniform (uniform that is worn over the ACU), and
their tactical field gear.(3) One capsule per 30 cubic meter (m3) is to be dispersed for
initial chamber concentration and an additional capsule dispersed per 10 personnel that
17
go through the chamber.(7) Prior to entry into the chamber, all masks are to be inspected
for fit and function. If a Soldier’s mask does not properly fit or function they will receive
a new mask or use another Soldier’s mask after that Soldier has completed the chamber
exercise. Individuals that have medical reasons for not entering the chamber will be
identified and not conduct the chamber exercise. Contact lenses are not to be worn inside
the chamber to prevent CS particulates from being trapped in between the contact lens
and the eye (eyeglass inserts for the protective mask are issued to Soldiers). After the
initial administration and pre-exercise checks are completed, Soldiers will then enter the
chamber.(3) Upon exiting the chamber with the mask removed, the Soldiers will walk
around in a “decontamination” track (area away from non-exposed personnel) until the
CS effects subside.(3) The Department of the Army Pamphlet 385-63, entitled Range
Safety (Chapter 13, Chemical Agents and Smoke) states that unprotected personnel will
not be exposed to RCAs greater than 15 seconds and prescribes the use of personal
protective equipment for Army personnel who handle or dispense CS (protective mask
with hood rubber boots, and field clothing secured at ankles, wrist and neck).(4)
OBSERVED MASK CONFIDENCE CHAMBER EXERCISE PROCEDURE While knowledge of the written policies and procedures for the Army is
important, the actual chamber exercise procedures are vital to understanding the route of
exposure. At Fort Jackson, SC, one to three companies conducted this training daily
Monday through Saturday. While this was the case, each individual basic training recruit
typically participates in the chamber exercise only one time during their basic training
experience, for a brief period.
18
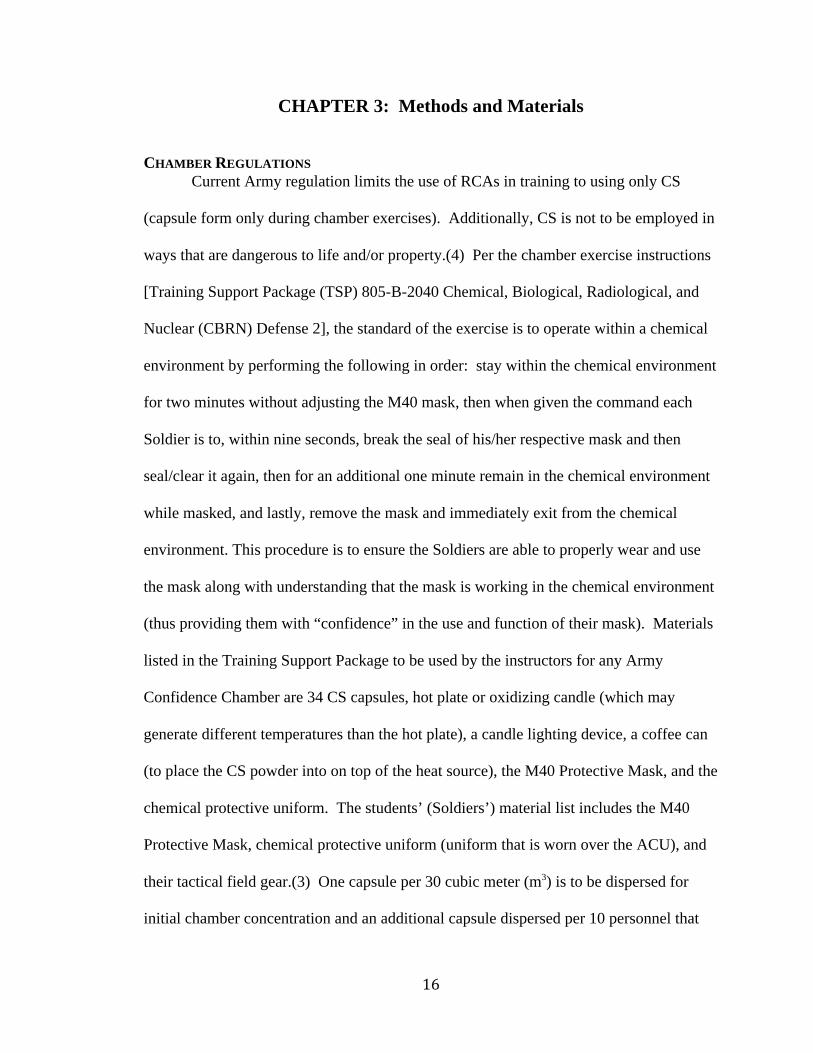
Figure 3-1 Chamber Layout
Basic layout of chamber. Soldiers participating in the exercise line up along the walls. Drill Sergeants work in the center of the chamber. The CS Generation site is located centrally inside the chamber with the CBRNE NCO standing beside it. A large fan is used to help direct the aerosolized CS. The HCN sample point was located ~5 feet from the CS generation point.
Soldier Grouping (Companies and Platoons) and Chamber Description
Each company consisted of four platoons, with 45-64 Soldiers in each platoon
(180-240 Soldiers in a company). Each company had approximately eight Drill
Sergeants (DS). The DS stayed in the chamber throughout the training exercise. During
the chamber exercise, a Chemical Biological Radiological Nuclear and Explosives
(CBRNE) Noncommissioned Officer (NCO) dispersed the CS and was present during the
duration of training (~60 minutes per company). The CBRNE NCO (supervisor) was
generally assigned to manage the chamber for all companies conducting training
throughout the day. There were ~3 CBRNE NCOs that would alternate conducting
chambers throughout the week. There was potential for an individual CBRNE NCO to
19
conduct multiple chambers within a day and a week. The standard personnel protective
equipment (PPE) worn by personnel entering the chamber that had CS combusting was
an air-purifying M40 protective mask (ILC Dover, Frederica, Delaware), which is a
military equivalent of the commercially available Millenium full-face air-purifying
respirator (Mine Safety Appliances, Cranberry Township, Pennsylvania). The chamber
was 43 feet (13.11m) long by 24 feet (7.32m) wide by 10 feet (3.05m) high for a total of
10,320 ft3 (293 m3).
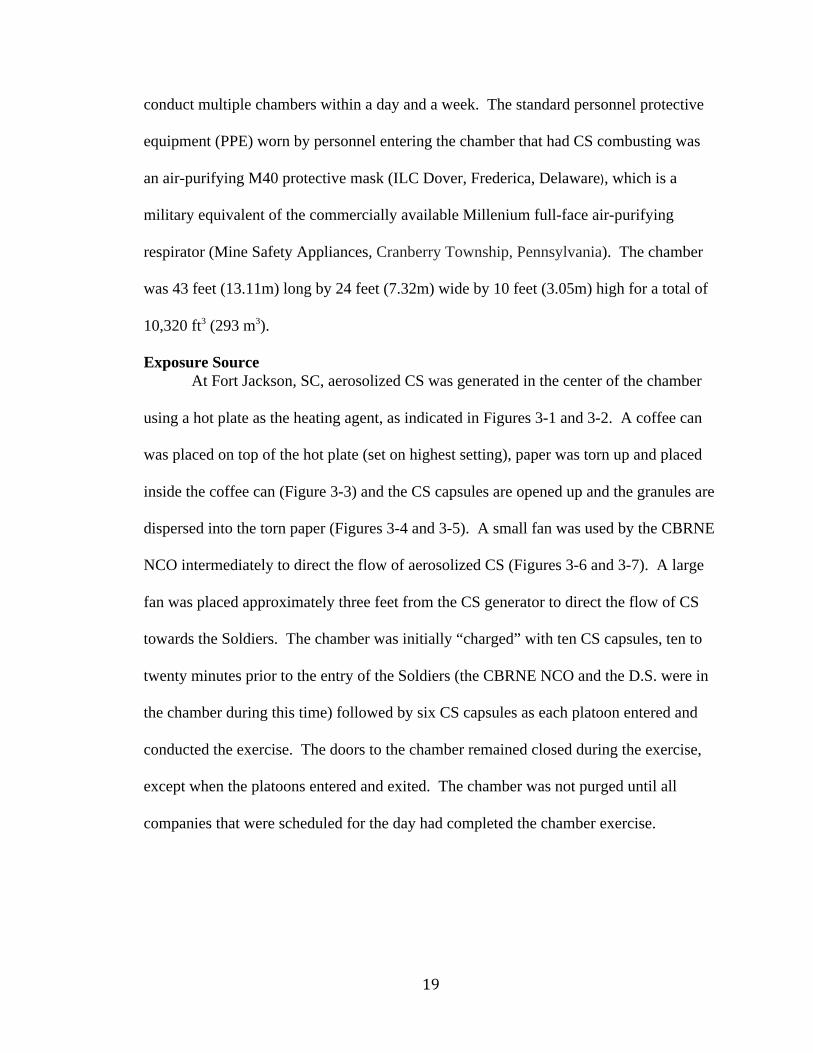
Exposure Source At Fort Jackson, SC, aerosolized CS was generated in the center of the chamber
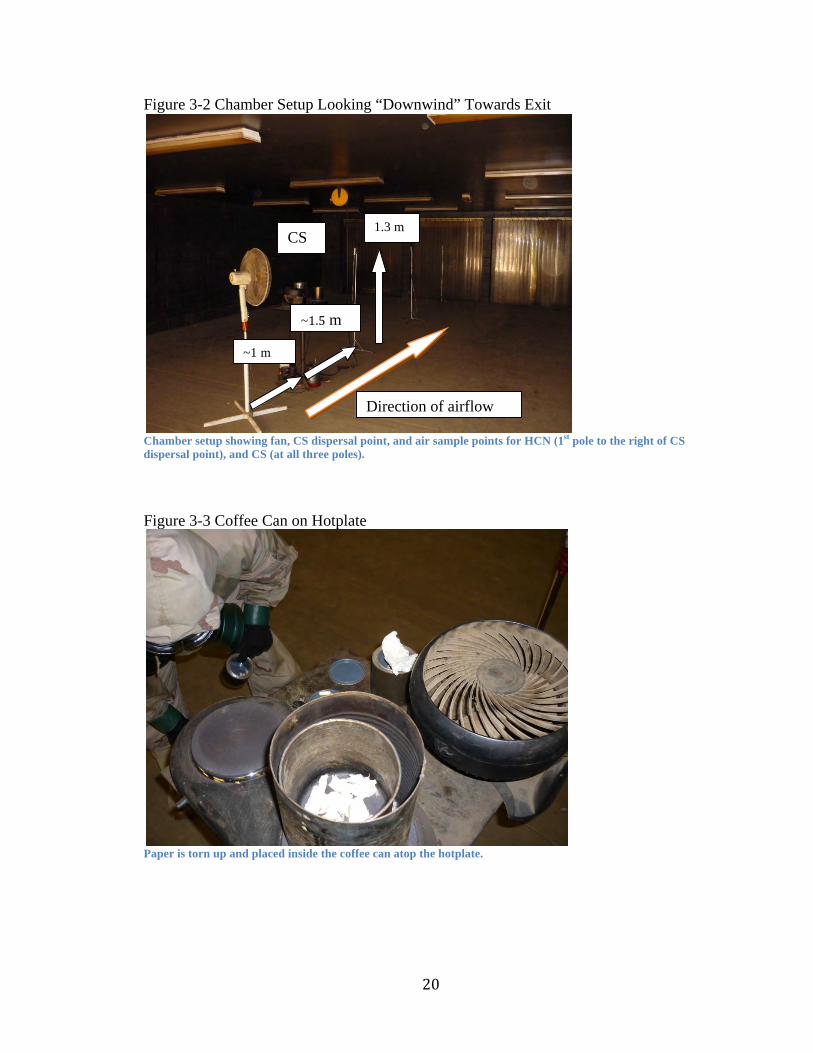
using a hot plate as the heating agent, as indicated in Figures 3-1 and 3-2. A coffee can
was placed on top of the hot plate (set on highest setting), paper was torn up and placed
inside the coffee can (Figure 3-3) and the CS capsules are opened up and the granules are
dispersed into the torn paper (Figures 3-4 and 3-5). A small fan was used by the CBRNE
NCO intermediately to direct the flow of aerosolized CS (Figures 3-6 and 3-7). A large
fan was placed approximately three feet from the CS generator to direct the flow of CS
towards the Soldiers. The chamber was initially “charged” with ten CS capsules, ten to
twenty minutes prior to the entry of the Soldiers (the CBRNE NCO and the D.S. were in
the chamber during this time) followed by six CS capsules as each platoon entered and
conducted the exercise. The doors to the chamber remained closed during the exercise,
except when the platoons entered and exited. The chamber was not purged until all
companies that were scheduled for the day had completed the chamber exercise.
20
Figure 3-2 Chamber Setup Looking “Downwind” Towards Exit
Chamber setup showing fan, CS dispersal point, and air sample points for HCN (1st pole to the right of CS dispersal point), and CS (at all three poles).
Figure 3-3 Coffee Can on Hotplate
Paper is torn up and placed inside the coffee can atop the hotplate.
1.3 m CS
Direction of airflow
~1.5 m
~1 m
21
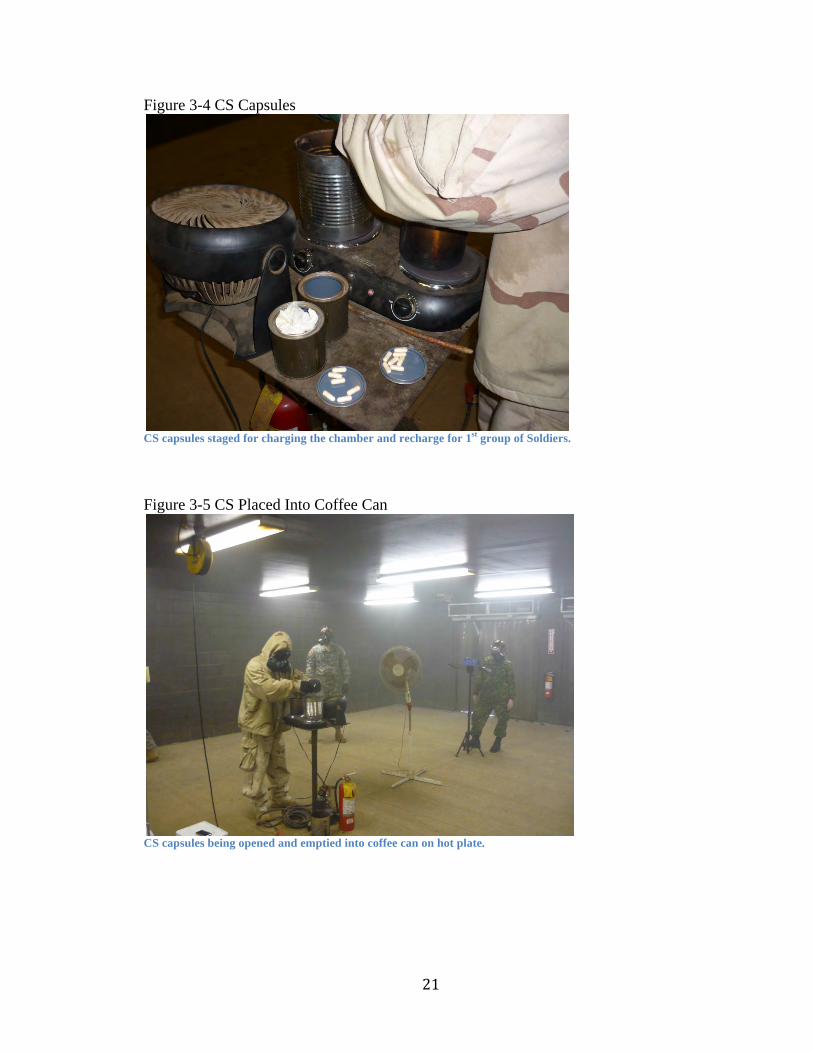
Figure 3-4 CS Capsules
CS capsules staged for charging the chamber and recharge for 1st group of Soldiers.
Figure 3-5 CS Placed Into Coffee Can
CS capsules being opened and emptied into coffee can on hot plate.
22
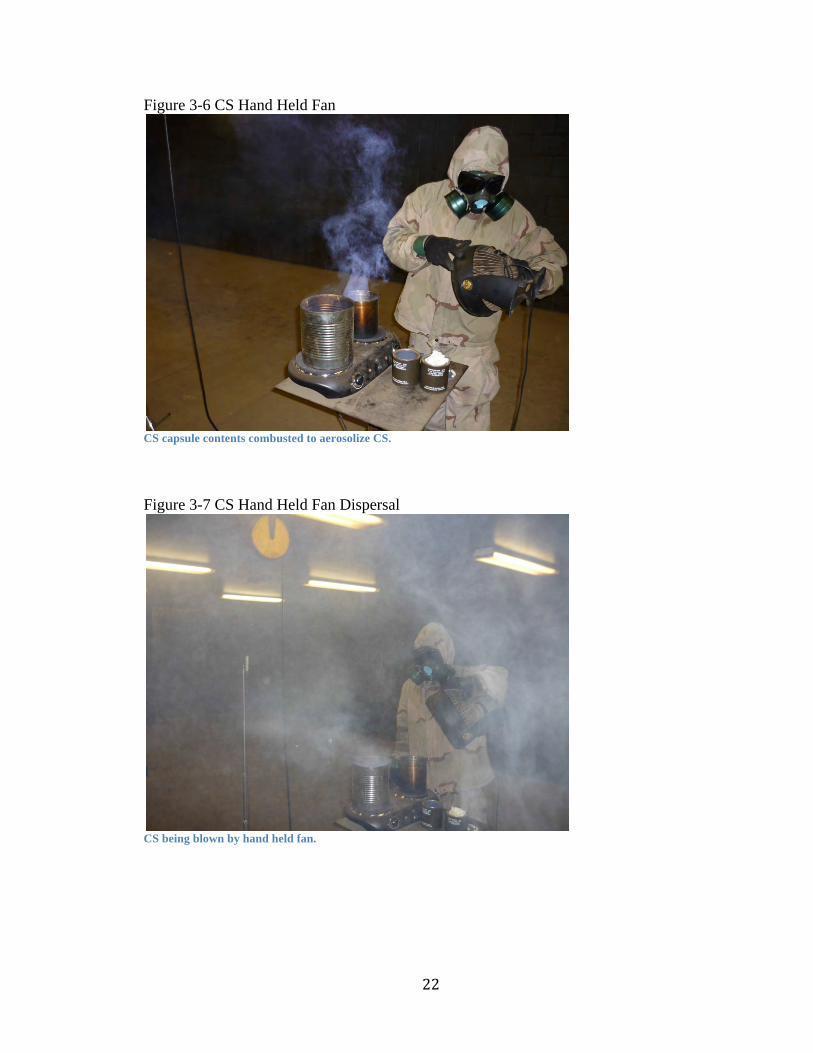
Figure 3-6 CS Hand Held Fan
CS capsule contents combusted to aerosolize CS.
Figure 3-7 CS Hand Held Fan Dispersal
CS being blown by hand held fan.
23
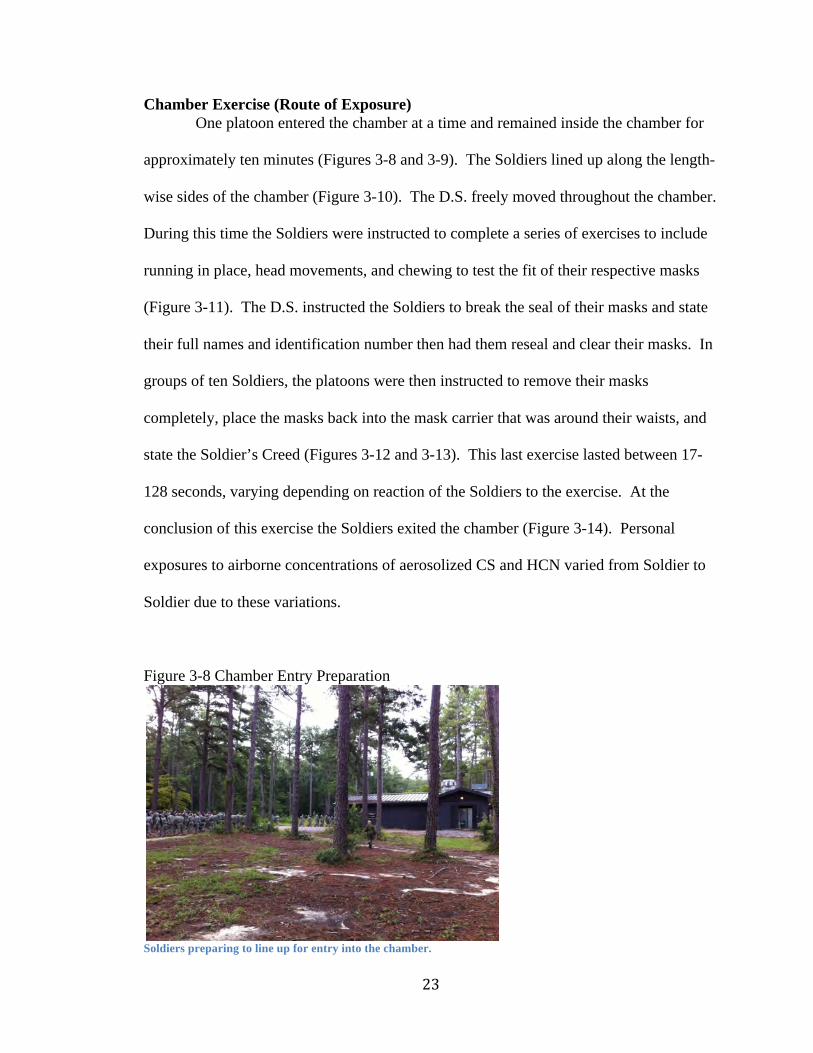
Chamber Exercise (Route of Exposure) One platoon entered the chamber at a time and remained inside the chamber for
approximately ten minutes (Figures 3-8 and 3-9). The Soldiers lined up along the length-
wise sides of the chamber (Figure 3-10). The D.S. freely moved throughout the chamber.
During this time the Soldiers were instructed to complete a series of exercises to include
running in place, head movements, and chewing to test the fit of their respective masks
(Figure 3-11). The D.S. instructed the Soldiers to break the seal of their masks and state
their full names and identification number then had them reseal and clear their masks. In
groups of ten Soldiers, the platoons were then instructed to remove their masks
completely, place the masks back into the mask carrier that was around their waists, and
state the Soldier’s Creed (Figures 3-12 and 3-13). This last exercise lasted between 17-
128 seconds, varying depending on reaction of the Soldiers to the exercise. At the
conclusion of this exercise the Soldiers exited the chamber (Figure 3-14). Personal
exposures to airborne concentrations of aerosolized CS and HCN varied from Soldier to
Soldier due to these variations.
Figure 3-8 Chamber Entry Preparation
Soldiers preparing to line up for entry into the chamber.
24
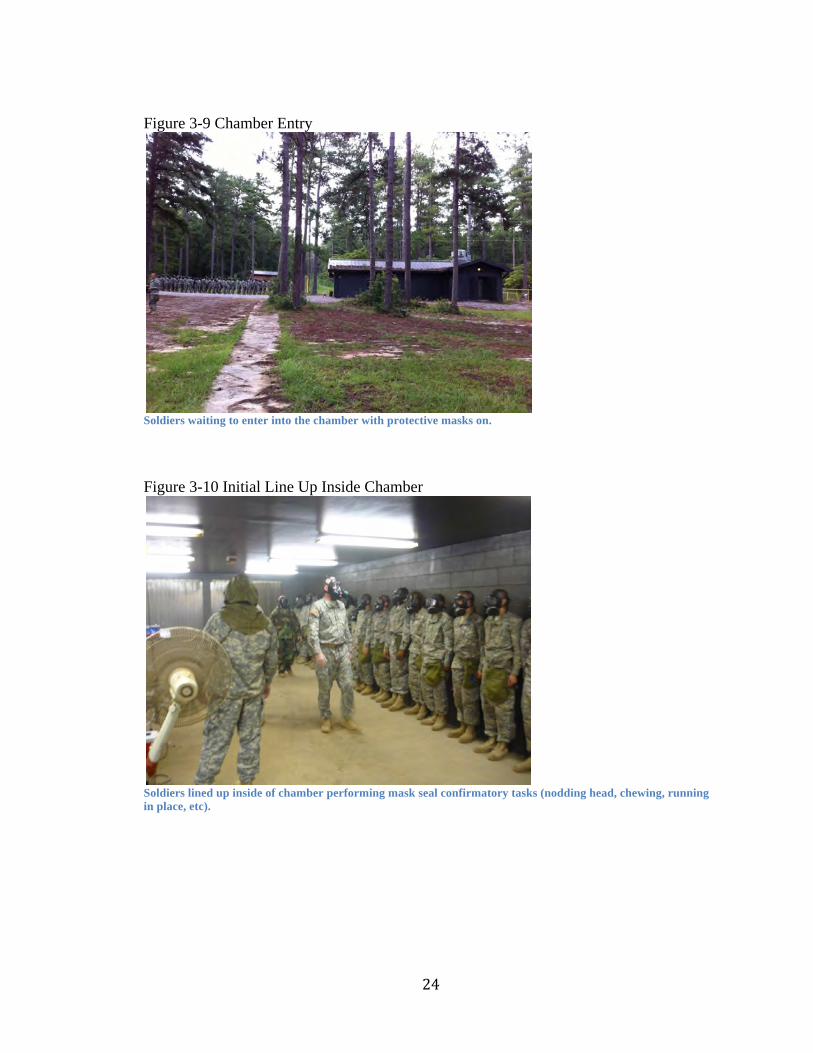
Figure 3-9 Chamber Entry
Soldiers waiting to enter into the chamber with protective masks on.
Figure 3-10 Initial Line Up Inside Chamber
Soldiers lined up inside of chamber performing mask seal confirmatory tasks (nodding head, chewing, running in place, etc).
25
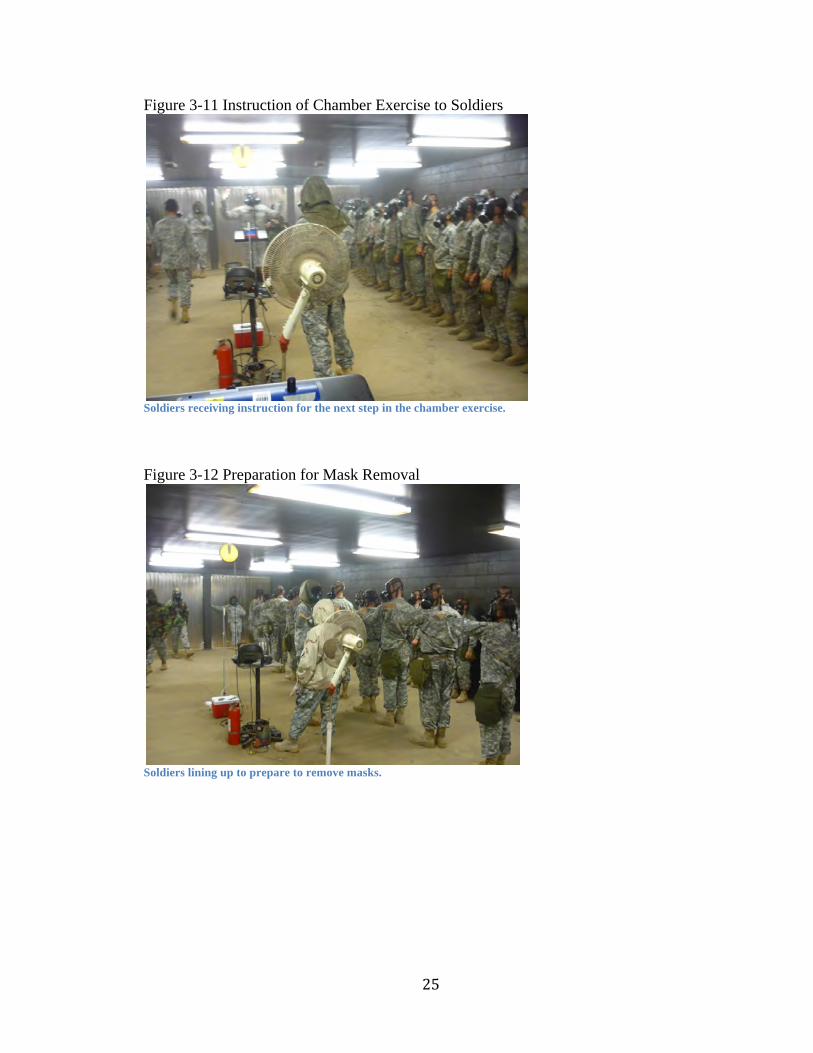
Figure 3-11 Instruction of Chamber Exercise to Soldiers
Soldiers receiving instruction for the next step in the chamber exercise.
Figure 3-12 Preparation for Mask Removal
Soldiers lining up to prepare to remove masks.
26
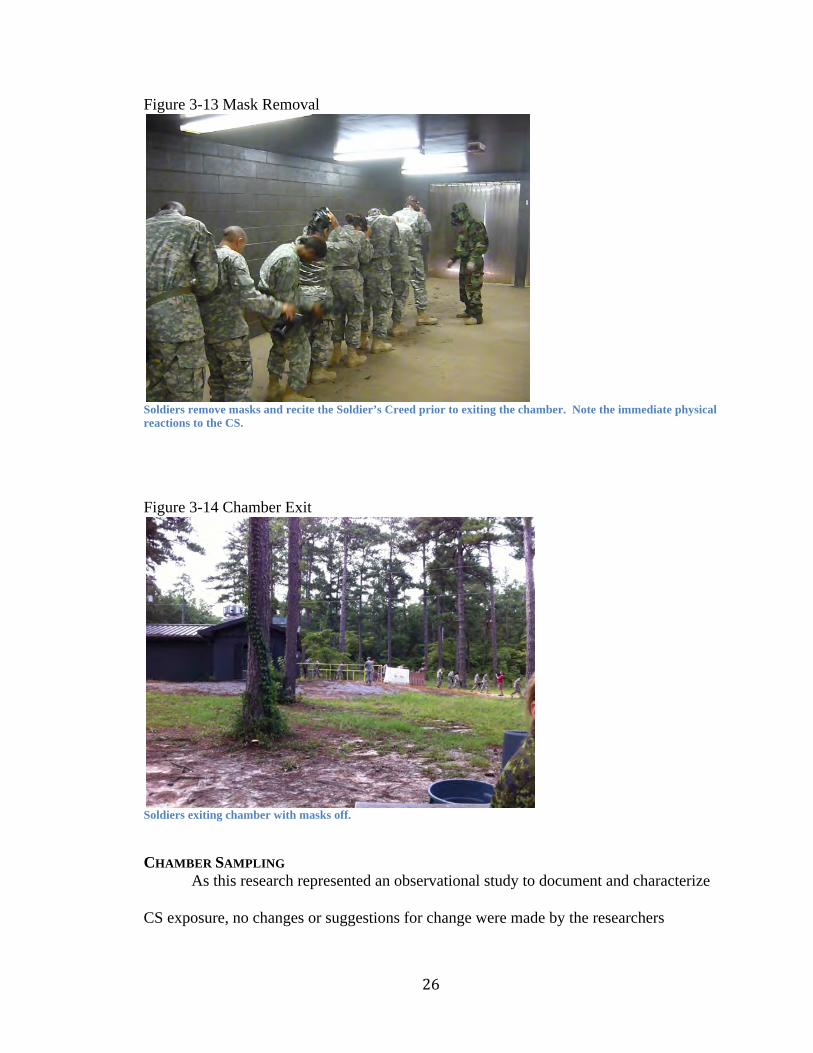
Figure 3-13 Mask Removal
Soldiers remove masks and recite the Soldier’s Creed prior to exiting the chamber. Note the immediate physical reactions to the CS.
Figure 3-14 Chamber Exit
Soldiers exiting chamber with masks off.
CHAMBER SAMPLING
As this research represented an observational study to document and characterize
CS exposure, no changes or suggestions for change were made by the researchers
27
regarding to any chamber procedures which took place during this research. This method
allowed for “real time” sampling to occur with the variability that may occur in a non-
controlled setting (such as amount of CS combusted and duration of sampling/exercise).
A Hotmux thermal datalogger (DCC Corporation, Pennsauken, New Jersey) was used to
determine temperature generated from hotplate that was used for CS dispersal. At a
recorded 200 ºC, this temperature is lower than past recorded temperatures using different
combustion methods (i.e. oxidizing candles, propane burner).(12; 15; 20; 41) NIOSH
Method 6010 was used to quantify HCN levels at fifteen minute intervals and training
exercise duration (~60 minutes) during a three week period in August and September
2012. NIOSH Method 6010 is more sensitive with less interference than NIOSH Method
7904, an alternative method for HCN sampling.(27)
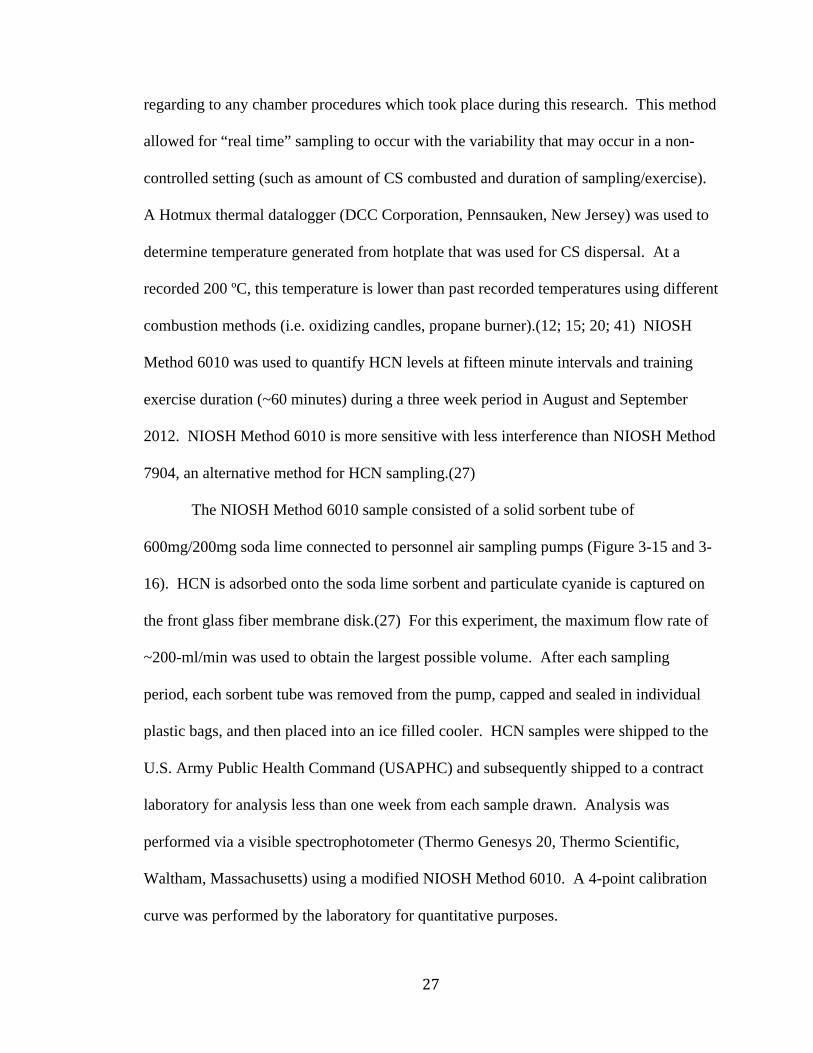
The NIOSH Method 6010 sample consisted of a solid sorbent tube of
600mg/200mg soda lime connected to personnel air sampling pumps (Figure 3-15 and 3-
16). HCN is adsorbed onto the soda lime sorbent and particulate cyanide is captured on
the front glass fiber membrane disk.(27) For this experiment, the maximum flow rate of
~200-ml/min was used to obtain the largest possible volume. After each sampling
period, each sorbent tube was removed from the pump, capped and sealed in individual
plastic bags, and then placed into an ice filled cooler. HCN samples were shipped to the
U.S. Army Public Health Command (USAPHC) and subsequently shipped to a contract
laboratory for analysis less than one week from each sample drawn. Analysis was
performed via a visible spectrophotometer (Thermo Genesys 20, Thermo Scientific,
Waltham, Massachusetts) using a modified NIOSH Method 6010. A 4-point calibration
curve was performed by the laboratory for quantitative purposes.
28
Figure 3-15 Sample Train
From left to right: soda lime sorbent tube, personal sampling pump with tubing next to pole used to hold sample in place, complete sampling train.
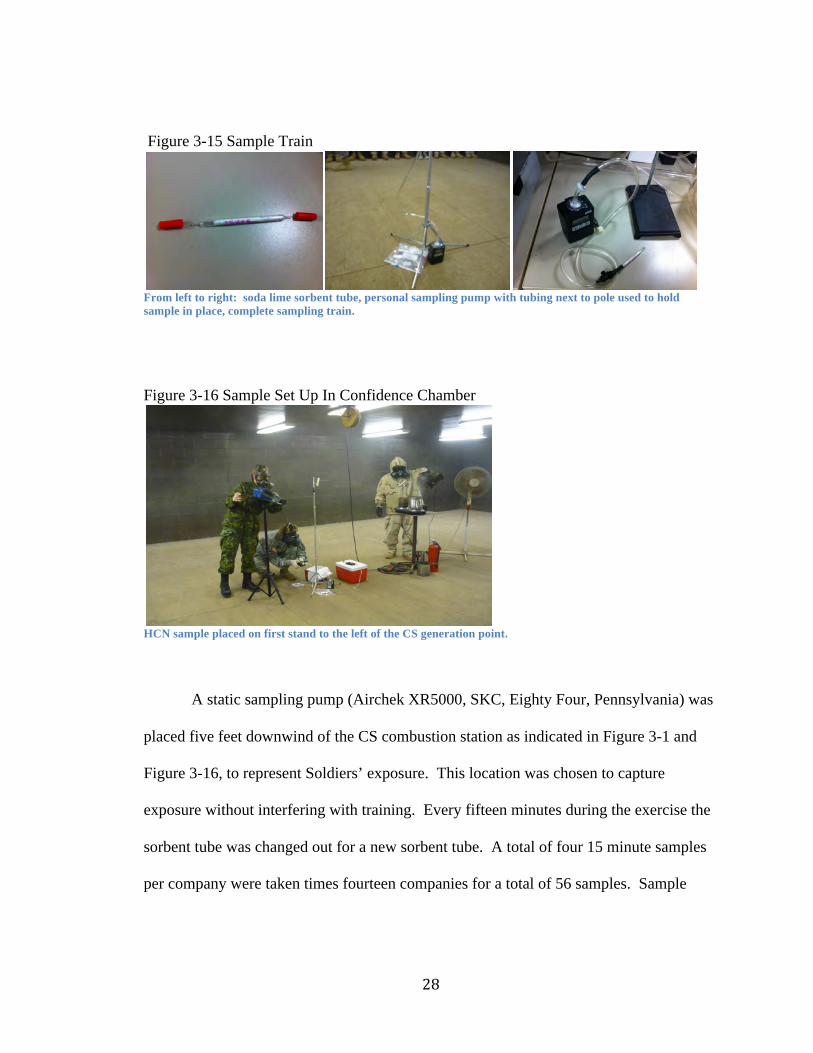
Figure 3-16 Sample Set Up In Confidence Chamber
HCN sample placed on first stand to the left of the CS generation point.
A static sampling pump (Airchek XR5000, SKC, Eighty Four, Pennsylvania) was
placed five feet downwind of the CS combustion station as indicated in Figure 3-1 and
Figure 3-16, to represent Soldiers’ exposure. This location was chosen to capture
exposure without interfering with training. Every fifteen minutes during the exercise the
sorbent tube was changed out for a new sorbent tube. A total of four 15 minute samples
per company were taken times fourteen companies for a total of 56 samples. Sample
29
placement and duration were determined by a pilot study conducted July 2012 that
examined variability of exercise and feasibility of sample locations.(18)
Exercise duration samples to characterize supervisor exposure were placed on
each of the CBRNE NCO with the pump in their respective pocket and each respective
sorbent tube clipped to the lapel of the uniform in the individual’s breathing zone. The
sampling pump was turned on when CBRNE NCO entered the chamber and then turned
off when CBRNE NCO exited the chamber. Time of sampling ranged from 40-92
minutes. One sorbent tube per company was used for each exercise duration sample. A
total of eighteen supervisory samples were collected and analyzed.
During the three week period, three consecutive training exercise samples (two
companies conducting chamber exercise on same day) were taken as the opportunity
arose. A static sampling pump was positioned next to the CBRNE NCO. These samples
were started from the start of the first company training exercise of the day and were
ended after the completion of the subsequent company’s training exercise. Sample
duration ranged from 102-401 minutes.
An additional eight 15-minute samples and two CBRNE NCO samples, using
NIOSH Method 6010, were taken concurrently with samples that were sent to APHC.
These samples were sent to and were funded by the Navy & Marine Corps Public Health
Center Consolidated Industrial Hygiene Laboratory (CIHL) Detachment Norfolk for
comparison. After receipt by CIHL, the samples were then sent to a contract laboratory
for analysis. Analysis was performed via spectrophotometer/visible absorption (HACH
DR5000, HACH, Loveland, California) in accordance with NIOSH Method 6010 (no
method modifications). Table 3-1 provides an overview of quantity of samples taken.
30
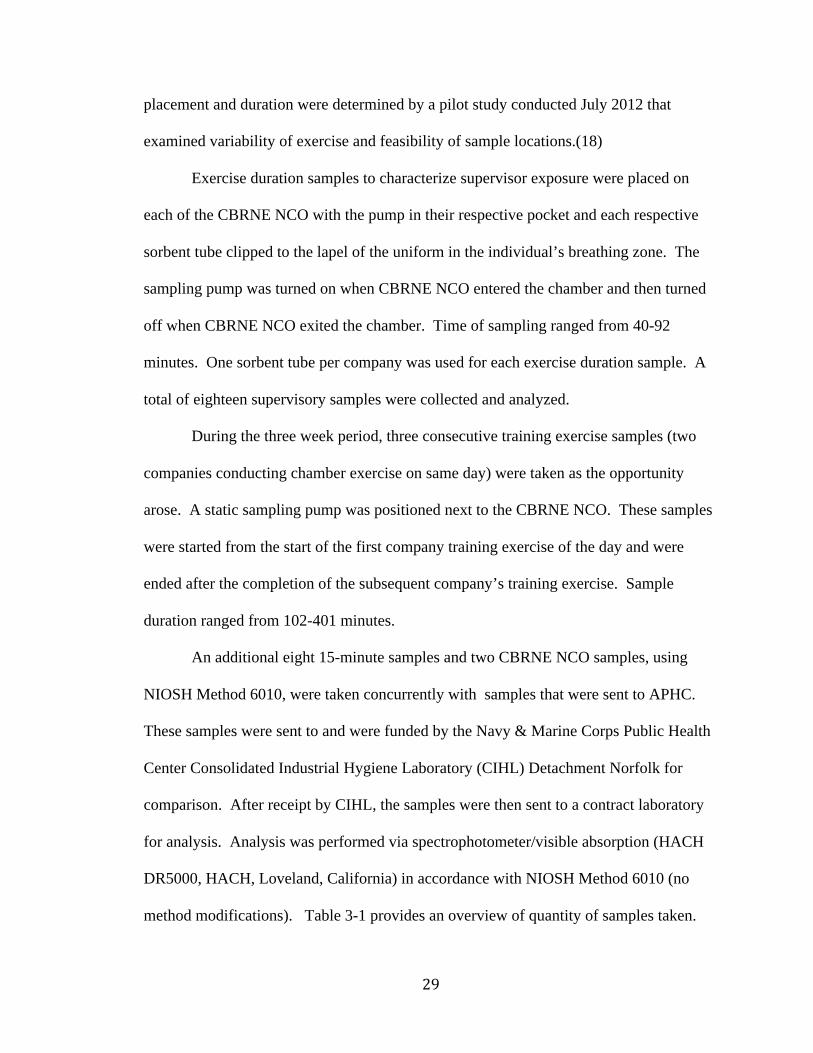
Table 3-1 Overview Sample Size LOQ 2.7 µg LOQ 1.1 µg
Sample n Sample n
15 minute 56 15 minute 8
Supervisor 18 Supervisor 2
Consecutive Exercise
3 N/A N/A
Total 77 Total 10
A sample size of eighteen was calculated to be sufficient to estimate the mean
concentration for the supervisor samples with a margin of error of 0.4973 based on a
95%, 2-sided confidence interval. A sample size of fifty-six was calculated to be
sufficient to estimate the mean concentration for the 15 minute samples with a margin of
error of 0.2678 based on a 95%, 2-sided confidence interval. A sample size of three was
calculated, post hoc, to be sufficient to estimate the mean concentration of the
consecutive samples with a margin of error of 2.484 based on a 95%, 2-sided confidence
interval. Sample size was calculated based on analysis of the confidence interval for one
mean.(22)
31
TUBE FURNACE
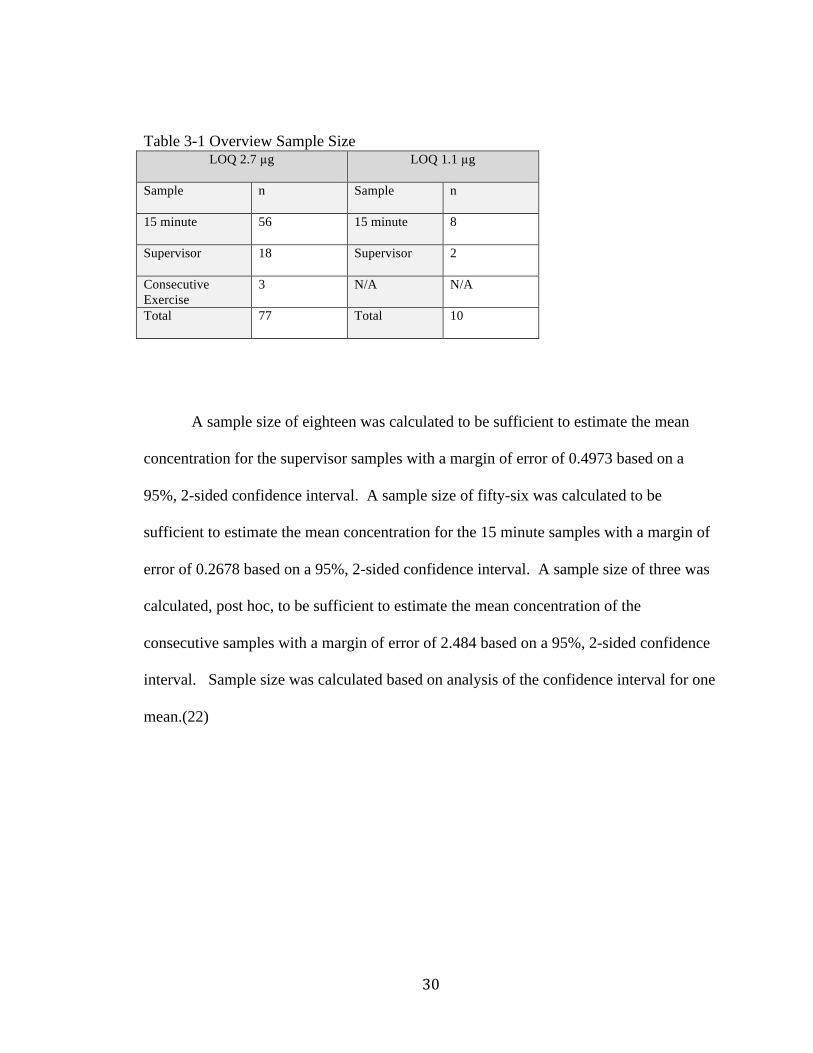
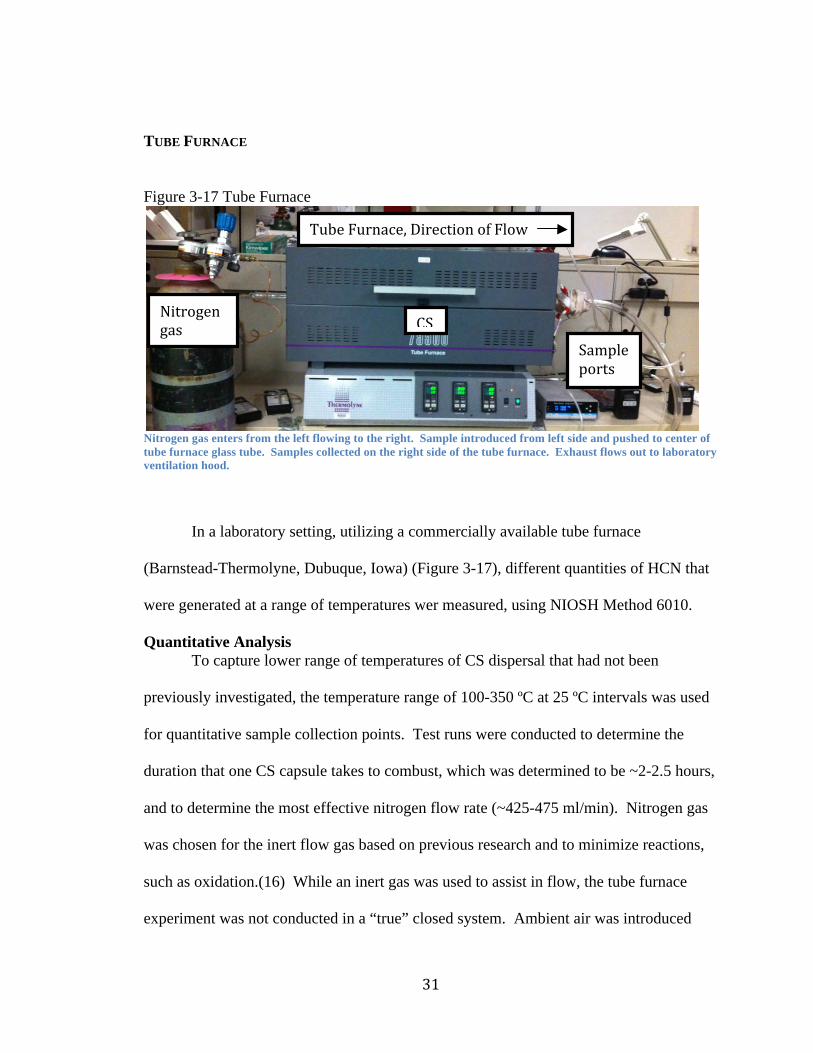
Figure 3-17 Tube Furnace
Nitrogen gas enters from the left flowing to the right. Sample introduced from left side and pushed to center of tube furnace glass tube. Samples collected on the right side of the tube furnace. Exhaust flows out to laboratory ventilation hood.
In a laboratory setting, utilizing a commercially available tube furnace
(Barnstead-Thermolyne, Dubuque, Iowa) (Figure 3-17), different quantities of HCN that
were generated at a range of temperatures wer measured, using NIOSH Method 6010.
Quantitative Analysis To capture lower range of temperatures of CS dispersal that had not been
previously investigated, the temperature range of 100-350 ºC at 25 ºC intervals was used
for quantitative sample collection points. Test runs were conducted to determine the
duration that one CS capsule takes to combust, which was determined to be ~2-2.5 hours,
and to determine the most effective nitrogen flow rate (~425-475 ml/min). Nitrogen gas
was chosen for the inert flow gas based on previous research and to minimize reactions,
such as oxidation.(16) While an inert gas was used to assist in flow, the tube furnace
experiment was not conducted in a “true” closed system. Ambient air was introduced
Tube Furnace, Direction of Flow
Nitrogen gas
Sample ports
CS
32
each time a capsule was added to the system along with air entry from the exhaust side;
more gas is pulled out by the static air sampling pumps (600 ml/min) than is entered into
the reaction tube (~450 ml/min). One CS capsule (average weight 0.64 grams) was
emptied on to a combustion boat and inserted into the center of the tube furnace quartz
reaction tube using a metal rod. Three capsules total were used, inserted at evenly spaced
time intervals. The total air volume sampled ranged between +/- 10% of 90L, NIOSH
recommended maximum volume, with higher volumes collected for the lower portion of
the temperature range to ensure adequate volume captured to obtain results above LOQ.
Nitrogen flow gas was set at 350-450 ml/min to prevent backpressure and assist in flow
of aerosolized CS. Three static sampling pumps (Airchek XR5000, SKC, Eighty Four,
Pennsylvania) with 600mg/200mg soda lime sorbent tubes set at a flow rate of
200ml/min each, running concurrently, were used for the sample collection.
After each sampling period, each sorbent tube was removed from the pump,
capped and sealed in plastic bags, and placed in a refrigerator until shipped to the
laboratory. The HCN samples were shipped to USAPHC and subsequently shipped to a
contract laboratory for analysis less than one week from each sample drawn (per NIOSH
Method 6010 samples are stable up to two weeks).(27) Analysis was performed via a
visible spectrophotometer (Thermo Genesys 20, Thermo Scientific, Waltham,
Massachusetts) using a modified NIOSH Method 6010.
A total of eleven sample points within the temperature range was determined to
be sufficient to provide an 80% power with a 5% significance level and detectable beta[j]
(meaningful regression coefficient) of 0.61. Sample size was calculated based on linear
regression analysis. (22)
33
Analysis Methods
For both objectives, concentration means (along with 95% Confidence Intervals)
were calculated and compared to established exposure guidelines. Regression analysis
was also conducted for the laboratory analysis to assess the relationship between the
concentration of HCN and the temperature of CS combustion. To determine whether or
not there was a correlation between temperature and concentration, Pearson’s Correlation
Coefficient was calculated for normal distribution and Spearman’s Correlation
Coefficient for non-normal distribution. For the case of a large quantity of censored data
within a small sample set, confidence intervals for the results were analyzed as
proportions (samples quantified over total samples taken) using the modified Wald
method. In the case of when a small proportion of censored data , ½ of the reporting
limit was used.
34
CHAPTER 4: Results
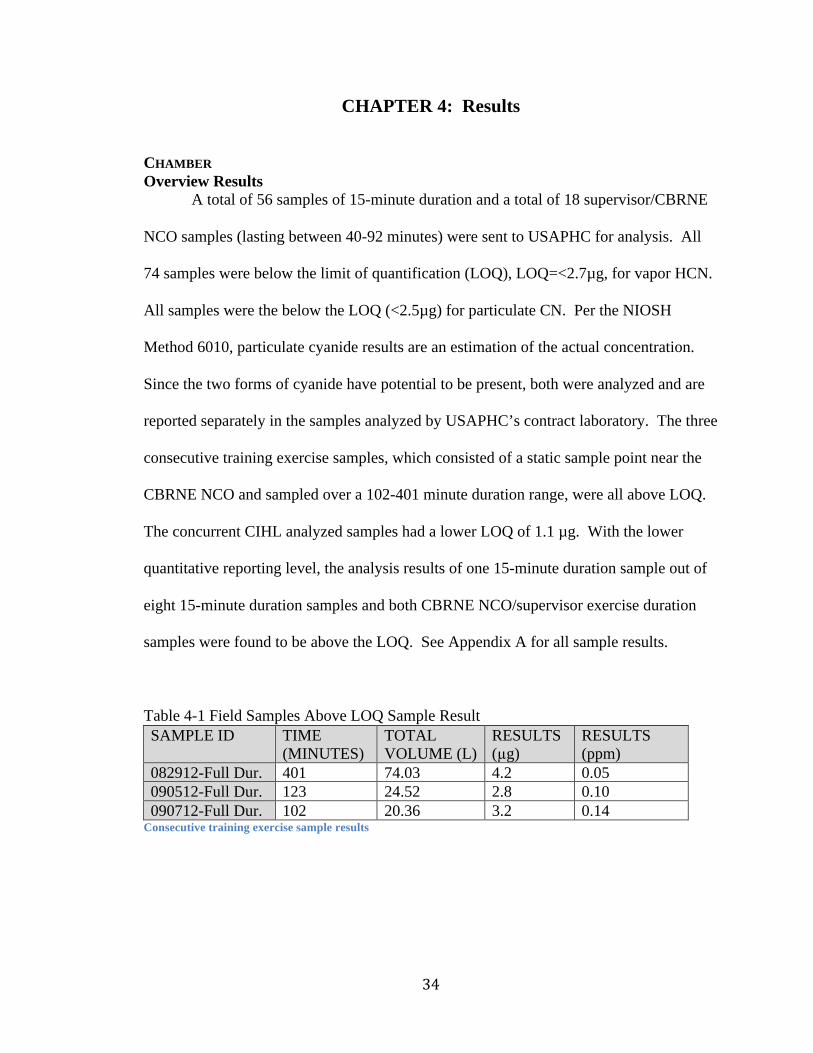
CHAMBER Overview Results
A total of 56 samples of 15-minute duration and a total of 18 supervisor/CBRNE
NCO samples (lasting between 40-92 minutes) were sent to USAPHC for analysis. All
74 samples were below the limit of quantification (LOQ), LOQ=<2.7µg, for vapor HCN.
All samples were the below the LOQ (<2.5µg) for particulate CN. Per the NIOSH
Method 6010, particulate cyanide results are an estimation of the actual concentration.
Since the two forms of cyanide have potential to be present, both were analyzed and are
reported separately in the samples analyzed by USAPHC’s contract laboratory. The three
consecutive training exercise samples, which consisted of a static sample point near the
CBRNE NCO and sampled over a 102-401 minute duration range, were all above LOQ.
The concurrent CIHL analyzed samples had a lower LOQ of 1.1 µg. With the lower
quantitative reporting level, the analysis results of one 15-minute duration sample out of
eight 15-minute duration samples and both CBRNE NCO/supervisor exercise duration
samples were found to be above the LOQ. See Appendix A for all sample results.
Table 4-1 Field Samples Above LOQ Sample Result SAMPLE ID TIME
(MINUTES) TOTAL VOLUME (L)
RESULTS (µg)
RESULTS (ppm)
082912-Full Dur. 401 74.03 4.2 0.05 090512-Full Dur. 123 24.52 2.8 0.10 090712-Full Dur. 102 20.36 3.2 0.14
Consecutive training exercise sample results
35
Table 4-2 Field Samples Above LOQ Sample Results SAMPLE ID TIME
(MINUTES) TOTAL VOLUME (L)
RESULTS (µg)
RESULTS (ppm)
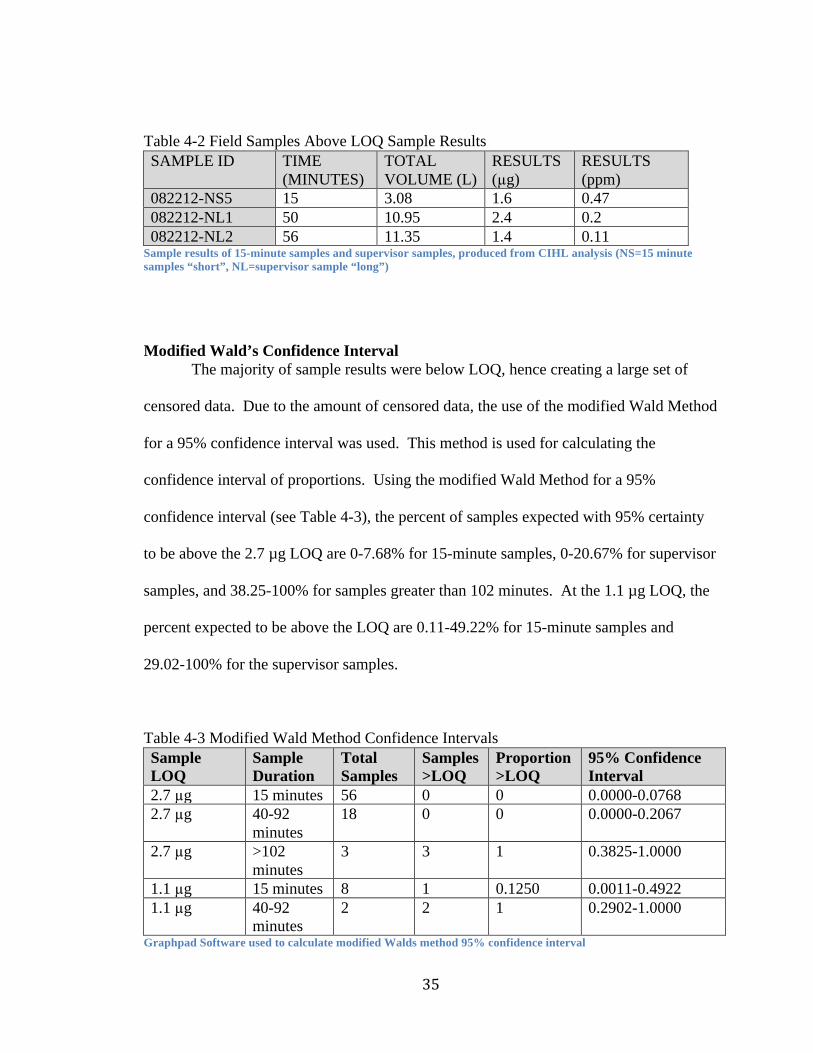
082212-NS5 15 3.08 1.6 0.47 082212-NL1 50 10.95 2.4 0.2 082212-NL2 56 11.35 1.4 0.11
Sample results of 15-minute samples and supervisor samples, produced from CIHL analysis (NS=15 minute samples “short”, NL=supervisor sample “long”)
Modified Wald’s Confidence Interval The majority of sample results were below LOQ, hence creating a large set of
censored data. Due to the amount of censored data, the use of the modified Wald Method
for a 95% confidence interval was used. This method is used for calculating the
confidence interval of proportions. Using the modified Wald Method for a 95%
confidence interval (see Table 4-3), the percent of samples expected with 95% certainty
to be above the 2.7 µg LOQ are 0-7.68% for 15-minute samples, 0-20.67% for supervisor
samples, and 38.25-100% for samples greater than 102 minutes. At the 1.1 µg LOQ, the
percent expected to be above the LOQ are 0.11-49.22% for 15-minute samples and
29.02-100% for the supervisor samples.
Table 4-3 Modified Wald Method Confidence Intervals Sample LOQ
Sample Duration
Total Samples
Samples >LOQ
Proportion >LOQ
95% Confidence Interval
2.7 µg 15 minutes 56 0 0 0.0000-0.0768 2.7 µg 40-92
minutes 18 0 0 0.0000-0.2067
2.7 µg >102 minutes
3 3 1 0.3825-1.0000
1.1 µg 15 minutes 8 1 0.1250 0.0011-0.4922 1.1 µg 40-92
minutes 2 2 1 0.2902-1.0000
Graphpad Software used to calculate modified Walds method 95% confidence interval
36
TUBE FURNACE Overview Results
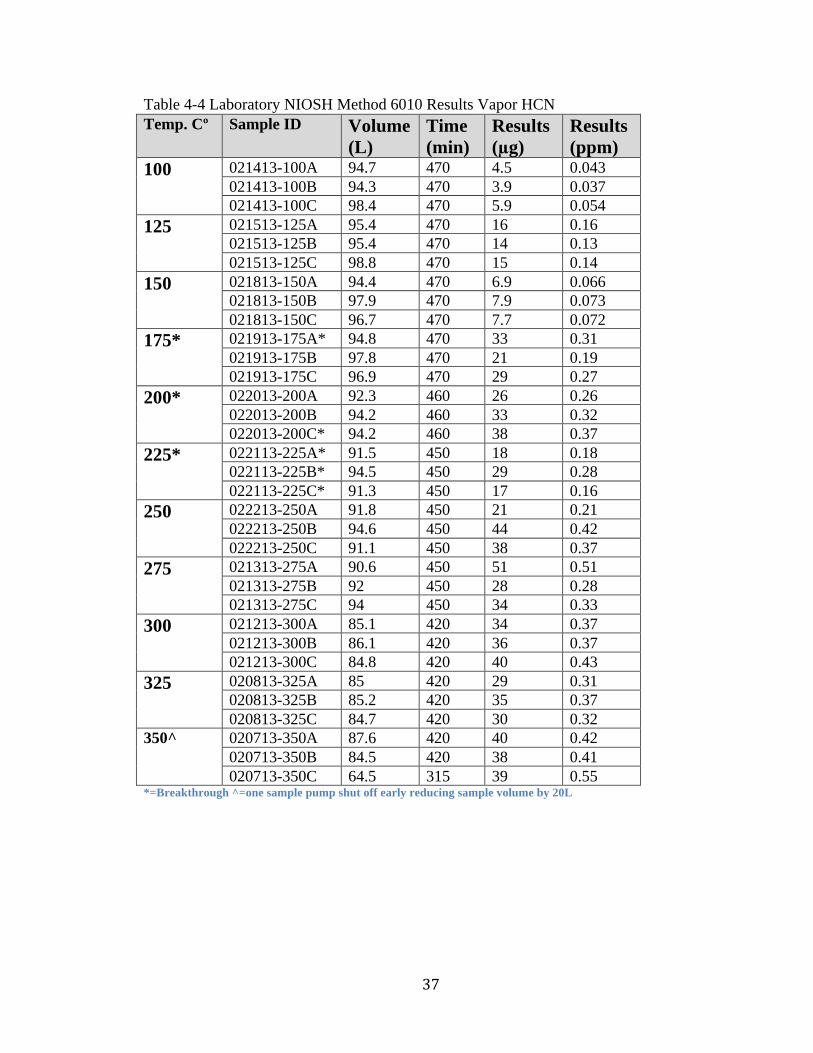
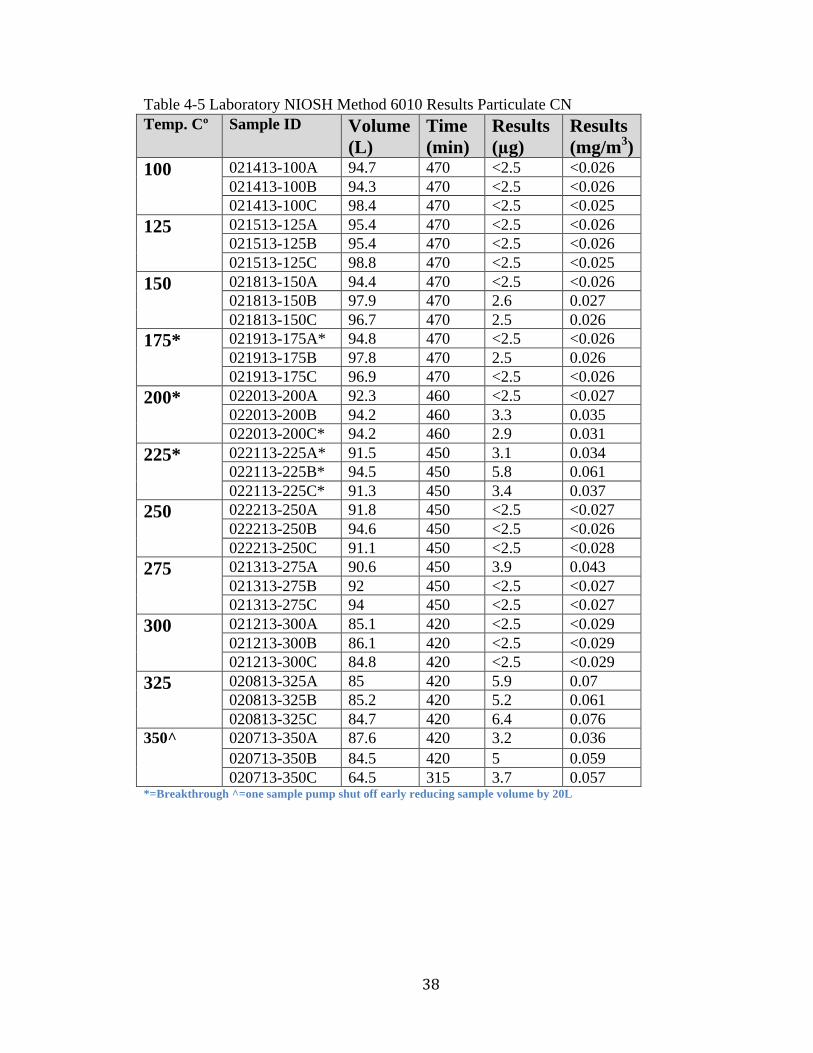
All vapor HCN NIOSH Method 6010 samples were above the LOQ of 2.7 µg. A
portion of the particulate CN samples (15 of 33) were at or above the LOQ of 2.5 µg.
Particulate CN results from NIOSH Method 6010 are an estimate of the mass and
concentration. Results are shown in Tables 4-4 through 4-7 below and in Appendix A.
Breakthrough of HCN to the back section of the sorbent tube for samples at temperatures
175-225 ºC occurred. One sampling pump shut off early at the 350 ºC temperature point
due to battery failure.
37
Table 4-4 Laboratory NIOSH Method 6010 Results Vapor HCN Temp. Cº Sample ID Volume
(L) Time (min)
Results (µg)
Results (ppm)
100 021413-100A 94.7 470 4.5 0.043 021413-100B 94.3 470 3.9 0.037 021413-100C 98.4 470 5.9 0.054
125 021513-125A 95.4 470 16 0.16 021513-125B 95.4 470 14 0.13 021513-125C 98.8 470 15 0.14
150 021813-150A 94.4 470 6.9 0.066 021813-150B 97.9 470 7.9 0.073 021813-150C 96.7 470 7.7 0.072
175* 021913-175A* 94.8 470 33 0.31 021913-175B 97.8 470 21 0.19 021913-175C 96.9 470 29 0.27
200* 022013-200A 92.3 460 26 0.26 022013-200B 94.2 460 33 0.32 022013-200C* 94.2 460 38 0.37
225* 022113-225A* 91.5 450 18 0.18 022113-225B* 94.5 450 29 0.28 022113-225C* 91.3 450 17 0.16
250 022213-250A 91.8 450 21 0.21 022213-250B 94.6 450 44 0.42 022213-250C 91.1 450 38 0.37
275 021313-275A 90.6 450 51 0.51 021313-275B 92 450 28 0.28 021313-275C 94 450 34 0.33
300 021213-300A 85.1 420 34 0.37 021213-300B 86.1 420 36 0.37 021213-300C 84.8 420 40 0.43
325 020813-325A 85 420 29 0.31 020813-325B 85.2 420 35 0.37 020813-325C 84.7 420 30 0.32
350^ 020713-350A 87.6 420 40 0.42 020713-350B 84.5 420 38 0.41 020713-350C 64.5 315 39 0.55
*=Breakthrough ^=one sample pump shut off early reducing sample volume by 20L
38
Table 4-5 Laboratory NIOSH Method 6010 Results Particulate CN Temp. Cº Sample ID Volume
(L) Time (min)
Results (µg)
Results (mg/m3)
100 021413-100A 94.7 470 <2.5 <0.026 021413-100B 94.3 470 <2.5 <0.026 021413-100C 98.4 470 <2.5 <0.025
125 021513-125A 95.4 470 <2.5 <0.026 021513-125B 95.4 470 <2.5 <0.026 021513-125C 98.8 470 <2.5 <0.025
150 021813-150A 94.4 470 <2.5 <0.026 021813-150B 97.9 470 2.6 0.027 021813-150C 96.7 470 2.5 0.026
175* 021913-175A* 94.8 470 <2.5 <0.026 021913-175B 97.8 470 2.5 0.026 021913-175C 96.9 470 <2.5 <0.026
200* 022013-200A 92.3 460 <2.5 <0.027 022013-200B 94.2 460 3.3 0.035 022013-200C* 94.2 460 2.9 0.031
225* 022113-225A* 91.5 450 3.1 0.034 022113-225B* 94.5 450 5.8 0.061 022113-225C* 91.3 450 3.4 0.037
250 022213-250A 91.8 450 <2.5 <0.027 022213-250B 94.6 450 <2.5 <0.026 022213-250C 91.1 450 <2.5 <0.028
275 021313-275A 90.6 450 3.9 0.043 021313-275B 92 450 <2.5 <0.027 021313-275C 94 450 <2.5 <0.027
300 021213-300A 85.1 420 <2.5 <0.029 021213-300B 86.1 420 <2.5 <0.029 021213-300C 84.8 420 <2.5 <0.029
325 020813-325A 85 420 5.9 0.07 020813-325B 85.2 420 5.2 0.061 020813-325C 84.7 420 6.4 0.076
350^ 020713-350A 87.6 420 3.2 0.036 020713-350B 84.5 420 5 0.059 020713-350C 64.5 315 3.7 0.057
*=Breakthrough ^=one sample pump shut off early reducing sample volume by 20L
39
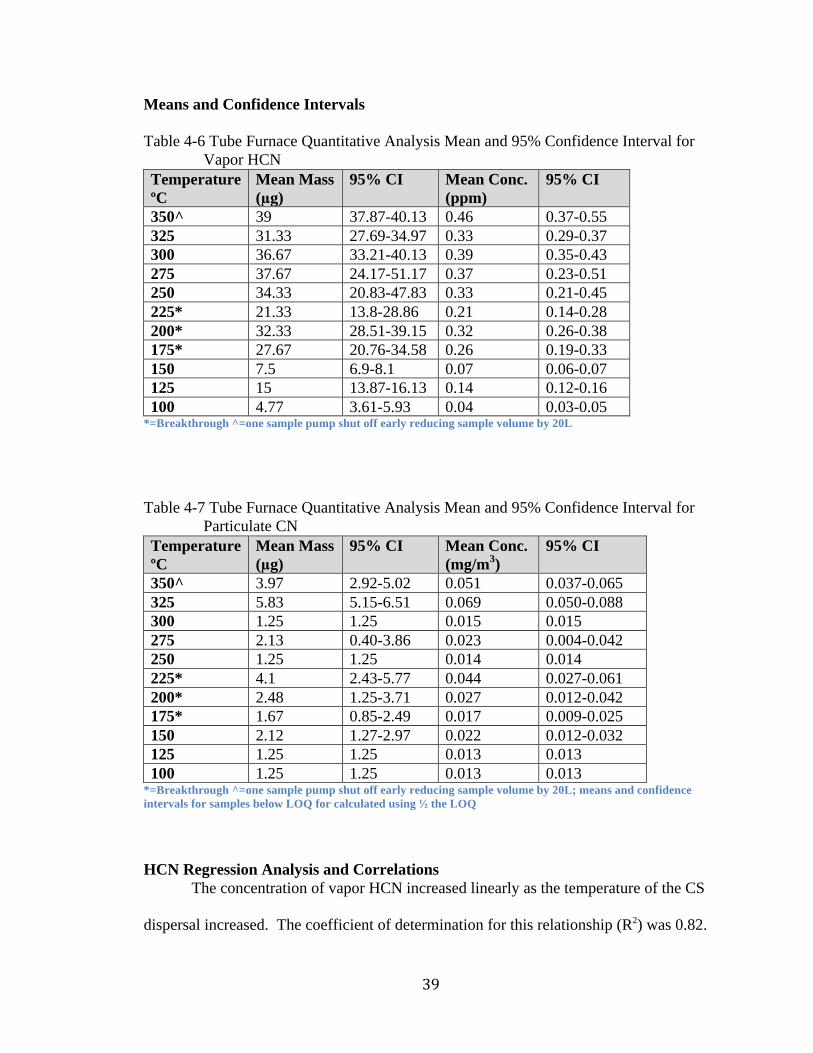
Means and Confidence Intervals Table 4-6 Tube Furnace Quantitative Analysis Mean and 95% Confidence Interval for
Vapor HCN Temperature ºC
Mean Mass (µg)
95% CI Mean Conc. (ppm)
95% CI
350^ 39 37.87-40.13 0.46 0.37-0.55 325 31.33 27.69-34.97 0.33 0.29-0.37 300 36.67 33.21-40.13 0.39 0.35-0.43 275 37.67 24.17-51.17 0.37 0.23-0.51 250 34.33 20.83-47.83 0.33 0.21-0.45 225* 21.33 13.8-28.86 0.21 0.14-0.28 200* 32.33 28.51-39.15 0.32 0.26-0.38 175* 27.67 20.76-34.58 0.26 0.19-0.33 150 7.5 6.9-8.1 0.07 0.06-0.07 125 15 13.87-16.13 0.14 0.12-0.16 100 4.77 3.61-5.93 0.04 0.03-0.05
*=Breakthrough ^=one sample pump shut off early reducing sample volume by 20L
Table 4-7 Tube Furnace Quantitative Analysis Mean and 95% Confidence Interval for Particulate CN
Temperature ºC
Mean Mass (µg)
95% CI Mean Conc. (mg/m3)
95% CI
350^ 3.97 2.92-5.02 0.051 0.037-0.065 325 5.83 5.15-6.51 0.069 0.050-0.088 300 1.25 1.25 0.015 0.015 275 2.13 0.40-3.86 0.023 0.004-0.042 250 1.25 1.25 0.014 0.014 225* 4.1 2.43-5.77 0.044 0.027-0.061 200* 2.48 1.25-3.71 0.027 0.012-0.042 175* 1.67 0.85-2.49 0.017 0.009-0.025 150 2.12 1.27-2.97 0.022 0.012-0.032 125 1.25 1.25 0.013 0.013 100 1.25 1.25 0.013 0.013
*=Breakthrough ^=one sample pump shut off early reducing sample volume by 20L; means and confidence intervals for samples below LOQ for calculated using ½ the LOQ
HCN Regression Analysis and Correlations The concentration of vapor HCN increased linearly as the temperature of the CS
dispersal increased. The coefficient of determination for this relationship (R2) was 0.82.
40
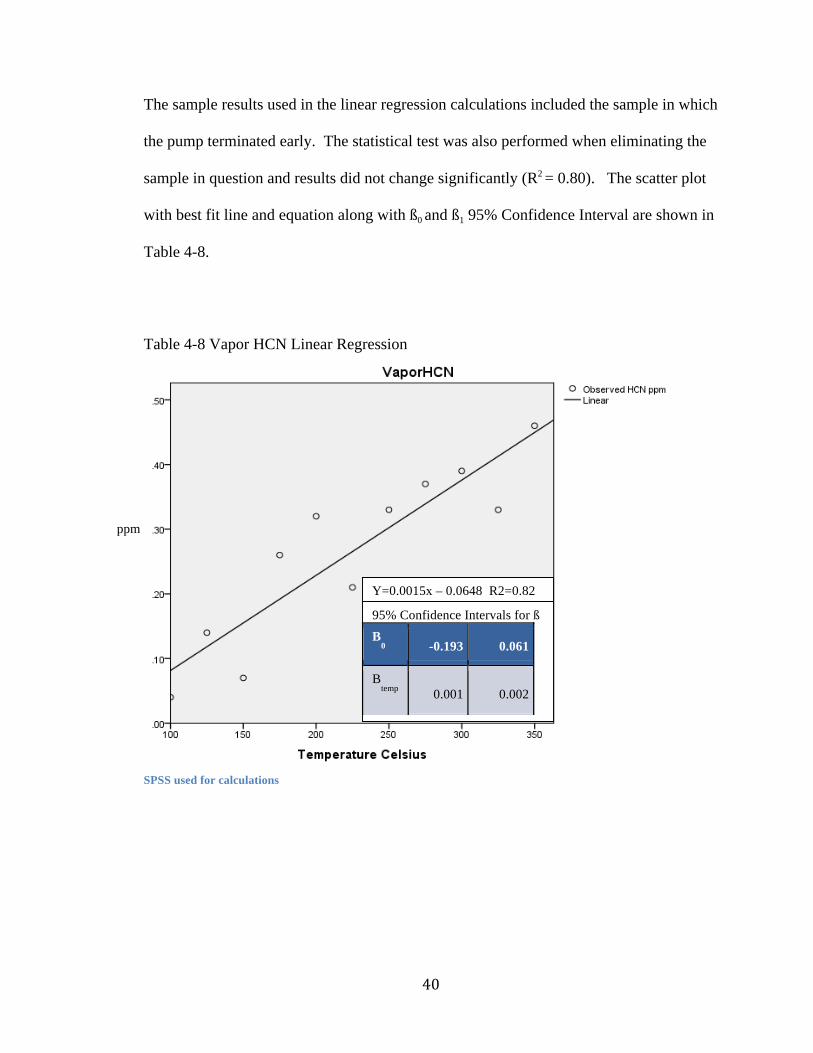
The sample results used in the linear regression calculations included the sample in which
the pump terminated early. The statistical test was also performed when eliminating the
sample in question and results did not change significantly (R2 = 0.80). The scatter plot
with best fit line and equation along with ß0 and ß1 95% Confidence Interval are shown in
Table 4-8.
Table 4-8 Vapor HCN Linear Regression
SPSS used for calculations
ppm
Y=0.0015x – 0.0648 R2=0.82
95% Confidence Intervals for ß B
0
-0.193 0.061
Btemp
0.001 0.002
41
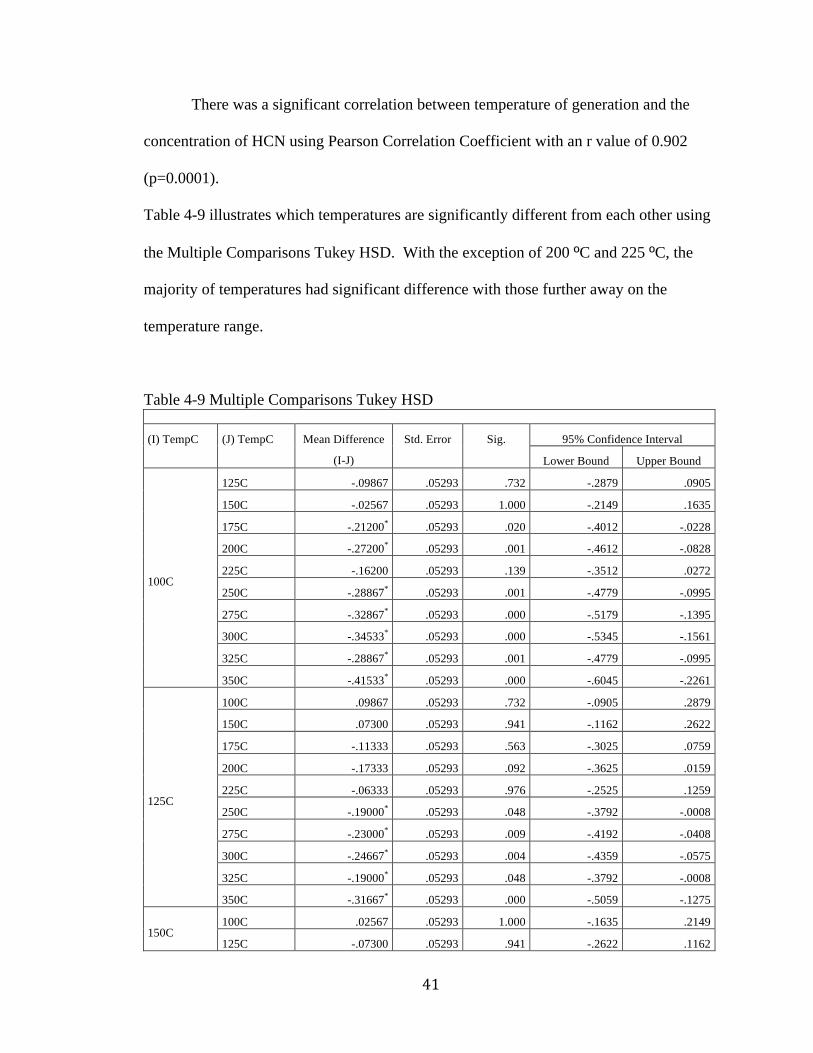
There was a significant correlation between temperature of generation and the
concentration of HCN using Pearson Correlation Coefficient with an r value of 0.902
(p=0.0001).
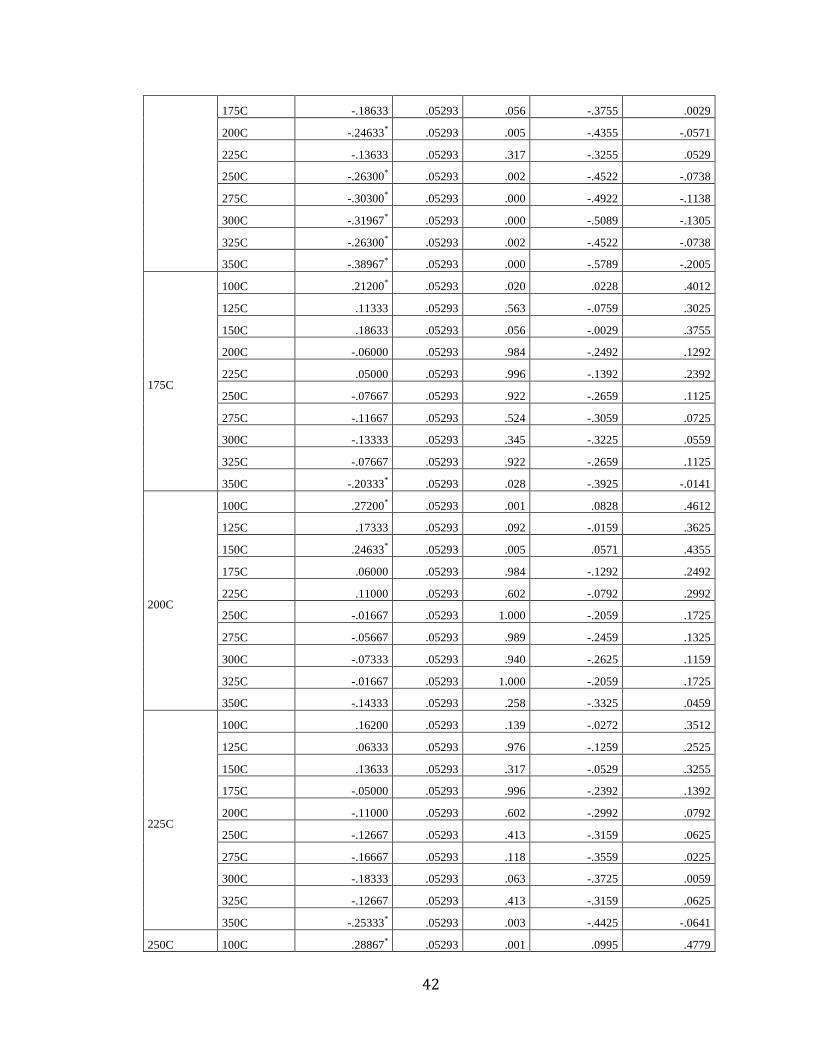
Table 4-9 illustrates which temperatures are significantly different from each other using
the Multiple Comparisons Tukey HSD. With the exception of 200 ºC and 225 ºC, the
majority of temperatures had significant difference with those further away on the
temperature range.
Table 4-9 Multiple Comparisons Tukey HSD
(I) TempC (J) TempC Mean Difference
(I-J)
Std. Error Sig. 95% Confidence Interval
Lower Bound Upper Bound
100C
125C -.09867 .05293 .732 -.2879 .0905
150C -.02567 .05293 1.000 -.2149 .1635
175C -.21200* .05293 .020 -.4012 -.0228
200C -.27200* .05293 .001 -.4612 -.0828
225C -.16200 .05293 .139 -.3512 .0272
250C -.28867* .05293 .001 -.4779 -.0995
275C -.32867* .05293 .000 -.5179 -.1395
300C -.34533* .05293 .000 -.5345 -.1561
325C -.28867* .05293 .001 -.4779 -.0995
350C -.41533* .05293 .000 -.6045 -.2261
125C
100C .09867 .05293 .732 -.0905 .2879
150C .07300 .05293 .941 -.1162 .2622
175C -.11333 .05293 .563 -.3025 .0759
200C -.17333 .05293 .092 -.3625 .0159
225C -.06333 .05293 .976 -.2525 .1259
250C -.19000* .05293 .048 -.3792 -.0008
275C -.23000* .05293 .009 -.4192 -.0408
300C -.24667* .05293 .004 -.4359 -.0575
325C -.19000* .05293 .048 -.3792 -.0008
350C -.31667* .05293 .000 -.5059 -.1275
150C 100C .02567 .05293 1.000 -.1635 .2149
125C -.07300 .05293 .941 -.2622 .1162
42
175C -.18633 .05293 .056 -.3755 .0029
200C -.24633* .05293 .005 -.4355 -.0571
225C -.13633 .05293 .317 -.3255 .0529
250C -.26300* .05293 .002 -.4522 -.0738
275C -.30300* .05293 .000 -.4922 -.1138
300C -.31967* .05293 .000 -.5089 -.1305
325C -.26300* .05293 .002 -.4522 -.0738
350C -.38967* .05293 .000 -.5789 -.2005
175C
100C .21200* .05293 .020 .0228 .4012
125C .11333 .05293 .563 -.0759 .3025
150C .18633 .05293 .056 -.0029 .3755
200C -.06000 .05293 .984 -.2492 .1292
225C .05000 .05293 .996 -.1392 .2392
250C -.07667 .05293 .922 -.2659 .1125
275C -.11667 .05293 .524 -.3059 .0725
300C -.13333 .05293 .345 -.3225 .0559
325C -.07667 .05293 .922 -.2659 .1125
350C -.20333* .05293 .028 -.3925 -.0141
200C
100C .27200* .05293 .001 .0828 .4612
125C .17333 .05293 .092 -.0159 .3625
150C .24633* .05293 .005 .0571 .4355
175C .06000 .05293 .984 -.1292 .2492
225C .11000 .05293 .602 -.0792 .2992
250C -.01667 .05293 1.000 -.2059 .1725
275C -.05667 .05293 .989 -.2459 .1325
300C -.07333 .05293 .940 -.2625 .1159
325C -.01667 .05293 1.000 -.2059 .1725
350C -.14333 .05293 .258 -.3325 .0459
225C
100C .16200 .05293 .139 -.0272 .3512
125C .06333 .05293 .976 -.1259 .2525
150C .13633 .05293 .317 -.0529 .3255
175C -.05000 .05293 .996 -.2392 .1392
200C -.11000 .05293 .602 -.2992 .0792
250C -.12667 .05293 .413 -.3159 .0625
275C -.16667 .05293 .118 -.3559 .0225
300C -.18333 .05293 .063 -.3725 .0059
325C -.12667 .05293 .413 -.3159 .0625
350C -.25333* .05293 .003 -.4425 -.0641
250C 100C .28867* .05293 .001 .0995 .4779
43
125C .19000* .05293 .048 .0008 .3792
150C .26300* .05293 .002 .0738 .4522
175C .07667 .05293 .922 -.1125 .2659
200C .01667 .05293 1.000 -.1725 .2059
225C .12667 .05293 .413 -.0625 .3159
275C -.04000 .05293 .999 -.2292 .1492
300C -.05667 .05293 .989 -.2459 .1325
325C .00000 .05293 1.000 -.1892 .1892
350C -.12667 .05293 .413 -.3159 .0625
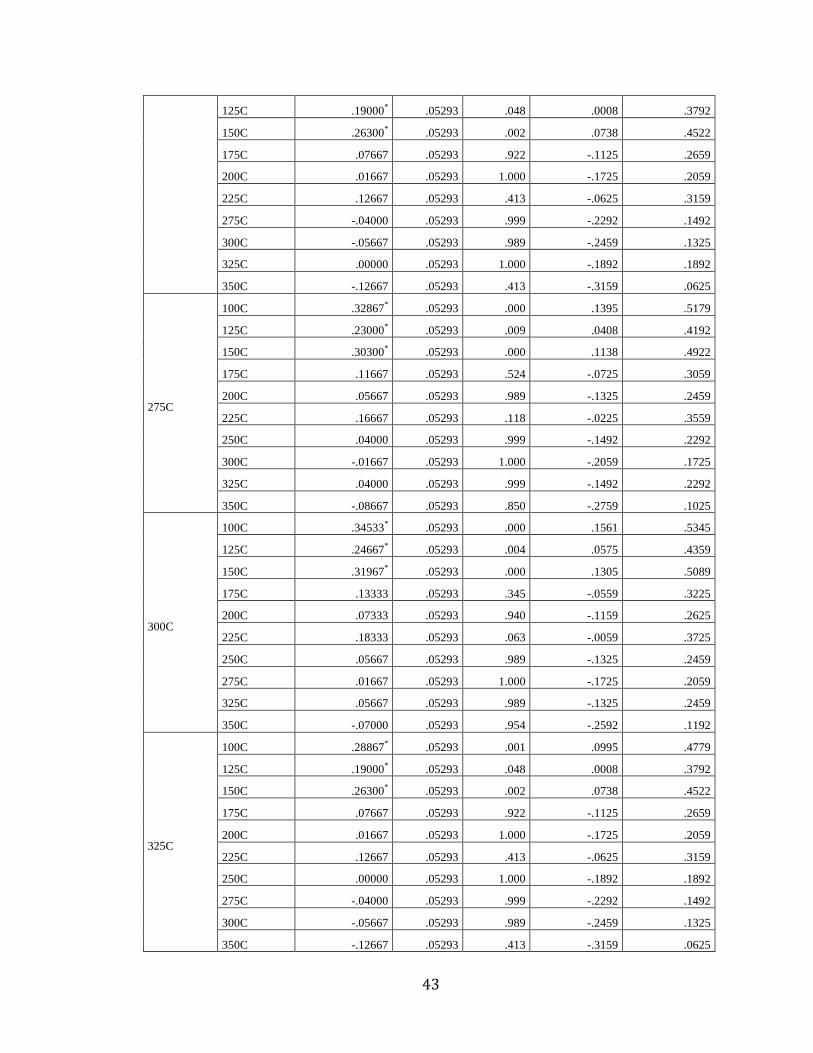
275C
100C .32867* .05293 .000 .1395 .5179
125C .23000* .05293 .009 .0408 .4192
150C .30300* .05293 .000 .1138 .4922
175C .11667 .05293 .524 -.0725 .3059
200C .05667 .05293 .989 -.1325 .2459
225C .16667 .05293 .118 -.0225 .3559
250C .04000 .05293 .999 -.1492 .2292
300C -.01667 .05293 1.000 -.2059 .1725
325C .04000 .05293 .999 -.1492 .2292
350C -.08667 .05293 .850 -.2759 .1025
300C
100C .34533* .05293 .000 .1561 .5345
125C .24667* .05293 .004 .0575 .4359
150C .31967* .05293 .000 .1305 .5089
175C .13333 .05293 .345 -.0559 .3225
200C .07333 .05293 .940 -.1159 .2625
225C .18333 .05293 .063 -.0059 .3725
250C .05667 .05293 .989 -.1325 .2459
275C .01667 .05293 1.000 -.1725 .2059
325C .05667 .05293 .989 -.1325 .2459
350C -.07000 .05293 .954 -.2592 .1192
325C
100C .28867* .05293 .001 .0995 .4779
125C .19000* .05293 .048 .0008 .3792
150C .26300* .05293 .002 .0738 .4522
175C .07667 .05293 .922 -.1125 .2659
200C .01667 .05293 1.000 -.1725 .2059
225C .12667 .05293 .413 -.0625 .3159
250C .00000 .05293 1.000 -.1892 .1892
275C -.04000 .05293 .999 -.2292 .1492
300C -.05667 .05293 .989 -.2459 .1325
350C -.12667 .05293 .413 -.3159 .0625
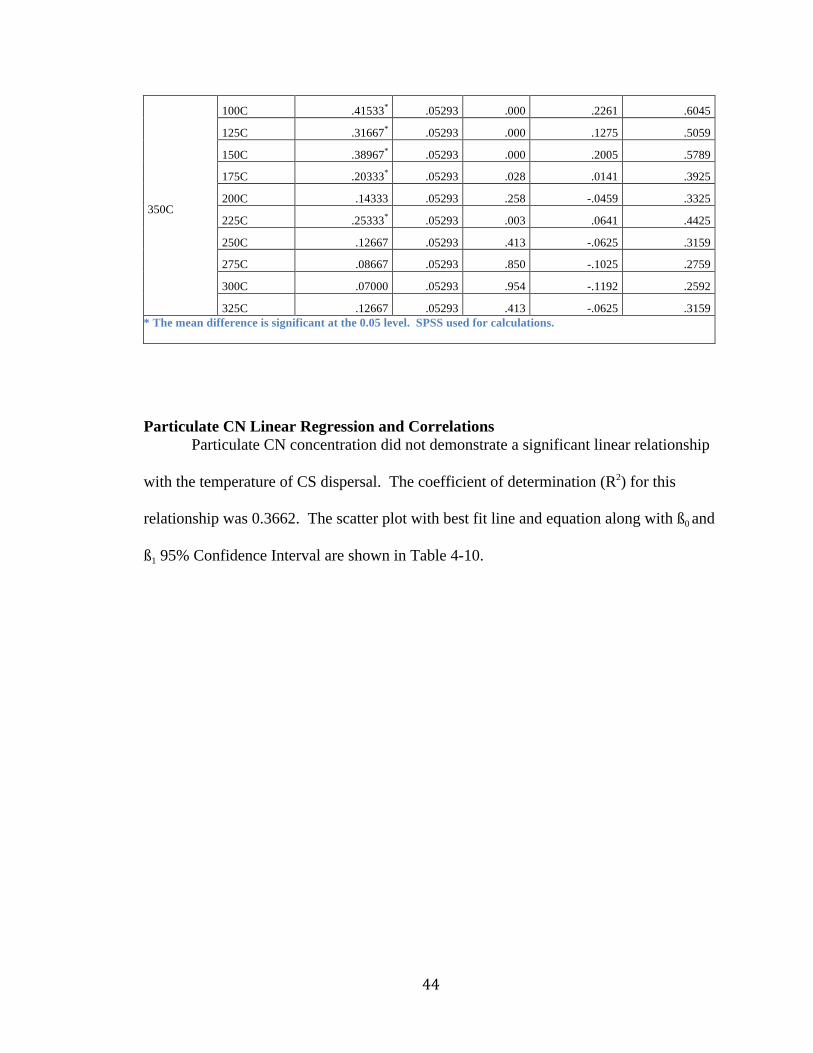
44
350C
100C .41533* .05293 .000 .2261 .6045
125C .31667* .05293 .000 .1275 .5059
150C .38967* .05293 .000 .2005 .5789
175C .20333* .05293 .028 .0141 .3925
200C .14333 .05293 .258 -.0459 .3325
225C .25333* .05293 .003 .0641 .4425
250C .12667 .05293 .413 -.0625 .3159
275C .08667 .05293 .850 -.1025 .2759
300C .07000 .05293 .954 -.1192 .2592
325C .12667 .05293 .413 -.0625 .3159 * The mean difference is significant at the 0.05 level. SPSS used for calculations.
Particulate CN Linear Regression and Correlations Particulate CN concentration did not demonstrate a significant linear relationship
with the temperature of CS dispersal. The coefficient of determination (R2) for this
relationship was 0.3662. The scatter plot with best fit line and equation along with ß0 and
ß1 95% Confidence Interval are shown in Table 4-10.
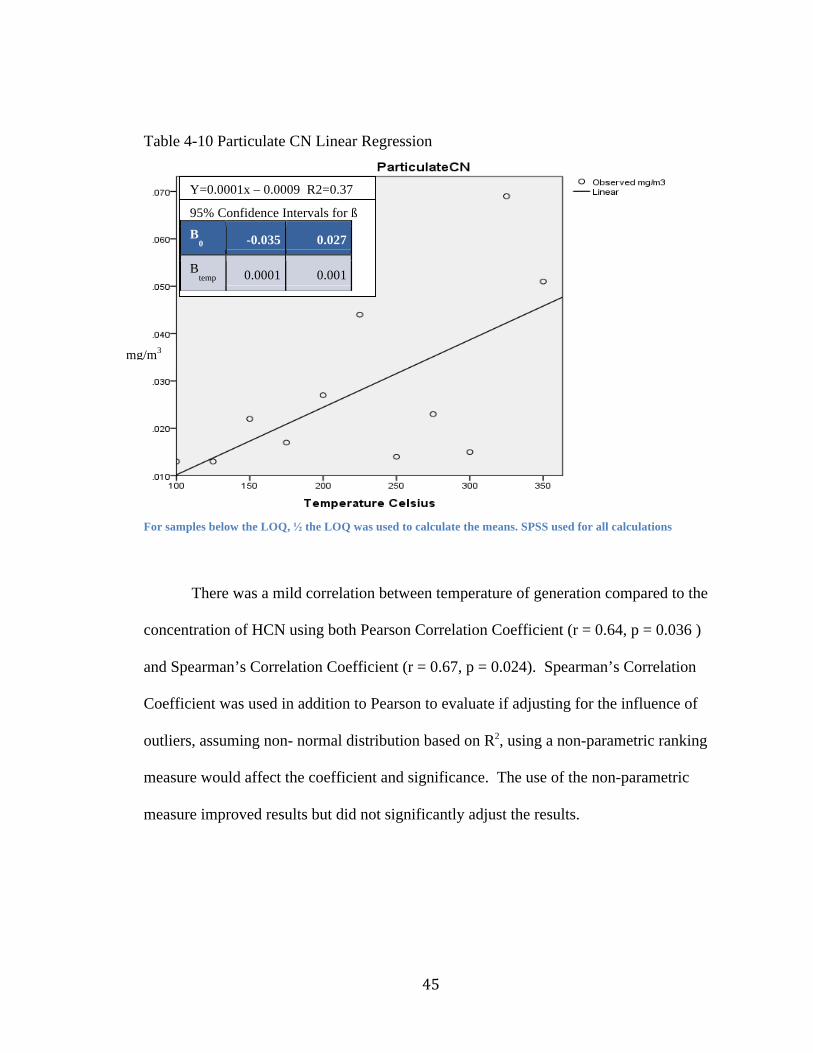
45
Table 4-10 Particulate CN Linear Regression
For samples below the LOQ, ½ the LOQ was used to calculate the means. SPSS used for all calculations
There was a mild correlation between temperature of generation compared to the
concentration of HCN using both Pearson Correlation Coefficient (r = 0.64, p = 0.036 )
and Spearman’s Correlation Coefficient (r = 0.67, p = 0.024). Spearman’s Correlation
Coefficient was used in addition to Pearson to evaluate if adjusting for the influence of
outliers, assuming non- normal distribution based on R2, using a non-parametric ranking
measure would affect the coefficient and significance. The use of the non-parametric
measure improved results but did not significantly adjust the results.
Y=0.0001x – 0.0009 R2=0.37
mg/m3
95% Confidence Intervals for ß B
0 -0.035 0.027
Btemp
0.0001 0.001
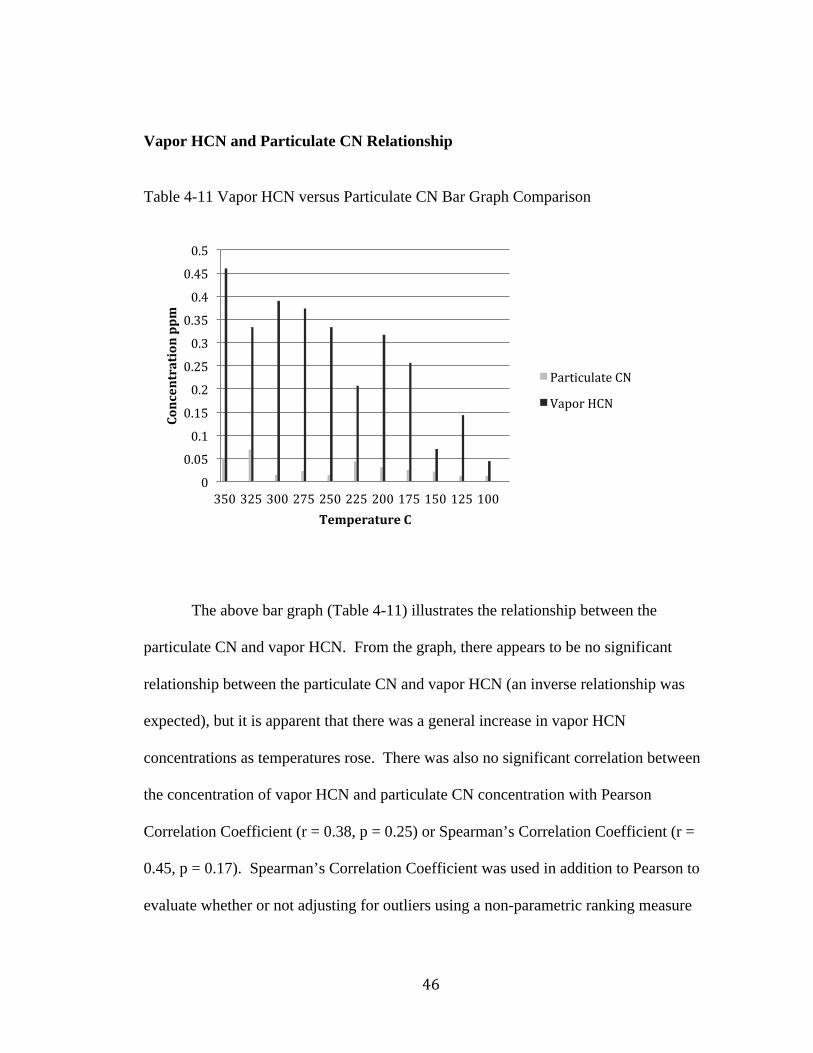
46
Vapor HCN and Particulate CN Relationship Table 4-11 Vapor HCN versus Particulate CN Bar Graph Comparison
The above bar graph (Table 4-11) illustrates the relationship between the
particulate CN and vapor HCN. From the graph, there appears to be no significant
relationship between the particulate CN and vapor HCN (an inverse relationship was
expected), but it is apparent that there was a general increase in vapor HCN
concentrations as temperatures rose. There was also no significant correlation between
the concentration of vapor HCN and particulate CN concentration with Pearson
Correlation Coefficient (r = 0.38, p = 0.25) or Spearman’s Correlation Coefficient (r =
0.45, p = 0.17). Spearman’s Correlation Coefficient was used in addition to Pearson to
evaluate whether or not adjusting for outliers using a non-parametric ranking measure
0
0.05
0.1
0.15
0.2
0.25
0.3
0.35
0.4
0.45
0.5
350 325 300 275 250 225 200 175 150 125 100
Concentration ppm
Temperature C
Particulate CN
Vapor HCN
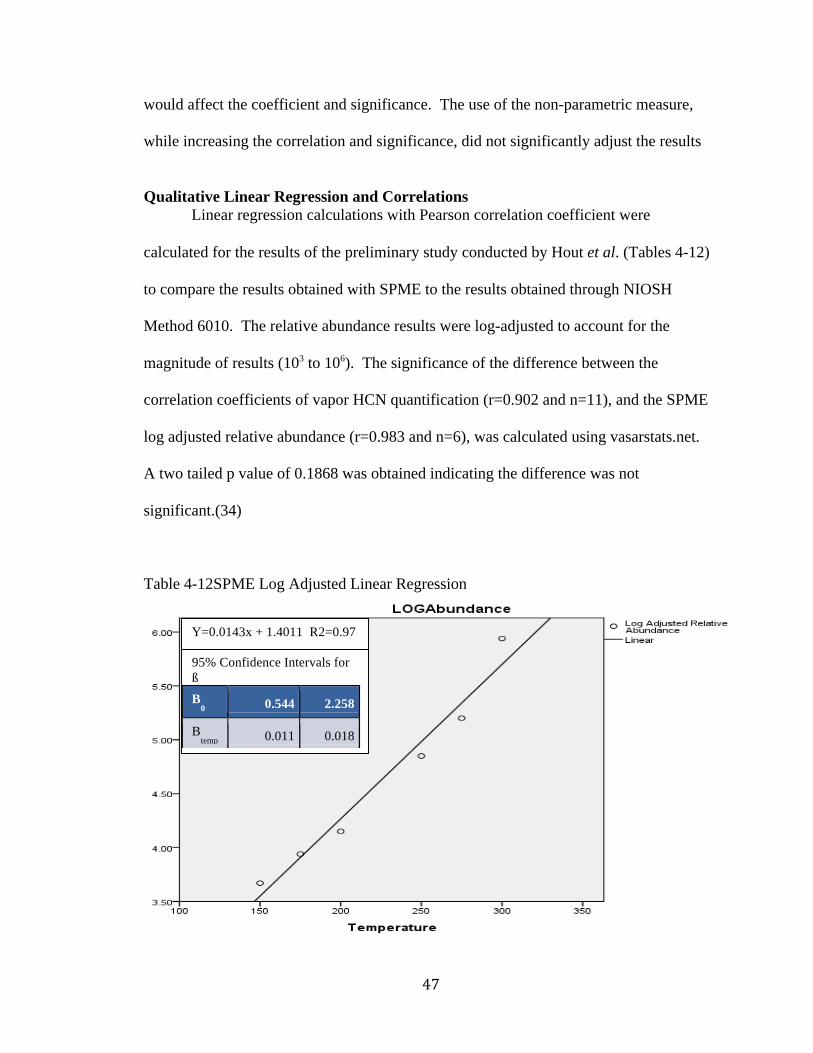
47
would affect the coefficient and significance. The use of the non-parametric measure,
while increasing the correlation and significance, did not significantly adjust the results
Qualitative Linear Regression and Correlations
Linear regression calculations with Pearson correlation coefficient were
calculated for the results of the preliminary study conducted by Hout et al. (Tables 4-12)
to compare the results obtained with SPME to the results obtained through NIOSH
Method 6010. The relative abundance results were log-adjusted to account for the
magnitude of results (103 to 106). The significance of the difference between the
correlation coefficients of vapor HCN quantification (r=0.902 and n=11), and the SPME
log adjusted relative abundance (r=0.983 and n=6), was calculated using vasarstats.net.
A two tailed p value of 0.1868 was obtained indicating the difference was not
significant.(34)
Table 4-12SPME Log Adjusted Linear Regression
Y=0.0143x + 1.4011 R2=0.97
95% Confidence Intervals for ß B
0 0.544 2.258
Btemp
0.011 0.018

48
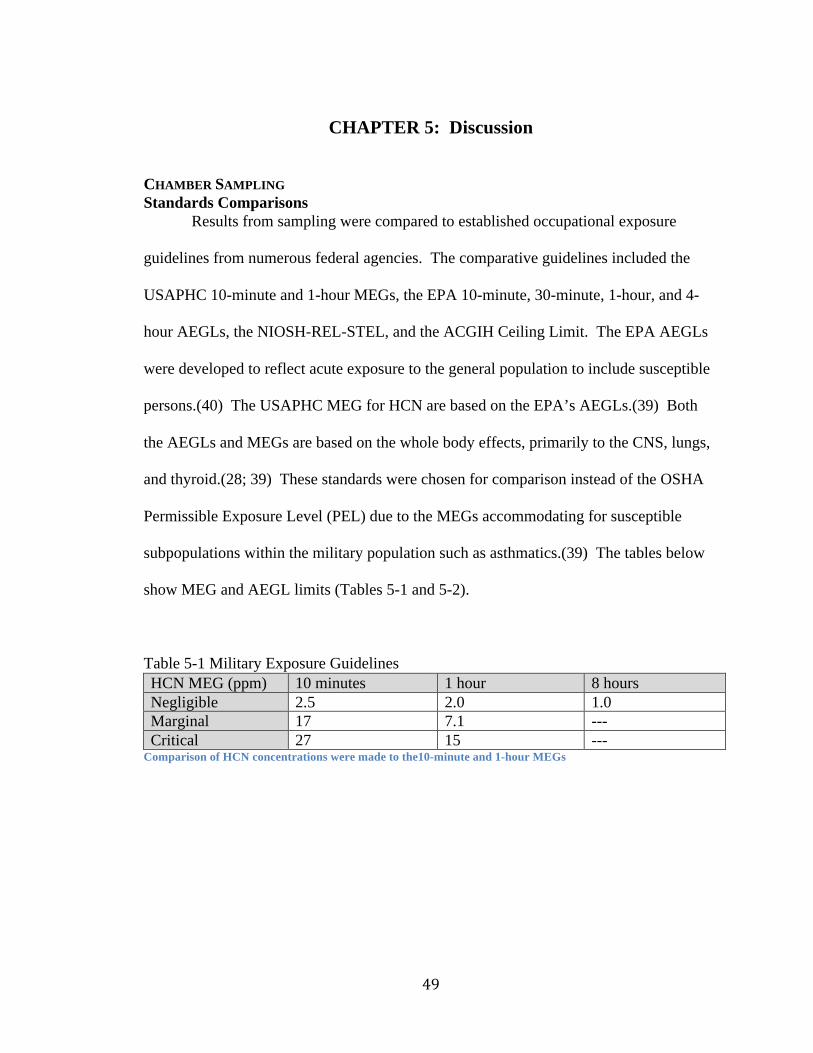
49
CHAPTER 5: Discussion
CHAMBER SAMPLING Standards Comparisons
Results from sampling were compared to established occupational exposure
guidelines from numerous federal agencies. The comparative guidelines included the
USAPHC 10-minute and 1-hour MEGs, the EPA 10-minute, 30-minute, 1-hour, and 4-
hour AEGLs, the NIOSH-REL-STEL, and the ACGIH Ceiling Limit. The EPA AEGLs
were developed to reflect acute exposure to the general population to include susceptible
persons.(40) The USAPHC MEG for HCN are based on the EPA’s AEGLs.(39) Both
the AEGLs and MEGs are based on the whole body effects, primarily to the CNS, lungs,
and thyroid.(28; 39) These standards were chosen for comparison instead of the OSHA
Permissible Exposure Level (PEL) due to the MEGs accommodating for susceptible
subpopulations within the military population such as asthmatics.(39) The tables below
show MEG and AEGL limits (Tables 5-1 and 5-2).
Table 5-1 Military Exposure Guidelines HCN MEG (ppm) 10 minutes 1 hour 8 hours Negligible 2.5 2.0 1.0 Marginal 17 7.1 --- Critical 27 15 ---
Comparison of HCN concentrations were made to the10-minute and 1-hour MEGs
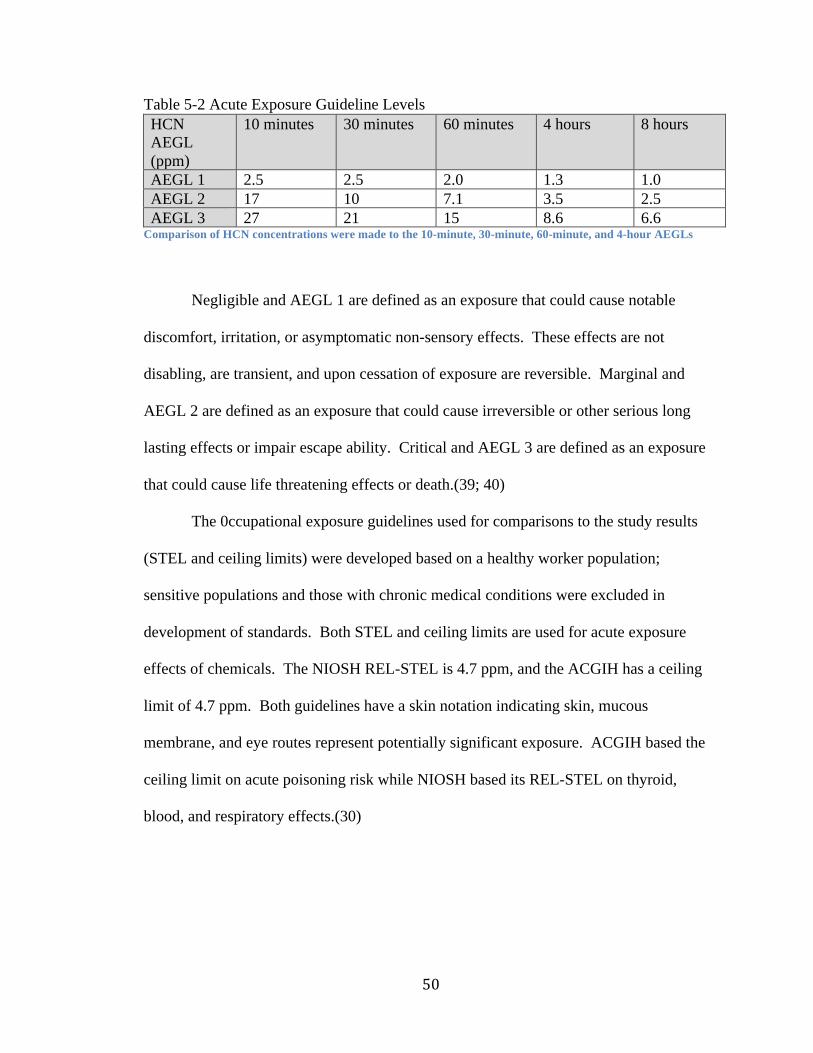
50
Table 5-2 Acute Exposure Guideline Levels HCN AEGL (ppm)
10 minutes 30 minutes 60 minutes 4 hours 8 hours
AEGL 1 2.5 2.5 2.0 1.3 1.0 AEGL 2 17 10 7.1 3.5 2.5 AEGL 3 27 21 15 8.6 6.6
Comparison of HCN concentrations were made to the 10-minute, 30-minute, 60-minute, and 4-hour AEGLs
Negligible and AEGL 1 are defined as an exposure that could cause notable
discomfort, irritation, or asymptomatic non-sensory effects. These effects are not
disabling, are transient, and upon cessation of exposure are reversible. Marginal and
AEGL 2 are defined as an exposure that could cause irreversible or other serious long
lasting effects or impair escape ability. Critical and AEGL 3 are defined as an exposure
that could cause life threatening effects or death.(39; 40)
The 0ccupational exposure guidelines used for comparisons to the study results
(STEL and ceiling limits) were developed based on a healthy worker population;
sensitive populations and those with chronic medical conditions were excluded in
development of standards. Both STEL and ceiling limits are used for acute exposure
effects of chemicals. The NIOSH REL-STEL is 4.7 ppm, and the ACGIH has a ceiling
limit of 4.7 ppm. Both guidelines have a skin notation indicating skin, mucous
membrane, and eye routes represent potentially significant exposure. ACGIH based the
ceiling limit on acute poisoning risk while NIOSH based its REL-STEL on thyroid,
blood, and respiratory effects.(30)
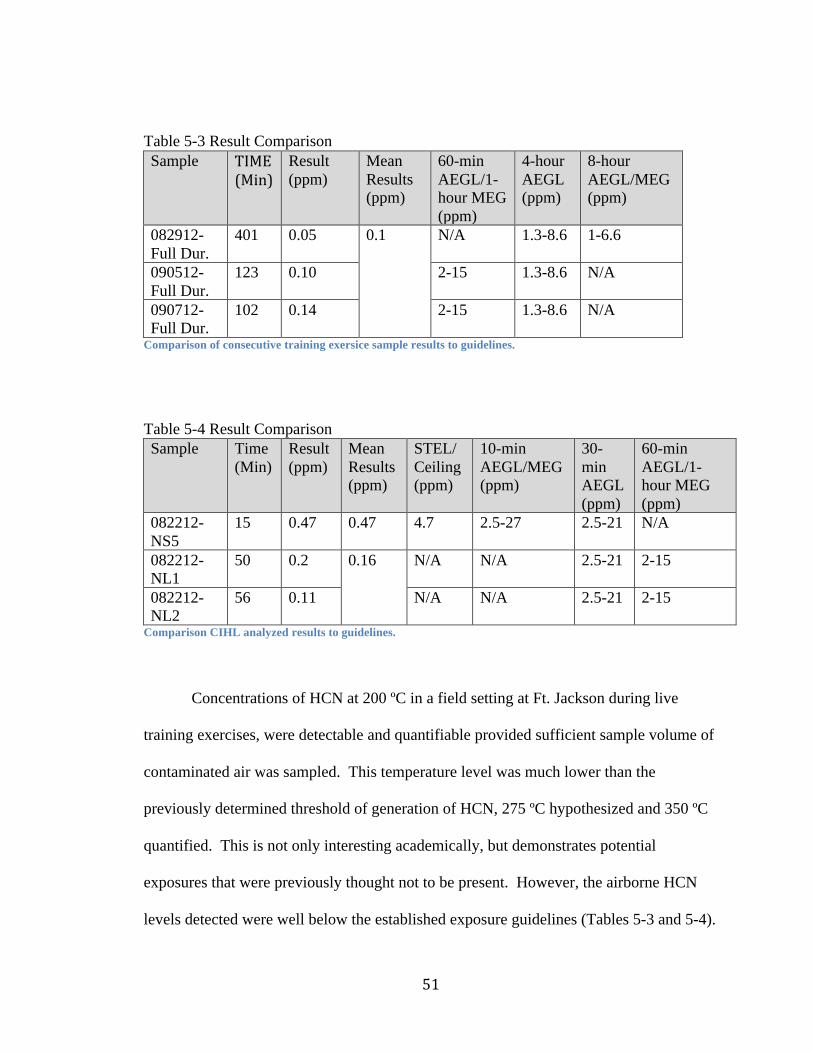
51
Table 5-3 Result Comparison Sample TIME
(Min) Result (ppm)
Mean Results (ppm)
60-min AEGL/1- hour MEG (ppm)
4-hour AEGL (ppm)
8-hour AEGL/MEG (ppm)
082912-Full Dur.
401 0.05 0.1 N/A 1.3-8.6 1-6.6
090512-Full Dur.
123 0.10 2-15 1.3-8.6 N/A
090712-Full Dur.
102 0.14 2-15 1.3-8.6 N/A
Comparison of consecutive training exersice sample results to guidelines.
Table 5-4 Result Comparison Sample Time
(Min) Result (ppm)
Mean Results (ppm)
STEL/Ceiling (ppm)
10-min AEGL/MEG (ppm)
30-min AEGL (ppm)
60-min AEGL/1- hour MEG (ppm)
082212-NS5
15 0.47 0.47 4.7 2.5-27 2.5-21 N/A
082212-NL1
50 0.2 0.16 N/A N/A 2.5-21 2-15
082212-NL2
56 0.11 N/A N/A 2.5-21 2-15
Comparison CIHL analyzed results to guidelines.
Concentrations of HCN at 200 ºC in a field setting at Ft. Jackson during live
training exercises, were detectable and quantifiable provided sufficient sample volume of
contaminated air was sampled. This temperature level was much lower than the
previously determined threshold of generation of HCN, 275 ºC hypothesized and 350 ºC
quantified. This is not only interesting academically, but demonstrates potential
exposures that were previously thought not to be present. However, the airborne HCN
levels detected were well below the established exposure guidelines (Tables 5-3 and 5-4).
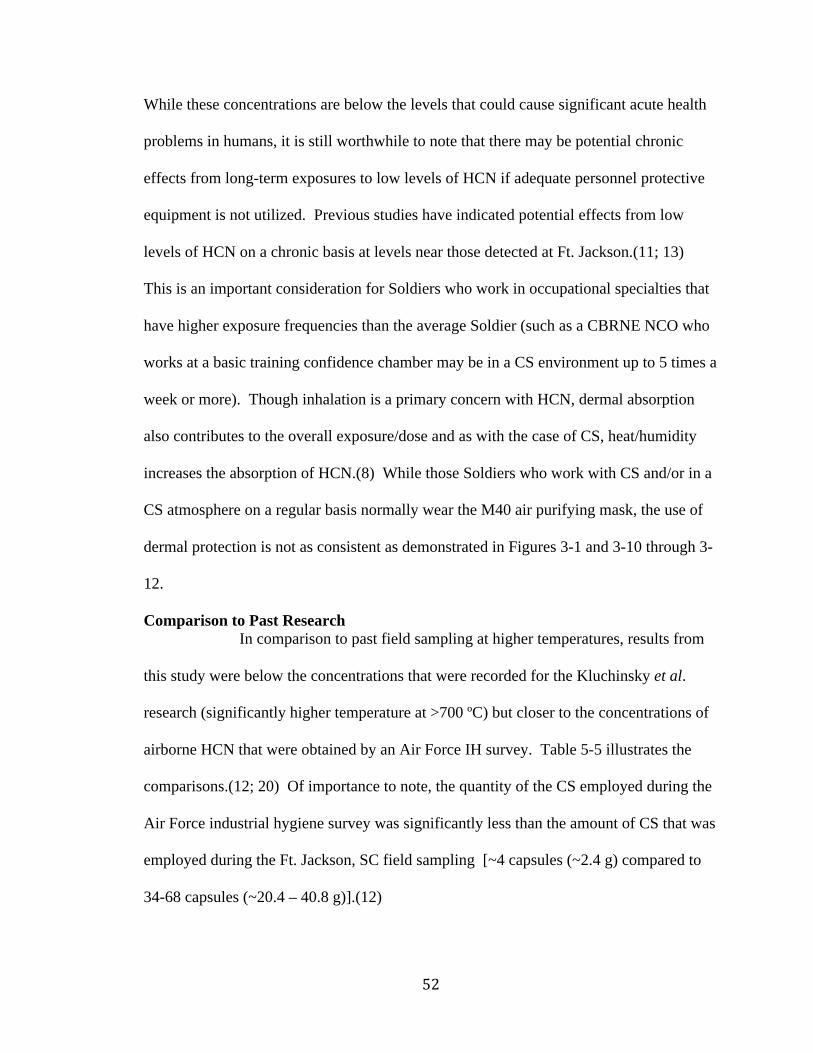
52
While these concentrations are below the levels that could cause significant acute health
problems in humans, it is still worthwhile to note that there may be potential chronic
effects from long-term exposures to low levels of HCN if adequate personnel protective
equipment is not utilized. Previous studies have indicated potential effects from low
levels of HCN on a chronic basis at levels near those detected at Ft. Jackson.(11; 13)
This is an important consideration for Soldiers who work in occupational specialties that
have higher exposure frequencies than the average Soldier (such as a CBRNE NCO who
works at a basic training confidence chamber may be in a CS environment up to 5 times a
week or more). Though inhalation is a primary concern with HCN, dermal absorption
also contributes to the overall exposure/dose and as with the case of CS, heat/humidity
increases the absorption of HCN.(8) While those Soldiers who work with CS and/or in a
CS atmosphere on a regular basis normally wear the M40 air purifying mask, the use of
dermal protection is not as consistent as demonstrated in Figures 3-1 and 3-10 through 3-
12.
Comparison to Past Research In comparison to past field sampling at higher temperatures, results from
this study were below the concentrations that were recorded for the Kluchinsky et al.
research (significantly higher temperature at >700 ºC) but closer to the concentrations of
airborne HCN that were obtained by an Air Force IH survey. Table 5-5 illustrates the
comparisons.(12; 20) Of importance to note, the quantity of the CS employed during the
Air Force industrial hygiene survey was significantly less than the amount of CS that was
employed during the Ft. Jackson, SC field sampling [~4 capsules (~2.4 g) compared to
34-68 capsules (~20.4 – 40.8 g)].(12)
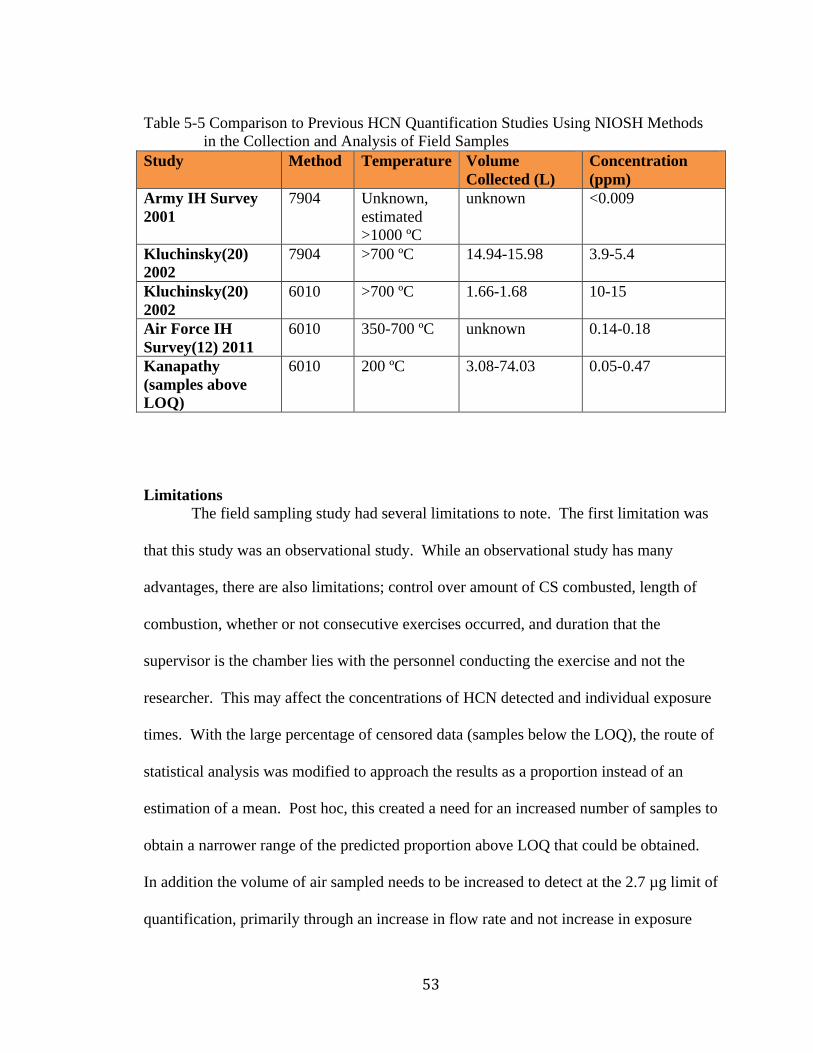
53
Table 5-5 Comparison to Previous HCN Quantification Studies Using NIOSH Methods
in the Collection and Analysis of Field Samples Study Method Temperature Volume
Collected (L) Concentration (ppm)
Army IH Survey 2001
7904 Unknown, estimated >1000 ºC
unknown <0.009
Kluchinsky(20) 2002
7904 >700 ºC 14.94-15.98 3.9-5.4
Kluchinsky(20) 2002
6010 >700 ºC 1.66-1.68 10-15
Air Force IH Survey(12) 2011
6010 350-700 ºC unknown 0.14-0.18
Kanapathy (samples above LOQ)
6010 200 ºC 3.08-74.03 0.05-0.47
Limitations
The field sampling study had several limitations to note. The first limitation was
that this study was an observational study. While an observational study has many
advantages, there are also limitations; control over amount of CS combusted, length of
combustion, whether or not consecutive exercises occurred, and duration that the
supervisor is the chamber lies with the personnel conducting the exercise and not the
researcher. This may affect the concentrations of HCN detected and individual exposure
times. With the large percentage of censored data (samples below the LOQ), the route of
statistical analysis was modified to approach the results as a proportion instead of an
estimation of a mean. Post hoc, this created a need for an increased number of samples to
obtain a narrower range of the predicted proportion above LOQ that could be obtained.
In addition the volume of air sampled needs to be increased to detect at the 2.7 µg limit of
quantification, primarily through an increase in flow rate and not increase in exposure

54
duration due to the study being observational in nature. In addition, more sampling
during consecutive exercises and sample analysis through a laboratory with lower LOQ
for 15 minute duration samples and supervisor samples needs to be conducted. It is
important to remember, while the samples may fall below LOQ, it does not necessarily
mean that the substance is not present, which was shown with three samples falling in
between the two different LOQs (1.1 and 2.7 µg).
TUBE FURNACE Observations
Several notable observations were made during the thermal degradation of CS
within the tube furnace reaction system which raises additional questions regarding the
combustion (endothermic degradation) processes of CS at these lower temperatures. The
following was visually observed during the tube furnace experiment:
1. Visible white exhaust was present 250-350 ºC. Exhaust was not visible
below 250 ºC. At 250-350 ºC fine particles were noted. A large quantity of
crystal-like fibers from 100-225 ºC were present. These fibers were
approximately between 0.2-1 cm in length. This created occasional blockage
of the sorbent tubes. This may have affected results, in particular particulate
CN. This may be from incomplete combustion below 250 ºC.
2. Soda lime sorbent tubes turned from white to purple completely through,
front to back of sorbent tube, from100-225 ºC. Soda lime is manufactured
with an indicator dye that turns purple when exposed to carbon dioxide in
concentrations that exhaust the absorptive capacity and thus cause
breakthrough (loss) fo the analyte of interest.(1) While it is possible that CO2
was the cause of this observation, another chemical may have caused the
55
interference. This may have affected results by hindering the ability of
sorbent to capture the HCN and subsequent loss of some of the HCN analyte.
At 250-275 ºC there was a minimal band of purple discoloration at the front
end of the sorbent. At 300-350 ºC, no purple discoloration was noted. This
finding warrants further investigation to determine whether or not CO2 was
the source.
Quantification
Quantification of HCN was obtained at all temperatures sampled (100-350 ºC) for
vapor HCN in a linear relationship; concentration of HCN increased as temperature of
generation increased. Particulate CN was present at various temperatures but did not
present in a linear relationship to temperature. Results that were less than the LOQ (2.5
µg) for particulate CN were assessed statistically using ½ the LOQ (1.25 µg). The use of
½ the LOQ for the concentration of samples that presented below the LOQ may create
either an over or underestimation of the amount of particulate CN generated. Obtaining
particulate CN in the laboratory sampling and not the field sampling may have been aided
by the proximity of the collection devices (sorbent tubes and/or SPME) to the point of
generation and the flow gas but inhibited by periodic particulate blockage of sorbent
tubes at temperatures 100-225 ºC. The concentration of particulate CN generated was
compared to the concentration of vapor HCN generated. No linear or significant
relationship was determined (an inverse relationship was anticipated, the greater
concentration of vapor HCN the reduced concentration of particulate CN due to
combustion processes), nor did adding the particulate CN results to the vapor HCN
results adjust the best fit line significantly. The mean concentrations at each temperature
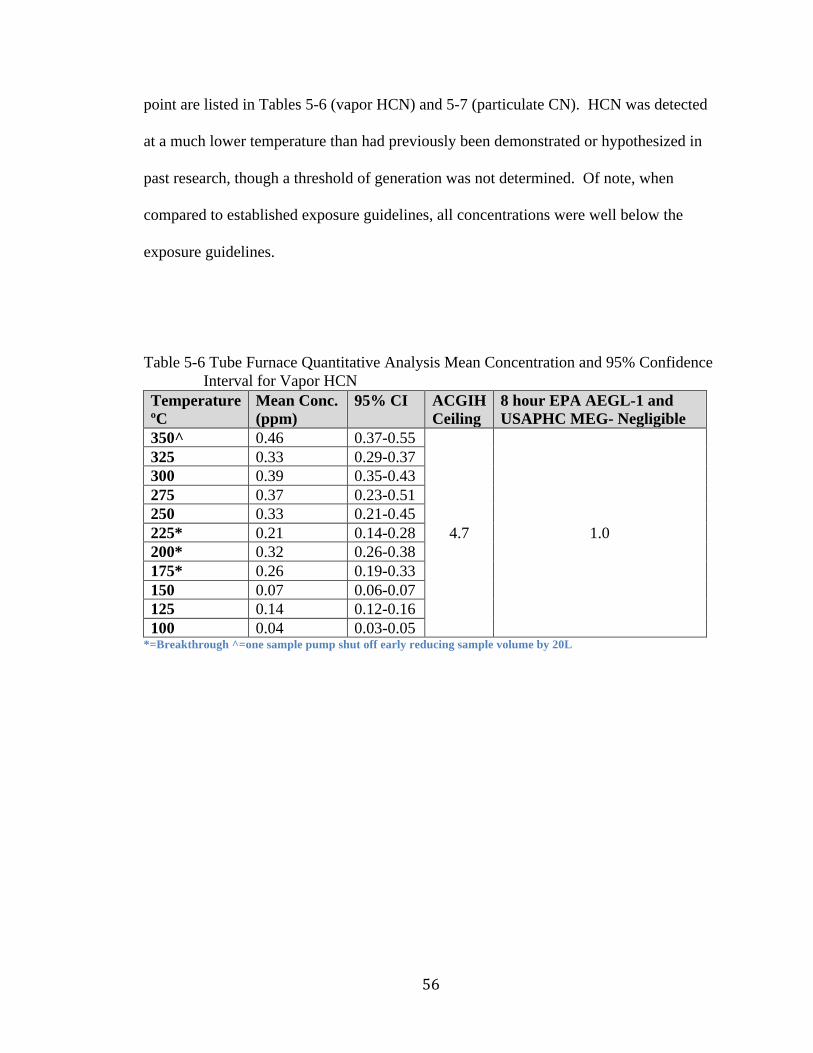
56
point are listed in Tables 5-6 (vapor HCN) and 5-7 (particulate CN). HCN was detected
at a much lower temperature than had previously been demonstrated or hypothesized in
past research, though a threshold of generation was not determined. Of note, when
compared to established exposure guidelines, all concentrations were well below the
exposure guidelines.
Table 5-6 Tube Furnace Quantitative Analysis Mean Concentration and 95% Confidence Interval for Vapor HCN
Temperature ºC
Mean Conc. (ppm)
95% CI ACGIH Ceiling
8 hour EPA AEGL-1 and USAPHC MEG- Negligible
350^ 0.46 0.37-0.55
4.7 1.0
325 0.33 0.29-0.37 300 0.39 0.35-0.43 275 0.37 0.23-0.51 250 0.33 0.21-0.45 225* 0.21 0.14-0.28 200* 0.32 0.26-0.38 175* 0.26 0.19-0.33 150 0.07 0.06-0.07 125 0.14 0.12-0.16 100 0.04 0.03-0.05
*=Breakthrough ^=one sample pump shut off early reducing sample volume by 20L
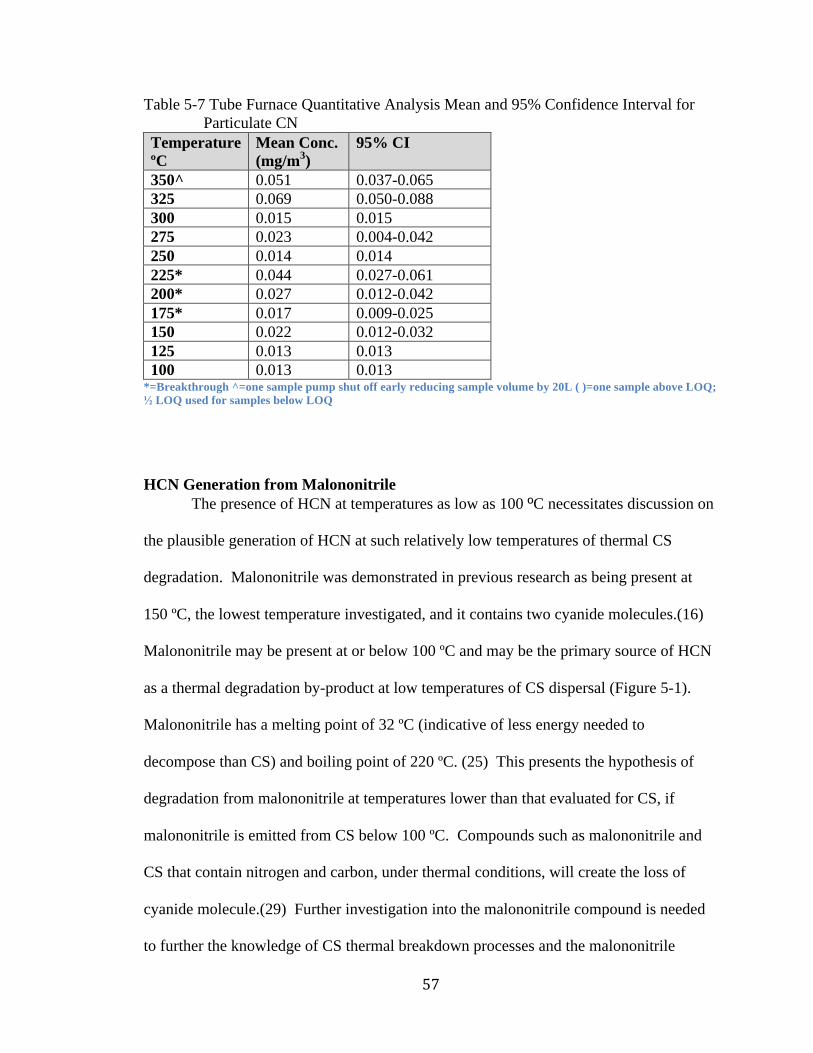
57
Table 5-7 Tube Furnace Quantitative Analysis Mean and 95% Confidence Interval for Particulate CN
Temperature ºC
Mean Conc. (mg/m3)
95% CI
350^ 0.051 0.037-0.065 325 0.069 0.050-0.088 300 0.015 0.015 275 0.023 0.004-0.042 250 0.014 0.014 225* 0.044 0.027-0.061 200* 0.027 0.012-0.042 175* 0.017 0.009-0.025 150 0.022 0.012-0.032 125 0.013 0.013 100 0.013 0.013
*=Breakthrough ^=one sample pump shut off early reducing sample volume by 20L ( )=one sample above LOQ; ½ LOQ used for samples below LOQ
HCN Generation from Malononitrile The presence of HCN at temperatures as low as 100 ºC necessitates discussion on
the plausible generation of HCN at such relatively low temperatures of thermal CS
degradation. Malononitrile was demonstrated in previous research as being present at
150 ºC, the lowest temperature investigated, and it contains two cyanide molecules.(16)
Malononitrile may be present at or below 100 ºC and may be the primary source of HCN
as a thermal degradation by-product at low temperatures of CS dispersal (Figure 5-1).
Malononitrile has a melting point of 32 ºC (indicative of less energy needed to
decompose than CS) and boiling point of 220 ºC. (25) This presents the hypothesis of
degradation from malononitrile at temperatures lower than that evaluated for CS, if
malononitrile is emitted from CS below 100 ºC. Compounds such as malononitrile and
CS that contain nitrogen and carbon, under thermal conditions, will create the loss of
cyanide molecule.(29) Further investigation into the malononitrile compound is needed
to further the knowledge of CS thermal breakdown processes and the malononitrile
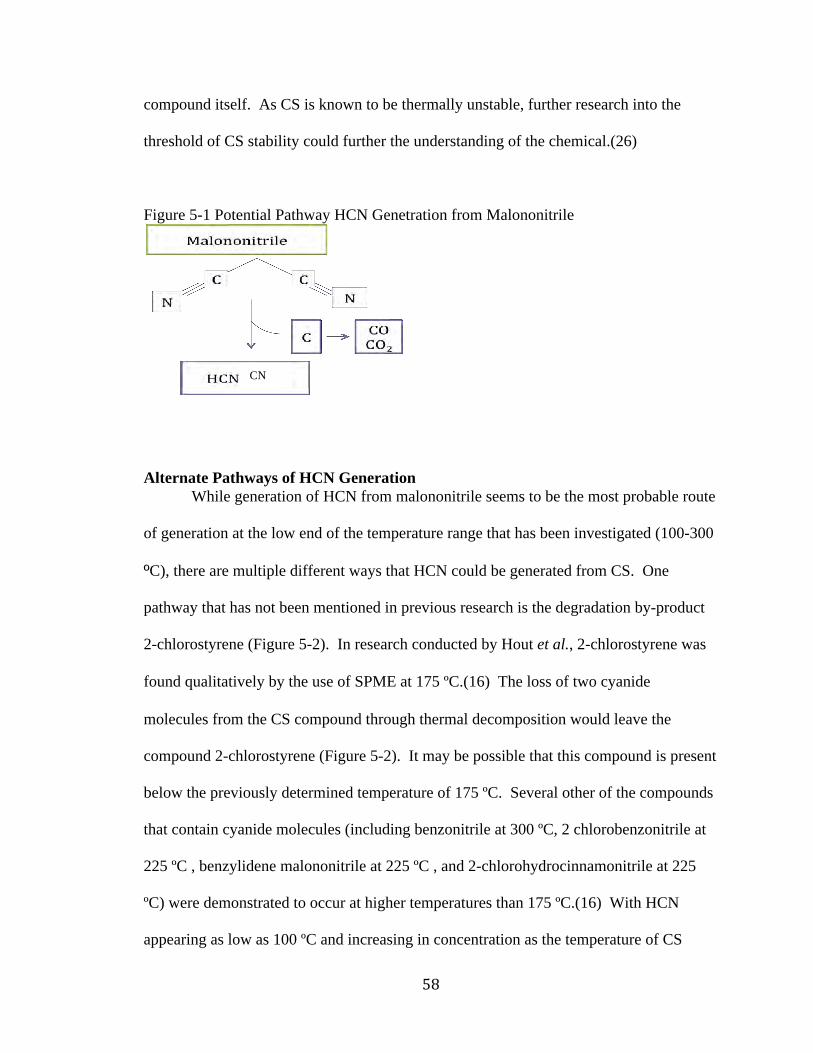
58
compound itself. As CS is known to be thermally unstable, further research into the
threshold of CS stability could further the understanding of the chemical.(26)
Figure 5-1 Potential Pathway HCN Genetration from Malononitrile
Alternate Pathways of HCN Generation While generation of HCN from malononitrile seems to be the most probable route
of generation at the low end of the temperature range that has been investigated (100-300
ºC), there are multiple different ways that HCN could be generated from CS. One
pathway that has not been mentioned in previous research is the degradation by-product
2-chlorostyrene (Figure 5-2). In research conducted by Hout et al., 2-chlorostyrene was
found qualitatively by the use of SPME at 175 ºC.(16) The loss of two cyanide
molecules from the CS compound through thermal decomposition would leave the
compound 2-chlorostyrene (Figure 5-2). It may be possible that this compound is present
below the previously determined temperature of 175 ºC. Several other of the compounds
that contain cyanide molecules (including benzonitrile at 300 ºC, 2 chlorobenzonitrile at
225 ºC , benzylidene malononitrile at 225 ºC , and 2-chlorohydrocinnamonitrile at 225
ºC) were demonstrated to occur at higher temperatures than 175 ºC.(16) With HCN
appearing as low as 100 ºC and increasing in concentration as the temperature of CS
CN
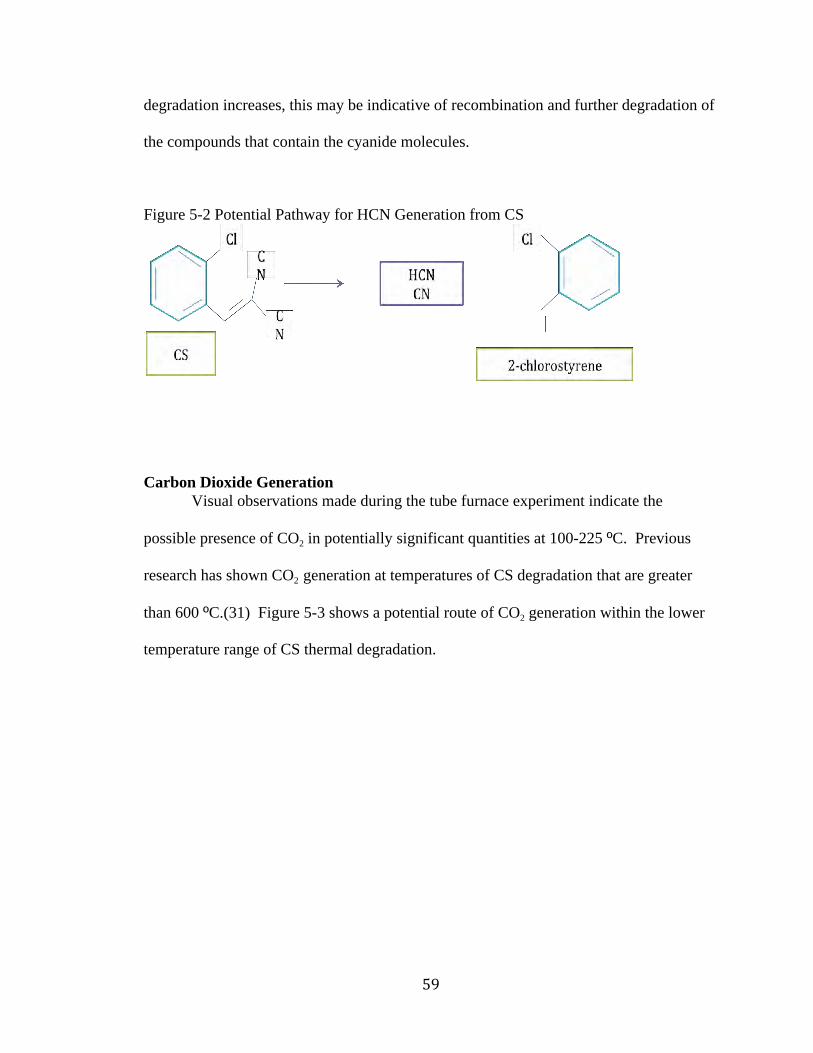
59
degradation increases, this may be indicative of recombination and further degradation of
the compounds that contain the cyanide molecules.
Figure 5-2 Potential Pathway for HCN Generation from CS
Carbon Dioxide Generation Visual observations made during the tube furnace experiment indicate the
possible presence of CO2 in potentially significant quantities at 100-225 ºC. Previous
research has shown CO2 generation at temperatures of CS degradation that are greater
than 600 ºC.(31) Figure 5-3 shows a potential route of CO2 generation within the lower
temperature range of CS thermal degradation.
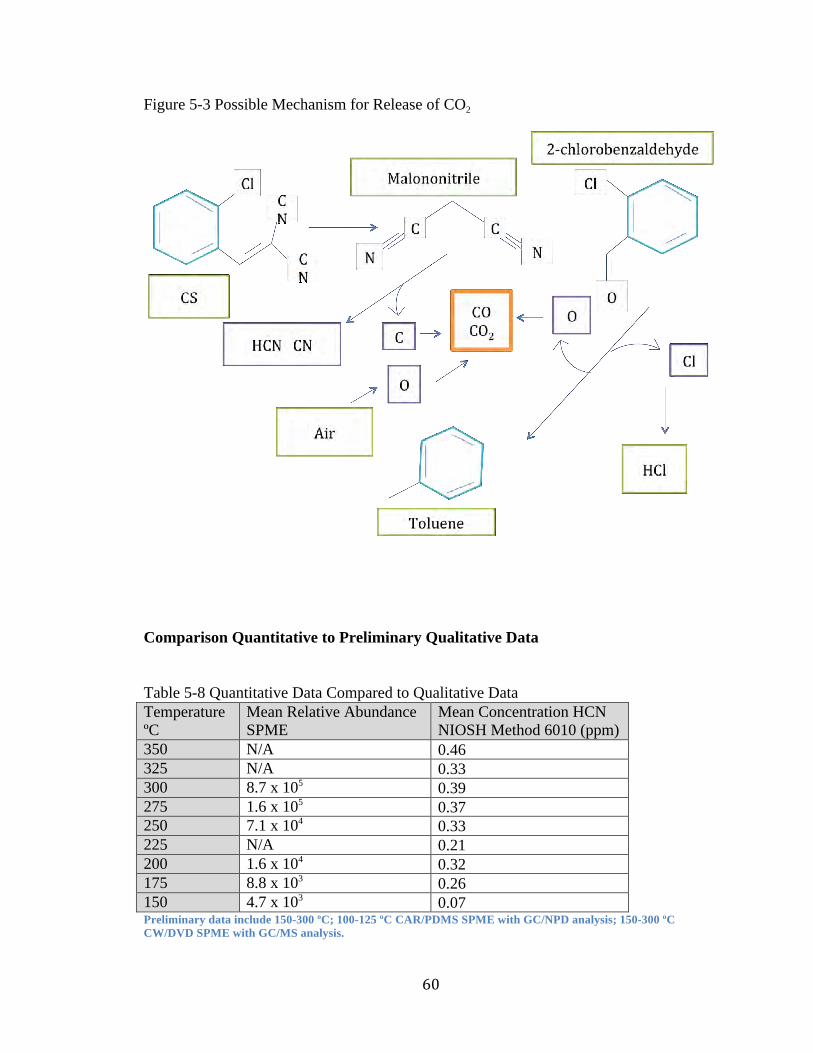
60
Figure 5-3 Possible Mechanism for Release of CO2
Comparison Quantitative to Preliminary Qualitative Data
Table 5-8 Quantitative Data Compared to Qualitative Data Temperature ºC
Mean Relative Abundance SPME
Mean Concentration HCN NIOSH Method 6010 (ppm)
350 N/A 0.46 325 N/A 0.33 300 8.7 x 10⁵ 0.39 275 1.6 x 10⁵ 0.37 250 7.1 x 10⁴ 0.33 225 N/A 0.21 200 1.6 x 10⁴ 0.32 175 8.8 x 10³ 0.26 150 4.7 x 10³ 0.07 Preliminary data include 150-300 ºC; 100-125 ºC CAR/PDMS SPME with GC/NPD analysis; 150-300 ºC CW/DVD SPME with GC/MS analysis.
61
The preliminary study’s qualitative analysis results (Table 5-8) showed a linear
relationship between the relative abundance and temperature of CS aerosolization with an
increase in strength when log adjusted. When log adjusted, the linear relationship was
stronger than compared to quantification using NIOSH Method 6010. Even with an
increased coefficient of determination, a comparison of the Pearson correlation
coefficients demonstrated no significant difference between the two correlations (SPME
and NIOSH Method 6010). These results demonstrated that SPME sampling may have
potential for the utilization in detecting and estimating short exposure concentrations (i.e.
the ~ 1-2 minutes that Soldiers have their masks off) when determining CS combustion
protocols. The limitations of using SPME may prevent this method from being regularly
used to determine HCN concentrations during live training. These limitations are based
on the rapid availability of a GC with detector and calibration methods (field or
laboratory based). These resource limitations may lead to limiting the use of SPME to
assist in determining protocol for the quantity of CS that is combusted and the
temperature range in which CS dispersed. If equipment is available for the use of SPME
with appropriate analysis in a field setting, this technique could prove to be useful in
providing “real time” airborne concentration estimates for short exposure durations and
evaluating exposure complaints.
Limitations The greater LOQ (2.7µg versus 1.1µg) required the use of multiple capsules and
the maximum volume air to be sampled to ensure enough HCN was captured to quantify.
Possible carbon dioxide (demonstrated by the soda lime sorbent color change from white
to purple) generated within the reaction tube at 100-225 ºC posed a breakthrough issue at
175-225 ºC by exhausting the absorptive capability of the soda lime sorbent and may
62
have created an underestimation of HCN quantity. The apparent presence of carbon
dioxide in a larger percentage at temperatures less than 250 ºC warrant further
investigation. Large crystal fibers formed at 100-225 ºC, creating occasional blockage at
the sorbent tube entrance. This may have affected the quantity of particulate CN, and to a
lesser extent vapor HCN, leading to underestimating amount generated.
63
CHAPTER 6: Conclusion and Future Research
CONCLUSION This research advances the understanding of military occupational exposures as it
relates to the use of CS during Chemical, Biological, Radiological, Nuclear, and
Explosive (CBRNE) training, an aspect of military life that affects all Soldiers from basic
training (enlisted and officer) to annual training and deployment training. When
combusting CS at 200 ºC , within a live training CS chamber, concentrations of HCN
were well below the established exposure guidelines. The 200 ºC temperature point was
the lowest temperature in which sampling for HCN has been conducted in a field setting
and during live training exercises.(12; 15; 16; 20; 37; 41) When sampling for HCN
within the temperature range of 100-350 ºC, in a laboratory setting, a linear relationship
between the temperature of CS dispersal and quantity of HCN was obtained, using
NIOSH Method 6010. In the laboratory, HCN was generated over a range of CS thermal
degradation temperatures that previously had been considered too low to produce HCN.
The presence of HCN as a thermal degradation by-product at 100 ºC was demonstrated; a
generation point that is significantly lower than previous research has shown.
Findings suggest that low CS combustion temperatures (<200 ºC) may not
produce acutely hazardous airborne HCN concentrations within mask confidence
chambers similar in structure and design as the chamber in Ft. Jackson, when operated
under similar environmental conditions and when using similar capsule delivery methods.
The study also suggests that under similar conditions to this study, DoD doctrine policies
related to CS combustion procedures may be more protective of health if they do not
exceed these temperature settings. While concentrations of HCN obtained were well
64
below the established exposure guidelines, further investigation into chronic exposure
effects at these levels is warranted given that a subset of Soldiers are exposed on a more
frequent occupational basis.
POTENTIAL FUTURE RESEARCH Qualitative and Quantitative Analysis of HCN at Generation Temperatures Below the Melting Point of CS
HCN was quantitatively determined to be present at 100 ºC, 5 ºC above the
melting point of CS. With HCN present at such a low temperature of CS dispersal, it
may be possible that HCN is emitted at temperatures below the melting point of CS.
Qualitative analysis followed by quantitative analysis of HCN at CS combustion
temperatures below 95 ºC (melting point of CS) to further characterize the threshold for
generation may be warranted (CS storage related issue).
Differences in CS Degradation at ≤225 ºC versus ≥250 ºC Observations during the tube furnace experiment showed a marked difference in
the visual exhaust of the aerosolized CS and potential by-products between 225 ºC and
250 ºC. This point demonstrated a change in particle size, visible versus non-visible
exhaust, and complete exhaustion of soda lime sorbent at 225 ºC compared to minimal
exhaustion at 250 ºC. These observations create questions as to what is happening at
these temperatures and why these temperature points are significant to these visual
observations.
Direct Measurement of HCN in Tube Furnace At the 350 ºC temperature point, one of the three samples was terminated early
due to battery failure in the pump. Even with the reduced volume of sample, the amount
of HCN obtained fell in between the other two samples. This result leads to the questions
as to when does HCN begin generation during CS combustion, when does generation
peak, and when does HCN generation cease or become minimized. The use of a direct
65
reading instrument in a laboratory setting may assist in solving these questions about the
behavior of HCN as it relates to generation from thermal dispersal of CS.
Field Sampling <200 ºC Qualitative and quantitative field sampling at lower temperatures is warranted
with the determination of the presence of HCN <200 ºC in a laboratory setting. Field
sampling in an environmental chamber or RCA training chamber may help combat soda
lime sorbent exhaustion and sorbent tube clogging issues encountered during the tube
furnace experiment at the 100-225 ºC range of CS thermal dispersion. The air
atmosphere would more accurately reflect exposure potential and behavior of by-product
generation during training situations. A maximum volume of air sampled and adequate
quantity of CS burned would need to occur to ensure detection.
Quantification with SPME/Comparison to NIOSH Method Results Further investigation is warranted into determining whether or not use of SPME
for quantification of HCN in a CS atmosphere is comparable to the NIOSH and OSHA
Methods of quantification for HCN (NIOSH 6010, NIOSH 7904, OSHA 1015).
Other Methods of Quantification The risk of inhalation exposure to CS and HCN generally occurs in an estimated
one minute timeframe. The use of sampling techniques, such as needle trap, may be
warranted for investigation as to whether or not the techniques can reliably sample for
one minute in a CS atmosphere. A one minute sample can give a better picture of the
inhalation exposure hazard.
Biomarkers of exposure The ultimate measurement of exposure that individual receives and uptakes into
their system would be to analyze biomarkers. Both CS and HCN have dermal absorption
66
capabilities, the use of biomarkers (such as thiocyanate in urine) can give a more
complete picture to the overall body burden from exposure.
Quantification of Malononitrile Malononitrile is a primary breakdown product of CS through hydrolysis. At 150
ºC, malononitrile has been demonstrated to form as a degradation by-product from
thermal aerosolization of CS. With the presence of HCN at 100 ºC, malononitrile may
have a lower threshold of generation. Quantification and qualitative analysis of
malononitrile below 150 ºC to a point below CS melting point would give greater insight
into the degradation of CS. Malononitrile is noted to have a greater toxicity than CS with
its toxicity similar to cyanides. This compound also has both skin and eye irritant
capability, similar to CS.(19) Quantification of malononitrile during live chamber
training exercises with comparisons to CS concentrations would represent interesting
aspect of CBRNE training to look at with the similarities of irritant capability.
Carbon Dioxide Generation at CS Dispersal Temperature Range 100-250 ºC A significant observation during the tube furnace experiment was the change in
color of the soda lime sorbent completely turning from white to purple at 100-225 ºC
with minimal purple coloration at 250-275 ºC. During the field sampling (200 ºC)
several of the longer duration samples had minimal purple coloration. Soda lime will
turn purple when the absorption capability has been exhausted by carbon dioxide.
Investigation into the potential presence of a large percentage of carbon dioxide at the
lower combustion temperatures may be warrented, as this compound may be interfering
with quantification and accurate characterization of HCN.
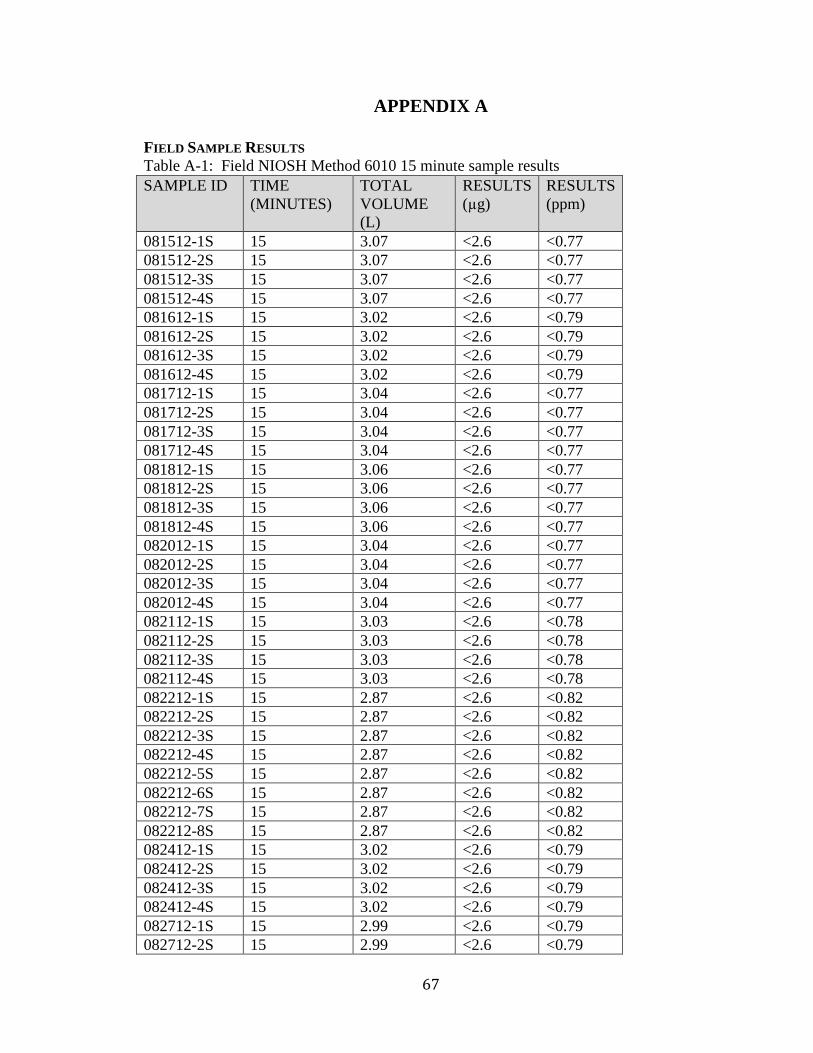
67
APPENDIX A
FIELD SAMPLE RESULTS Table A-1: Field NIOSH Method 6010 15 minute sample results SAMPLE ID TIME
(MINUTES) TOTAL VOLUME (L)
RESULTS (µg)
RESULTS (ppm)
081512-1S 15 3.07 <2.6 <0.77 081512-2S 15 3.07 <2.6 <0.77 081512-3S 15 3.07 <2.6 <0.77 081512-4S 15 3.07 <2.6 <0.77 081612-1S 15 3.02 <2.6 <0.79 081612-2S 15 3.02 <2.6 <0.79 081612-3S 15 3.02 <2.6 <0.79 081612-4S 15 3.02 <2.6 <0.79 081712-1S 15 3.04 <2.6 <0.77 081712-2S 15 3.04 <2.6 <0.77 081712-3S 15 3.04 <2.6 <0.77 081712-4S 15 3.04 <2.6 <0.77 081812-1S 15 3.06 <2.6 <0.77 081812-2S 15 3.06 <2.6 <0.77 081812-3S 15 3.06 <2.6 <0.77 081812-4S 15 3.06 <2.6 <0.77 082012-1S 15 3.04 <2.6 <0.77 082012-2S 15 3.04 <2.6 <0.77 082012-3S 15 3.04 <2.6 <0.77 082012-4S 15 3.04 <2.6 <0.77 082112-1S 15 3.03 <2.6 <0.78 082112-2S 15 3.03 <2.6 <0.78 082112-3S 15 3.03 <2.6 <0.78 082112-4S 15 3.03 <2.6 <0.78 082212-1S 15 2.87 <2.6 <0.82 082212-2S 15 2.87 <2.6 <0.82 082212-3S 15 2.87 <2.6 <0.82 082212-4S 15 2.87 <2.6 <0.82 082212-5S 15 2.87 <2.6 <0.82 082212-6S 15 2.87 <2.6 <0.82 082212-7S 15 2.87 <2.6 <0.82 082212-8S 15 2.87 <2.6 <0.82 082412-1S 15 3.02 <2.6 <0.79 082412-2S 15 3.02 <2.6 <0.79 082412-3S 15 3.02 <2.6 <0.79 082412-4S 15 3.02 <2.6 <0.79 082712-1S 15 2.99 <2.6 <0.79 082712-2S 15 2.99 <2.6 <0.79
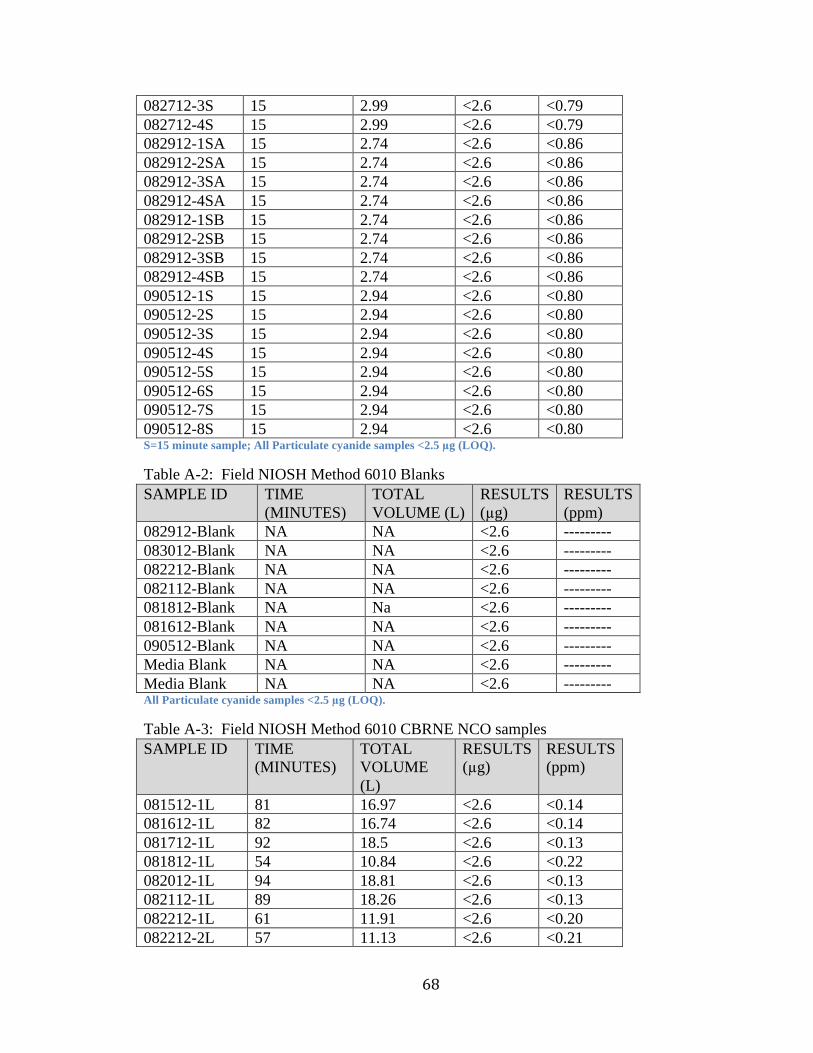
68
082712-3S 15 2.99 <2.6 <0.79 082712-4S 15 2.99 <2.6 <0.79 082912-1SA 15 2.74 <2.6 <0.86 082912-2SA 15 2.74 <2.6 <0.86 082912-3SA 15 2.74 <2.6 <0.86 082912-4SA 15 2.74 <2.6 <0.86 082912-1SB 15 2.74 <2.6 <0.86 082912-2SB 15 2.74 <2.6 <0.86 082912-3SB 15 2.74 <2.6 <0.86 082912-4SB 15 2.74 <2.6 <0.86 090512-1S 15 2.94 <2.6 <0.80 090512-2S 15 2.94 <2.6 <0.80 090512-3S 15 2.94 <2.6 <0.80 090512-4S 15 2.94 <2.6 <0.80 090512-5S 15 2.94 <2.6 <0.80 090512-6S 15 2.94 <2.6 <0.80 090512-7S 15 2.94 <2.6 <0.80 090512-8S 15 2.94 <2.6 <0.80 S=15 minute sample; All Particulate cyanide samples <2.5 µg (LOQ).
Table A-2: Field NIOSH Method 6010 Blanks SAMPLE ID TIME
(MINUTES) TOTAL VOLUME (L)
RESULTS (µg)
RESULTS (ppm)
082912-Blank NA NA <2.6 --------- 083012-Blank NA NA <2.6 --------- 082212-Blank NA NA <2.6 --------- 082112-Blank NA NA <2.6 --------- 081812-Blank NA Na <2.6 --------- 081612-Blank NA NA <2.6 --------- 090512-Blank NA NA <2.6 --------- Media Blank NA NA <2.6 --------- Media Blank NA NA <2.6 --------- All Particulate cyanide samples <2.5 µg (LOQ).
Table A-3: Field NIOSH Method 6010 CBRNE NCO samples SAMPLE ID TIME
(MINUTES) TOTAL VOLUME (L)
RESULTS (µg)
RESULTS (ppm)
081512-1L 81 16.97 <2.6 <0.14 081612-1L 82 16.74 <2.6 <0.14 081712-1L 92 18.5 <2.6 <0.13 081812-1L 54 10.84 <2.6 <0.22 082012-1L 94 18.81 <2.6 <0.13 082112-1L 89 18.26 <2.6 <0.13 082212-1L 61 11.91 <2.6 <0.20 082212-2L 57 11.13 <2.6 <0.21
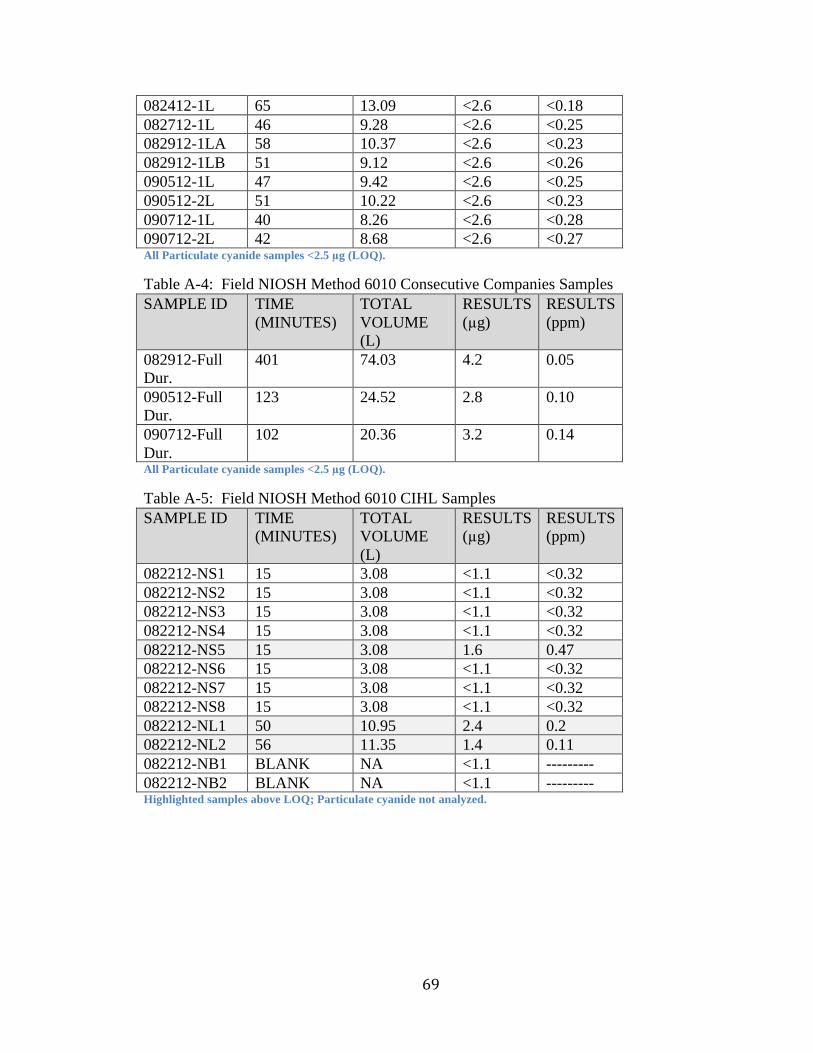
69
082412-1L 65 13.09 <2.6 <0.18 082712-1L 46 9.28 <2.6 <0.25 082912-1LA 58 10.37 <2.6 <0.23 082912-1LB 51 9.12 <2.6 <0.26 090512-1L 47 9.42 <2.6 <0.25 090512-2L 51 10.22 <2.6 <0.23 090712-1L 40 8.26 <2.6 <0.28 090712-2L 42 8.68 <2.6 <0.27 All Particulate cyanide samples <2.5 µg (LOQ).
Table A-4: Field NIOSH Method 6010 Consecutive Companies Samples SAMPLE ID TIME
(MINUTES) TOTAL VOLUME (L)
RESULTS (µg)
RESULTS (ppm)
082912-Full Dur.
401 74.03 4.2 0.05
090512-Full Dur.
123 24.52 2.8 0.10
090712-Full Dur.
102 20.36 3.2 0.14
All Particulate cyanide samples <2.5 µg (LOQ).
Table A-5: Field NIOSH Method 6010 CIHL Samples SAMPLE ID TIME
(MINUTES) TOTAL VOLUME (L)
RESULTS (µg)
RESULTS (ppm)
082212-NS1 15 3.08 <1.1 <0.32 082212-NS2 15 3.08 <1.1 <0.32 082212-NS3 15 3.08 <1.1 <0.32 082212-NS4 15 3.08 <1.1 <0.32 082212-NS5 15 3.08 1.6 0.47 082212-NS6 15 3.08 <1.1 <0.32 082212-NS7 15 3.08 <1.1 <0.32 082212-NS8 15 3.08 <1.1 <0.32 082212-NL1 50 10.95 2.4 0.2 082212-NL2 56 11.35 1.4 0.11 082212-NB1 BLANK NA <1.1 --------- 082212-NB2 BLANK NA <1.1 --------- Highlighted samples above LOQ; Particulate cyanide not analyzed.
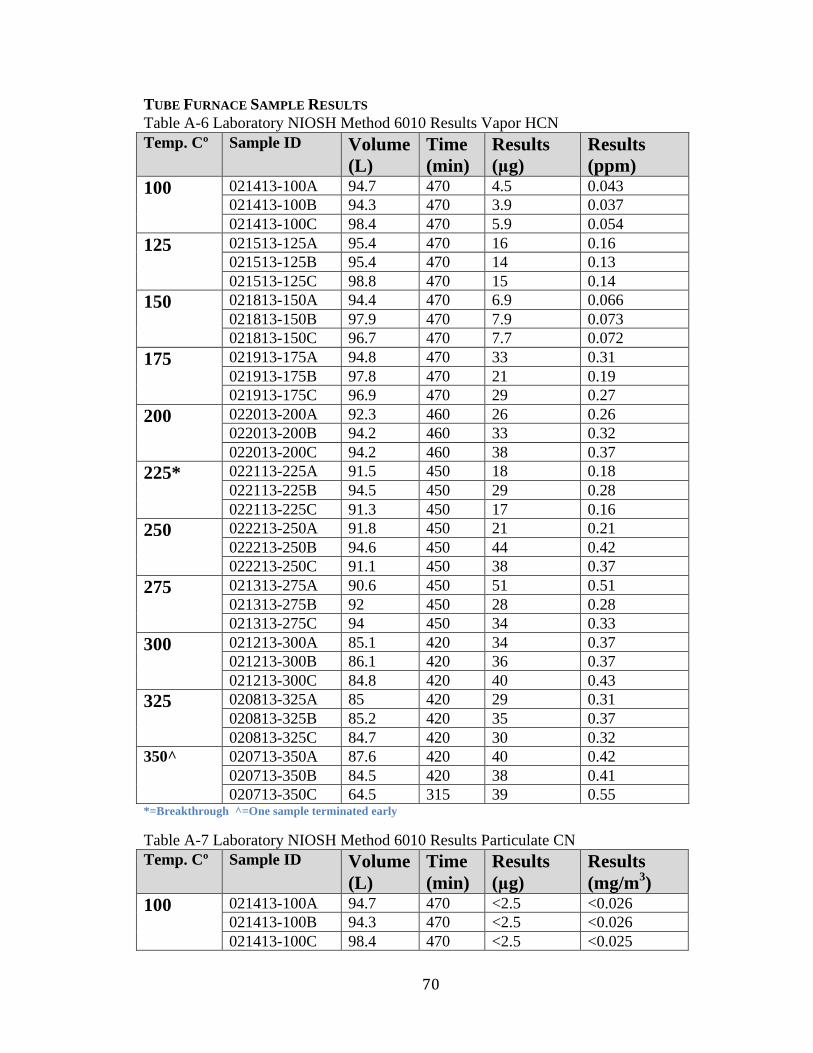
70
TUBE FURNACE SAMPLE RESULTS Table A-6 Laboratory NIOSH Method 6010 Results Vapor HCN Temp. Cº Sample ID Volume
(L) Time (min)
Results (µg)
Results (ppm)
100 021413-100A 94.7 470 4.5 0.043 021413-100B 94.3 470 3.9 0.037 021413-100C 98.4 470 5.9 0.054
125 021513-125A 95.4 470 16 0.16 021513-125B 95.4 470 14 0.13 021513-125C 98.8 470 15 0.14
150 021813-150A 94.4 470 6.9 0.066 021813-150B 97.9 470 7.9 0.073 021813-150C 96.7 470 7.7 0.072
175 021913-175A 94.8 470 33 0.31 021913-175B 97.8 470 21 0.19 021913-175C 96.9 470 29 0.27
200 022013-200A 92.3 460 26 0.26 022013-200B 94.2 460 33 0.32 022013-200C 94.2 460 38 0.37
225* 022113-225A 91.5 450 18 0.18 022113-225B 94.5 450 29 0.28 022113-225C 91.3 450 17 0.16
250 022213-250A 91.8 450 21 0.21 022213-250B 94.6 450 44 0.42 022213-250C 91.1 450 38 0.37
275 021313-275A 90.6 450 51 0.51 021313-275B 92 450 28 0.28 021313-275C 94 450 34 0.33
300 021213-300A 85.1 420 34 0.37 021213-300B 86.1 420 36 0.37 021213-300C 84.8 420 40 0.43
325 020813-325A 85 420 29 0.31 020813-325B 85.2 420 35 0.37 020813-325C 84.7 420 30 0.32
350^ 020713-350A 87.6 420 40 0.42 020713-350B 84.5 420 38 0.41 020713-350C 64.5 315 39 0.55
*=Breakthrough ^=One sample terminated early
Table A-7 Laboratory NIOSH Method 6010 Results Particulate CN Temp. Cº Sample ID Volume
(L) Time (min)
Results (µg)
Results (mg/m3)
100 021413-100A 94.7 470 <2.5 <0.026 021413-100B 94.3 470 <2.5 <0.026 021413-100C 98.4 470 <2.5 <0.025
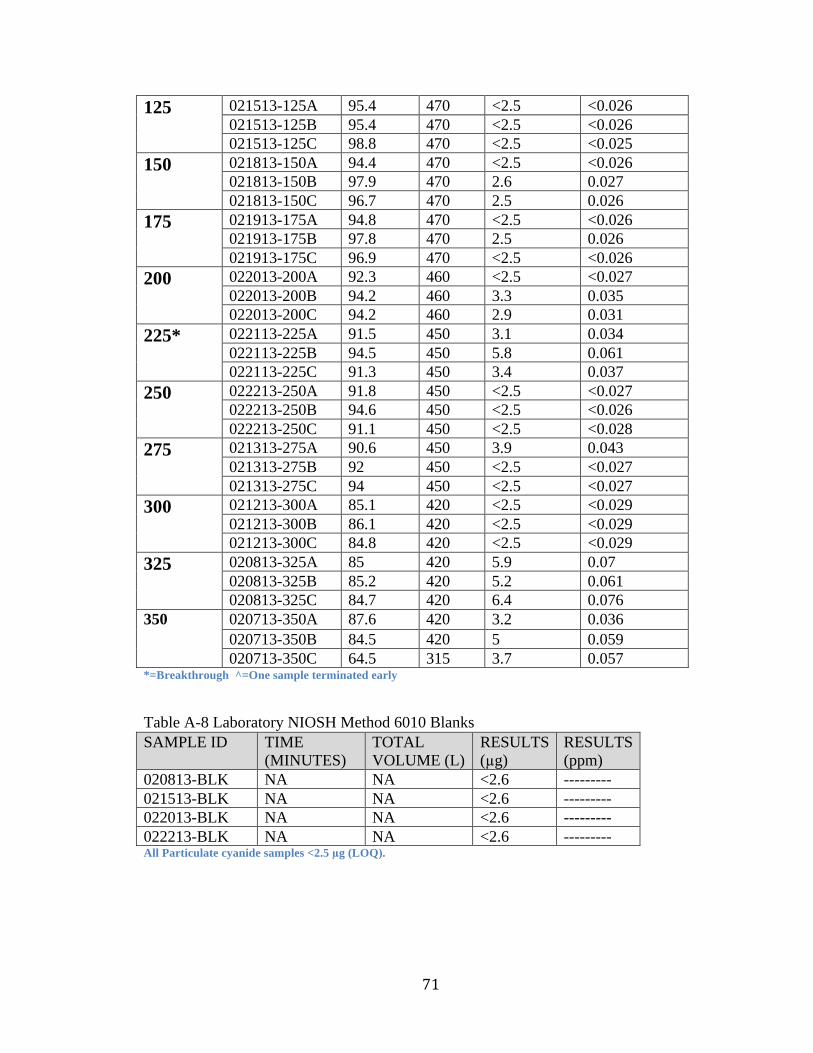
71
125 021513-125A 95.4 470 <2.5 <0.026 021513-125B 95.4 470 <2.5 <0.026 021513-125C 98.8 470 <2.5 <0.025
150 021813-150A 94.4 470 <2.5 <0.026 021813-150B 97.9 470 2.6 0.027 021813-150C 96.7 470 2.5 0.026
175 021913-175A 94.8 470 <2.5 <0.026 021913-175B 97.8 470 2.5 0.026 021913-175C 96.9 470 <2.5 <0.026
200 022013-200A 92.3 460 <2.5 <0.027 022013-200B 94.2 460 3.3 0.035 022013-200C 94.2 460 2.9 0.031
225* 022113-225A 91.5 450 3.1 0.034 022113-225B 94.5 450 5.8 0.061 022113-225C 91.3 450 3.4 0.037
250 022213-250A 91.8 450 <2.5 <0.027 022213-250B 94.6 450 <2.5 <0.026 022213-250C 91.1 450 <2.5 <0.028
275 021313-275A 90.6 450 3.9 0.043 021313-275B 92 450 <2.5 <0.027 021313-275C 94 450 <2.5 <0.027
300 021213-300A 85.1 420 <2.5 <0.029 021213-300B 86.1 420 <2.5 <0.029 021213-300C 84.8 420 <2.5 <0.029
325 020813-325A 85 420 5.9 0.07 020813-325B 85.2 420 5.2 0.061 020813-325C 84.7 420 6.4 0.076
350 020713-350A 87.6 420 3.2 0.036 020713-350B 84.5 420 5 0.059 020713-350C 64.5 315 3.7 0.057
*=Breakthrough ^=One sample terminated early
Table A-8 Laboratory NIOSH Method 6010 Blanks SAMPLE ID TIME
(MINUTES) TOTAL VOLUME (L)
RESULTS (µg)
RESULTS (ppm)
020813-BLK NA NA <2.6 --------- 021513-BLK NA NA <2.6 --------- 022013-BLK NA NA <2.6 --------- 022213-BLK NA NA <2.6 --------- All Particulate cyanide samples <2.5 µg (LOQ).
72
REFERENCES
1. 1993. SODASORB® MANUAL OF CO2 ABSORPTION. Cambridge, MA: W. R. Grace & CO.-Conn., 62 Whittemore Avenue
2. 2003. Flame, Riot Control Agent, and Herbicide Operations. Department of the Army
3. 2008. Chemical, Biological, Radiological, and Nuclear (CBRN) Defense 2. ed. USATCF Jackson, p. Appendix C
4. 2012. DA PAM 385-63 Range Safety. pp. 160-2 5. ACGIH. 2001. Hydrogen Cyanide and Cyanide Salts. American Conference of
Goverment Industrial Hygienists 6. ACGIH. 2001. o-chlorobenzylidene malononitrile. American Conference of
Goverment Industrial Hygienists 7. Army US. 1994. Training Circular (TC) 3-8, Chemical Training, Chapter 3 Mask
Confidence Training. 8. ATDSR. 2006. Cyanide.
http://www.atsdr.cdc.gov/toxprofiles/tp.asp?id=72&tid=19 9. CDC. 1994. o-Chlorobenzylidene malononitrile.
www.cdc.gov/niosh/idlh/2698411.html 10. CDC. 1995. Occupational Safety and Health Guideline for o-Chlorobenzylidene
Malononitrile. http://www.cdc.gov/niosh/docs/81-123/pdfs/0122-rev.pdf 11. Chandra H, Gupta BN, Bhargava SK, Clerk SH, Mahendra PN. 1980. Chronic
cyanide exposure--A biochemical and industrial hygiene study. Journal of analytical toxicology 4:161-5
12. Dominguez T. 2012. o-Chlorobenzylidene Malononitrile (CS) Gas Exposure Evaluation, CEX Field Training Flight (0100-CECX-953A). ed. AMDS/SGPB. Lackland Air Force Base, Texas
13. El Ghawabi SH, Gaafar MA, El-Saharti AA, Ahmed SH, Malash KK, Fares R. 1975. Chronic cyanide exposure: a clinical, radioisotope, and laboratory study. British journal of industrial medicine 32:215-9
14. Gutch PK, Raza SK, Malhotra RC. 2003. Studies on Thermal Degradation of Benzylidene Malononitriles. Journal of Thermal Analysis and Calorimetry 71:593-9
15. Hout JJ. 2010. Qualitative Analysis of HCN Generation During CS Thermal Dispersal in a Tube Furnace. [Unpublished Raw Data]. Uniformed Services University of the Health Sciences
16. Hout JJ, Hook GL, Lapuma PT, White DW. 2010. Identification of compounds formed during low temperature thermal dispersion of encapsulated o-chlorobenzylidene malononitrile (CS riot control agent). Journal of occupational and environmental hygiene 7:352-7
17. Hout JJ, Kluchinsky T, LaPuma PT, White DW. 2011. Evaluation of CS (o-chlorobenzylidene malononitrile) concentrations during U.S. Army mask confidence training. Journal of environmental health 74:18-21
73
18. Johnson-Kanapthy EJ. 2012. Pilot Study: Quantification of hydrogen cyanide (HCN), a thermal degradation product of o-chlorobenzylidene malononitrile (CS), during U.S. Army Mask Confidence Training. [Unpublished Raw Data].
19. Keller WC, Elves, R.G., Bonnin, J.C. 1986. Assessment of CS Environmental Toxicity at Eglin AFB FL, USAF Occupational and Environmental Health Laboratory, Brooks Air Force Base, TX
20. Kluchinsky TA, Jr., Savage PB, Fitz R, Smith PA. 2002. Liberation of hydrogen cyanide and hydrogen chloride during high-temperature dispersion of CS riot control agent. AIHA journal : a journal for the science of occupational and environmental health and safety 63:493-6
21. Kluchinsky TA, Jr., Sheely MV, Savage PB, Smith PA. 2002. Formation of 2-chlorobenzylidenemalononitrile (CS riot control agent) thermal degradation products at elevated temperatures. Journal of chromatography. A 952:205-13
22. Lenth RV-. Java Applets for Power and Sample Size [computer software]. http://www.stat.uiowa.edu/~rlenth/Power.
23. McNamara BP. 1971. The cyanide portion of the CS molecule. Edgewood
Arsenal, MD: U.S. Department of the Army; U.S. Army Biomedical Laboratory 24. NIH. 2008. TOXNET: Hydrogen Cyanide. http://toxnet.nlm.nih.gov/cgi-
bin/sis/search/a?dbs+hsdb:@term+@DOCNO+165 25. NIOSH. NIOSH Pocket Guide to Chemical Hazards: Malononitrile. National
Institute of Occupational Safety and Health 26. NIOSH. Occupational Health Guidelines for O-chlorobenzylidene Malononitrile.
www.cdc.gov/niosh/docs/81-123/pdf/0122.pdf 27. NIOSH. 1994. NIOSH Manual of Analytical Methods 4 ed.: Hydrogen Cyanide:
Method 6010. 28. NRC. 2002. Acute Exposure Guideline Levels for Selected Airborne Chemicals.
Washington D.C.: National Research Council of the National Academies: National Academies Press
29. Olajus EJ, Stepford, W. 2004. Riot Control Agents: Issues in Toxicology, Safety, and Health. CRC Press
30. OSHA. Occupational Safety and Health Guideline for Hydrogen Cyanide. www.osha.gov/SLTC/healthguidelines/hydrogencyanide/recognition.html
31. Porter E, Sinkinson, D.V., Tees, T.F.S. 1961. The Pyrolysis of O-chlorobenzalmalononitrile in a Gas Flow System., Chemical Defence Establishment, Porton Down, Salisbury, Great Britain
32. PUBCHEM N. CID: 768. http://pubchem.ncbi.nlm.nih.gov/summary/summary.cgi?cid=768&loc=ec_rcs
33. Punte C, Owens, EJ, Gutentag, PJ. 1963. Exposures to orthochlorobenzylidene malononitrile. Controlled human exposures. Arch Environ Health. 6:366-74
34. Richard Lowry P. VassarStats. www.vassarstats.net 35. Salem H, Gutting, B.W., Kluchinsky, T.A., Boardman, C.H., Tuorinsky, S.D.,
Hout, J.J. 2008. Riot Control Agents. In Medical Aspects of Chemical Warfare, pp. 441-83

74
36. Simeonova F, Fishbein, L. 2004. Concise International Chemical Assessment Document 61; HYDROGEN CYANIDE AND CYANIDES: HUMAN HEALTH ASPECTS. Geneva: International Programme on Chemical Safety, World Health Organization
37. Smith PA, Sheely, M.V., Kluchinsky, T.A. 2002. Solid phase microextraction with analysis by gas chromatography to determine short term hydrogen cyanide concentrations in a field setting. Journal of Separation Science 25:917-21
38. Smith RP. 1996. Toxic Responses of the Blood. In Casarett and Doull's
Toxicology: The Basic Science of Poisons:350-1. New York: McGraw-Hill. Number of 350-1 pp.
39. USAPHC. 2010. Technical Guide 230 Environmental Health Risk Assessment and Chemical Exposure Guidelines for Deployed Military Personnel. Aberdeen Proving Ground, MD: U.S. Army Public Health Command (Provisional)
40. USEPA. 2012. Acute Exposure Guideline Levels. http://www.epa.gov/opptintr/aegl/pubs/results6.htm
41. Vittitow WL. 2002. Technical Report of Industrial Hygiene Accident Investigation No. B7106-092/070-0233-01 Regarding Building 7106, Gas Mask Test Chamber. ed. IH Department of Preventive Medicine Services. Fort Knox, Kentucky