Embed Size (px)
Citation preview
INORGANIC HYDROGEN CYANIDELISTING BACKGROUND DOCUMENT
FOR THEINORGANIC CHEMICAL LISTING DETERMINATION
August 2000
U.S. ENVIRONMENTAL PROTECTION AGENCYARIEL RIOS BUILDING1200 PENNSYLVANIA AVENUE, N.W.WASHINGTON, D.C. 20460
Inorganic Hydrogen CyanideListing Background Document August 2000i
TABLE OF CONTENTS
1. SECTOR OVERVIEW . . . . . . . . . . . . . . . . . . . . . . . . . . . . . . . . . . . . . . . . . . . . . . . . . . . . 11.1 Sector Definition, Facility Names and Locations . . . . . . . . . . . . . . . . . . . . . . . . . . . . 11.2 Products, Product Usage and Markets . . . . . . . . . . . . . . . . . . . . . . . . . . . . . . . . . . . 21.3 Production Capacity . . . . . . . . . . . . . . . . . . . . . . . . . . . . . . . . . . . . . . . . . . . . . . . . . 41.4 Production, Product and Process Trends . . . . . . . . . . . . . . . . . . . . . . . . . . . . . . . . . 4
2. DESCRIPTION OF MANUFACTURING PROCESS . . . . . . . . . . . . . . . . . . . . . . . . . . . 52.1 Andrussow Process . . . . . . . . . . . . . . . . . . . . . . . . . . . . . . . . . . . . . . . . . . . . . . . . . 52.2 Variations to the Andrussow Process . . . . . . . . . . . . . . . . . . . . . . . . . . . . . . . . . . . . 6
3. WASTE GENERATION AND MANAGEMENT . . . . . . . . . . . . . . . . . . . . . . . . . . . . . . . 83.1. Summary of Waste Generation Processes . . . . . . . . . . . . . . . . . . . . . . . . . . . . . . . . . 8
3.2.1 Commingled Wastewaters . . . . . . . . . . . . . . . . . . . . . . . . . . . . . . . . . . . . . 113.2.2 Ammonia Recycle Cartridge and Spent Carbon Filters . . . . . . . . . . . . . . . . 243.2.3 Biological Wastewater Treatment Solids . . . . . . . . . . . . . . . . . . . . . . . . . . . 293.2.4 Feed Gas Cartridge and Spent Carbon Filters . . . . . . . . . . . . . . . . . . . . . . . 323.1.5 Process Air Cartridge Filters . . . . . . . . . . . . . . . . . . . . . . . . . . . . . . . . . . . 343.1.6 Acid Spray Cartridge Filters . . . . . . . . . . . . . . . . . . . . . . . . . . . . . . . . . . . . 353.1.7 Spent Catalyst . . . . . . . . . . . . . . . . . . . . . . . . . . . . . . . . . . . . . . . . . . . . . . 363.1.8 Ammonium Sulfate and Ammonium Phosphate . . . . . . . . . . . . . . . . . . . . . . 383.1.9 Miscellaneous Wastewaters . . . . . . . . . . . . . . . . . . . . . . . . . . . . . . . . . . . . 413.1.10 HCN Polymer and Sump Waste . . . . . . . . . . . . . . . . . . . . . . . . . . . . . . . . . 443.1.11 Sludge from Wastewater Collection Tank . . . . . . . . . . . . . . . . . . . . . . . . . . 453.1.12 HCN Storage Tank Solids . . . . . . . . . . . . . . . . . . . . . . . . . . . . . . . . . . . . . 463.1.13 Wastewater Filters . . . . . . . . . . . . . . . . . . . . . . . . . . . . . . . . . . . . . . . . . . . 473.1.14 Ammonia Sulfate Filters . . . . . . . . . . . . . . . . . . . . . . . . . . . . . . . . . . . . . . . 483.1.15 Spent Ammonium Phosphate . . . . . . . . . . . . . . . . . . . . . . . . . . . . . . . . . . . 483.1.16 Organic Layer from Wastewater Collection Tank . . . . . . . . . . . . . . . . . . . . 49
3.2 Wastes Outside the Scope of the Consent Decree . . . . . . . . . . . . . . . . . . . . . . . . . 50
Appendix A: Comparison of EPA with Facility Split Sample DataAppendix B: Phone Logs, Maps, and Other Supporting Materials
Inorganic Hydrogen CyanideListing Background Document August 2000ii
LIST OF TABLES
Table 1.1 Hydrogen Cyanide Producers . . . . . . . . . . . . . . . . . . . . . . . . . . . . . . . . . . . . . . . . . . . . . 1Table 1.2 Hydrogen Cyanide Production Capacity . . . . . . . . . . . . . . . . . . . . . . . . . . . . . . . . . . . . . . 4Table 3.1 Wastes Generated From the Production of Inorganic Hydrogen Cyanide . . . . . . . . . . . . . 9Table 3.2 Waste Management Summary for Commingled Wastewaters . . . . . . . . . . . . . . . . . . . . . 12Table 3.3 Wastewater Record Samples . . . . . . . . . . . . . . . . . . . . . . . . . . . . . . . . . . . . . . . . . . . . . 13Table 3.4 Waste Characterization for Commingled Wastewaters . . . . . . . . . . . . . . . . . . . . . . . . . . 22Table 3.5 Waste Management Summary for Ammonia Recycle Cartridge and Spent Carbon Filters 24Table 3.6 Ammonia Recycle Cartridge Samples . . . . . . . . . . . . . . . . . . . . . . . . . . . . . . . . . . . . . . . 25Table 3.7 Waste Characterization for Ammonia Recycle Cartridge and Spent Carbon Filters
. . . . . . . . . . . . . . . . . . . . . . . . . . . . . . . . . . . . . . . . . . . . . . . . . . . . . . . . . . . . . . . . . . . . . 27Table 3.8 Waste Management Summary for Biological Wastewater Treatment Solids . . . . . . . . . . . 29Table 3.9 Waste Characterization for Biological Wastewater Treatment Solids . . . . . . . . . . . . . . . . 31Table 3.10 Waste Management Summary for Feed Gas Cartridge and Spent Carbon Filters . . . . . 32Table 3.11 Waste Characterization for Feed Gas Cartridge and Spent Carbon Filters . . . . . . . . . . . 34Table 3.12 Waste Management Summary for Process Air Cartridge Filters . . . . . . . . . . . . . . . . . . 35Table 3.13 Waste Management for Acid Spray Cartridge Filters . . . . . . . . . . . . . . . . . . . . . . . . . . 36Table 3.14 Waste Management Summary for Spent Catalyst . . . . . . . . . . . . . . . . . . . . . . . . . . . . . 37Table 3.15 Waste Management Summary for Ammonium Sulfate and Ammonium Phosphate
. . . . . . . . . . . . . . . . . . . . . . . . . . . . . . . . . . . . . . . . . . . . . . . . . . . . . . . . . . . . . . . . . . . . . 38Table 3.16 Waste Characterization for Ammonium Sulfate . . . . . . . . . . . . . . . . . . . . . . . . . . . . . . . 40Table 3.17 Waste Management Summary for Miscellaneous Wastewaters . . . . . . . . . . . . . . . . . . . 41Table 3.18 Characterization of Miscellaneous Wastewaters . . . . . . . . . . . . . . . . . . . . . . . . . . . . . . . 43Table 3.19 Waste Management for HCN Polymer and Sump Wastes . . . . . . . . . . . . . . . . . . . . . . 45Table 3.20 Waste Management for Sludge from Wastewater Collection Tank . . . . . . . . . . . . . . . . 46Table 3.21 Waste Management for HCN Storage Tank Solids . . . . . . . . . . . . . . . . . . . . . . . . . . . 46Table 3.22 Waste Management for Wastewater Filters . . . . . . . . . . . . . . . . . . . . . . . . . . . . . . . . . 47Table 3.23 Waste Management for Ammonia Sulfate Filters . . . . . . . . . . . . . . . . . . . . . . . . . . . . . . 48Table 3.24 Waste Management for Spent Ammonium Phosphate . . . . . . . . . . . . . . . . . . . . . . . . . . 49Table 3.25 Waste Management for Organic Layer from Wastewater Collection Tank . . . . . . . . . . . 50
LIST OF FIGURES
Figure 1.1 Geographical Distribution of Inorganic Hydrogen Cyanide Producers1 . . . . . . . . . . . . . . . 3Figure 2.1 Process Flow Diagram for Inorganic Hydrogen Cyanide . . . . . . . . . . . . . . . . . . . . . . . . . 7
1 Environmental Protection Agency, RCRA 3007, Survey of Inorganic Chemicals Industry
Inorganic Hydrogen CyanideListing Background Document August 20001
1. SECTOR OVERVIEW
1.1 Sector Definition, Facility Names and Locations
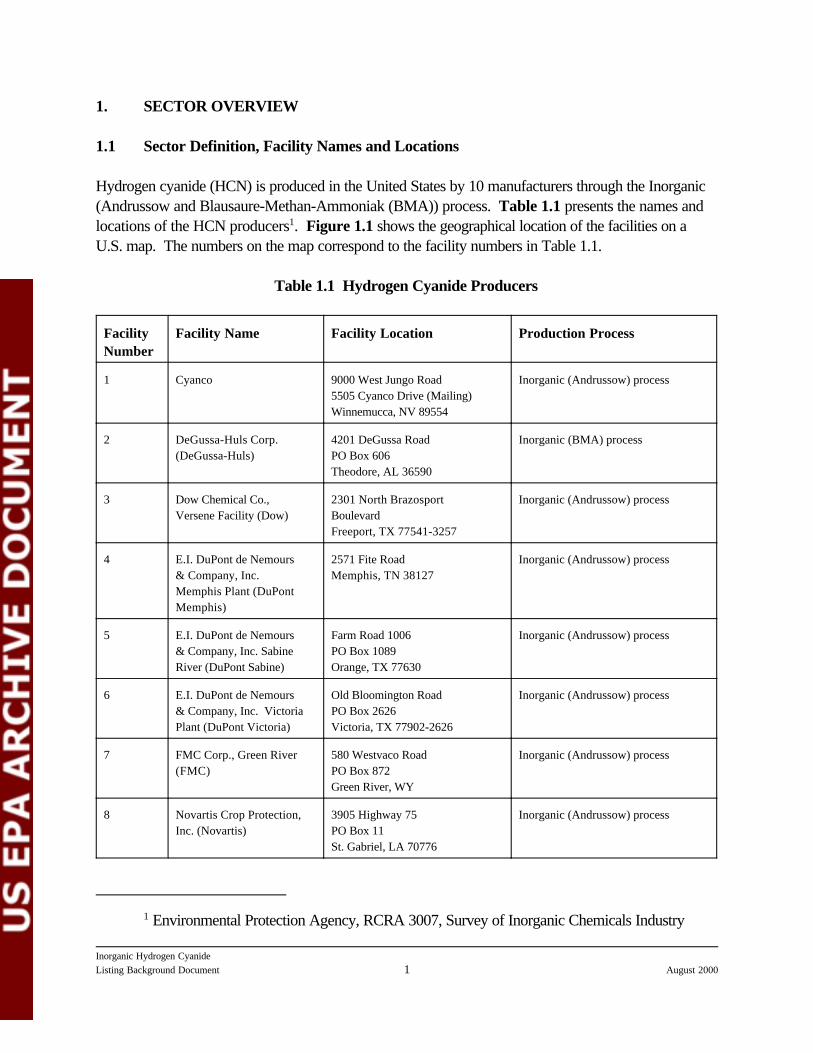
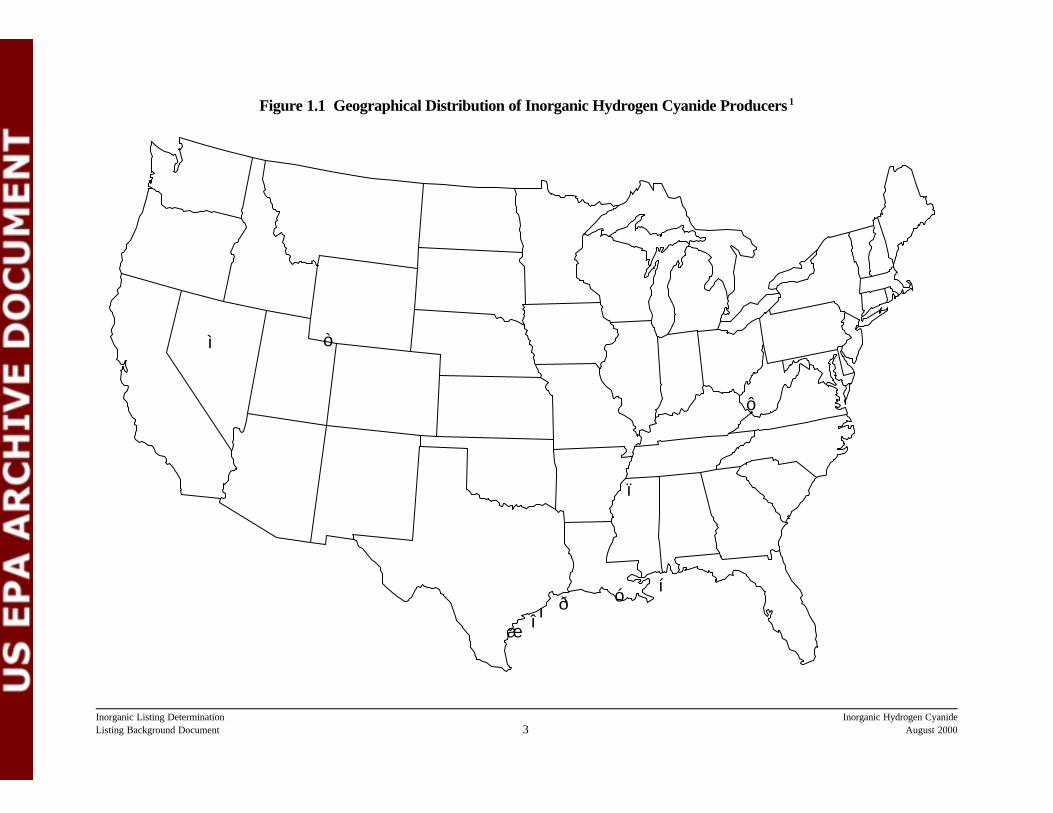
Hydrogen cyanide (HCN) is produced in the United States by 10 manufacturers through the Inorganic(Andrussow and Blausaure-Methan-Ammoniak (BMA)) process. Table 1.1 presents the names andlocations of the HCN producers1. Figure 1.1 shows the geographical location of the facilities on aU.S. map. The numbers on the map correspond to the facility numbers in Table 1.1.
Table 1.1 Hydrogen Cyanide Producers
FacilityNumber
Facility Name Facility Location Production Process
1 Cyanco 9000 West Jungo Road5505 Cyanco Drive (Mailing)Winnemucca, NV 89554
Inorganic (Andrussow) process
2 DeGussa-Huls Corp.(DeGussa-Huls)
4201 DeGussa RoadPO Box 606Theodore, AL 36590
Inorganic (BMA) process
3 Dow Chemical Co.,Versene Facility (Dow)
2301 North BrazosportBoulevardFreeport, TX 77541-3257
Inorganic (Andrussow) process
4 E.I. DuPont de Nemours& Company, Inc.Memphis Plant (DuPontMemphis)
2571 Fite RoadMemphis, TN 38127
Inorganic (Andrussow) process
5 E.I. DuPont de Nemours& Company, Inc. SabineRiver (DuPont Sabine)
Farm Road 1006PO Box 1089Orange, TX 77630
Inorganic (Andrussow) process
6 E.I. DuPont de Nemours& Company, Inc. VictoriaPlant (DuPont Victoria)
Old Bloomington RoadPO Box 2626 Victoria, TX 77902-2626
Inorganic (Andrussow) process
7 FMC Corp., Green River(FMC)
580 Westvaco RoadPO Box 872Green River, WY
Inorganic (Andrussow) process
8 Novartis Crop Protection,Inc. (Novartis)
3905 Highway 75PO Box 11St. Gabriel, LA 70776
Inorganic (Andrussow) process
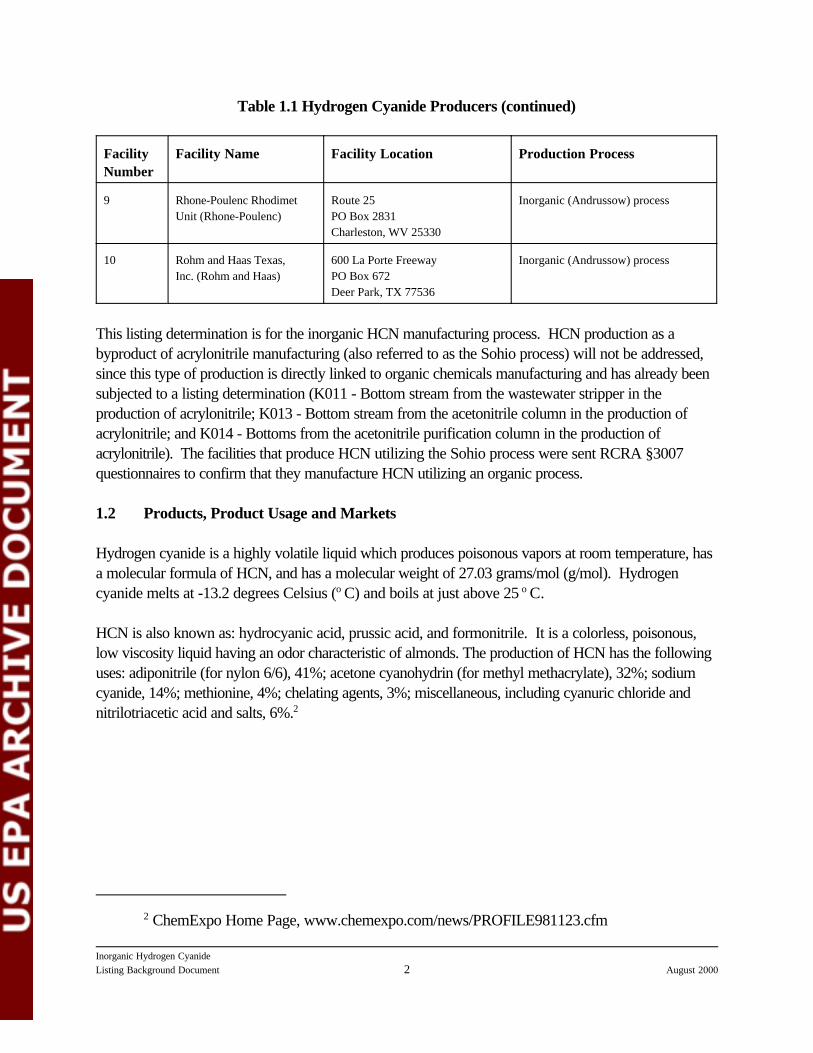
Table 1.1 Hydrogen Cyanide Producers (continued)
FacilityNumber
Facility Name Facility Location Production Process
2 ChemExpo Home Page, www.chemexpo.com/news/PROFILE981123.cfm
Inorganic Hydrogen CyanideListing Background Document August 20002
9 Rhone-Poulenc RhodimetUnit (Rhone-Poulenc)
Route 25PO Box 2831Charleston, WV 25330
Inorganic (Andrussow) process
10 Rohm and Haas Texas,Inc. (Rohm and Haas)
600 La Porte FreewayPO Box 672Deer Park, TX 77536
Inorganic (Andrussow) process
This listing determination is for the inorganic HCN manufacturing process. HCN production as abyproduct of acrylonitrile manufacturing (also referred to as the Sohio process) will not be addressed,since this type of production is directly linked to organic chemicals manufacturing and has already beensubjected to a listing determination (K011 - Bottom stream from the wastewater stripper in theproduction of acrylonitrile; K013 - Bottom stream from the acetonitrile column in the production ofacrylonitrile; and K014 - Bottoms from the acetonitrile purification column in the production ofacrylonitrile). The facilities that produce HCN utilizing the Sohio process were sent RCRA §3007questionnaires to confirm that they manufacture HCN utilizing an organic process.
1.2 Products, Product Usage and Markets
Hydrogen cyanide is a highly volatile liquid which produces poisonous vapors at room temperature, hasa molecular formula of HCN, and has a molecular weight of 27.03 grams/mol (g/mol). Hydrogencyanide melts at -13.2 degrees Celsius (o C) and boils at just above 25 o C.
HCN is also known as: hydrocyanic acid, prussic acid, and formonitrile. It is a colorless, poisonous,low viscosity liquid having an odor characteristic of almonds. The production of HCN has the followinguses: adiponitrile (for nylon 6/6), 41%; acetone cyanohydrin (for methyl methacrylate), 32%; sodiumcyanide, 14%; methionine, 4%; chelating agents, 3%; miscellaneous, including cyanuric chloride andnitrilotriacetic acid and salts, 6%.2
Inorganic Listing Determination Inorganic Hydrogen CyanideListing Background Document August 20003
Figure 1.1 Geographical Distribution of Inorganic Hydrogen Cyanide Producers 1
ò ì
ô
ï
í ó ð õ
î ñ
3 Ibid
4 Ibid
Inorganic Listing Determination Inorganic Hydrogen CyanideListing Background Document August 20004
1 See Table 1.1 for facility name and location.The historical market for HCN has shown a growth of approximately 3 percent per year in the periodspanning the years 1988-1997. Future growth of the market from the present time until the year 2002is expected to continue at the rate of approximately 2 percent per year. Market demand for thisproduct was approximately 1.44 billion pounds in 1998. 3
1.3 Production Capacity
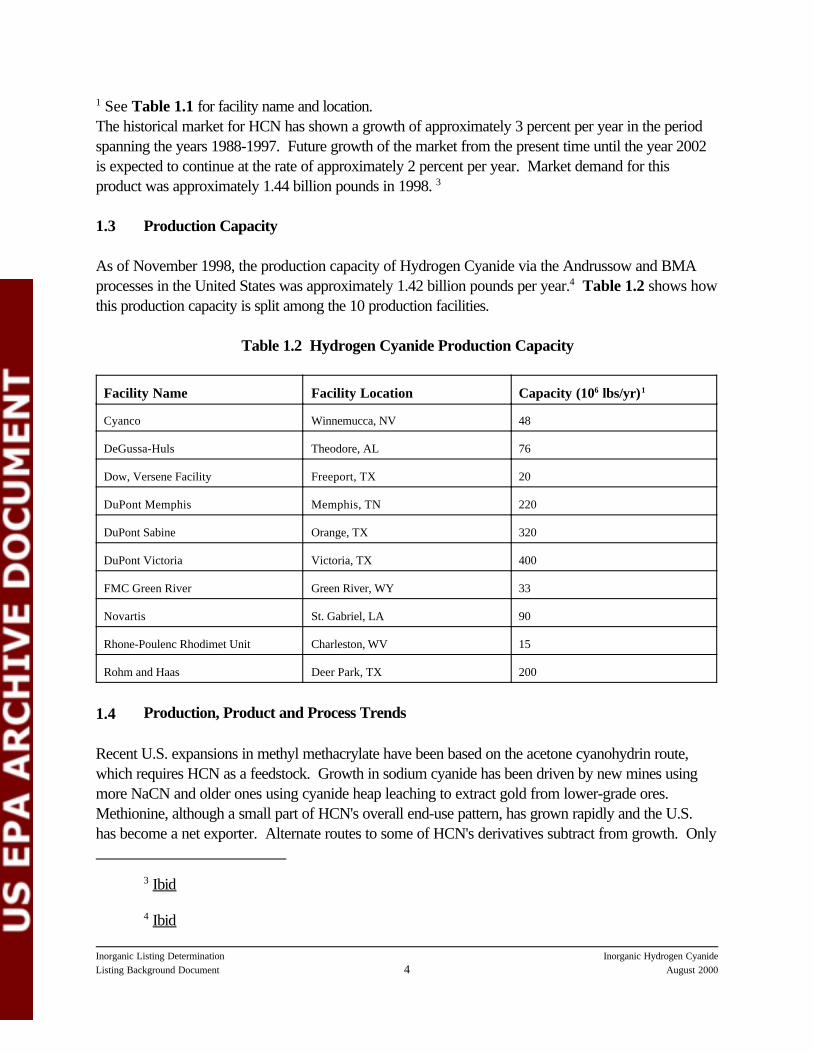
As of November 1998, the production capacity of Hydrogen Cyanide via the Andrussow and BMAprocesses in the United States was approximately 1.42 billion pounds per year.4 Table 1.2 shows howthis production capacity is split among the 10 production facilities.
Table 1.2 Hydrogen Cyanide Production Capacity
Facility Name Facility Location Capacity (106 lbs/yr)1
Cyanco Winnemucca, NV 48
DeGussa-Huls Theodore, AL 76
Dow, Versene Facility Freeport, TX 20
DuPont Memphis Memphis, TN 220
DuPont Sabine Orange, TX 320
DuPont Victoria Victoria, TX 400
FMC Green River Green River, WY 33
Novartis St. Gabriel, LA 90
Rhone-Poulenc Rhodimet Unit Charleston, WV 15
Rohm and Haas Deer Park, TX 200
1.4 Production, Product and Process Trends
Recent U.S. expansions in methyl methacrylate have been based on the acetone cyanohydrin route,which requires HCN as a feedstock. Growth in sodium cyanide has been driven by new mines usingmore NaCN and older ones using cyanide heap leaching to extract gold from lower-grade ores. Methionine, although a small part of HCN's overall end-use pattern, has grown rapidly and the U.S.has become a net exporter. Alternate routes to some of HCN's derivatives subtract from growth. Only
Inorganic Listing Determination Inorganic Hydrogen CyanideListing Background Document August 20005
one of the two U.S. adiponitrile producers uses HCN in its process.
Overall demand for HCN should continue to grow depending on performance of nylon 6/6 and methylmethacrylate going into consumer end products. Strong exports of adiponitrile and sodium cyanidehave been key growth factors for HCN in recent years.
2. DESCRIPTION OF MANUFACTURING PROCESS
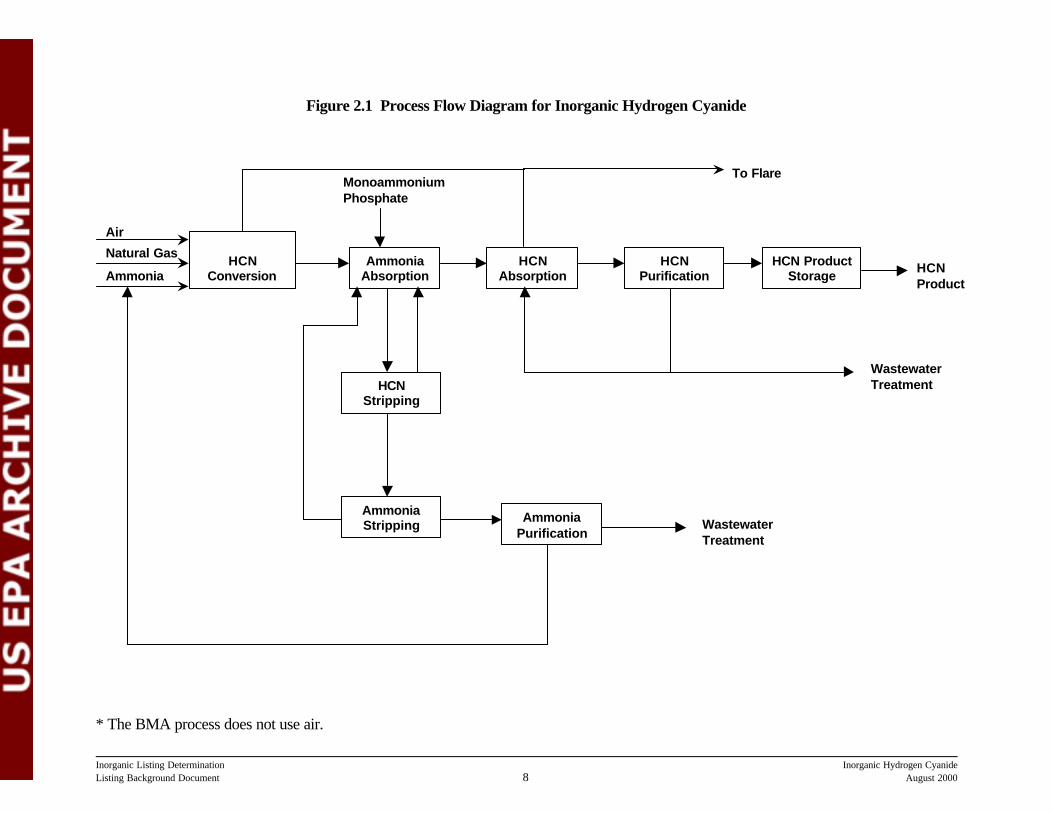
The Andrussow process flow diagram is presented in Figure 2.1. The inorganic manufacturing ofHCN is via the Andrussow process also known as the direct process, and is described in Section 2.1. There are variations on the Andrussow process that are determined by HCN use and ammoniamanagement. These variations are discussed in Section 2.2.
2.1 Andrussow Process
HCN Conversion
The first step in the Andrussow Process is the conversion of air, ammonia and natural gas into HCN. Filtered ammonia, natural gas and air are fed into a reactor and heated in the presence of a platinumand rhodium catalyst to 2,200 o C. The reaction is:
2NH3 + 2CH4 + 3O2 = 2HCN + 6H2O
The reactor off-gas containing HCN and un-reacted ammonia are quenched in a waste heat boiler toapproximately 350 o C. The HCN conversion process generates used feed gas and process air filters. Additionally, the catalyst is replaced approximately every 18-24 months.
Ammonia Absorption
The cooled reactor off-gas is sent through an ammonia absorption process to remove un-reactedammonia. This is accomplished by the addition of either ammonium phosphate solution, phosphoricacid or sulfuric acid to remove the ammonia, which is then sent to an ammonia recovery system (seeammonia recovery and purification). In general, this step does not generate any wastes.
HCN Absorption
From the ammonia absorber the product off-gas is sent through the HCN absorber where cold water isadded to entrain the HCN. The excess un-reacted gases are sent to flare. In general, this step doesnot generate any wastes.
HCN Purification
Inorganic Listing Determination Inorganic Hydrogen CyanideListing Background Document August 20006
The HCN-water mixture is then sent to a cyanide stripper where excess waste is removed from theliquid. In addition, the HCN-water mixture may also be sent through a fractionator to concentrate theHCN before the product is stored in tanks or directly used as a feedstock. This HCN purification stepproduces wastewaters that are sent to wastewater treatment or are recycled back to the HCNabsorption step. HCN product storage in tanks may also generate sediments or sludges.
Ammonia Recovery and Purification
The ammonia recovery and purification system receives wastewater from the ammonia absorber whichis stripped to remove ammonia. The system consists of a steam stripper and a fractionator. From thestripper, the overhead containing water and ammonia is condensed and sent to a fractionator whereadditional water is removed. This wastewater is sent to wastewater treatment and the ammonia isrecycled back to the reactor feed. The stripper bottoms may be recycled to the ammonia absorber. Some facilities produce a byproduct from their ammonia recovery system instead of recovering theammonia and recycling it back to the reactor. Two byproducts are generated by different facilities:ammonia sulfate and ammonia phosphate, both used as fertilizers.
Wastewater Treatment
The wastewater treatment at the 8 facilities that treat HCN purification wastewaters, ammoniapurification wastewaters, in addition to other miscellaneous wastewaters generated during the processincludes neutralization, biological treatment, alkaline-chlorination, and ozone treatment. The biologicaltreatment process can produce biological treatment solids.
2.2 Variations to the Andrussow Process
Sodium Cyanide (NaCN) Production
The production of NaCN follows the Andrussow process through the HCN conversion step using thesame three feedstocks i.e., ammonia, natural gas and air, sent through a platinum/rhodium catalyst toproduce HCN. However, the liquid product is immediately reacted with NaOH to produce NaCN,which is then used as a feedstock. Therefore, there are no process wastewaters generated and noammonia recovery system or byproducts generated.
Blausaure-Methan-Ammoniak (BMA) Process
The BMA process was developed by DeGussa-Huls and involves the reaction of ammonia withmethane without air. The reaction is carried out in tubes that are heated externally. After removal ofthe un-reacted ammonia and recovery of HCN, the waste gas is essentially pure hydrogen suitable forother uses.
Inorganic Listing Determination Inorganic Hydrogen CyanideListing Background Document August 20007
Inorganic Listing Determination Inorganic Hydrogen CyanideListing Background Document August 20008
HCNConversion
AmmoniaAbsorption
HCNAbsorption
HCNPurification
HCN ProductStorage
HCNStripping
AmmoniaStripping
AmmoniaPurification
Air
Natural Gas
Ammonia
To Flare
HCNProduct
WastewaterTreatment
WastewaterTreatment
Monoammonium Phosphate
Figure 2.1 Process Flow Diagram for Inorganic Hydrogen Cyanide
* The BMA process does not use air.
Inorganic Listing Determination Inorganic Hydrogen CyanideListing Background Document August 20009
3. WASTE GENERATION AND MANAGEMENT
Section 3.1 presents a detailed discussion of the production steps that generate the wastes, themanagement steps for the wastes, a characterization of the physical and chemical properties of thewastes, and results of initial screening analysis. Section 3.2 describes several waste categories that areoutside the scope of the consent decree. Appendix A presents a complete summary of the wastesgenerated at each of the facilities and their management.
3.1. Summary of Waste Generation Processes
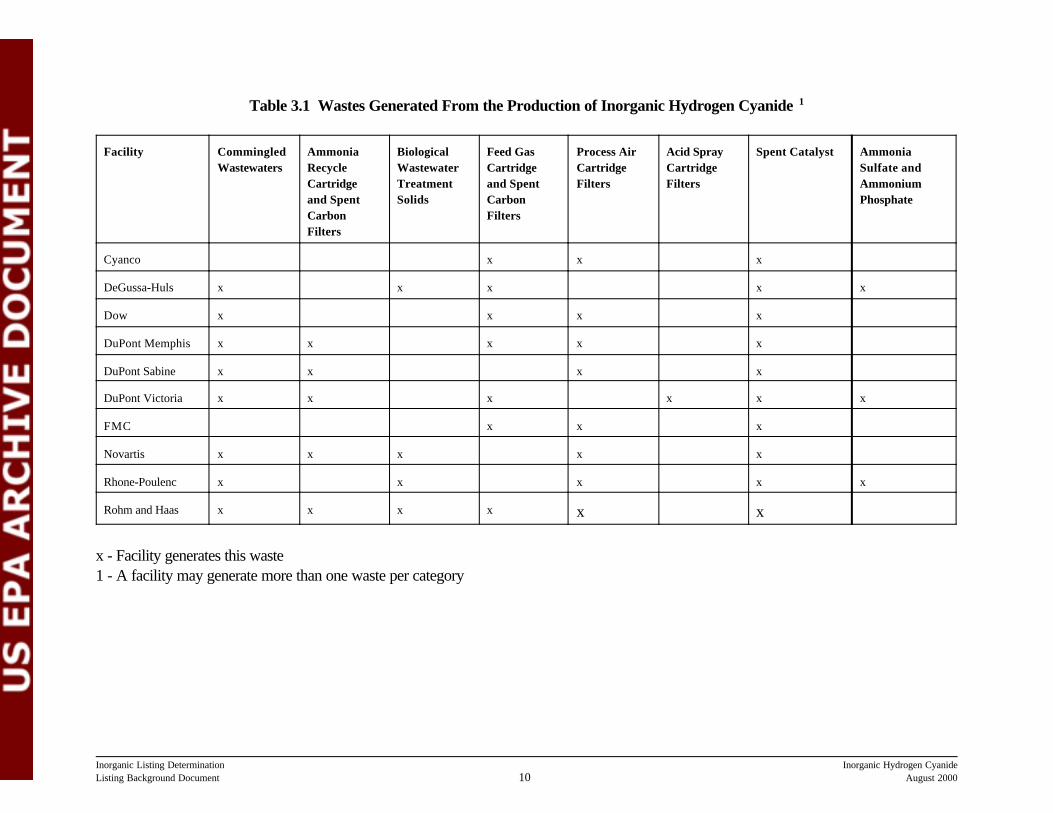
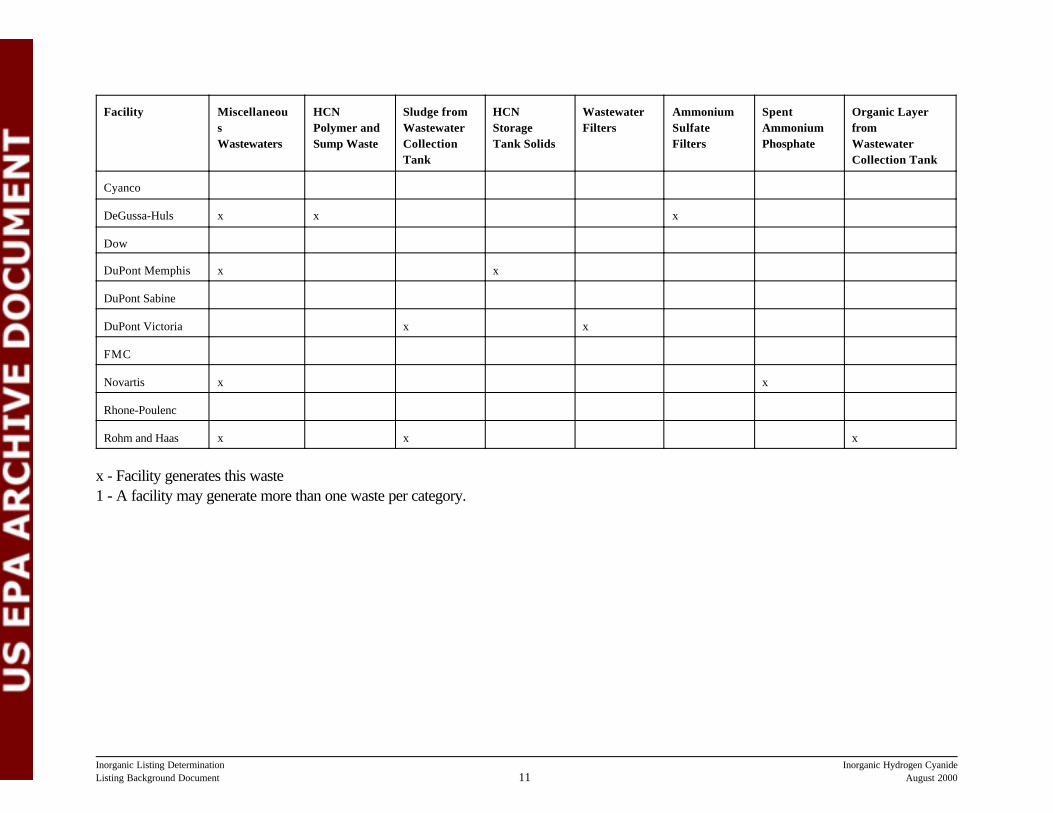
Wastes generated from the production of hydrogen cyanide consist of various types of wastewater,various types of spent filter media, spent catalyst, biological solids from wastewater treatment, andammonium salts. Table 3.1 presents a summary of the waste categories generated by facility.
Inorganic Listing Determination Inorganic Hydrogen CyanideListing Background Document August 200010
Table 3.1 Wastes Generated From the Production of Inorganic Hydrogen Cyanide 1
Facility CommingledWastewaters
AmmoniaRecycleCartridgeand SpentCarbon Filters
BiologicalWastewaterTreatmentSolids
Feed GasCartridgeand SpentCarbonFilters
Process AirCartridgeFilters
Acid SprayCartridge Filters
Spent Catalyst AmmoniaSulfate andAmmoniumPhosphate
Cyanco x x x
DeGussa-Huls x x x x x
Dow x x x x
DuPont Memphis x x x x x
DuPont Sabine x x x x
DuPont Victoria x x x x x x
FMC x x x
Novartis x x x x x
Rhone-Poulenc x x x x x
Rohm and Haas x x x x x x
x - Facility generates this waste1 - A facility may generate more than one waste per category
Inorganic Listing Determination Inorganic Hydrogen CyanideListing Background Document August 200011
Facility MiscellaneousWastewaters
HCNPolymer andSump Waste
Sludge fromWastewaterCollectionTank
HCNStorageTank Solids
WastewaterFilters
AmmoniumSulfateFilters
SpentAmmoniumPhosphate
Organic LayerfromWastewaterCollection Tank
Cyanco
DeGussa-Huls x x x
Dow
DuPont Memphis x x
DuPont Sabine
DuPont Victoria x x
FMC
Novartis x x
Rhone-Poulenc
Rohm and Haas x x x
x - Facility generates this waste1 - A facility may generate more than one waste per category.
Inorganic Listing Determination Inorganic Hydrogen CyanideListing Background Document August 200012
3.2.1 Commingled Wastewaters
Waste Generation
The commingled wastewaters consist of HCN purification wastewaters and ammonia purificationwastewaters. These wastewaters are commingled along with other miscellaneous waste (discussedseparately, see Section 3.2.9) In addition, at all facilities that generate wastewaters, the HCN processwastewaters are commingled and managed with non-HCN process wastewaters.
HCN Purification Wastewaters
HCN purification wastewaters are generated when the HCN-water mixture from the reactor is sentthrough a stripper to remove excess water. Some facilities generate this wastewater as a discrete wasteand others pipe this wastewater back to the HCN absorber for reuse.
Ammonia Purification Wastewaters
Ammonia purification wastewaters are generated when the reactor off-gases are mixed with eitherammonium phosphate, phosphoric acid or sulfuric acid to remove the un-reacted ammonia which isthen stripped of ammonia. The resultant wastewater from the stripper is the ammonia purificationwastewater.
Waste Management
The commingled wastewaters are all treated in on-site wastewater treatment processes before beingdischarged under a National Pollutant Discharge Elimination System (NPDES) permit, to a Publically-Owned Treatment Works (POTW), or via deep-well injection. The wastewaters are treated using oneor more of the following operations:
• steam stripping to remove cyanide and ammonia, with off-gases vented to flares, scrubbers orincinerators;
• pH adjustment;• aerated or non-aerated biological treatment in tanks or lined/unlined surface impoundments;• ozone treatment;• oxychlorination; and• settling in surface impoundments.
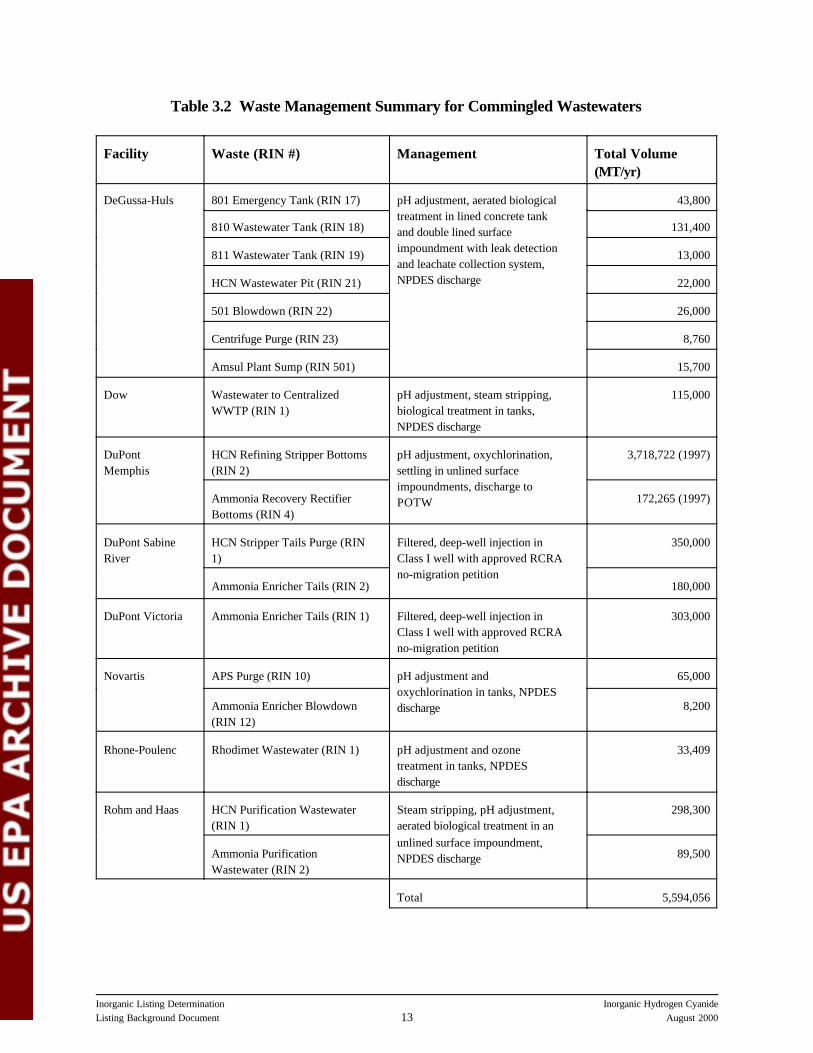
Table 3.2 presents a summary of the management practices used by the facilities for commingledwastewaters and reported waste volumes.
Inorganic Listing Determination Inorganic Hydrogen CyanideListing Background Document August 200013
Table 3.2 Waste Management Summary for Commingled Wastewaters
Facility Waste (RIN #) Management Total Volume(MT/yr)
DeGussa-Huls 801 Emergency Tank (RIN 17) pH adjustment, aerated biologicaltreatment in lined concrete tankand double lined surfaceimpoundment with leak detectionand leachate collection system,NPDES discharge
43,800
810 Wastewater Tank (RIN 18) 131,400
811 Wastewater Tank (RIN 19) 13,000
HCN Wastewater Pit (RIN 21) 22,000
501 Blowdown (RIN 22) 26,000
Centrifuge Purge (RIN 23) 8,760
Amsul Plant Sump (RIN 501) 15,700
Dow Wastewater to CentralizedWWTP (RIN 1)
pH adjustment, steam stripping,biological treatment in tanks,NPDES discharge
115,000
DuPontMemphis
HCN Refining Stripper Bottoms(RIN 2)
pH adjustment, oxychlorination,settling in unlined surfaceimpoundments, discharge toPOTW
3,718,722 (1997)
Ammonia Recovery RectifierBottoms (RIN 4)
172,265 (1997)
DuPont SabineRiver
HCN Stripper Tails Purge (RIN1)
Filtered, deep-well injection inClass I well with approved RCRAno-migration petition
350,000
Ammonia Enricher Tails (RIN 2) 180,000
DuPont Victoria Ammonia Enricher Tails (RIN 1) Filtered, deep-well injection inClass I well with approved RCRAno-migration petition
303,000
Novartis APS Purge (RIN 10) pH adjustment andoxychlorination in tanks, NPDESdischarge
65,000
Ammonia Enricher Blowdown(RIN 12)
8,200
Rhone-Poulenc Rhodimet Wastewater (RIN 1) pH adjustment and ozonetreatment in tanks, NPDESdischarge
33,409
Rohm and Haas HCN Purification Wastewater(RIN 1)
Steam stripping, pH adjustment,aerated biological treatment in anunlined surface impoundment,NPDES discharge
298,300
Ammonia PurificationWastewater (RIN 2)
89,500
Total 5,594,056
Inorganic Listing Determination Inorganic Hydrogen CyanideListing Background Document August 200014
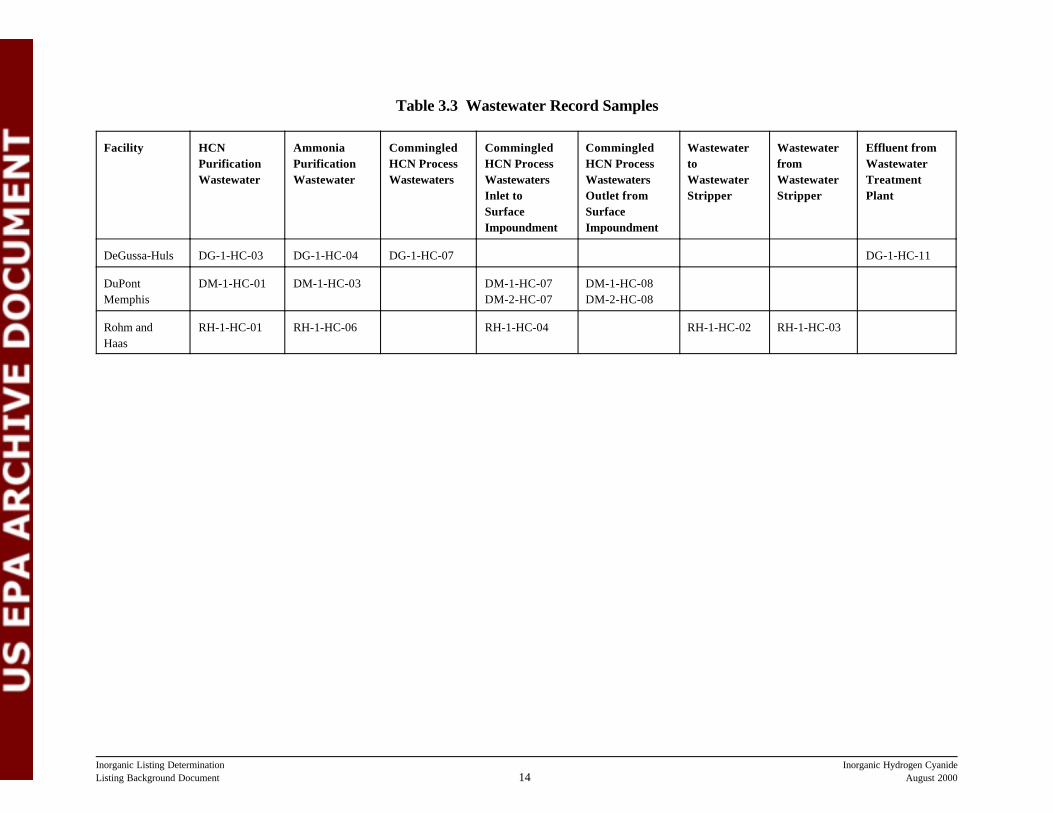
Table 3.3 Wastewater Record Samples
Facility HCNPurificationWastewater
AmmoniaPurificationWastewater
CommingledHCN ProcessWastewaters
CommingledHCN ProcessWastewatersInlet toSurfaceImpoundment
CommingledHCN ProcessWastewatersOutlet fromSurfaceImpoundment
WastewatertoWastewaterStripper
WastewaterfromWastewaterStripper
Effluent fromWastewaterTreatmentPlant
DeGussa-Huls DG-1-HC-03 DG-1-HC-04 DG-1-HC-07 DG-1-HC-11
DuPontMemphis
DM-1-HC-01 DM-1-HC-03 DM-1-HC-07DM-2-HC-07
DM-1-HC-08DM-2-HC-08
Rohm andHaas
RH-1-HC-01 RH-1-HC-06 RH-1-HC-04 RH-1-HC-02 RH-1-HC-03
Inorganic Listing Determination Inorganic Hydrogen CyanideListing Background Document August 200015
Waste Characterization
Three record samples of HCN purification wastewaters and ammonia purification wastewaters werecollected. In addition, nine record samples of commingled wastewaters were collected. Table 3.3describes the wastewater samples collected and their corresponding sample numbers. The completerecord sampling analytical results for each sample can be found in the sampling and analytical datareports listed below and included in the docket as separate documents. These reports contain allpertinent data validations and quality control information.
Sampling and Analytical Data Report for Record Sampling and Characterization ofWastes from the Inorganic Hydrogen Cyanide Manufacturing Sector; E.I. DuPont deNemours & Co., Inc., Memphis, TN; August 12, 1999
Sampling and Analytical Data Report for Record Sampling and Characterization ofWastes from the Inorganic Hydrogen Cyanide Manufacturing Sector; E.I. DuPont deNemours & Co., Inc., Memphis, TN; October 26, 1999
Sampling and Analytical Data Report for Record Sampling and Characterization ofWastes from the Inorganic Hydrogen Cyanide Manufacturing Sector; Rohm & HaasTexas, Deer Park, TX; July 28, 1999
Sampling and Analytical Data Report for Record Sampling and Characterization ofWastes from the Inorganic Hydrogen Cyanide Manufacturing Sector; Rohm & HaasTexas, Deer Park, TX; November 16, 1999
Sampling and Analytical Data Report for Record Sampling and Characterization ofWastes from the Inorganic Hydrogen Cyanide Manufacturing Sector; Degussa-Huls,Theodore, AL; August 26, 1999
Appendix A presents a comparison of EPA sample and facility-provided split sample data results.
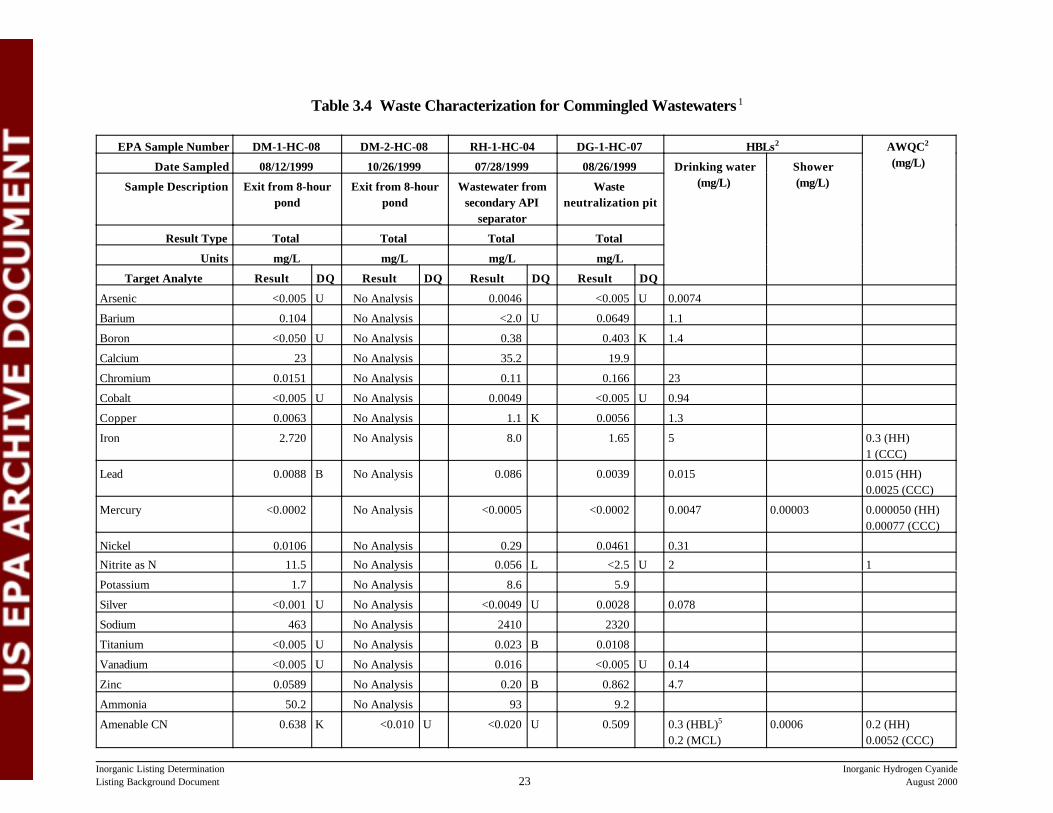
Because HCN purification and ammonia purification wastewaters are commingled with other non-HCNwastewaters prior to treatment and management in on-site surface impoundments at each of the threefacilities that were investigated, the samples that were assessed in the initial screening were the samplesthat represent the commingled wastewaters in these surface impoundments. These samples arenumbered as follows: DM-1-HC-08, RH-1-HC-04, and DG-1-HC-07. Table 3.4 presents theapplicable analytical data used for initial screening. Only detected constituents are shown. A secondround of analysis was conducted at DuPont Memphis resulting in additional analytical results, alsoincluded in Table 3.4 (DM-2-HC-08).
The MCL is 0.2 for free cyanide. The HBL for free cyanide is 0.3. We are assuming the analyticalresults for amenable cyanide represent mainly free cyanide (although some metal cyanide complexesmay be also be amenable to chlorination). We are assuming the appropriate risk assessment input
Inorganic Listing Determination Inorganic Hydrogen CyanideListing Background Document August 200016
would be our amenable cyanide results and that these results adequately reflect free cyanideconcentrations.
Results of Screening Analyses
The three facilities that use surface impoundments were assessed individually, as described furtherbelow. Table 3.4 compares the analytical results for detected constituents with the correspondingHBLs.
Rohm and Haas
Summary
An initial screening analysis of the Rohm and Haas commingled wastewaters managed in the on-sitesurface impoundment was conducted by comparing the analytical results for sample RH-1-HC-04 tothe health-based levels (HBLs) for detected constituents. This initial screening showed that allconstituents detected in Rohm and Haas’ wastewater are either below the HBLs or are derived fromnon-HCN wastewaters commingled with the targeted wastes (e.g., acetone). Therefore, the Rohm andHaas unlined surface impoundment scenario did not warrant further assessment.
Detailed Analysis
Acetone was detected in the commingled wastewater entering the surface impoundment at levelsexceeding the HBL and it was also detected in one of the upstream process wastewaters. However,EPA believes this constituent is derived from non-HCN wastewaters from two separate sources ofother on-site organic chemical processes that are commingled with the HCN wastewaters. The HCNwastewaters, which consist of HCN Purification Wastewater (RIN 1) and Ammonia PurificationWastewater (RIN 2), showed low levels of acetone prior to commingling with non-HCN wastewatersof 4 mg/L and 0.005 mg/L, respectively. After the first commingling with non-HCN wastewater, theacetone concentration increases to 240 mg/L (Wastewater to Stripper, RH-1-HC-02) and then dropsto 0.1 mg/L after processing in the stripper (Wastewater from Stripper, RH-1-HC-03), which isdesigned to remove cyanide and ammonia. After the second commingling with non-HCNwastewaters, the acetone level increases from 0.1 mg/L to 50 mg/L prior to the surface impoundment. Therefore, EPA is assuming that the bulk of the acetone loading in the commingled wastewater cannotbe attributed to HCN manufacture.
A number of other toxicant constituents shown in Table 3.4 (arsenic, benzene, lead, 4-methyl-2-pentanone, and methacrylonitrile) were detected in R&H’s wastewater inlet at levels close to orexceeding HBLs. However, these constituents were not detected in any of the upstream HCN processwastewaters that we sampled (RH-1-HC-01 and RH-1-HC-06), except for low levels of 4-methyl-pentanone in sample RH-1-HC-06. However, the level of this chemical in sample RH-1-HC-06 (0.01mg/L) was an order of magnitude lower than the level measured in RH-1-HC-04 (and also below theHBLs), which indicates no significant levels of this constituent are derived from the HCN process.Therefore, these constituents of concern are not associated with the HCN process.
5 U.S. EPA Phase II RFI Workplan, Potentiometric Surface Plan, March 3 & 4, 1999.
6The results reported on 10/18 for amenable cyanide were qualified as K, “estimated results with high bias”. The determination of the “non-amenable” portion of this analysis was made outside the holding time, resulting in apossible underestimate of the amount of “non-amenable” cyanide. Because this value is then subtracted from thetotal cyanide results to calculate “amenable cyanide”, the overall amenable value is estimated high.
7These samples were re-analyzed for total and amenable CN, as well as volatiles, pH, and % solids, and werecollected at the inlet and outlet of the 8-hr basins.
Inorganic Listing Determination Inorganic Hydrogen CyanideListing Background Document August 200017
DuPont Memphis
Summary
The facility and its surface impoundments are sited on the banks of the Loosahatchie River. Thesurface impoundments are located approximately 800 feet from the river. Based on informationavailable in the Remedial Facility Investigation (RFI),5 the direction of the groundwater flow isdocumented to be south towards the Loosahatchie River. The possibility of a public water supply wellor private well being located down gradient of the Tennessee surface impoundments is unlikely becausethe facility boundary extends to the river to the south. Hence, based on the geologic setting of thefacility as detailed above, we believe it is highly unlikely that these impoundments could impact drinkingwater wells via migration of a contaminated groundwater plume. Based on these facts we did notassess the groundwater-to-drinking water well pathway further at this site.
We did, however, conduct a screening analysis of potential releases of groundwater to surface waterand subsequent exposure via ingestion because of the proximity of the unit to the river. We calculatedthe concentrations in the river that would result from discharge of contaminated groundwater byestimating the infiltration rate for the unlined impoundment and diluting the resulting leachate volume intothe river under various flow conditions. The results of this screening level analysis demonstrate thatconcentrations of the constituents of concern in the river would be well below the aquatic life AWQCand HBLs for drinking water. The methodology and detailed results of the screening analysis arepresented in Risk Assessment for the Listing Determinations for Inorganic ChemicalManufacturing Wastes (August 2000) in the docket for today’s proposal.
Detailed Analysis
Some of the analytical results in the first round of sampling at DuPont Memphis on August 12, 1999 arequalified due to holding time exceedences.6 We re-sampled this waste category at DuPont7 onOctober 26, 1999 (sample DM-2-HC-08).
In discussions with DuPont regarding differences in our split results for cyanide, DuPont noted that theirsamples were preserved and analyzed differently than ours, with the purpose of their method being tohalt the oxychlorination destruction of CN (the treatment technology they employ in the WWT system). Their split-sample results for total cyanide are consistently higher than ours, as expected, because theyrepresent a snapshot of the waste in the impoundment at the time of sampling, and the oxychlorination
8U.S. EPA Phase II RFI Workplan, Potentiometric Surface Plan, March 3 & 4, 1999
Inorganic Listing Determination Inorganic Hydrogen CyanideListing Background Document August 200018
process may have continued in our samples. This pattern does not hold, however, for the amenableresults. It is unclear whether this difference is due to the holding time problems with our amenableanalysis or DuPont’s preservatives.
In our second round of sampling at the DuPont, Memphis facility, we collected two sample volumes of the wastewaters, one of which was preserved using our standard SW-846 preservatives, and the otherwhich was preserved using Na2S2O3 (DuPont’s standard method). Using the DuPont techniqueprovided us with (1) a split sample that is directly comparable to DuPont’s, and (2) worst case resultsthat may not be as sensitive to holding times.
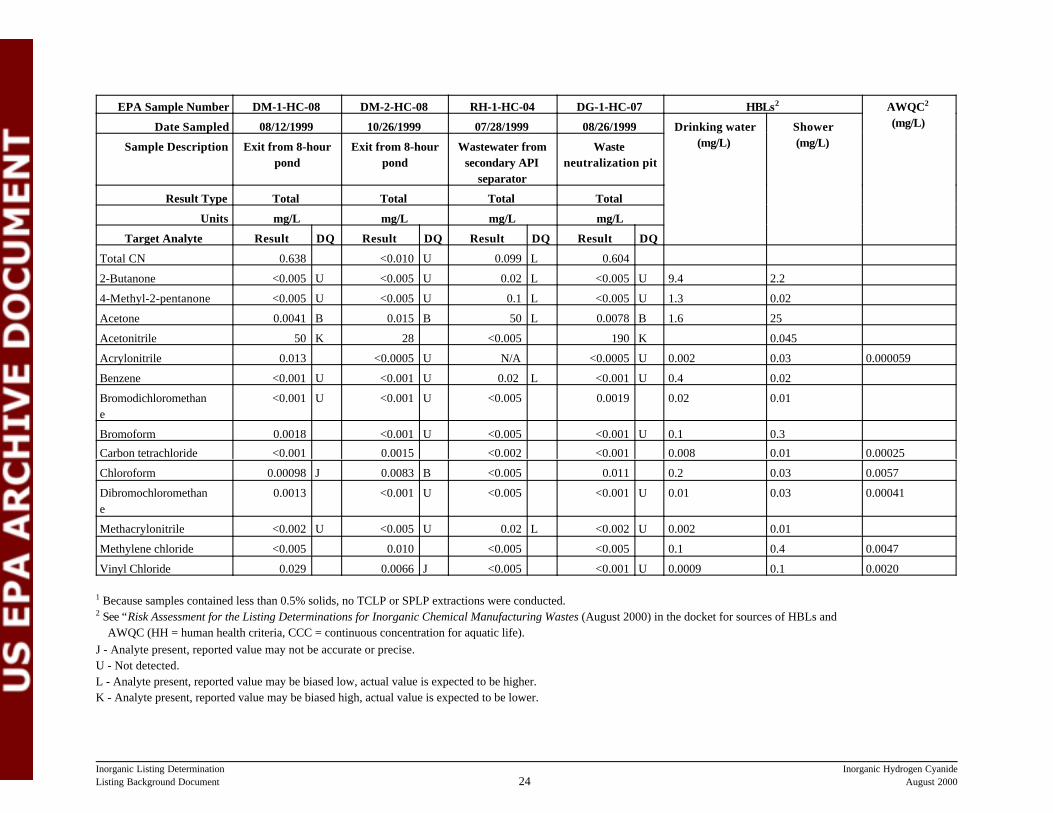
The DuPont Memphis commingled wastewater analytical results (DM-1-HC-08 and DM-1-HC-08)were compared directly to the drinking water HBLs and Ambient Water Quality Criteria (AWQC) as afirst level screening analysis (see Table 3.4). The following constituents exceeded the HBLs or AWQCin one or both of these samples: acetonitrile, acrylonitrile, carbon tetrachloride, chloroform, cyanide,dibromochloromethane, methylene chloride, vinyl chloride, iron, nitrite, copper and lead.
Acetonitrile was detected at 50 mg/L in DM-1-HC-08, but qualified as estimated by the laboratory dueto interferences. DuPont’s split-sample results were about half our detected levels. Our detectedlevels are consistent in our three related DuPont samples, and we also found it in the DeGussa sample. Thus, we used the detected concentration, despite its qualification, because (1) DuPont’s split is withinthe same order of magnitude, (2) other samples of comparable wastes also contain acetonitrile, (3)samples of the upstream HCN wastewaters at DuPont, Rohm&Haas and Degussa also containedacetonitrile at comparable or higher levels.Low levels of acetonitrile were detected in the DuPont trip blank (1 ppm). We do not believe theselevels are significant given the much higher levels detected in the wastes themselves.
We evaluated exit concentrations for DuPont’s surface impoundment as the most representativeconcentration to model in groundwater. However, the difference between inlet and exit concentrationsare not dramatic, and would not significantly affect the screening results.
DuPont has submitted information regarding the lack of groundwater receptors. However, weconducted a second level screening analysis for possible releases to surface water for those constituentsthat did not screen out in the first level HBL/AWQC screen. We reviewed this information, as well asthe RFI/RFA8 documents, to determine the most appropriate hydrogeologic parameters to model. From the existing documents, we assumed that any plume from the impoundments intercepts theadjacent river via the shallow aquifer.
This analyses is based on the subsurface migration of wastewaters from the 8-hour surfaceimpoundment at DuPont-Memphis discharging directly into the Loosahatchie River. Thus, theestimated seepage rate under the impoundment was diluted directly into the river water. Seepage rateswere calculated for two soil types: silt clay loam and silt loam. Although the subsurface soils are
9April 21, 2000 letter from DeGussa-Huls to M. Diaz (EPA); RE: Response to EPA LetterRequesting Additional Information dated April 18, 2000
Inorganic Listing Determination Inorganic Hydrogen CyanideListing Background Document August 200019
described in the RFI as clayey silt and silty clay, a soil permeability (saturated hydraulic conductivity)corresponding to a silt clay loam was used to account for the expected natural heterogeneity of alluvialsoils. The higher soil permeability corresponding to silt loam is considered a bounding condition.
The results of this screening level analysis suggest that concentrations of the constituents of concern inthe river would be well below the aquatic life AWQC and HBLs for drinking water. The details of thescreening analysis are presented in “Risk Assessment for the Listing Determinations for InorganicChemical Manufacturing Wastes” in the docket.
DeGussa-Huls
Summary
An initial screening analysis of the Degussa-Huls commingled wastewaters was conducted bycomparing the analytical results for sample DG-1-HC-07 to the HBLs for detected constituents (seeTable 3.4). This initial screening identified two constituents of concern: acetonitrile and cyanide.DeGussa-Huls reported in a letter to EPA9 that the volume associated with the sample point is 20,800MT/yr, and that the total waste volume managed in the equalization basin is 748,300 MT/yr, resulting ina dilution ratio of 36. Sample DG-1-HC-07 was collected directly from the equalization tank for thecommingled HCN process wastewater. After the HCN process wastewater leaves the neutralizationtank, it is commingled with process wastewater from other on-site non-HCN process wastewatersprior to the point in the wastewater treatment system where the combined HCN and non-HCNwastewater is placed in the equalization basin. Levels of all constituents of concern (including cyanide)are below HBLs in the combined HCN/non-HCN wastewater, except for acetonitrile. Theequalization basin is double-lined with a leachate collection system. A study of existing wells near thefacility indicates the presence of private water wells within a one-mile radius of the property boundary.See Appendix B in Risk-Based Corrective Action Plan for the Sodium Cyanide Production Unitat Degussa Corporation; Theodore, Alabama; March 19, 1998. This surface impoundmentscenario warranted further assessment of acetonitrile. For details and the results of this assessment seeRisk Assessment for the Listing Determinations for Inorganic Chemical Manufacturing Wastes(August 2000) available in the docket for this proposal.
Detailed Analysis
The DeGussa facility manages wastewater in a series of surface impoundments and tanks that provideequalization, oxidation, maturation, rock-reed filtration, and mixing. In addition, the facility has anemergency holding basin which has also been used for HCN process wastewaters. The surfaceimpoundments are equipped with double synthetic liners with leachate detection and collection systems. The oxidation basin is a concrete-lined structure with an additional synthetic liner. Our analytical dataindicates that concentrations at the inlet to the impoundments would exceed the HBLs for one
10 The facility reported that the cover on the equalization unit was installed to ensurecompliance with expected new regulations to control volatile organic carbon emissionsfrom wastewater sources for the Synthetic Organic Chemical Manufacturing Industry(SOCMI) (proposal, 59 FR 46780, September 9, 1994).
Inorganic Listing Determination Inorganic Hydrogen CyanideListing Background Document August 200020
constituent of concern (acetonitrile). A study of existing wells near the facility indicates the presence ofprivate water wells within a one-mile radius of the property boundary. We therefore assessed theseunits further for potential releases to groundwater.
The DeGussa’s surface impoundments are located in the center of an industrial park on the west side ofMobile Bay. The wastewater treatment impoundments are located near the eastern property boundaryof the facility and approximately 4,000 feet south of the State of Alabama barge canal. We chose toassess surface water risks at the Tennessee facility, which is closer to a surface water body. However,given the use of groundwater in the area around the Alabama facility, we assessed the possible impacton drinking water wells. We selected the equalization basin as the unit for quantitative modeling. Thisis the first surface impoundment in the series and is likely to hold the highest level of constituents ofconcern. We elected not to assess the emergency holding pond, which is used primarily during highstormwater events. Due to the intermittent use of the holding pond, we expect the potential forsignificant groundwater releases to be greater for the equalization pond. In addition, the equalizationpond is covered with a floating synthetic membrane, while the holding pond is not.10 Our modeling ofthe covered equalization pond did not assume any loss of the volatile constituents of concern, thusallowing more of the constituents to infiltrate to the groundwater rather than volatilize to the air.
We did not model the biological treatment unit because we believe the equalization unit would posemore risk. The concentrations in the equalization pond will be higher than in this unit, as evidenced bythe sampling and analysis data downstream of the biological treatment unit (which screened out). Thusthe concentrations in the equalization impoundment are likely to be much greater than in the biologicaltreatment unit. Also, the equalization pond is bigger than the biounit (1,700 m2 vs 1,200 m2), and thebiological treatment unit is concrete-lined, making any release to groundwater less likely.
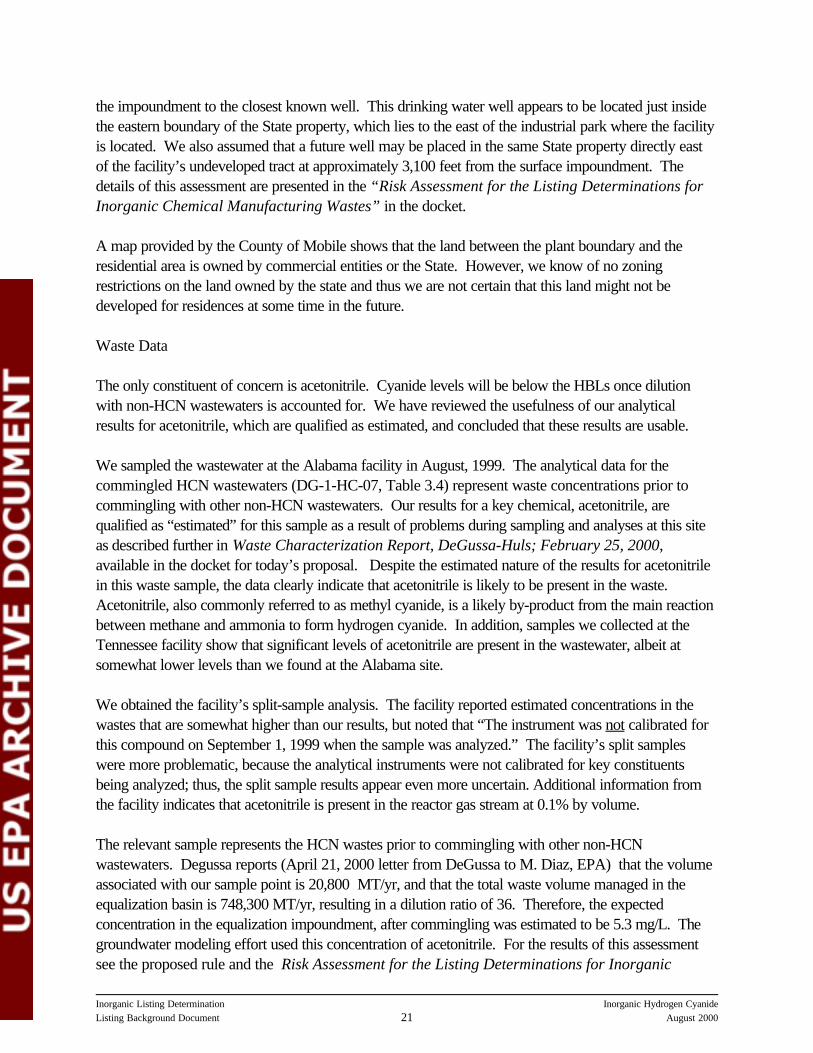
Based on information available in a corrective action plan related to a product spill on-site (Risk-BasedCorrective Action Plan for the Sodium Cyanide Production Unit at DeGussa CorporationAlabama Facility, Theodore, Alabama; March 19, 1998), the most likely direction of groundwaterflow is to the low-lying areas to the north-northeast of the surface impoundments. We found there aredrinking water wells located due east of the equalization surface impoundment. Although the wells arelocated east of the surface impoundment instead of the estimated north-northeast groundwater flowdirection, they are at somewhat lower ground elevation than the surface impoundment. Given theuncertainty in the direction of the groundwater flow, we assumed that contaminated groundwater fromthe surface impoundment could migrate to the east and reach these wells. Based on the available landuse and groundwater use information for this area, we performed risk modeling for potential releases todrinking water wells located between 3,100 and 5,280 feet east of the surface impoundment. Theminimum distance of 3,100 feet is based on the distance from the impoundment to the eastern boundaryof the industrial area controlled by the facility. The maximum distance of 5,280 is the distance east from
Inorganic Listing Determination Inorganic Hydrogen CyanideListing Background Document August 200021
the impoundment to the closest known well. This drinking water well appears to be located just insidethe eastern boundary of the State property, which lies to the east of the industrial park where the facilityis located. We also assumed that a future well may be placed in the same State property directly eastof the facility’s undeveloped tract at approximately 3,100 feet from the surface impoundment. Thedetails of this assessment are presented in the “Risk Assessment for the Listing Determinations forInorganic Chemical Manufacturing Wastes” in the docket.
A map provided by the County of Mobile shows that the land between the plant boundary and theresidential area is owned by commercial entities or the State. However, we know of no zoningrestrictions on the land owned by the state and thus we are not certain that this land might not bedeveloped for residences at some time in the future.
Waste Data
The only constituent of concern is acetonitrile. Cyanide levels will be below the HBLs once dilutionwith non-HCN wastewaters is accounted for. We have reviewed the usefulness of our analyticalresults for acetonitrile, which are qualified as estimated, and concluded that these results are usable.
We sampled the wastewater at the Alabama facility in August, 1999. The analytical data for thecommingled HCN wastewaters (DG-1-HC-07, Table 3.4) represent waste concentrations prior tocommingling with other non-HCN wastewaters. Our results for a key chemical, acetonitrile, arequalified as “estimated” for this sample as a result of problems during sampling and analyses at this siteas described further in Waste Characterization Report, DeGussa-Huls; February 25, 2000,available in the docket for today’s proposal. Despite the estimated nature of the results for acetonitrilein this waste sample, the data clearly indicate that acetonitrile is likely to be present in the waste. Acetonitrile, also commonly referred to as methyl cyanide, is a likely by-product from the main reactionbetween methane and ammonia to form hydrogen cyanide. In addition, samples we collected at theTennessee facility show that significant levels of acetonitrile are present in the wastewater, albeit atsomewhat lower levels than we found at the Alabama site.
We obtained the facility’s split-sample analysis. The facility reported estimated concentrations in thewastes that are somewhat higher than our results, but noted that “The instrument was not calibrated forthis compound on September 1, 1999 when the sample was analyzed.” The facility’s split sampleswere more problematic, because the analytical instruments were not calibrated for key constituentsbeing analyzed; thus, the split sample results appear even more uncertain. Additional information fromthe facility indicates that acetonitrile is present in the reactor gas stream at 0.1% by volume.
The relevant sample represents the HCN wastes prior to commingling with other non-HCNwastewaters. Degussa reports (April 21, 2000 letter from DeGussa to M. Diaz, EPA) that the volumeassociated with our sample point is 20,800 MT/yr, and that the total waste volume managed in theequalization basin is 748,300 MT/yr, resulting in a dilution ratio of 36. Therefore, the expectedconcentration in the equalization impoundment, after commingling was estimated to be 5.3 mg/L. Thegroundwater modeling effort used this concentration of acetonitrile. For the results of this assessmentsee the proposed rule and the Risk Assessment for the Listing Determinations for Inorganic

Inorganic Listing Determination Inorganic Hydrogen CyanideListing Background Document August 200022
Chemical Manufacturing Wastes (August 2000) available in the docket for this proposal.
Inorganic Listing Determination Inorganic Hydrogen CyanideListing Background Document August 200023
Table 3.4 Waste Characterization for Commingled Wastewaters 1
EPA Sample Number DM-1-HC-08 DM-2-HC-08 RH-1-HC-04 DG-1-HC-07 HBLs2 AWQC2 (mg/L)Date Sampled 08/12/1999 10/26/1999 07/28/1999 08/26/1999 Drinking water
(mg/L)Shower(mg/L)Sample Description Exit from 8-hour
pondExit from 8-hour
pondWastewater from
secondary APIseparator
Wasteneutralization pit
Result Type Total Total Total Total
Units mg/L mg/L mg/L mg/L
Target Analyte Result DQ Result DQ Result DQ Result DQ
Arsenic <0.005 U No Analysis 0.0046 <0.005 U 0.0074
Barium 0.104 No Analysis <2.0 U 0.0649 1.1
Boron <0.050 U No Analysis 0.38 0.403 K 1.4
Calcium 23 No Analysis 35.2 19.9
Chromium 0.0151 No Analysis 0.11 0.166 23
Cobalt <0.005 U No Analysis 0.0049 <0.005 U 0.94
Copper 0.0063 No Analysis 1.1 K 0.0056 1.3
Iron 2.720 No Analysis 8.0 1.65 5 0.3 (HH)1 (CCC)
Lead 0.0088 B No Analysis 0.086 0.0039 0.015 0.015 (HH)0.0025 (CCC)
Mercury <0.0002 No Analysis <0.0005 <0.0002 0.0047 0.00003 0.000050 (HH)0.00077 (CCC)
Nickel 0.0106 No Analysis 0.29 0.0461 0.31
Nitrite as N 11.5 No Analysis 0.056 L <2.5 U 2 1
Potassium 1.7 No Analysis 8.6 5.9
Silver <0.001 U No Analysis <0.0049 U 0.0028 0.078
Sodium 463 No Analysis 2410 2320
Titanium <0.005 U No Analysis 0.023 B 0.0108
Vanadium <0.005 U No Analysis 0.016 <0.005 U 0.14
Zinc 0.0589 No Analysis 0.20 B 0.862 4.7
Ammonia 50.2 No Analysis 93 9.2
Amenable CN 0.638 K <0.010 U <0.020 U 0.509 0.3 (HBL)5
0.2 (MCL)0.0006 0.2 (HH)
0.0052 (CCC)
EPA Sample Number DM-1-HC-08 DM-2-HC-08 RH-1-HC-04 DG-1-HC-07 HBLs2 AWQC2 (mg/L)Date Sampled 08/12/1999 10/26/1999 07/28/1999 08/26/1999 Drinking water
(mg/L)Shower(mg/L)Sample Description Exit from 8-hour
pondExit from 8-hour
pondWastewater from
secondary APIseparator
Wasteneutralization pit
Result Type Total Total Total Total
Units mg/L mg/L mg/L mg/L
Target Analyte Result DQ Result DQ Result DQ Result DQ
Inorganic Listing Determination Inorganic Hydrogen CyanideListing Background Document August 200024
Total CN 0.638 <0.010 U 0.099 L 0.604
2-Butanone <0.005 U <0.005 U 0.02 L <0.005 U 9.4 2.2
4-Methyl-2-pentanone <0.005 U <0.005 U 0.1 L <0.005 U 1.3 0.02
Acetone 0.0041 B 0.015 B 50 L 0.0078 B 1.6 25
Acetonitrile 50 K 28 <0.005 190 K 0.045
Acrylonitrile 0.013 <0.0005 U N/A <0.0005 U 0.002 0.03 0.000059
Benzene <0.001 U <0.001 U 0.02 L <0.001 U 0.4 0.02
Bromodichloromethane
<0.001 U <0.001 U <0.005 0.0019 0.02 0.01
Bromoform 0.0018 <0.001 U <0.005 <0.001 U 0.1 0.3
Carbon tetrachloride <0.001 0.0015 <0.002 <0.001 0.008 0.01 0.00025
Chloroform 0.00098 J 0.0083 B <0.005 0.011 0.2 0.03 0.0057
Dibromochloromethane
0.0013 <0.001 U <0.005 <0.001 U 0.01 0.03 0.00041
Methacrylonitrile <0.002 U <0.005 U 0.02 L <0.002 U 0.002 0.01
Methylene chloride <0.005 0.010 <0.005 <0.005 0.1 0.4 0.0047
Vinyl Chloride 0.029 0.0066 J <0.005 <0.001 U 0.0009 0.1 0.0020
1 Because samples contained less than 0.5% solids, no TCLP or SPLP extractions were conducted.2 See “Risk Assessment for the Listing Determinations for Inorganic Chemical Manufacturing Wastes (August 2000) in the docket for sources of HBLs and AWQC (HH = human health criteria, CCC = continuous concentration for aquatic life).J - Analyte present, reported value may not be accurate or precise.U - Not detected.L - Analyte present, reported value may be biased low, actual value is expected to be higher.K - Analyte present, reported value may be biased high, actual value is expected to be lower.
Inorganic Listing Determination Inorganic Hydrogen CyanideListing Background Document August 200025
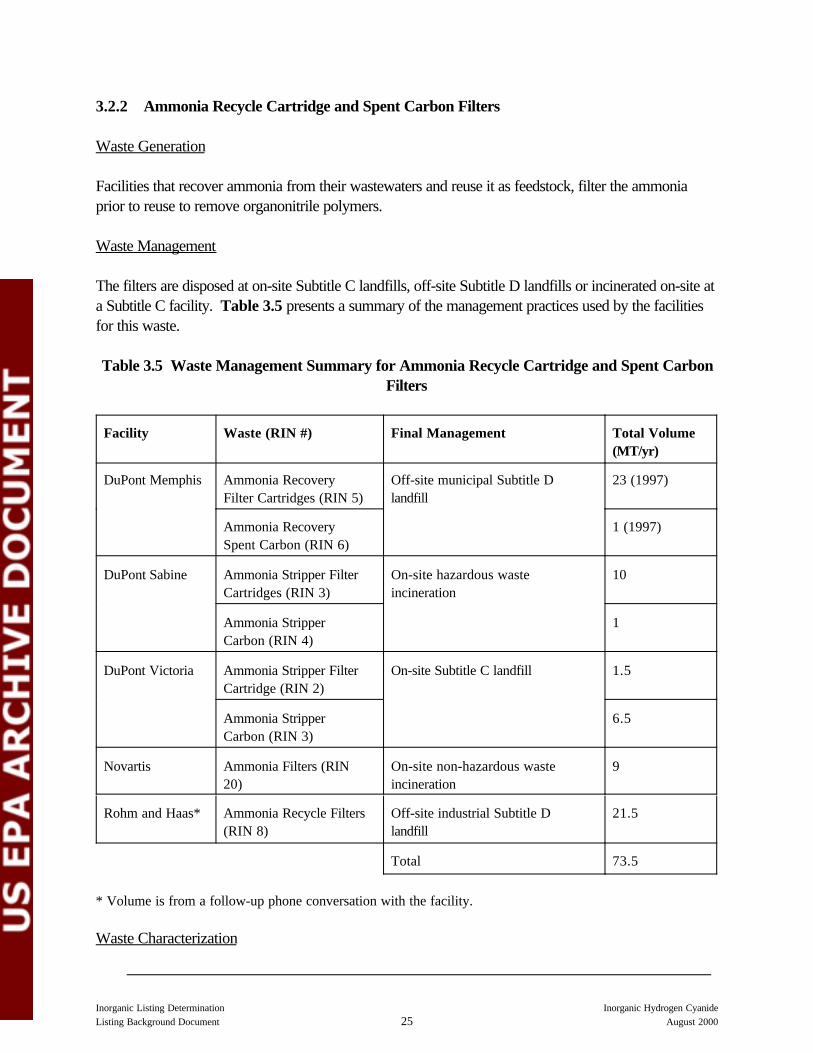
3.2.2 Ammonia Recycle Cartridge and Spent Carbon Filters
Waste Generation
Facilities that recover ammonia from their wastewaters and reuse it as feedstock, filter the ammoniaprior to reuse to remove organonitrile polymers.
Waste Management
The filters are disposed at on-site Subtitle C landfills, off-site Subtitle D landfills or incinerated on-site ata Subtitle C facility. Table 3.5 presents a summary of the management practices used by the facilitiesfor this waste.
Table 3.5 Waste Management Summary for Ammonia Recycle Cartridge and Spent CarbonFilters
Facility Waste (RIN #) Final Management Total Volume(MT/yr)
DuPont Memphis Ammonia RecoveryFilter Cartridges (RIN 5)
Off-site municipal Subtitle Dlandfill
23 (1997)
Ammonia RecoverySpent Carbon (RIN 6)
1 (1997)
DuPont Sabine Ammonia Stripper FilterCartridges (RIN 3)
On-site hazardous wasteincineration
10
Ammonia StripperCarbon (RIN 4)
1
DuPont Victoria Ammonia Stripper FilterCartridge (RIN 2)
On-site Subtitle C landfill 1.5
Ammonia StripperCarbon (RIN 3)
6.5
Novartis Ammonia Filters (RIN20)
On-site non-hazardous wasteincineration
9
Rohm and Haas* Ammonia Recycle Filters(RIN 8)
Off-site industrial Subtitle Dlandfill
21.5
Total 73.5
* Volume is from a follow-up phone conversation with the facility.
Waste Characterization
Inorganic Listing Determination Inorganic Hydrogen CyanideListing Background Document August 200026
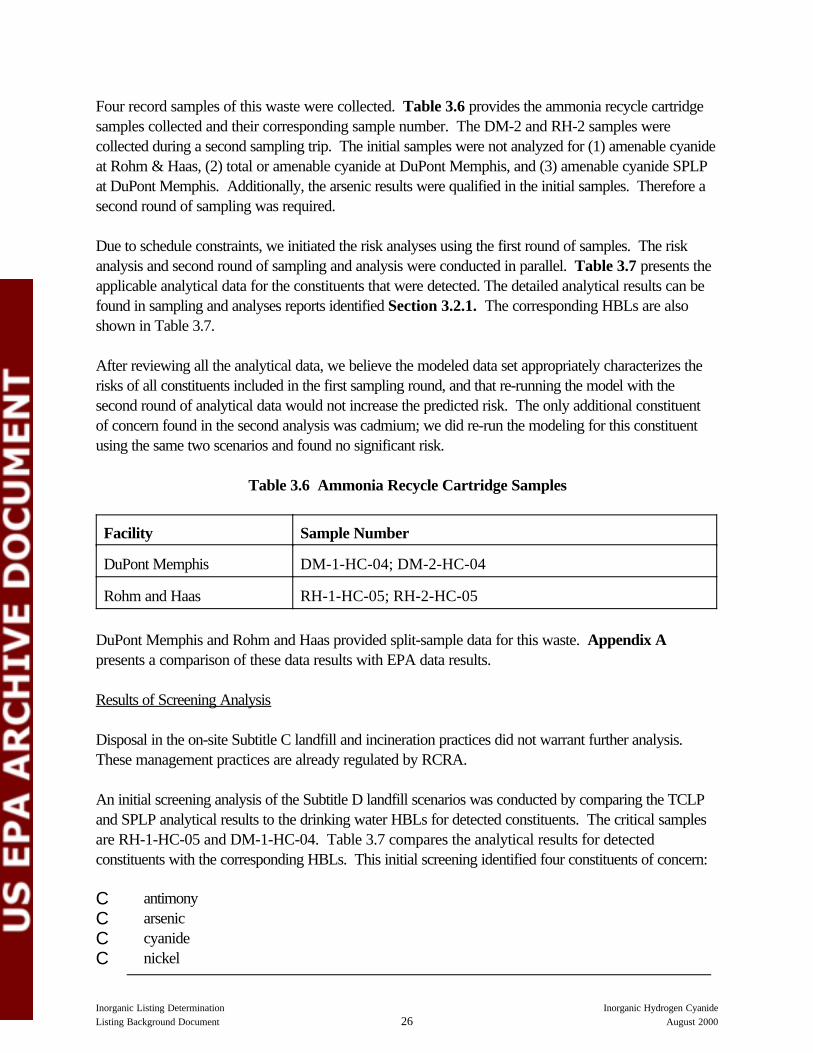
Four record samples of this waste were collected. Table 3.6 provides the ammonia recycle cartridgesamples collected and their corresponding sample number. The DM-2 and RH-2 samples werecollected during a second sampling trip. The initial samples were not analyzed for (1) amenable cyanideat Rohm & Haas, (2) total or amenable cyanide at DuPont Memphis, and (3) amenable cyanide SPLPat DuPont Memphis. Additionally, the arsenic results were qualified in the initial samples. Therefore asecond round of sampling was required.
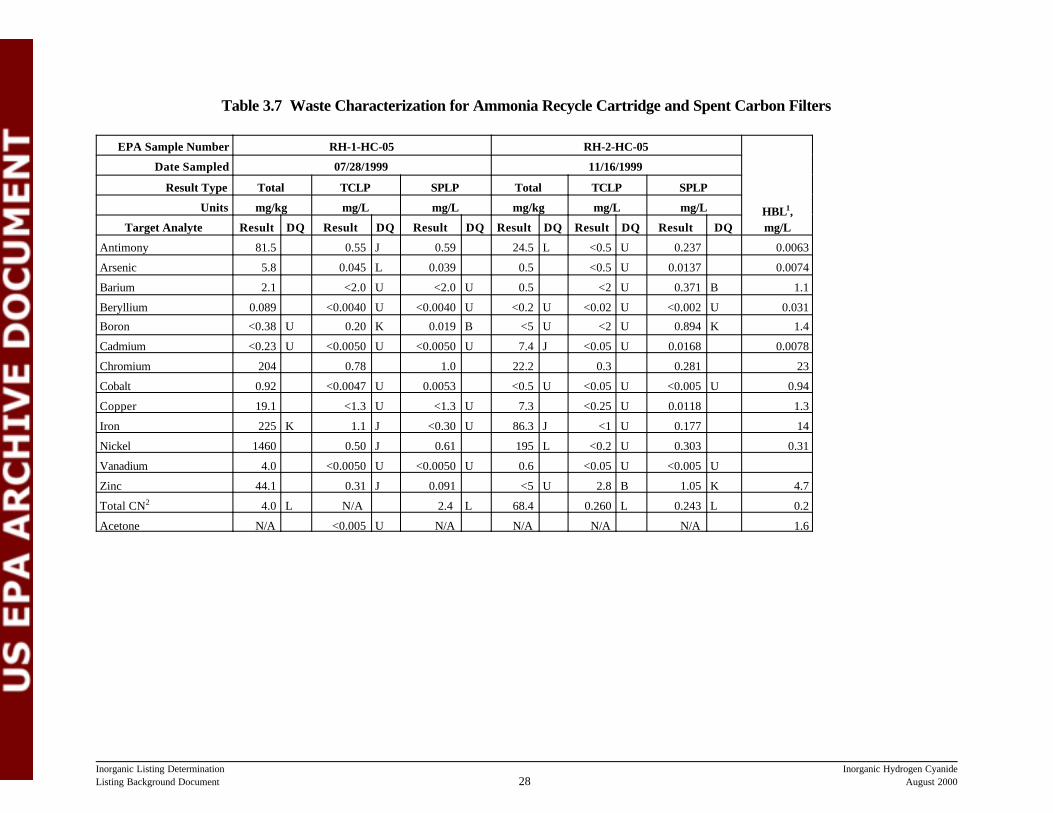
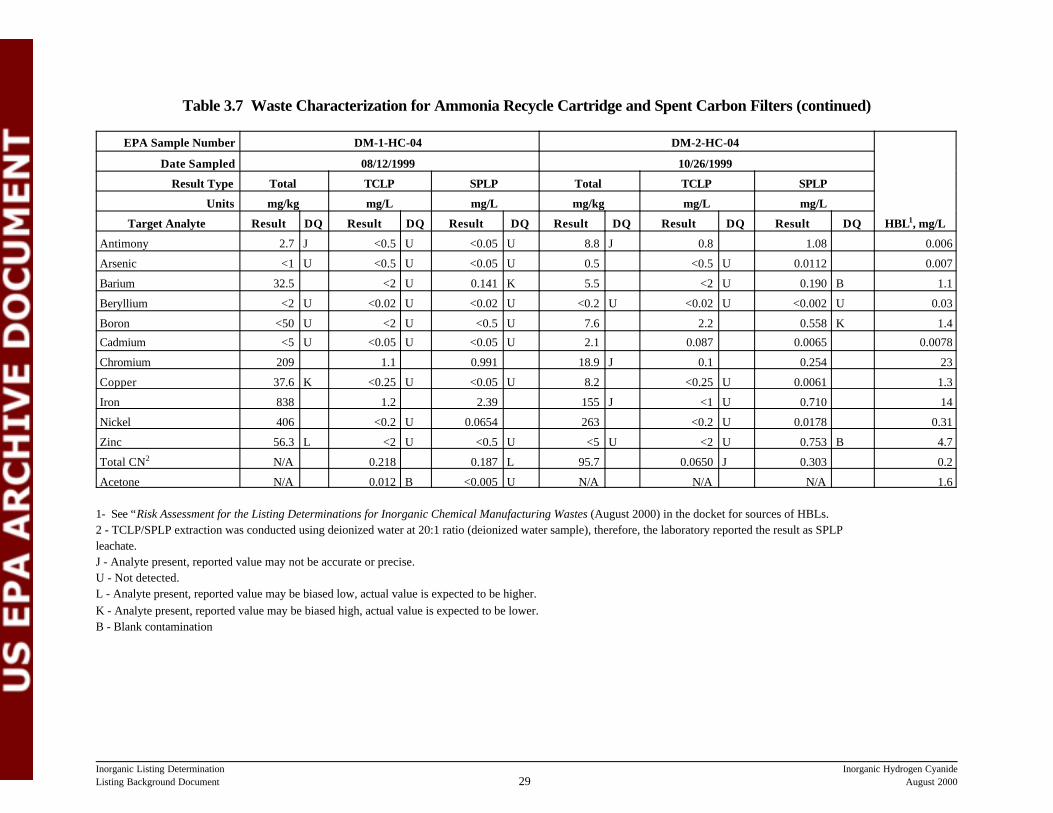
Due to schedule constraints, we initiated the risk analyses using the first round of samples. The riskanalysis and second round of sampling and analysis were conducted in parallel. Table 3.7 presents theapplicable analytical data for the constituents that were detected. The detailed analytical results can befound in sampling and analyses reports identified Section 3.2.1. The corresponding HBLs are alsoshown in Table 3.7.
After reviewing all the analytical data, we believe the modeled data set appropriately characterizes therisks of all constituents included in the first sampling round, and that re-running the model with thesecond round of analytical data would not increase the predicted risk. The only additional constituentof concern found in the second analysis was cadmium; we did re-run the modeling for this constituentusing the same two scenarios and found no significant risk.
Table 3.6 Ammonia Recycle Cartridge Samples
Facility Sample Number
DuPont Memphis DM-1-HC-04; DM-2-HC-04
Rohm and Haas RH-1-HC-05; RH-2-HC-05
DuPont Memphis and Rohm and Haas provided split-sample data for this waste. Appendix Apresents a comparison of these data results with EPA data results.
Results of Screening Analysis
Disposal in the on-site Subtitle C landfill and incineration practices did not warrant further analysis. These management practices are already regulated by RCRA.
An initial screening analysis of the Subtitle D landfill scenarios was conducted by comparing the TCLPand SPLP analytical results to the drinking water HBLs for detected constituents. The critical samplesare RH-1-HC-05 and DM-1-HC-04. Table 3.7 compares the analytical results for detectedconstituents with the corresponding HBLs. This initial screening identified four constituents of concern:
C antimonyC arsenicC cyanideC nickel
Inorganic Listing Determination Inorganic Hydrogen CyanideListing Background Document August 200027
The TCLP Boron result also exceed the HBL, however, because it exceeds the HBL by a factor ofless than two, it was screened out; a dilution and attenuation factor of two would bring this constituentbelow the HBL.
We assessed the groundwater ingestion pathway for the off-site landfill scenarios, reflecting the types ofmanagement reported for this waste. Our model inputs included different hydrogeologic settingsreflecting the two regions where the wastes are reported to be managed. We used the TCLP resultsfor the municipal landfill scenario and the SPLP for the industrial landfill scenario.Landfill characteristics were selected from the national municipal landfill database rather than using thereported landfills because of the potential for the wastes to be managed at a variety of landfills otherthan those reported. The landfills were be assumed to be unlined, although the landfill operatorsindicate that they are lined with leachate collection systems and groundwater monitoring under theSubtitle D program.
For details and the results of this assessment, see “Risk Assessment for the Listing Determinationsfor Inorganic Chemical Manufacturing Wastes” (August 2000) available in the docket.
No significant volatile constituents were detected in this waste (only non-volatile metals were detected),thus volatilization from landfills to the air was not a pathway of concern. It is also highly unlikely thatwind blown particulates from landfills would be significant due to the common usage of daily andlonger-term cover at landfills. In any case, the levels of all constituents in the waste itself (i.e., totalconcentrations shown in Table 3.7) are below or only marginally above soil screening levels based onthe direct ingestion of the waste (see table 3-3 of the risk document cited above). In one sample,antimony exceeded the ingestion level by a factor of 2.5 and arsenic by a factor of 1.2. Given theselevels and the small volumes of waste at issue (22 and 23 MT), the likelihood of any release ofparticulates presenting a significant risk is remote.
Inorganic Listing Determination Inorganic Hydrogen CyanideListing Background Document August 200028
Table 3.7 Waste Characterization for Ammonia Recycle Cartridge and Spent Carbon Filters
EPA Sample Number RH-1-HC-05 RH-2-HC-05
HBL1,mg/L
Date Sampled 07/28/1999 11/16/1999
Result Type Total TCLP SPLP Total TCLP SPLP
Units mg/kg mg/L mg/L mg/kg mg/L mg/L
Target Analyte Result DQ Result DQ Result DQ Result DQ Result DQ Result DQ
Antimony 81.5 0.55 J 0.59 24.5 L <0.5 U 0.237 0.0063
Arsenic 5.8 0.045 L 0.039 0.5 <0.5 U 0.0137 0.0074
Barium 2.1 <2.0 U <2.0 U 0.5 <2 U 0.371 B 1.1
Beryllium 0.089 <0.0040 U <0.0040 U <0.2 U <0.02 U <0.002 U 0.031
Boron <0.38 U 0.20 K 0.019 B <5 U <2 U 0.894 K 1.4
Cadmium <0.23 U <0.0050 U <0.0050 U 7.4 J <0.05 U 0.0168 0.0078
Chromium 204 0.78 1.0 22.2 0.3 0.281 23
Cobalt 0.92 <0.0047 U 0.0053 <0.5 U <0.05 U <0.005 U 0.94
Copper 19.1 <1.3 U <1.3 U 7.3 <0.25 U 0.0118 1.3
Iron 225 K 1.1 J <0.30 U 86.3 J <1 U 0.177 14
Nickel 1460 0.50 J 0.61 195 L <0.2 U 0.303 0.31
Vanadium 4.0 <0.0050 U <0.0050 U 0.6 <0.05 U <0.005 U
Zinc 44.1 0.31 J 0.091 <5 U 2.8 B 1.05 K 4.7
Total CN2 4.0 L N/A 2.4 L 68.4 0.260 L 0.243 L 0.2
Acetone N/A <0.005 U N/A N/A N/A N/A 1.6
Inorganic Listing Determination Inorganic Hydrogen CyanideListing Background Document August 200029
Table 3.7 Waste Characterization for Ammonia Recycle Cartridge and Spent Carbon Filters (continued)
EPA Sample Number DM-1-HC-04 DM-2-HC-04
HBL1, mg/L
Date Sampled 08/12/1999 10/26/1999
Result Type Total TCLP SPLP Total TCLP SPLP
Units mg/kg mg/L mg/L mg/kg mg/L mg/L
Target Analyte Result DQ Result DQ Result DQ Result DQ Result DQ Result DQ
Antimony 2.7 J <0.5 U <0.05 U 8.8 J 0.8 1.08 0.006
Arsenic <1 U <0.5 U <0.05 U 0.5 <0.5 U 0.0112 0.007
Barium 32.5 <2 U 0.141 K 5.5 <2 U 0.190 B 1.1
Beryllium <2 U <0.02 U <0.02 U <0.2 U <0.02 U <0.002 U 0.03
Boron <50 U <2 U <0.5 U 7.6 2.2 0.558 K 1.4
Cadmium <5 U <0.05 U <0.05 U 2.1 0.087 0.0065 0.0078
Chromium 209 1.1 0.991 18.9 J 0.1 0.254 23
Copper 37.6 K <0.25 U <0.05 U 8.2 <0.25 U 0.0061 1.3
Iron 838 1.2 2.39 155 J <1 U 0.710 14
Nickel 406 <0.2 U 0.0654 263 <0.2 U 0.0178 0.31
Zinc 56.3 L <2 U <0.5 U <5 U <2 U 0.753 B 4.7
Total CN2 N/A 0.218 0.187 L 95.7 0.0650 J 0.303 0.2
Acetone N/A 0.012 B <0.005 U N/A N/A N/A 1.6
1- See “Risk Assessment for the Listing Determinations for Inorganic Chemical Manufacturing Wastes (August 2000) in the docket for sources of HBLs.2 - TCLP/SPLP extraction was conducted using deionized water at 20:1 ratio (deionized water sample), therefore, the laboratory reported the result as SPLPleachate.J - Analyte present, reported value may not be accurate or precise.U - Not detected.L - Analyte present, reported value may be biased low, actual value is expected to be higher.K - Analyte present, reported value may be biased high, actual value is expected to be lower.B - Blank contamination
Inorganic Listing Determination Inorganic Hydrogen CyanideListing Background Document August 200030
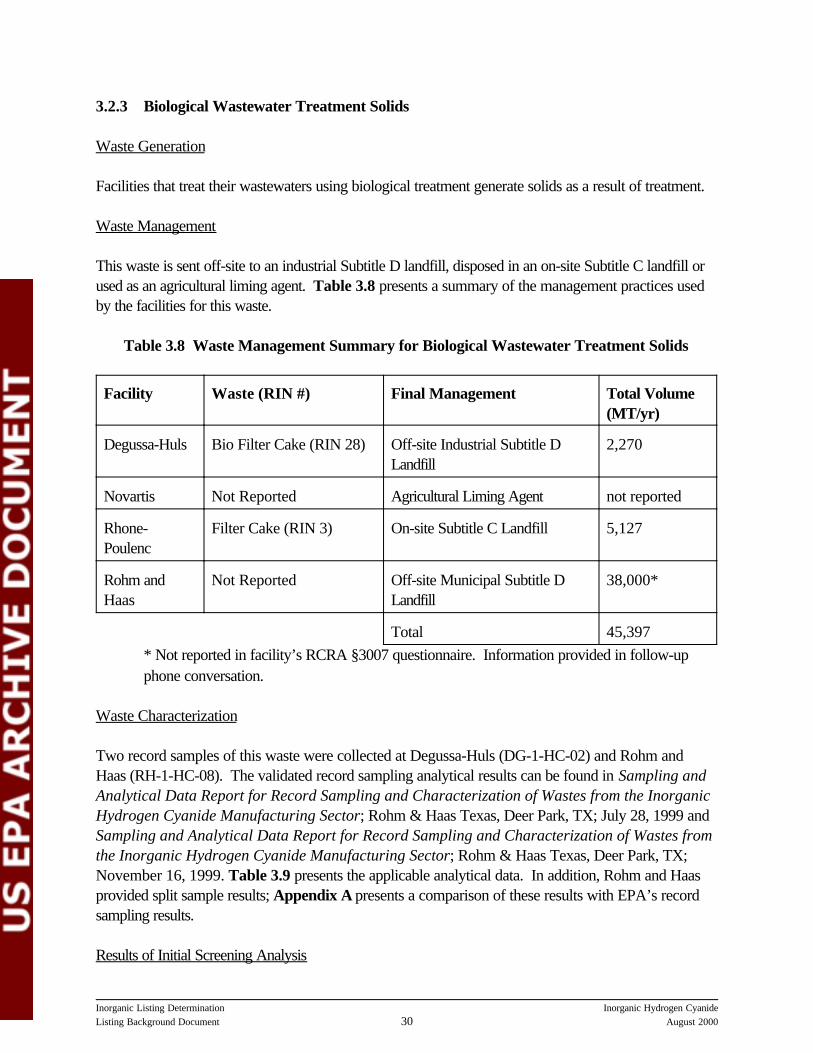
3.2.3 Biological Wastewater Treatment Solids
Waste Generation
Facilities that treat their wastewaters using biological treatment generate solids as a result of treatment.
Waste Management
This waste is sent off-site to an industrial Subtitle D landfill, disposed in an on-site Subtitle C landfill orused as an agricultural liming agent. Table 3.8 presents a summary of the management practices usedby the facilities for this waste.
Table 3.8 Waste Management Summary for Biological Wastewater Treatment Solids
Facility Waste (RIN #) Final Management Total Volume(MT/yr)
Degussa-Huls Bio Filter Cake (RIN 28) Off-site Industrial Subtitle DLandfill
2,270
Novartis Not Reported Agricultural Liming Agent not reported
Rhone-Poulenc
Filter Cake (RIN 3) On-site Subtitle C Landfill 5,127
Rohm andHaas
Not Reported Off-site Municipal Subtitle DLandfill
38,000*
Total 45,397* Not reported in facility’s RCRA §3007 questionnaire. Information provided in follow-upphone conversation.
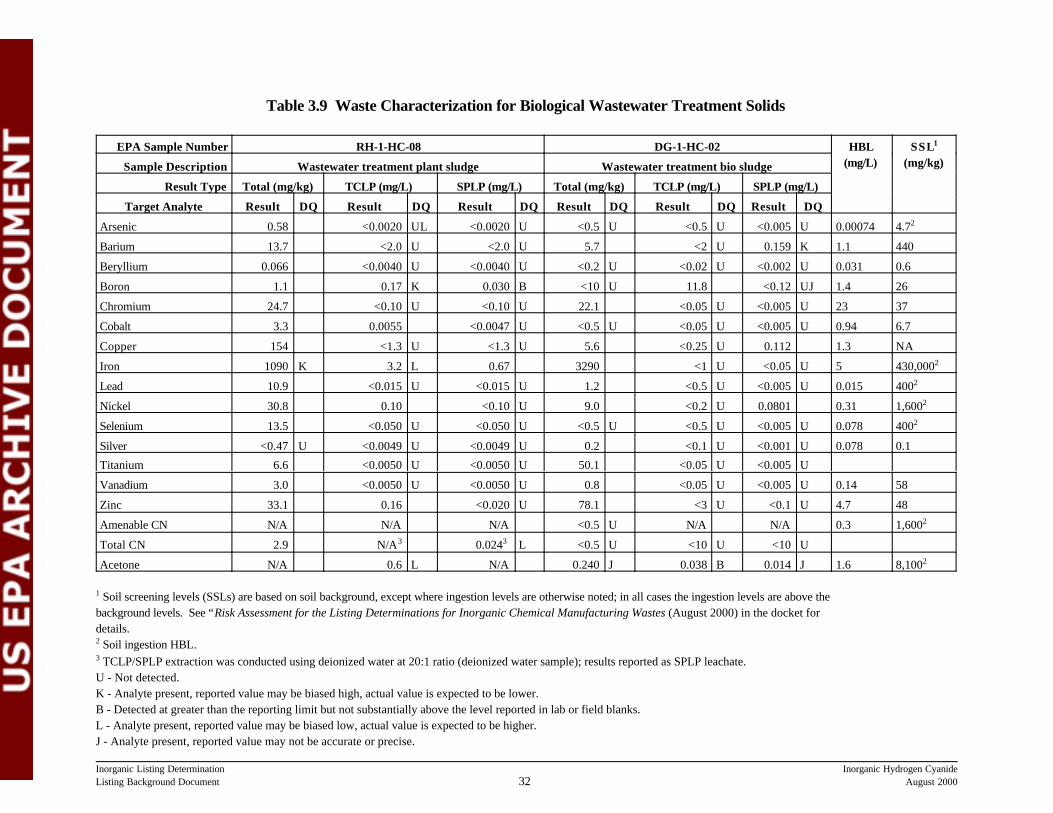
Waste Characterization
Two record samples of this waste were collected at Degussa-Huls (DG-1-HC-02) and Rohm andHaas (RH-1-HC-08). The validated record sampling analytical results can be found in Sampling andAnalytical Data Report for Record Sampling and Characterization of Wastes from the InorganicHydrogen Cyanide Manufacturing Sector; Rohm & Haas Texas, Deer Park, TX; July 28, 1999 andSampling and Analytical Data Report for Record Sampling and Characterization of Wastes fromthe Inorganic Hydrogen Cyanide Manufacturing Sector; Rohm & Haas Texas, Deer Park, TX;November 16, 1999. Table 3.9 presents the applicable analytical data. In addition, Rohm and Haasprovided split sample results; Appendix A presents a comparison of these results with EPA’s recordsampling results.
Results of Initial Screening Analysis
11 For further explanation of these levels see “Risk Assessment for the Listing Determinationsfor Inorganic Chemical Manufacturing Wastes” (August 2000) in the docket.
12 The TCLP results for boron in sample RH-1-HC-08 showed an elevated level, however theTCLP value is not possible given the nondetect level in the total analysis (< 10 mg/kg). The TCLPmethod should have yielded a leaching level of no more than ~0.5 mg/L based on this total value, which iswell below the HBL. Furthermore, boron is not expected to be in wastes from the HCN process..Inorganic Listing Determination Inorganic Hydrogen CyanideListing Background Document August 200031
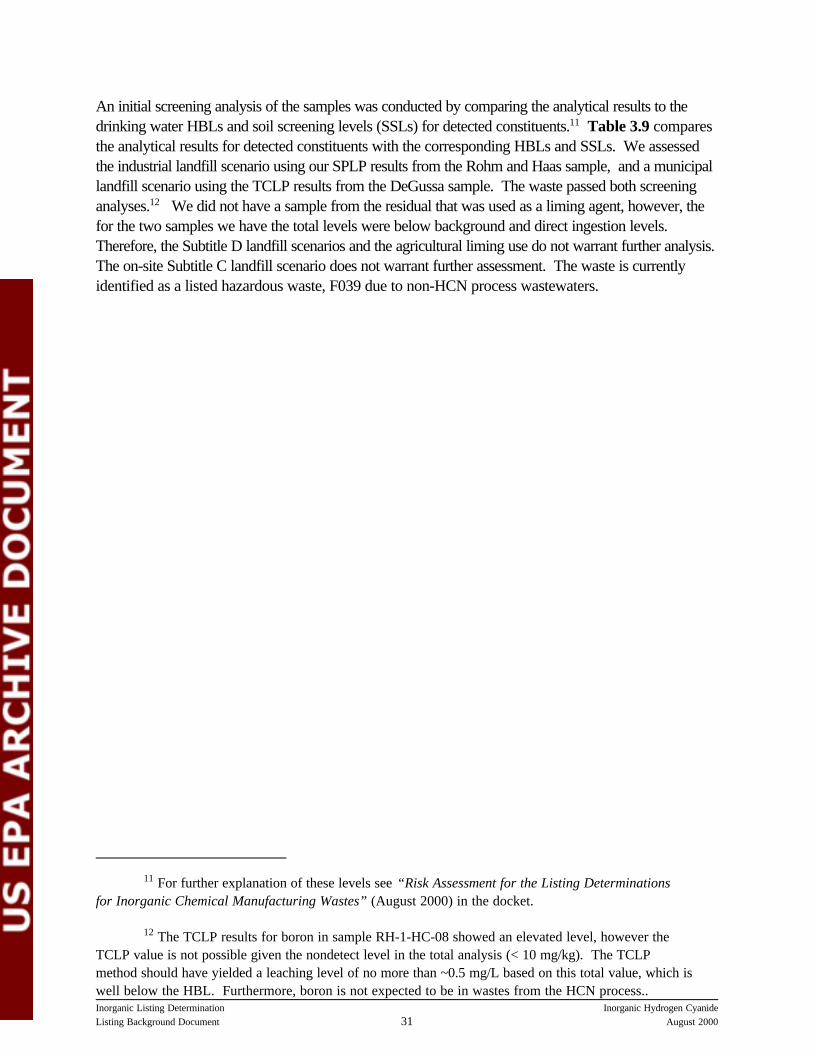
An initial screening analysis of the samples was conducted by comparing the analytical results to thedrinking water HBLs and soil screening levels (SSLs) for detected constituents.11 Table 3.9 comparesthe analytical results for detected constituents with the corresponding HBLs and SSLs. We assessedthe industrial landfill scenario using our SPLP results from the Rohm and Haas sample, and a municipallandfill scenario using the TCLP results from the DeGussa sample. The waste passed both screeninganalyses.12 We did not have a sample from the residual that was used as a liming agent, however, thefor the two samples we have the total levels were below background and direct ingestion levels. Therefore, the Subtitle D landfill scenarios and the agricultural liming use do not warrant further analysis. The on-site Subtitle C landfill scenario does not warrant further assessment. The waste is currentlyidentified as a listed hazardous waste, F039 due to non-HCN process wastewaters.
Inorganic Listing Determination Inorganic Hydrogen CyanideListing Background Document August 200032
Table 3.9 Waste Characterization for Biological Wastewater Treatment Solids
EPA Sample Number RH-1-HC-08 DG-1-HC-02 HBL(mg/L)
SSL1
(mg/kg)Sample Description Wastewater treatment plant sludge Wastewater treatment bio sludge
Result Type Total (mg/kg) TCLP (mg/L) SPLP (mg/L) Total (mg/kg) TCLP (mg/L) SPLP (mg/L)
Target Analyte Result DQ Result DQ Result DQ Result DQ Result DQ Result DQ
Arsenic 0.58 <0.0020 UL <0.0020 U <0.5 U <0.5 U <0.005 U 0.00074 4.72
Barium 13.7 <2.0 U <2.0 U 5.7 <2 U 0.159 K 1.1 440
Beryllium 0.066 <0.0040 U <0.0040 U <0.2 U <0.02 U <0.002 U 0.031 0.6
Boron 1.1 0.17 K 0.030 B <10 U 11.8 <0.12 UJ 1.4 26
Chromium 24.7 <0.10 U <0.10 U 22.1 <0.05 U <0.005 U 23 37
Cobalt 3.3 0.0055 <0.0047 U <0.5 U <0.05 U <0.005 U 0.94 6.7
Copper 154 <1.3 U <1.3 U 5.6 <0.25 U 0.112 1.3 NA
Iron 1090 K 3.2 L 0.67 3290 <1 U <0.05 U 5 430,0002
Lead 10.9 <0.015 U <0.015 U 1.2 <0.5 U <0.005 U 0.015 4002
Nickel 30.8 0.10 <0.10 U 9.0 <0.2 U 0.0801 0.31 1,6002
Selenium 13.5 <0.050 U <0.050 U <0.5 U <0.5 U <0.005 U 0.078 4002
Silver <0.47 U <0.0049 U <0.0049 U 0.2 <0.1 U <0.001 U 0.078 0.1
Titanium 6.6 <0.0050 U <0.0050 U 50.1 <0.05 U <0.005 U
Vanadium 3.0 <0.0050 U <0.0050 U 0.8 <0.05 U <0.005 U 0.14 58
Zinc 33.1 0.16 <0.020 U 78.1 <3 U <0.1 U 4.7 48
Amenable CN N/A N/A N/A <0.5 U N/A N/A 0.3 1,6002
Total CN 2.9 N/A3 0.0243 L <0.5 U <10 U <10 U
Acetone N/A 0.6 L N/A 0.240 J 0.038 B 0.014 J 1.6 8,1002
1 Soil screening levels (SSLs) are based on soil background, except where ingestion levels are otherwise noted; in all cases the ingestion levels are above thebackground levels. See “Risk Assessment for the Listing Determinations for Inorganic Chemical Manufacturing Wastes (August 2000) in the docket fordetails. 2 Soil ingestion HBL.3 TCLP/SPLP extraction was conducted using deionized water at 20:1 ratio (deionized water sample); results reported as SPLP leachate.U - Not detected.K - Analyte present, reported value may be biased high, actual value is expected to be lower.B - Detected at greater than the reporting limit but not substantially above the level reported in lab or field blanks.L - Analyte present, reported value may be biased low, actual value is expected to be higher.J - Analyte present, reported value may not be accurate or precise.

Inorganic Listing Determination Inorganic Hydrogen CyanideListing Background Document August 200033
3.2.4 Feed Gas Cartridge and Spent Carbon Filters
Waste Generation
Natural gas and ammonia feedstocks are typically filtered prior to entering the reactor. The filter mediaare typically made of cotton, polypropylene, or a blend wrapped around a stainless steel core.
Waste Management
These filters are disposed at Subtitle C or Subtitle D landfills or returned to the manufacturer forrefurbishment and reused. Table 3.10 presents a summary of the management practices used by thefacilities for this waste.
Table 3.10 Waste Management Summary for Feed Gas Cartridge and Spent Carbon Filters
Facility Waste (RIN #) Final Management Volume (MT/yr)
Cyanco Liquid anhydrous ammonia filters(RIN 1)
Off-site industrial Subtitle D landfill 0.004
Natural gas filter (RIN 2) 0
Mixed gas filtrate (RIN 4) 0.05
Degussa-Huls Ammonia filters (RIN 2) Off-site industrial Subtitle D landfill 0.09
Dow Ammonia filters (RIN 3) Returned to manufacturer,refurbished and reused
0.023 (1999)
Methane filters (RIN 4) 0.02 (1999)
DuPontMemphis
Natural gas feed filters (RIN 10) Off-site municipal Subtitle D landfill 0.2
Ammonia feed filters (RIN 11) 0.2
DuPont Victoria Natural gas sock filters (RIN 8) On-site Subtitle C landfill 0.09
Natural gas carbon bed (RIN 9) 1.90
FMC* Gas mixer inlet filters (RIN 1) On-site industrial Subtitle D landfill 0.04
Gas mixer outlet filter (RIN 2) 0.28
Rohm andHaas**
Feed gas filters (RIN 6) Off-site industrial Subtitle D landfill 6.8
Total 9.697
* Combined natural gas, process air and ammonia filter.** Volume derived based on E-mail message from J. McTague (Dynamac) to Max Diaz (EPA), April 3, 2000. The feedgas filters (RIN 6) and Process air filters (RIN 5) volumes were originally included in the Ammonia recycle filters (RIN8) volume of 35 MT/yr; the RIN 5 and RIN 6 volumes were assumed to each be half of the difference between 35MT/yr and the revised RIN 8 volume of 21.5 MT/yr.Note: Novartis and DuPont Sabine River reported generating this waste in their written follow-up response. However, they did not provide the volume generated or management information.
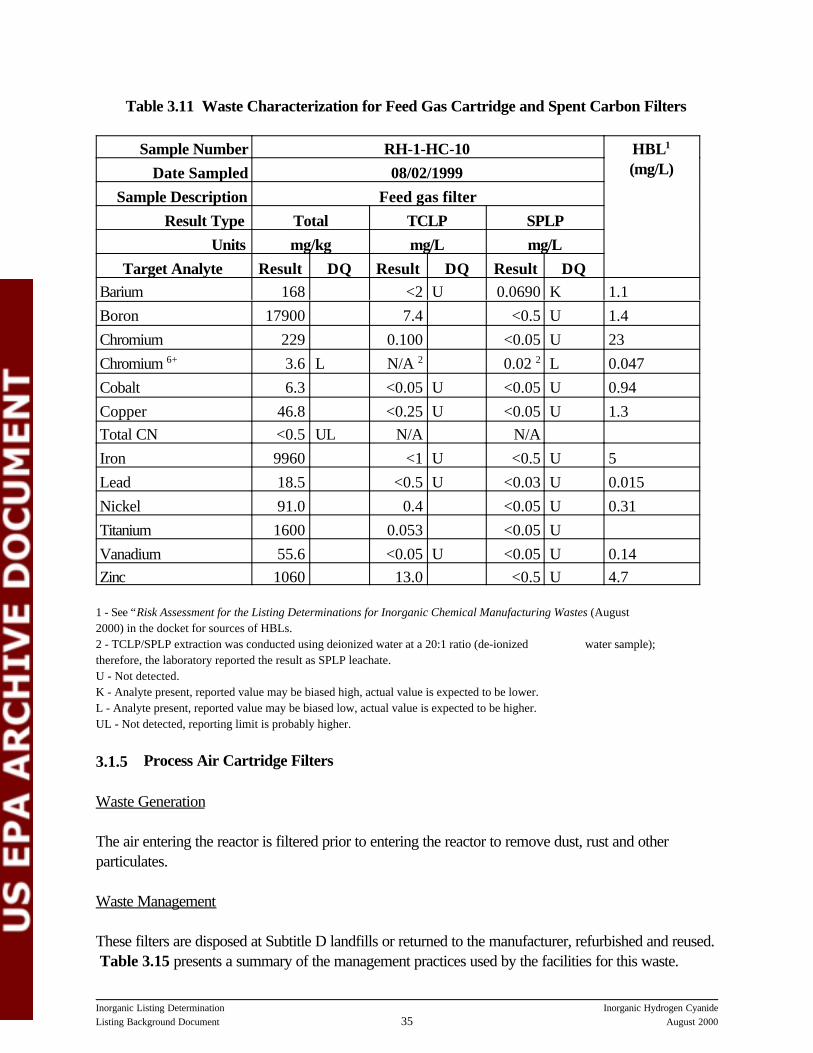
Waste Characterization
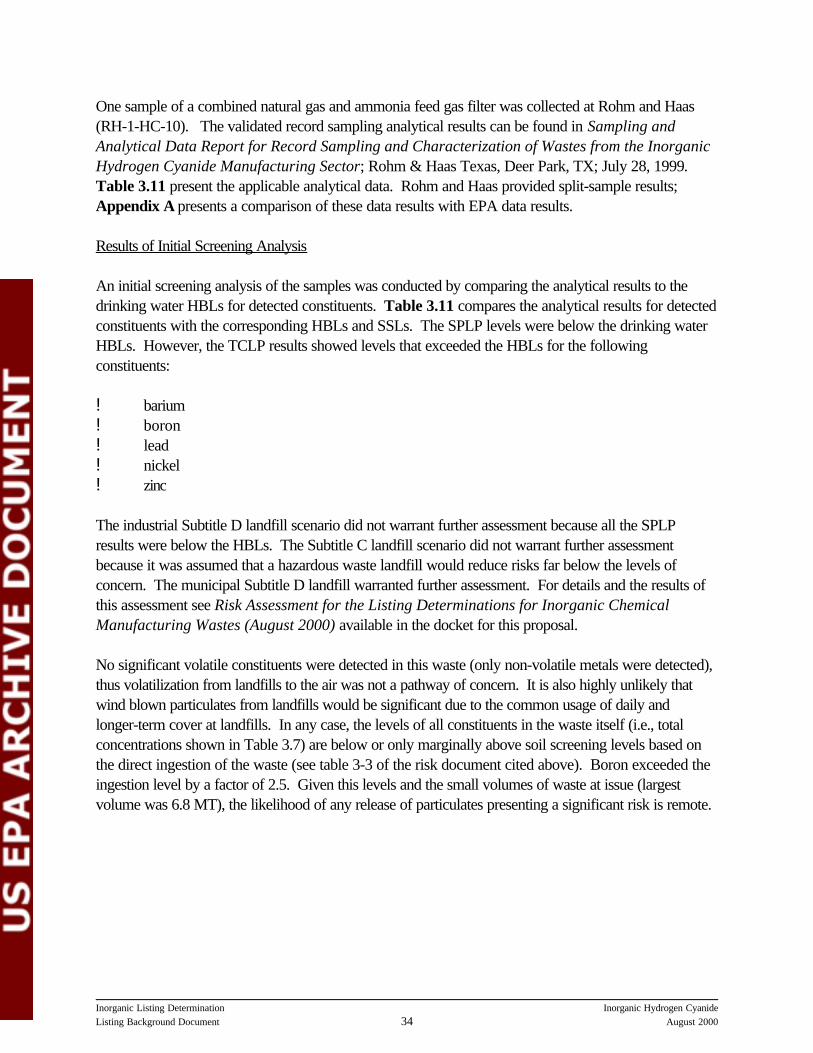
Inorganic Listing Determination Inorganic Hydrogen CyanideListing Background Document August 200034
One sample of a combined natural gas and ammonia feed gas filter was collected at Rohm and Haas(RH-1-HC-10). The validated record sampling analytical results can be found in Sampling andAnalytical Data Report for Record Sampling and Characterization of Wastes from the InorganicHydrogen Cyanide Manufacturing Sector; Rohm & Haas Texas, Deer Park, TX; July 28, 1999. Table 3.11 present the applicable analytical data. Rohm and Haas provided split-sample results;Appendix A presents a comparison of these data results with EPA data results.
Results of Initial Screening Analysis
An initial screening analysis of the samples was conducted by comparing the analytical results to thedrinking water HBLs for detected constituents. Table 3.11 compares the analytical results for detectedconstituents with the corresponding HBLs and SSLs. The SPLP levels were below the drinking waterHBLs. However, the TCLP results showed levels that exceeded the HBLs for the followingconstituents:
! barium! boron! lead! nickel! zinc
The industrial Subtitle D landfill scenario did not warrant further assessment because all the SPLPresults were below the HBLs. The Subtitle C landfill scenario did not warrant further assessmentbecause it was assumed that a hazardous waste landfill would reduce risks far below the levels ofconcern. The municipal Subtitle D landfill warranted further assessment. For details and the results ofthis assessment see Risk Assessment for the Listing Determinations for Inorganic ChemicalManufacturing Wastes (August 2000) available in the docket for this proposal.
No significant volatile constituents were detected in this waste (only non-volatile metals were detected),thus volatilization from landfills to the air was not a pathway of concern. It is also highly unlikely thatwind blown particulates from landfills would be significant due to the common usage of daily andlonger-term cover at landfills. In any case, the levels of all constituents in the waste itself (i.e., totalconcentrations shown in Table 3.7) are below or only marginally above soil screening levels based onthe direct ingestion of the waste (see table 3-3 of the risk document cited above). Boron exceeded theingestion level by a factor of 2.5. Given this levels and the small volumes of waste at issue (largestvolume was 6.8 MT), the likelihood of any release of particulates presenting a significant risk is remote.
Inorganic Listing Determination Inorganic Hydrogen CyanideListing Background Document August 200035
Table 3.11 Waste Characterization for Feed Gas Cartridge and Spent Carbon Filters
Sample Number RH-1-HC-10 HBL1
(mg/L)Date Sampled 08/02/1999Sample Description Feed gas filter
Result Type Total TCLP SPLPUnits mg/kg mg/L mg/L
Target Analyte Result DQ Result DQ Result DQBarium 168 <2 U 0.0690 K 1.1Boron 17900 7.4 <0.5 U 1.4Chromium 229 0.100 <0.05 U 23Chromium 6+ 3.6 L N/A 2 0.02 2 L 0.047Cobalt 6.3 <0.05 U <0.05 U 0.94Copper 46.8 <0.25 U <0.05 U 1.3Total CN <0.5 UL N/A N/AIron 9960 <1 U <0.5 U 5Lead 18.5 <0.5 U <0.03 U 0.015Nickel 91.0 0.4 <0.05 U 0.31Titanium 1600 0.053 <0.05 UVanadium 55.6 <0.05 U <0.05 U 0.14Zinc 1060 13.0 <0.5 U 4.7
1 - See “Risk Assessment for the Listing Determinations for Inorganic Chemical Manufacturing Wastes (August2000) in the docket for sources of HBLs.2 - TCLP/SPLP extraction was conducted using deionized water at a 20:1 ratio (de-ionized water sample);therefore, the laboratory reported the result as SPLP leachate.U - Not detected.K - Analyte present, reported value may be biased high, actual value is expected to be lower.L - Analyte present, reported value may be biased low, actual value is expected to be higher.UL - Not detected, reporting limit is probably higher.
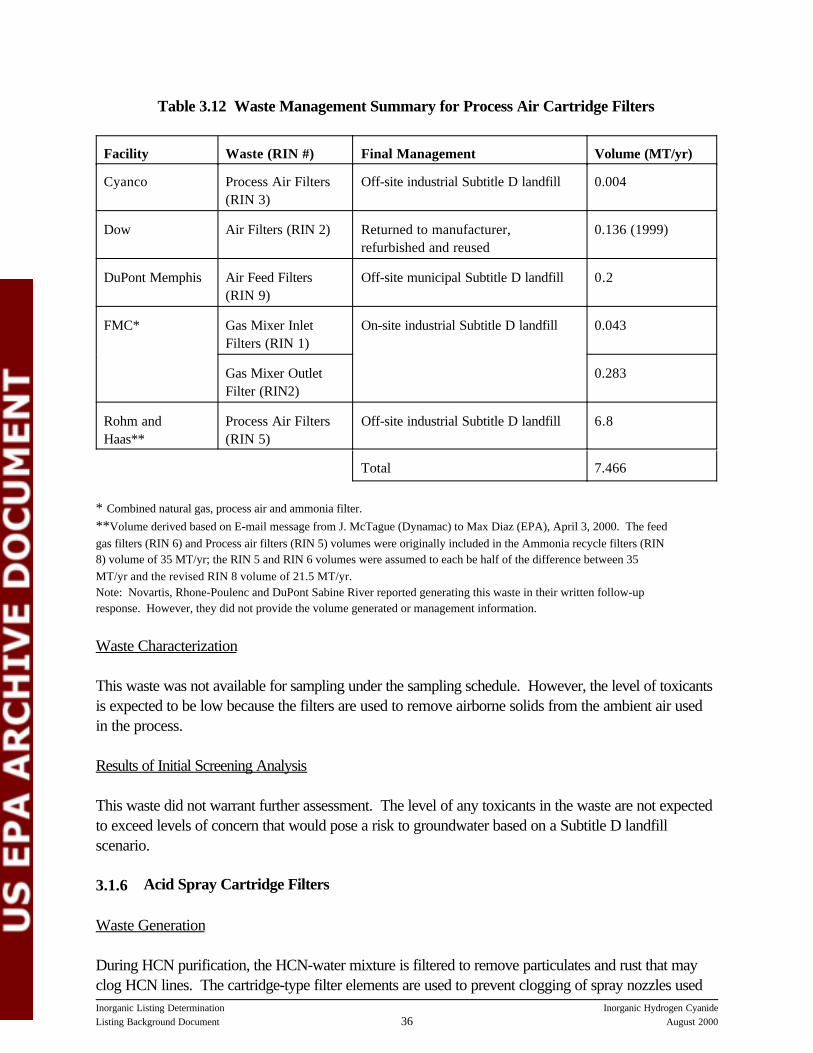
3.1.5 Process Air Cartridge Filters
Waste Generation
The air entering the reactor is filtered prior to entering the reactor to remove dust, rust and otherparticulates.
Waste Management
These filters are disposed at Subtitle D landfills or returned to the manufacturer, refurbished and reused. Table 3.15 presents a summary of the management practices used by the facilities for this waste.
Inorganic Listing Determination Inorganic Hydrogen CyanideListing Background Document August 200036
Table 3.12 Waste Management Summary for Process Air Cartridge Filters
Facility Waste (RIN #) Final Management Volume (MT/yr)
Cyanco Process Air Filters(RIN 3)
Off-site industrial Subtitle D landfill 0.004
Dow Air Filters (RIN 2) Returned to manufacturer,refurbished and reused
0.136 (1999)
DuPont Memphis Air Feed Filters(RIN 9)
Off-site municipal Subtitle D landfill 0.2
FMC* Gas Mixer InletFilters (RIN 1)
On-site industrial Subtitle D landfill 0.043
Gas Mixer OutletFilter (RIN2)
0.283
Rohm andHaas**
Process Air Filters(RIN 5)
Off-site industrial Subtitle D landfill 6.8
Total 7.466
* Combined natural gas, process air and ammonia filter.**Volume derived based on E-mail message from J. McTague (Dynamac) to Max Diaz (EPA), April 3, 2000. The feedgas filters (RIN 6) and Process air filters (RIN 5) volumes were originally included in the Ammonia recycle filters (RIN8) volume of 35 MT/yr; the RIN 5 and RIN 6 volumes were assumed to each be half of the difference between 35MT/yr and the revised RIN 8 volume of 21.5 MT/yr.Note: Novartis, Rhone-Poulenc and DuPont Sabine River reported generating this waste in their written follow-upresponse. However, they did not provide the volume generated or management information.
Waste Characterization
This waste was not available for sampling under the sampling schedule. However, the level of toxicantsis expected to be low because the filters are used to remove airborne solids from the ambient air usedin the process.
Results of Initial Screening Analysis
This waste did not warrant further assessment. The level of any toxicants in the waste are not expectedto exceed levels of concern that would pose a risk to groundwater based on a Subtitle D landfillscenario.
3.1.6 Acid Spray Cartridge Filters
Waste Generation
During HCN purification, the HCN-water mixture is filtered to remove particulates and rust that mayclog HCN lines. The cartridge-type filter elements are used to prevent clogging of spray nozzles used
Inorganic Listing Determination Inorganic Hydrogen CyanideListing Background Document August 200037
to inject HCN intermediate product into the HCN stripper.
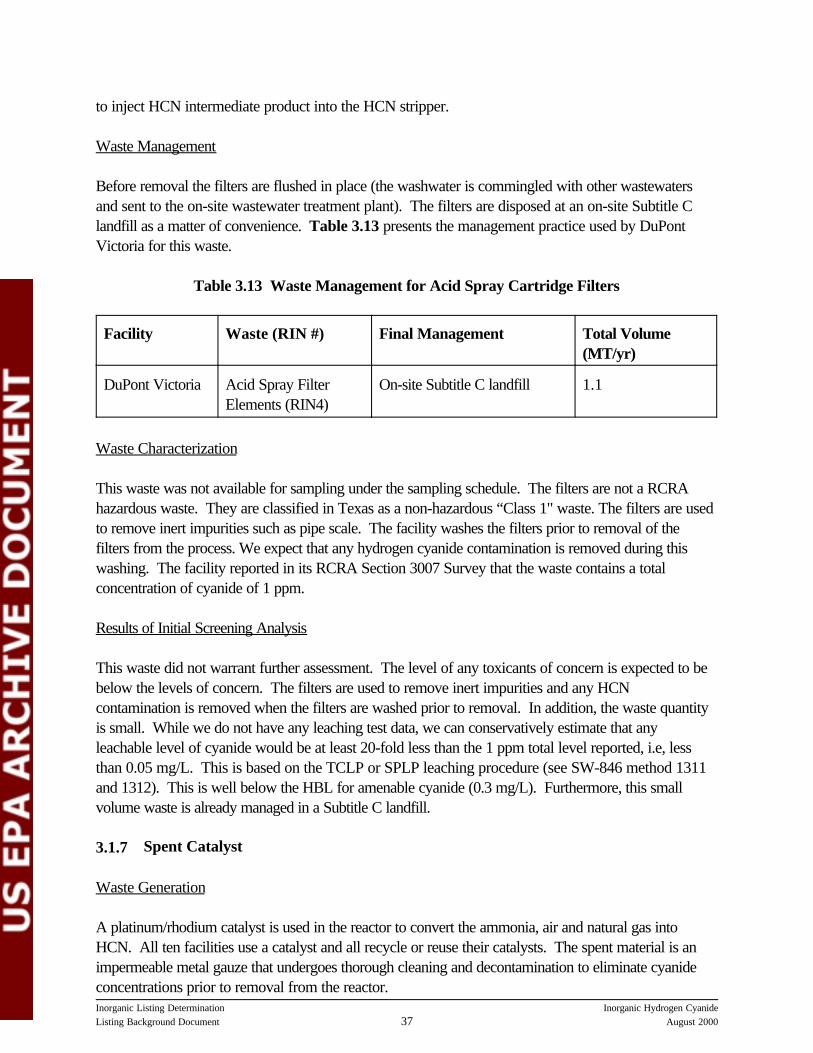
Waste Management
Before removal the filters are flushed in place (the washwater is commingled with other wastewatersand sent to the on-site wastewater treatment plant). The filters are disposed at an on-site Subtitle Clandfill as a matter of convenience. Table 3.13 presents the management practice used by DuPontVictoria for this waste.
Table 3.13 Waste Management for Acid Spray Cartridge Filters
Facility Waste (RIN #) Final Management Total Volume(MT/yr)
DuPont Victoria Acid Spray FilterElements (RIN4)
On-site Subtitle C landfill 1.1
Waste Characterization
This waste was not available for sampling under the sampling schedule. The filters are not a RCRAhazardous waste. They are classified in Texas as a non-hazardous “Class 1" waste. The filters are usedto remove inert impurities such as pipe scale. The facility washes the filters prior to removal of thefilters from the process. We expect that any hydrogen cyanide contamination is removed during thiswashing. The facility reported in its RCRA Section 3007 Survey that the waste contains a totalconcentration of cyanide of 1 ppm.
Results of Initial Screening Analysis
This waste did not warrant further assessment. The level of any toxicants of concern is expected to bebelow the levels of concern. The filters are used to remove inert impurities and any HCNcontamination is removed when the filters are washed prior to removal. In addition, the waste quantityis small. While we do not have any leaching test data, we can conservatively estimate that anyleachable level of cyanide would be at least 20-fold less than the 1 ppm total level reported, i.e, lessthan 0.05 mg/L. This is based on the TCLP or SPLP leaching procedure (see SW-846 method 1311and 1312). This is well below the HBL for amenable cyanide (0.3 mg/L). Furthermore, this smallvolume waste is already managed in a Subtitle C landfill.
3.1.7 Spent Catalyst
Waste Generation
A platinum/rhodium catalyst is used in the reactor to convert the ammonia, air and natural gas intoHCN. All ten facilities use a catalyst and all recycle or reuse their catalysts. The spent material is animpermeable metal gauze that undergoes thorough cleaning and decontamination to eliminate cyanideconcentrations prior to removal from the reactor.
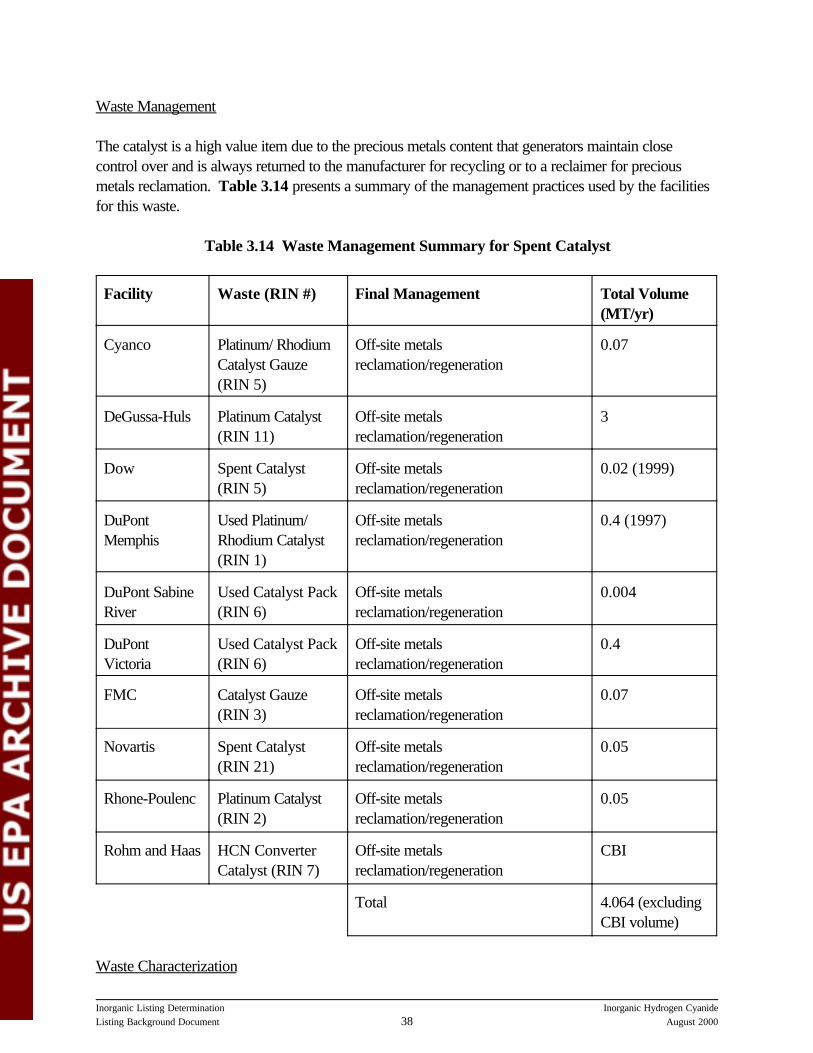
Inorganic Listing Determination Inorganic Hydrogen CyanideListing Background Document August 200038
Waste Management
The catalyst is a high value item due to the precious metals content that generators maintain closecontrol over and is always returned to the manufacturer for recycling or to a reclaimer for preciousmetals reclamation. Table 3.14 presents a summary of the management practices used by the facilitiesfor this waste.
Table 3.14 Waste Management Summary for Spent Catalyst
Facility Waste (RIN #) Final Management Total Volume(MT/yr)
Cyanco Platinum/ RhodiumCatalyst Gauze(RIN 5)
Off-site metalsreclamation/regeneration
0.07
DeGussa-Huls Platinum Catalyst(RIN 11)
Off-site metalsreclamation/regeneration
3
Dow Spent Catalyst(RIN 5)
Off-site metalsreclamation/regeneration
0.02 (1999)
DuPontMemphis
Used Platinum/Rhodium Catalyst(RIN 1)
Off-site metalsreclamation/regeneration
0.4 (1997)
DuPont SabineRiver
Used Catalyst Pack(RIN 6)
Off-site metalsreclamation/regeneration
0.004
DuPontVictoria
Used Catalyst Pack(RIN 6)
Off-site metalsreclamation/regeneration
0.4
FMC Catalyst Gauze(RIN 3)
Off-site metalsreclamation/regeneration
0.07
Novartis Spent Catalyst(RIN 21)
Off-site metalsreclamation/regeneration
0.05
Rhone-Poulenc Platinum Catalyst(RIN 2)
Off-site metalsreclamation/regeneration
0.05
Rohm and Haas HCN ConverterCatalyst (RIN 7)
Off-site metalsreclamation/regeneration
CBI
Total 4.064 (excludingCBI volume)
Waste Characterization
Inorganic Listing Determination Inorganic Hydrogen CyanideListing Background Document August 200039
The catalyst used at all the facilities is composed of various concentrations of platinum and rhodium.
Results of Initial Screening Analysis
This waste did not warrant further assessment. Generators clean and decontaminate the catalyst priorto removal. The catalyst is maintained in containers with limited potential for significant releases prior tobeing shipped off-site for precious metals recovery.
3.1.8 Ammonium Sulfate and Ammonium Phosphate
Waste Generation
An ammonia byproduct is generated at three facilities. Ammonium sulfate is generated by combiningthe reactor off-gases with sulfuric acid. Ammonium phosphate is generated by combining the reactoroff-gases with phosphoric acid.
Waste Management
All three facilities sell this byproduct as a fertilizer. Table 3.15 presents a summary of the managementpractices used by the facilities for this waste.
Table 3.15 Waste Management Summary for Ammonium Sulfate and Ammonium Phosphate
Facility Waste (RIN #) Final Management Total Volume (MT/yr)
DeGussa- Huls AMSUL (RIN 505) Sold as fertilizer 12,000
DuPont Victoria NR Sold as fertilizer NR
Rhone-Poulenc NR Sold as fertilizer 15,425
Total 27,425
NR - not reported
Waste Characterization
One record sample was collected at DeGussa-Huls (DG-1-HC-01). The validated record samplinganalytical results can be found in Sampling and Analytical Data Report for Record Sampling andCharacterization of Wastes from the Inorganic Hydrogen Cyanide Manufacturing Sector,DeGussa-Huls, February 25, 2000. Table 3.16 presents the applicable analytical data. DeGussahas provided split sample results; Appendix A presents a comparison of these data results to EPA’srecord sampling results
Results of Initial Screening Analysis

Inorganic Listing Determination Inorganic Hydrogen CyanideListing Background Document August 200040
Because the material is land applied it remains a solid waste under Subtitle C regulations and thusrequires assessment. An initial screening analysis of the samples was conducted by comparing theanalytical results to soil screening levels. Table 3.16 compares the analytical results for detectedconstituents with the soil screening levels. This initial screening showed that all detected constituents arebelow the soil screening levels. In addition, we compared the SPLP leaching results to the HBLs as ascreen of potential groundwater exposure. Note that the SPLP/HBL groundwater screen for thisscenario is likely to be a worst-case screening, because the fertilizer application scenario is notanalogous to a landfill scenario, particularly with respect to application rates. Therefore, this waste didnot warrant further assessment.
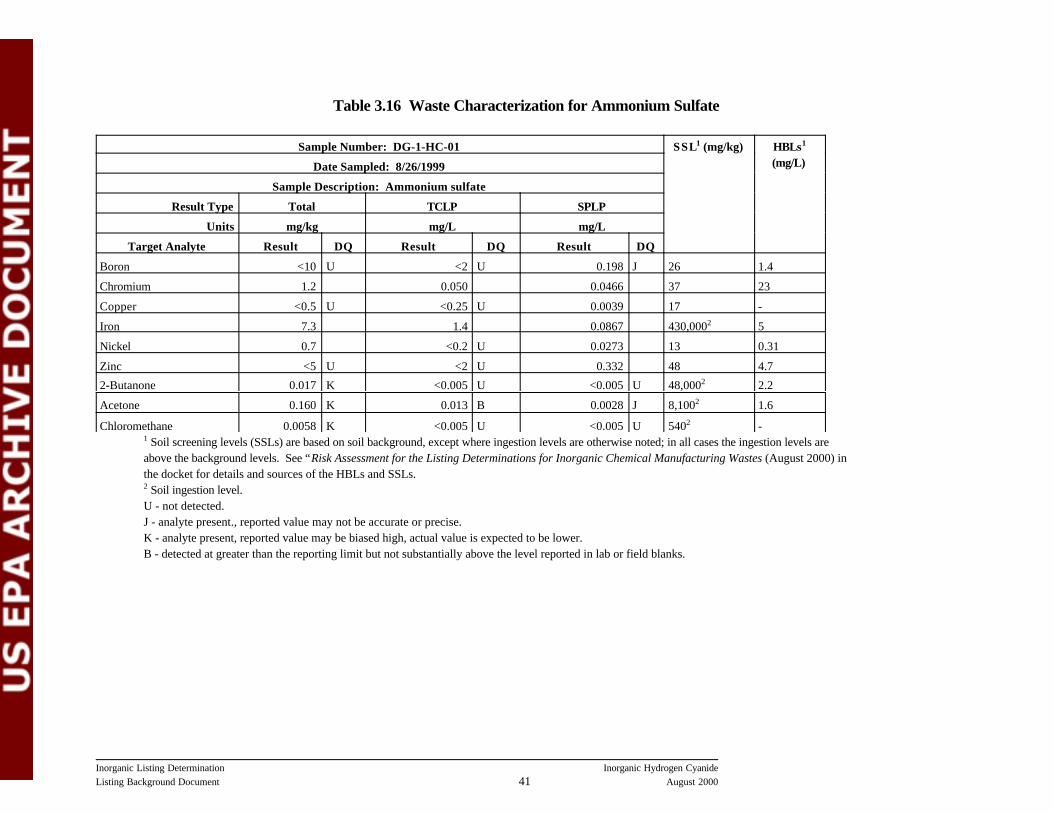
Inorganic Listing Determination Inorganic Hydrogen CyanideListing Background Document August 200041
Table 3.16 Waste Characterization for Ammonium Sulfate
Sample Number: DG-1-HC-01 SSL1 (mg/kg) HBLs1
(mg/L)Date Sampled: 8/26/1999
Sample Description: Ammonium sulfate
Result Type Total TCLP SPLP
Units mg/kg mg/L mg/L
Target Analyte Result DQ Result DQ Result DQ
Boron <10 U <2 U 0.198 J 26 1.4
Chromium 1.2 0.050 0.0466 37 23
Copper <0.5 U <0.25 U 0.0039 17 -
Iron 7.3 1.4 0.0867 430,0002 5
Nickel 0.7 <0.2 U 0.0273 13 0.31
Zinc <5 U <2 U 0.332 48 4.7
2-Butanone 0.017 K <0.005 U <0.005 U 48,0002 2.2
Acetone 0.160 K 0.013 B 0.0028 J 8,1002 1.6
Chloromethane 0.0058 K <0.005 U <0.005 U 5402 -1 Soil screening levels (SSLs) are based on soil background, except where ingestion levels are otherwise noted; in all cases the ingestion levels areabove the background levels. See “Risk Assessment for the Listing Determinations for Inorganic Chemical Manufacturing Wastes (August 2000) inthe docket for details and sources of the HBLs and SSLs.2 Soil ingestion level.U - not detected.J - analyte present., reported value may not be accurate or precise.K - analyte present, reported value may be biased high, actual value is expected to be lower.B - detected at greater than the reporting limit but not substantially above the level reported in lab or field blanks.
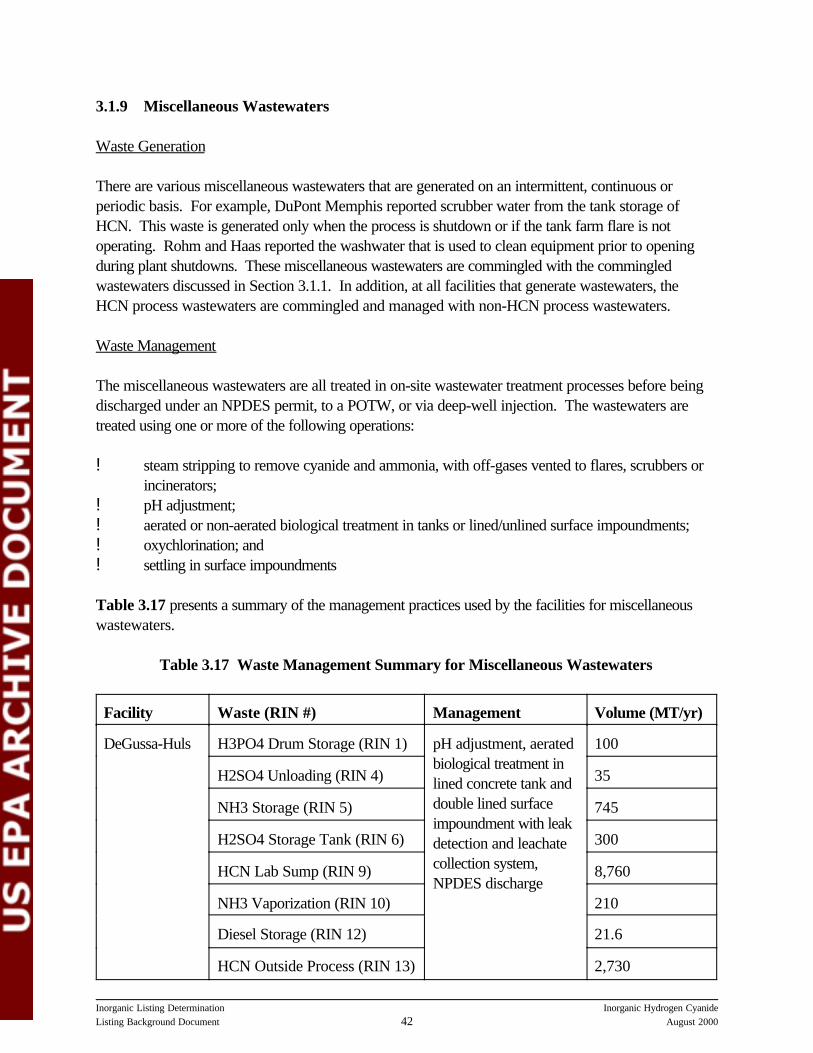
Inorganic Listing Determination Inorganic Hydrogen CyanideListing Background Document August 200042
3.1.9 Miscellaneous Wastewaters
Waste Generation
There are various miscellaneous wastewaters that are generated on an intermittent, continuous orperiodic basis. For example, DuPont Memphis reported scrubber water from the tank storage ofHCN. This waste is generated only when the process is shutdown or if the tank farm flare is notoperating. Rohm and Haas reported the washwater that is used to clean equipment prior to openingduring plant shutdowns. These miscellaneous wastewaters are commingled with the commingledwastewaters discussed in Section 3.1.1. In addition, at all facilities that generate wastewaters, theHCN process wastewaters are commingled and managed with non-HCN process wastewaters.
Waste Management
The miscellaneous wastewaters are all treated in on-site wastewater treatment processes before beingdischarged under an NPDES permit, to a POTW, or via deep-well injection. The wastewaters aretreated using one or more of the following operations:
! steam stripping to remove cyanide and ammonia, with off-gases vented to flares, scrubbers orincinerators;
! pH adjustment;! aerated or non-aerated biological treatment in tanks or lined/unlined surface impoundments;! oxychlorination; and! settling in surface impoundments
Table 3.17 presents a summary of the management practices used by the facilities for miscellaneouswastewaters.
Table 3.17 Waste Management Summary for Miscellaneous Wastewaters
Facility Waste (RIN #) Management Volume (MT/yr)
DeGussa-Huls H3PO4 Drum Storage (RIN 1) pH adjustment, aeratedbiological treatment inlined concrete tank anddouble lined surfaceimpoundment with leakdetection and leachatecollection system,NPDES discharge
100
H2SO4 Unloading (RIN 4) 35
NH3 Storage (RIN 5) 745
H2SO4 Storage Tank (RIN 6) 300
HCN Lab Sump (RIN 9) 8,760
NH3 Vaporization (RIN 10) 210
Diesel Storage (RIN 12) 21.6
HCN Outside Process (RIN 13) 2,730
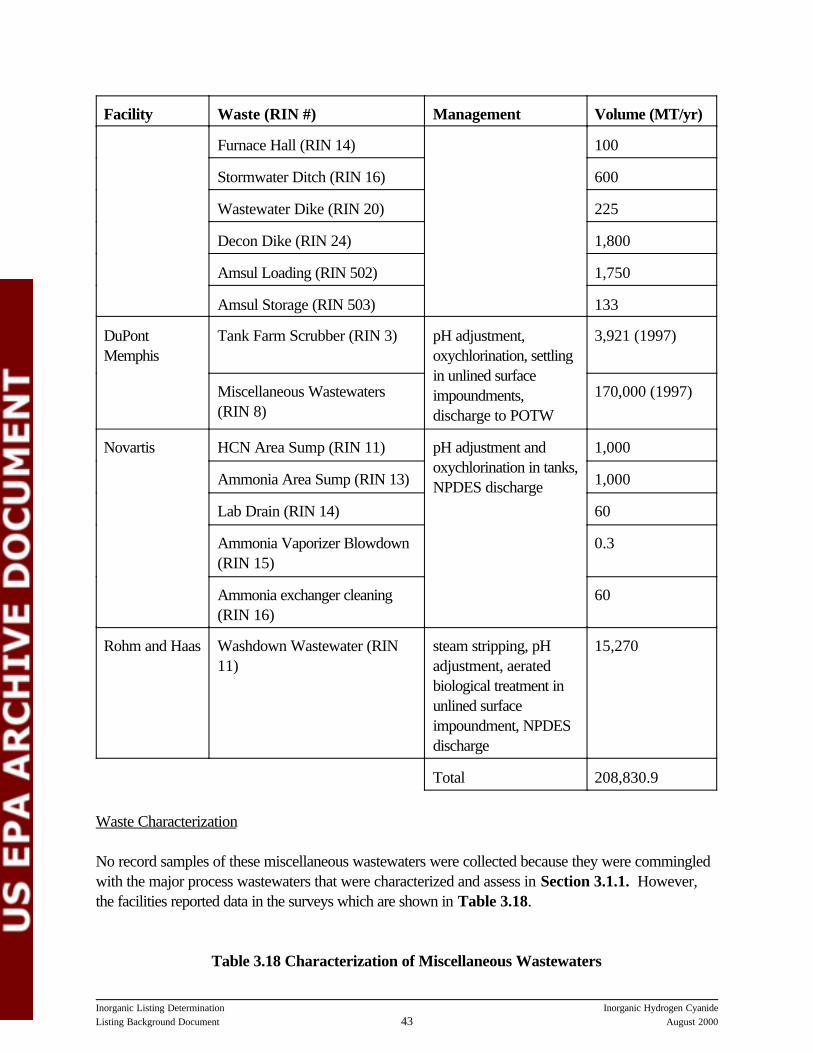
Facility Waste (RIN #) Management Volume (MT/yr)
Inorganic Listing Determination Inorganic Hydrogen CyanideListing Background Document August 200043
Furnace Hall (RIN 14) 100
Stormwater Ditch (RIN 16) 600
Wastewater Dike (RIN 20) 225
Decon Dike (RIN 24) 1,800
Amsul Loading (RIN 502) 1,750
Amsul Storage (RIN 503) 133
DuPontMemphis
Tank Farm Scrubber (RIN 3) pH adjustment,oxychlorination, settlingin unlined surfaceimpoundments,discharge to POTW
3,921 (1997)
Miscellaneous Wastewaters(RIN 8)
170,000 (1997)
Novartis HCN Area Sump (RIN 11) pH adjustment andoxychlorination in tanks,NPDES discharge
1,000
Ammonia Area Sump (RIN 13) 1,000
Lab Drain (RIN 14) 60
Ammonia Vaporizer Blowdown(RIN 15)
0.3
Ammonia exchanger cleaning(RIN 16)
60
Rohm and Haas Washdown Wastewater (RIN11)
steam stripping, pHadjustment, aeratedbiological treatment inunlined surfaceimpoundment, NPDESdischarge
15,270
Total 208,830.9
Waste Characterization
No record samples of these miscellaneous wastewaters were collected because they were commingledwith the major process wastewaters that were characterized and assess in Section 3.1.1. However,the facilities reported data in the surveys which are shown in Table 3.18.
Table 3.18 Characterization of Miscellaneous Wastewaters
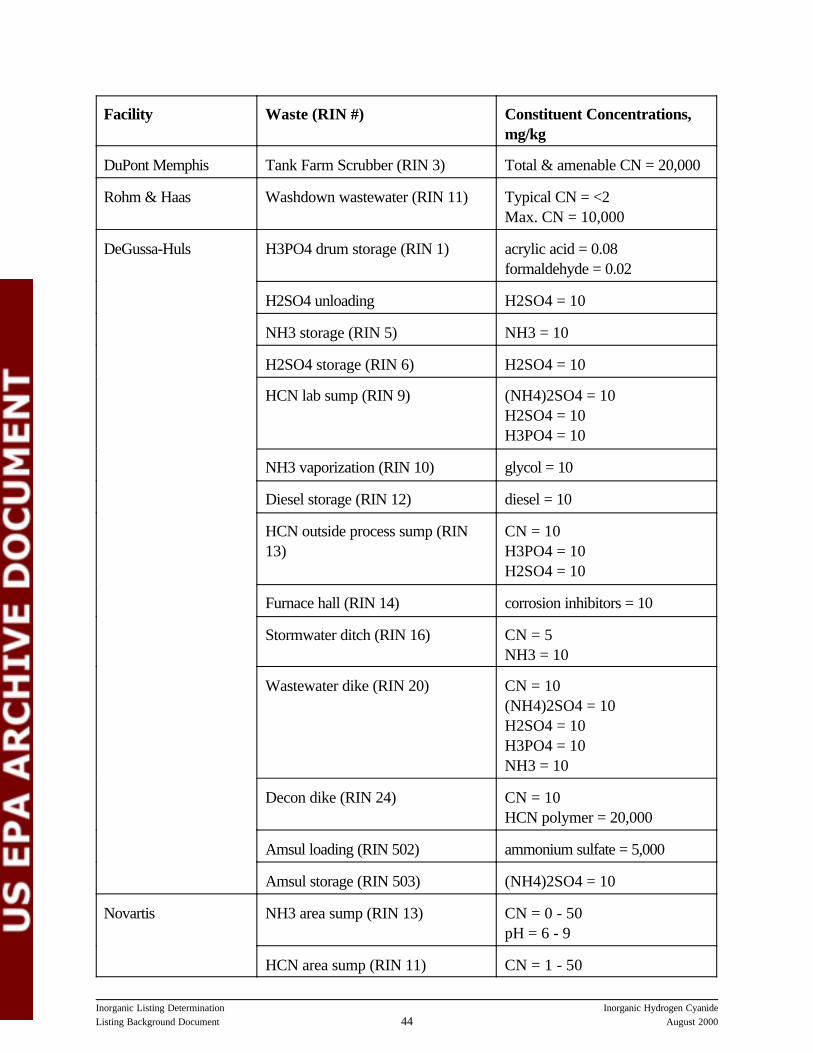
Inorganic Listing Determination Inorganic Hydrogen CyanideListing Background Document August 200044
Facility Waste (RIN #) Constituent Concentrations,mg/kg
DuPont Memphis Tank Farm Scrubber (RIN 3) Total & amenable CN = 20,000
Rohm & Haas Washdown wastewater (RIN 11) Typical CN = <2Max. CN = 10,000
DeGussa-Huls H3PO4 drum storage (RIN 1) acrylic acid = 0.08formaldehyde = 0.02
H2SO4 unloading H2SO4 = 10
NH3 storage (RIN 5) NH3 = 10
H2SO4 storage (RIN 6) H2SO4 = 10
HCN lab sump (RIN 9) (NH4)2SO4 = 10H2SO4 = 10H3PO4 = 10
NH3 vaporization (RIN 10) glycol = 10
Diesel storage (RIN 12) diesel = 10
HCN outside process sump (RIN13)
CN = 10H3PO4 = 10H2SO4 = 10
Furnace hall (RIN 14) corrosion inhibitors = 10
Stormwater ditch (RIN 16) CN = 5NH3 = 10
Wastewater dike (RIN 20) CN = 10(NH4)2SO4 = 10H2SO4 = 10H3PO4 = 10NH3 = 10
Decon dike (RIN 24) CN = 10HCN polymer = 20,000
Amsul loading (RIN 502) ammonium sulfate = 5,000
Amsul storage (RIN 503) (NH4)2SO4 = 10
Novartis NH3 area sump (RIN 13) CN = 0 - 50pH = 6 - 9
HCN area sump (RIN 11) CN = 1 - 50
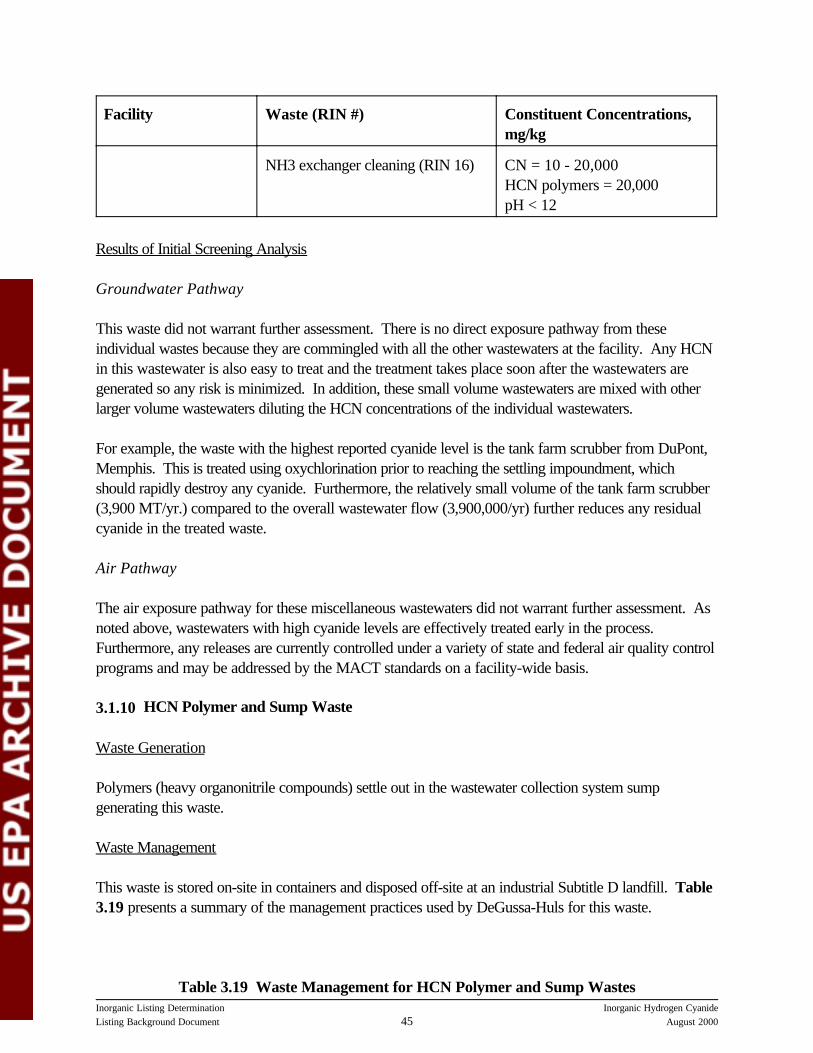
Facility Waste (RIN #) Constituent Concentrations,mg/kg
Inorganic Listing Determination Inorganic Hydrogen CyanideListing Background Document August 200045
NH3 exchanger cleaning (RIN 16) CN = 10 - 20,000HCN polymers = 20,000pH < 12
Results of Initial Screening Analysis
Groundwater Pathway
This waste did not warrant further assessment. There is no direct exposure pathway from theseindividual wastes because they are commingled with all the other wastewaters at the facility. Any HCNin this wastewater is also easy to treat and the treatment takes place soon after the wastewaters aregenerated so any risk is minimized. In addition, these small volume wastewaters are mixed with otherlarger volume wastewaters diluting the HCN concentrations of the individual wastewaters.
For example, the waste with the highest reported cyanide level is the tank farm scrubber from DuPont,Memphis. This is treated using oxychlorination prior to reaching the settling impoundment, whichshould rapidly destroy any cyanide. Furthermore, the relatively small volume of the tank farm scrubber(3,900 MT/yr.) compared to the overall wastewater flow (3,900,000/yr) further reduces any residualcyanide in the treated waste.
Air Pathway
The air exposure pathway for these miscellaneous wastewaters did not warrant further assessment. Asnoted above, wastewaters with high cyanide levels are effectively treated early in the process. Furthermore, any releases are currently controlled under a variety of state and federal air quality controlprograms and may be addressed by the MACT standards on a facility-wide basis.
3.1.10 HCN Polymer and Sump Waste
Waste Generation
Polymers (heavy organonitrile compounds) settle out in the wastewater collection system sumpgenerating this waste.
Waste Management
This waste is stored on-site in containers and disposed off-site at an industrial Subtitle D landfill. Table3.19 presents a summary of the management practices used by DeGussa-Huls for this waste.
Table 3.19 Waste Management for HCN Polymer and Sump Wastes
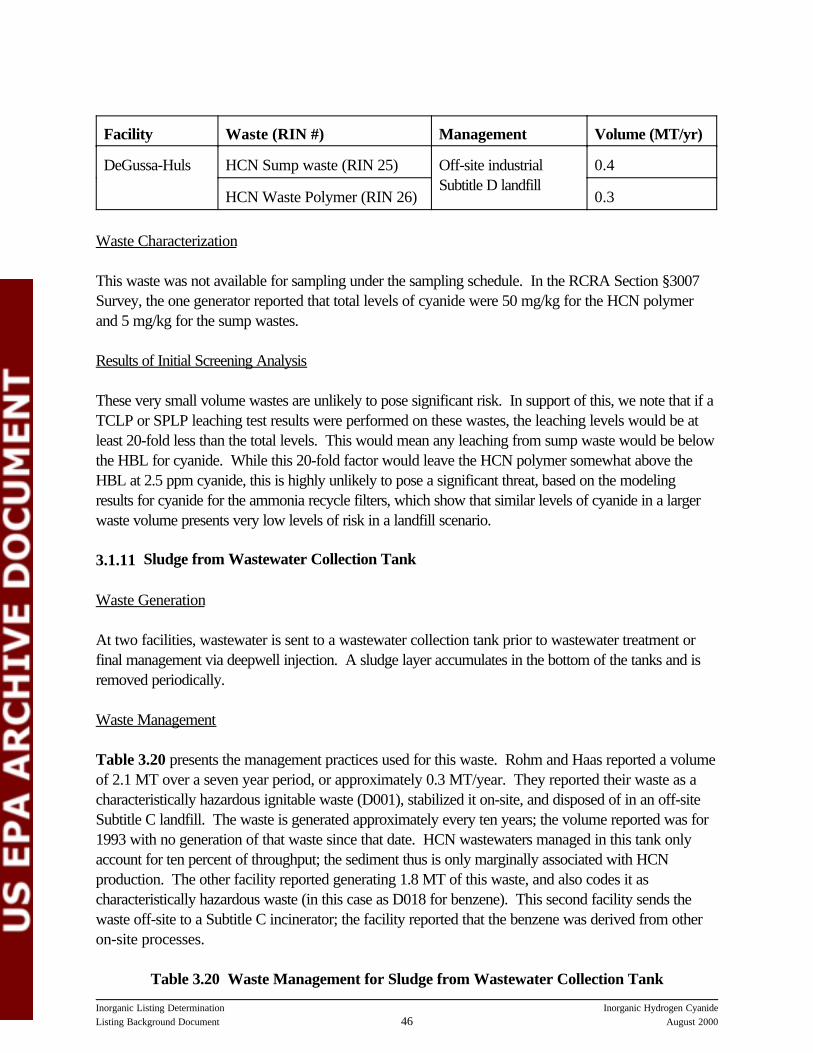
Inorganic Listing Determination Inorganic Hydrogen CyanideListing Background Document August 200046
Facility Waste (RIN #) Management Volume (MT/yr)
DeGussa-Huls HCN Sump waste (RIN 25) Off-site industrialSubtitle D landfill
0.4
HCN Waste Polymer (RIN 26) 0.3
Waste Characterization
This waste was not available for sampling under the sampling schedule. In the RCRA Section §3007Survey, the one generator reported that total levels of cyanide were 50 mg/kg for the HCN polymerand 5 mg/kg for the sump wastes.
Results of Initial Screening Analysis
These very small volume wastes are unlikely to pose significant risk. In support of this, we note that if aTCLP or SPLP leaching test results were performed on these wastes, the leaching levels would be atleast 20-fold less than the total levels. This would mean any leaching from sump waste would be belowthe HBL for cyanide. While this 20-fold factor would leave the HCN polymer somewhat above theHBL at 2.5 ppm cyanide, this is highly unlikely to pose a significant threat, based on the modelingresults for cyanide for the ammonia recycle filters, which show that similar levels of cyanide in a largerwaste volume presents very low levels of risk in a landfill scenario.
3.1.11 Sludge from Wastewater Collection Tank
Waste Generation
At two facilities, wastewater is sent to a wastewater collection tank prior to wastewater treatment orfinal management via deepwell injection. A sludge layer accumulates in the bottom of the tanks and isremoved periodically.
Waste Management
Table 3.20 presents the management practices used for this waste. Rohm and Haas reported a volumeof 2.1 MT over a seven year period, or approximately 0.3 MT/year. They reported their waste as acharacteristically hazardous ignitable waste (D001), stabilized it on-site, and disposed of in an off-siteSubtitle C landfill. The waste is generated approximately every ten years; the volume reported was for1993 with no generation of that waste since that date. HCN wastewaters managed in this tank onlyaccount for ten percent of throughput; the sediment thus is only marginally associated with HCNproduction. The other facility reported generating 1.8 MT of this waste, and also codes it ascharacteristically hazardous waste (in this case as D018 for benzene). This second facility sends thewaste off-site to a Subtitle C incinerator; the facility reported that the benzene was derived from otheron-site processes.
Table 3.20 Waste Management for Sludge from Wastewater Collection Tank
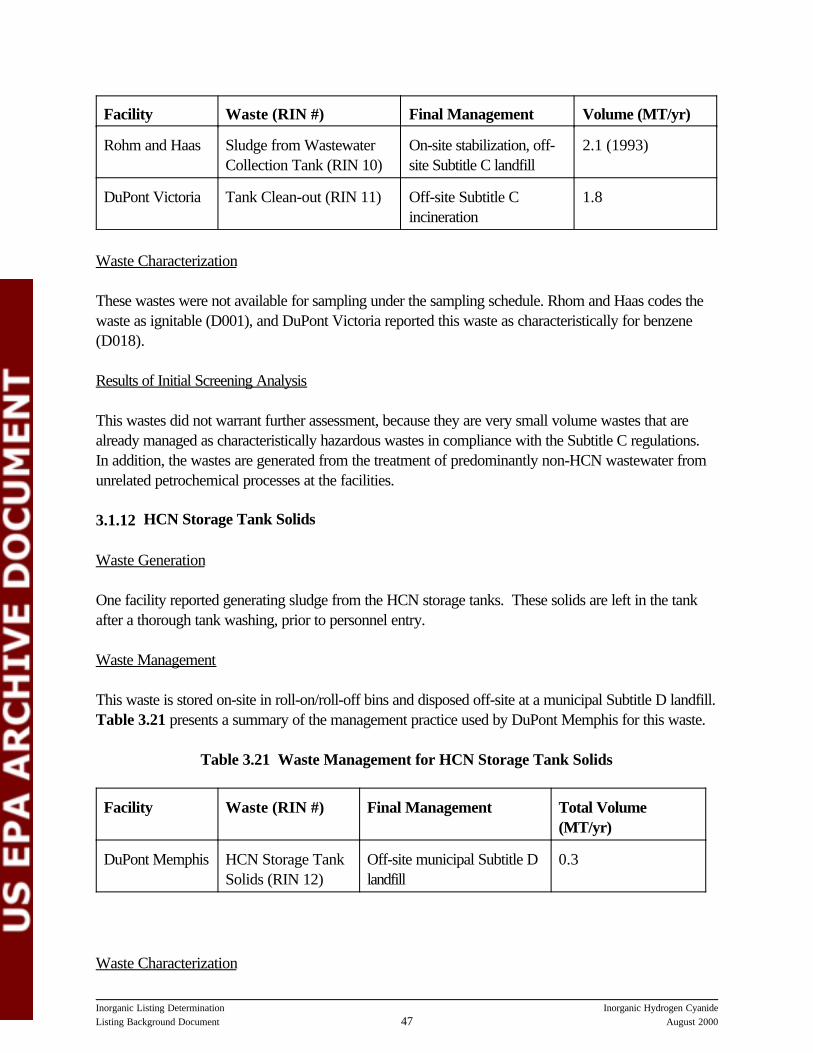
Inorganic Listing Determination Inorganic Hydrogen CyanideListing Background Document August 200047
Facility Waste (RIN #) Final Management Volume (MT/yr)
Rohm and Haas Sludge from WastewaterCollection Tank (RIN 10)
On-site stabilization, off-site Subtitle C landfill
2.1 (1993)
DuPont Victoria Tank Clean-out (RIN 11) Off-site Subtitle Cincineration
1.8
Waste Characterization
These wastes were not available for sampling under the sampling schedule. Rhom and Haas codes thewaste as ignitable (D001), and DuPont Victoria reported this waste as characteristically for benzene(D018).
Results of Initial Screening Analysis
This wastes did not warrant further assessment, because they are very small volume wastes that arealready managed as characteristically hazardous wastes in compliance with the Subtitle C regulations. In addition, the wastes are generated from the treatment of predominantly non-HCN wastewater fromunrelated petrochemical processes at the facilities.
3.1.12 HCN Storage Tank Solids
Waste Generation
One facility reported generating sludge from the HCN storage tanks. These solids are left in the tankafter a thorough tank washing, prior to personnel entry.
Waste Management
This waste is stored on-site in roll-on/roll-off bins and disposed off-site at a municipal Subtitle D landfill. Table 3.21 presents a summary of the management practice used by DuPont Memphis for this waste.
Table 3.21 Waste Management for HCN Storage Tank Solids
Facility Waste (RIN #) Final Management Total Volume(MT/yr)
DuPont Memphis HCN Storage TankSolids (RIN 12)
Off-site municipal Subtitle Dlandfill
0.3
Waste Characterization
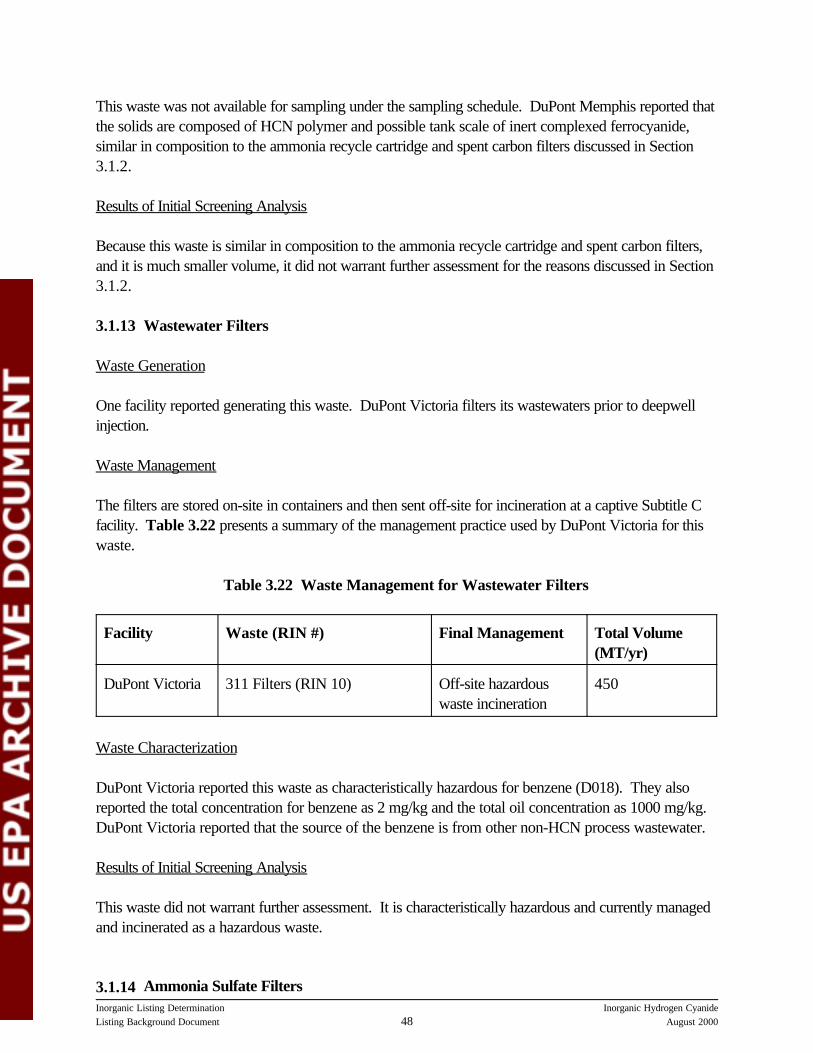
Inorganic Listing Determination Inorganic Hydrogen CyanideListing Background Document August 200048
This waste was not available for sampling under the sampling schedule. DuPont Memphis reported thatthe solids are composed of HCN polymer and possible tank scale of inert complexed ferrocyanide,similar in composition to the ammonia recycle cartridge and spent carbon filters discussed in Section3.1.2.
Results of Initial Screening Analysis
Because this waste is similar in composition to the ammonia recycle cartridge and spent carbon filters,and it is much smaller volume, it did not warrant further assessment for the reasons discussed in Section3.1.2.
3.1.13 Wastewater Filters
Waste Generation
One facility reported generating this waste. DuPont Victoria filters its wastewaters prior to deepwellinjection.
Waste Management
The filters are stored on-site in containers and then sent off-site for incineration at a captive Subtitle Cfacility. Table 3.22 presents a summary of the management practice used by DuPont Victoria for thiswaste.
Table 3.22 Waste Management for Wastewater Filters
Facility Waste (RIN #) Final Management Total Volume(MT/yr)
DuPont Victoria 311 Filters (RIN 10) Off-site hazardouswaste incineration
450
Waste Characterization
DuPont Victoria reported this waste as characteristically hazardous for benzene (D018). They alsoreported the total concentration for benzene as 2 mg/kg and the total oil concentration as 1000 mg/kg. DuPont Victoria reported that the source of the benzene is from other non-HCN process wastewater.
Results of Initial Screening Analysis
This waste did not warrant further assessment. It is characteristically hazardous and currently managedand incinerated as a hazardous waste.
3.1.14 Ammonia Sulfate Filters
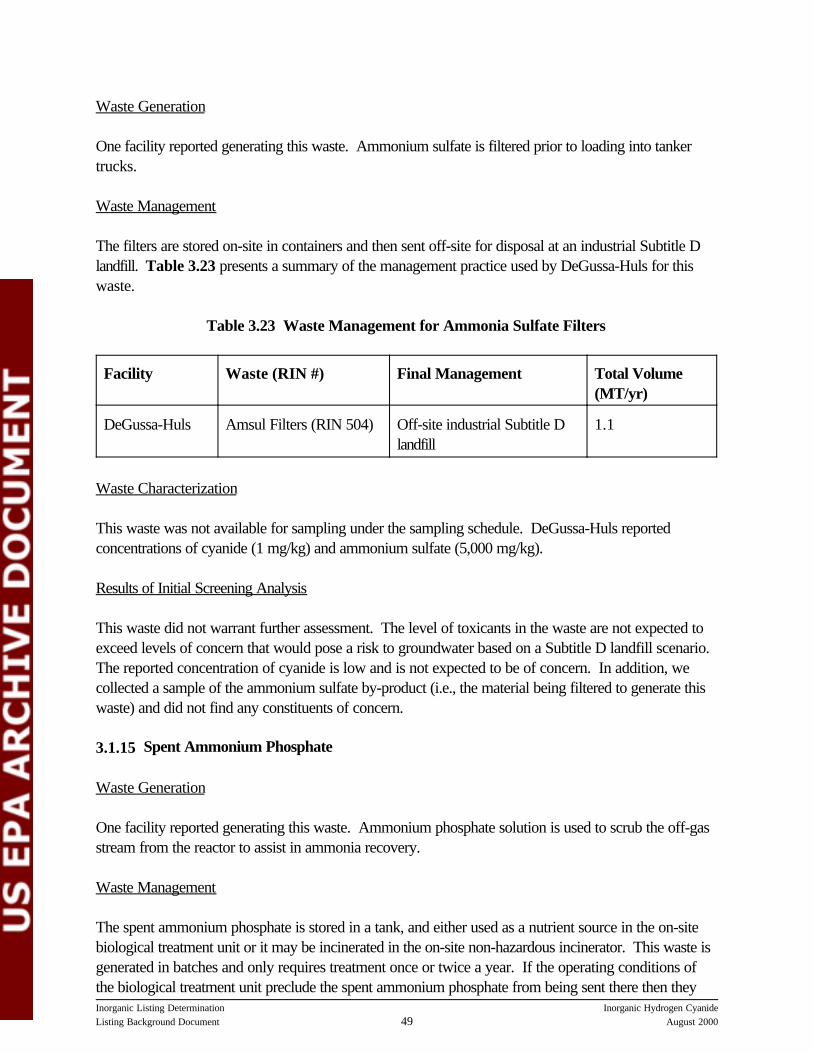
Inorganic Listing Determination Inorganic Hydrogen CyanideListing Background Document August 200049
Waste Generation
One facility reported generating this waste. Ammonium sulfate is filtered prior to loading into tankertrucks.
Waste Management
The filters are stored on-site in containers and then sent off-site for disposal at an industrial Subtitle Dlandfill. Table 3.23 presents a summary of the management practice used by DeGussa-Huls for thiswaste.
Table 3.23 Waste Management for Ammonia Sulfate Filters
Facility Waste (RIN #) Final Management Total Volume(MT/yr)
DeGussa-Huls Amsul Filters (RIN 504) Off-site industrial Subtitle Dlandfill
1.1
Waste Characterization
This waste was not available for sampling under the sampling schedule. DeGussa-Huls reportedconcentrations of cyanide (1 mg/kg) and ammonium sulfate (5,000 mg/kg).
Results of Initial Screening Analysis
This waste did not warrant further assessment. The level of toxicants in the waste are not expected toexceed levels of concern that would pose a risk to groundwater based on a Subtitle D landfill scenario. The reported concentration of cyanide is low and is not expected to be of concern. In addition, wecollected a sample of the ammonium sulfate by-product (i.e., the material being filtered to generate thiswaste) and did not find any constituents of concern.
3.1.15 Spent Ammonium Phosphate
Waste Generation
One facility reported generating this waste. Ammonium phosphate solution is used to scrub the off-gasstream from the reactor to assist in ammonia recovery.
Waste Management
The spent ammonium phosphate is stored in a tank, and either used as a nutrient source in the on-sitebiological treatment unit or it may be incinerated in the on-site non-hazardous incinerator. This waste isgenerated in batches and only requires treatment once or twice a year. If the operating conditions ofthe biological treatment unit preclude the spent ammonium phosphate from being sent there then they
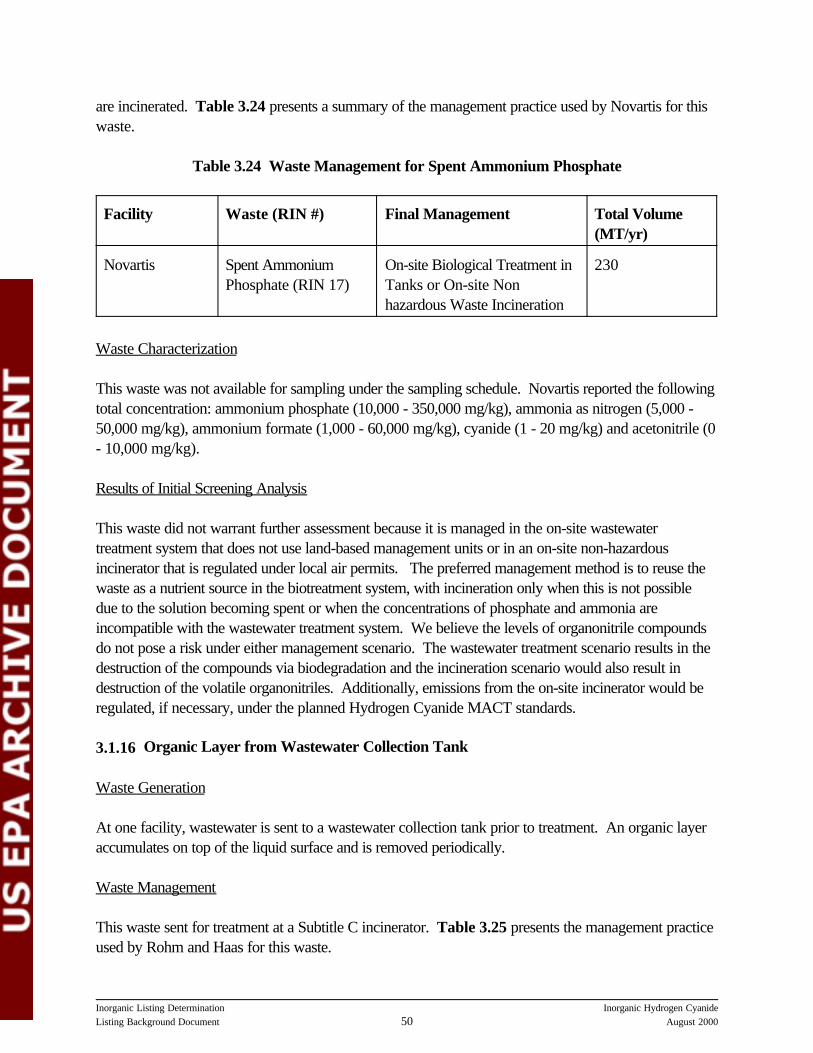
Inorganic Listing Determination Inorganic Hydrogen CyanideListing Background Document August 200050
are incinerated. Table 3.24 presents a summary of the management practice used by Novartis for thiswaste.
Table 3.24 Waste Management for Spent Ammonium Phosphate
Facility Waste (RIN #) Final Management Total Volume(MT/yr)
Novartis Spent AmmoniumPhosphate (RIN 17)
On-site Biological Treatment inTanks or On-site Nonhazardous Waste Incineration
230
Waste Characterization
This waste was not available for sampling under the sampling schedule. Novartis reported the followingtotal concentration: ammonium phosphate (10,000 - 350,000 mg/kg), ammonia as nitrogen (5,000 -50,000 mg/kg), ammonium formate (1,000 - 60,000 mg/kg), cyanide (1 - 20 mg/kg) and acetonitrile (0- 10,000 mg/kg).
Results of Initial Screening Analysis
This waste did not warrant further assessment because it is managed in the on-site wastewatertreatment system that does not use land-based management units or in an on-site non-hazardousincinerator that is regulated under local air permits. The preferred management method is to reuse thewaste as a nutrient source in the biotreatment system, with incineration only when this is not possibledue to the solution becoming spent or when the concentrations of phosphate and ammonia areincompatible with the wastewater treatment system. We believe the levels of organonitrile compoundsdo not pose a risk under either management scenario. The wastewater treatment scenario results in thedestruction of the compounds via biodegradation and the incineration scenario would also result indestruction of the volatile organonitriles. Additionally, emissions from the on-site incinerator would beregulated, if necessary, under the planned Hydrogen Cyanide MACT standards.
3.1.16 Organic Layer from Wastewater Collection Tank
Waste Generation
At one facility, wastewater is sent to a wastewater collection tank prior to treatment. An organic layeraccumulates on top of the liquid surface and is removed periodically.
Waste Management
This waste sent for treatment at a Subtitle C incinerator. Table 3.25 presents the management practiceused by Rohm and Haas for this waste.
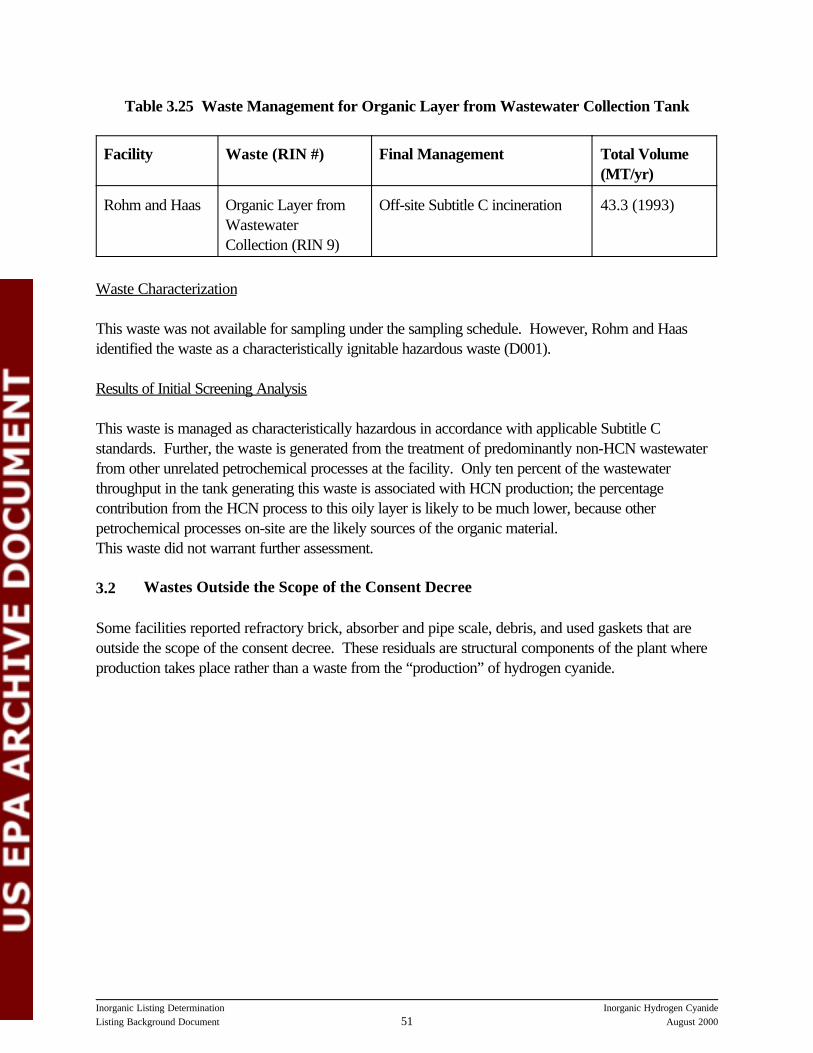
Inorganic Listing Determination Inorganic Hydrogen CyanideListing Background Document August 200051
Table 3.25 Waste Management for Organic Layer from Wastewater Collection Tank
Facility Waste (RIN #) Final Management Total Volume(MT/yr)
Rohm and Haas Organic Layer fromWastewaterCollection (RIN 9)
Off-site Subtitle C incineration 43.3 (1993)
Waste Characterization
This waste was not available for sampling under the sampling schedule. However, Rohm and Haasidentified the waste as a characteristically ignitable hazardous waste (D001).
Results of Initial Screening Analysis
This waste is managed as characteristically hazardous in accordance with applicable Subtitle Cstandards. Further, the waste is generated from the treatment of predominantly non-HCN wastewaterfrom other unrelated petrochemical processes at the facility. Only ten percent of the wastewaterthroughput in the tank generating this waste is associated with HCN production; the percentagecontribution from the HCN process to this oily layer is likely to be much lower, because otherpetrochemical processes on-site are the likely sources of the organic material.This waste did not warrant further assessment.
3.2 Wastes Outside the Scope of the Consent Decree
Some facilities reported refractory brick, absorber and pipe scale, debris, and used gaskets that areoutside the scope of the consent decree. These residuals are structural components of the plant whereproduction takes place rather than a waste from the “production” of hydrogen cyanide.
APPENDIX A
Comparison of Facility Split-Sample Analytical Resultswith
EPA’s Record Sampling Results
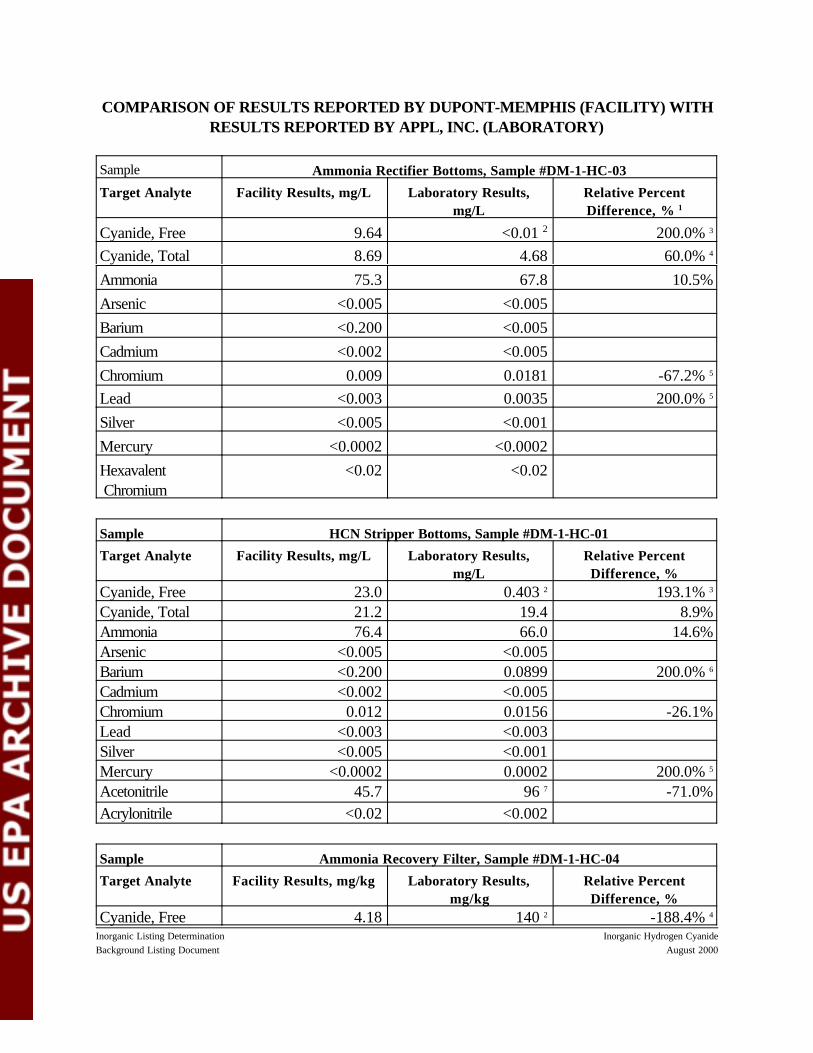
Inorganic Listing Determination Inorganic Hydrogen CyanideBackground Listing Document August 2000
COMPARISON OF RESULTS REPORTED BY DUPONT-MEMPHIS (FACILITY) WITHRESULTS REPORTED BY APPL, INC. (LABORATORY)
Sample Ammonia Rectifier Bottoms, Sample #DM-1-HC-03
Target Analyte Facility Results, mg/L Laboratory Results,mg/L
Relative PercentDifference, % 1
Cyanide, Free 9.64 <0.01 2 200.0% 3
Cyanide, Total 8.69 4.68 60.0% 4
Ammonia 75.3 67.8 10.5%Arsenic <0.005 <0.005Barium <0.200 <0.005Cadmium <0.002 <0.005Chromium 0.009 0.0181 -67.2% 5
Lead <0.003 0.0035 200.0% 5
Silver <0.005 <0.001Mercury <0.0002 <0.0002Hexavalent Chromium
<0.02 <0.02
Sample HCN Stripper Bottoms, Sample #DM-1-HC-01
Target Analyte Facility Results, mg/L Laboratory Results,mg/L
Relative PercentDifference, %
Cyanide, Free 23.0 0.403 2 193.1% 3
Cyanide, Total 21.2 19.4 8.9%Ammonia 76.4 66.0 14.6%Arsenic <0.005 <0.005Barium <0.200 0.0899 200.0% 6
Cadmium <0.002 <0.005Chromium 0.012 0.0156 -26.1%Lead <0.003 <0.003Silver <0.005 <0.001Mercury <0.0002 0.0002 200.0% 5
Acetonitrile 45.7 96 7 -71.0%Acrylonitrile <0.02 <0.002
Sample Ammonia Recovery Filter, Sample #DM-1-HC-04
Target Analyte Facility Results, mg/kg Laboratory Results,mg/kg
Relative PercentDifference, %
Cyanide, Free 4.18 140 2 -188.4% 4
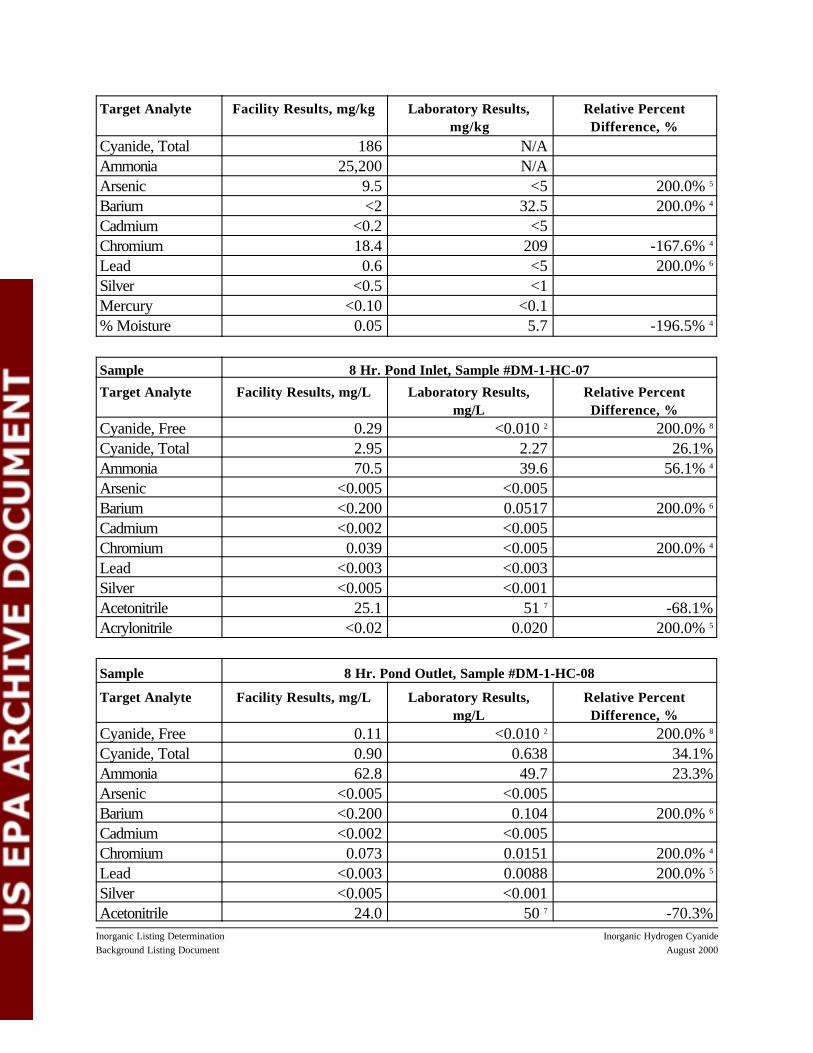
Target Analyte Facility Results, mg/kg Laboratory Results,mg/kg
Relative PercentDifference, %
Inorganic Listing Determination Inorganic Hydrogen CyanideBackground Listing Document August 2000
Cyanide, Total 186 N/AAmmonia 25,200 N/AArsenic 9.5 <5 200.0% 5
Barium <2 32.5 200.0% 4
Cadmium <0.2 <5Chromium 18.4 209 -167.6% 4
Lead 0.6 <5 200.0% 6
Silver <0.5 <1Mercury <0.10 <0.1% Moisture 0.05 5.7 -196.5% 4
Sample 8 Hr. Pond Inlet, Sample #DM-1-HC-07
Target Analyte Facility Results, mg/L Laboratory Results,mg/L
Relative PercentDifference, %
Cyanide, Free 0.29 <0.010 2 200.0% 8
Cyanide, Total 2.95 2.27 26.1%Ammonia 70.5 39.6 56.1% 4
Arsenic <0.005 <0.005Barium <0.200 0.0517 200.0% 6
Cadmium <0.002 <0.005Chromium 0.039 <0.005 200.0% 4
Lead <0.003 <0.003Silver <0.005 <0.001Acetonitrile 25.1 51 7 -68.1%Acrylonitrile <0.02 0.020 200.0% 5
Sample 8 Hr. Pond Outlet, Sample #DM-1-HC-08
Target Analyte Facility Results, mg/L Laboratory Results,mg/L
Relative PercentDifference, %
Cyanide, Free 0.11 <0.010 2 200.0% 8
Cyanide, Total 0.90 0.638 34.1%Ammonia 62.8 49.7 23.3%Arsenic <0.005 <0.005Barium <0.200 0.104 200.0% 6
Cadmium <0.002 <0.005Chromium 0.073 0.0151 200.0% 4
Lead <0.003 0.0088 200.0% 5
Silver <0.005 <0.001Acetonitrile 24.0 50 7 -70.3%
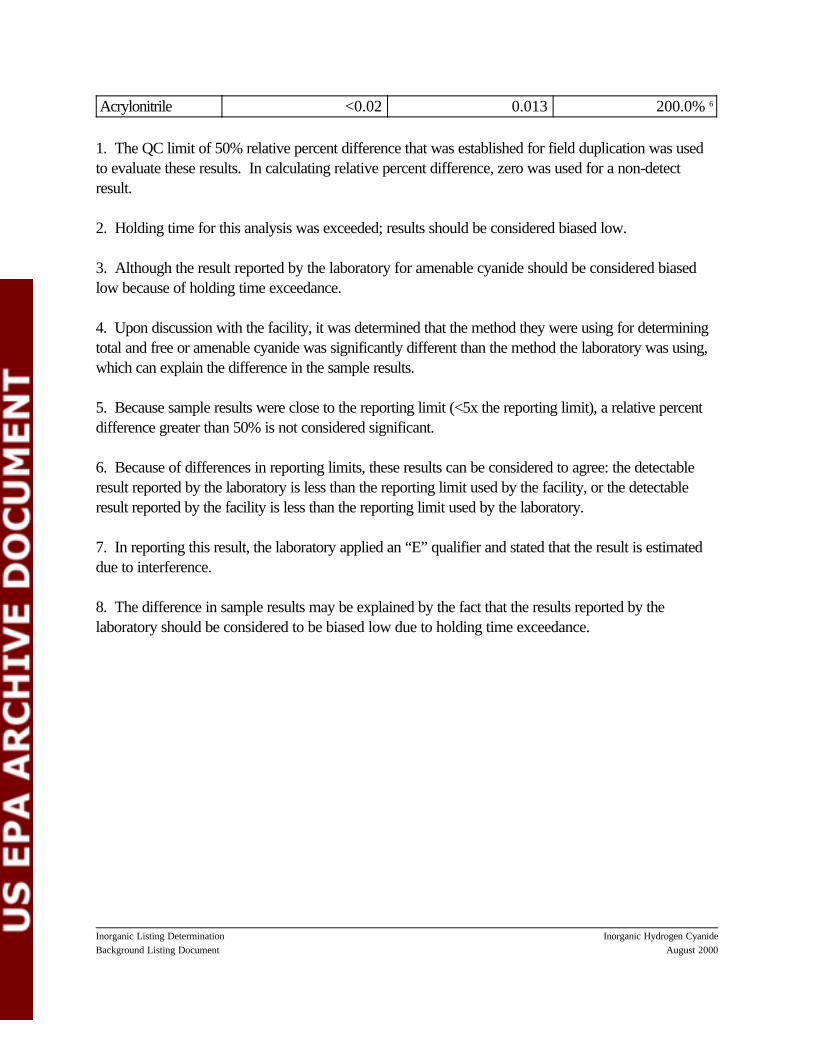
Inorganic Listing Determination Inorganic Hydrogen CyanideBackground Listing Document August 2000
Acrylonitrile <0.02 0.013 200.0% 6
1. The QC limit of 50% relative percent difference that was established for field duplication was usedto evaluate these results. In calculating relative percent difference, zero was used for a non-detectresult.
2. Holding time for this analysis was exceeded; results should be considered biased low.
3. Although the result reported by the laboratory for amenable cyanide should be considered biasedlow because of holding time exceedance.
4. Upon discussion with the facility, it was determined that the method they were using for determiningtotal and free or amenable cyanide was significantly different than the method the laboratory was using,which can explain the difference in the sample results.
5. Because sample results were close to the reporting limit (<5x the reporting limit), a relative percentdifference greater than 50% is not considered significant.
6. Because of differences in reporting limits, these results can be considered to agree: the detectableresult reported by the laboratory is less than the reporting limit used by the facility, or the detectableresult reported by the facility is less than the reporting limit used by the laboratory.
7. In reporting this result, the laboratory applied an “E” qualifier and stated that the result is estimateddue to interference.
8. The difference in sample results may be explained by the fact that the results reported by thelaboratory should be considered to be biased low due to holding time exceedance.
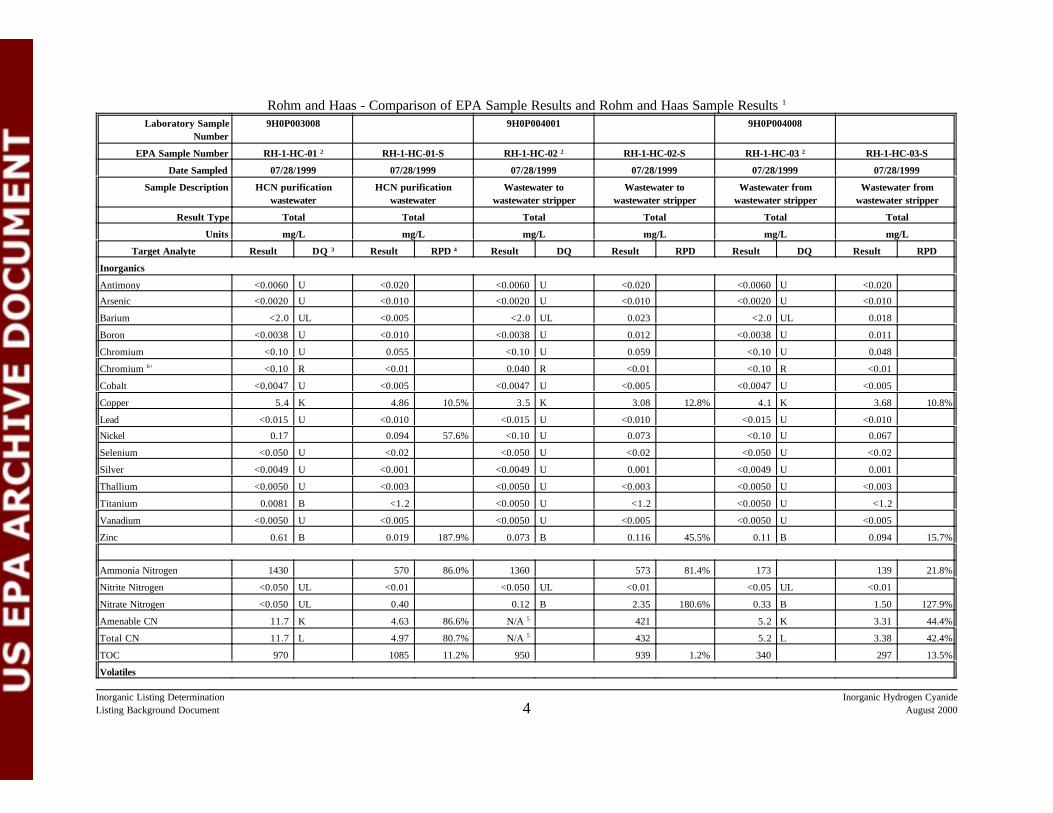
Inorganic Listing Determination Inorganic Hydrogen CyanideListing Background Document August 20004
Rohm and Haas - Comparison of EPA Sample Results and Rohm and Haas Sample Results 1
Laboratory SampleNumber
9H0P003008 9H0P004001 9H0P004008
EPA Sample Number RH-1-HC-01 2 RH-1-HC-01-S RH-1-HC-02 2 RH-1-HC-02-S RH-1-HC-03 2 RH-1-HC-03-S
Date Sampled 07/28/1999 07/28/1999 07/28/1999 07/28/1999 07/28/1999 07/28/1999
Sample Description HCN purificationwastewater
HCN purificationwastewater
Wastewater towastewater stripper
Wastewater towastewater stripper
Wastewater fromwastewater stripper
Wastewater fromwastewater stripper
Result Type Total Total Total Total Total Total
Units mg/L mg/L mg/L mg/L mg/L mg/L
Target Analyte Result DQ 3 Result RPD 4 Result DQ Result RPD Result DQ Result RPD
Inorganics
Antimony <0.0060 U <0.020 <0.0060 U <0.020 <0.0060 U <0.020
Arsenic <0.0020 U <0.010 <0.0020 U <0.010 <0.0020 U <0.010
Barium <2.0 UL <0.005 <2.0 UL 0.023 <2.0 UL 0.018
Boron <0.0038 U <0.010 <0.0038 U 0.012 <0.0038 U 0.011
Chromium <0.10 U 0.055 <0.10 U 0.059 <0.10 U 0.048
Chromium 6+ <0.10 R <0.01 0.040 R <0.01 <0.10 R <0.01
Cobalt <0.0047 U <0.005 <0.0047 U <0.005 <0.0047 U <0.005
Copper 5.4 K 4.86 10.5% 3.5 K 3.08 12.8% 4.1 K 3.68 10.8%
Lead <0.015 U <0.010 <0.015 U <0.010 <0.015 U <0.010
Nickel 0.17 0.094 57.6% <0.10 U 0.073 <0.10 U 0.067
Selenium <0.050 U <0.02 <0.050 U <0.02 <0.050 U <0.02
Silver <0.0049 U <0.001 <0.0049 U 0.001 <0.0049 U 0.001
Thallium <0.0050 U <0.003 <0.0050 U <0.003 <0.0050 U <0.003
Titanium 0.0081 B <1.2 <0.0050 U <1.2 <0.0050 U <1.2
Vanadium <0.0050 U <0.005 <0.0050 U <0.005 <0.0050 U <0.005
Zinc 0.61 B 0.019 187.9% 0.073 B 0.116 45.5% 0.11 B 0.094 15.7%
Ammonia Nitrogen 1430 570 86.0% 1360 573 81.4% 173 139 21.8%
Nitrite Nitrogen <0.050 UL <0.01 <0.050 UL <0.01 <0.05 UL <0.01
Nitrate Nitrogen <0.050 UL 0.40 0.12 B 2.35 180.6% 0.33 B 1.50 127.9%
Amenable CN 11.7 K 4.63 86.6% N/A 5 421 5.2 K 3.31 44.4%
Total CN 11.7 L 4.97 80.7% N/A 5 432 5.2 L 3.38 42.4%
TOC 970 1085 11.2% 950 939 1.2% 340 297 13.5%
Volatiles
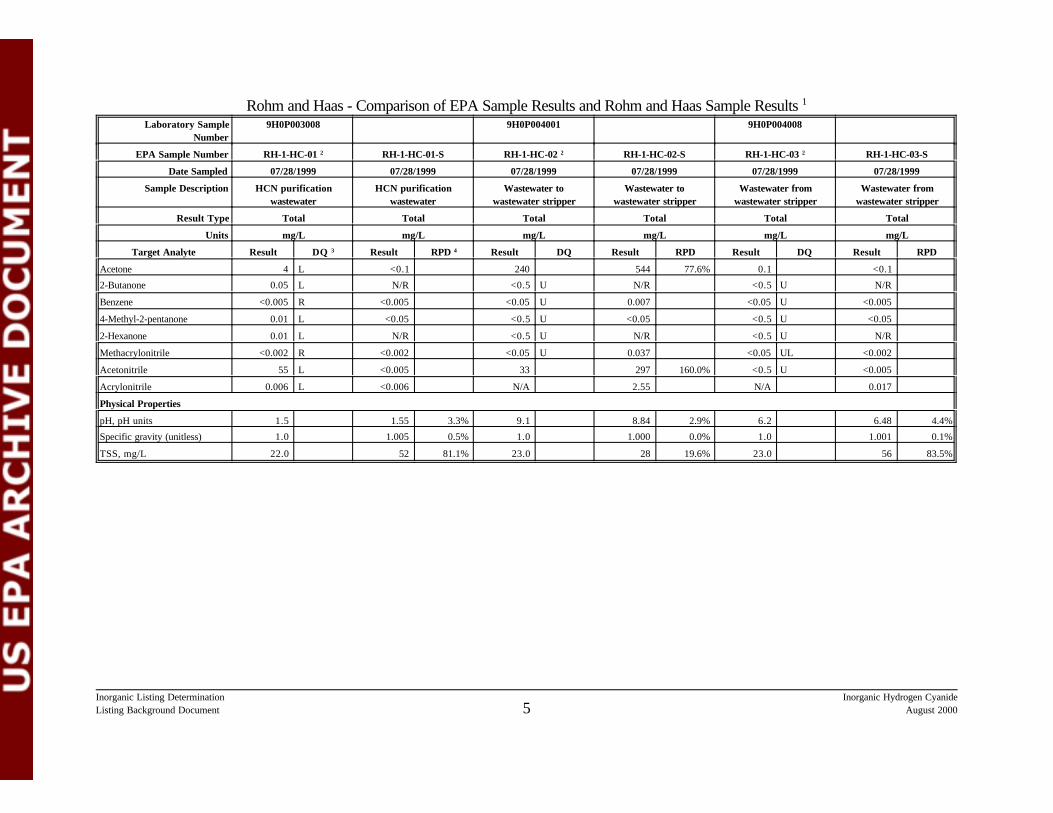
Rohm and Haas - Comparison of EPA Sample Results and Rohm and Haas Sample Results 1Laboratory Sample
Number9H0P003008 9H0P004001 9H0P004008
EPA Sample Number RH-1-HC-01 2 RH-1-HC-01-S RH-1-HC-02 2 RH-1-HC-02-S RH-1-HC-03 2 RH-1-HC-03-S
Date Sampled 07/28/1999 07/28/1999 07/28/1999 07/28/1999 07/28/1999 07/28/1999
Sample Description HCN purificationwastewater
HCN purificationwastewater
Wastewater towastewater stripper
Wastewater towastewater stripper
Wastewater fromwastewater stripper
Wastewater fromwastewater stripper
Result Type Total Total Total Total Total Total
Units mg/L mg/L mg/L mg/L mg/L mg/L
Target Analyte Result DQ 3 Result RPD 4 Result DQ Result RPD Result DQ Result RPD
Inorganic Listing Determination Inorganic Hydrogen CyanideListing Background Document August 20005
Acetone 4 L <0.1 240 544 77.6% 0.1 <0.1
2-Butanone 0.05 L N/R <0.5 U N/R <0.5 U N/R
Benzene <0.005 R <0.005 <0.05 U 0.007 <0.05 U <0.005
4-Methyl-2-pentanone 0.01 L <0.05 <0.5 U <0.05 <0.5 U <0.05
2-Hexanone 0.01 L N/R <0.5 U N/R <0.5 U N/R
Methacrylonitrile <0.002 R <0.002 <0.05 U 0.037 <0.05 UL <0.002
Acetonitrile 55 L <0.005 33 297 160.0% <0.5 U <0.005
Acrylonitrile 0.006 L <0.006 N/A 2.55 N/A 0.017
Physical Properties
pH, pH units 1.5 1.55 3.3% 9.1 8.84 2.9% 6.2 6.48 4.4%
Specific gravity (unitless) 1.0 1.005 0.5% 1.0 1.000 0.0% 1.0 1.001 0.1%
TSS, mg/L 22.0 52 81.1% 23.0 28 19.6% 23.0 56 83.5%
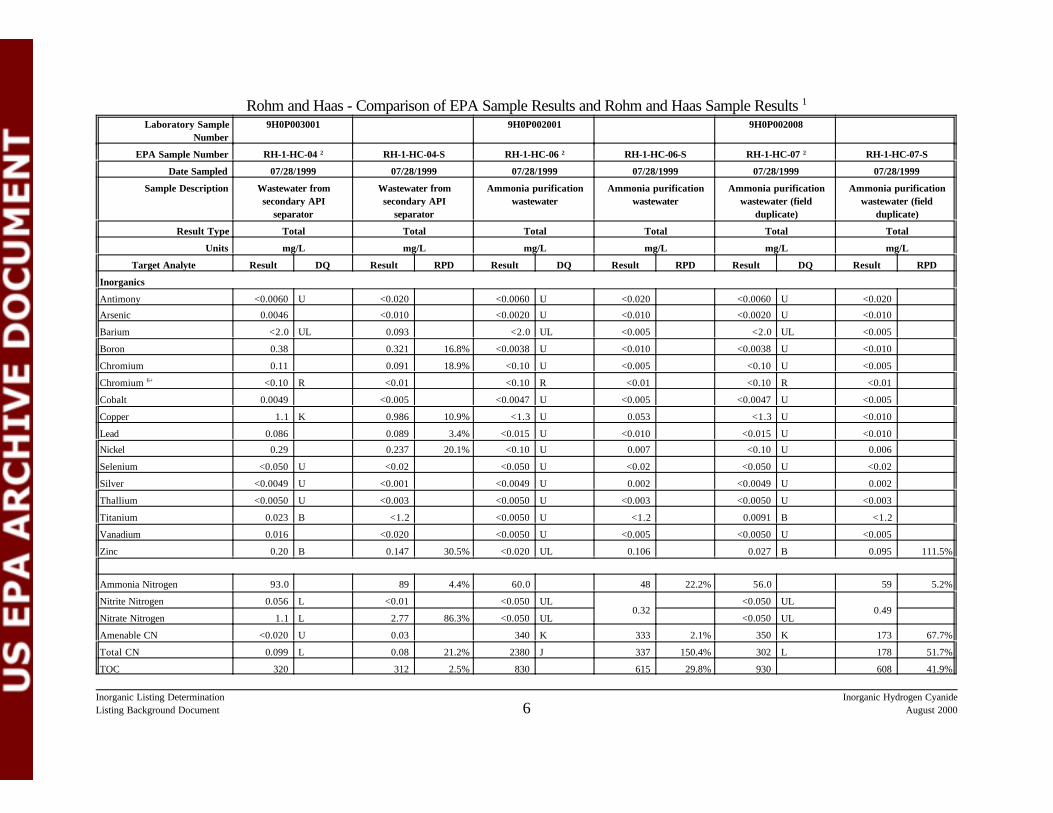
Rohm and Haas - Comparison of EPA Sample Results and Rohm and Haas Sample Results 1
Inorganic Listing Determination Inorganic Hydrogen CyanideListing Background Document August 20006
Laboratory SampleNumber
9H0P003001 9H0P002001 9H0P002008
EPA Sample Number RH-1-HC-04 2 RH-1-HC-04-S RH-1-HC-06 2 RH-1-HC-06-S RH-1-HC-07 2 RH-1-HC-07-S
Date Sampled 07/28/1999 07/28/1999 07/28/1999 07/28/1999 07/28/1999 07/28/1999
Sample Description Wastewater fromsecondary API
separator
Wastewater fromsecondary API
separator
Ammonia purificationwastewater
Ammonia purificationwastewater
Ammonia purificationwastewater (field
duplicate)
Ammonia purificationwastewater (field
duplicate)
Result Type Total Total Total Total Total Total
Units mg/L mg/L mg/L mg/L mg/L mg/L
Target Analyte Result DQ Result RPD Result DQ Result RPD Result DQ Result RPD
Inorganics
Antimony <0.0060 U <0.020 <0.0060 U <0.020 <0.0060 U <0.020
Arsenic 0.0046 <0.010 <0.0020 U <0.010 <0.0020 U <0.010
Barium <2.0 UL 0.093 <2.0 UL <0.005 <2.0 UL <0.005
Boron 0.38 0.321 16.8% <0.0038 U <0.010 <0.0038 U <0.010
Chromium 0.11 0.091 18.9% <0.10 U <0.005 <0.10 U <0.005
Chromium 6+ <0.10 R <0.01 <0.10 R <0.01 <0.10 R <0.01
Cobalt 0.0049 <0.005 <0.0047 U <0.005 <0.0047 U <0.005
Copper 1.1 K 0.986 10.9% <1.3 U 0.053 <1.3 U <0.010
Lead 0.086 0.089 3.4% <0.015 U <0.010 <0.015 U <0.010
Nickel 0.29 0.237 20.1% <0.10 U 0.007 <0.10 U 0.006
Selenium <0.050 U <0.02 <0.050 U <0.02 <0.050 U <0.02
Silver <0.0049 U <0.001 <0.0049 U 0.002 <0.0049 U 0.002
Thallium <0.0050 U <0.003 <0.0050 U <0.003 <0.0050 U <0.003
Titanium 0.023 B <1.2 <0.0050 U <1.2 0.0091 B <1.2
Vanadium 0.016 <0.020 <0.0050 U <0.005 <0.0050 U <0.005
Zinc 0.20 B 0.147 30.5% <0.020 UL 0.106 0.027 B 0.095 111.5%
Ammonia Nitrogen 93.0 89 4.4% 60.0 48 22.2% 56.0 59 5.2%
Nitrite Nitrogen 0.056 L <0.01 <0.050 UL0.32
<0.050 UL0.49
Nitrate Nitrogen 1.1 L 2.77 86.3% <0.050 UL <0.050 UL
Amenable CN <0.020 U 0.03 340 K 333 2.1% 350 K 173 67.7%
Total CN 0.099 L 0.08 21.2% 2380 J 337 150.4% 302 L 178 51.7%
TOC 320 312 2.5% 830 615 29.8% 930 608 41.9%
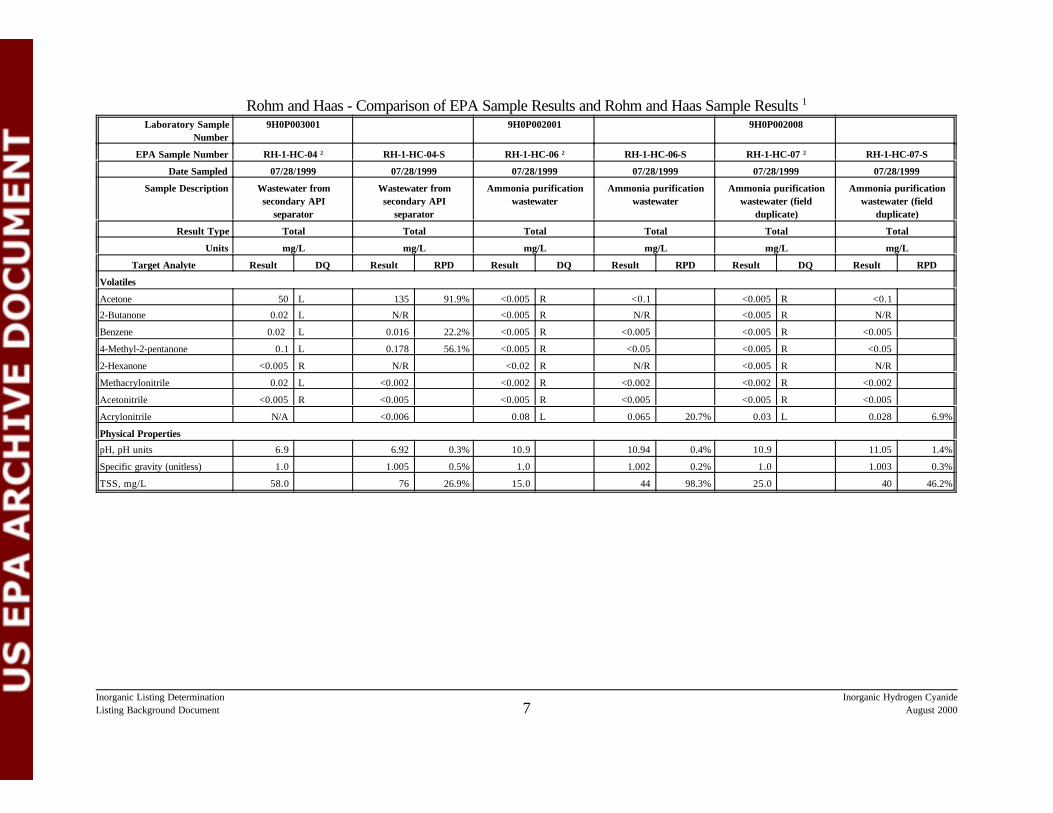
Rohm and Haas - Comparison of EPA Sample Results and Rohm and Haas Sample Results 1Laboratory Sample
Number9H0P003001 9H0P002001 9H0P002008
EPA Sample Number RH-1-HC-04 2 RH-1-HC-04-S RH-1-HC-06 2 RH-1-HC-06-S RH-1-HC-07 2 RH-1-HC-07-S
Date Sampled 07/28/1999 07/28/1999 07/28/1999 07/28/1999 07/28/1999 07/28/1999
Sample Description Wastewater fromsecondary API
separator
Wastewater fromsecondary API
separator
Ammonia purificationwastewater
Ammonia purificationwastewater
Ammonia purificationwastewater (field
duplicate)
Ammonia purificationwastewater (field
duplicate)
Result Type Total Total Total Total Total Total
Units mg/L mg/L mg/L mg/L mg/L mg/L
Target Analyte Result DQ Result RPD Result DQ Result RPD Result DQ Result RPD
Inorganic Listing Determination Inorganic Hydrogen CyanideListing Background Document August 20007
Volatiles
Acetone 50 L 135 91.9% <0.005 R <0.1 <0.005 R <0.1
2-Butanone 0.02 L N/R <0.005 R N/R <0.005 R N/R
Benzene 0.02 L 0.016 22.2% <0.005 R <0.005 <0.005 R <0.005
4-Methyl-2-pentanone 0.1 L 0.178 56.1% <0.005 R <0.05 <0.005 R <0.05
2-Hexanone <0.005 R N/R <0.02 R N/R <0.005 R N/R
Methacrylonitrile 0.02 L <0.002 <0.002 R <0.002 <0.002 R <0.002
Acetonitrile <0.005 R <0.005 <0.005 R <0.005 <0.005 R <0.005
Acrylonitrile N/A <0.006 0.08 L 0.065 20.7% 0.03 L 0.028 6.9%
Physical Properties
pH, pH units 6.9 6.92 0.3% 10.9 10.94 0.4% 10.9 11.05 1.4%
Specific gravity (unitless) 1.0 1.005 0.5% 1.0 1.002 0.2% 1.0 1.003 0.3%
TSS, mg/L 58.0 76 26.9% 15.0 44 98.3% 25.0 40 46.2%
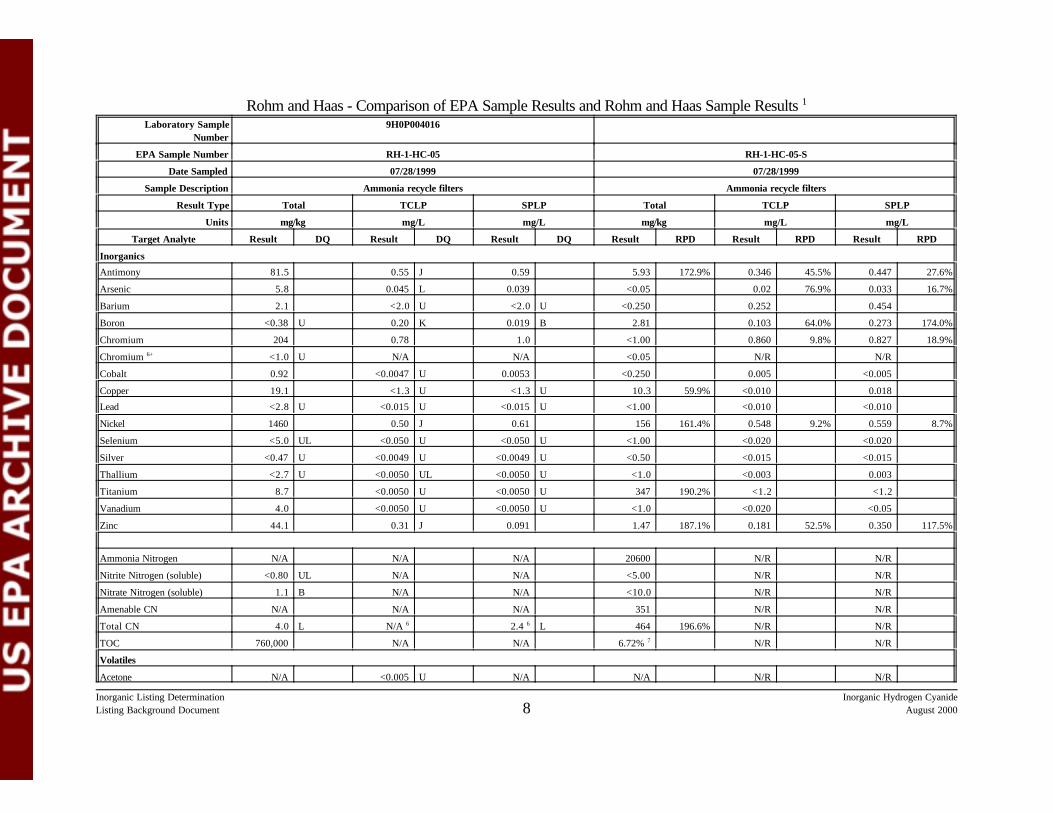
Rohm and Haas - Comparison of EPA Sample Results and Rohm and Haas Sample Results 1
Inorganic Listing Determination Inorganic Hydrogen CyanideListing Background Document August 20008
Laboratory SampleNumber
9H0P004016
EPA Sample Number RH-1-HC-05 RH-1-HC-05-S
Date Sampled 07/28/1999 07/28/1999
Sample Description Ammonia recycle filters Ammonia recycle filters
Result Type Total TCLP SPLP Total TCLP SPLP
Units mg/kg mg/L mg/L mg/kg mg/L mg/L
Target Analyte Result DQ Result DQ Result DQ Result RPD Result RPD Result RPD
Inorganics
Antimony 81.5 0.55 J 0.59 5.93 172.9% 0.346 45.5% 0.447 27.6%
Arsenic 5.8 0.045 L 0.039 <0.05 0.02 76.9% 0.033 16.7%
Barium 2.1 <2.0 U <2.0 U <0.250 0.252 0.454
Boron <0.38 U 0.20 K 0.019 B 2.81 0.103 64.0% 0.273 174.0%
Chromium 204 0.78 1.0 <1.00 0.860 9.8% 0.827 18.9%
Chromium 6+ <1.0 U N/A N/A <0.05 N/R N/R
Cobalt 0.92 <0.0047 U 0.0053 <0.250 0.005 <0.005
Copper 19.1 <1.3 U <1.3 U 10.3 59.9% <0.010 0.018
Lead <2.8 U <0.015 U <0.015 U <1.00 <0.010 <0.010
Nickel 1460 0.50 J 0.61 156 161.4% 0.548 9.2% 0.559 8.7%
Selenium <5.0 UL <0.050 U <0.050 U <1.00 <0.020 <0.020
Silver <0.47 U <0.0049 U <0.0049 U <0.50 <0.015 <0.015
Thallium <2.7 U <0.0050 UL <0.0050 U <1.0 <0.003 0.003
Titanium 8.7 <0.0050 U <0.0050 U 347 190.2% <1.2 <1.2
Vanadium 4.0 <0.0050 U <0.0050 U <1.0 <0.020 <0.05
Zinc 44.1 0.31 J 0.091 1.47 187.1% 0.181 52.5% 0.350 117.5%
Ammonia Nitrogen N/A N/A N/A 20600 N/R N/R
Nitrite Nitrogen (soluble) <0.80 UL N/A N/A <5.00 N/R N/R
Nitrate Nitrogen (soluble) 1.1 B N/A N/A <10.0 N/R N/R
Amenable CN N/A N/A N/A 351 N/R N/R
Total CN 4.0 L N/A 6 2.4 6 L 464 196.6% N/R N/R
TOC 760,000 N/A N/A 6.72% 7 N/R N/R
Volatiles
Acetone N/A <0.005 U N/A N/A N/R N/R

Rohm and Haas - Comparison of EPA Sample Results and Rohm and Haas Sample Results 1Laboratory Sample
Number9H0P004016
EPA Sample Number RH-1-HC-05 RH-1-HC-05-S
Date Sampled 07/28/1999 07/28/1999
Sample Description Ammonia recycle filters Ammonia recycle filters
Result Type Total TCLP SPLP Total TCLP SPLP
Units mg/kg mg/L mg/L mg/kg mg/L mg/L
Target Analyte Result DQ Result DQ Result DQ Result RPD Result RPD Result RPD
Inorganic Listing Determination Inorganic Hydrogen CyanideListing Background Document August 20009
2-Butanone N/A <0.005 U N/A N/R N/R N/R
Benzene N/A <0.005 U N/A N/A N/R N/R
4-Methyl-2-pentanone N/A <0.005 U N/A N/A N/R N/R
2-Hexanone N/A <0.005 U N/A N/R N/R N/R
Methacrylonitrile N/A <0.002 U N/A N/A N/R N/R
Acetonitrile N/A <0.005 U N/A N/A N/R N/R
Acrylonitrile N/A <0.005 U N/A N/A N/R N/R
Physical Properties
pH, pH units 6.7 N/A N/A 6.52 2.7% N/R N/R
Moisture content, % 37.0 N/A N/A 66.3 56.7% N/A N/A
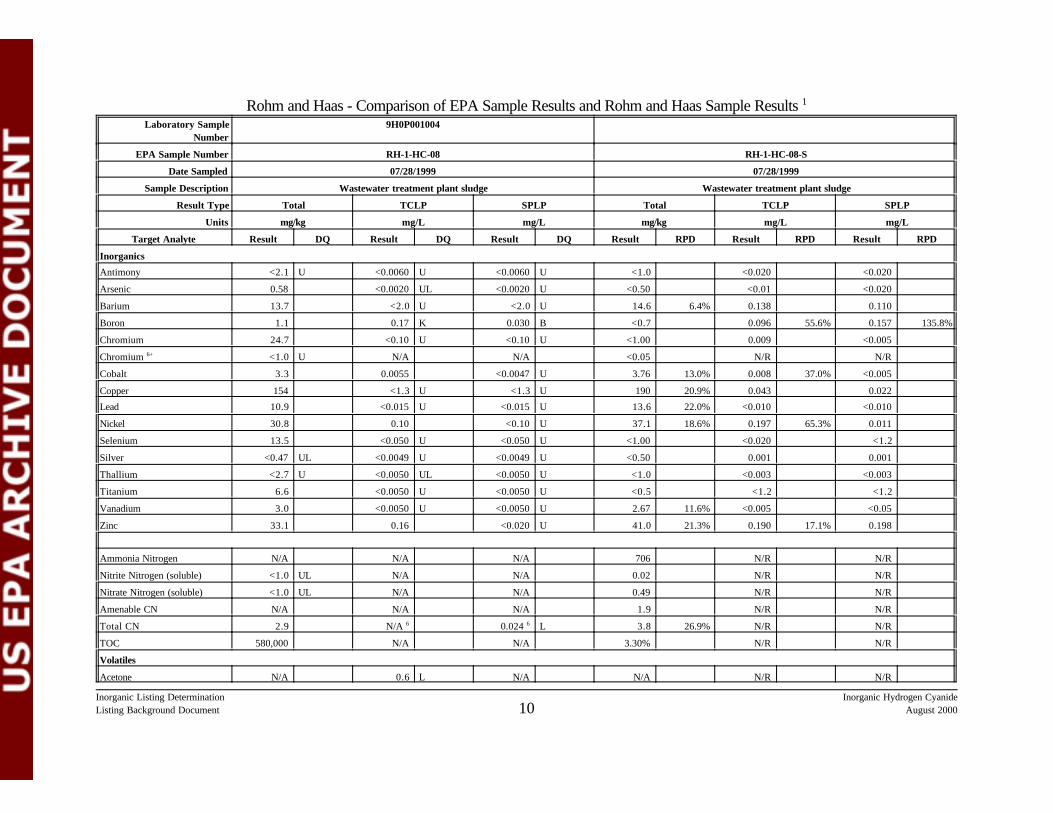
Rohm and Haas - Comparison of EPA Sample Results and Rohm and Haas Sample Results 1
Inorganic Listing Determination Inorganic Hydrogen CyanideListing Background Document August 200010
Laboratory SampleNumber
9H0P001004
EPA Sample Number RH-1-HC-08 RH-1-HC-08-S
Date Sampled 07/28/1999 07/28/1999
Sample Description Wastewater treatment plant sludge Wastewater treatment plant sludge
Result Type Total TCLP SPLP Total TCLP SPLP
Units mg/kg mg/L mg/L mg/kg mg/L mg/L
Target Analyte Result DQ Result DQ Result DQ Result RPD Result RPD Result RPD
Inorganics
Antimony <2.1 U <0.0060 U <0.0060 U <1.0 <0.020 <0.020
Arsenic 0.58 <0.0020 UL <0.0020 U <0.50 <0.01 <0.020
Barium 13.7 <2.0 U <2.0 U 14.6 6.4% 0.138 0.110
Boron 1.1 0.17 K 0.030 B <0.7 0.096 55.6% 0.157 135.8%
Chromium 24.7 <0.10 U <0.10 U <1.00 0.009 <0.005
Chromium 6+ <1.0 U N/A N/A <0.05 N/R N/R
Cobalt 3.3 0.0055 <0.0047 U 3.76 13.0% 0.008 37.0% <0.005
Copper 154 <1.3 U <1.3 U 190 20.9% 0.043 0.022
Lead 10.9 <0.015 U <0.015 U 13.6 22.0% <0.010 <0.010
Nickel 30.8 0.10 <0.10 U 37.1 18.6% 0.197 65.3% 0.011
Selenium 13.5 <0.050 U <0.050 U <1.00 <0.020 <1.2
Silver <0.47 UL <0.0049 U <0.0049 U <0.50 0.001 0.001
Thallium <2.7 U <0.0050 UL <0.0050 U <1.0 <0.003 <0.003
Titanium 6.6 <0.0050 U <0.0050 U <0.5 <1.2 <1.2
Vanadium 3.0 <0.0050 U <0.0050 U 2.67 11.6% <0.005 <0.05
Zinc 33.1 0.16 <0.020 U 41.0 21.3% 0.190 17.1% 0.198
Ammonia Nitrogen N/A N/A N/A 706 N/R N/R
Nitrite Nitrogen (soluble) <1.0 UL N/A N/A 0.02 N/R N/R
Nitrate Nitrogen (soluble) <1.0 UL N/A N/A 0.49 N/R N/R
Amenable CN N/A N/A N/A 1.9 N/R N/R
Total CN 2.9 N/A 6 0.024 6 L 3.8 26.9% N/R N/R
TOC 580,000 N/A N/A 3.30% N/R N/R
Volatiles
Acetone N/A 0.6 L N/A N/A N/R N/R
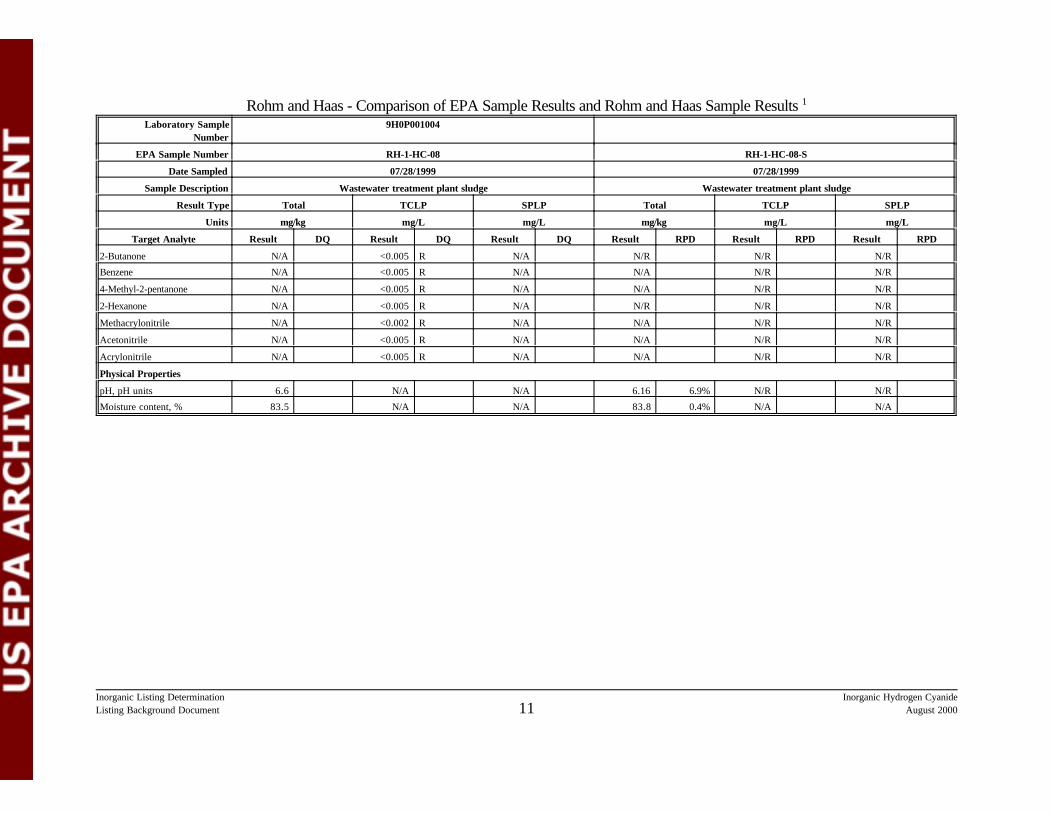
Rohm and Haas - Comparison of EPA Sample Results and Rohm and Haas Sample Results 1Laboratory Sample
Number9H0P001004
EPA Sample Number RH-1-HC-08 RH-1-HC-08-S
Date Sampled 07/28/1999 07/28/1999
Sample Description Wastewater treatment plant sludge Wastewater treatment plant sludge
Result Type Total TCLP SPLP Total TCLP SPLP
Units mg/kg mg/L mg/L mg/kg mg/L mg/L
Target Analyte Result DQ Result DQ Result DQ Result RPD Result RPD Result RPD
Inorganic Listing Determination Inorganic Hydrogen CyanideListing Background Document August 200011
2-Butanone N/A <0.005 R N/A N/R N/R N/R
Benzene N/A <0.005 R N/A N/A N/R N/R
4-Methyl-2-pentanone N/A <0.005 R N/A N/A N/R N/R
2-Hexanone N/A <0.005 R N/A N/R N/R N/R
Methacrylonitrile N/A <0.002 R N/A N/A N/R N/R
Acetonitrile N/A <0.005 R N/A N/A N/R N/R
Acrylonitrile N/A <0.005 R N/A N/A N/R N/R
Physical Properties
pH, pH units 6.6 N/A N/A 6.16 6.9% N/R N/R
Moisture content, % 83.5 N/A N/A 83.8 0.4% N/A N/A
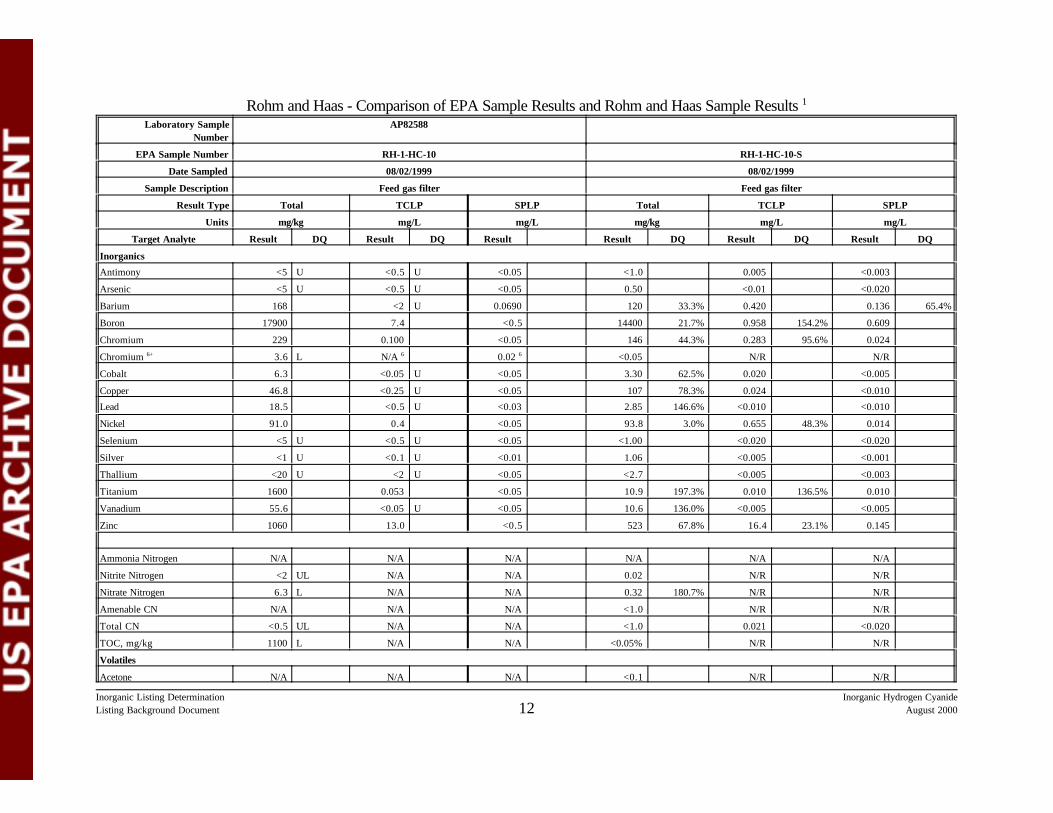
Rohm and Haas - Comparison of EPA Sample Results and Rohm and Haas Sample Results 1
Inorganic Listing Determination Inorganic Hydrogen CyanideListing Background Document August 200012
Laboratory SampleNumber
AP82588
EPA Sample Number RH-1-HC-10 RH-1-HC-10-S
Date Sampled 08/02/1999 08/02/1999
Sample Description Feed gas filter Feed gas filter
Result Type Total TCLP SPLP Total TCLP SPLP
Units mg/kg mg/L mg/L mg/kg mg/L mg/L
Target Analyte Result DQ Result DQ Result Result DQ Result DQ Result DQ
Inorganics
Antimony <5 U <0.5 U <0.05 <1.0 0.005 <0.003
Arsenic <5 U <0.5 U <0.05 0.50 <0.01 <0.020
Barium 168 <2 U 0.0690 120 33.3% 0.420 0.136 65.4%
Boron 17900 7.4 <0.5 14400 21.7% 0.958 154.2% 0.609
Chromium 229 0.100 <0.05 146 44.3% 0.283 95.6% 0.024
Chromium 6+ 3.6 L N/A 6 0.02 6 <0.05 N/R N/R
Cobalt 6.3 <0.05 U <0.05 3.30 62.5% 0.020 <0.005
Copper 46.8 <0.25 U <0.05 107 78.3% 0.024 <0.010
Lead 18.5 <0.5 U <0.03 2.85 146.6% <0.010 <0.010
Nickel 91.0 0.4 <0.05 93.8 3.0% 0.655 48.3% 0.014
Selenium <5 U <0.5 U <0.05 <1.00 <0.020 <0.020
Silver <1 U <0.1 U <0.01 1.06 <0.005 <0.001
Thallium <20 U <2 U <0.05 <2.7 <0.005 <0.003
Titanium 1600 0.053 <0.05 10.9 197.3% 0.010 136.5% 0.010
Vanadium 55.6 <0.05 U <0.05 10.6 136.0% <0.005 <0.005
Zinc 1060 13.0 <0.5 523 67.8% 16.4 23.1% 0.145
Ammonia Nitrogen N/A N/A N/A N/A N/A N/A
Nitrite Nitrogen <2 UL N/A N/A 0.02 N/R N/R
Nitrate Nitrogen 6.3 L N/A N/A 0.32 180.7% N/R N/R
Amenable CN N/A N/A N/A <1.0 N/R N/R
Total CN <0.5 UL N/A N/A <1.0 0.021 <0.020
TOC, mg/kg 1100 L N/A N/A <0.05% N/R N/R
Volatiles
Acetone N/A N/A N/A <0.1 N/R N/R
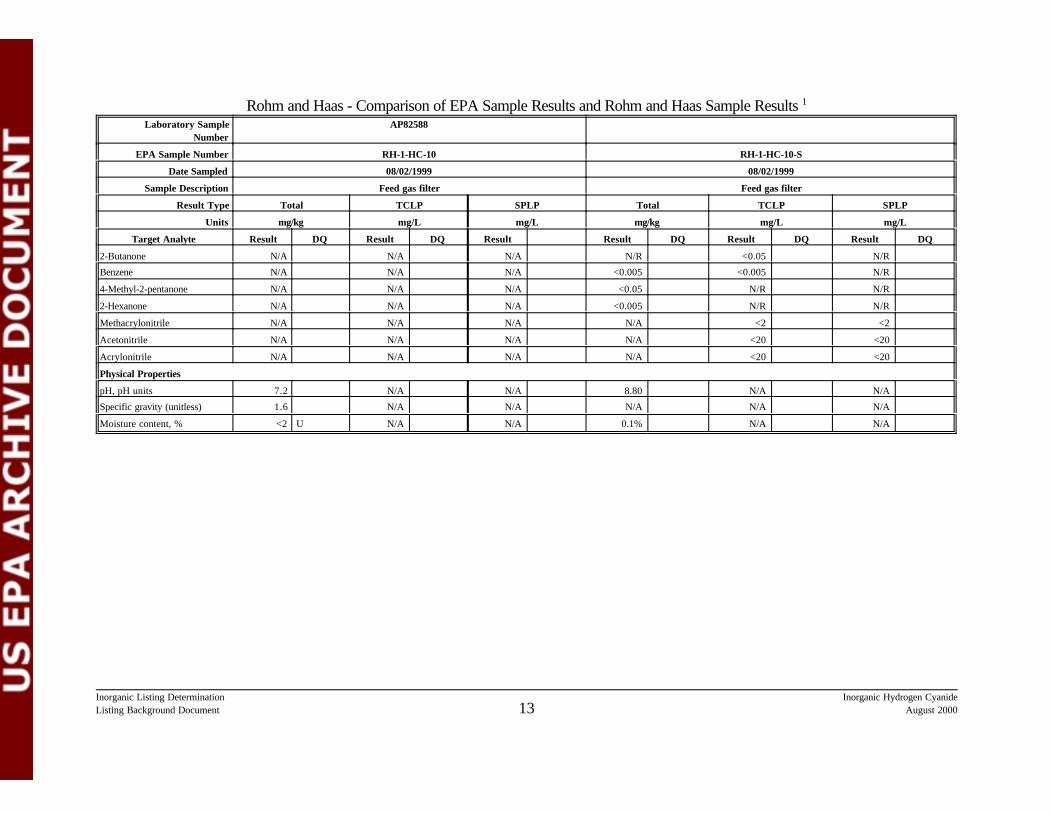
Rohm and Haas - Comparison of EPA Sample Results and Rohm and Haas Sample Results 1Laboratory Sample
NumberAP82588
EPA Sample Number RH-1-HC-10 RH-1-HC-10-S
Date Sampled 08/02/1999 08/02/1999
Sample Description Feed gas filter Feed gas filter
Result Type Total TCLP SPLP Total TCLP SPLP
Units mg/kg mg/L mg/L mg/kg mg/L mg/L
Target Analyte Result DQ Result DQ Result Result DQ Result DQ Result DQ
Inorganic Listing Determination Inorganic Hydrogen CyanideListing Background Document August 200013
2-Butanone N/A N/A N/A N/R <0.05 N/R
Benzene N/A N/A N/A <0.005 <0.005 N/R
4-Methyl-2-pentanone N/A N/A N/A <0.05 N/R N/R
2-Hexanone N/A N/A N/A <0.005 N/R N/R
Methacrylonitrile N/A N/A N/A N/A <2 <2
Acetonitrile N/A N/A N/A N/A <20 <20
Acrylonitrile N/A N/A N/A N/A <20 <20
Physical Properties
pH, pH units 7.2 N/A N/A 8.80 N/A N/A
Specific gravity (unitless) 1.6 N/A N/A N/A N/A N/A
Moisture content, % <2 U N/A N/A 0.1% N/A N/A
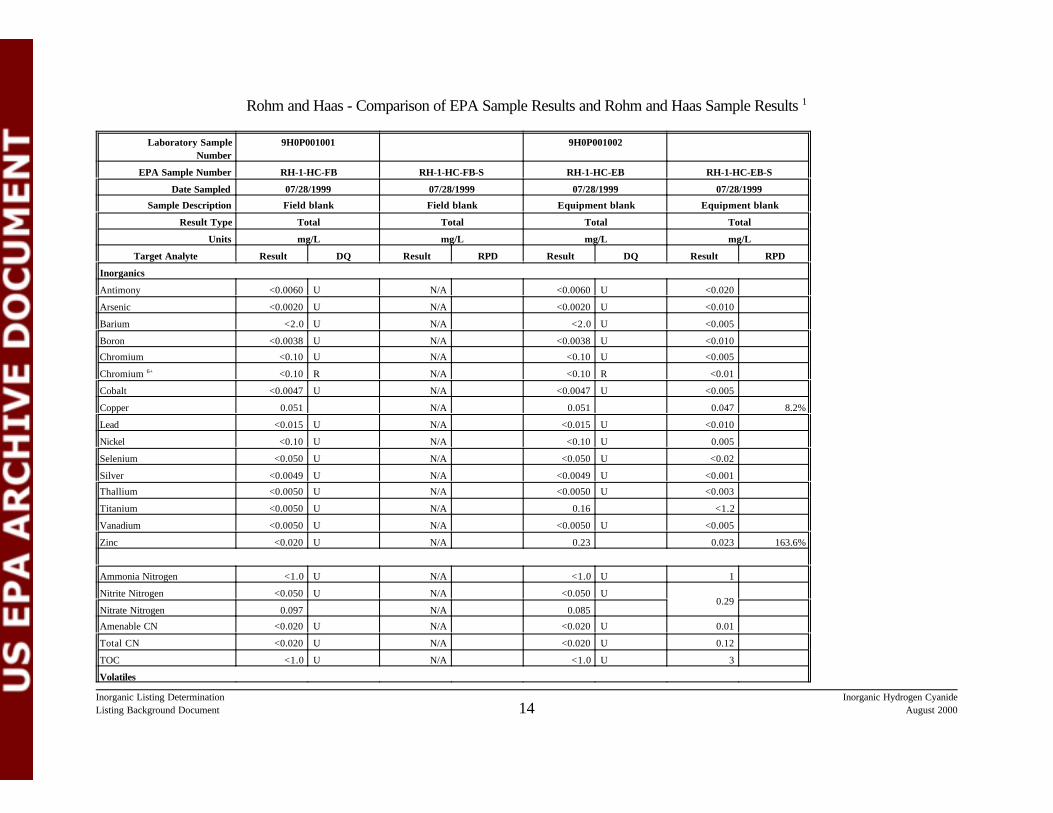
Rohm and Haas - Comparison of EPA Sample Results and Rohm and Haas Sample Results 1
Inorganic Listing Determination Inorganic Hydrogen CyanideListing Background Document August 200014
Laboratory SampleNumber
9H0P001001 9H0P001002
EPA Sample Number RH-1-HC-FB RH-1-HC-FB-S RH-1-HC-EB RH-1-HC-EB-S
Date Sampled 07/28/1999 07/28/1999 07/28/1999 07/28/1999
Sample Description Field blank Field blank Equipment blank Equipment blank
Result Type Total Total Total Total
Units mg/L mg/L mg/L mg/L
Target Analyte Result DQ Result RPD Result DQ Result RPD
Inorganics
Antimony <0.0060 U N/A <0.0060 U <0.020
Arsenic <0.0020 U N/A <0.0020 U <0.010
Barium <2.0 U N/A <2.0 U <0.005
Boron <0.0038 U N/A <0.0038 U <0.010
Chromium <0.10 U N/A <0.10 U <0.005
Chromium 6+ <0.10 R N/A <0.10 R <0.01
Cobalt <0.0047 U N/A <0.0047 U <0.005
Copper 0.051 N/A 0.051 0.047 8.2%
Lead <0.015 U N/A <0.015 U <0.010
Nickel <0.10 U N/A <0.10 U 0.005
Selenium <0.050 U N/A <0.050 U <0.02
Silver <0.0049 U N/A <0.0049 U <0.001
Thallium <0.0050 U N/A <0.0050 U <0.003
Titanium <0.0050 U N/A 0.16 <1.2
Vanadium <0.0050 U N/A <0.0050 U <0.005
Zinc <0.020 U N/A 0.23 0.023 163.6%
Ammonia Nitrogen <1.0 U N/A <1.0 U 1
Nitrite Nitrogen <0.050 U N/A <0.050 U0.29
Nitrate Nitrogen 0.097 N/A 0.085
Amenable CN <0.020 U N/A <0.020 U 0.01
Total CN <0.020 U N/A <0.020 U 0.12
TOC <1.0 U N/A <1.0 U 3
Volatiles
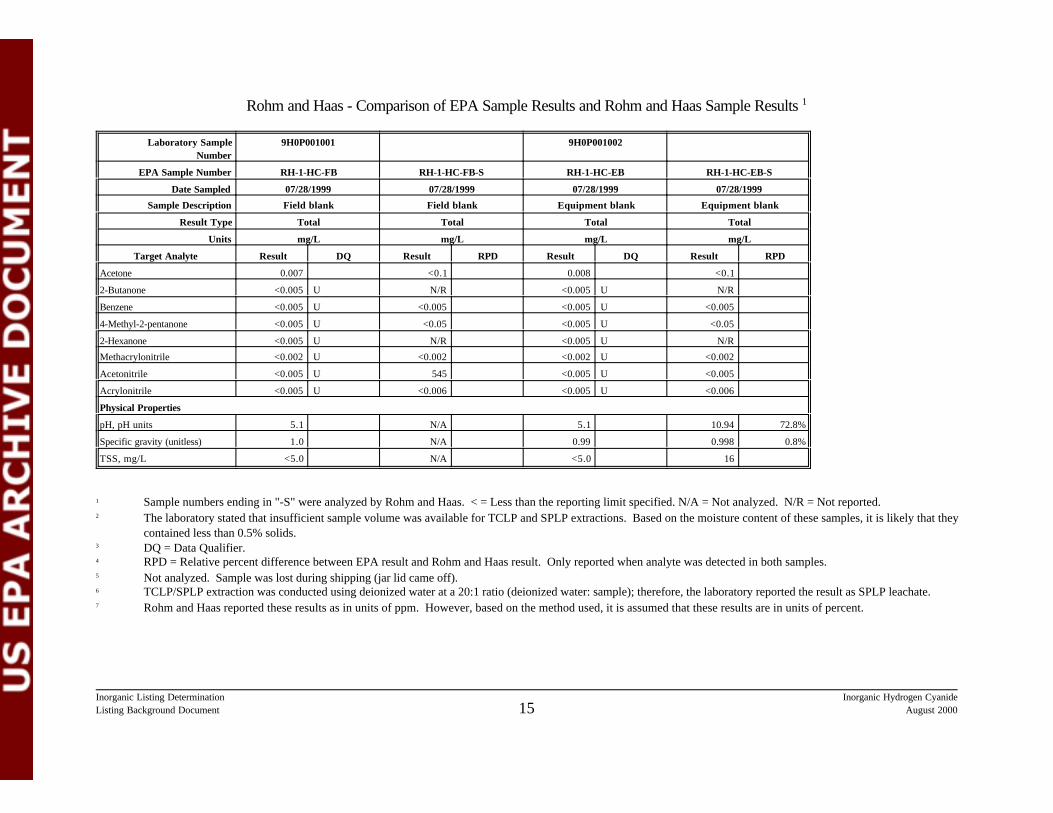
Rohm and Haas - Comparison of EPA Sample Results and Rohm and Haas Sample Results 1
Laboratory SampleNumber
9H0P001001 9H0P001002
EPA Sample Number RH-1-HC-FB RH-1-HC-FB-S RH-1-HC-EB RH-1-HC-EB-S
Date Sampled 07/28/1999 07/28/1999 07/28/1999 07/28/1999
Sample Description Field blank Field blank Equipment blank Equipment blank
Result Type Total Total Total Total
Units mg/L mg/L mg/L mg/L
Target Analyte Result DQ Result RPD Result DQ Result RPD
Inorganic Listing Determination Inorganic Hydrogen CyanideListing Background Document August 200015
Acetone 0.007 <0.1 0.008 <0.1
2-Butanone <0.005 U N/R <0.005 U N/R
Benzene <0.005 U <0.005 <0.005 U <0.005
4-Methyl-2-pentanone <0.005 U <0.05 <0.005 U <0.05
2-Hexanone <0.005 U N/R <0.005 U N/R
Methacrylonitrile <0.002 U <0.002 <0.002 U <0.002
Acetonitrile <0.005 U 545 <0.005 U <0.005
Acrylonitrile <0.005 U <0.006 <0.005 U <0.006
Physical Properties
pH, pH units 5.1 N/A 5.1 10.94 72.8%
Specific gravity (unitless) 1.0 N/A 0.99 0.998 0.8%
TSS, mg/L <5.0 N/A <5.0 16
1 Sample numbers ending in "-S" were analyzed by Rohm and Haas. < = Less than the reporting limit specified. N/A = Not analyzed. N/R = Not reported.2 The laboratory stated that insufficient sample volume was available for TCLP and SPLP extractions. Based on the moisture content of these samples, it is likely that they
contained less than 0.5% solids.3 DQ = Data Qualifier.4 RPD = Relative percent difference between EPA result and Rohm and Haas result. Only reported when analyte was detected in both samples.5 Not analyzed. Sample was lost during shipping (jar lid came off).6 TCLP/SPLP extraction was conducted using deionized water at a 20:1 ratio (deionized water: sample); therefore, the laboratory reported the result as SPLP leachate. 7 Rohm and Haas reported these results as in units of ppm. However, based on the method used, it is assumed that these results are in units of percent.
Inorganic Listing Determination Inorganic Hydrogen CyanideListing Background Document August 200016
APPENDIX B
PHONE LOGS, MAPS AND OTHER SUPPORTING MATERIALS