Embed Size (px)
Citation preview

Investor PresentationPhilippe Courtot, Chairman and CEO
Melissa Fisher, CFO

Safe Harbor
This presentation includes forward-looking statements within the meaning of the federal securities laws. Forward-
looking statements generally relate to future events or our future financial or operating performance. Forward-looking
statements in this presentation include, but are not limited to, the following list:
- our business and financial performance and expectations for future periods, including the rate of growth of our
business and market share gains;
- trends related to the diversification of our revenue base;
- our ability to sell additional solutions to our customer base and the strength of demand for those solutions;
- our plans regarding the development of our technology and its expected timing;
- our expectations regarding the capabilities of our platform and solutions;
- the anticipated needs of our customers;
- our strategy, the scalability of our strategy, our ability to execute our strategy and our expectations regarding our
market position;
- the expansion of our platform and our delivery of new solutions;
- the expansion of our partnerships and the related benefits of those partnerships;
- our ability to effectively manage our costs; and
- our expectations for existing and new MSSPs, which are multi-year contracts at fixed prices.
We also remind you that this presentation will include a discussion of GAAP and non-GAAP financial measures. The
non-GAAP financial measures are not intended to be considered in isolation or as a substitute for results prepared in
accordance with GAAP. A reconciliation of the non-GAAP financial measures discussed in this presentation to the most
directly comparable GAAP financial measures is included in the appendix of this presentation.

Qualys Cloud PlatformProvides continuous view of global IT assets
and of their security & compliance posture
Consolidates 10 enterprise
security & compliance
solutions and more to come…
ALL centrally managed,
self updating and natively
sharing information
Drastically reducing
infrastructure, operational
and maintenance costs
3
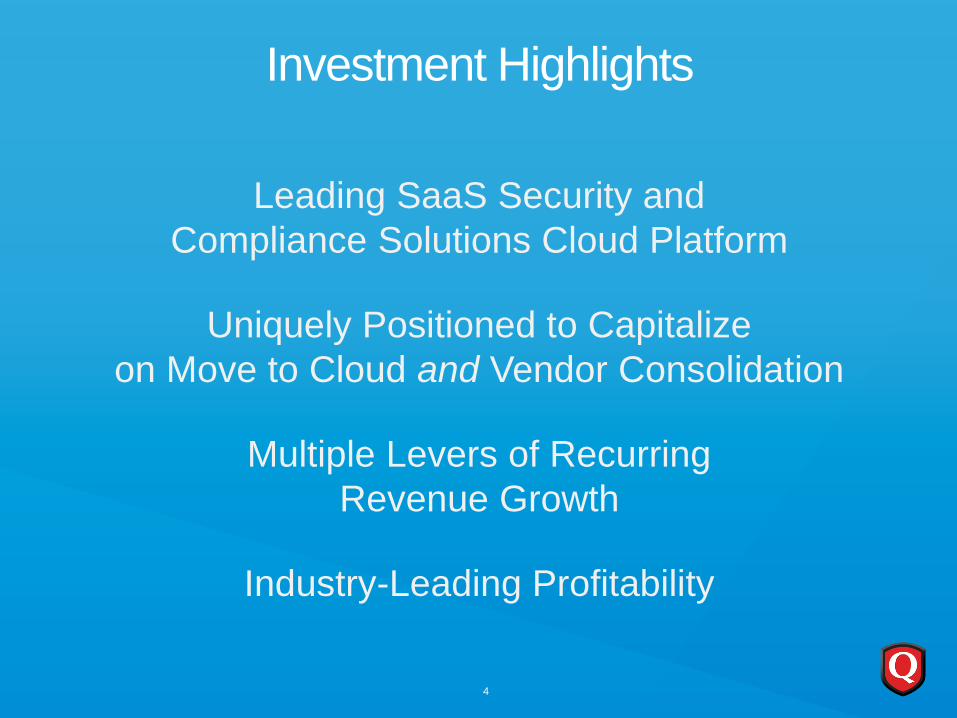
Investment Highlights
4
Leading SaaS Security and
Compliance Solutions Cloud Platform
Uniquely Positioned to Capitalize
on Move to Cloud and Vendor Consolidation
Multiple Levers of Recurring
Revenue Growth
Industry-Leading Profitability

Evolution of Qualys Cloud Platform
Today Qualys Offers 10 Enterprise Security & Compliance Solutions*
Beginning Additional Solutions Re-architecture Current Qualys Cloud Platform
2006 2006 – 2011 2011 – 2013 2013 – Current
5
Vulnerability Management
Policy Compliance
Web Application Security
* Note: For full product names, please refer to page 30 in the appendix
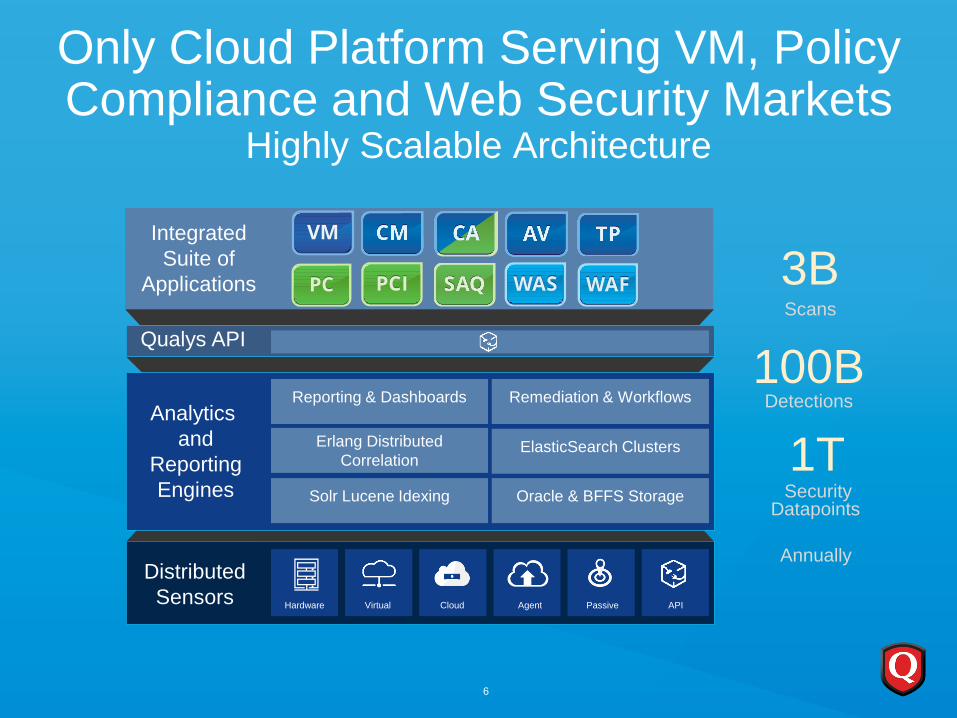
Integrated
Suite of
Applications
Qualys API
Distributed
Sensors Hardware Virtual Cloud Agent Passive API
Only Cloud Platform Serving VM, Policy Compliance and Web Security Markets
Highly Scalable Architecture
Analytics
and
Reporting
Engines
Erlang Distributed
CorrelationElasticSearch Clusters
Solr Lucene Idexing Oracle & BFFS Storage
Reporting & Dashboards Remediation & Workflows
3BScans
100BDetections
1TSecurity
Datapoints
Annually
6
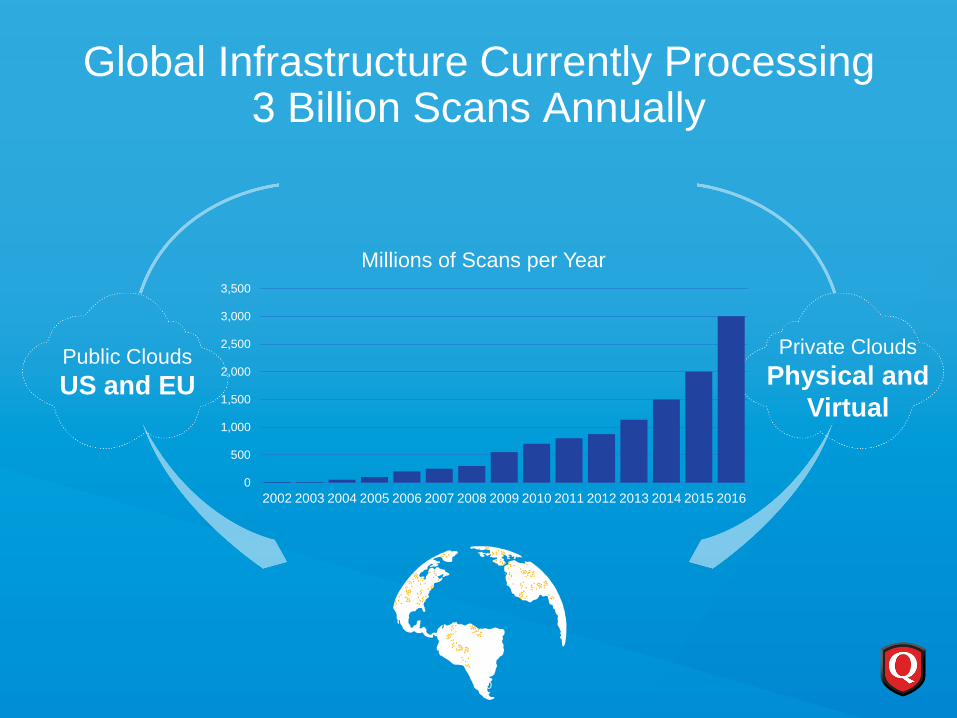
Public Clouds
US and EU
Private Clouds
Physical and
Virtual
10
0
500
1,000
1,500
2,000
2,500
3,000
3,500
2002 2003 2004 2005 2006 2007 2008 2009 2010 2011 2012 2013 2014 2015 2016
Millions of Scans per Year
Global Infrastructure Currently Processing3 Billion Scans Annually

More New Solutions ComingNew solutions will increase TAM
and potential share of wallet
8
Integrated Suite of Applications
TO COMECURRENT
Qualys Cloud Platform
Hardware Virtual Cloud Agent Passive API
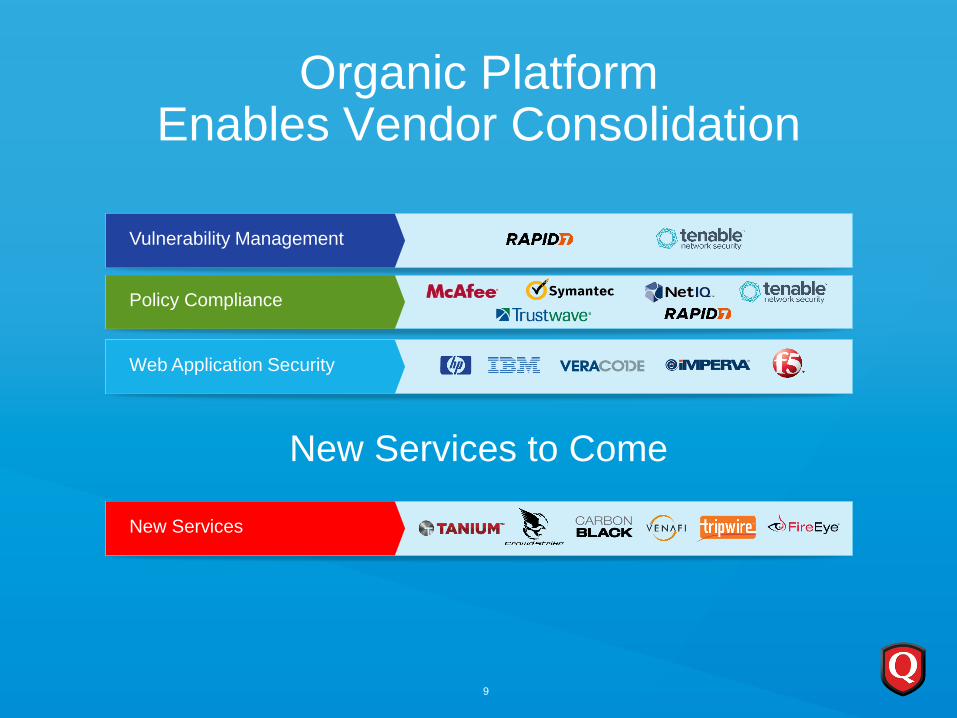
Policy Compliance
New Services
Web Application Security
Vulnerability Management
Organic PlatformEnables Vendor Consolidation
9
New Services to Come
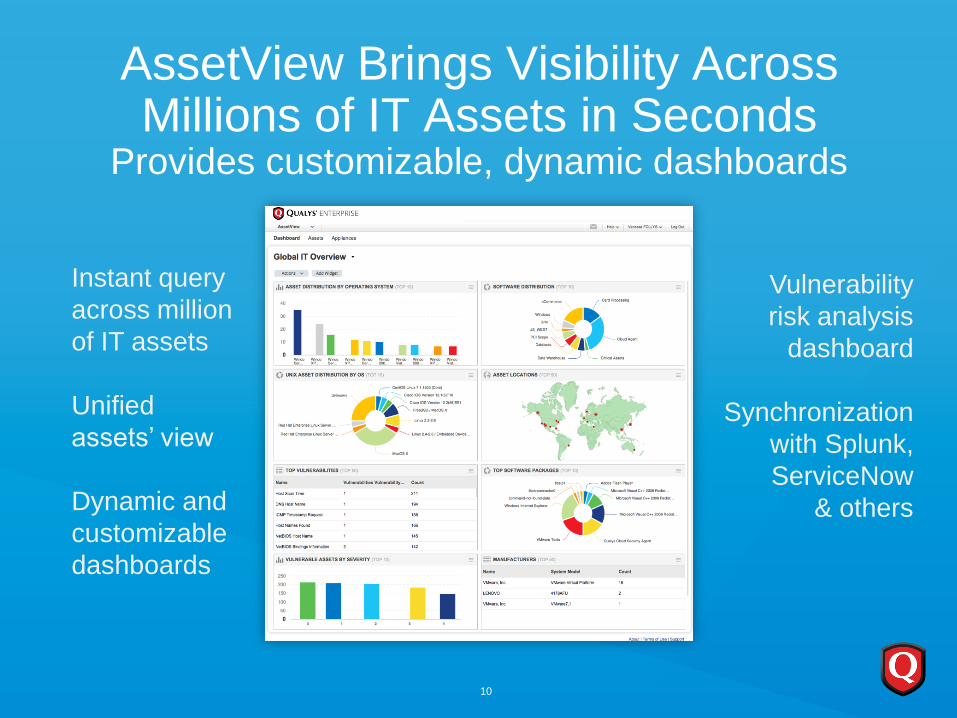
AssetView Brings Visibility Across Millions of IT Assets in Seconds
Provides customizable, dynamic dashboards
Instant query
across million
of IT assets
Unified
assets’ view
Dynamic and
customizable
dashboards
Vulnerability
risk analysis
dashboard
Synchronization
with Splunk,
ServiceNow
& others
10
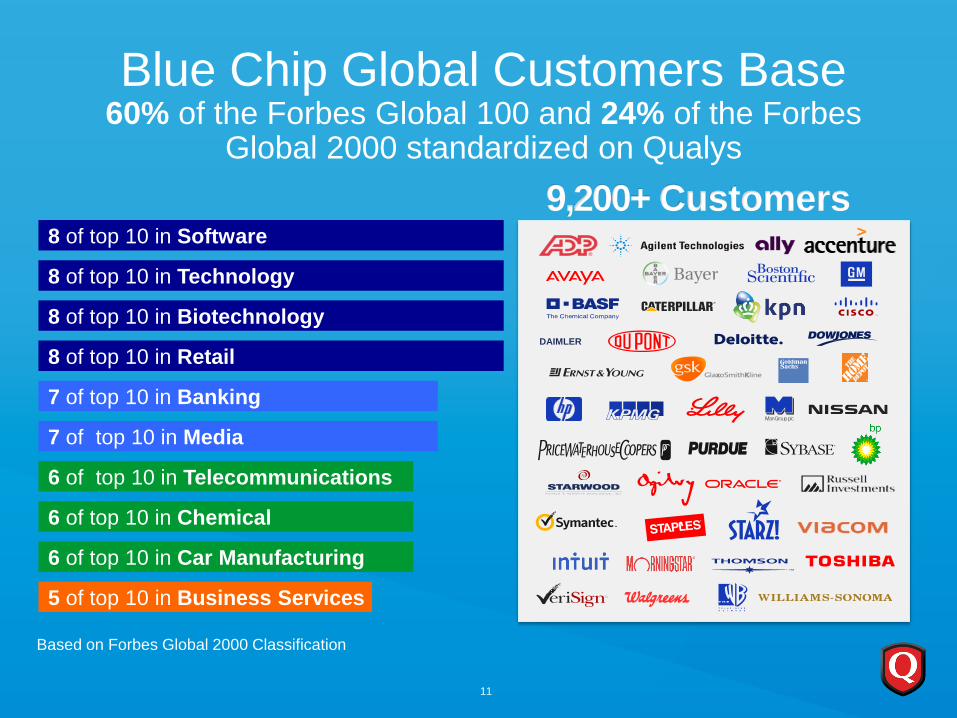
Blue Chip Global Customers Base60% of the Forbes Global 100 and 24% of the Forbes
Global 2000 standardized on Qualys
Based on Forbes Global 2000 Classification
9,200+ Customers
8 of top 10 in Retail
7 of top 10 in Banking
8 of top 10 in Biotechnology
6 of top 10 in Chemical
6 of top 10 in Car Manufacturing
7 of top 10 in Media
6 of top 10 in Telecommunications
8 of top 10 in Software
5 of top 10 in Business Services
8 of top 10 in Technology
DAIMLER
11
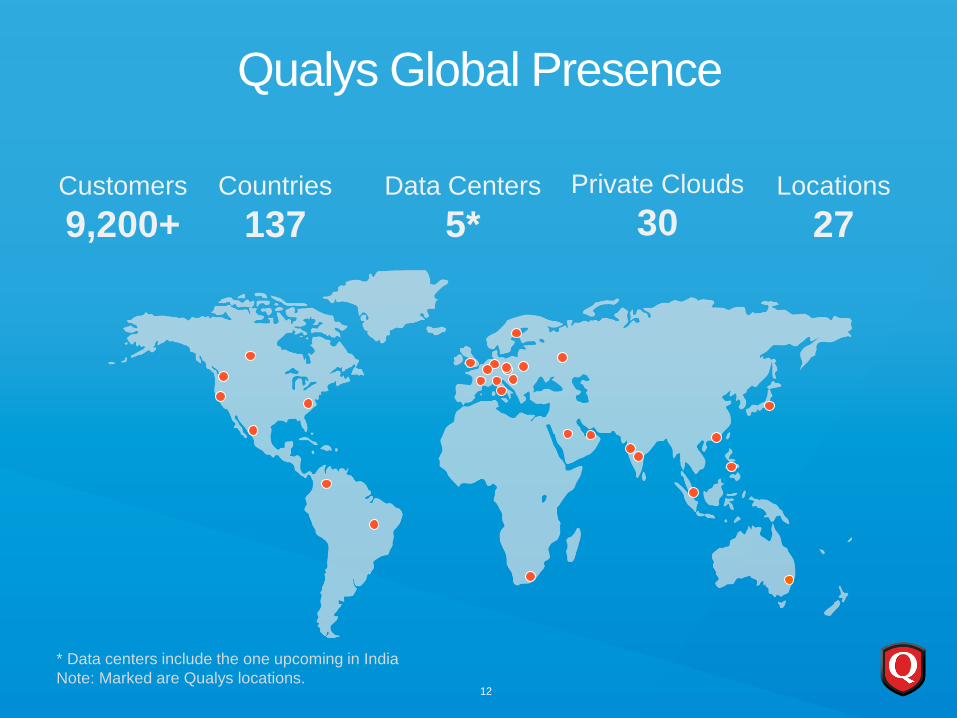
Qualys Global Presence
12
Customers
9,200+Countries
137Data Centers
5*Locations
27
* Data centers include the one upcoming in India
Note: Marked are Qualys locations.
Private Clouds
30
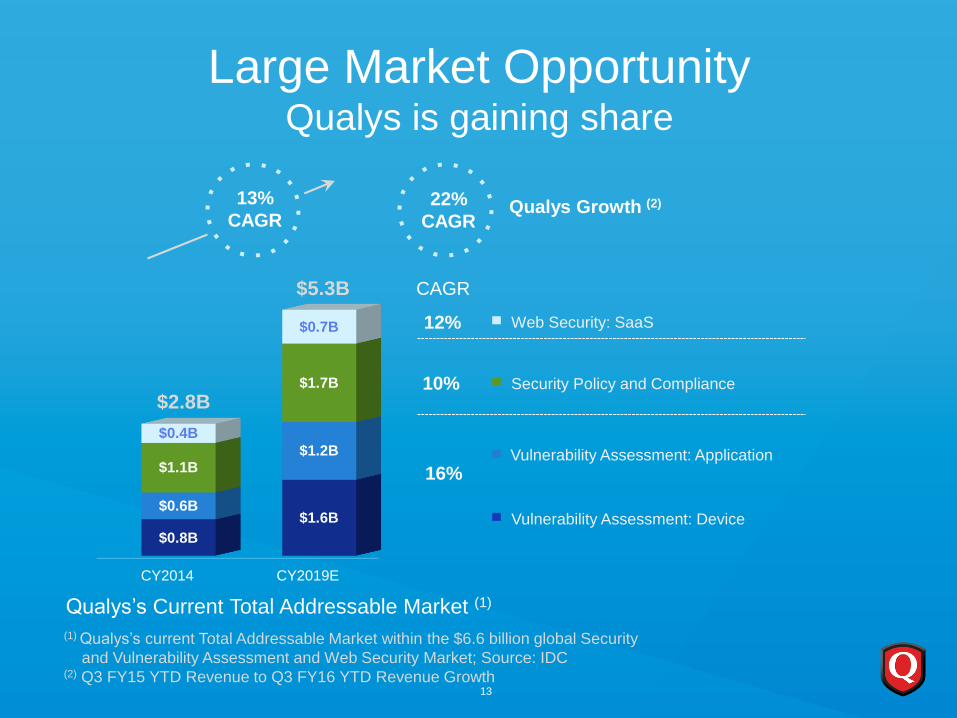
Large Market OpportunityQualys is gaining share
13
(1) Qualys’s current Total Addressable Market within the $6.6 billion global Security
and Vulnerability Assessment and Web Security Market; Source: IDC(2) Q3 FY15 YTD Revenue to Q3 FY16 YTD Revenue Growth
CY2014 CY2019E
$0.8B
$1.6B $0.6B
$1.2B $1.1B
$1.7B
$0.4B
$0.7B
10%
12%
CAGR
$2.8B
$5.3B
16%
Qualys’s Current Total Addressable Market (1)
13%
CAGR22%
CAGR
Web Security: SaaS
Security Policy and Compliance
Vulnerability Assessment: Application
Vulnerability Assessment: Device
Qualys Growth (2)

Global Go-to-Market Strategy and Execution

Platform Enables Cost-Effective Service to All Customer Segments
5,000+Employees
ENTERPRISEEnterprise Suite
250 – 5,000Employees
SMEExpress Suite
Below 250Employees
SMBExpress Lite Suite
ConsultantGroups
ConsultantsConsultant Suite
15
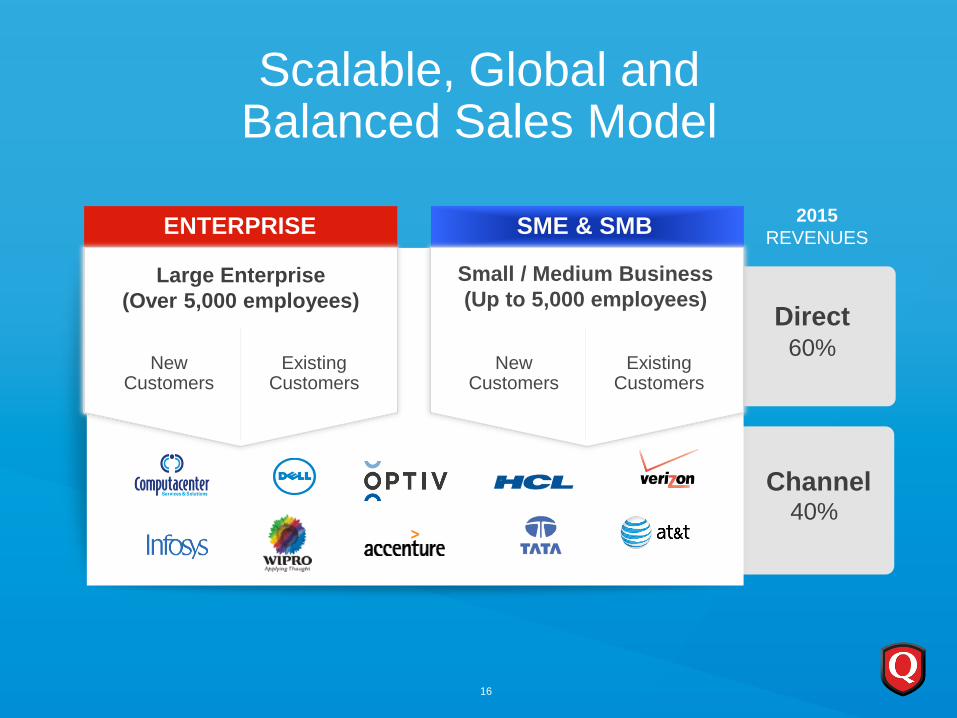
Scalable, Global and Balanced Sales Model
40%
Channel
60%
Direct
ENTERPRISE
Large Enterprise
(Over 5,000 employees)
NewCustomers
ExistingCustomers
SME & SMB
Small / Medium Business
(Up to 5,000 employees)
NewCustomers
ExistingCustomers
16
2015
REVENUES
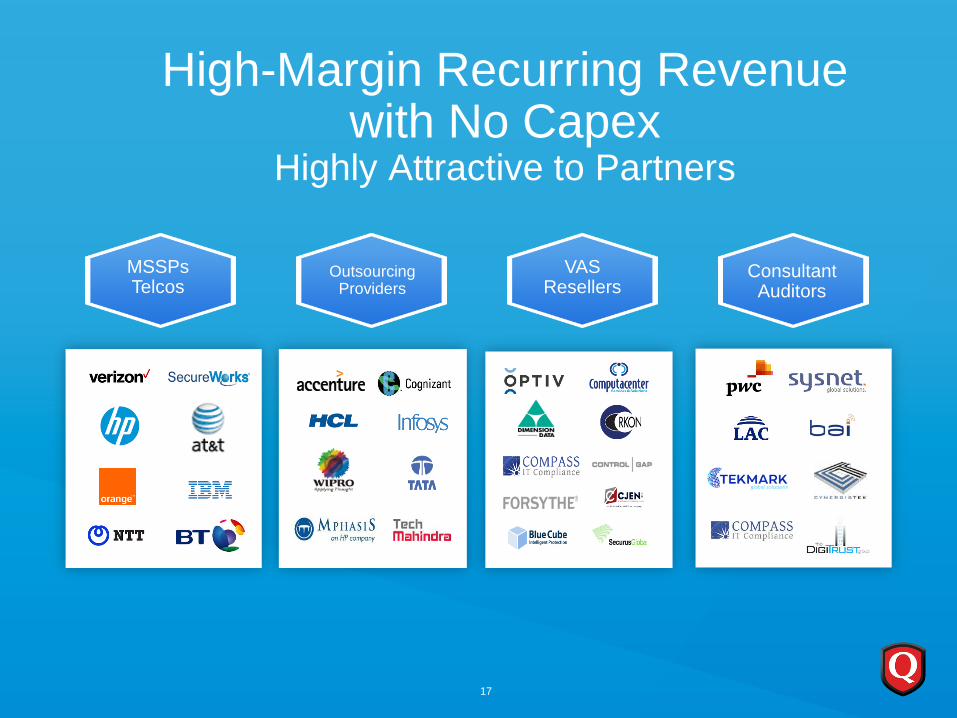
High-Margin Recurring Revenue with No Capex
Highly Attractive to Partners
MSSPsTelcos
VASResellers
ConsultantAuditors
OutsourcingProviders
17

SaaS Platform Enables Cost-Effective Marketing Through Try and Buy
New free service for
Asset Inventory and
CMDB integrations
Connects security
with IT
AssetView
FreeScan generates
25% of leads inflow
Free tool to test
drive all Qualys’s
services
FreeScan
Most popular SSL
Test on the Internet
250K unique users
and over 400K
tests per month
SSL Labs
18
Financial Highlights and Business Model

High Visibility Business Model
SaaS Subscription ModelSubscription, recurring revenue business
No professional services, license
or maintenance revenues
Billing ModelAnnual subscriptions, paid in advance
Average contract length 1.1 years
Billings charged to deferred revenue
and amortized over term
Global Customer BaseDiversified, high penetration of Forbes Global 1000
No customer concentration risk
20
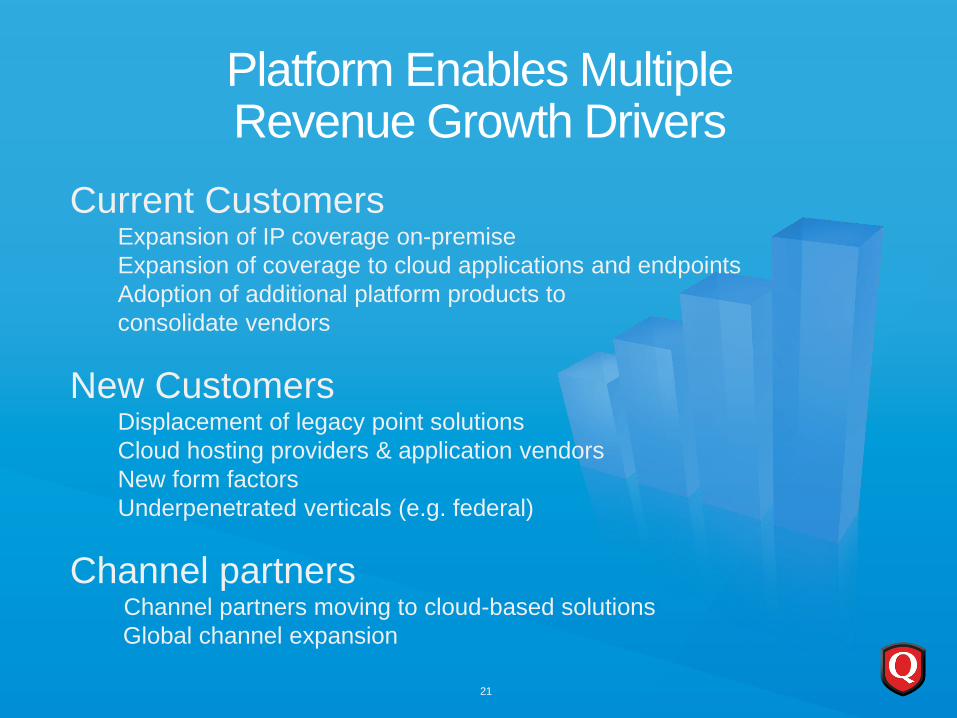
Platform Enables Multiple Revenue Growth Drivers
21
Current CustomersExpansion of IP coverage on-premise
Expansion of coverage to cloud applications and endpoints
Adoption of additional platform products to
consolidate vendors
New CustomersDisplacement of legacy point solutions
Cloud hosting providers & application vendors
New form factors
Underpenetrated verticals (e.g. federal)
Channel partnersChannel partners moving to cloud-based solutions
Global channel expansion
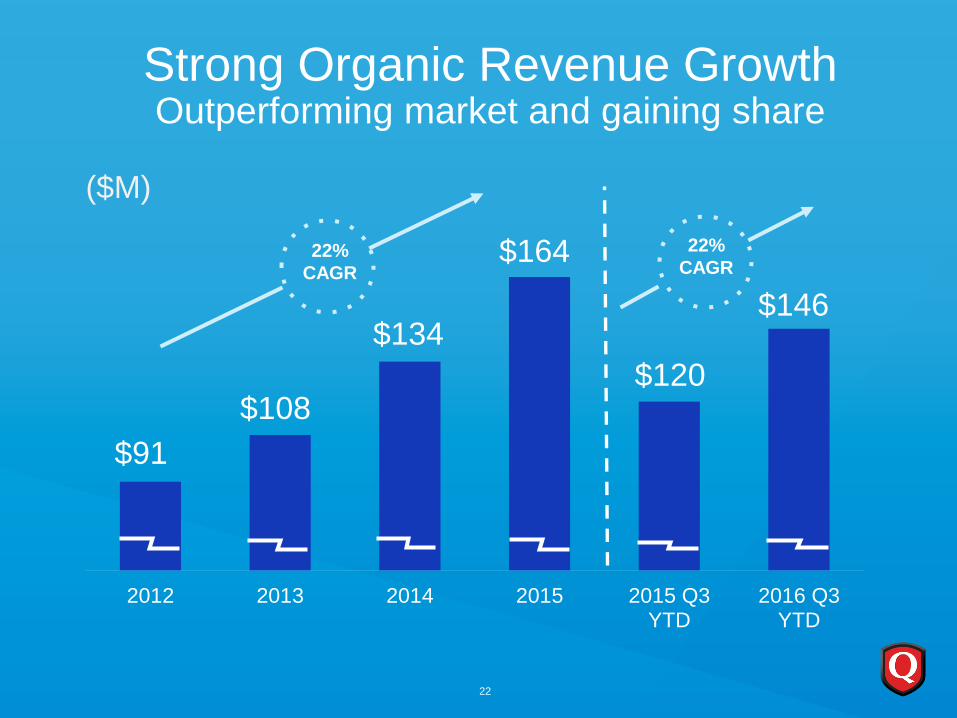
2012 2013 2014 2015 2015 Q3YTD
2016 Q3YTD
$164
$146
$120
Strong Organic Revenue Growth Outperforming market and gaining share
$91
$108
$134
22
($M)
22%
CAGR
22%
CAGR
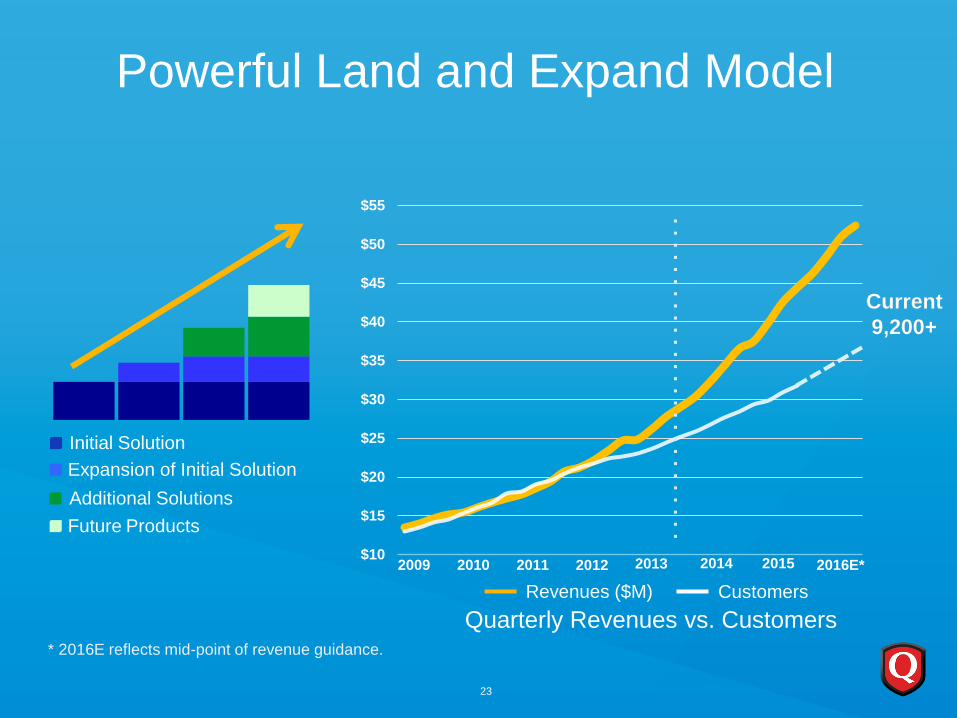
Powerful Land and Expand Model
$10
$15
$20
$25
$30
$35
$40
$45
$50
$55
Quarterly Revenues vs. Customers
Expansion of Initial Solution
Initial Solution
Additional Solutions
Future Products
2010 20122011 20132009
Revenues ($M) Customers
Current
9,200+
2014 2015
23
2016E*
* 2016E reflects mid-point of revenue guidance.
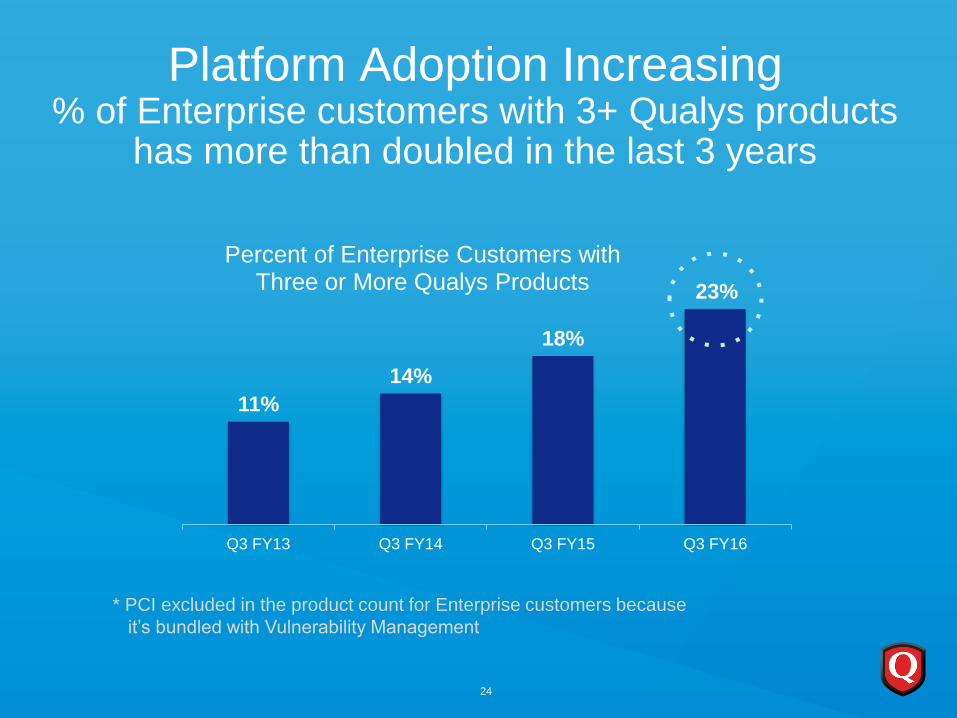
11%
14%
18%
23%
Q3 FY13 Q3 FY14 Q3 FY15 Q3 FY16
Percent of Enterprise Customers with Three or More Qualys Products
Platform Adoption Increasing% of Enterprise customers with 3+ Qualys products
has more than doubled in the last 3 years
24
* PCI excluded in the product count for Enterprise customers because
it’s bundled with Vulnerability Management

Platform Enables Scalable Operational Model
25
High Sales Productivity Leveraging Low Cost Geos
$0.8M$0.9M
$1.0M
2013 2014 2015
Revenue per S&M Headcount
15%
28%
36%
2013 2014 2015
% of Customer Support, Operations, and R&D
Headcount in India

Increasing Adjusted EBITDA& Operating Cash Flow
26
$14$17
$32
$57
2012 2013 2014 2015 2016 Q3YTD
$49
($M)
Adjusted
EBITDA
Operating
Cash Flow
Margin (%)
Adjusted EBITDA
Margin (%)
34%
15%
16%
24%
34%
$22$25
$41
$66
$55
2012 2013 2014 2015 2016 Q3 YTD
Operating
Cash Flow
24% 23%
31%
40%
38%

Industry-Leading Margins
27
* Source: JPMorgan
34%
2015 EBITDA Margin vs. Select Security Peers and SaaS PeersQualys
Peer Avg: (2%)
SaaS
Security

Scalable profitable business model
with industry-leading margins
Uniquely positioned to leverage the
adoption of cloud technology and
vendor / stack consolidation
28
Large and growing customer
base with increasing adoption
of multiple solutions
Qualys Cloud PlatformProvides continuous view of global IT assets
and of their security & compliance posture
Multiple levers of recurring
revenue growth
Appendix
29
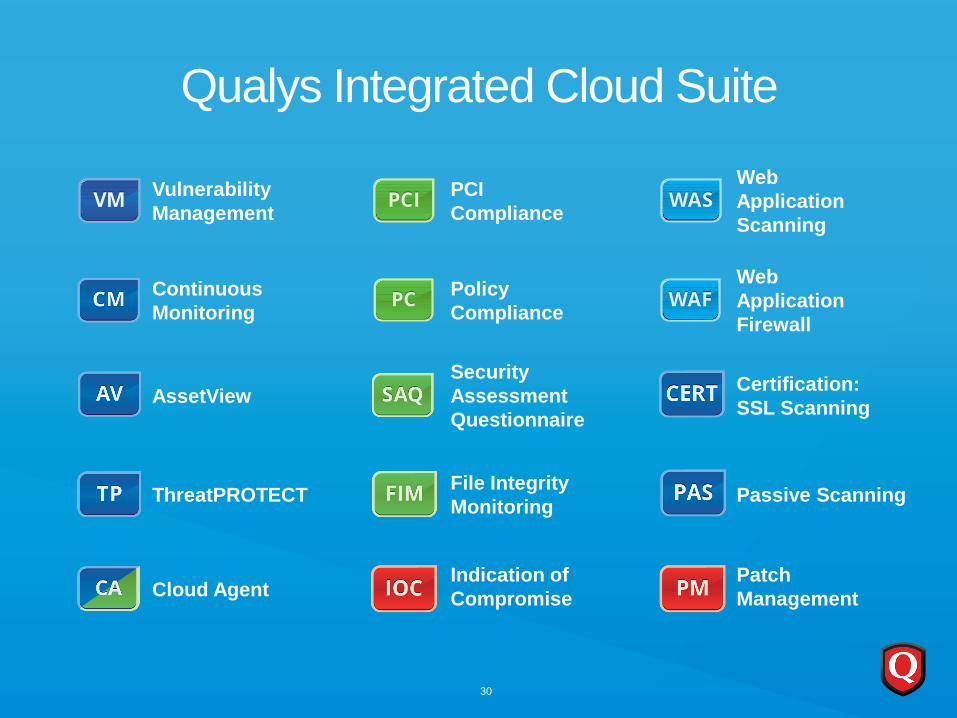
Qualys Integrated Cloud Suite
30
Vulnerability
Management
Continuous
Monitoring
AssetView
ThreatPROTECT
Cloud Agent
PCI
Compliance
Policy
Compliance
Security
Assessment
Questionnaire
File Integrity
Monitoring
Indication of
Compromise
Web
Application
Scanning
Web
Application
Firewall
Patch
Management
Certification:
SSL Scanning
Passive Scanning
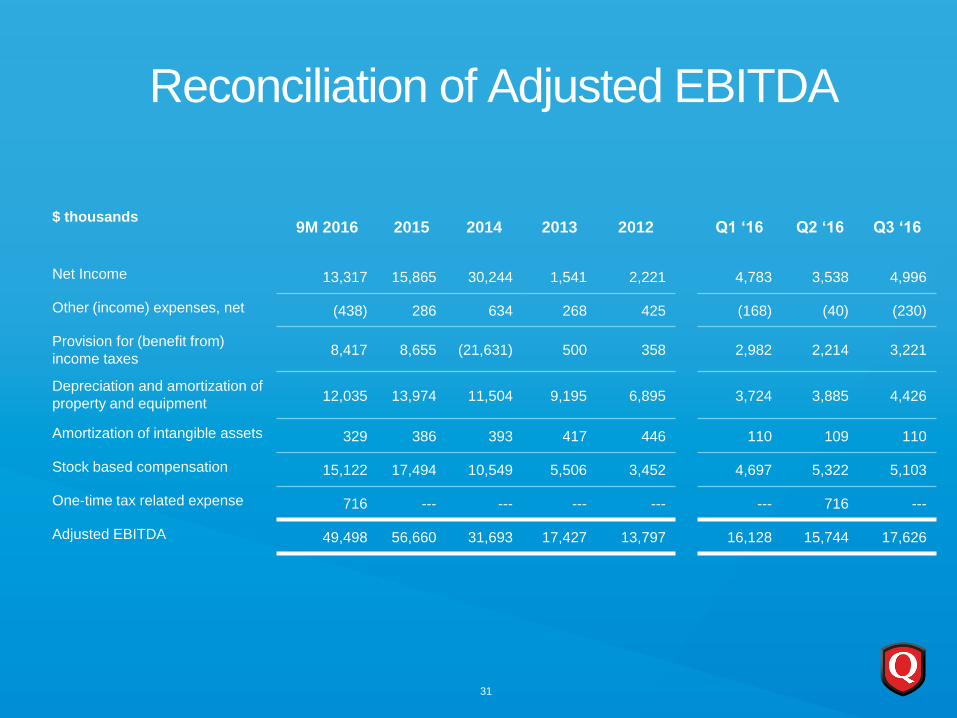
Reconciliation of Adjusted EBITDA
31
$ thousands9M 2016 2015 2014 2013 2012 Q1 ‘16 Q2 ‘16 Q3 ‘16
Net Income 13,317 15,865 30,244 1,541 2,221 4,783 3,538 4,996
Other (income) expenses, net (438) 286 634 268 425 (168) (40) (230)
Provision for (benefit from)
income taxes8,417 8,655 (21,631) 500 358 2,982 2,214 3,221
Depreciation and amortization of
property and equipment12,035 13,974 11,504 9,195 6,895 3,724 3,885 4,426
Amortization of intangible assets 329 386 393 417 446 110 109 110
Stock based compensation 15,122 17,494 10,549 5,506 3,452 4,697 5,322 5,103
One-time tax related expense 716 --- --- --- --- --- 716 ---
Adjusted EBITDA 49,498 56,660 31,693 17,427 13,797 16,128 15,744 17,626