Embed Size (px)
Citation preview

Quality Performance Measurement in CaliforniaFindings and Recommendations
Prepared for The Office of the Patient Advocate
ByUniversity of California, DavisCenter for Healthcare Policy and Research
December 2008
iiii
This UC Davis Center for Healthcare Policy and Research report was funded by the California Office of the Patient Advocate.
The views expressed in this report are those of the authors and interviewees and do not necessarily represent the views of the Center for Healthcare Policy and Research or the California Office of the Patient Advocate.
Copyright 2008 The Regents of the University of California. All Rights Reserved.
Citation: D Ritley, PS Romano, JA Rainwater. Quality Performance Measurement in California: Findings and Recommendation. Davis, CA: UC Davis Center for Healthcare Policy and Research, 2008.
iiiiii
Acknowledgements
This report was prepared by the UC Davis Center for Healthcare Policy and Research (CHPR). Members of the CHPR team included Dominique Ritley, MPH, Patrick Romano, MD, MPH and Julie Rainwater, PhD. CHPR would like to thank Sandra Perez, Ed Mendoza, and Dr. John Zweifler of the California Office of the Patient Advocate for providing direction to the CHPR project team. CHPR staff member, Tammy Gee, provided valuable support to the project through her note taking during interviews and assistance with compiling the quality measure inventories. We are indebted to Laura Bates Sterner for her design production and editorial assistance. In addition, we would like to acknowledge the contribution of the 29 healthcare stakeholder representatives who shared their time and expertise with us through the interview process. Their observations, opinions and suggestions informed many of the findings and recommendations in this report.
About The Center for Healthcare Policy and Research University of California, Davis
The University of California, Davis Center for Healthcare Policy and Research facilitates policy-relevant research in the areas of health care quality, access, delivery costs and outcomes. Established in 1994, the Center is an interdisciplinary unit comprised of UC Davis faculty and researchers with backgrounds in medicine, program evaluation, public policy, quality of care, survey research and statistics. The Center collaborates with other academic units, and provides research and consulting services for health care organizations, governmental agencies and private industry.
For more information regarding the Center for Healthcare Policy and Research, see http://www.ucdmc.ucdavis.edu/chpr/ or contact:
Center for Healthcare Policy and Research 2103 Stockton Boulevard, Suite 2224Sacramento, CA 95817Tel (916) 734-2818Fax (916) 734-8731

v
Table of Contents
I. Executive Summary 1OPA Background• 1QPM Project Objectives• 1Methods• 2Findings and Recommendations• 3
Data Gaps Revealed in Inventorieso 3OPA’s Role in Measurement and Public Reportingo 7Presentation and Dissemination of Report Card and Portal Information o 10
II. Introduction 13OPA Background• 13QPM Project Purpose• 13Project Methods• 14
III. Quality Performance Measurement Inventories 17Health Plans• 19
Findingso 20Physician Organizations • 24
Findingso 26Hospitals• 29
Findingso 31Nursing Homes• 33
Findingso 34Other Sources of Quality Measures • 36
Findingso 38
IV. Stakeholder Interviews 41 Current and Future Measures• 42 Gaps in Quality Measurement • 47 OPA’s Role in Quality Measurement and Public Reporting • 53
V. Findings and Recommendations 59Data Gaps Revealed in Inventories• 59OPA’s Role in Measurement and Public Reporting• 63Presentation and Dissemination of Report Card/ Portal Information• 66
VI. Appendices 69 A: Stakeholders Interviewed 69 B : Background Materials for Interviews 75 C: References 83 D: QPM Inventories 89
Health Planso 91Physician Organizationso 100Hospitalso 120Nursing Homeso 137“Other” Sourceso 147

University of California, DavisCenter for Healthcare Policy and Research
Chapter I: Executive Summary
11
I. Executive Summary
The Office of the Patient Advocate (OPA) contracted with the University of California, Davis Center for Healthcare Policy and Research (CHPR) to produce the Quality Performance Measurement in California report. This report sets forth recommendations to support the continued development of OPA’s Health Care Report Card and Health Care Quality Portal website based on findings from a two-step process: 1) producing a detailed inventory of quality measures available to California; and 2) conducting interviews with key health care stakeholders about current and future quality measures, gaps in measurement, and OPA’s role in quality measurement and reporting.
There is significant interest in planning a comprehensive strategy to improve the measurement of California’s health care quality and publicly report the results. This is evident through a growing number of health care industry initiatives and recent state government actions. Both California’s executive and legislative branches actively support the delivery of information about health care quality. Governor Schwarzenegger’s Executive Order (EO) S-06-07 in March 2007 set forward goals of improving quality transparency and accountability. In response to government interest, OPA committed to conducting a strategic review of the quality performance measurement (QPM) field to assist with its future planning for publicly reporting quality of care in California.
OPA BAckgrOund
OPA contributes significantly to the health care quality measurement field and plays an important role at the hub of California’s QPM efforts. It is an independent office within the Business, Transportation & Housing Agency and works closely with the Department of Managed Health Care to help enrollees secure health care services to which they are entitled. It is statutorily mandated to develop consumer education materials and programs informing consumers on their rights and responsibilities as health plan enrollees and publish an annual report card on the quality of care. OPA strives to be a neutral, reliable source of health care quality information for consumers and the health care industry.
After seven years of producing the California Health Care Quality Report card, OPA further improved its public reporting efforts by launching the Health Care “Quality Portal” website. In addition to continued publication of the Report Card, the new Portal supports consumer education by providing links to an array of health care quality-related sites that span the continuum of health care.
QPM PrOject OBjectivesThe objectives of the QPM project are:
To identify useful measures for reporting the quality of health care in California •To assess health care stakeholders’ use of current and future quality measures, their perceived •gaps in health care measurement, and their perceived role of OPA in quality measurement and public reporting
Quality Performance Measurement in CaliforniaFindings and Recommendations
University of California, DavisCenter for Healthcare Policy and Research22
To assist OPA in developing strategies that contribute to the development of a coordinated •and comprehensive set of publicly reported quality performance metrics for California
MethOdsThe QPM Inventory series is organized into five health care sectors to facilitate analysis and presentation (Appendix D).
Health Plans•Physician Organizations•Hospitals•Skilled Nursing Facilities•“Other” Sources of Quality Measures•
Each inventory includes:Name of Measure Set and Developer•Title/Brief Description of Quality Measure (individual and composite measures)•Organization Managing Quality Performance Data (by product line for health plan inventory)•Measure Relevance to Institute of Medicine (IOM) Domains of Quality Care•Measure Relevance to Life Cycle (pediatric, adult, geriatric)•Measure Relevance to Type of Care (preventive, acute, chronic)•Measure Relevance to Key Health Conditions •
OPA invited a diverse group of 31 health care stakeholders, based on their interest and/or expertise in quality performance measurement or public reporting, to participate in an hour long interview that solicited feedback on:
the comprehensiveness of the Inventories•current quality measures sponsored or used by their organization or agency and any planned •for the futureperceived measurement gaps•OPA’s role in quality measurement and reporting •
CHPR staff completed 29 interviews by telephone or in person during Spring 2008. Prior to the interviews, the respondent was provided with relevant background materials, including the Inventories for Health Plans, Physician Organizations, Hospitals, and “Other” Sources of Quality Measures.
LIMITATIONS: This report reflects measures available through June 2008. Some limitations may affect the findings of this report due to the ongoing process of creating, refining and retiring metrics. Also, the assignments to IOM Quality Domains, Type of Care, and Life Cycle are subjective in nature, but we believe this approach provides insight into where measurement gaps may exist. Finally, the opinions summarized here are those of the individual respondent and may not necessarily reflect the formal views of the organizations or agencies they represent.
Chapter I: Executive Summary
University of California, DavisCenter for Healthcare Policy and Research 3
Findings And recOMMendAtiOns There is a clear need for California to coordinate a statewide, common quality measurement system that reduces duplicative quality data collection efforts. OPA is well positioned to facilitate much of this work due to its positive reputation among a variety of stakeholders and its historic position in the hub of the California quality measurement and public reporting network, which includes stakeholders from both the private and public sectors.
The recommendations in this report suggest ways to fill existing measurement gaps, refine public reporting, and improve OPA’s communication efforts. OPA may choose to use these suggestions individually or in combination with one another. The recommendations suggest both short-term activities and long-term projects that will yield a more accurate and comprehensive view of health care quality in California.
Data Gaps Revealed in InventoriesThe five QPM Inventories revealed gaps in the availability of measures related to some IOM domains and health conditions. Finding 1: Data Gaps Throughout the five Inventories, the IOM’s Effectiveness domain (evidence-based avoidance of overuse of inappropriate care and underuse of appropriate care) had the most relevant number of quality indicators and provided the richest amount of quality data. The Patient-Centeredness (care is respectful and responsive to patient needs, preferences, and values) domain also had a significant number of related quality measures. Patient-centered measures were related mostly to the CAHPS patient experience survey series. Any information gaps found within the CAHPS survey topics are consistent across all providers because the core questions are essentially the same regardless of provider type.
The Safety and Timeliness domains (“avoidance of injury from care” and “wait times for care and harmful delays in care from patient or provider perspective,” respectively) had several quality measures sprinkled throughout each Inventory. The majority of Safety-related indicators reside in the Nursing Home and Hospital Inventories. The Timeliness indicators primarily related to administration of medications or patient perceptions of receiving timely care.
Recommendation 1A To shore up the number of reportable Safety indicators, OPA should continue to collaborate with the California Department of Public Health (CDPH) to report hospital adverse events (medical errors) and hospital acquired infection rates as available. Although data are not expected to be publicly available through CDPH until 2011, OPA may be able to assist CDPH by posting some data earlier on the existing OPA website. A link to the CDPH website should be maintained.
“Somebody needs to be delegated in California to help with this problem.”
—Reporting organization
“The measures aren’t the problem—it’s the implementation of measures based on ease of access to data.”
—Reporting organization
Quality Performance Measurement in CaliforniaFindings and Recommendations
University of California, DavisCenter for Healthcare Policy and Research4
Recommendation 1B OPA should translate the surgeon-specific data from OSHPD’s CABG surgery reports into consumer-friendly terms and post findings on its Portal site. This will boost the number of patient safety indicators publicly reported while making these results more accessible to consumers.
Recommendation 1C New physician safety-related metrics may soon be available for public reporting, and OPA should evaluate their suitability. Although sources, such as Medicare’s Physician Quality Reporting Initiative and Integrated Healthcare Association’s (IHA) P4P, do not yet publicly report individual physician metrics, OPA should advocate for the public release of this information and be prepared to report it when available.
Finding 2: Data Gaps Inventory analysis and stakeholder interviews confirmed that there is a dearth of indicators related to the IOM domains of Efficiency (avoidance of wasting resources) and Equity (care that does not vary based on population or individual characteristics). Although there are few Efficiency measures currently available, most quality reporting organizations reported a concerted effort to developing “efficiency of care” or “episodes of care” metrics. These metrics combine multiple interventions (e.g., pharmacy, lab, hospital and physician services) used to treat a health condition and capture the efficiency of care delivered. Theoretically, Equity can be measured using almost any quality indicator as long as sociodemographic data are collected and linked to the indicators.
Recommendation 2A To advance the development and implementation of Efficiency measures, OPA should advocate for the public use of reporting organizations’ proprietary “episodes of care” metrics that are under development (e.g., RAND or Thomson/MedStat) and track other emerging efficiency indicators (e.g., IHA and Hospital Value Initiative) to ensure their inclusion in the Portal once they are available.
Recommendation 2B OPA should work with its quality measurement and public reporting network (both public and private sectors) to construct a plan for collecting and reporting Equity measures at all levels of health care. For example, OPA should continue its effort to encourage the California Cooperative Healthcare Reporting Initiative (CCHRI) to
“The rubber hits the road with reporting on [individual] doctor and hospital providers.”
—Government agency
“You can drive quality of care with an ‘episodes of care’ approach. This is the future contracting strategy.”
—Reporting organization
“Equity is a derivative of the other five domains.”
—Reporting organization
Chapter I: Executive Summary
University of California, DavisCenter for Healthcare Policy and Research 5
use sociodemographic data already collected in the CAHPS survey. Also, if the results from an ongoing NCQA pilot project determine that (Medicare) plan data can be used to examine health disparities, OPA should advocate for matching Equity data with existing clinical quality measures and reporting health care disparities. Using pooled data may address concerns about appropriate sample sizes.
Finding 3: Data GapsStakeholders agreed that there are a sufficient number of quality measures available (some of “better quality than others”) and that reporting entities need to selectively choose indicators that reduce the data collection burden on providers. Stakeholders encouraged OPA to report on indicators that:
reflect variation in quality (significant differences)•provide opportunities for improvement •focus on elective interventions•target clinically important conditions (high cost or prevalence)•
Recommendation 3A Using this set of criteria, OPA should periodically review the indicators it publicly reports. Indicators with little variation or where opportunities for improvement are low or non-existent should be replaced with more informative indicators where provider or consumer actions will result in improvements. As a first step to determining the threshold for such decisions, OPA might consider convening a technical panel to review specific criteria.
Finding 4: Data GapsAcross the spectrum of health care stakeholders interviewed, most acknowledged or agreed that the more granular or discrete the reporting level the better. For example, most stakeholders believed that reporting at the individual physician level was crucial to consumer decision making and should be the next step in public reporting, and yet little information is publicly available by provider. There are many nationally-approved process and quality indicators measuring physician performance at the individual and organizational levels (see Physician Organizations Inventory in Appendix D for details).
One state initiative, CCHRI’s California Physician Performance Initiative (CPPI), collects data at the individual physician level with results privately reported to participating physicians. However, this initiative is in a pilot phase and concerns remain about data reliability and whether results are accurate enough for public reporting.
Recommendation 4A Reporting quality data at the individual physician level will take patience and tenacity. To help bridge the political chasm and push forward with reporting California physician quality, OPA should continue to work with IHA in reporting
“No measurement would ever come about if we waited for 100% participation—mandatory or otherwise.”
—Reporting organization
“Using administrative data is OK even though it is not perfect.”
—Reporting organization
“Measures that are heavily reported on generally aren’t ‘shoppable’ [elective] conditions.”
—Reporting organization
Quality Performance Measurement in CaliforniaFindings and Recommendations
University of California, DavisCenter for Healthcare Policy and Research6
quality by physician organization, and also should consider partnering with the California Associateion of Physician Groups (CAPG) to publicly report data from its proprietary Standards of Excellence survey (survey details on page 24). While the survey does not measure clinical quality, accepting CAPG’s invitation to share its results can serve as a critical step for OPA to establish a positive relationship with physician organizations.
Recommendation 4B OPA should consider supporting CCHRI in its effort to eventually publicly report individual physician performance data. As a neutral third-party, OPA can work with
vested stakeholders and advocate for establishing acceptable physician data collection methods to improve Californian’s access to useful, pertinent health care information. In addition, OPA’s support for expanding CCHRI (and IHA) data collection to include Medicare and Medi-Cal data would help address the issue of small denominators (which is a significant barrier to physician performance measurement) and permit more detailed, product line analyses.
Recommendation 4C In addition, participating in national initiatives, such as the Consumer-Purchaser Disclosure Project, (a national group of health care stakeholders that created a set of principles to guide measuring and reporting to consumers about doctors’ performance: http://healthcaredisclosure.org/), or Charter Value Exchanges (CVE description on page 25), would support OPA’s effort to bring individual physician performance results to the public. Participation in national initiatives also may allow California earlier access to national benchmark data to compare with California data.
Finding 5: Data GapsOPA chose to focus on nine key health conditions in the QPM Inventories. Of these, at least half had quality measures related to them. The most frequently measured conditions related to heart disease, cancer, asthma, and diabetes. Those health conditions less likely to have quality measures associated with them were mental health, COPD, reproductive health, hypertension, and musculoskeletal conditions.
In addition to the key conditions of interest, the Inventories also included metrics related to a handful of other health conditions and care methods including pneumonia (community-acquired), surgical infection prevention, stroke, gastroesophageal reflux disease, immunizations, and antibiotic timing. The vast majority of the conditions of interest to stakeholders were measured with hospital process or structure metrics rather than health outcomes metrics.
Recommendation 5A OPA should work with its quality measurement and public reporting network (both public and private sectors) to
“It is too easy to confuse the failure of society with the failure of individual provider.”
—Professional association
“What unit is of most interest to the consumer?”
—Government agency
Chapter I: Executive Summary
University of California, DavisCenter for Healthcare Policy and Research 7
periodically review the types of health conditions measured to ensure that the high cost or high prevalence conditions are included in public reporting (and replace those conditions not meeting the criteria). Specifically, OPA could collaborate with CDPH and OSPHD in 2009 on highlighting hospital-acquired infection rates.
Recommendation 5B OPA should report on its Portal site the progress of DMHC’s “Right Care Initiative,” which supports managed care plans efforts to meet the national 90th percentile goal for diabetes, heart disease, and hospital-acquired infection care. Information for consumers should include “Why this is important” information similar to the summaries offered in OPA’s Health Plan Report Card. As goals are met and new initiatives emerge, OPA’s focus should change to highlight other issues. Such an effort would demonstrate coordinated effort by California to improve quality of care.
OPA’s Role in Measurement and Public ReportingOPA enjoys a favorable reputation among the stakeholders interviewed due, in part, to its continued, inclusive efforts to solicit feedback from these organizations. Stakeholders believe OPA should continue to publicly report available quality measures, and it also should facilitate stakeholder discussions. However, stakeholders concluded that OPA should refrain from developing or mandating quality measures.
Finding 6: OPA’s Role Stakeholders from the public and private sectors perceived OPA as the appropriate, neutral organization for reporting health care quality data. Several stakeholders identified OPA as the appropriate entity to organize stakeholder discussions about publicly reporting information about quality.
In general, the Portal concept was supported and considered to be the appropriate location for communicating California’s health care information.
Several stakeholders advised that OPA refrain from developing clinical quality measures because other organizations are more qualified to create those types of quality indicators. One stakeholder specifically cautioned OPA to avoid this type of “mission creep.” Instead, OPA should report those measures endorsed by respected organizations, such as NQF or AQA.
Recommendation 6A OPA should engage the Health and Human Services and Business, Transportation and Housing Agencies, and the Governor’s office to coordinate health care quality measurement and reporting in California. A centralized, coordinated effort to measure and report quality across the health care spectrum would reduce the burden on providers and would ensure a robust and efficient quality performance reporting system.
“How much do we really do to get people to understand what the report cards mean?”
—Health plan
Quality Performance Measurement in CaliforniaFindings and Recommendations
University of California, DavisCenter for Healthcare Policy and Research8
Finding 7: OPA’s RoleStakeholders from all categories identified the need for OPA to clearly define the audience(s) or end-user(s) it serves. There are many groups with distinct interests that are interested in quality performance data (e.g., privately insured consumers, government agencies, policy makers, providers, etc.) and many stakeholders were confused as to which group(s) OPA serves.
Recommendation 7AOPA should reaffirm and clearly identify its target audiences, which should include managed health care members (including PPO subscribers), policy makers, researchers, and publicly-insured beneficiaries. OPA should consider making a “Research and Policy” tab more prominent by moving it to first level (green) bar rather than its current position at the second level (blue) bar under “Quality Report Card.” This new format would be more dynamic and permit repackaging of valuable quality data that would provide public decision makers with critical information applicable to the macro level. Specific reports may include product line comparisons, trend information, or regional variation in care. National benchmark data, California Independent Medical Review data, and white papers addressing emerging issues could be housed in this location as well.
Finding 8: OPA’s Role Government stakeholder comments about gaps in measures revealed that a tension exists between the increasing pressures on government entities to collect, analyze and publish quality data and the entities’ traditional regulatory role. Most of the government organizations related to health care are regulating bodies charged with enforcing state laws and regulations. Publicly reporting the quality of health care is a new role for most entities and one that requires more technical and financial support. OSHPD, CDI, MRMIB and DHCS were amenable to OPA’s assistance in public reporting.
Recommendation 8A OPA’s first overtures for government collaboration were made at its April 2008 “Public Reporting on Health Care Quality for California State Agencies” meeting and should be followed up with the interested departments. Specifically, OPA should continue to work with OSHPD to translate some of OSHPD’s valuable hospital quality data into lay terms for public reporting on OPA’s website. Choosing to report “elective” treatments that OSHPD studied would yield the most benefit to consumers.
Recommendation 8B Continued collaboration with CDI to post new PPO quality data results on the OPA and CDI websites is another suggestion for OPA. From a consumer perspective, it would be more efficient to have all PPO and HMO plan results published on one site rather than forcing consumers to toggle between multiple sites. Assuming CDI also publishes the PPO
“Create a [government] Quality Council to do joint problem solving with QM departments.”
—Government agency
“Who are you [OPA]? What is your goal?”
—Professional association
Chapter I: Executive Summary
University of California, DavisCenter for Healthcare Policy and Research 9
data on its own website, OPA should offer its Report Card template and reporting expertise to CDI to achieve a uniform presentation for consumers.
Recommendation 8C OPA should also continue to forge a reporting partnership with DHCS and MRMIB to provide quality data that are pertinent to their beneficiaries and are easily accessible
through the OPA website. This approach not only provides important quality performance information, but also permits these beneficiaries to use other helpful information links provided only through the Quality Portal site. Furthermore, reporting the public insurance system’s information about quality on the same site as commercial plan information
allows researchers and policy makers to compare product lines. Similar to the CDI approach, the same information could reside on the DHCS and MRMIB websites to increase the probability that consumers will access and use this information.
Finding 9: OPA’s Role Public reporting of quality data is increasing, but many stakeholders remarked that consumers are not considering the information in their health care decisions. Stakeholders speculated the reasons may be because:
ultimately, consumers have very little control over provider choices (especially those enrolled •in public insurance programs), the measures reported reflect conditions where patients have no choice in choosing care (heart •attack care versus maternity care), the measures are not at a specific enough level (“how does • my doctor rate?”), or the measures are not outcomes related. This observation relates to an aforementioned finding •that choosing the “correct” (useful and “actionable”) indicators are critical to effective public reporting.
Recommendation 9A To encourage more consumer use of data, OPA should facilitate a roundtable discussion with public and private sector stakeholders in and beyond California’s quality measurement hub. The meeting goal should focus on the types and number of quality
measures that California should be reporting. Possible agenda topics include culling non-informative metrics (due to no variation or standard met), choosing new metrics for conditions that are high cost/prevalence, identifying additional conditions for a public-private partnership to target for improvement (similar to DMHC’s “Right Care Initiative”), identifying funding needs and sources, increasing
decision maker use of such quality data, and creating a single data warehouse that pools data (i.e., lab, pharmacy, hospital and physician data, etc.) from the private and public sectors.
“How do we best serve the public and the consumer?”
—Professional association
“What could be done to move forward with the large inventory of measures?”
—Reporting organization
Quality Performance Measurement in CaliforniaFindings and Recommendations
University of California, DavisCenter for Healthcare Policy and Research10
Presentation and Dissemination of Report Card and Portal Information
Finding 10: Presentation and Dissemination of Portal InformationThe vast majority of stakeholders agreed that displaying information in a uniform manner is critical to effective communication with OPA’s audience(s). They believe that a consistent format would enhance the users’ understanding of quality data across service providers or product lines.
Stakeholder opinions about the most appropriate and effective presentation style varied, but there was consensus on the need to identify OPA’s audience before measures are selected and the results are communicated (Recommendation 7A). Once the audience was defined, agreement on a presentation style would be more easily achieved.
Recommendation 10A OPA should consider capitalizing on its current format to create “theme” tabs on its website. Tabs summarizing all quality measures (i.e., hospital, physician, and health plan) related to a particular population (e.g., children) or a health condition could be useful to consumers who would like to know more about the continuum of care.
Recommendation 10B Using the same tabular website design, OPA should redesign the box format to make all sectors of the health care industry (i.e., hospital, nursing home, etc.) more prominent and expand the data presented. For example, OPA could propose adopting CHCF’s CalNursingHome reporting system and publishing the results on the Portal under a “Nursing Home” tab. Alternatively, OPA could simply summarize or highlight CHCF’s key nursing home findings on the Portal and offer a link to the CHCF site.
Recommendation 10C Publishing on OPA’s website either specific or summary quality performance results from all health care sectors (rather than relying exclusively on website links to government departments) provides an opportunity for more consistent formatting and presentation. A uniform presentation can help the public understand complicated data and apply it comparatively.
Finding 11: Presentation and Dissemination of Portal InformationSome of the stakeholders encouraged OPA to study social marketing strategies to continue refining its consumer communication efforts.
Recommendation 11A OPA is in the process of exploring social marketing strategies and should share the QPM report findings with appropriate consultants to ensure consideration of issues such as determining OPA’s audience(s), and choosing appropriate reporting formats that accommodate multiple health care sectors (e.g., hospitals, health plans, physician organizations).
Chapter I: Executive Summary
University of California, DavisCenter for Healthcare Policy and Research 11
Finding 12: Presentation and Dissemination of Portal Information Stakeholders from different health care sectors believed that OPA could and should improve consumer awareness about its service.
Recommendation 12A Finding more opportunities throughout the year to promote the Report Card and Quality Portal website would benefit OPA, rather than relying on one annual press conference. For example, if a health plan is fined by DMHC, OPA could partner with DMHC to incorporate the Quality Portal website into the story. This would require designing a public relations campaign and encouraging OPA’s sister departments to promote the Report Card and Quality Portal.
Recommendation 12BOPA should consider collaborating with organized groups (i.e., legislators, health advocacy groups, consumer representatives, etc.) to sponsor “mini-town hall meetings” or “state of the state” presentations about health care quality (plans, physicians, hospitals, etc.) across California throughout the year.
Recommendation 12CAsking health plans, hospitals, physician groups and other government departments (i.e., CDI, CDPH, OSHPD, etc.) to add prominent links on their websites to OPA’s Quality Portal would also increase consumer awareness of OPA’s services and facilitate consumer education. (Six of the eight health plans profiled on the OPA Report Card link to the OPA website, but it frequently required a minimum of four clicks into the website before a link was found.)
Finding 13: Presentation and Dissemination of Portal Information Stakeholders’ comfort and familiarity with quality performance measurement and public reporting methods vary markedly. There appears to be great opportunity for more education in these two areas to build a solid and even foundation for stakeholders.
Recommendation 13A OPA should consider educating health care stakeholders in quality measurement and public reporting. OPA should continue sponsoring periodic seminars (i.e., “Lunch n’ Learn”) about both topics.
Finding 14: Presentation and Dissemination of Portal Information Many government colleagues mentioned that they could benefit from OPA’s years of experience in reporting quality.
“We would be happy to have OPA repackage our information to make it more ‘user friendly’ for consumers.”
—Government organization
“Do people know about the website? What has OPA done to promote the site to the public?”
—Government agency
Quality Performance Measurement in CaliforniaFindings and Recommendations
University of California, DavisCenter for Healthcare Policy and Research12
Recommendation 14A When possible, OPA could act as an “internal quality reporting consultant” to other state departments that need help with quality reporting. OPA provides a strategic link for quality performance measurement and reporting in California and it possesses useful knowledge and contacts. Formally designating an OPA staff person as an “internal consultant” would be helpful to OPA’s colleagues and may help push forward other QPM Report recommendations that rely on cooperation from these departments.
Recommendation 14BOPA may wish to act as a conduit between funding groups and state departments in need of enhancing quality reporting. OPA could monitor (through in-house staff or a contractor) possible sources of funding and communicate RFPs to a listserv of interested state departments.
University of California, DavisCenter for Healthcare Policy and Research
Chapter II: Introduction
1313
II. Introduction
At the national, state and local levels, the quality performance measurement (QPM) field continues to grow in importance and influence with the increasing demand for health care quality information and the resulting creation of new metrics for all health care industry sectors. California’s Office of the Patient Advocate (OPA) has played an important role in California’s health care quality measurement and public reporting since 2000 and is one of the principal organizations at the hub of California’s health care QPM efforts.
Interest in planning future measurement strategy for California is high. This is evident not only through the multitude of private industry initiatives, but also through government actions. Both the state’s executive and legislative branches actively support the delivery of quality performance information. Governor Schwarzenegger issued Executive Order (EO) S-06-07 in March 2007, which acknowledged OPA’s primary role in public reporting. Among many general mandates, the EO specifically requested that the State “collaborate with private and public entities to develop a quality reporting mechanism through the Office of the Patient Advocate” to provide relevant, reliable and useful quality health care information.
OPA BAckgrOundOPA is the primary state agency charged with publicly reporting managed health care quality-related information for consumer and industry use. In collaboration with various industry and consumer stakeholders, it annually publishes the Health Care Quality Report Card, which describes the quality of care delivered by commercial HMOs and PPOs (under Department of Managed Health Care jurisdiction), and medical groups in California. The report card is one way OPA fulfills its mission to inform consumers about their rights and responsibilities as HMO enrollees.
OPA’s public reporting expanded in November 2007 to publishing a Health Care Quality “Portal” website. This new website supports consumer education through the original Report Card, and offers links to an array of health care quality-related sites that span the continuum of health care.
QPM PrOject PurPOseIn tandem with the Governor and the state legislature’s recent quality measurement initiatives, OPA determined that it was necessary to conduct a strategic review of current quality measures to assist with its future planning.
OPA contracted with the University of California, Davis Center for Healthcare Policy and Research (CHPR) to study the current status of quality measurement in California, identify gaps in quality measurement and assess OPA’s role in quality performance reporting. The purpose of the Quality
Quality Performance Measurement in CaliforniaFindings and Recommendations
University of California, DavisCenter for Healthcare Policy and Research1414
Performance Measurement in California report is to provide OPA with recommendations for the continued development of its Report Card and Health Care Quality Portal.
The project objectives are:To identify useful measures for reporting the quality of health care in California•To assess health care stakeholders’ use of current and future quality measures, their perceived •gaps in health care measurement, and their perceived role of OPA in quality measurement and public reportingTo develop strategies for OPA that will result in publicly reporting a comprehensive set of •quality performance metrics for California
PrOject MethOdsTwo primary components inform the QPM report findings and recommendations: 1) an inventory of quality measures available for California’s use; and 2) interviews with key health care stakeholders about current and future quality measures, gaps in measurement, and OPA’s role in quality performance measurement and reporting.
Quality Performance Measurement InventoriesThe Inventory series is organized into five health care sectors to facilitate analysis and presentation (Appendix D).
Health Plans•Physician Organizations•Hospitals•Skilled Nursing Facilities•“Other” Sources of Quality Measures•
Each inventory includes:Name of Measure Set and Developer•Title/Brief Description of Quality Measure (individual and composite measures)•Organization Managing Quality Performance Data (by product line for health plan inventory)•Measure Relevance to Institute of Medicine (IOM) Domains of Quality Care•Measure Relevance to Life Cycle (pediatric, adult, geriatric)•Measure Relevance to Type of Care (preventive, acute, chronic)•Measure Relevance to Key Health Conditions •
UC Davis CHPR identified eligible quality performance measure sets through extensive website searches, expert opinion and referral, and personal interviews with key stakeholders identified by OPA. Research took place between September 2007 and January 2008. Periodic updates to the Inventories, based on stakeholder interviews and current industry publications, occurred through June 2008 to ensure inclusion of the most recent information. Only measure sets with metrics approved by leading national organizations (e.g., National Committee on Quality Assurance, AQA, National Quality Forum, etc.) that provided clear documentation and an established reporting system
Chapter II: Introduction
University of California, DavisCenter for Healthcare Policy and Research 15
were included in the Inventories. Specific measure sets cited during interviews meeting the same criteria were also included.
LIMITATIONS: The measure sets in the QPM field change frequently and the Inventories included in this report are as complete as possible through June 2008. This report does not include measures for ancillary services (i.e., laboratory, pharmacy, etc.) or for other types of health care facilities licensed through the California Department of Public Health. The report does not include measure sets that use proprietary metrics or methodologies that are not readily transparent (e.g., HealthGrades). Another possible limitation relates to assigning IOM Quality Domains, Type of Care, and Life Cycle stage to each measure. The assignments are subjective in nature, but do, at minimum, provide a threshold of where measurement gaps may exist.
Stakeholder InterviewsOPA identified and invited a diverse group of 31 health care stakeholder organizations to participate in an hour long interview that solicited feedback on the:
comprehensiveness of the Inventories,•current and future quality measures used by their organization or agency,•perceived measurement gaps, and•OPA’s role in quality measurement and reporting. •
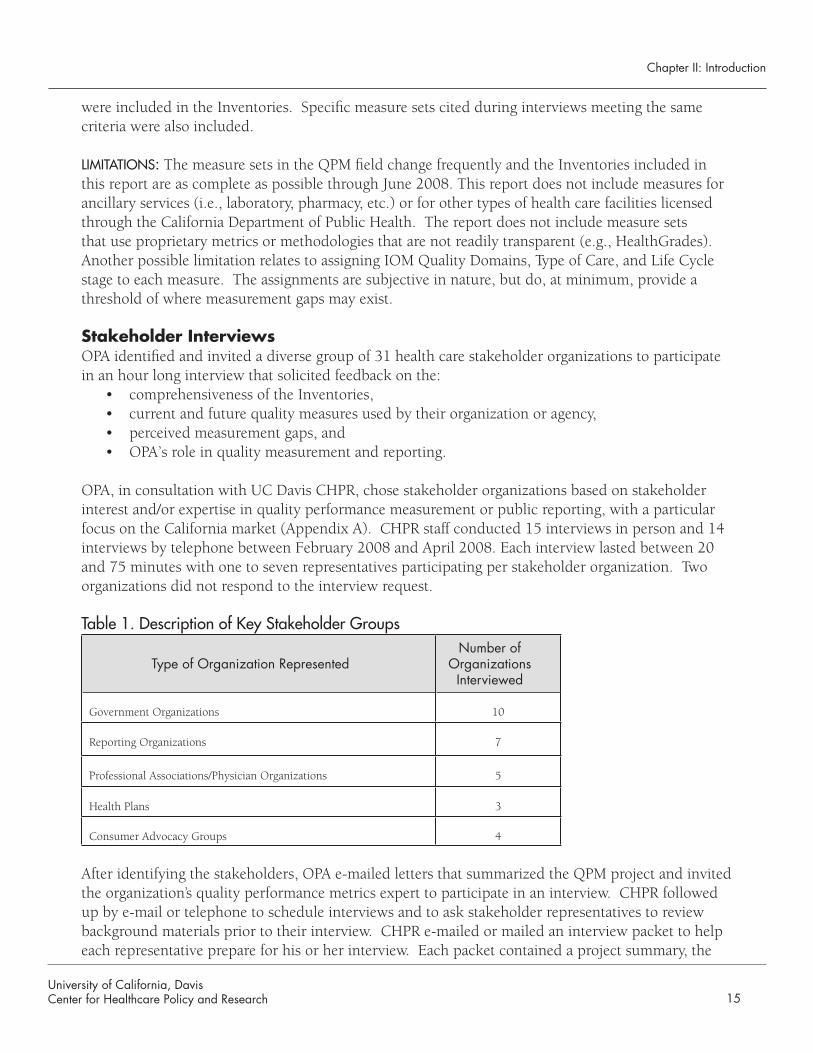
OPA, in consultation with UC Davis CHPR, chose stakeholder organizations based on stakeholder interest and/or expertise in quality performance measurement or public reporting, with a particular focus on the California market (Appendix A). CHPR staff conducted 15 interviews in person and 14 interviews by telephone between February 2008 and April 2008. Each interview lasted between 20 and 75 minutes with one to seven representatives participating per stakeholder organization. Two organizations did not respond to the interview request.
Table 1. Description of Key Stakeholder Groups
Type of Organization RepresentedNumber of
Organizations Interviewed
Government Organizations 10
Reporting Organizations 7
Professional Associations/Physician Organizations 5
Health Plans 3
Consumer Advocacy Groups 4
After identifying the stakeholders, OPA e-mailed letters that summarized the QPM project and invited the organization’s quality performance metrics expert to participate in an interview. CHPR followed up by e-mail or telephone to schedule interviews and to ask stakeholder representatives to review background materials prior to their interview. CHPR e-mailed or mailed an interview packet to help each representative prepare for his or her interview. Each packet contained a project summary, the
Quality Performance Measurement in CaliforniaFindings and Recommendations
University of California, DavisCenter for Healthcare Policy and Research16
interview protocol, inventories for Health Plans, Physician Organizations, Hospitals, and “Other” Sources of Quality Measures as well as a glossary (Appendix B). The Nursing Home Inventory was incomplete at the time of the interviews and was not included in the information packet.
LIMITATIONS: The opinions of the interviewees may not reflect the formal views of the organizations or agencies they represented. In most cases, stakeholders did not review the Inventories in detail prior to their interview.
University of California, DavisCenter for Healthcare Policy and Research
Chapter III: Quality Performance Measurement Inventories
1717
III. Quality Performance Measurement Inventory: Summaries and Findings
Surveying quality performance measures provides critical information for the continued development of OPA’s quality measurement and public reporting efforts. To organize the available quality measures, the UC Davis CHPR divided the measures into five separate Inventories: Health Plans, Physician Organizations (i.e., medical groups), Hospitals, Nursing Homes, and Other Sources of Quality Measures (Section II). As a series, the Inventories present the quality of care performance metrics available to California (some of which are already reported by OPA) at the time of this report. The Inventories help identify gaps and opportunities in quality measurement.
In addition to itemizing measures, each Inventory identifies the:Measure Set and Developer:• The developer creates and modifies, as needed, the quality measures. Some developers also collect and/or warehouse the data.Individual Measures within the set: • This category describes each measure contained in the set. Some measures are composites of multiple individual measures and are noted as such.Organization(s) Managing the Quality Data:• The organizations that collect, analyze and/or warehouse the performance measurement data frequently differ from the measure set developers.Measure relevance to the IOM Domains of Quality:• The Institute of Medicine’s (IOM) distinguished 2001 report, Crossing the Quality Chasm, identified six domains of quality care that are necessary to improving health: Safety, Effectiveness, Patient Centeredness, Timeliness, Efficiency, and Equity (defined in Table 2a). The Inventories’ measures are assigned to the relevant domain(s) to assess gaps in quality measurement.Stage(s) of the Human Life Cycle related to the measure: • The measures are assigned to the stage of the life cycle (pediatric, adult, geriatric) according to their denominator definitions. A measure can be relevant to more than one stage of the human life cycle.Type of Care: • The quality performance measures are also categorized according to whether they address preventive, acute, and/or management health care. Some measures may be relevant to more than one type of care. Key Health Conditions related to the measure:• OPA identified nine key health conditions to assess the gaps in the quality performance measures that are related to the following high prevalence and/or costly conditions: asthma, cancer, chronic obstructive pulmonary disease (COPD), diabetes, heart disease, hypertension, mental health, musculoskeletal, and reproductive health.
Quality Performance Measurement in CaliforniaFindings and Recommendations
University of California, DavisCenter for Healthcare Policy and Research1818
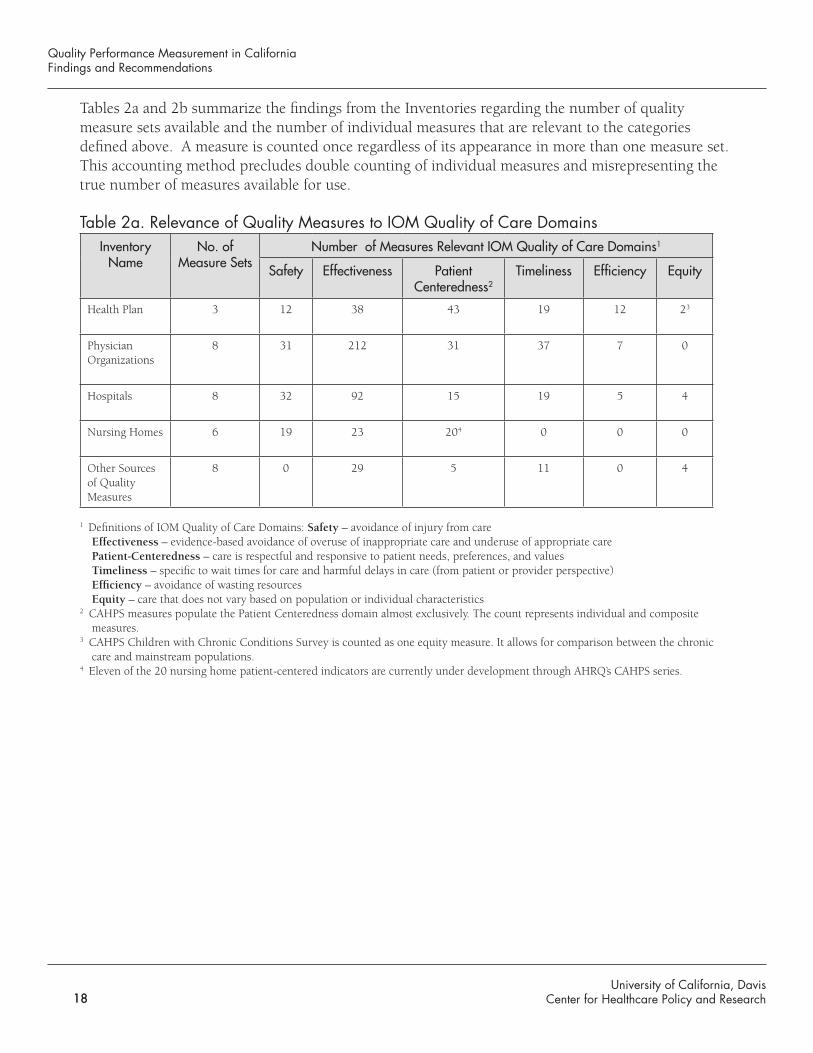
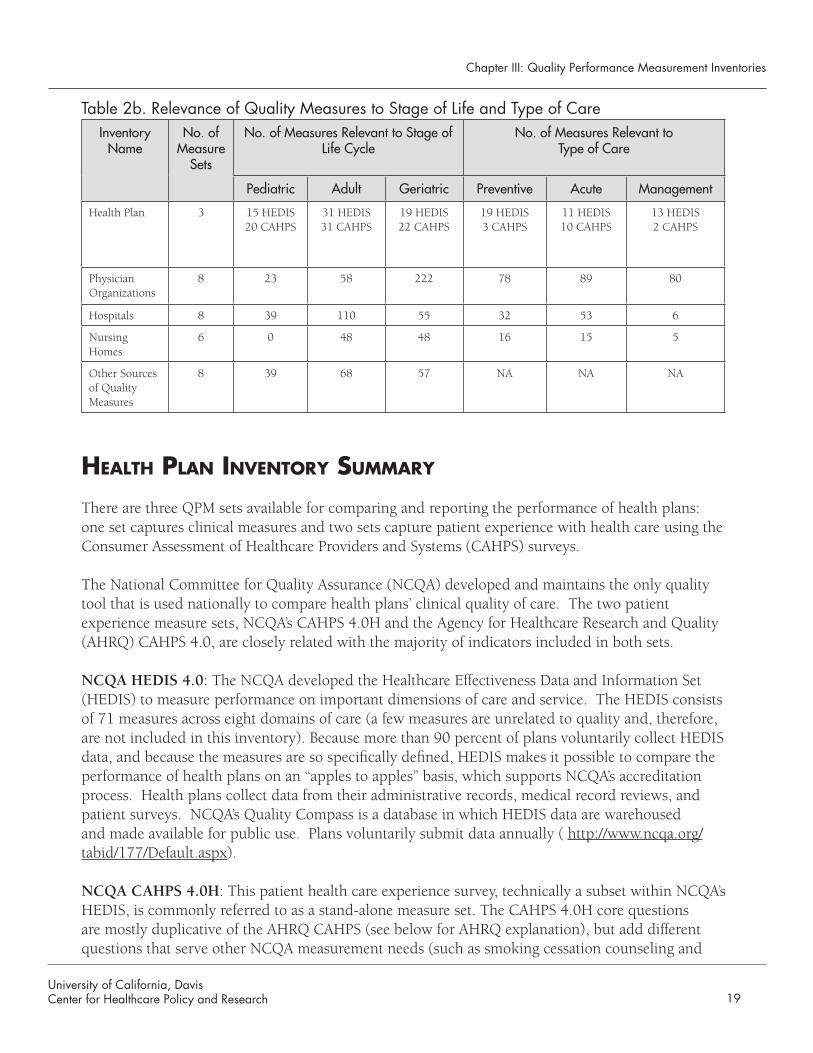
Tables 2a and 2b summarize the findings from the Inventories regarding the number of quality measure sets available and the number of individual measures that are relevant to the categories defined above. A measure is counted once regardless of its appearance in more than one measure set. This accounting method precludes double counting of individual measures and misrepresenting the true number of measures available for use.
Table 2a. Relevance of Quality Measures to IOM Quality of Care DomainsInventory
NameNo. of
Measure SetsNumber of Measures Relevant IOM Quality of Care Domains1
Safety Effectiveness Patient Centeredness2
Timeliness Efficiency Equity
Health Plan 3 12 38 43 19 12 23
Physician Organizations
8 31 212 31 37 7 0
Hospitals 8 32 92 15 19 5 4
Nursing Homes 6 19 23 204 0 0 0
Other Sources of Quality Measures
8 0 29 5 11 0 4
1 Definitions of IOM Quality of Care Domains: Safety – avoidance of injury from careEffectiveness – evidence-based avoidance of overuse of inappropriate care and underuse of appropriate carePatient-Centeredness – care is respectful and responsive to patient needs, preferences, and valuesTimeliness – specific to wait times for care and harmful delays in care (from patient or provider perspective)Efficiency – avoidance of wasting resourcesEquity – care that does not vary based on population or individual characteristics
2 CAHPS measures populate the Patient Centeredness domain almost exclusively. The count represents individual and composite measures.
3 CAHPS Children with Chronic Conditions Survey is counted as one equity measure. It allows for comparison between the chronic care and mainstream populations.
4 Eleven of the 20 nursing home patient-centered indicators are currently under development through AHRQ’s CAHPS series.
University of California, DavisCenter for Healthcare Policy and Research 19
Chapter III: Quality Performance Measurement Inventories
Table 2b. Relevance of Quality Measures to Stage of Life and Type of CareInventory
NameNo. of
Measure Sets
No. of Measures Relevant to Stage of Life Cycle
No. of Measures Relevant to Type of Care
Pediatric Adult Geriatric Preventive Acute Management
Health Plan 3 15 HEDIS20 CAHPS
31 HEDIS31 CAHPS
19 HEDIS22 CAHPS
19 HEDIS3 CAHPS
11 HEDIS10 CAHPS
13 HEDIS2 CAHPS
Physician Organizations
8 23 58 222 78 89 80
Hospitals 8 39 110 55 32 53 6
Nursing Homes
6 0 48 48 16 15 5
Other Sources of Quality Measures
8 39 68 57 NA NA NA
HealtH Plan Inventory Summary
There are three QPM sets available for comparing and reporting the performance of health plans: one set captures clinical measures and two sets capture patient experience with health care using the Consumer Assessment of Healthcare Providers and Systems (CAHPS) surveys.
The National Committee for Quality Assurance (NCQA) developed and maintains the only quality tool that is used nationally to compare health plans’ clinical quality of care. The two patient experience measure sets, NCQA’s CAHPS 4.0H and the Agency for Healthcare Research and Quality (AHRQ) CAHPS 4.0, are closely related with the majority of indicators included in both sets.
NCQA HEDIS 4.0: The NCQA developed the Healthcare Effectiveness Data and Information Set (HEDIS) to measure performance on important dimensions of care and service. The HEDIS consists of 71 measures across eight domains of care (a few measures are unrelated to quality and, therefore, are not included in this inventory). Because more than 90 percent of plans voluntarily collect HEDIS data, and because the measures are so specifically defined, HEDIS makes it possible to compare the performance of health plans on an “apples to apples” basis, which supports NCQA’s accreditation process. Health plans collect data from their administrative records, medical record reviews, and patient surveys. NCQA’s Quality Compass is a database in which HEDIS data are warehoused and made available for public use. Plans voluntarily submit data annually ( http://www.ncqa.org/tabid/177/Default.aspx). NCQA CAHPS 4.0H: This patient health care experience survey, technically a subset within NCQA’s HEDIS, is commonly referred to as a stand-alone measure set. The CAHPS 4.0H core questions are mostly duplicative of the AHRQ CAHPS (see below for AHRQ explanation), but add different questions that serve other NCQA measurement needs (such as smoking cessation counseling and
Quality Performance Measurement in CaliforniaFindings and Recommendations
University of California, DavisCenter for Healthcare Policy and Research20
influenza vaccination). This survey is administered annually to a sample of members by each commercial health plan. NCQA warehouses and makes public the survey results voluntarily submitted by health plans. Data are updated annually (http://www.ncqa.org/tabid/536/Default.aspx).
AHRQ CAHPS 4.0: The AHRQ CAHPS 4.0 is the original patient health care experience survey. Its core measure set consists of fewer questions than the NCQA version, however AHRQ permits numerous supplemental measures (related to chronic conditions, people with mobility impairments, and quality improvement) to be added at an individual health plan’s discretion. The National CAHPS Benchmark Database (NCBD), sponsored by AHRQ, warehouses all CAHPS data voluntarily submitted by plans. Data can be updated annually at the discretion of the participating plans. No plan-specific data are publicly available (https://www.cahps.ahrq.gov/content/products/PROD_AmbCareSurveys.asp?p=102&s=21).
HealtH Plan Inventory FIndIngS
Measure Developers and Data ManagersThe organizations that develop and modify the quality performance measure •sets for health plans frequently differ from those that collect, warehouse, and report the data. For example, NCQA develops and maintains the HEDIS measure set, but the California Cooperative Healthcare Reporting Initiative (CCHRI) manages the data collection and analysis for its member health plans. CCHRI works closely with OPA to publicly report the results (see inset box below). The same data are also submitted to NCQA by plans applying for NCQA accreditation.
Duplication of MeasuresThe HEDIS clinical indicators are unique and not duplicated elsewhere in •the Health Plan Inventory. However, NCQA’s core CAHPS 4.0H indicators repeat those indicators appearing in the AHRQ CAHPS 4.0 set. In addition to the core set, the AHRQ CAHPS offers a substantial number of supplemental indicators that are left to the health plan’s discretion for inclusion.
University of California, DavisCenter for Healthcare Policy and Research 21
Chapter III: Quality Performance Measurement Inventories
California LevelThe California Cooperative Healthcare Reporting Initiative (CCHRI) supports HEDIS (includ-ing CAHPS) data collection and data analysis for its membership, the largest health plans in California. This collaborative of health plans, employers, and other stakeholders ensures com-parable performance measurement methodologies and rigorous quality data collection for plans within California. Although HEDIS measures are determined by and data are submitted to NCQA, CCHRI is the organization, rather than NCQA, that collaborates with OPA to publicly report California health plan results.
National LevelHMOs, PPOs, Medicare Advantage, and Medicaid managed care plans report HEDIS data to NCQA’s Quality Compass database to gain coveted accreditation. The HEDIS measure set per-mits fair comparison between plans nationwide. CAHPS 4.0 (AHRQ) results can be obtained for commercial health plans, Medicare, Medicaid, and State Children’s Health Insurance Program (SCHIP) managed care plans through AHRQ’s NCBD, a repository for data submitted voluntarily by health plans. Beginning in 2007, the NCBD also obtained commercial health plan CAHPS data submitted to NCQA. The NCBD will continue to receive Medicaid data from States and other plans that may or may not submit data to the NCQA. By arrangement, the NCQA generates Medicaid and SCHIP “sponsor reports” that are case-mix adjusted (unlike NCQA’s own reports). Requests for CAHPS results for Medi-Cal and Healthy Families health plans must be directed to their respective state regulatory agencies. The NCBD does not permit public access to plan-specific data.
Levels of ReportingBecause NCQA requires health plans to submit HEDIS 4.0 (including •CAHPS 4.0H) quality data for NCQA accreditation, the vast majority of HMOs in California and nationwide participate in this process. Recently PPO participation increased markedly. This permits valid and reliable comparisons of health plan performance in various combinations:
California (state aggregate) to national benchmark •California plan to California state or national benchmark •Among California plans •
HEDIS health plan data are not currently organized or reported at the county •(except Medi-Cal) or regional levels.
In addition to different reporting cycles, which make comparisons between •public sector and private sector health plans challenging, the different geographic areas captured in the data provide challenges. For example, Medi-Cal plans report HEDIS results by county, whereas Healthy Families plans and commercial plans cover a much wider geographic area.
Quality Performance Measurement in CaliforniaFindings and Recommendations
University of California, DavisCenter for Healthcare Policy and Research22
Data CollectionBoth the CCHRI (state level) and NCQA and AHRQ/NCBD (national •levels) collect and warehouse CAHPS core measures. However, the AHRQ CAHPS survey is voluntary and unrelated to accreditation, unlike the NCQA-based CAHPS. Because AHRQ offers no incentives or penalties to encourage participation, health plan participation is variable, greatly reducing comparatibility for public reporting purposes. This is especially true with regard to the CAHPS supplemental items that are inconsistently administered and reported.
There is a great deal of overlap in CAHPS measures that different HMO •product lines use (e.g., commercial HMO, Medicare managed care, Healthy Families and Medi-Cal Managed Care product lines). However, product line comparisons are challenging due to the inconsistency of where plans submit data (NCQA or AHRQ), the measures used (core or supplemental) and the frequency of administering the survey.
Relevance to IOM DomainsThe Effectiveness and Patient-Centered domains contain the most quality •related measures.
The Timeliness, Efficiency, and Safety domains have far fewer related •measures.
There are essentially no equity-related measures. HEDIS 4.0 does not capture •demographic information, thus limiting its use for measuring equity between various populations. NCQA is considering the addition of such information in a future HEDIS version.
Product Line ComparisonsPrivate sector commercial health plans (HMOs and PPOs) and Medicare •managed care plans report the most HEDIS and CAHPS measures of any group. California’s MRMIB reports 12 HEDIS clinical indicators and the core CAPHS indicators for the Healthy Families program. Other MRMIB programs (AIM and MRMIP) do not track quality of care indicators. Medi-Cal typically requires their contracted plans to report 12 HEDIS clinical indicators and the core CAHPS indicators.
Product line comparisons may be possible on a limited basis provided that •data are collected for the same time period. For example, CalPERS, Medi-Cal and Healthy Families include the following HEDIS measures: Immunization Combo 2 and Combo 3, appropriate upper respiratory infection treatment, appropriate medicine for asthma, and chlamydia screening. However, the public programs have difficulty collecting data annually due to budget
University of California, DavisCenter for Healthcare Policy and Research 23
Chapter III: Quality Performance Measurement Inventories
constraints. This can make comparisons difficult because measurement can occur during different time periods.
Life Cycle
The human life cycle (pediatric, adult and geriatric) is another useful tool •for assessing the breadth of quality performance measures available to a population. HEDIS and CAHPS measures focus much more frequently on adults than on the pediatric or geriatric populations.
Type of CareThe quality performance measures are also categorized according to whether •they address preventive, acute, and/or management health care.
19 HEDIS and 3 CAHPS measures are related to preventive care•11 HEDIS and 10 CAHPS measures are related to acute care•13 HEDIS and 2 CAHPS measures are related to disease/condition •management care
Key Health ConditionsThe HEDIS measures in the Health Plan Inventory are fairly well distributed •among the nine key health conditions. Heart disease (6), mental health (4), cancer (4), musculoskeletal (4) and COPD (4) have the most measures while reproductive health (3) and asthma (1 measure with three age groupings) have fewer measures. Diabetes has one large composite measure composed of nine individual indicators that are reported separately and rolled into a composite. Other conditions with quality measures include immunizations, dental health, and well-child visits.
Gaps in Health Plan Measures or ReportingThere is a large gap in measuring the IOM domains of • Equity and Efficiency. Although CAHPS surveys collect limited demographic data, these data are not commonly used in quality care reports because member-level data are retained by the participating plans. HEDIS does not collect these data and some health plans incorrectly believe that it is illegal to collect such data from plan members. There are very few Efficiency measures, although efforts to create such measures are ongoing.
PPOs regulated by the California Department of Insurance (CDI) do not •publicly report HEDIS or CAHPS measures leaving a portion of the insured California population with no quality performance information upon which to make informed decisions. CDI plans to introduce a report card in 2009 that includes HEDIS and CAHPS indicators.
Quality Performance Measurement in CaliforniaFindings and Recommendations
University of California, DavisCenter for Healthcare Policy and Research24
PHySIcIan organIzatIon Inventory Summary
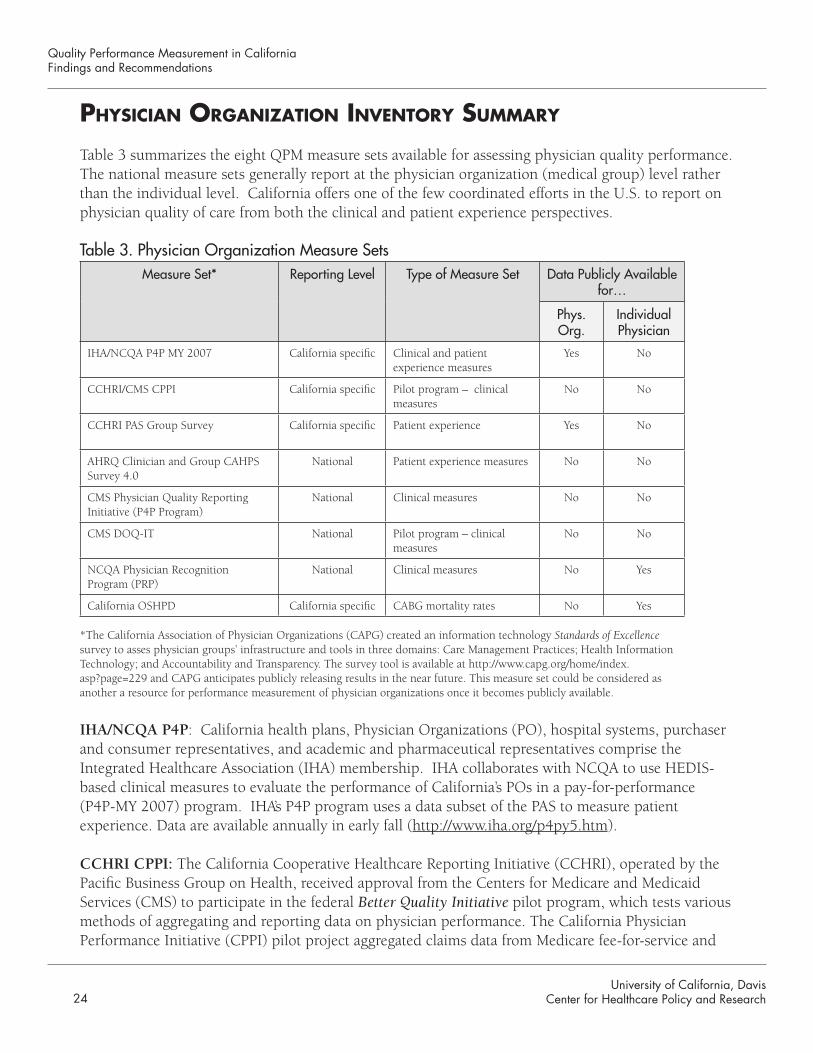
Table 3 summarizes the eight QPM measure sets available for assessing physician quality performance. The national measure sets generally report at the physician organization (medical group) level rather than the individual level. California offers one of the few coordinated efforts in the U.S. to report on physician quality of care from both the clinical and patient experience perspectives.
Table 3. Physician Organization Measure SetsMeasure Set* Reporting Level Type of Measure Set Data Publicly Available
for…
Phys. Org.
Individual Physician
IHA/NCQA P4P MY 2007 California specific Clinical and patient experience measures
Yes No
CCHRI/CMS CPPI California specific Pilot program – clinical measures
No No
CCHRI PAS Group Survey California specific Patient experience Yes No
AHRQ Clinician and Group CAHPS Survey 4.0
National Patient experience measures No No
CMS Physician Quality Reporting Initiative (P4P Program)
National Clinical measures No No
CMS DOQ-IT National Pilot program – clinical measures
No No
NCQA Physician Recognition Program (PRP)
National Clinical measures No Yes
California OSHPD California specific CABG mortality rates No Yes
*The California Association of Physician Organizations (CAPG) created an information technology Standards of Excellence survey to asses physician groups’ infrastructure and tools in three domains: Care Management Practices; Health Information Technology; and Accountability and Transparency. The survey tool is available at http://www.capg.org/home/index.asp?page=229 and CAPG anticipates publicly releasing results in the near future. This measure set could be considered as another a resource for performance measurement of physician organizations once it becomes publicly available.
IHA/NCQA P4P: California health plans, Physician Organizations (PO), hospital systems, purchaser and consumer representatives, and academic and pharmaceutical representatives comprise the Integrated Healthcare Association (IHA) membership. IHA collaborates with NCQA to use HEDIS-based clinical measures to evaluate the performance of California’s POs in a pay-for-performance (P4P-MY 2007) program. IHA’s P4P program uses a data subset of the PAS to measure patient experience. Data are available annually in early fall (http://www.iha.org/p4py5.htm).
CCHRI CPPI: The California Cooperative Healthcare Reporting Initiative (CCHRI), operated by the Pacific Business Group on Health, received approval from the Centers for Medicare and Medicaid Services (CMS) to participate in the federal Better Quality Initiative pilot program, which tests various methods of aggregating and reporting data on physician performance. The California Physician Performance Initiative (CPPI) pilot project aggregated claims data from Medicare fee-for-service and
University of California, DavisCenter for Healthcare Policy and Research 25
Chapter III: Quality Performance Measurement Inventories
three commerical PPOs in California as part of a national effort to establish physician performance standards. Results from 15 clinical quality measures are privately reported to physicians (http://www.cchri.org/programs/programs_CPPI.html).
Chartered Value Exchanges: Future Data Source
CCHRI and OPA are part of the recently formed California Chartered Value Exchange. A Chartered Value Exchange (CVE) is a local multi-stakeholder collaborative. Composed of purchasers, health plans, providers, and consumers, the CVEs work to improve care and make provider quality and pricing data widely available as part of the federal Value-Driven Health Care initiative. The CVEs have access to a Learning Network sponsored by AHRQ, which features decision tools, access to experts, and a private Web-based knowledge management system. Specially designated CVEs have access to a summary Medicare provider performance dataset, which can be combined with commercial sector data to produce and publish all-payer performance re-sults. (This CMS data set differs from another data set that CMS provided to the Better Quality Initiative groups, which are also involved in physician measurement.)
CCHRI PAS Group Survey: The CCHRI also sponsors the Patient Assessment Survey (PAS) Group Survey. This cooperative of California health plans, POs, and purchasers assists physician organizations with measuring their patients’ health care experience. Closely aligned with AHRQ’s Clinician and Group CAHPS survey, the PAS focuses on areas of particular interest to California and topics that support IHA’s P4P program. There are separate, but similar, PAS surveys for primary care physicians, specialists, and pediatricians. Data for California POs and individual physicians are collected and managed by CCHRI and reported annually (http://www.cchri.org/programs/programs_pas.html).
AHRQ Clinician and Group CAHPS Survey 4.0: The Agency for Healthcare Research and Quality (AHRQ) Clinician and Group Consumer Assessment of Healthcare Providers and Systems (CAHPS) Survey 4.0 data are collected at the PO level by the physician organization and submitted to the National CAHPS Benchmarking Database (NCBD) annually. Data are submitted voluntarily from POs across the U.S and can be accessed only by those contributing data. Data are not available to the public (https://www.cahps.ahrq.gov/content/products/CG/PROD_CG_CG40Products.asp). CMS Physician Quality Reporting Initiative--P4P Program: The voluntary PQRI-P4P program is sponsored by the Centers for Medicare and Medicaid Services (CMS) and pays individual physicians annually for reporting specified clinical quality measures related to fee-for-service Medicare patients. Measurement results are derived from administrative/billing data. The data are not publicly available at this time (http://www.cms.hhs.gov/pqri/).
CMS DOQ-IT: The Centers for Medicare and Medicaid Services created the Doctors’ Office Quality–Information Technology (DOQ-IT) pilot program. Similar in purpose to the CMS P4P Program, these data are pulled exclusively from electronic health records of Medicare beneficiaries rather
Quality Performance Measurement in CaliforniaFindings and Recommendations
University of California, DavisCenter for Healthcare Policy and Research26
than administrative or billing records. Data submission by physicians is voluntary with no financial incentive to participate. Data are not publicly available at this time (http://providers.ipro.org/index/doqit).
NCQA Physician Recognition Program (PRP): NCQA developed and manages a program to publicly recognize physicians meeting clinical requirements for appropriate care in these areas: Back Pain, Heart/Stroke, Diabetes, and Primary Care Medical Home. Physicians who seek official recognition from NCQA submit appropriate data voluntarily (http://www.ncqa.org/tabid/58/Default.aspx).
California OSHPD: Every two years, OSHPD reports on surgeon-specific, risk-adjusted CABG surgery outcomes. Hospitals submit data to OSHPD annually (http://www.oshpd.ca.gov/HID/Products/Clinical_Data/CABG/03-04Breakdown.html). (Of note: There is precedent for limited public reporting about some surgeon outcomes in a few other states including New York and Pennsylvania.)
PHySIcIan organIzatIon Inventory FIndIngS
Measure Developers and Data ManagersUnlike the measure sets in the Health Plan Inventory, the PO measure set •developers are the same organizations that warehouse the resulting data.
Of the eight measure sets, two sets publicly report individual physician scores •(OSHPD-CABG Mortality Rates by Surgeon and NCQA PRP).
The measure sets developed by AHRQ CG CAHPS 4.0, PQRI-P4P Program, •and DOQ-IT collect data nationwide at the physician group level and at the individual physician level, however data are typically used for internal quality improvement efforts and are not publicly reported.
The NCBD warehouses data collected from POs nationwide and includes •CAHPS survey data from multiple product lines.
CMS collects and warehouses PO data (specific to its Medicare fee-for-service •population) from the CMS P4P Program and the CMS DOQ-IT pilot program.
There are two California-specific resources for publicly reporting individual •physician performance:
1) CCHRI and IHA assist California physician organizations with the collection and analysis of their clinical measures and patient experience survey data. Both organizations work closely with OPA to publicly report the results at the PO level; and 2) OSHPD reports on surgeons’ risk-adjusted CABG surgery outcomes.
University of California, DavisCenter for Healthcare Policy and Research 27
Chapter III: Quality Performance Measurement Inventories
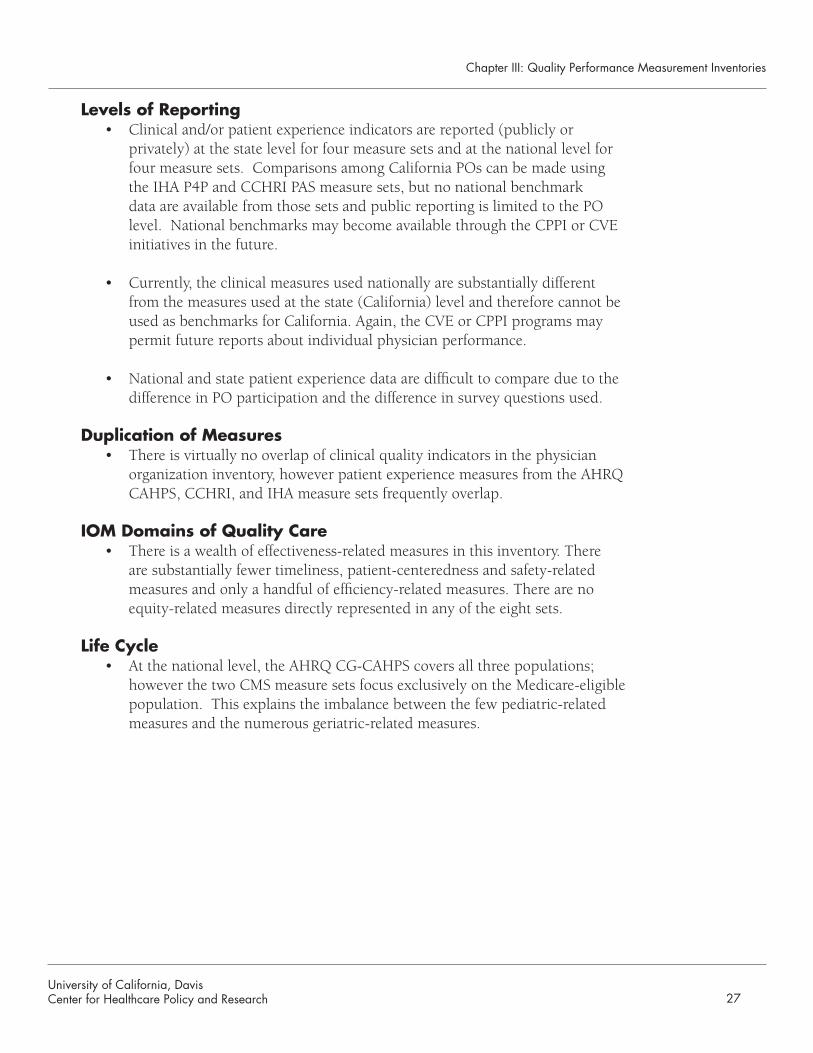
Levels of ReportingClinical and/or patient experience indicators are reported (publicly or •privately) at the state level for four measure sets and at the national level for four measure sets. Comparisons among California POs can be made using the IHA P4P and CCHRI PAS measure sets, but no national benchmark data are available from those sets and public reporting is limited to the PO level. National benchmarks may become available through the CPPI or CVE initiatives in the future.
Currently, the clinical measures used nationally are substantially different •from the measures used at the state (California) level and therefore cannot be used as benchmarks for California. Again, the CVE or CPPI programs may permit future reports about individual physician performance.
National and state patient experience data are difficult to compare due to the •difference in PO participation and the difference in survey questions used.
Duplication of MeasuresThere is virtually no overlap of clinical quality indicators in the physician •organization inventory, however patient experience measures from the AHRQ CAHPS, CCHRI, and IHA measure sets frequently overlap.
IOM Domains of Quality Care
There is a wealth of effectiveness-related measures in this inventory. There •are substantially fewer timeliness, patient-centeredness and safety-related measures and only a handful of efficiency-related measures. There are no equity-related measures directly represented in any of the eight sets.
Life CycleAt the national level, the AHRQ CG-CAHPS covers all three populations; •however the two CMS measure sets focus exclusively on the Medicare-eligible population. This explains the imbalance between the few pediatric-related measures and the numerous geriatric-related measures.
Quality Performance Measurement in CaliforniaFindings and Recommendations
University of California, DavisCenter for Healthcare Policy and Research28
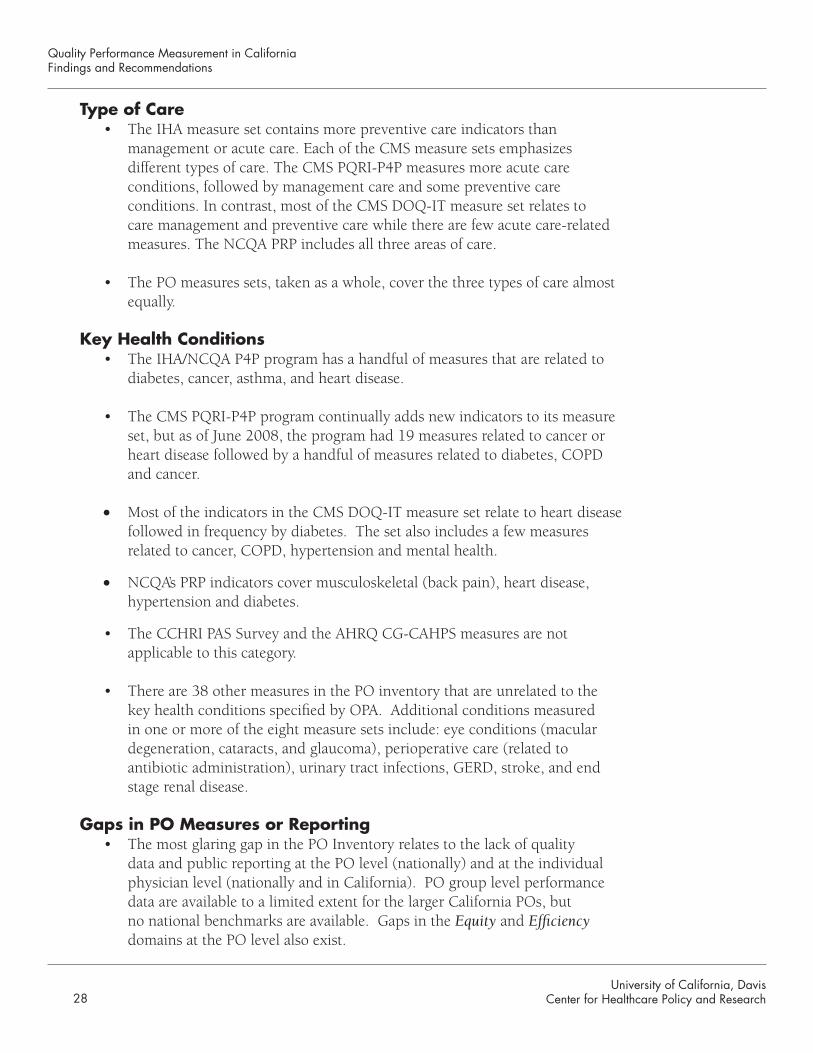
Type of Care The IHA measure set contains more preventive care indicators than •management or acute care. Each of the CMS measure sets emphasizes different types of care. The CMS PQRI-P4P measures more acute care conditions, followed by management care and some preventive care conditions. In contrast, most of the CMS DOQ-IT measure set relates to care management and preventive care while there are few acute care-related measures. The NCQA PRP includes all three areas of care.
The PO measures sets, taken as a whole, cover the three types of care almost •equally.
Key Health Conditions The IHA/NCQA P4P program has a handful of measures that are related to •diabetes, cancer, asthma, and heart disease.
The CMS PQRI-P4P program continually adds new indicators to its measure •set, but as of June 2008, the program had 19 measures related to cancer or heart disease followed by a handful of measures related to diabetes, COPD and cancer.
Most of the indicators in the CMS DOQ-IT measure set relate to heart disease •followed in frequency by diabetes. The set also includes a few measures related to cancer, COPD, hypertension and mental health.
NCQA’s PRP indicators cover musculoskeletal (back pain), heart disease, •hypertension and diabetes.
The CCHRI PAS Survey and the AHRQ CG-CAHPS measures are not •applicable to this category.
There are 38 other measures in the PO inventory that are unrelated to the •key health conditions specified by OPA. Additional conditions measured in one or more of the eight measure sets include: eye conditions (macular degeneration, cataracts, and glaucoma), perioperative care (related to antibiotic administration), urinary tract infections, GERD, stroke, and end stage renal disease.
Gaps in PO Measures or ReportingThe most glaring gap in the PO Inventory relates to the lack of quality •data and public reporting at the PO level (nationally) and at the individual physician level (nationally and in California). PO group level performance data are available to a limited extent for the larger California POs, but no national benchmarks are available. Gaps in the Equity and Efficiency domains at the PO level also exist.
University of California, DavisCenter for Healthcare Policy and Research 29
Chapter III: Quality Performance Measurement Inventories
HoSPItal Inventory Summary
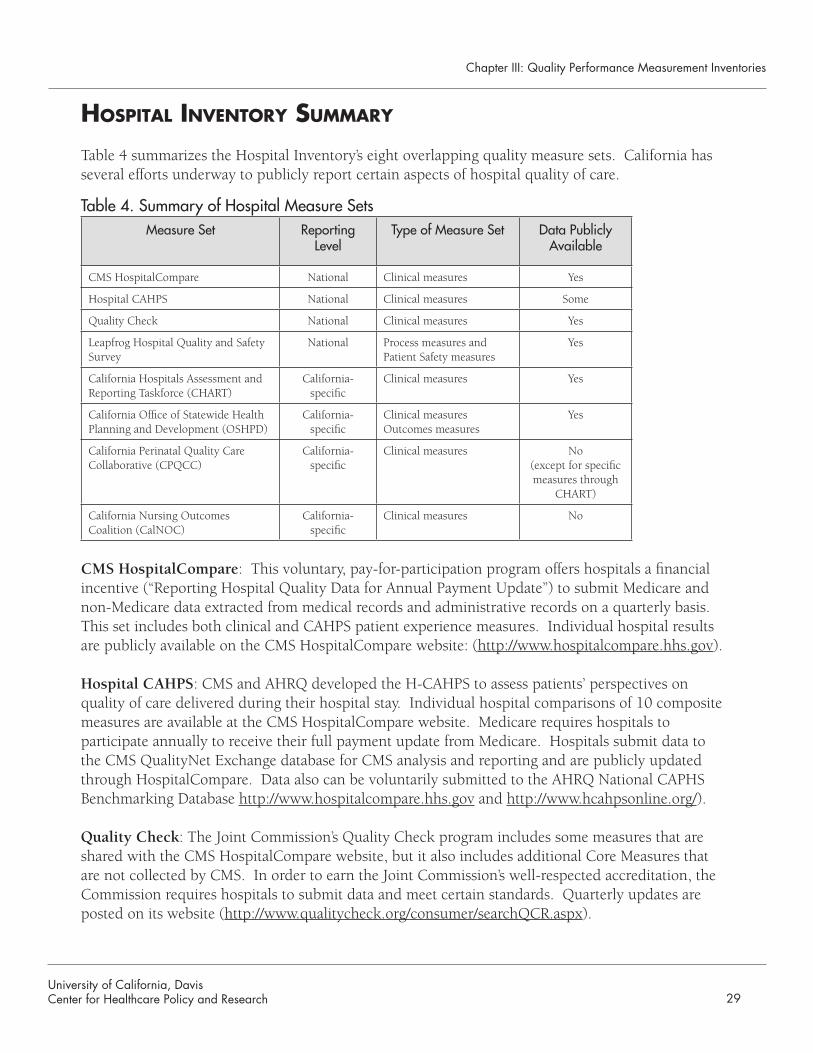
Table 4 summarizes the Hospital Inventory’s eight overlapping quality measure sets. California has several efforts underway to publicly report certain aspects of hospital quality of care.
Table 4. Summary of Hospital Measure SetsMeasure Set Reporting
LevelType of Measure Set Data Publicly
Available
CMS HospitalCompare National Clinical measures Yes
Hospital CAHPS National Clinical measures Some
Quality Check National Clinical measures Yes
Leapfrog Hospital Quality and Safety Survey
National Process measures and Patient Safety measures
Yes
California Hospitals Assessment and Reporting Taskforce (CHART)
California-specific
Clinical measures Yes
California Office of Statewide Health Planning and Development (OSHPD)
California-specific
Clinical measures Outcomes measures
Yes
California Perinatal Quality Care Collaborative (CPQCC)
California-specific
Clinical measures No (except for specific measures through
CHART)
California Nursing Outcomes Coalition (CalNOC)
California-specific
Clinical measures No
CMS HospitalCompare: This voluntary, pay-for-participation program offers hospitals a financial incentive (“Reporting Hospital Quality Data for Annual Payment Update”) to submit Medicare and non-Medicare data extracted from medical records and administrative records on a quarterly basis. This set includes both clinical and CAHPS patient experience measures. Individual hospital results are publicly available on the CMS HospitalCompare website: (http://www.hospitalcompare.hhs.gov).
Hospital CAHPS: CMS and AHRQ developed the H-CAHPS to assess patients’ perspectives on quality of care delivered during their hospital stay. Individual hospital comparisons of 10 composite measures are available at the CMS HospitalCompare website. Medicare requires hospitals to participate annually to receive their full payment update from Medicare. Hospitals submit data to the CMS QualityNet Exchange database for CMS analysis and reporting and are publicly updated through HospitalCompare. Data also can be voluntarily submitted to the AHRQ National CAPHS Benchmarking Database http://www.hospitalcompare.hhs.gov and http://www.hcahpsonline.org/).
Quality Check: The Joint Commission’s Quality Check program includes some measures that are shared with the CMS HospitalCompare website, but it also includes additional Core Measures that are not collected by CMS. In order to earn the Joint Commission’s well-respected accreditation, the Commission requires hospitals to submit data and meet certain standards. Quarterly updates are posted on its website (http://www.qualitycheck.org/consumer/searchQCR.aspx).
Quality Performance Measurement in CaliforniaFindings and Recommendations
University of California, DavisCenter for Healthcare Policy and Research30
Leapfrog Hospital Quality and Safety Survey: This survey, administered by Thomson Healthcare, assesses hospital performance based on four quality and safety practices that are believed to reduce preventable medical mistakes. Hospitals voluntarily report computerized physician order entry, intensive-care unit physician staffing and evidence-based hospital referral, and NQF-endorsed safe practices to Leapfrog. The fourth indicator, a unique measure developed by Leapfrog, calculates resource efficiency for five conditions. All results are publicly reported and updated annually on its website (http://www.leapfroggroup.org).
California Hospitals Assessment and Reporting Taskforce (CHART): A collaboration of California groups representing health care stakeholders developed a statewide hospital performance reporting system in 2004. The quality of care delivered by hospitals for eleven health conditions is publicly reported annually. CHART developed its own risk-adjusted intensive care mortality measure, but relies on other measures developed by the Joint Commission, OSHPD, Leapfrog, H-CAHPS, CPQCC and Cal-NOC. CHART is actively expanding its family of indicators (http://www.calhospitalcompare.org).
California Office of Statewide Health Planning and Development (OSHPD): This state office provides quality of care reports on potentially preventable hospitalizations for 15 health conditions. It also reports on the Agency for Healthcare Research and Quality’s Inpatient Quality Indicators of hospital volume and utilization. In addition, OSHPD provides reports on risk-adjusted mortality related to pneumonia, heart attack, and CABG mortality. Reports are issued on an ad hoc basis and are available for public review ( http://oshpd.ca.gov/HID/DataFlow/HospQuality.html).
California Perinatal Quality Care Collaborative (CPQCC): Professional and government stakeholders collaborate with 60 hospitals on the development of perinatal and neonatal outcomes and information. This collaborative requires the coordination of existing California databases such as birth and death files, rehospitalizations, hospital chart information, and maternal/newborn discharges. Data are submitted annually and available for member use only (http://cpqcc.org/).
California Nursing Outcomes Coalition (CalNOC): In collaboration with the American Nurses Association and the National Database of Nursing Quality Indicators project, CalNOC coordinates the submission of structure, process and outcome data to evaluate nursing quality at the unit level. California hospitals voluntarily submit data quarterly (except for an annual RN survey) and a rolling average of eight consecutives quarters (with national comparisons) is reported to participating hospitals quarterly (https://www.calnoc.org/globalPages/mainpage.aspx).
University of California, DavisCenter for Healthcare Policy and Research 31
Chapter III: Quality Performance Measurement Inventories
Future Data Sources
California Department of Public Health: CDPH formed two quality-related groups in 2008: the Center for Healthcare Quality and the Office of Patient Safety. The groups plan to inventory public health measures related to the national Healthy People 2010 goals and quality indicators derived from CDPH’s enforcement and certification data sets to choose appropriate metrics for public reporting. Data from “27 Never Events” (in-patient safety indicators as required by state law), medication safety and medical error reports, and health care acquired infection reports are under consideration.
Hospital Value Initiative: PBGH and CalPERS created the HVI to build consensus among Califor-nia stakeholders and produce scientifically-sound efficiency measures to assess hospital resource use and total cost of hospital care to payers. The goal is to use these measures with CHART’s quality measures to create reward programs for hospitals. Using publicly available financial data from OSHPD, a report on hospital cost efficiency was released in October 2007.
HoSPItal Inventory FIndIngS
Measure Developers and Data ManagersThere are eight developer organizations in the Hospital Inventory of which •seven also manage the quality data submissions from hospitals and report the results. These sets provide one of the richest collections of performance indicators in health care.
Public reports on performance are issued by five of the eight organizations •managing the data. Three organizations report results exclusively to their participants.
Levels of ReportingResults are available at the individual hospital level for all measure sets •(although not always publicly). State and national averages are available for comparative purposes on four sites.
Duplication of MeasuresThe HospitalCompare and Joint Commission measure sets overlap on most •indicators although each has its own set of unique indicators as well.
Leapfrog, OSHPD, CPQCC and CalNOC developed unique indicators within •their respective organizations.
HospitalCompare (at the national level) and CHART (at the California state •level) duplicate the AHRQ H-CAHPS indicators.
Quality Performance Measurement in CaliforniaFindings and Recommendations
University of California, DavisCenter for Healthcare Policy and Research32
CHART mostly reports on indicators from the aforementioned sources, •but also includes a unique indicator regarding respirator complication prevention.
IOM Domains of Quality Care Similar to the other inventories, the Hospital Inventory is most robust •in Effectiveness indicators followed by Safety and Timeliness indicators. Patient-centeredness indicators are primarily captured through the H-CAHPS set. CHART added six unique measures to the core H-CAHPS survey as well as Leapfrog’s patient-centered measure of “Adherence to ‘Never-Events’ Policy”.
Life CycleAdult-related measures outnumber, by far, the geriatric- and pediatric-related •indicators.
Type of Care Acute care has the largest number of measures represented. Preventive •care indicators are second in frequency and mostly relate to preventing complications such as surgical infections and death after heart attack. Measures related to management care are much less likely to be found throughout the Hospital Inventory.
Key Health Conditions Of the health conditions specified by OPA, heart disease has the most •hospital quality measures. Asthma, COPD, and reproductive health conditions have only a handful of related measures.
Other conditions considered important to hospital measure set developers •include pneumonia, surgical care, NICU care, and nosocomial infections.
Gaps in Measures or ReportingThere are several areas in the Hospital Inventory where gaps exist. As is •consistent with the rest of the health care sectors profiled in the Inventories, the IOM Equity and Efficiency domains lack measures. There are no hospital quality measures in the inventory that are related to cancer, mental health and musculoskeletal conditions. Also, indicators for elective treatments, such as orthopaedic or gastric bypass surgeries, are lacking.
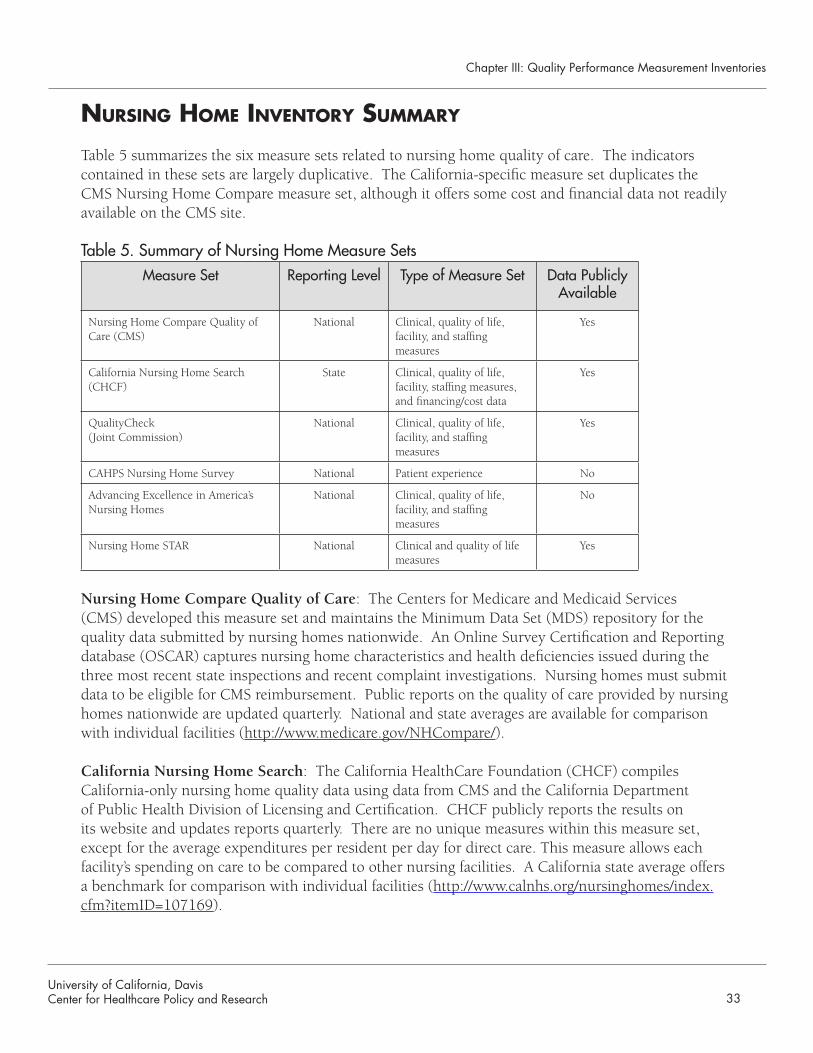
University of California, DavisCenter for Healthcare Policy and Research 33
Chapter III: Quality Performance Measurement Inventories
nurSIng Home Inventory Summary
Table 5 summarizes the six measure sets related to nursing home quality of care. The indicators contained in these sets are largely duplicative. The California-specific measure set duplicates the CMS Nursing Home Compare measure set, although it offers some cost and financial data not readily available on the CMS site.
Table 5. Summary of Nursing Home Measure SetsMeasure Set Reporting Level Type of Measure Set Data Publicly
Available
Nursing Home Compare Quality of Care (CMS)
National Clinical, quality of life, facility, and staffing measures
Yes
California Nursing Home Search (CHCF)
State Clinical, quality of life, facility, staffing measures, and financing/cost data
Yes
QualityCheck (Joint Commission)
National Clinical, quality of life, facility, and staffing measures
Yes
CAHPS Nursing Home Survey National Patient experience No
Advancing Excellence in America’s Nursing Homes
National Clinical, quality of life, facility, and staffing measures
No
Nursing Home STAR National Clinical and quality of life measures
Yes
Nursing Home Compare Quality of Care: The Centers for Medicare and Medicaid Services (CMS) developed this measure set and maintains the Minimum Data Set (MDS) repository for the quality data submitted by nursing homes nationwide. An Online Survey Certification and Reporting database (OSCAR) captures nursing home characteristics and health deficiencies issued during the three most recent state inspections and recent complaint investigations. Nursing homes must submit data to be eligible for CMS reimbursement. Public reports on the quality of care provided by nursing homes nationwide are updated quarterly. National and state averages are available for comparison with individual facilities (http://www.medicare.gov/NHCompare/).
California Nursing Home Search: The California HealthCare Foundation (CHCF) compiles California-only nursing home quality data using data from CMS and the California Department of Public Health Division of Licensing and Certification. CHCF publicly reports the results on its website and updates reports quarterly. There are no unique measures within this measure set, except for the average expenditures per resident per day for direct care. This measure allows each facility’s spending on care to be compared to other nursing facilities. A California state average offers a benchmark for comparison with individual facilities (http://www.calnhs.org/nursinghomes/index.cfm?itemID=107169).
Quality Performance Measurement in CaliforniaFindings and Recommendations
University of California, DavisCenter for Healthcare Policy and Research34
Quality Check: The Joint Commission developed patient safety standards as part of its accreditation process for nursing homes. In order to be eligible for accreditation, nursing homes must submit quality data quarterly to the Joint Commission and meet its standards. Public reports about nursing home performance nationwide are available through the Joint Commission’s QualityCheck website (http://www.qualitycheck.org/consumer/searchQCR.aspx). CAHPS Nursing Home Survey (NH-CAHPS): The nursing home survey, one of the series of patient experience survey tools developed by AHRQ, is under development. Three similar surveys (for short-term and long-term residents and family members) will assess the environment, care, communication, autonomy, and activities provided in a nursing home facility. The data collection process and reporting cycle have yet to be determined. Public availability of the data has yet to be determined. (http://www.cahps.ahrq.gov/content/products/NH/PROD_NH_Intro.asp).
Advancing Excellence in America’s Nursing Homes: This two-year, coalition-based campaign, composed of long-term care providers, medical and quality improvement experts, government agencies and health care providers, monitors key indicators of nursing home quality of care. Twenty-five percent of California’s nursing homes voluntarily submit data on three or more goals on a quarterly (Goals 1-5) or annual (Goals 6-8) basis. No public reporting occurs, but participating nursing homes receive reports with national benchmarks to use for comparison and internal quality improvement (http://www.nhqualitycampaign.org).
Nursing Home STAR: Sponsored by the Nursing Home Quality Initiative (organized by Quality Improvement Organizations), the STAR program has 9,600 participating nursing homes nationwide that voluntarily submit quality data on six key measures. CMS developed and maintains the measures. STAR provides software for nursing homes to set improvement targets and track performance goals for the key measures. The STAR Program reports compare individual facility data with state and national averages trended over a four-year period. Results are updated quarterly and publicly available on the STAR Program website (http://www.nhqi-star.org). The six key indicators are also available through the CMS NursingHomeCompare website.
nurSIng Home Inventory FIndIngS
Measure Developers and Data ManagersThere is one primary clinical measure set (NursingHomeCompare) and one •primary patient experience measure set (NH-CAHPS under development) included in the Nursing Home Inventory. The third measure set (QualityCheck) includes a unique set of patient safety standards.
Three of the six measure sets duplicate quality measures found in other sets. •
All 19 unique clinical quality indicators are publicly available. •
University of California, DavisCenter for Healthcare Policy and Research 35
Chapter III: Quality Performance Measurement Inventories
Levels of ReportingFive measure set developers warehouse and report the data collected from •state survey agency nursing home inspectors. Individual nursing home quality data from across the nation are available on each of the five sites. Only one measure set, reported by CHCF at CalNursingHome.org, focuses on nursing home quality at the state (California-specific) level.
IOM Domains of Quality Care The • Effectiveness, Safety and Patient-centeredness domains have the most indicators. Currently, there are a few comparative indicators that relate to activities of daily living, mobility and use of restraints. However, there are no direct measures of patient experience with nursing home care at this time.
The Nursing Home inventory recorded no indicators related to the IOM •Timeliness, Efficiency or Equity domains.
Life CycleAll the quality measures in the Nursing Home Inventory are related to the •Medicare-eligible population, which is predominantly over age 65 (geriatric).
Type of Care The preventive and acute care-related quality measures are more prevalent •than management-related measures.
Key Health Conditions Pneumonia and influenza vaccination measures are the only quality •indicators related to the Inventory-specific health conditions.
Gaps in Measures or ReportingThere are several data gaps in the Nursing Home indicators including the •lack of comparable patient experience information. Although the NH-CAHPS will fill this void at some point, it is unknown when these data will be publicly available. Only one measure set (QualityCheck) includes an indicator related to tracking safety of medication administration. Also, no quality indicator measures management of chronic conditions affecting nursing home patients, or the Timeliness or Efficiency of care provided.
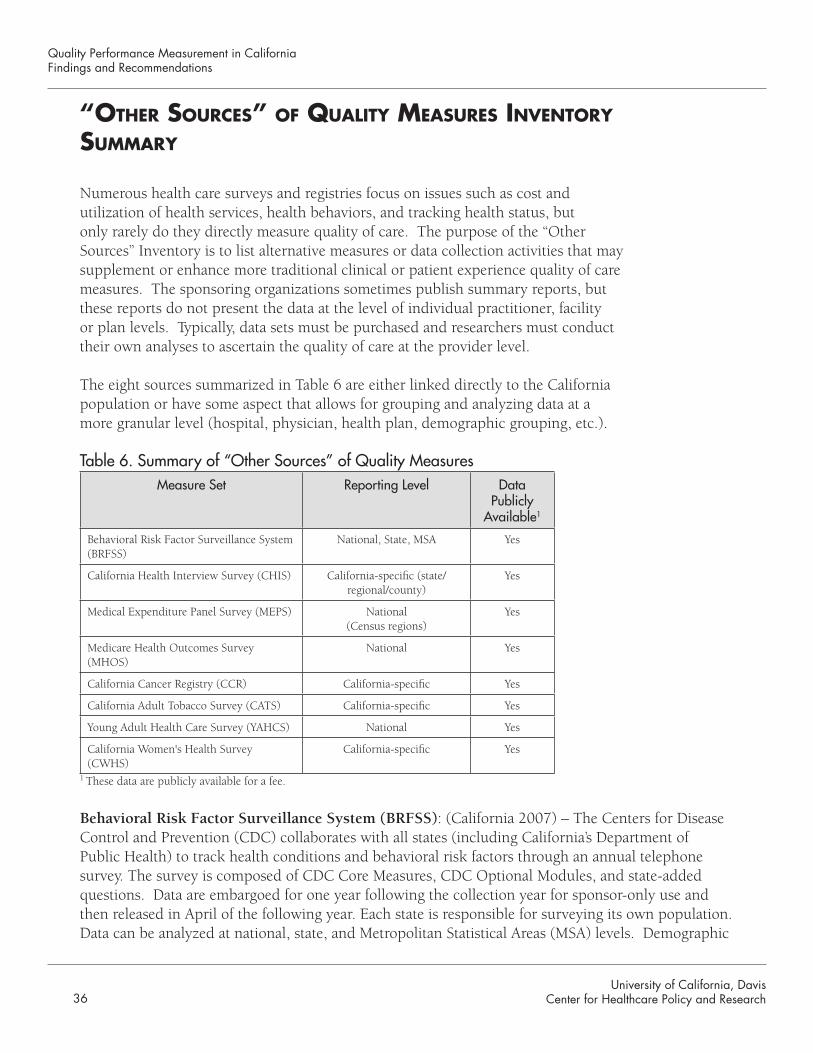
Quality Performance Measurement in CaliforniaFindings and Recommendations
University of California, DavisCenter for Healthcare Policy and Research36
“otHer SourceS” oF QualIty meaSureS Inventory Summary
Numerous health care surveys and registries focus on issues such as cost and utilization of health services, health behaviors, and tracking health status, but only rarely do they directly measure quality of care. The purpose of the “Other Sources” Inventory is to list alternative measures or data collection activities that may supplement or enhance more traditional clinical or patient experience quality of care measures. The sponsoring organizations sometimes publish summary reports, but these reports do not present the data at the level of individual practitioner, facility or plan levels. Typically, data sets must be purchased and researchers must conduct their own analyses to ascertain the quality of care at the provider level.
The eight sources summarized in Table 6 are either linked directly to the California population or have some aspect that allows for grouping and analyzing data at a more granular level (hospital, physician, health plan, demographic grouping, etc.).
Table 6. Summary of “Other Sources” of Quality MeasuresMeasure Set Reporting Level Data
Publicly Available1
Behavioral Risk Factor Surveillance System (BRFSS)
National, State, MSA Yes
California Health Interview Survey (CHIS) California-specific (state/regional/county)
Yes
Medical Expenditure Panel Survey (MEPS) National (Census regions)
Yes
Medicare Health Outcomes Survey (MHOS)
National Yes
California Cancer Registry (CCR) California-specific Yes
California Adult Tobacco Survey (CATS) California-specific Yes
Young Adult Health Care Survey (YAHCS) National Yes
California Women's Health Survey (CWHS)
California-specific Yes
1 These data are publicly available for a fee.
Behavioral Risk Factor Surveillance System (BRFSS): (California 2007) – The Centers for Disease Control and Prevention (CDC) collaborates with all states (including California’s Department of Public Health) to track health conditions and behavioral risk factors through an annual telephone survey. The survey is composed of CDC Core Measures, CDC Optional Modules, and state-added questions. Data are embargoed for one year following the collection year for sponsor-only use and then released in April of the following year. Each state is responsible for surveying its own population. Data can be analyzed at national, state, and Metropolitan Statistical Areas (MSA) levels. Demographic
University of California, DavisCenter for Healthcare Policy and Research 37
Chapter III: Quality Performance Measurement Inventories
data are collected and data are comparable by product line (e.g., Medicare, Medicaid, commercial managed care, other government plans). Sample size: Approximately 5,000 Californians (http://www.cdc.gov/brfss/).
California Health Interview Survey (CHIS): (California 2005) - The California Departments of Health Care Services and Public Health, the Public Health Institute, and the UCLA Center for Health Policy Research collaborate on the design, administration and analysis of a statewide telephone survey of California children, adolescents, and adults regarding health behaviors and health status. The survey consists of established core questions and new questions rotated in to address emerging health issues. Data are collected biennially and released during the subsequent data collection process two years later (e.g., 2005 data become publicly available in 2007). Data can be analyzed at the state level, state-regional, and county levels. Demographic information is collected and data are comparable by product line. Sample size: Approximately 42,000 Californians (http://www.chis.ucla.edu/).
Medical Expenditure Panel Survey (MEPS): AHRQ developed and manages the MEPS tool and database, which gathers health information about families and individuals and their medical providers nationwide. Data collection occurs through rounds of interviewing over a two-year period to determine how changes in respondents’ health status, use of services, eligibility for coverage, etc. are related. Data are available at the national and census region levels and data are comparable by insurance product line (http://www.meps.ahrq.gov/mepsweb/).
Medicare Health Outcomes Survey (MHOS): CMS, in collaboration with NCQA, developed this survey, which relies on self-reported health outcomes by Medicare Advantage (MA) beneficiaries to assess their health plans’ ability to maintain or improve physical and mental health function. CMS provides each MA plan with a “plan performance measurement report” that describes changes in beneficiaries’ health status over a two-year period. Plan reports are not available for public review. The survey is based on the Veterans’ RAND 12-Item Health Survey and four HEDIS measures. Demographic data are collected. The survey is conducted every spring. Sample size: Approximately 100,000 beneficiaries from plans nationwide (http://www.hosonline.org/).
California Cancer Registry (CCR): The California Department of Public Health collaborates with the Public Health Institute, ten regional registries, hospitals and cancer researchers to maintain the cancer registry, which adds approximately 140,000 cancer cases annually. The registry includes information on demographics, cancer type, extent of disease at diagnosis, treatments, and survival rates. Data are publicly available. Hospitals and physicians are required by law to submit data. Registry size: 2.5 million cancer cases (http://www.ccrcal.org/abouttheccr.html).
California Adult Tobacco Survey (CATS): The California Department of Public Health’s Tobacco Control Section oversees an ongoing, monthly telephone survey that collects information on a wide variety of tobacco-related behaviors, attitudes and beliefs from a random sample of adult Californians. Data are publicly available. A biennial children’s survey is also conducted. Sample size: 4,200 adults (http://www.dhs.ca.gov/tobacco/).
Quality Performance Measurement in CaliforniaFindings and Recommendations
University of California, DavisCenter for Healthcare Policy and Research38
Young Adult Health Care Survey (YAHCS): The Child and Adolescent Health Measurement Initiative (CAHMI), in collaboration with NCQA and the now defunct FAACT, developed YAHCS. This annual survey targets adolescents ages 14-18 years to assess how well the health care system provides recommended preventive care. CAHMI has collected and analyzed more than 3,000 surveys to date. The survey tool and some data are publicly available; however no benchmark data are available. MRMIB used this survey in 2007 to help assess its adolescent population. CAHMI houses the data at the Oregon Health and Science University (http://www.cahmi.org).
California Women’s Health Survey (CWHS): The California Departments of Health Services, Mental Health, Alcohol and Drug Programs, and Social Services, and the Public Health Institute (PHI) collaborate on this statewide, annual telephone survey. The survey collects information from randomly selected adult women ages 18 years or older on a wide variety of health indicators and health-related knowledge, behaviors and attitudes. The PHI Survey Research Group administers the survey. Reports on the data are available for public review. Sample size: 4,000 (http://www.dhcs.ca.gov/dataandstats/reports/Pages/DataPoints.aspx).
“otHer SourceS” oF QualIty meaSureS Inventory FIndIngS
Measure Developers and Data ManagersIn addition to creating the survey tools, the developers are responsible for •overseeing the data collection, analysis and public reporting of summary results.
Levels of ReportingFive of the eight sources of registries and survey tools provide data limited to •the California population and one offers comparative data between California and the nation. The remaining two sources (MEPS and MHOS) are limited to comparisons at the national level only.
Duplication of MeasuresVery few measures are duplicated between the sources listed in the Inventory. •BRFSS and CHIS both address many of the same health topics, but CHIS frequently offers more detail.
IOM Domains of Quality Care Because these sources are not direct indicators of quality of care, there •are very few measures related to the IOM domains. The Effectiveness and Timeliness domains contain the most related survey questions. (The Timeliness questions are usually related to access to care.)
University of California, DavisCenter for Healthcare Policy and Research 39
Chapter III: Quality Performance Measurement Inventories
Life CycleThe Inventory covers all stages of the life cycle. BRFSS, CHIS and MEPS •include all three stages in their surveys, while MHOS captures only the geriatric stage and the YACHS captures only the pediatric stage.
Key Health Conditions The surveys and registries not only cover the health conditions identified by •OPA, but expand into other areas such as physical disabilities and HIV/STDs.
Gaps in Measures or ReportingThese surveys and registries primarily assess population health rather than •individual health. This makes the application of the data more challenging and complicated than other Inventory measure sets, which were designed specifically to measure the quality of care. Those who use these data for quality performance measurement may also face a challenge with the timeliness of some survey data. For example, BRFSS and CHIS use two-year data cycles and much of the data are outdated in comparison with other measure sets (e.g., HEDIS, HospitalCompare, etc.). Another limitation to using these data for quality measurement relates to the small sample size in some surveys.

University of California, DavisCenter for Healthcare Policy and Research
Chapter IV: Stakeholder Interviews
41
Chapter IV: Stakeholder Interviews
41
IV. Stakeholder Interviews
The voluntary participation of health care providers in quality performance measurement has been essential to establishing and improving California’s public reports on quality of care. OPA recognizes the pivotal role these providers play in promoting transparency and accountability in health care. Therefore, as part of the QPM project, it was important to OPA to consider the opinions, perceptions, and suggestions of these stakeholders in the development of its plan for QPM and public reporting.
Twenty-nine of the 31 stakeholders invited by OPA agreed to be interviewed about the state of quality measurement and public reporting in California. In general, stakeholder comments are not attributed to a specific organization to assure a frank and enlightening discussion.
The interview summaries are organized into three primary topics: current and future measures; gaps in measurement and OPA’s role in quality measurement and public reporting. Within each topic, responses are grouped into one of five stakeholder groups to identify possible variation in stakeholder perspectives. The contributing organizations are:
Government OrganizationsBusiness, Transportation and Housing Agency (BTH)1. CalPERS2. Department of Health Care Services (DHCS)3. Department of Insurance (CDI)4. Department of Managed Health Care (DMHC)5. Department of Public Health (DPH)6. Health and Human Services Agency (HHS)7. Managed Risk Medical Insurance Board (MRMIB)8. Office of Governor Schwarzenegger9. Office of Statewide Health Planning and Development (OSHPD)10.
Health PlansAetna1. Anthem Blue Cross of California2. Kaiser Permanente3.
Consumer Advocacy GroupsAARP1. Center for Health Improvement2. Consumers Union3. Health Access4.
Quality Performance Measurement in CaliforniaFindings and Recommendations
University of California, DavisCenter for Healthcare Policy and Research4242
Quality Reporting OrganizationsCalifornia Healthcare Foundation (CHCF)1. California Hospital Assessment and Reporting Taskforce (CHART)2. Integrated Healthcare Association (IHA)3. National Committee for Quality Assurance (NCQA)4. Pacific Business Group on Health (PBGH)5. RAND6. Thomson Healthcare7.
Professional Associations/Physician Organizations California Association of Health Plans1. California Association of Physician Groups (CAPG)2. California Hospital Association3. California Medical Association4. Humboldt-Del Norte Foundation for Medical Care5.
Current and Future MeasuresThe interview questions in this domain focused on whether the Inventories were complete and whether the interviewee was aware of any current or potential future measures that were not included in the Inventories, but could be useful to the public.
Current Quality Measures
Government Organizations
Six of the ten government stakeholders did not identify measure gaps in the Inventories. Two •stakeholders suggested adding the following quality measures/sources:
Young Adult Health Care Survey (YAHCS) o CAHPS Dental Surveyo Hospital utilization rateso More structure measures related to hospitals (e.g., staffing ratios, procedure volume, o accreditation.)
Five government entities have some experience collecting and publicly reporting quality •measures (CalPERS, MRMIB, DHCS, CDPH, and OSHPD) and CDI anticipates publicly reporting HEDIS/CAHPS results in 2009 for the first time. CDPH anticipates reporting “events and investigated outcomes to consumers” in 2009.
All government stakeholders collect HEDIS measures annually and all but two entities collect •CAHPS measures biennially, (assuming budget resources are available). However, the specific HEDIS/CAHPS measures collected by CalPERS, MRMIB, and DHCS differ somewhat as does the frequency of their data collection.
Chapter IV: Stakeholder Interviews
University of California, DavisCenter for Healthcare Policy and Research 43
Chapter IV: Stakeholder Interviews
All government stakeholders using HEDIS/CAHPS measures are satisfied with the breadth and •depth of the clinical and patient satisfaction survey measures and found no reason to expand beyond those, nor to create their own measures of patient experiences with care.
Some stakeholders suggested using other quality sources, including HMO-specific Quality •Improvement Plans, HMO Annual Reports (both regulatory in nature and obtained through DMHC), California Women’s Health Survey (tracking health indicators and behaviors), and “California Perspectives” published by OSHPD (an overview of healthcare facilities and services). These sources are not intended for the public’s use in decision making, but rather to motivate health plans or providers to improve their quality of care or for public health research purposes.
OSHPD highlighted the outcomes data they produce for CABG •surgeries at the individual surgeon and hospital levels of care.
CalPERS created two unique composites from the HEDIS •measures: a medical composite and a mental health composite. Each composite reports the average rating for all of the clinical measures and for all of the mental health measures that CalPERS studies. CalPERS publicly reports the composites to members annually.
Health PlansNone of the plan representatives stated that any specific measures •were missing from the Inventories. However, one representative mentioned that it tracks “NCQA-blessed” IT infrastructure measures (Physician Practice Connection, internal communication, E-prescribing) that could be useful for quality reports.
All plans reported using at least some of the health plan-related •measures included in the Inventories (HEDIS/CAHPS).
One plan stated that the measures their plan uses are already endorsed at the national level. •
Two plans mentioned that they use their national offices to help determine which quality •measures should be used.
The plans observed that measures are developed through a scientific process that is not •immune to political considerations.
Consumer AdvocatesNo consumer advocacy group identified any missing measures from the Inventories. One •group stated that, in general, California’s quality measurement movement should focus on outcomes measures and patient safety measures.
One advocacy group described the Agency for Healthcare Research and Quality’s free Patient •Safety Indicators (PSI) software that tracks 15-20 PSI and 20-25 Inpatient Quality Indicators.
“There are challenges with operationalizing [quality] measures.”
—Health plan
“Outcomes are the gold standard.”
—Government agency
Quality Performance Measurement in CaliforniaFindings and Recommendations
University of California, DavisCenter for Healthcare Policy and Research44
The group stated that more than 20 states track and report these indicators and they would like to see California take part in this initiative. (CDPH began PSI data collection in 2007.)
Consumers Union is the only advocacy group involved with quality reporting. It publishes •“Best Buy Drugs” which offers “value-based” reviews of various drug categories. Consumers Union needs help disseminating this information to the public and would welcome the opportunity to link their website with OPA’s Quality Portal.
Two consumer groups advocated for publicly reporting efficiency measures related to the •“value received for the health care dollar spent.”
Quality Reporting OrganizationsNo quality reporting organizations suggested specific, publicly available quality measures to •add to the Inventories.
One organization suggested adding Information Technology (IT) type measures.•
Several organizations identified some of the leading quality metric systems used for assessing •performance. These systems, developed by RAND QA, Resolution Health, Thomson Healthcare (MedStat), and Ingenix, are proprietary and not publicly available.
One organization cited the National Surgical Quality Improvement Program (NSQIP) as an •important resource for quality indicators. The program was developed by the Department of Veterans Affairs and is now used by private hospitals through the American College of Surgeons. The data describe risk-adjusted surgical outcomes (rather than survival rates only) and are not publicly reported.
Professional Associations/Physician Organizations One stakeholder reported that the Inventories missed a quality measure set. CAPG created •a quality measurement tool for California “physician groups” in delegated managed care groups that focuses on a physician group’s infrastructure rather than clinical indicators. CAPG introduced the Standards of Excellence quality survey instrument in 2007. CAPG collects, analyzes, and reports the data in aggregate. It will eventually contract with a third party to oversee future data collection and analysis. The survey assesses three domains:
care managemento health information technologyo accountability and transparencyo
CAPG shares the physician group-specific results with each participating physician group but does not release the results publicly. (However, the survey instrument can be shared publicly.) CAPG anticipates public reports by group name will be available in the near future once the survey tool is validated and finalized.
“We’re in a situation where nobody has more influence on quality than individual doctors.”
—Reporting organization
Chapter IV: Stakeholder Interviews
University of California, DavisCenter for Healthcare Policy and Research 45
All stakeholders acknowledged the need for or trend toward reporting at the provider level •whether it is at the hospital level, physician group, or individual physician level. Enthusiasm for reporting at this more granular level varied by stakeholder.
Four stakeholders mentioned that they personally contributed feedback to OPA about the •quality measures reported on the Health Care Quality Report Card. They also mentioned having the opportunity to respond to the Report Card’s results. These unsolicited comments were presented in an appreciative tone indicating that OPA’s collaborative effort was important to them.
Each stakeholder in this category represents a different part of the health care service industry •and expressed different needs and concerns that were unique to their organization.
Future Quality Measures
Government OrganizationsMost government stakeholders plan to maintain their current •quality performance measurement programs with slight adjustments. Specifically, efficiency measures will receive more attention in the future as they become available. CalPERS (through the CHART initiative) and OSHPD both mentioned a need for developing efficiency measures.
OSHPD’s Health Information Resource Center will focus on developing and reporting •currently undetermined population-based measures. A team will take two to three years to design and implement this new measure set.
OSHPD is expanding its custom outcomes reports and developing a new report style that •does not require intensive data validation. OSHPD is confident in the validity of its dataset and is comfortable using those data in the custom reports. OSHPD staff will develop the entire methodology based on an AHRQ design, but they will include additional variables such as “conditions present upon admission” that OSHPD considers important. The conditions OSHPD chooses for the custom reports depend on the prevalence of condition, contribution to mortality rates, cost, and whether the care is elective (e.g., CABG, maternity care). Currently, two conditions are in queue with two more under consideration:
Maternal birth outcomes (perineal lacerations) •Mortality following hip fracture •Mortality following abdominal aortic aneurysm surgery (under consideration)•Heart failure mortality (under consideration) •
OSHPD plans to fully develop data collection efforts for in-patient hospitalizations, Emergency •Departments, and ambulatory surgery centers in the near future.
“Who should pay for the cost of data flow?”
—Reporting organization
Quality Performance Measurement in CaliforniaFindings and Recommendations
University of California, DavisCenter for Healthcare Policy and Research46
CDI will report HEDIS/CAHPS measures on California’s •six largest PPOs within the next two years. This effort will cover about 85 percent of the PPO insured market. This is a cooperative effort on behalf of the PPOs as CDI has no statutory authority to require PPOs to contribute data or publicly report results. Eventually, CDI would like “to move further down the chain of the insurers” to include more of the smaller PPOs.
CDPH formed two new quality-related groups in 2008: Center •for Healthcare Quality and the Office of Patient Safety. Both groups plan to inventory public health measures related to the national Healthy People 2010 goals and quality measures. The new Center will look at “tracking and identifying issues, creating robust reports and sharing best practices.” The director hopes to fund these efforts through grants. Examples of pertinent data collection include “27 Never Events” (as required by state law), medication safety and medical error reports, and health care acquired infections. Most of these data points are designed and collected for enforcement purposes rather than quality measurement, but CDPH feels that there are valuable quality data available for analysis and reporting. CDPH would like to issue public reports and information in 2008-2009 using quality indicators derived from its enforcement and certification data sets.
Health PlansTwo plans mentioned that they provide continuing medical education and training modules •for their physicians to maintain their licensing/certification and suggested that something similar could be used as part of a quality performance measure for physicians. Both plans thought that including the scores from quality and practice improvement modules in a physician report card would be useful for physicians and consumers.
One plan drew a parallel between the Centers for Medicare and Medicaid Services’ • Bridges to Excellence program and its own internal program.
Consumer AdvocatesConsumers Union is working on a public education effort to inform consumers that “more •care is not always better.” A new website (http://www.consumerreports.org/health/doctors-and-hospitals/hospital-home.htm), introduced in June 2008, provides hospital intensity measures (defined as time in hospital and number of doctor visits) for nine conditions at 3,000 facilities nationwide. Based upon 2008 Dartmouth Atlas hospital data, Dr. John Santa of Consumers Union, translated “hospital intensity measures” into lay language to educate consumers that more interventions can sometimes be dangerous and more expensive without improving health outcomes. The measures are based on the medical care received by patients during their last two years of life.
Quality Reporting OrganizationsRegarding the future need for more measures, one organization specifically stated that there •are many measures that are not yet fully implemented at the proper health care levels, and therefore, there is no need to add more measures. “The measures implemented today are done
“The real goal is to go as far as needed to capture a majority of the physicians serving the PPO population.”
—Government agency
Chapter IV: Stakeholder Interviews
University of California, DavisCenter for Healthcare Policy and Research 47
so in a patchwork—no PPOs report, little for HMOs, hospitals have some measures, but no group is comprehensive in its use or reporting of currently available measures.”
Another organization stated that there are many proprietary measures generated by different •groups that possibly could be used by California, if there was interest. For example, “episode groupers” link related claims together based on a diagnosis. Stakeholders reported that this approach measures an outcome for a particular condition with risk-adjustment.
Two stakeholders reported that they are working together on developing efficiency measures •(episodes of care) related to physician performance to see what drives practice variation. Only participating physician groups will receive the pilot project results in 2008. These efficiency indicators may become publicly available in the future.
It was reported that, in the near future, NQF should be adopting efficiency metrics created •by Leapfrog, PacifiCare and United Health. Once approved by NQF, CHART will consider adopting these indicators for public reporting.
Professional Associations/Physician Organizations Of the five association stakeholder groups, none have future plans to create, administer •or report quality measures with the exception of CAPG, which will continue to refine its Standards of Excellence survey (described in Chapter III).
Gaps in Quality MeasureMentAnother area of critical importance to mapping a future measurement and reporting plan in California is assessing where gaps in quality measurement currently exist. All stakeholders were queried about their perceived gaps in quality measurement.
Government OrganizationsOf the stakeholder groups interviewed, the government •organizations overlapped the most in their identification of gaps in quality performance measures. Several of the government organizations mentioned that they have not seen OPA’s Report Card or Quality Portal site and felt somewhat unprepared to comment on gaps specific to the Report Card.
Gaps in Types of MeasuresTwo stakeholders felt outcomes measurement, rather than process measurement, should be •promoted. Three stakeholders said they have no feel for where the clinical or quality gaps may be in measure sets. One stakeholder stated that, “data at the individual physician level is the biggest missing piece.”
“Quality measurement is nothing but gaps—there are a few islands in the ocean.”
—Government agency
Quality Performance Measurement in CaliforniaFindings and Recommendations
University of California, DavisCenter for Healthcare Policy and Research48
Two stakeholders said that, when choosing which gaps to fill, it •was important to emphasize data that lead to “actionable” steps. They wanted indicators chosen that providers can control or change. There was sensitivity to the number of measures already required and the reporting burden on providers.
Two stakeholders volunteered that the ability to compare a plan’s •product lines (such as Medi-Cal, commercial, PPOs, etc.) is very important as is the geography of reporting: regional reporting is very important to some, but frequently is not available. Also, fee-for-service plans are not included in quality measurement, but one entity specifically mentioned the value in capturing that product line.
Gaps in IOM DomainsFour government stakeholders reported that measures related to the Efficiency domain need •to be expanded. Two stakeholders mentioned the need for more Equity measures to identify possible racial, ethnic, or socioeconomic disparities. Two stakeholders identified the need for more patient safety measures.
Gaps in Health Conditions MeasuredTwo stakeholders reported that there are not enough mental health quality measures and •two more reported that hospital acquired infections need more focus. Also, government stakeholders mentioned preventable hospitalizations, chronic care management, obesity, dental care, and elective surgery as other key areas of interest.
Structural Gaps in ReportingSeveral government stakeholders discussed the need to identify a designated quality reporting •authority. In a related comment, one raised the question about “beefing up [OPA’s authority] if they go any further” in reporting clinical quality metrics. “Right now, it’s all voluntary and the real question is will people be willing to [continue] doing this?” Another observed that “there is a gap between DMHC and OPA. Some people think they are linked, but there’s potential value in having OPA be a much more independent organization. For OPA to be truly a patient advocate organization, it has to assume an independent role. Right now OPA’s budget is tied to DMHC, so by nature it’s not as independent as it should be.” In contrast, a few government stakeholders did not want a central authority responsible for reporting all measures, but rather wanted “to be told where the gaps are, so we can make [reporting] adjustments.”
A few government stakeholders said that quality reporting is a new and very different •responsibility for most government organizations. Most stakeholders focus on policy, consultation and/or enforcement and said they needed support in reporting.
“Data at the individual physician level is the biggest missing piece.”
—Reporting organization
“…there’s potential value in having OPA be a much more independent organization.”
—Government agency
Chapter IV: Stakeholder Interviews
University of California, DavisCenter for Healthcare Policy and Research 49
Health PlansOverall, health plans were satisfied with the selection of clinical quality measures with a few exceptions. Gaps in Measures
There was some overlap in the gaps identified by health plans. Stakeholders from one •plan said reporting on individual physician performance is important, but they believe the physician specialty measures adopted by CMS are “very weak and not solid evidence-based.” They said that CMS accepted lists of AMA-recommended measures that were not “vetted with scientific rigor” that is common to NCQA-approved measures. Also, the plans won’t use any measure unless it is endorsed by AQA, NQF or NCQA.
Stakeholders noted that there is a need to report on PPO quality and a need for more •outcomes data.
Gaps in IOM DomainsAreas that need more attention include racial/ethnic disparities and efficiency, but “how do •you capture that and report it?” The plans expressed concern over the ability of any reporting entity to properly risk-adjust for population differences, but cautioned that it was “not OPA’s role to create the risk-adjustment models.”
Structural Gaps in Reporting
The stakeholders also mentioned their concern over reporting “old data.” They said •improvements in programs and services may have occurred since the last measurement cycle, but those improvements would not be recognized because of the time lag in the reporting cycle.
Finally, one plan encouraged OPA to change its approach from highlighting the worst •performers to highlighting the best performers. They felt the biggest gap in public reporting is not sharing the successful, best practices amongst providers. By highlighting the best performers, it was thought that providers would be encouraged to adopt best practices across each sector of the health care industry.
Consumer AdvocatesThe consumer advocates had very distinct opinions about gaps in quality performance measures.
Gaps in MeasuresOne stakeholder said that more hospital quality performance •information is needed, specifically information related to patient safety (such as AHRQ’s Patient Safety Indicators). The stakeholder believes OSHPD “is doing some data analysis on this topic, but I don’t see the numbers publicly reported.” Another stakeholder mentioned the need for public reporting on readmission rates and timely access. For example, it is more
“People use this [hospital quality] information as ‘just in time’ information.”
—Reporting organization
Quality Performance Measurement in CaliforniaFindings and Recommendations
University of California, DavisCenter for Healthcare Policy and Research50
useful to know who provides the timeliest access and care (“within 7 days”) rather than “as soon as you thought was needed.” He believes using a specific time standard is more helpful to consumers.
Another stakeholder reported that no CAHPS survey measures capture the “inadequate •interpretation/translation services” in California. The stakeholder felt that integrating the CAHPS language/interpretation measures into the core CAHPS survey (rather than supplemental) is important to measuring health plan compliance with the new California language assistance regulations.
Finally, the impact of cost of care on patients and medical debt suffered by patients was of •utmost importance to one advocacy group. They wanted to know, “Does that [cost or medical debt] impact future care sought by a patient, and thus [his] future health outcomes?”
Quality Reporting OrganizationsThe reporting organizations overlapped in their identification of gaps more than most of the stakeholder groups interviewed.
Gaps in MeasuresMost reporting organizations observed that there is a plethora of quality indicators available, •but that reporting entities should choose their required indicators carefully. The groups publicly reporting such data should be sure that the indicators measure conditions for which there are: 1) high rates of variation; 2) opportunities for improvement; and 3) clinically important questions to be answered. Another stakeholder included “shoppable” or elective measures as another criterion for choosing the most appropriate indicators for reporting.
A related comment focused on the need for thorough data collection. For example, accurately •measuring physician beta-blocker treatment rates would require pharmacy data, but it is very difficult to link those data because pharmacy data are reported to the plan and not to the physician.
Three reporting organizations said that physician measures lack both chronic and acute •care quality indicators (prevention is “pretty well covered”) and that there are no measures available for specialists—the few that are available focus on the primary care level.
Several reporting organizations identified the need for more patient safety indicators at the •physician level and the hospital level for ER and ambulatory care. One stakeholder mentioned nursing homes as having very few quality measures available to the public. Home health care providers also have no quality measures to which they are held accountable.
Structural Gaps in ReportingConcerns regarding gaps in the structure or process of reporting data related to ensuring that •physicians see their individual measures, the challenges of data warehouse management, and concern over all hospitals reporting CAHPS measures for public review.
Chapter IV: Stakeholder Interviews
University of California, DavisCenter for Healthcare Policy and Research 51
Gaps in Health ConditionsAt least two quality reporting organizations said that “comfort care” measures would be •worthy indicators once there is agreement on the definition and measure design. This area should include measuring palliative care (quality, type, process) delivered in hospitals.
It was noted by one stakeholder that cancer care is a high cost and high impact condition, but •it is too complex to measure. Others noted that obesity and outcomes and readmission rates for an array of conditions are all areas that need attention.
Future measures should assess “longitudinal care” which is more comprehensive than readmit •rates or episodes of care. This stakeholder believed that payment reform would fundamentally change how measures are used in the long run.
Gaps in IOM DomainsThere was much agreement between reporting organizations with regard to gaps in the IOM •domains of care. Six stakeholders said that Efficiency measures are sorely lacking. Using somewhat varied terminology, they agreed that there is a great need for “episodes of care” or “relative resource use/cost” measures. They noted that timeliness and accessibility of data are the hurdles to overcome in establishing these measures. Calculating the cost per episode of care should be done at both the physician group and individual physician level too.
Two stakeholders mentioned the lack of comparability of the efficiency of treatment patterns. •For example, Consumer Reports produces an efficiency report on pharmaceuticals, but no organization produces the equivalent report for other medical interventions. Efforts need to be made to assess treatment options as related to health outcomes and cost to the patient.
Two stakeholders noted that while health care disparities are difficult to measure, creating a •hospital unit of analysis that linked the demographic statistics from the hospitals’ catchment area would be very worthwhile. Another stakeholder from a reporting organization encouraged a regional approach to measuring quality reasoning that it may not be as specific as a report about an individual provider, but it offers more detail than a statewide report.
One stakeholder observed, “Equity is a derivative of the other •five IOM domains.” In other words, the potential to measure equity exists in virtually all quality indicators as long as sociodemographic data are collected along with the quality indicators. The stakeholder mentioned that geocoding may help solve this problem.
There is also a void in the number of Timeliness measures for physicians, hospitals (other than •door-to-needle measures), and specific treatment options.
“Equity is a derivative of the other five IOM Domains.”
—Reporting organization
Quality Performance Measurement in CaliforniaFindings and Recommendations
University of California, DavisCenter for Healthcare Policy and Research52
Professional Associations/Physician Organizations Professional Associations/Physician Organizations mentioned very different gaps in quality measurement with virtually no overlap within their group. However, this group shares concern about burdening providers with too many measures.
Structural Gaps in ReportingSeveral stakeholders stated that there are “no resources available •to help physicians to collect, analyze, or report data” and that this is a big challenge for primary care physicians. In a related comment, some expressed concern about too much transparency driving physicians away from cooperating with measurement or even continuing to practice. The stakeholders suggested that those requiring quality reports be judicious in choosing what to measure.
One stakeholder from the association/physician organization group noted that political •interests are working their way into measure sets. For example, he considered the new cultural competency indicators for physicians offensive and unquantifiable, and therefore ineffective in identifying health disparities.
Another structural gap in quality measurement relates to quantifying “dropped hand-offs” •between providers. A stakeholder asked, “How do we make sure instructions are followed and information is forwarded to the PCP?” He noted that readmission is a big and expensive problem and that “quality, safety, and economic issues are tied up in these dropped hand-offs.”
One stakeholder identified a gap in the availability of national comparisons to California •results and felt that “private payers may find it useful to see CMS physician indicator results compared to California results.”
Publicly reporting results at the physician group level with private reporting at the individual •physician level was considered the most optimal for improving outcomes. Respondents observed that care is a “team sport” and mid-level practitioners deliver 30 percent of care, so reporting individual physician scores may not be accurate.
Gaps in IOM DomainsThere were several suggestions for measuring efficiency. One stakeholder mentioned the •gap in capturing Emergency Department use and “how to cut down on preventable trips to the ER.” Another mentioned that episodes of care —“a systematic approach to care for conditions, such as diabetes”— is more important to measure than individual services or processes.
Gaps in Health ConditionsOne stakeholder reported gaps in measuring hospital-acquired infections, surgical outcomes, •and service-related measures (although it was noted that the PAS survey helps capture the service topic somewhat).
“[Physicians are] being forced to participate in reporting quality, but are not yet properly prepared.”
— Professional association
Chapter IV: Stakeholder Interviews
University of California, DavisCenter for Healthcare Policy and Research 53
suMMary oF opa’s role in publiCly reportinG Quality perForManCe inForMation
During the interviews, the CHPR staff asked two questions regarding OPA’s role in publicly reporting health care quality information: “What do you think OPA might do to encourage the collection of necessary data for additional quality measurement and public reporting?” and “What might OPA do to increase coordination between government and private sector stakeholders around quality measurement and public reporting?”
Government OrganizationsThe vast majority of government stakeholders volunteered that OPA is “doing a good job in reporting information about quality.”
Statutory/Regulatory AuthorityThree government stakeholders pointed out issues surrounding • OPA’s limited authority to require data collection and reporting. Two felt OPA’s role is supported enough at the agency level to continue its momentum with moving the quality reporting process forward. The other stakeholder felt that OPA needs more (formal) authority in order to improve reporting participation.
Collaborative EffortsFive of the 10 stakeholders mentioned the need for collaboration among the government •departments and offices. A few commented on being “expected to work with each other” as related to the Governor’s Executive Order.
Four stakeholders mentioned the need to meet together more often to discuss the quality •performance reporting issue. Comments ranged from the need to create a “Quality Council of government interests to problem solve” to expressing appreciation for OPA’s April 2, 2008 “Public Reporting on Health Care Quality for California State Agencies” meeting and expressing interest in continuing such meetings.
One stakeholder suggested that OPA, CDPH and OSHPD should collaborate to go beyond •process measures (the “low-hanging fruit”) to drive the field of reporting toward outcomes measures.
Several stakeholders wanted to utilize • OPA’s expertise in public reporting, including learning more about social marketing and data presentation. One stakeholder mentioned that OPA could collaborate with sister departments to apply for quality reporting funding. The stakeholder cited a Commonwealth quality reporting RFP that contained considerable funding, but went un-bid by California because there was no lead agency to execute the RFP.
“OPA is doing a good job in reporting information about quality.”
— Government agency
Quality Performance Measurement in CaliforniaFindings and Recommendations
University of California, DavisCenter for Healthcare Policy and Research54
Centralized Quality Performance Portal Site vs. Multiple Reporting SitesSix government stakeholders recognized • OPA’s expertise and experience in publicly reporting quality data and would consider linking to or reporting data through OPA’s Quality Portal site. Some were open to having their quality data reported on OPA’s Report Card while most were more interested in OPA acting only as a portal to connect to their home sites.
Those government stakeholders only interested in using • OPA’s Quality Portal to connect to their site agreed that the information should be reported to the consumer in a uniform manner. One specifically mentioned the importance of a “seamless view” for the consumer.
One suggestion focused on creating a summary comparison •of all product lines on OPA’s Report Card, but also creating website links to the “drill-down detail” that would be located independently in each government organization’s site.
Marketing OPATwo government stakeholders thought OPA should put more •effort into marketing itself. “Not many people [consumers and other decision makers] know about OPA and its Health Care Report Card.”
CommunicationStakeholders representing three different government organizations discussed the need for •OPA to define its end-users of the Report Card and Quality Portal (i.e., consumers, policy makers, purchasers, etc.). They suggested talking with end-users to learn how to present information in the most useful way.
One stakeholder finds • OPA’s website “user-friendly.”
Another stakeholder expressed interest in using • OPA’s experience with consumers and public reporting to help it “translate” its data and reports into a consumer-friendly format.
Concerns
Two stakeholders raised the issue of “clinical authority.” OPA “should not reinvent the wheel” •with regard to clinical quality measures, partly because it does not have the clinical expertise to do so. One stakeholder asked whether OPA should strive to gain more expertise in this area.
A stakeholder expressed concern for the financial and staff resources needed to maintain the •system for collecting, analyzing, and reporting quality data.
Also, some concern was expressed about data “freshness” and how to report data in a timely •manner.
“Not many people know about OPA and its Health Care Report Card.”
— Government agency
Chapter IV: Stakeholder Interviews
University of California, DavisCenter for Healthcare Policy and Research 55
Health Plans The health plans felt that OPA greatly improved its quality reporting over the years.
Collaborative EffortsTwo health plan stakeholders were supportive of OPA taking the lead in collaboration among •various stakeholders in reporting quality measures. They thought that OPA’s mission (“serving the interest of the people”) helps maintain the integrity and neutrality of quality reporting.
One stakeholder appreciated • OPA’s efforts to collaborate with the organizations that do the “heavy lifting” (data collection), and also appreciated that OPA participates in industry meetings around quality measurement.
MeasurementTwo stakeholders advised OPA to focus on the consumer •education aspect rather than measure development. They stated that OPA should not require more measurement or data collection, but instead it should simplify the information it already reports to consumers.
Two stakeholders reported that data collection is a burdensome •task and becomes more so when multiple groups ask for similar data in different formats.
Centralized Quality Performance Portal Site vs. Multiple Reporting SitesOne of the three health plan stakeholders suggested producing a central site where consumers •can compare the quality of care of all health care provider types.
CommunicationAll plan stakeholders said that communication is very important, but their emphasis differed •somewhat. Two said that OPA and other report card sponsors need to do more to understand whether the end users find the information helpful and understandable. One stakeholder also would like to know more about who uses the Report Card.
Another stakeholder urged OPA to focus on translating the information and educating the •public to understand the results published on its Report Card.
Two health plan stakeholders said that the rating format chosen to communicate health plan •performance is critical. The differences between many rates are insignificant or, in some cases, are due to documentation issues rather than actual performance issues. They advised OPA not to differentiate each plan, but perhaps simply aggregate indices (e.g., what are the best organizations? Or, “Males 50 yrs. + receive the best heart disease care at the following organizations...”). They felt this reporting method would be more meaningful to consumers.
“Explain the information you already have to consumers in a useful and simple manner.”
— Health plan
Quality Performance Measurement in CaliforniaFindings and Recommendations
University of California, DavisCenter for Healthcare Policy and Research56
One stakeholder mentioned that state benchmarks should be included in physician •organization performance reports so readers know how groups perform comparatively. It was noted that while consumers can’t choose between doctors who are located in L.A. and Sacramento, the pressure to improve a medical group’s overall rating compared to a state average probably would be motivating to physician organizations.
Consumer AdvocatesThe stakeholders gave positive reviews of OPA’s quality reporting efforts, but would like to see more health care quality information.
Statutory/Regulatory AuthorityThe consumer advocate stakeholders agreed that OPA lacks •the “political heft” to mandate data collection or reporting. Because reporting is voluntary, gaps exist in the data. There was a difference of opinion as to whether OPA should have statutory power to mandate data collection and reporting.
One stakeholder thought that there was no big role for OPA in •determining health care quality measures or public reporting.
Centralized Quality Performance Portal Site vs. Multiple Reporting SitesOne stakeholder commented on the various quality reporting •formats between different government websites. It was recommended that OPA work to centralize the reported data on one site with a uniform format for all government organizations.
Marketing OPAAll the consumer advocate stakeholders agreed that OPA should •focus more effort on marketing its Report Card to consumers.
Another stakeholder thought that the OPA budget for advertising •the Report Card was $50,000-$100,000 which is “not to California’s scale.” OPA needs to advocate for increased funding to improve its consumer outreach.
Communication and PresentationOne stakeholder advised OPA to take advantage of the research •and investment already made in social marketing. “There is much information available about how to communicate effectively with consumers, but it’s not been taken to the next level yet.”
“[OPA is] in a strange and contested space in government.”
— Consumer advocate
“There is much information available about how to effectively communicate with consumers, but it’s not been taken to the next level yet.”
— Consumer advocate
“Most consumers don’t know about the Report Card. A one shot effort is made annually and then it’s forgotten. You have done good work, but you’re not reaching consumers.”
—Consumer advocate
Chapter IV: Stakeholder Interviews
University of California, DavisCenter for Healthcare Policy and Research 57
One stakeholder commented that OPA draws no conclusions about the data reported (i.e., •“Health Plan A improved on all measures in 2006”). This type of summary would be very helpful to consumers.
Another stakeholder noted that trend information about health plan performance over a •specific time period is more important for decision makers (especially purchasers) than snapshot data.
One consumer group (Health Access) is open to linking its website to • OPA’s Quality Portal site.
Quality Reporting Organizations Collaborative Efforts
Three of the seven quality reporting organization stakeholders encouraged the pooling of •quality data. Specifically, two recommended that OPA encourage health plans to pool their databases to increase denominator sizes for physician reporting on efficiency and effectiveness. Another suggested that the state create a data warehouse where all health care entities would be required to report quality performance data (i.e., OSHPD cost data, and claims data from Medicare, commercial, Medi-Cal, FFS, etc.) to “give power to the numbers.” Maine was cited as a good example for pooling data. (It publicly released its pooled data in Spring 2008.)
One stakeholder mentioned some concern over whether OPA had the statutory power to •oversee the collection and pooling of data.
Another collaborative idea from a stakeholder was to encourage OPA and OSHPD to work •closely together.
MeasurementA quality reporting organization recommended that OPA encourage reporting data that can •be “rolled up and down” by levels: individual physicians, physician groups and health plans. Offering a variety of data presentations from summary aggregate measures to detailed granular measures would be very helpful to stakeholders with different interests.
One stakeholder suggested that OPA foster pressure in California to encourage more PPO •participation in HEDIS/CAHPS reporting.
Professional Associations/Physician Organizations These stakeholders reported their continued interest in collaborating with OPA on publicly reporting health care quality performance in California.
CommunicationOne stakeholder mentioned that OPA should provide simpler •information and less of it by focusing on the most meaningful measures. Obtaining feedback from OPA’s audience (providers
“More does not translate to better.”
—Professional association
Quality Performance Measurement in CaliforniaFindings and Recommendations
University of California, DavisCenter for Healthcare Policy and Research58
and “choice makers”) about the types of information they use in their decision making would be very helpful. Another stakeholder held a similar opinion. “How do you put together the metrics so that stakeholders (hospitals, consumers, purchasers, etc.) can look at a simplified report and draw valid conclusions about the comparative quality of hospitals? It doesn’t take 150 metrics to do this—maybe 15 or 22.”
One stakeholder recommended that OPA study social marketing and consumer usability •testing as ways to improve the usefulness of the Report Card.
One stakeholder considered educating the general population about the benefits and pitfalls of •data measurement as critical to fulfilling OPA’s mission.
MeasurementOne association/physician organization stakeholder mentioned •that OPA or its affiliates review the utility of measures periodically, especially if there is little to no difference in high ratings between groups.
Another association/physician organization stakeholder •mentioned that any focus on health disparities/equity needs to be well defined. CHIS data could be used to identify disparities between groups and focus public attention at the societal level rather than criticizing a clinical group practicing in an underfunded clinic. This stakeholder felt that underfunded clinics and underequipped facilities cannot be held responsible for health disparities.
Collaborative EffortsOne stakeholder mentioned that OPA should be involved with the California Regional Health •Information Organization (CalRHIO) Board and another mentioned that OPA should advocate for adequate Health Information Technology resources for physicians and medical groups.
Two stakeholders recommended that OPA reach out to practicing physicians and draw them •into the discussion about measures under consideration for public reporting.
“If the health issue has become less relevant, then retire the measure.”
—Professional association
University of California, DavisCenter for Healthcare Policy and Research
Chapter V: Findings and Recommendations
5959
V. Findings and Recommendations
These report findings demonstrate the need for California to coordinate a statewide, common quality measurement system that reduces duplicative quality data collection efforts. OPA is well positioned to facilitate much of this work due to to its positive reputation among a variety of stakeholders and its historic position within the hub of California’s quality measurement and public reporting network. The report recommendations provide methods to fill in existing measurement gaps, refine public reporting, and improve OPA’s communication efforts. OPA may use these suggestions individually or in combination with one another.
Data Gaps Revealed in InventoriesThe five QPM Inventories revealed gaps in the availability of measures related to some IOM domains and health conditions. Finding 1: Data Gaps The IOM’s Effectiveness domain (evidence-based avoidance of overuse of inappropriate care and underuse of appropriate care) had the most relevant number of quality indicators and provided the richest amount of quality data. The Patient-Centeredness (care is respectful and responsive to patient needs, preferences, and values) domain also had a significant number of related quality measures. Patient-centered measures were related mostly to the CAHPS patient experience survey series. Any information gaps found within the CAHPS survey topics are consistent across all providers because the core questions are essentially the same regardless of provider type.
The Safety and Timeliness domains (“avoidance of injury from care” and “wait times for care and harmful delays in care from patient or provider perspective,” respectively) had several quality measures sprinkled throughout each Inventory. The majority of Safety-related indicators reside in the Nursing Home and Hospital Inventories. The Timeliness indicators primarily related to administration of medications or patient perceptions of receiving timely care.
Recommendation 1A To shore up the number of reportable Safety indicators, OPA should continue to collaborate with the California Department of Public Health (CDPH) to report hospital adverse events (medical errors) and hospital acquired infection rates as available. Although data are not expected to be publicly available through CDPH until 2011, OPA may be able to assist CDPH by posting some data earlier on the existing OPA website. A link to the CDPH website should be maintained.
“Somebody needs to be delegated in California to help with this problem.”
—Reporting organization
“There’s a whole universe of stuff that isn’t looked at. What we’re measuring isn’t quality overall, but just pieces of quality.”
—Government agency
Quality Performance Measurement in CaliforniaFindings and Recommendations
University of California, DavisCenter for Healthcare Policy and Research6060
Recommendation 1B OPA should translate the surgeon-specific data from OSHPD’s CABG surgery reports into consumer-friendly terms and post findings on its Portal site. This will boost the number of patient safety indicators publicly reported while making these results more accessible to consumers.
Recommendation 1C New physician safety-related metrics may soon be available for public reporting, and OPA should evaluate their suitability. Although sources, such as Medicare’s Physician Quality Reporting Initiative and Integrated Healthcare Association’s (IHA) P4P, do not yet publicly report individual physician metrics, OPA should advocate for the public release of this information and be prepared to report it when available.
Finding 2: Data Gaps Inventory analysis and stakeholder interviews confirmed that there is a dearth of indicators related to the IOM domains of Efficiency (avoidance of wasting resources) and Equity (care that does not vary based on population or individual characteristics). Although there are few Efficiency measures
currently available, most quality reporting organizations reported a concerted effort to developing “efficiency of care” or “episodes of care” metrics. These metrics combine multiple interventions (e.g., pharmacy, lab, hospital and physician services) used to treat a health condition and capture the efficiency of care delivered. Theoretically, Equity can be measured using almost any quality indicator as long as sociodemographic data are collected and linked to the indicators.
More could be done to examine disparities in care using equity-related measures. (For example, a researcher recently presented Medi-Cal plan performance data by race, ethnicity, and language [Rodriguez, 2008]).
Recommendation 2A To advance the development and implementation of Efficiency measures, OPA should advocate for the public use of reporting organizations’ proprietary “episodes of care” metrics that are under development (e.g, RAND or Thomson/MedStat) and track other emerging efficiency indicators (e.g., IHA and Hospital Value Initiative) to ensure their inclusion in the Portal once they are available.
Recommendation 2B OPA should work with its quality measurement and public reporting network (both public and private sectors) to construct a plan for collecting and reporting Equity measures at all levels of health care. For example, OPA should continue its effort to encourage CCHRI to use sociodemographic data already collected in the CAHPS survey. Also, if the results
“There is still a struggle with how to capture or measure efficiency.”
—Reporting organization
“The rubber hits the road with reporting on [individual] doctor and hospital providers.”
—Government agency
Chapter V: Findings and Recommendations
University of California, DavisCenter for Healthcare Policy and Research 61
from an ongoing NCQA pilot project determine that (Medicare) plan data can be used to examine health disparities, OPA should advocate for matching Equity data with existing clinical quality measures and reporting health care disparities. Using pooled data may address concerns about appropriate sample sizes.
Finding 3: Data GapsStakeholders agreed that there are a sufficient number of quality measures available (some of “better quality than others”) and that reporting entities need to selectively choose indicators that reduce the data collection burden on providers. Stakeholders encouraged OPA to report on indicators that:
reflect variation in quality (significant differences)•provide opportunities for improvement •focus on elective interventions•target clinically important conditions (high cost or prevalence)•
Recommendation 3A Using this set of criteria, OPA should periodically review the indicators it publicly reports. Indicators with little variation or where opportunities for improvement are low or non-existent should be replaced with more informative indicators where provider or consumer actions will result in improvements. As a first step to determining the threshold for such decisions, OPA might consider convening a technical panel to review specific criteria.
Finding 4: Data GapsAcross the spectrum of health care stakeholders interviewed, most acknowledged or agreed that the more granular or discrete the reporting level the better. For example, most stakeholders believed that reporting at the individual physician level was crucial to consumer decision making and should be the next step in public reporting, and yet little information is publicly available by provider. There are many nationally-approved process and quality indicators measuring physician performance at the individual and organizational levels (see Physician Organization Inventory in Appendix D for details).
One state initiative, CCHRI’s California Physician Performance Initiative (CPPI), collects data at the individual physician level with results privately reported to participating physicians. However, this initiative is in a pilot phase and concerns remain about data reliability and whether results are accurate enough for public reporting.
Recommendation 4A Reporting quality data at the individual physician level will take patience and tenacity. To help bridge the political chasm and push forward with reporting California physician quality, OPA should continue to work with IHA in reporting quality by physician organization, and also should consider partnering with CAPG to publicly report data from its proprietary Standards of Excellence survey (survey details on page 46). While the survey does not measure clinical quality, accepting CAPG’s invitation to share its Information Technology survey results can serve as a critical step for OPA to establish a positive relationship with physician organizations.
“There is more value at discrete levels of reporting.”
—Reporting organization
Quality Performance Measurement in CaliforniaFindings and Recommendations
University of California, DavisCenter for Healthcare Policy and Research62
Recommendation 4B OPA should consider supporting CCHRI in its effort to eventually publicly report individual physician performance data. As a neutral third-party, OPA can work with vested stakeholders and advocate for establishing acceptable physician data collection methods to improve Californian’s access to useful, pertinent health care information. In addition, OPA’s support for expanding CCHRI (and IHA) data collection to include Medicare and Medi-Cal data would help address the issue of small denominators (which is a significant barrier to physician performance measurement) and permit more detailed, product line analyses.
Recommendation 4C In addition, participating in national initiatives, such as the Consumer-Purchaser Disclosure Project or Charter Value Exchanges (project descriptions on page 27), would support OPA’s effort to bring individual physician performance results to the public. Participation in national initiatives also may allow California earlier access to national benchmark data to compare with California data.
Finding 5: Data GapsOPA highlighted nine key health conditions in the QPM Inventories. Of these, at least half had quality measures related to them. The most frequently measured conditions related to heart disease, cancer, asthma, and diabetes. Those health conditions less likely to have quality measures associated with them were mental health, COPD, reproductive health, hypertension, and musculoskeletal conditions.
In addition to the key conditions of interest, the Inventories also included metrics related to a handful of other health conditions and care methods including pneumonia (community-acquired), surgical infection prevention, stroke, gastroesophageal reflux disease, immunizations, and antibiotic timing. The vast majority of the conditions of interest to stakeholders were measured with hospital process or structure metrics rather than health outcomes metrics.
Recommendation 5A OPA should work with its quality measurement and public reporting network (both public and private sectors) to periodically review the types of health conditions measured to ensure that the high cost or high prevalence conditions are included in public reporting (and replace those conditions not meeting the criteria). Specifically, OPA could collaborate with CDPH and OSPHD in 2009 on highlighting hospital-acquired infection rates.
“The unit of analysis should be more granular—especially from the consumers’ perspective.”
—Reporting organization
“Reporting at the physician and hospital levels is the most useful to stakeholders. Reporting at the plan level is only a necessary to stop to getting the system to move toward full reporting at the practitioner level.”
—Professional association
Chapter V: Findings and Recommendations
University of California, DavisCenter for Healthcare Policy and Research 63
Recommendation 5B OPA should report on its Portal site the progress of DMHC’s “Right Care Initiative,” which supports managed care plans efforts to meet the national 90th percentile goal for diabetes, heart disease, and hospital-acquired infection care. Information for consumers should include “Why this is important” information similar to the summaries offered in OPA’s Health Plan Report Card. As goals are met and new initiatives emerge, OPA’s focus should change to highlight other issues. Such an effort would demonstrate coordinated effort by California to improve quality of care.
OPA’s Role in Measurement and Public ReportingOPA enjoys a favorable reputation among the stakeholders interviewed due, in part, to its continued, inclusive efforts to solicit feedback from these organizations. Stakeholders believe OPA should continue to publicly report available quality measures, and it also should facilitate stakeholder discussions. However, stakeholders concluded that OPA should refrain from developing or mandating quality measures.
Finding 6: OPA’s Role Stakeholders from the public and private sectors perceived OPA as the appropriate, neutral organization for reporting health care quality data. Several stakeholders identified OPA as the appropriate entity to organize stakeholder discussions about publicly reporting information about quality.
In general, the Portal concept was supported and considered to be the appropriate location for communicating California’s health care information.
Several stakeholders advised that OPA refrain from developing clinical quality measures because other organizations are more qualified to create those types of quality indicators. One stakeholder specifically cautioned OPA to avoid this type of “mission creep.” Instead, OPA should report those measures endorsed by respected organizations, such as NQF or AQA.
Recommendation 6A OPA should engage the Health and Human Services and Business, Transportation and Housing Agencies, and the Governor’s office to coordinate health care quality measurement and reporting in California. A centralized, coordinated effort to measure and report quality across the health care spectrum would reduce the burden on providers and would ensure a robust and efficient quality performance reporting system.
“OPA has done a valuable service.”
—Professional association
“[OPA should] beware of mission creep—don’t go beyond public reporting.”
—Reporting organization
Quality Performance Measurement in CaliforniaFindings and Recommendations
University of California, DavisCenter for Healthcare Policy and Research64
Finding 7: OPA’s RoleStakeholders from all categories identified the need for OPA to clearly define the audience(s) or end-user(s) it serves. There are many groups with distinct interests that are interested in quality performance data (e.g., privately insured consumers, government agencies, policy makers, providers, etc.) and many stakeholders were confused as to which group(s) OPA serves.
Recommendation 7AOPA should reaffirm and clearly identify its target audiences, which should include managed health care members (including PPO subscribers), policy makers, researchers, and publicly-insured beneficiaries. OPA should consider making a “Research and Policy” tab more prominent by moving it to first level (green) bar rather than its current position at the second level (blue) bar under “Quality Report Card.” This new format would be more dynamic and permit repackaging of valuable quality data that would provide public decision makers with critical information applicable to the macro level. Specific reports may include product line comparisons, trend information, or regional variation in care. National benchmark data, California IMR data, and white papers addressing emerging issues could be housed in this location as well.
Finding 8: OPA’s Role Government stakeholder comments about gaps in measures revealed that a tension exists between the increasing pressures on government entities to collect, analyze and publish quality data and the entities’ traditional regulatory role. Most of the government organizations related to health care are regulating bodies charged with enforcing state laws and regulations. Publicly reporting the quality of health care is a new role for most entities and one that requires more technical and financial support. OSHPD, CDI, MRMIB and DHCS were amenable to OPA’s assistance in public reporting.
Recommendation 8A OPA’s first overtures for government collaboration were made at its April 2008 “Public Reporting on Health Care Quality for California State Agencies” meeting and should be followed up with the interested departments. Specifically, OPA should continue to work with OSHPD to translate some of OSHPD’s valuable hospital quality data into lay terms for public reporting on OPA’s website. Choosing to report “elective” treatments that OSHPD studied would yield the most benefit to consumers.
Recommendation 8B Continued collaboration with CDI to post new PPO quality data results on the OPA and CDI websites is another suggestion for OPA. From a consumer perspective, it would be more efficient to have all PPO and HMO plan results published on one site rather than
“OPA, OSHPD, and CDPH could work together to change the focus from just process measures to outcomes measures.”
—Government agency
“We are willing to share any information to improve the report card because we know there is value there for the beneficiaries.”
—Government agency
Chapter V: Findings and Recommendations
University of California, DavisCenter for Healthcare Policy and Research 65
forcing consumers to toggle between multiple sites. Assuming CDI also publishes the PPO data on its own website, OPA should offer its Report Card template and reporting expertise to CDI to achieve a uniform presentation for consumers.
Recommendation 8C OPA should also continue to forge a reporting partnership with DHCS and MRMIB to provide quality data that are pertinent to their beneficiaries and are easily accessible through the OPA website. This approach not only provides important quality performance information, but also permits these beneficiaries to use other helpful information links provided only through the Quality Portal site. Furthermore, reporting the public insurance system’s information about quality on the same site as commercial plan information allows researchers and policy makers to compare product lines. Similar to the CDI approach, the same information could reside on the DHCS and MRMIB websites to increase the probability that consumers will access and use this information.
Finding 9: OPA’s Role Public reporting of quality data is increasing, but many stakeholders remarked that consumers are not considering the information in their health care decisions. Stakeholders speculated the reasons may be because:
ultimately, consumers have very little control over provider choices (especially those enrolled •in public insurance programs), the measures reported reflect conditions where patients have no choice in choosing care (heart •attack care versus maternity care), the measures are not at a specific enough level (“how does • my doctor rate?”), or the measures are not outcomes related. This observation relates to an aforementioned finding •that choosing the “correct” (useful and “actionable”) indicators are critical to effective public reporting.
Recommendation 9A To encourage more consumer use of data, OPA should facilitate a roundtable discussion
with public and private sector stakeholders in and beyond California’s quality measurement hub. The meeting goal should focus on the types and number of quality measures that California should be reporting. Possible agenda topics include culling non-informative metrics (due to no variation or standard met), choosing new metrics for conditions that are high cost/prevalence, identifying additional conditions
for a public-private partnership to target for improvement (similar to DMHC’s “Right Care Initiative”), identifying funding needs and sources, increasing decision maker use of such quality data, and creating a single data warehouse that pools data (i.e., lab, pharmacy, hospital and physician data, etc.) from the private and public sectors.
“Push one reporting system that is not duplicative.”
—Professional association
Quality Performance Measurement in CaliforniaFindings and Recommendations
University of California, DavisCenter for Healthcare Policy and Research66
Presentation and Dissemination of Report Card and Portal InformationBoth information access and data presentation are important to stakeholders.
Finding 10: Presentation and Dissemination of Portal InformationThe vast majority of stakeholders agreed that displaying information in a uniform manner is critical to effective communication with OPA’s audience(s). They believe that a consistent format would enhance the users’ understanding of quality data across service providers or product lines.
Stakeholder opinions about the most appropriate and effective presentation style varied, but there was consensus on the need to identify OPA’s audience before measures are selected and the results are communicated (Recommendation 7A). Once the audience was defined, agreement on a presentation style would be more easily achieved.
Recommendation 10A OPA should consider capitalizing on its current format to create “theme” tabs on its website. Tabs summarizing all quality measures (i.e., hospital, physician, and health plan) related to a particular population (e.g., children) or a health condition could be useful to consumers who would like to know more about the continuum of care.
Recommendation 10B Using the same tabular website design, OPA should redesign the box format to make all sectors of the health care industry (i.e., hospital, nursing home, etc.) more prominent and expand the data presented. For example, OPA could propose adopting CHCF’s CalNursingHome reporting system and publishing the results on the Portal under a “Nursing Home” tab. Alternatively, OPA could simply summarize or highlight CHCF’s key nursing home findings on the Portal and offer a link to the CHCF site.
Recommendation 10C Publishing on OPA’s website either specific or summary quality performance results from all health care sectors (rather than relying exclusively on website links to government departments) provides an opportunity for more consistent formatting and presentation. A uniform presentation can help the public understand complicated data and apply it comparatively.
“There has been much investment in studying social marketing, but no one’s taken it on the way it needs to be taken on.”
—Consumer advocate
Chapter V: Findings and Recommendations
University of California, DavisCenter for Healthcare Policy and Research 67
Finding 11: Presentation and Dissemination of Portal InformationSome of the stakeholders encouraged OPA to study social marketing strategies to continue refining its consumer communication efforts.
Recommendation 11A OPA is in the process of exploring social marketing strategies and should share the QPM report findings with appropriate consultants to ensure consideration of issues such as determining OPA’s audience(s), and choosing appropriate reporting formats that accommodate multiple health care sectors (hospitals, health plans, physician organizations, etc.).
Finding 12: Presentation and Dissemination of Portal Information Stakeholders from different health care sectors believed that OPA could and should improve consumer awareness about its service.
Recommendation 12A Finding more opportunities throughout the year to promote the Report Card and Quality Portal website would benefit OPA, rather than relying on one annual press conference. For example, if a health plan is fined by DMHC, OPA could partner with DMHC to incorporate the Quality Portal website into the story. This would require designing a public relations campaign and encouraging OPA’s sister departments to promote the Report Card and Quality Portal.
Recommendation 12BOPA should consider collaborating with organized groups (i.e., legislators, health advocacy groups, consumer representatives, etc.) to sponsor “mini-town hall meetings” or “state of the state” presentations about health care quality (plans, physicians, hospitals, etc.) across California throughout the year.
Recommendation 12CAsking health plans, hospitals, physician groups and other government departments (i.e., CDI, CDPH, OSHPD, etc.) to add prominent links on their websites to OPA’s Quality Portal would also increase consumer awareness of OPA’s services and facilitate consumer education. (Six of the eight health plans profiled on the OPA Report Card link to the OPA website, but it frequently required a minimum of four clicks into the website before a link was found.)
Finding 13: Presentation and Dissemination of Portal Information Stakeholders’ comfort and familiarity with quality performance measurement and public reporting methods vary markedly. There appears to be great opportunity for more education in these two areas to build a solid and even foundation for stakeholders.
“Do people know about the website? What has OPA done to promote the site to the public?”
—Government agency
Quality Performance Measurement in CaliforniaFindings and Recommendations
University of California, DavisCenter for Healthcare Policy and Research68
Recommendation 13A OPA should consider educating health care stakeholders in quality measurement and public reporting. OPA should continue sponsoring periodic seminars (i.e., “Lunch n’ Learn”) about both topics.
Finding 14: Presentation and Dissemination of Portal Information Many government colleagues mentioned that they could benefit from OPA’s years of experience in reporting quality.
Recommendation 14A When possible, OPA could act as an “internal quality reporting consultant” to other state departments that need help with quality reporting. OPA provides a strategic link to quality performance measurement and reporting in California and possesses useful knowledge and contacts. Formally designating an OPA staff person as an “internal consultant” would be helpful to OPA’s colleagues and may help push forward other QPM Report recommendations that rely on cooperation from these departments.
Recommendation 14BOPA may wish to act as a conduit between funding groups and state departments in need of enhancing quality reporting. OPA could monitor (through in-house staff or a contractor) possible sources of funding and communicate RFPs to a listserv of interested state departments.
University of California, DavisCenter for Healthcare Policy and Research
Chapter VI: Appendices
6969
Appendix A
List of Stakeholders Interviewed

University of California, DavisCenter for Healthcare Policy and Research 71
Chapter VI: AppendicesAppendix A: Stakeholders Interviewed
Stakeholders InterviewedCalifornia Government Organizations
Kathryn Lowell, Undersecretary Business, Transportation and Housing Agency
Mary Wieg, RN, Nurse Consultant II CalPERS Office of Health Policy Research
Sandra Shewry, Director Department of Health Care Services (Delegated to Ellie Birnbaum: Ellie Birnbaum interviewed in person 3/3/08 with Rene
Mollow, Dean Skertis, Larry Dickey, MD, Don Fields, Ellen Badley and Vanessa Baird)
David Link, Deputy Commissioner, Legislative Director Department of Insurance
Hattie Hanley, Health Policy Advisor, Office of the Director Department of Managed Health Care
Kathleen Billingsley, Deputy Director Department of Public Health
Ruth Liu, Associate Secretary for Health Policy Development Health and Human Services Agency
Shelley Rouillard, Deputy Director Benefits and Quality Monitoring Major Risk Medical Insurance Board
Herb Schultz, Senior Health Policy Advisor Office of the Governor David Carlisle, MD, Director Office of Statewide Health Planning and Development
Health Plan Representatives
Melissa Welch, MD, Medical Director Terri Schroeder, West Region Director, Quality Management
Aetna, West Region Mike Belman, MD, Vice President & Medical Director
Anthem Blue Cross of California
Quality Performance Measurement in CaliforniaFindings and Recommendations
University of California, DavisCenter for Healthcare Policy and Research72
Joel Hyatt, MD, Assistant Regional Medical Director Kaiser Permanente Southern California
Andy Amster, Director, Integrated Analytics Care Management Institute Kaiser Permanente
Consumer Advocacy Groups
Casey Young, Advocacy Manager AARP
Patricia Powers, President & CEO Center for Health Improvement
Betsy Imholz, Director of Special Projects Consumers Union-West Coast
Anthony Wright, Executive DirectorElizabeth Abbott, Project Director Health Access California
Quality Reporting Organizations
Maribeth Shannon, Director, Market & Policy Monitor California HealthCare Foundation
Bruce Spurlock, MD, Chairman CHART Steering Committee California Hospital Assessment and Reporting Taskforce (CHART)
Tom Williams, Executive Director Integrated Healthcare Association
Greg Pawlson, MD, Executive Vice President National Committee for Quality Assurance
Arnold Milstein, MD, Medical Director Pacific Business Group on Health
Cheryl Damberg, Public Policy and Health Services Research RAND Health
Mahil Senathirajah, Senior Research Manager Thomson Healthcare
University of California, DavisCenter for Healthcare Policy and Research 73
Chapter VI: AppendicesAppendix A: Stakeholders Interviewed
Professional Associations/Physician Organizations Chris Ohman, President & CEO
California Association of Health Plans
Wells Shoemaker, MD, Medical DirectorCalifornia Association of Physician Groups
Duane Dauner, President & CEO California Hospital Association
Richard Frankenstein, MD, President California Medical Association
Alan Glasseroff, MD, Chief Medical Officer Humboldt-Del Norte Foundation for Medical Care
Contacted
Foundation for Taxpayer and Consumer Rights
Hill Physicians Medical Group, Inc.

University of California, DavisCenter for Healthcare Policy and Research
Chapter VI: AppendicesAppendix B: Background Materials for Interview
7575
Appendix B
Background Information for Interviews
Letter of Invitation•Interview Protocol•Data Dictionary•

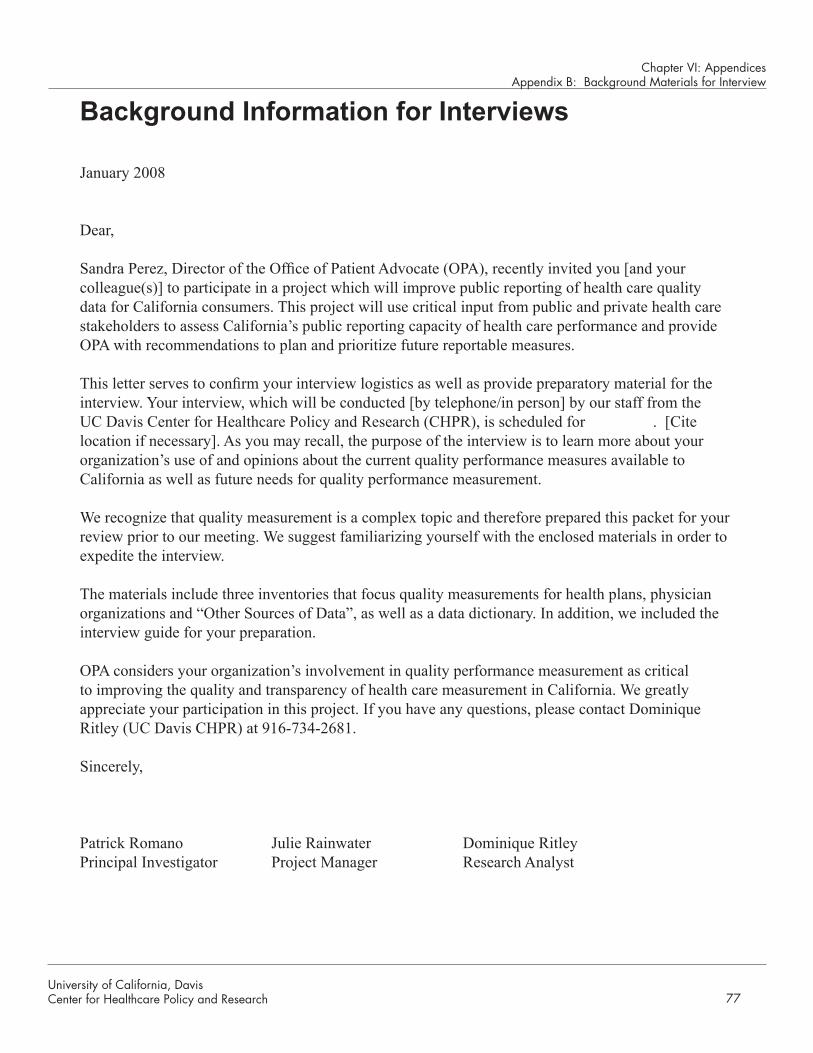
University of California, DavisCenter for Healthcare Policy and Research 77
Chapter VI: AppendicesAppendix B: Background Materials for Interview
Background Information for Interviews
January 2008
Dear,
Sandra Perez, Director of the Office of Patient Advocate (OPA), recently invited you [and your colleague(s)] to participate in a project which will improve public reporting of health care quality data for California consumers. This project will use critical input from public and private health care stakeholders to assess California’s public reporting capacity of health care performance and provide OPA with recommendations to plan and prioritize future reportable measures.
This letter serves to confirm your interview logistics as well as provide preparatory material for the interview. Your interview, which will be conducted [by telephone/in person] by our staff from the UC Davis Center for Healthcare Policy and Research (CHPR), is scheduled for . [Cite location if necessary]. As you may recall, the purpose of the interview is to learn more about your organization’s use of and opinions about the current quality performance measures available to California as well as future needs for quality performance measurement.
We recognize that quality measurement is a complex topic and therefore prepared this packet for your review prior to our meeting. We suggest familiarizing yourself with the enclosed materials in order to expedite the interview.
The materials include three inventories that focus quality measurements for health plans, physician organizations and “Other Sources of Data”, as well as a data dictionary. In addition, we included the interview guide for your preparation.
OPA considers your organization’s involvement in quality performance measurement as critical to improving the quality and transparency of health care measurement in California. We greatly appreciate your participation in this project. If you have any questions, please contact Dominique Ritley (UC Davis CHPR) at 916-734-2681.
Sincerely,
Patrick Romano Julie Rainwater Dominique RitleyPrincipal Investigator Project Manager Research Analyst
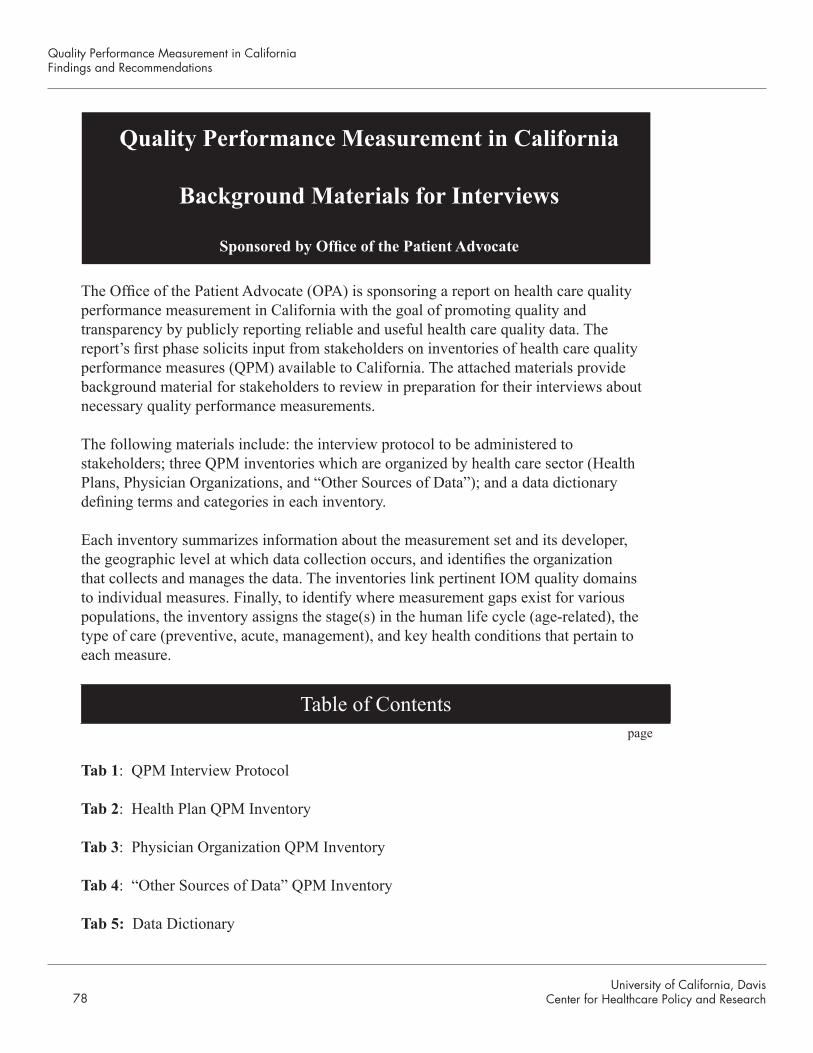
Quality Performance Measurement in CaliforniaFindings and Recommendations
University of California, DavisCenter for Healthcare Policy and Research78
Quality Performance Measurement in California
Background Materials for Interviews
Sponsored by Office of the Patient Advocate
The Office of the Patient Advocate (OPA) is sponsoring a report on health care quality performance measurement in California with the goal of promoting quality and transparency by publicly reporting reliable and useful health care quality data. The report’s first phase solicits input from stakeholders on inventories of health care quality performance measures (QPM) available to California. The attached materials provide background material for stakeholders to review in preparation for their interviews about necessary quality performance measurements.
The following materials include: the interview protocol to be administered to stakeholders; three QPM inventories which are organized by health care sector (Health Plans, Physician Organizations, and “Other Sources of Data”); and a data dictionary defining terms and categories in each inventory. Each inventory summarizes information about the measurement set and its developer, the geographic level at which data collection occurs, and identifies the organization that collects and manages the data. The inventories link pertinent IOM quality domains to individual measures. Finally, to identify where measurement gaps exist for various populations, the inventory assigns the stage(s) in the human life cycle (age-related), the type of care (preventive, acute, management), and key health conditions that pertain to each measure.
Table of Contents page
Tab 1: QPM Interview Protocol
Tab 2: Health Plan QPM Inventory
Tab 3: Physician Organization QPM Inventory Tab 4: “Other Sources of Data” QPM Inventory
Tab 5: Data Dictionary
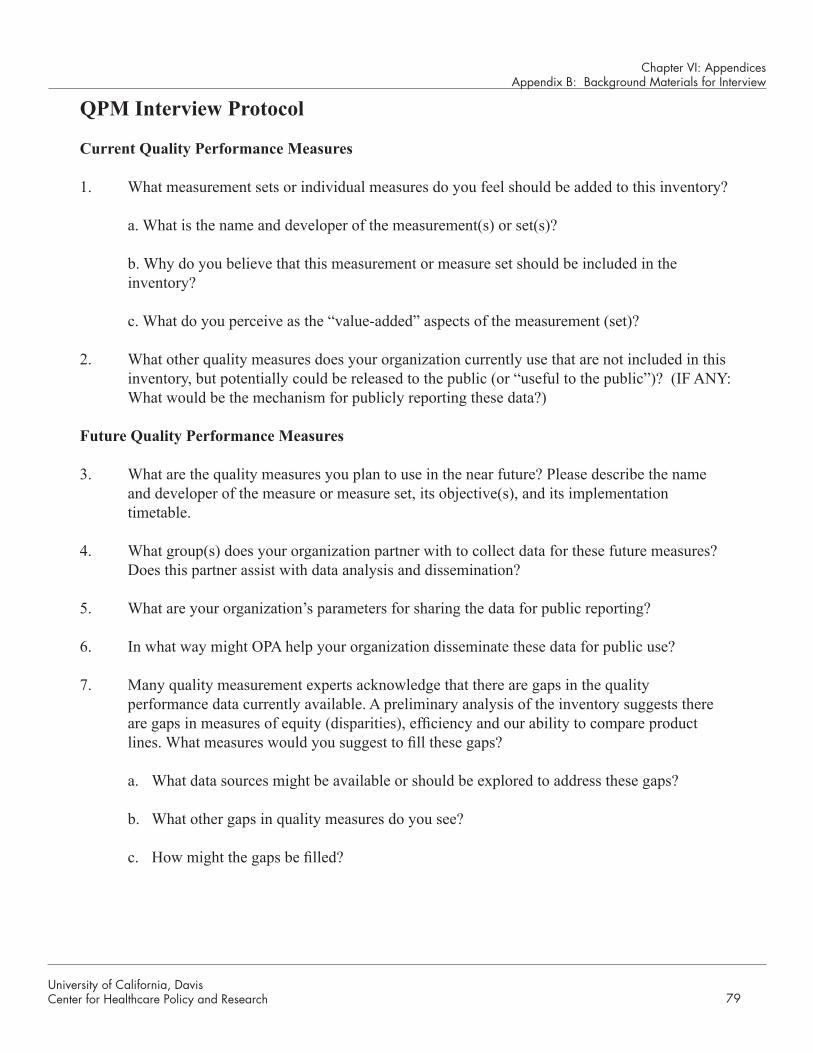
University of California, DavisCenter for Healthcare Policy and Research 79
Chapter VI: AppendicesAppendix B: Background Materials for Interview
QPM Interview Protocol
Current Quality Performance Measures
What measurement sets or individual measures do you feel should be added to this inventory? 1. a. What is the name and developer of the measurement(s) or set(s)? b. Why do you believe that this measurement or measure set should be included in the inventory? c. What do you perceive as the “value-added” aspects of the measurement (set)?
What other quality measures does your organization currently use that are not included in this 2. inventory, but potentially could be released to the public (or “useful to the public”)? (IF ANY: What would be the mechanism for publicly reporting these data?)
Future Quality Performance Measures
What are the quality measures you plan to use in the near future? Please describe the name 3. and developer of the measure or measure set, its objective(s), and its implementation timetable.
What group(s) does your organization partner with to collect data for these future measures? 4. Does this partner assist with data analysis and dissemination?
What are your organization’s parameters for sharing the data for public reporting?5.
In what way might OPA help your organization disseminate these data for public use? 6.
Many quality measurement experts acknowledge that there are gaps in the quality 7. performance data currently available. A preliminary analysis of the inventory suggests there are gaps in measures of equity (disparities), efficiency and our ability to compare product lines. What measures would you suggest to fill these gaps?
What data sources might be available or should be explored to address these gaps? a.
What other gaps in quality measures do you see? b.
How might the gaps be filled?c.
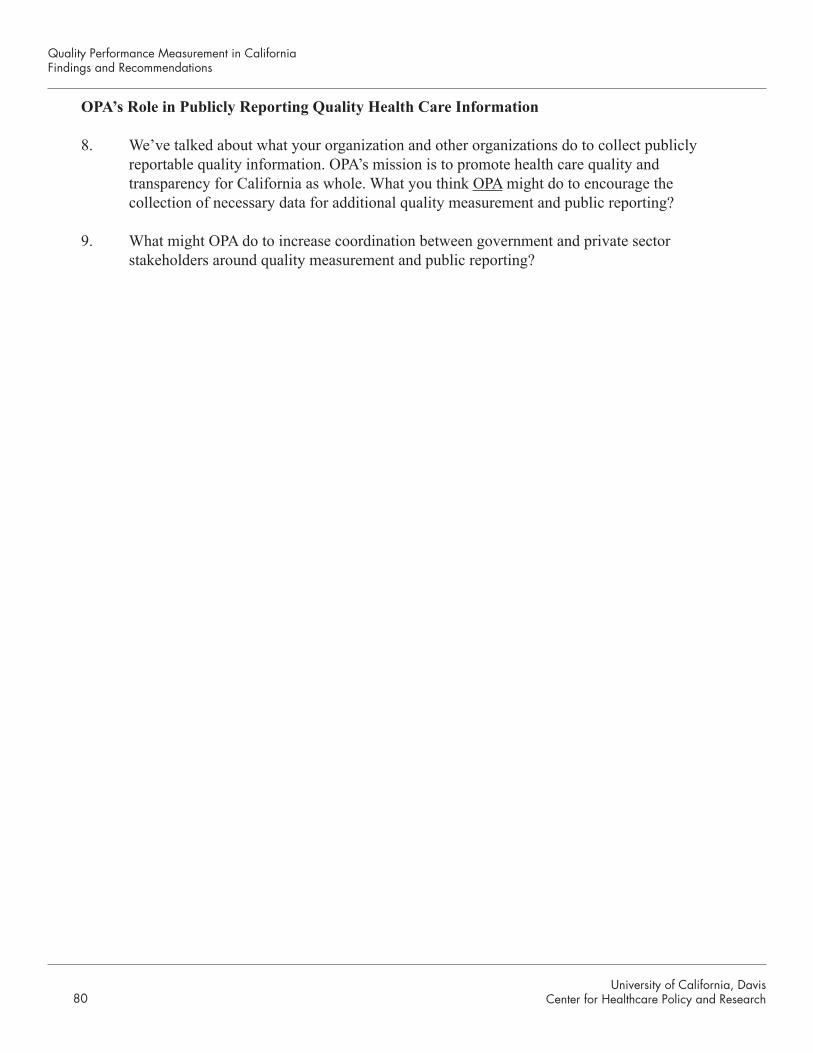
Quality Performance Measurement in CaliforniaFindings and Recommendations
University of California, DavisCenter for Healthcare Policy and Research80
OPA’s Role in Publicly Reporting Quality Health Care Information
We’ve talked about what your organization and other organizations do to collect publicly 8. reportable quality information. OPA’s mission is to promote health care quality and transparency for California as whole. What you think OPA might do to encourage the collection of necessary data for additional quality measurement and public reporting?
What might OPA do to increase coordination between government and private sector 9. stakeholders around quality measurement and public reporting?
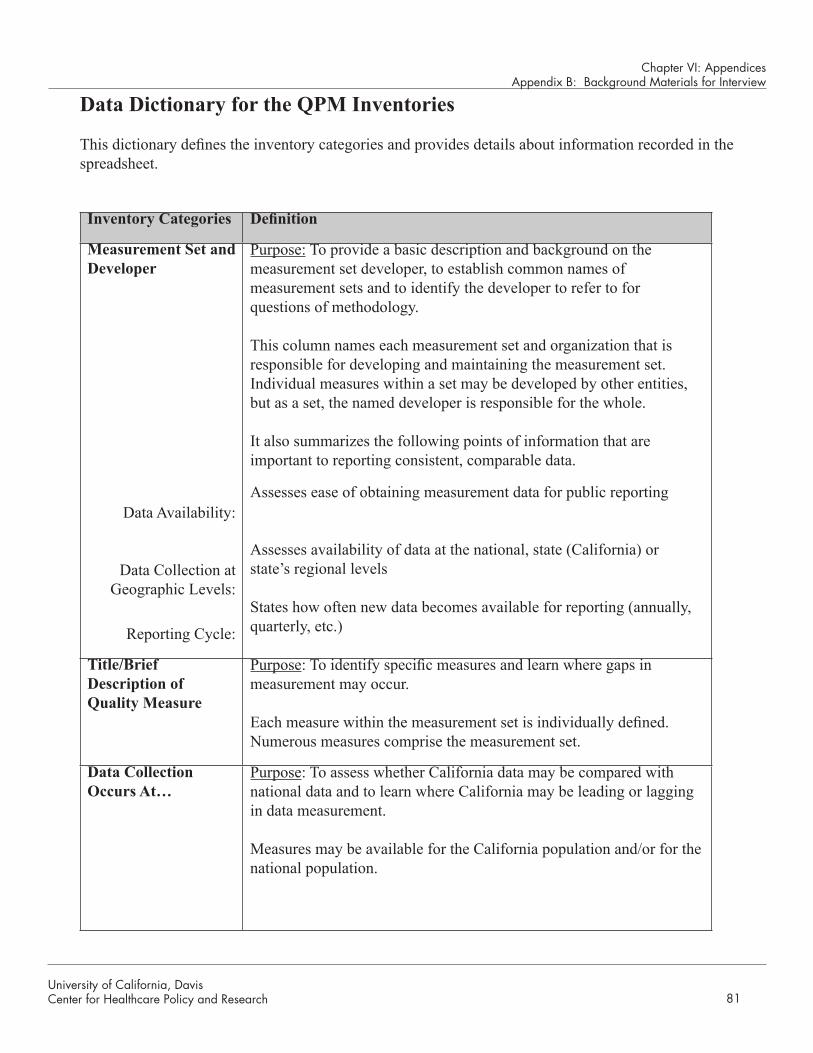
University of California, DavisCenter for Healthcare Policy and Research 81
Chapter VI: AppendicesAppendix B: Background Materials for Interview
Data Dictionary for the QPM Inventories
This dictionary defines the inventory categories and provides details about information recorded in the spreadsheet.
Inventory Categories Definition
Measurement Set and Developer
Data Availability:
Data Collection at Geographic Levels:
Reporting Cycle:
Purpose: To provide a basic description and background on the measurement set developer, to establish common names of measurement sets and to identify the developer to refer to for questions of methodology.
This column names each measurement set and organization that is responsible for developing and maintaining the measurement set. Individual measures within a set may be developed by other entities, but as a set, the named developer is responsible for the whole. It also summarizes the following points of information that are important to reporting consistent, comparable data.
Assesses ease of obtaining measurement data for public reporting
Assesses availability of data at the national, state (California) or state’s regional levels
States how often new data becomes available for reporting (annually, quarterly, etc.)
Title/Brief Description of Quality Measure
Purpose: To identify specific measures and learn where gaps in measurement may occur.
Each measure within the measurement set is individually defined. Numerous measures comprise the measurement set.
Data Collection Occurs At…
Purpose: To assess whether California data may be compared with national data and to learn where California may be leading or lagging in data measurement.
Measures may be available for the California population and/or for the national population.
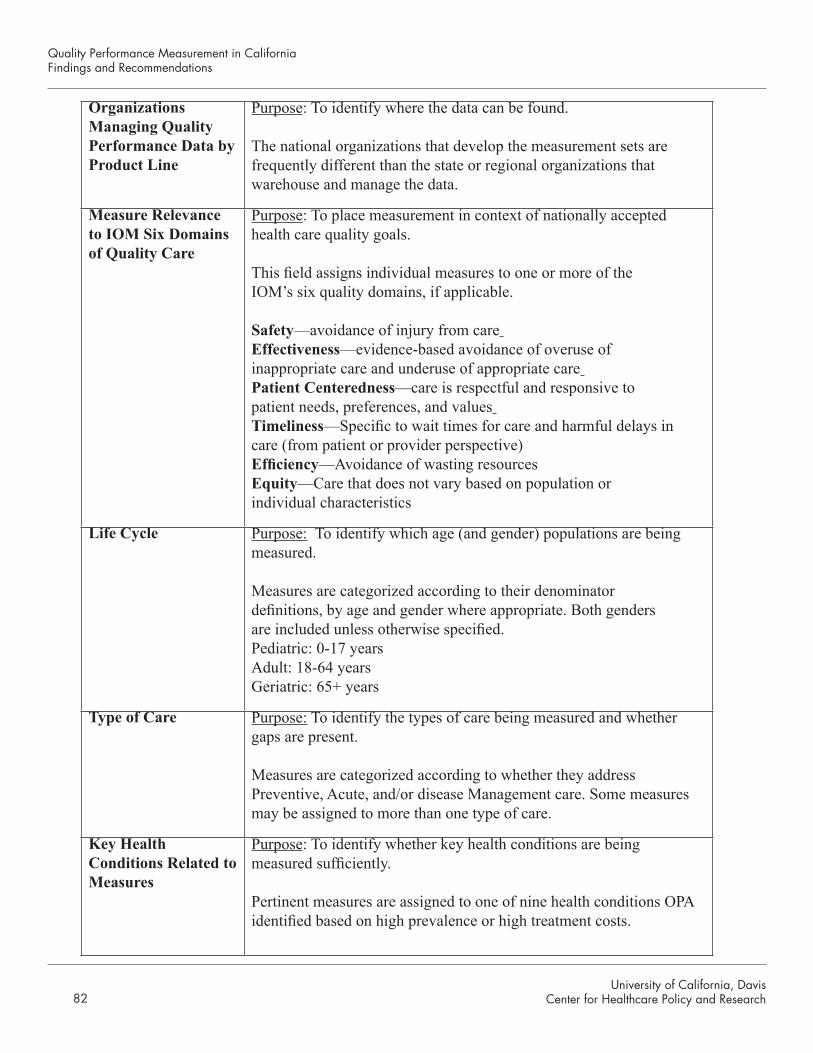
Quality Performance Measurement in CaliforniaFindings and Recommendations
University of California, DavisCenter for Healthcare Policy and Research82
Organizations Managing Quality Performance Data by Product Line
Purpose: To identify where the data can be found.
The national organizations that develop the measurement sets are frequently different than the state or regional organizations that warehouse and manage the data.
Measure Relevance to IOM Six Domains of Quality Care
Purpose: To place measurement in context of nationally accepted health care quality goals.
This field assigns individual measures to one or more of the IOM’s six quality domains, if applicable.
Safety—avoidance of injury from care Effectiveness—evidence-based avoidance of overuse of inappropriate care and underuse of appropriate care Patient Centeredness—care is respectful and responsive to patient needs, preferences, and values Timeliness—Specific to wait times for care and harmful delays in care (from patient or provider perspective)Efficiency—Avoidance of wasting resourcesEquity—Care that does not vary based on population or individual characteristics
Life Cycle Purpose: To identify which age (and gender) populations are being measured.
Measures are categorized according to their denominator definitions, by age and gender where appropriate. Both genders are included unless otherwise specified.Pediatric: 0-17 yearsAdult: 18-64 yearsGeriatric: 65+ years
Type of Care Purpose: To identify the types of care being measured and whether gaps are present.
Measures are categorized according to whether they address Preventive, Acute, and/or disease Management care. Some measures may be assigned to more than one type of care.
Key Health Conditions Related to Measures
Purpose: To identify whether key health conditions are being measured sufficiently.
Pertinent measures are assigned to one of nine health conditions OPA identified based on high prevalence or high treatment costs.
University of California, DavisCenter for Healthcare Policy and Research 83
Chapter VI: AppendicesAppendix C: References
Appendix C
References

University of California, DavisCenter for Healthcare Policy and Research 85
Chapter VI: AppendicesAppendix C: References
References
Advancing Excellence in America’s Nursing Homes. Nursing Home Quality Campaign. Available at: http://www.nhqualitycampaign.org/star_index.aspx?controls=about. Accessed March 2008.
Agency for Healthcare Research and Quality. Consumer Assessment of Healthcare Providers and Systems-Health Plan Survey 4.0. 2007. Available at: http://www.cahps.ahrq.gov/content/products/HP3/PROD_HP3_Version40.asp?p=1021&s=211 Accessed December 2007.
Agency for Healthcare Research and Quality. Consumer Assessment of Healthcare Providers and Systems-Item Set for Children with Chronic Conditions 2007. Available at http://www.cahps.ahrq.gov/content/products/CCC/PROD_CCC_Intro.asp?p=1021 Accessed October 2007.
Agency for Healthcare Research and Quality. Consumer Assessment of Healthcare Providers and Systems-Health Plan Survey 4.0. 2007. Available at:https://www.cahps.ahrq.gov/content/products/PROD_AmbCareSurveys.asp?p=102&s=21 Accessed October 2007.
Agency for Healthcare Research and Quality. Consumer Assessment of Healthcare Providers and Systems-Health Plan Survey Component. 2007. Available at:https://www.cahps.ahrq.gov/content/NCBD/HP/NCBD_HP_Intro.asp?p=105&s=52 Accessed November 2007.
Agency for Healthcare Research and Quality. Consumer Assessment of Healthcare Providers and Systems-NCQA Version of CAHPS. 2007. Available at: http://www.cahps.ahrq.gov/content/products/hp3/PROD_HP3_NCQA.asp?p=1021&s=211 Accessed November 2007.
Agency for Healthcare Research and Quality. Consumer Assessment of Healthcare Providers-Clinician and Group Survey. 2007. Available at: https://www.cahps.ahrq.gov/content/products/CG/PROD_CG_CG40Products.asp Accessed December 2007.
Agency for Healthcare Research and Quality. Medical Expenditure Panel Survey. Available at: http://www.meps.ahrq.gov/mepsweb/ . Accessed November 2007.
American Nurses Association on the National Database of Nursing Quality Indicators. CalNOC – California Nursing Outcomes Coalition/NDNQI. Available at: https://www.calnoc.org/globalPages/mainpage.aspx . Accessed January 2008.
California Cooperative Healthcare Reporting Initiative. Patient Assessment Survey Group Survey 2007. 2007. Available at: http://www.cchri.org/programs/programs_CAHPS.html . Accessed November 2007.
Quality Performance Measurement in CaliforniaFindings and Recommendations
University of California, DavisCenter for Healthcare Policy and Research86
California Cooperative Healthcare Reporting Initiative. Patient Assessment Survey Group Survey 2007. 2007. Available at: http://www.cchri.org/programs/programs_pas.html . Accessed November 2007.
California Department of Health Care Services. California Women’s Health Survey. Available at: http://www.dhcs.ca.gov/dataandstats/reports/Pages/DataPoints.aspx . Accessed January 2008.
California Department of Public Health (CDPH). California Cancer Registry. Available at: http://www.ccrcal.org/abouttheccr.html . Accessed December 2007.
California Department of Public Health Tobacco Control Section. California Adult Tobacco Survey. Available at: http://www.dhs.ca.gov/tobacco/ . Accessed January 2008.
California HealthCare Foundation. California Nursing Home Search. Available at: http://www.calnhs.org/nursinghomes/index.cfm?itemID=107169 . Accessed February 2008.
California Hospitals Assessment and Reporting Taskforce. Summary Quality Measures Available at: http://chart.ucsf.edu/ . Accessed January 2008.
California Hospitals Assessment and Reporting Taskforce. Available at: www.CalHospitalCompare.org. Accessed January 2008.
California Office of Statewide Health Planning and Development. Coronary Artery By-Pass Graft Surgery 2003-2004. Available at: http://www.oshpd.ca.gov/HID/Products/Clinical_Data/CABG/03-04Breakdown.html . Accessed January 2008.
California Office of Statewide Health Planning and Development. Health Information Division: Data Products Available at http://oshpd.ca.gov/HID/DataFlow/HospQuality.html Accessed January 2008.
California Perinatal Quality Care Collaborative. Available at: http://cpqcc.org/. Accessed: January 2008.
Centers for Disease Control and Prevention. Behavioral Risk Factor Surveillance System. 2007. Available at: http://www.cdc.gov/brfss/ . Accessed November 2007.
Centers for Medicare and Medicaid Services. Doctor’s Office Quality - Information Technology. Available at: http://providers.ipro.org/index/doqit . Accessed December 2007.
Centers for Medicare and Medicaid Services. Hospital Care Quality Information from the Consumer Perspective. Available at: www.hcahpsonline.org. Accessed December 2007.
Centers for Medicare and Medicaid Services. HospitalCompare (Hospital Process of Care Measure Set). Available at: www.hospitalcompare.hhs.gov. Accessed November 2007.
University of California, DavisCenter for Healthcare Policy and Research 87
Chapter VI: AppendicesAppendix C: References
Centers for Medicare and Medicaid Services. Medicare Health Outcomes Survey. Available at: http://www.hosonline.org/ . Accessed December 2007.
Centers for Medicare and Medicaid Services. Nursing Home Compare. Available at http://www.medicare.gov/NHCompare/ . Accessed January 2008.
Centers for Medicare and Medicaid Services. Physician Quality Reporting Initiative P4P Program. 2007. Available at: http://www.cms.hhs.gov/pqri/ . Accessed November 2007.
Centers for Medicare and Medicaid Services and Agency for Healthcare Research and Quality. Hospital CAHPS. Available at: http://www.cms.hhs.gov/hospitalqualityinits/30_hospitalHCAHPS.asp. Accessed December 2007.
Child and Adolescent Health Measurement Initiative. Young Adult Health Care Survey. Available at: http://www.cahmi.org . Accessed January 2008.
Consumer Assessment of Healthcare Providers and Systems. Nursing Home Survey. Available at: http://www.cahps.ahrq.gov/content/products/NH/PROD_NH_Intro.asp . Accessed February 2008.
Consumer-Purchaser Disclosure Project at http://healthcaredisclosure.org/ Accessed December 2007.
Integrated Healthcare Association/National Committee for Quality Assurance (IHA/NCQA) P4P Measurement Year 2007. Available at: http://www.iha.org/p4py6.htm Accessed November 2007.
Joint Commission. QualityCheck. Available at: http://www.qualitycheck.org/consumer/searchQCR.aspx. Accessed February 2008.
Leapfrog. Hospital Quality and Safety Survey. Available at: https://leapfrog.medstat.com Accessed December 2007.
Leapfrog. Home page. Available at http://www.leapfroggroup.org/. Accessed December 2007.
National Committee for Quality Assurance. CAHPS 3.0/4.0 Survey Crosswalk. Available at http://www.ncqa.org/tabid/346/Default.aspx . Accessed November 2007.
National Committee for Quality Assurance. Healthcare Effectiveness Data and Information Set. 2007. Available at: http://www.ncqa.org/tabid/177/Default.aspx . Accessed October 2007.
National Committee for Quality Assurance. Physician Recognition Program. Available at: http://www.ncqa.org/tabid/58/Default.aspx . Accessed January 2008.
Nursing Home Quality Initiative. Nursing Home STAR Program. Available at: http://www.nhqi-star.org/ . Accessed March 2008.
Quality Performance Measurement in CaliforniaFindings and Recommendations
University of California, DavisCenter for Healthcare Policy and Research88
Rodriguez, Michael. Confronting Healthcare Disparities in Medi-Cal Managed Care: The Role of Ethnicity, Race, and Primary Language. California Program on Access to Care Findings. March 2008. http://www.ucop.edu/cpac/documents/rodriguez_findings.pdf
Survey Research Group. California Data. Available at: www.surveyresearchgroup.com. Accessed November 2007.
UCLA Center for Health Policy Research. California Health Information Survey 2005. Available at: http://www.chis.ucla.edu/ . Accessed November 2007.
University of California, DavisCenter for Healthcare Policy and Research 89
Chapter VI: AppendicesAppendix D: QPM Inventories
University of California, DavisCenter for Healthcare Policy and Research 89
Appendix D
QPM Inventories
Health Plans•Physician Organizations•Hospitals•Nursing Homes•“Other” Sources•

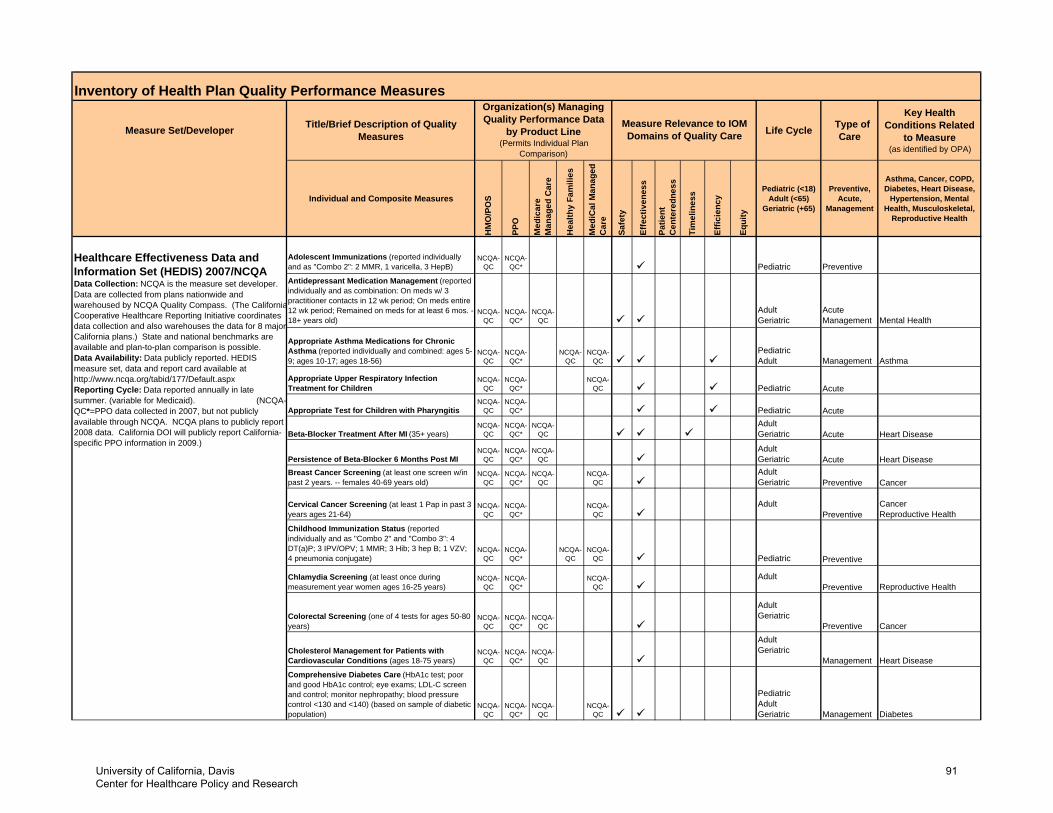
Inventory of Health Plan Quality Performance Measures
Measure Set/Developer Title/Brief Description of Quality Measures Life Cycle Type of
Care
Key Health Conditions Related
to Measure (as identified by OPA)
Individual and Composite Measures
HM
O/P
OS
PPO
Med
icar
e M
anag
ed C
are
Hea
lthy
Fam
ilies
Med
iCal
Man
aged
C
are
Safe
ty
Effe
ctiv
enes
s
Patie
nt
Cen
tere
dnes
s
Tim
elin
ess
Effic
ienc
y
Equi
ty
Pediatric (<18) Adult (<65)
Geriatric (+65)
Preventive, Acute,
Management
Asthma, Cancer, COPD, Diabetes, Heart Disease,
Hypertension, Mental Health, Musculoskeletal,
Reproductive Health
Adolescent Immunizations (reported individually and as "Combo 2": 2 MMR, 1 varicella, 3 HepB)
NCQA-QC
NCQA-QC* Pediatric Preventive
Antidepressant Medication Management (reported individually and as combination: On meds w/ 3 practitioner contacts in 12 wk period; On meds entire 12 wk period; Remained on meds for at least 6 mos. - 18+ years old)
NCQA-QC
NCQA-QC*
NCQA-QC
Adult Geriatric
Acute Management Mental Health
Appropriate Asthma Medications for Chronic Asthma (reported individually and combined: ages 5-9; ages 10-17; ages 18-56)
NCQA-QC
NCQA-QC*
NCQA-QC
NCQA-QC
Pediatric Adult Management Asthma
Appropriate Upper Respiratory Infection Treatment for Children
NCQA-QC
NCQA-QC*
NCQA-QC Pediatric Acute
Appropriate Test for Children with PharyngitisNCQA-
QCNCQA-
QC* Pediatric Acute
Beta-Blocker Treatment After MI (35+ years)NCQA-
QCNCQA-
QC*NCQA-
QCAdult Geriatric Acute Heart Disease
Persistence of Beta-Blocker 6 Months Post MINCQA-
QCNCQA-
QC*NCQA-
QCAdult Geriatric Acute Heart Disease
Breast Cancer Screening (at least one screen w/in past 2 years. -- females 40-69 years old)
NCQA-QC
NCQA-QC*
NCQA-QC
NCQA-QC
Adult Geriatric Preventive Cancer
Cervical Cancer Screening (at least 1 Pap in past 3 years ages 21-64)
NCQA-QC
NCQA-QC*
NCQA-QC
Adult Preventive
Cancer Reproductive Health
Childhood Immunization Status (reported individually and as "Combo 2" and "Combo 3": 4 DT(a)P; 3 IPV/OPV; 1 MMR; 3 Hib; 3 hep B; 1 VZV; 4 pneumonia conjugate)
NCQA-QC
NCQA-QC*
NCQA-QC
NCQA-QC Pediatric Preventive
Chlamydia Screening (at least once during measurement year women ages 16-25 years)
NCQA-QC
NCQA-QC*
NCQA-QC
Adult Preventive Reproductive Health
Colorectal Screening (one of 4 tests for ages 50-80 years)
NCQA-QC
NCQA-QC*
NCQA-QC
Adult Geriatric
Preventive Cancer
Cholesterol Management for Patients with Cardiovascular Conditions (ages 18-75 years)
NCQA-QC
NCQA-QC*
NCQA-QC
Adult Geriatric
Management Heart DiseaseComprehensive Diabetes Care (HbA1c test; poor and good HbA1c control; eye exams; LDL-C screen and control; monitor nephropathy; blood pressure control <130 and <140) (based on sample of diabetic population)
NCQA-QC
NCQA-QC*
NCQA-QC
NCQA-QC
Pediatric Adult Geriatric Management Diabetes
Healthcare Effectiveness Data and Information Set (HEDIS) 2007/NCQAData Collection: NCQA is the measure set developer. Data are collected from plans nationwide and warehoused by NCQA Quality Compass. (The CaliforniaCooperative Healthcare Reporting Initiative coordinates data collection and also warehouses the data for 8 majorCalifornia plans.) State and national benchmarks are available and plan-to-plan comparison is possible. Data Availability: Data publicly reported. HEDIS measure set, data and report card available at http://www.ncqa.org/tabid/177/Default.aspxReporting Cycle: Data reported annually in late summer. (variable for Medicaid). (NCQA-QC*=PPO data collected in 2007, but not publicly available through NCQA. NCQA plans to publicly report 2008 data. California DOI will publicly report California-specific PPO information in 2009.)
Measure Relevance to IOM Domains of Quality Care
Organization(s) Managing Quality Performance Data
by Product Line (Permits Individual Plan
Comparison)
University of California, Davis Center for Healthcare Policy and Research
91
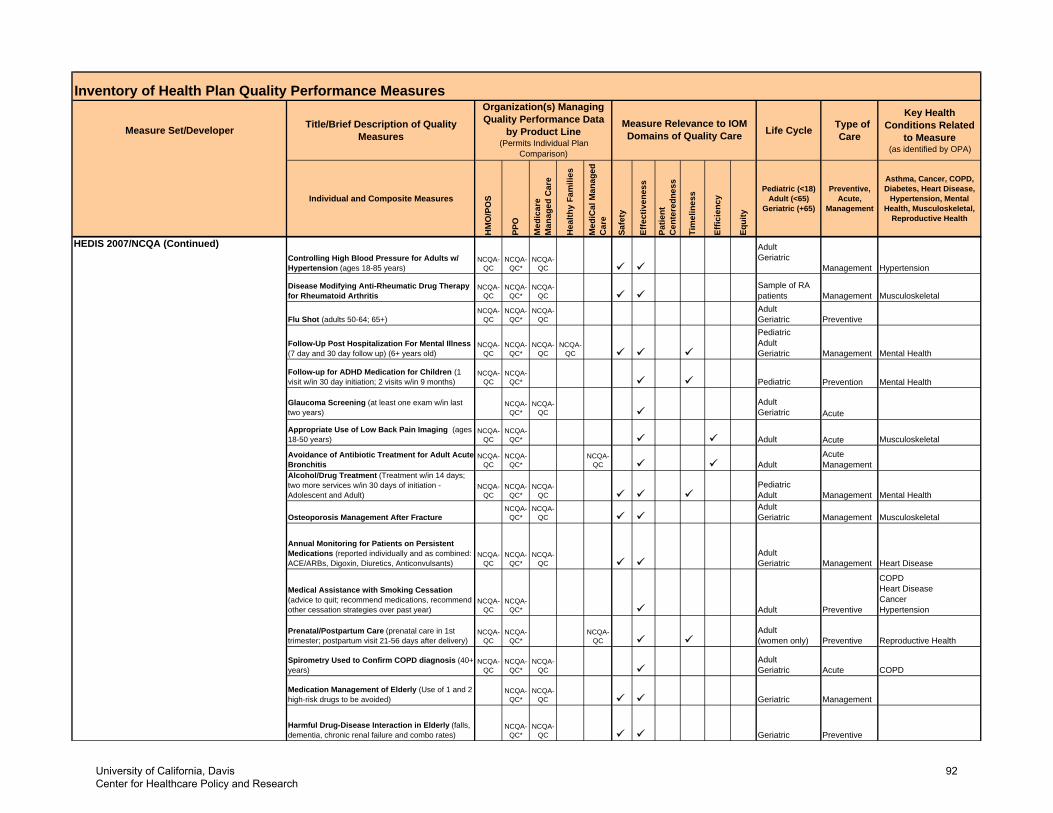
Inventory of Health Plan Quality Performance Measures
Measure Set/Developer Title/Brief Description of Quality Measures Life Cycle Type of
Care
Key Health Conditions Related
to Measure (as identified by OPA)
Individual and Composite Measures
HM
O/P
OS
PPO
Med
icar
e M
anag
ed C
are
Hea
lthy
Fam
ilies
Med
iCal
Man
aged
C
are
Safe
ty
Effe
ctiv
enes
s
Patie
nt
Cen
tere
dnes
s
Tim
elin
ess
Effic
ienc
y
Equi
ty
Pediatric (<18) Adult (<65)
Geriatric (+65)
Preventive, Acute,
Management
Asthma, Cancer, COPD, Diabetes, Heart Disease,
Hypertension, Mental Health, Musculoskeletal,
Reproductive Health
Measure Relevance to IOM Domains of Quality Care
Organization(s) Managing Quality Performance Data
by Product Line (Permits Individual Plan
Comparison)
HEDIS 2007/NCQA (Continued)Controlling High Blood Pressure for Adults w/ Hypertension (ages 18-85 years)
NCQA-QC
NCQA-QC*
NCQA-QC
Adult Geriatric
Management Hypertension
Disease Modifying Anti-Rheumatic Drug Therapy for Rheumatoid Arthritis
NCQA-QC
NCQA-QC*
NCQA-QC
Sample of RA patients Management Musculoskeletal
Flu Shot (adults 50-64; 65+)NCQA-
QCNCQA-
QC*NCQA-
QCAdult Geriatric Preventive
Follow-Up Post Hospitalization For Mental Illness (7 day and 30 day follow up) (6+ years old)
NCQA-QC
NCQA-QC*
NCQA-QC
NCQA-QC
Pediatric Adult Geriatric Management Mental Health
Follow-up for ADHD Medication for Children (1 visit w/in 30 day initiation; 2 visits w/in 9 months)
NCQA-QC
NCQA-QC* Pediatric Prevention Mental Health
Glaucoma Screening (at least one exam w/in last two years)
NCQA-QC*
NCQA-QC
Adult Geriatric Acute
Appropriate Use of Low Back Pain Imaging (ages 18-50 years)
NCQA-QC
NCQA-QC* Adult Acute Musculoskeletal
Avoidance of Antibiotic Treatment for Adult Acute Bronchitis
NCQA-QC
NCQA-QC*
NCQA-QC Adult
Acute Management
Alcohol/Drug Treatment (Treatment w/in 14 days; two more services w/in 30 days of initiation - Adolescent and Adult)
NCQA-QC
NCQA-QC*
NCQA-QC
Pediatric Adult Management Mental Health
Osteoporosis Management After FractureNCQA-
QC*NCQA-
QCAdult Geriatric Management Musculoskeletal
Annual Monitoring for Patients on Persistent Medications (reported individually and as combined: ACE/ARBs, Digoxin, Diuretics, Anticonvulsants)
NCQA-QC
NCQA-QC*
NCQA-QC
Adult Geriatric Management Heart Disease
Medical Assistance with Smoking Cessation (advice to quit; recommend medications, recommend other cessation strategies over past year)
NCQA-QC
NCQA-QC* Adult Preventive
COPD Heart Disease Cancer Hypertension
Prenatal/Postpartum Care (prenatal care in 1st trimester; postpartum visit 21-56 days after delivery)
NCQA-QC
NCQA-QC*
NCQA-QC
Adult (women only) Preventive Reproductive Health
Spirometry Used to Confirm COPD diagnosis (40+ years)
NCQA-QC
NCQA-QC*
NCQA-QC
Adult Geriatric Acute COPD
Medication Management of Elderly (Use of 1 and 2 high-risk drugs to be avoided)
NCQA-QC*
NCQA-QC Geriatric Management
Harmful Drug-Disease Interaction in Elderly (falls, dementia, chronic renal failure and combo rates)
NCQA-QC*
NCQA-QC Geriatric Preventive
University of California, Davis Center for Healthcare Policy and Research
92
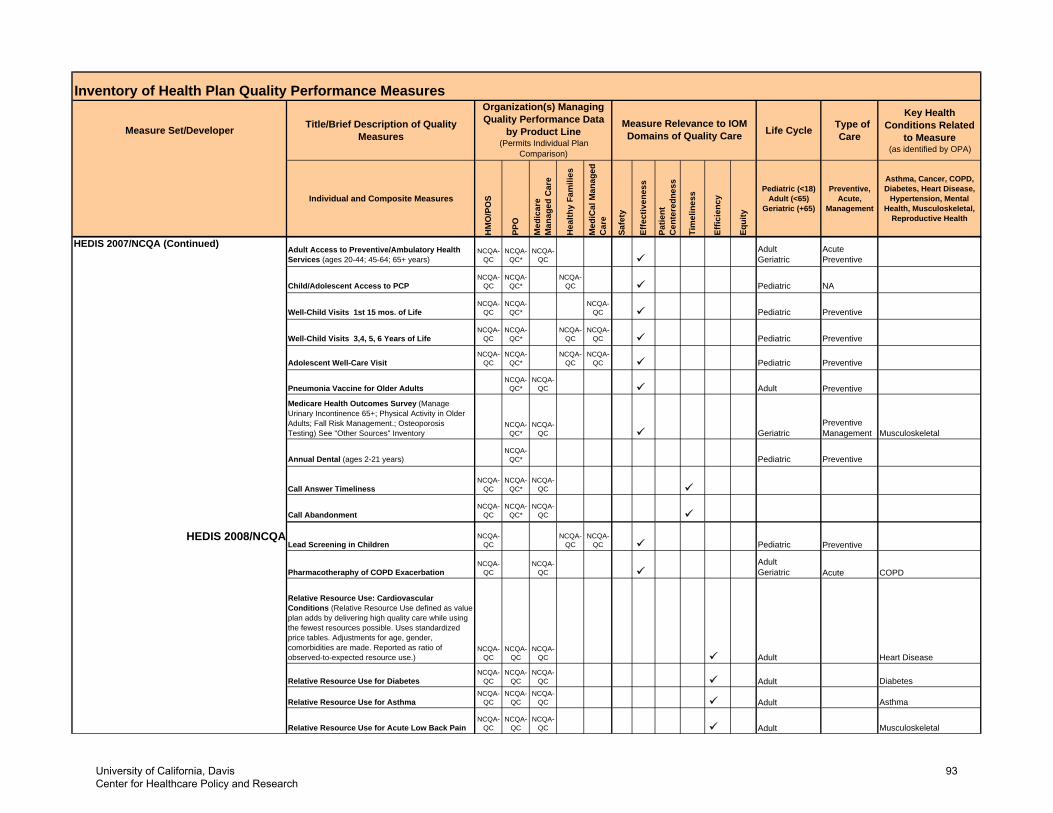
Inventory of Health Plan Quality Performance Measures
Measure Set/Developer Title/Brief Description of Quality Measures Life Cycle Type of
Care
Key Health Conditions Related
to Measure (as identified by OPA)
Individual and Composite Measures
HM
O/P
OS
PPO
Med
icar
e M
anag
ed C
are
Hea
lthy
Fam
ilies
Med
iCal
Man
aged
C
are
Safe
ty
Effe
ctiv
enes
s
Patie
nt
Cen
tere
dnes
s
Tim
elin
ess
Effic
ienc
y
Equi
ty
Pediatric (<18) Adult (<65)
Geriatric (+65)
Preventive, Acute,
Management
Asthma, Cancer, COPD, Diabetes, Heart Disease,
Hypertension, Mental Health, Musculoskeletal,
Reproductive Health
Measure Relevance to IOM Domains of Quality Care
Organization(s) Managing Quality Performance Data
by Product Line (Permits Individual Plan
Comparison)
HEDIS 2007/NCQA (Continued)Adult Access to Preventive/Ambulatory Health Services (ages 20-44; 45-64; 65+ years)
NCQA-QC
NCQA-QC*
NCQA-QC
Adult Geriatric
Acute Preventive
Child/Adolescent Access to PCPNCQA-
QCNCQA-
QC*NCQA-
QC Pediatric NA
Well-Child Visits 1st 15 mos. of LifeNCQA-
QCNCQA-
QC*NCQA-
QC Pediatric Preventive
Well-Child Visits 3,4, 5, 6 Years of LifeNCQA-
QCNCQA-
QC*NCQA-
QCNCQA-
QC Pediatric Preventive
Adolescent Well-Care VisitNCQA-
QCNCQA-
QC*NCQA-
QCNCQA-
QC Pediatric Preventive
Pneumonia Vaccine for Older AdultsNCQA-
QC*NCQA-
QC Adult Preventive
Medicare Health Outcomes Survey (Manage Urinary Incontinence 65+; Physical Activity in Older Adults; Fall Risk Management.; Osteoporosis Testing) See "Other Sources" Inventory
NCQA-QC*
NCQA-QC Geriatric
Preventive Management Musculoskeletal
Annual Dental (ages 2-21 years)NCQA-
QC* Pediatric Preventive
Call Answer TimelinessNCQA-
QCNCQA-
QC*NCQA-
QC
Call AbandonmentNCQA-
QCNCQA-
QC*NCQA-
QC
HEDIS 2008/NCQALead Screening in Children
NCQA-QC
NCQA-QC
NCQA-QC Pediatric Preventive
Pharmacotheraphy of COPD ExacerbationNCQA-
QCNCQA-
QCAdult Geriatric Acute COPD
Relative Resource Use: Cardiovascular Conditions (Relative Resource Use defined as value plan adds by delivering high quality care while using the fewest resources possible. Uses standardized price tables. Adjustments for age, gender, comorbidities are made. Reported as ratio of observed-to-expected resource use.)
NCQA-QC
NCQA-QC
NCQA-QC Adult Heart Disease
Relative Resource Use for DiabetesNCQA-
QCNCQA-
QCNCQA-
QC Adult Diabetes
Relative Resource Use for AsthmaNCQA-
QCNCQA-
QCNCQA-
QC Adult Asthma
Relative Resource Use for Acute Low Back PainNCQA-
QCNCQA-
QCNCQA-
QC Adult Musculoskeletal
University of California, Davis Center for Healthcare Policy and Research
93
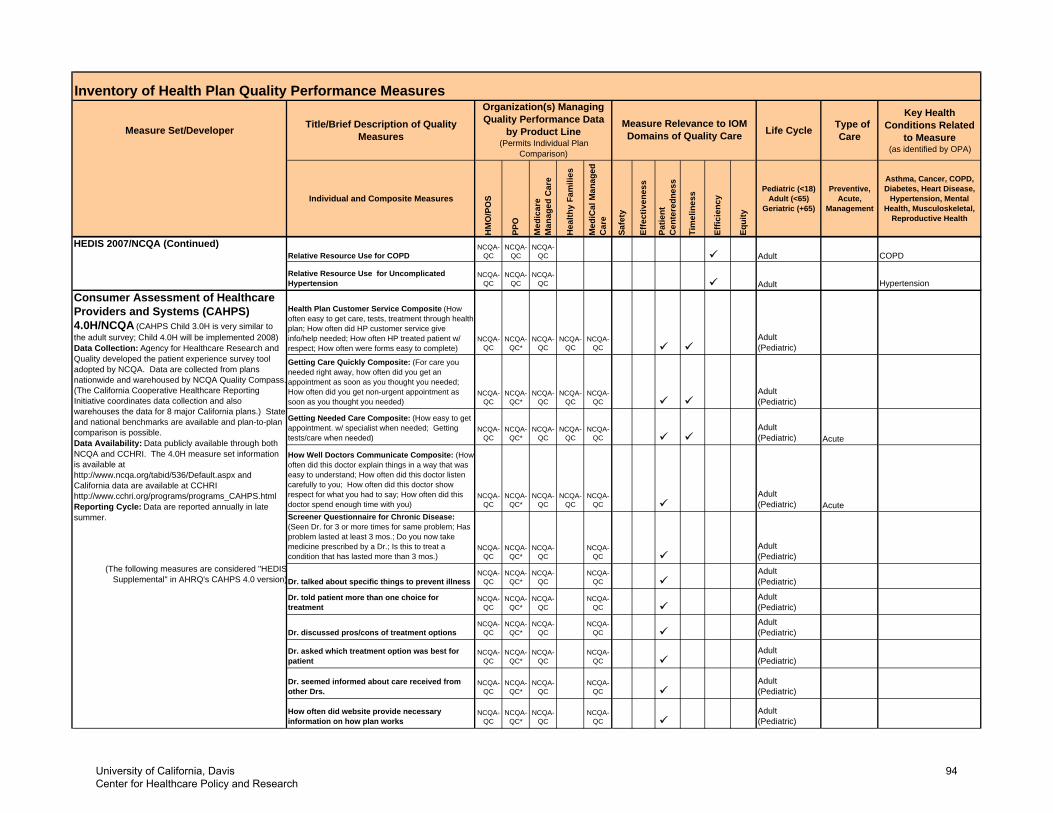
Inventory of Health Plan Quality Performance Measures
Measure Set/Developer Title/Brief Description of Quality Measures Life Cycle Type of
Care
Key Health Conditions Related
to Measure (as identified by OPA)
Individual and Composite Measures
HM
O/P
OS
PPO
Med
icar
e M
anag
ed C
are
Hea
lthy
Fam
ilies
Med
iCal
Man
aged
C
are
Safe
ty
Effe
ctiv
enes
s
Patie
nt
Cen
tere
dnes
s
Tim
elin
ess
Effic
ienc
y
Equi
ty
Pediatric (<18) Adult (<65)
Geriatric (+65)
Preventive, Acute,
Management
Asthma, Cancer, COPD, Diabetes, Heart Disease,
Hypertension, Mental Health, Musculoskeletal,
Reproductive Health
Measure Relevance to IOM Domains of Quality Care
Organization(s) Managing Quality Performance Data
by Product Line (Permits Individual Plan
Comparison)
HEDIS 2007/NCQA (Continued)Relative Resource Use for COPD
NCQA-QC
NCQA-QC
NCQA-QC Adult COPD
Relative Resource Use for Uncomplicated Hypertension
NCQA-QC
NCQA-QC
NCQA-QC Adult Hypertension
NCQA-QC
NCQA-QC*
NCQA-QC
NCQA-QC
NCQA-QC
Adult (Pediatric)
Getting Care Quickly Composite: (For care you needed right away, how often did you get an appointment as soon as you thought you needed; How often did you get non-urgent appointment as soon as you thought you needed)
NCQA-QC
NCQA-QC*
NCQA-QC
NCQA-QC
NCQA-QC
Adult (Pediatric)
Getting Needed Care Composite: (How easy to get appointment. w/ specialist when needed; Getting tests/care when needed)
NCQA-QC
NCQA-QC*
NCQA-QC
NCQA-QC
NCQA-QC
Adult (Pediatric) Acute
How Well Doctors Communicate Composite: (How often did this doctor explain things in a way that was easy to understand; How often did this doctor listen carefully to you; How often did this doctor show respect for what you had to say; How often did this doctor spend enough time with you)
NCQA-QC
NCQA-QC*
NCQA-QC
NCQA-QC
NCQA-QC
Adult (Pediatric) Acute
Screener Questionnaire for Chronic Disease: (Seen Dr. for 3 or more times for same problem; Has problem lasted at least 3 mos.; Do you now take medicine prescribed by a Dr.; Is this to treat a condition that has lasted more than 3 mos.)
NCQA-QC
NCQA-QC*
NCQA-QC
NCQA-QC
Adult (Pediatric)
Dr. talked about specific things to prevent illnessNCQA-
QCNCQA-
QC*NCQA-
QCNCQA-
QCAdult (Pediatric)
Dr. told patient more than one choice for treatment
NCQA-QC
NCQA-QC*
NCQA-QC
NCQA-QC
Adult (Pediatric)
Dr. discussed pros/cons of treatment optionsNCQA-
QCNCQA-
QC*NCQA-
QCNCQA-
QCAdult (Pediatric)
Dr. asked which treatment option was best for patient
NCQA-QC
NCQA-QC*
NCQA-QC
NCQA-QC
Adult (Pediatric)
Dr. seemed informed about care received from other Drs.
NCQA-QC
NCQA-QC*
NCQA-QC
NCQA-QC
Adult (Pediatric)
How often did website provide necessary information on how plan works
NCQA-QC
NCQA-QC*
NCQA-QC
NCQA-QC
Adult (Pediatric)
Consumer Assessment of Healthcare Providers and Systems (CAHPS) 4.0H/NCQA (CAHPS Child 3.0H is very similar to the adult survey; Child 4.0H will be implemented 2008)Data Collection: Agency for Healthcare Research and Quality developed the patient experience survey tool adopted by NCQA. Data are collected from plans nationwide and warehoused by NCQA Quality Compass.(The California Cooperative Healthcare Reporting Initiative coordinates data collection and also warehouses the data for 8 major California plans.) State and national benchmarks are available and plan-to-plan comparison is possible. Data Availability: Data publicly available through both NCQA and CCHRI. The 4.0H measure set information is available at http://www.ncqa.org/tabid/536/Default.aspx and California data are available at CCHRI http://www.cchri.org/programs/programs_CAHPS.htmlReporting Cycle: Data are reported annually in late summer.
(The following measures are considered "HEDISSupplemental" in AHRQ's CAHPS 4.0 version)
Health Plan Customer Service Composite (How often easy to get care, tests, treatment through health plan; How often did HP customer service give info/help needed; How often HP treated patient w/ respect; How often were forms easy to complete)
University of California, Davis Center for Healthcare Policy and Research
94
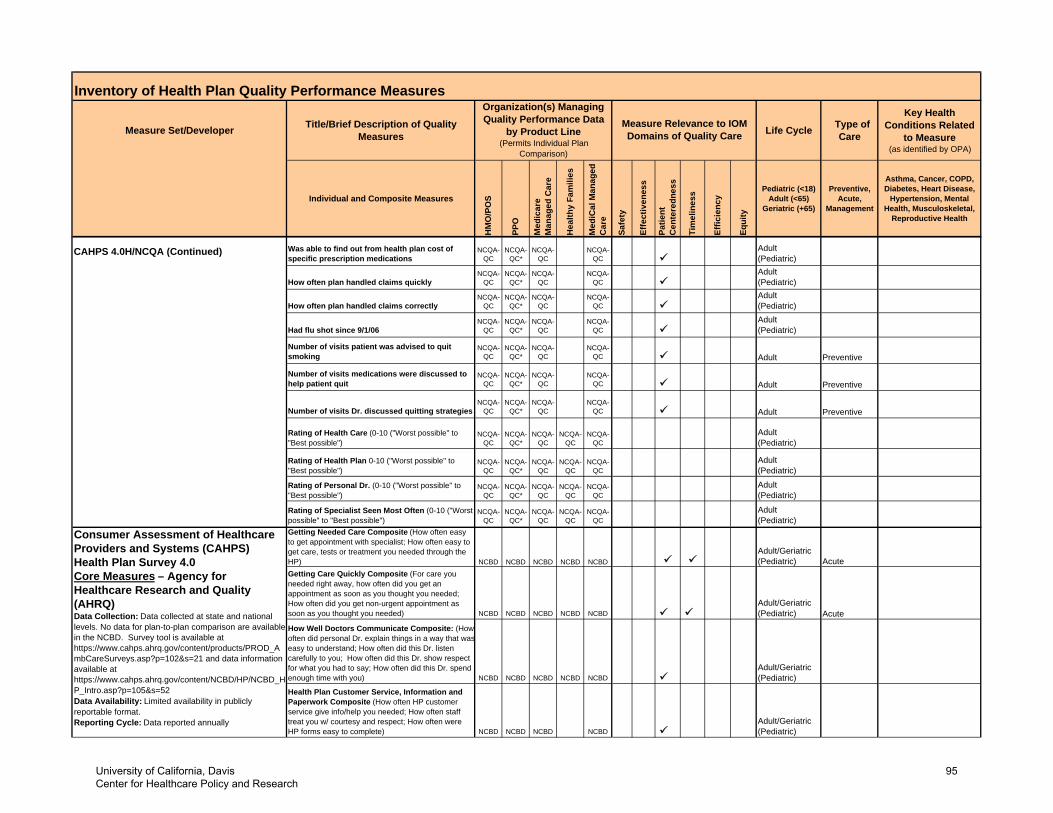
Inventory of Health Plan Quality Performance Measures
Measure Set/Developer Title/Brief Description of Quality Measures Life Cycle Type of
Care
Key Health Conditions Related
to Measure (as identified by OPA)
Individual and Composite Measures
HM
O/P
OS
PPO
Med
icar
e M
anag
ed C
are
Hea
lthy
Fam
ilies
Med
iCal
Man
aged
C
are
Safe
ty
Effe
ctiv
enes
s
Patie
nt
Cen
tere
dnes
s
Tim
elin
ess
Effic
ienc
y
Equi
ty
Pediatric (<18) Adult (<65)
Geriatric (+65)
Preventive, Acute,
Management
Asthma, Cancer, COPD, Diabetes, Heart Disease,
Hypertension, Mental Health, Musculoskeletal,
Reproductive Health
Measure Relevance to IOM Domains of Quality Care
Organization(s) Managing Quality Performance Data
by Product Line (Permits Individual Plan
Comparison)
CAHPS 4.0H/NCQA (Continued) Was able to find out from health plan cost of specific prescription medications
NCQA-QC
NCQA-QC*
NCQA-QC
NCQA-QC
Adult (Pediatric)
How often plan handled claims quicklyNCQA-
QCNCQA-
QC*NCQA-
QCNCQA-
QCAdult (Pediatric)
How often plan handled claims correctlyNCQA-
QCNCQA-
QC*NCQA-
QCNCQA-
QCAdult (Pediatric)
Had flu shot since 9/1/06NCQA-
QCNCQA-
QC*NCQA-
QCNCQA-
QCAdult (Pediatric)
Number of visits patient was advised to quit smoking
NCQA-QC
NCQA-QC*
NCQA-QC
NCQA-QC Adult Preventive
Number of visits medications were discussed to help patient quit
NCQA-QC
NCQA-QC*
NCQA-QC
NCQA-QC Adult Preventive
Number of visits Dr. discussed quitting strategiesNCQA-
QCNCQA-
QC*NCQA-
QCNCQA-
QC Adult Preventive
Rating of Health Care (0-10 ("Worst possible" to "Best possible")
NCQA-QC
NCQA-QC*
NCQA-QC
NCQA-QC
NCQA-QC
Adult (Pediatric)
Rating of Health Plan 0-10 ("Worst possible" to "Best possible")
NCQA-QC
NCQA-QC*
NCQA-QC
NCQA-QC
NCQA-QC
Adult (Pediatric)
Rating of Personal Dr. (0-10 ("Worst possible" to "Best possible")
NCQA-QC
NCQA-QC*
NCQA-QC
NCQA-QC
NCQA-QC
Adult (Pediatric)
Rating of Specialist Seen Most Often (0-10 ("Worst possible" to "Best possible")
NCQA-QC
NCQA-QC*
NCQA-QC
NCQA-QC
NCQA-QC
Adult (Pediatric)
Getting Care Quickly Composite (For care you needed right away, how often did you get an appointment as soon as you thought you needed; How often did you get non-urgent appointment as soon as you thought you needed) NCBD NCBD NCBD NCBD NCBD
Adult/Geriatric(Pediatric) Acute
How Well Doctors Communicate Composite: (How often did personal Dr. explain things in a way that waseasy to understand; How often did this Dr. listen carefully to you; How often did this Dr. show respect for what you had to say; How often did this Dr. spend enough time with you) NCBD NCBD NCBD NCBD NCBD
Adult/Geriatric(Pediatric)
Health Plan Customer Service, Information and Paperwork Composite (How often HP customer service give info/help you needed; How often staff treat you w/ courtesy and respect; How often were HP forms easy to complete) NCBD NCBD NCBD NCBD
Adult/Geriatric(Pediatric)
Adult/Geriatric(Pediatric)NCBD
Consumer Assessment of Healthcare Providers and Systems (CAHPS) Health Plan Survey 4.0 Core Measures – Agency for Healthcare Research and Quality (AHRQ)Data Collection: Data collected at state and national levels. No data for plan-to-plan comparison are available in the NCBD. Survey tool is available at https://www.cahps.ahrq.gov/content/products/PROD_AmbCareSurveys.asp?p=102&s=21 and data information available at https://www.cahps.ahrq.gov/content/NCBD/HP/NCBD_HP_Intro.asp?p=105&s=52Data Availability: Limited availability in publicly reportable format.Reporting Cycle: Data reported annually
AcuteNCBDNCBD NCBD
Getting Needed Care Composite (How often easy to get appointment with specialist; How often easy to get care, tests or treatment you needed through the HP) NCBD
University of California, Davis Center for Healthcare Policy and Research
95
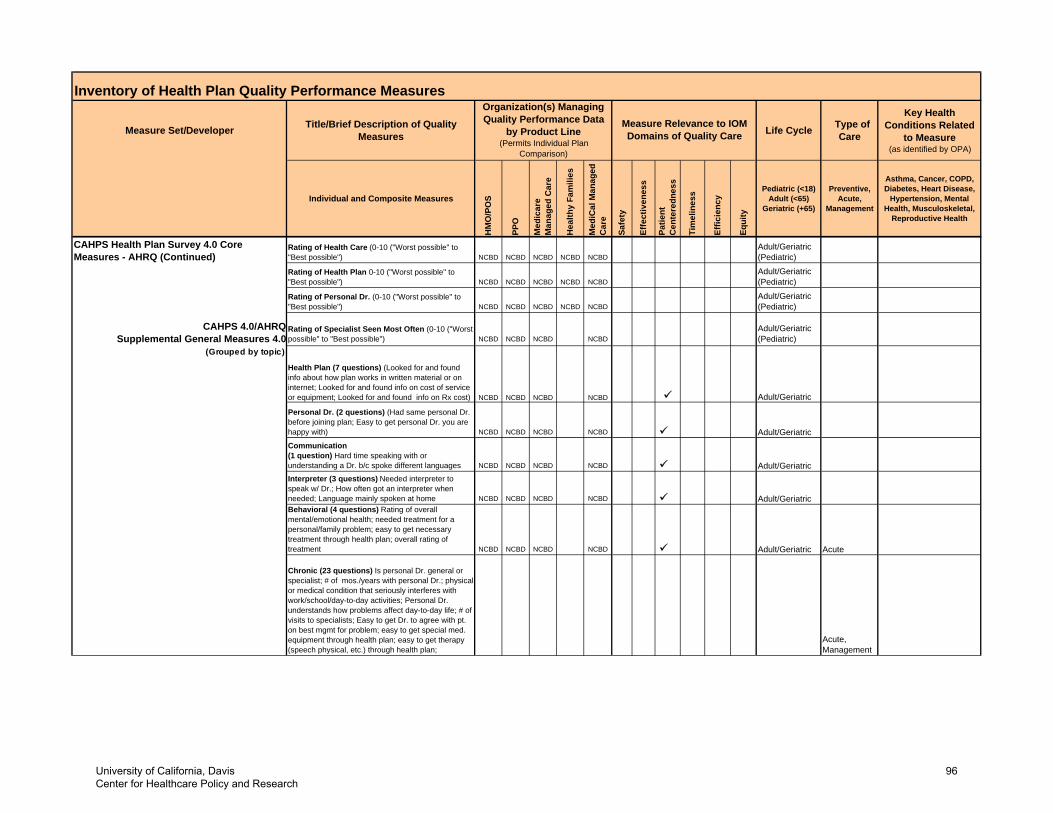
Inventory of Health Plan Quality Performance Measures
Measure Set/Developer Title/Brief Description of Quality Measures Life Cycle Type of
Care
Key Health Conditions Related
to Measure (as identified by OPA)
Individual and Composite Measures
HM
O/P
OS
PPO
Med
icar
e M
anag
ed C
are
Hea
lthy
Fam
ilies
Med
iCal
Man
aged
C
are
Safe
ty
Effe
ctiv
enes
s
Patie
nt
Cen
tere
dnes
s
Tim
elin
ess
Effic
ienc
y
Equi
ty
Pediatric (<18) Adult (<65)
Geriatric (+65)
Preventive, Acute,
Management
Asthma, Cancer, COPD, Diabetes, Heart Disease,
Hypertension, Mental Health, Musculoskeletal,
Reproductive Health
Measure Relevance to IOM Domains of Quality Care
Organization(s) Managing Quality Performance Data
by Product Line (Permits Individual Plan
Comparison)
CAHPS Health Plan Survey 4.0 Core Measures - AHRQ (Continued)
Rating of Health Care (0-10 ("Worst possible" to "Best possible") NCBD NCBD NCBD NCBD NCBD
Adult/Geriatric(Pediatric)
Rating of Health Plan 0-10 ("Worst possible" to "Best possible") NCBD NCBD NCBD NCBD NCBD
Adult/Geriatric(Pediatric)
Rating of Personal Dr. (0-10 ("Worst possible" to "Best possible") NCBD NCBD NCBD NCBD NCBD
Adult/Geriatric(Pediatric)
CAHPS 4.0/AHRQ Supplemental General Measures 4.0
Rating of Specialist Seen Most Often (0-10 ("Worst possible" to "Best possible") NCBD NCBD NCBD NCBD
Adult/Geriatric(Pediatric)
(Grouped by topic)
Personal Dr. (2 questions) (Had same personal Dr. before joining plan; Easy to get personal Dr. you are happy with) NCBD NCBD NCBD NCBD Adult/GeriatricCommunication (1 question) Hard time speaking with or understanding a Dr. b/c spoke different languages NCBD NCBD NCBD NCBD Adult/GeriatricInterpreter (3 questions) Needed interpreter to speak w/ Dr.; How often got an interpreter when needed; Language mainly spoken at home NCBD NCBD NCBD NCBD Adult/GeriatricBehavioral (4 questions) Rating of overall mental/emotional health; needed treatment for a personal/family problem; easy to get necessary treatment through health plan; overall rating of treatment NCBD NCBD NCBD NCBD Adult/Geriatric Acute
Chronic (23 questions) Is personal Dr. general or specialist; # of mos./years with personal Dr.; physical or medical condition that seriously interferes with work/school/day-to-day activities; Personal Dr. understands how problems affect day-to-day life; # of visits to specialists; Easy to get Dr. to agree with pt. on best mgmt for problem; easy to get special med. equipment through health plan; easy to get therapy (speech physical, etc.) through health plan;
Acute,Management
Adult/GeriatricNCBDNCBDNCBDNCBD
Health Plan (7 questions) (Looked for and found info about how plan works in written material or on internet; Looked for and found info on cost of service or equipment; Looked for and found info on Rx cost)
University of California, Davis Center for Healthcare Policy and Research
96
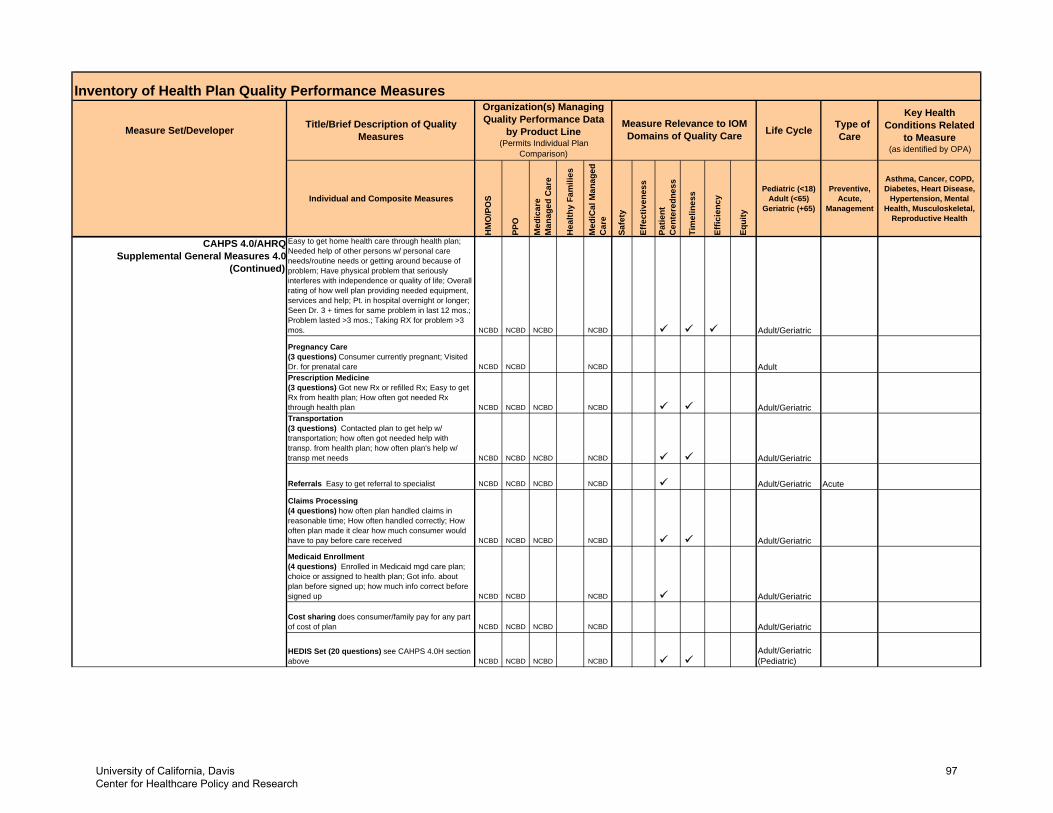
Inventory of Health Plan Quality Performance Measures
Measure Set/Developer Title/Brief Description of Quality Measures Life Cycle Type of
Care
Key Health Conditions Related
to Measure (as identified by OPA)
Individual and Composite Measures
HM
O/P
OS
PPO
Med
icar
e M
anag
ed C
are
Hea
lthy
Fam
ilies
Med
iCal
Man
aged
C
are
Safe
ty
Effe
ctiv
enes
s
Patie
nt
Cen
tere
dnes
s
Tim
elin
ess
Effic
ienc
y
Equi
ty
Pediatric (<18) Adult (<65)
Geriatric (+65)
Preventive, Acute,
Management
Asthma, Cancer, COPD, Diabetes, Heart Disease,
Hypertension, Mental Health, Musculoskeletal,
Reproductive Health
Measure Relevance to IOM Domains of Quality Care
Organization(s) Managing Quality Performance Data
by Product Line (Permits Individual Plan
Comparison)
CAHPS 4.0/AHRQSupplemental General Measures 4.0
(Continued)
Easy to get home health care through health plan; Needed help of other persons w/ personal care needs/routine needs or getting around because of problem; Have physical problem that seriously interferes with independence or quality of life; Overall rating of how well plan providing needed equipment, services and help; Pt. in hospital overnight or longer; Seen Dr. 3 + times for same problem in last 12 mos.; Problem lasted >3 mos.; Taking RX for problem >3 mos. NCBD NCBD NCBD NCBD Adult/Geriatric
Pregnancy Care (3 questions) Consumer currently pregnant; Visited Dr. for prenatal care NCBD NCBD NCBD AdultPrescription Medicine (3 questions) Got new Rx or refilled Rx; Easy to get Rx from health plan; How often got needed Rx through health plan NCBD NCBD NCBD NCBD Adult/GeriatricTransportation (3 questions) Contacted plan to get help w/ transportation; how often got needed help with transp. from health plan; how often plan's help w/ transp met needs NCBD NCBD NCBD NCBD Adult/Geriatric
Referrals Easy to get referral to specialist NCBD NCBD NCBD NCBD Adult/Geriatric Acute
Claims Processing (4 questions) how often plan handled claims in reasonable time; How often handled correctly; How often plan made it clear how much consumer would have to pay before care received NCBD NCBD NCBD NCBD Adult/Geriatric
Medicaid Enrollment (4 questions) Enrolled in Medicaid mgd care plan; choice or assigned to health plan; Got info. about plan before signed up; how much info correct before signed up NCBD NCBD NCBD Adult/Geriatric
Cost sharing does consumer/family pay for any part of cost of plan NCBD NCBD NCBD NCBD Adult/Geriatric
HEDIS Set (20 questions) see CAHPS 4.0H section above NCBD NCBD NCBD NCBD
Adult/Geriatric (Pediatric)
University of California, Davis Center for Healthcare Policy and Research
97
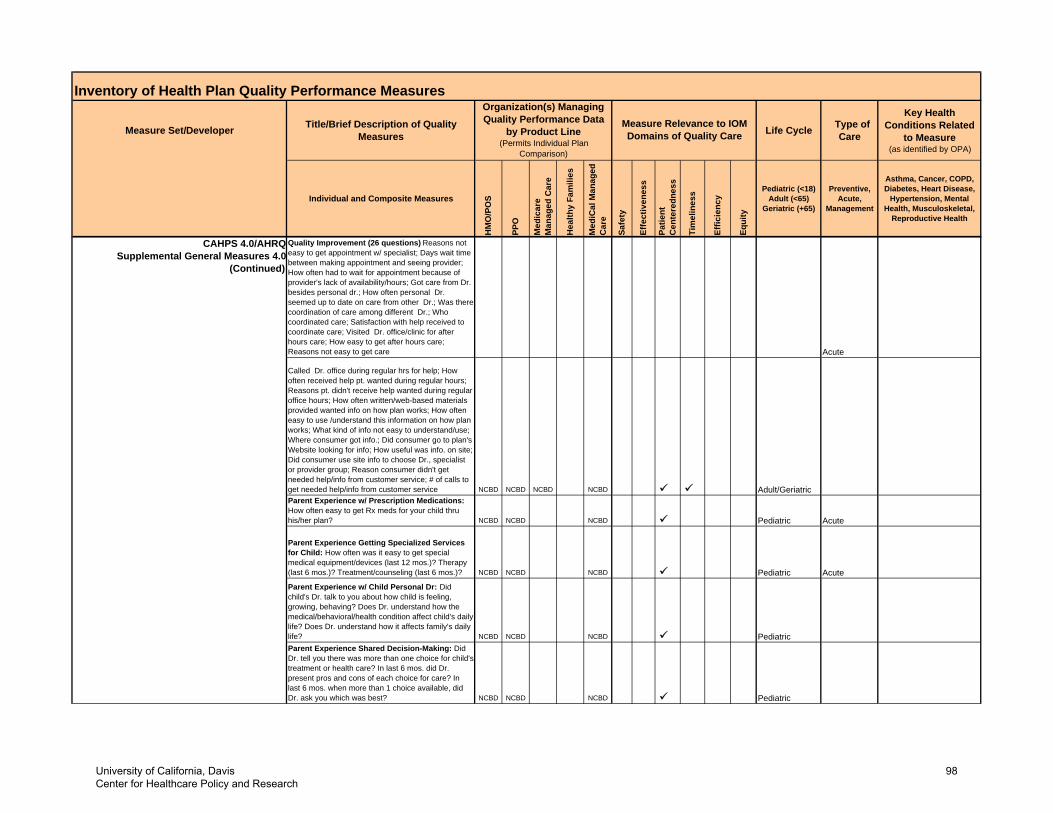
Inventory of Health Plan Quality Performance Measures
Measure Set/Developer Title/Brief Description of Quality Measures Life Cycle Type of
Care
Key Health Conditions Related
to Measure (as identified by OPA)
Individual and Composite Measures
HM
O/P
OS
PPO
Med
icar
e M
anag
ed C
are
Hea
lthy
Fam
ilies
Med
iCal
Man
aged
C
are
Safe
ty
Effe
ctiv
enes
s
Patie
nt
Cen
tere
dnes
s
Tim
elin
ess
Effic
ienc
y
Equi
ty
Pediatric (<18) Adult (<65)
Geriatric (+65)
Preventive, Acute,
Management
Asthma, Cancer, COPD, Diabetes, Heart Disease,
Hypertension, Mental Health, Musculoskeletal,
Reproductive Health
Measure Relevance to IOM Domains of Quality Care
Organization(s) Managing Quality Performance Data
by Product Line (Permits Individual Plan
Comparison)
CAHPS 4.0/AHRQ Supplemental General Measures 4.0
(Continued)
Quality Improvement (26 questions) Reasons not easy to get appointment w/ specialist; Days wait time between making appointment and seeing provider; How often had to wait for appointment because of provider's lack of availability/hours; Got care from Dr. besides personal dr.; How often personal Dr. seemed up to date on care from other Dr.; Was there coordination of care among different Dr.; Who coordinated care; Satisfaction with help received to coordinate care; Visited Dr. office/clinic for after hours care; How easy to get after hours care; Reasons not easy to get care Acute
Called Dr. office during regular hrs for help; How often received help pt. wanted during regular hours; Reasons pt. didn't receive help wanted during regular office hours; How often written/web-based materials provided wanted info on how plan works; How often easy to use /understand this information on how plan works; What kind of info not easy to understand/use; Where consumer got info.; Did consumer go to plan's Website looking for info; How useful was info. on site; Did consumer use site info to choose Dr., specialist or provider group; Reason consumer didn't get needed help/info from customer service; # of calls to get needed help/info from customer service NCBD NCBD NCBD NCBD Adult/GeriatricParent Experience w/ Prescription Medications: How often easy to get Rx meds for your child thru his/her plan? NCBD NCBD NCBD Pediatric Acute
Parent Experience Getting Specialized Services for Child: How often was it easy to get special medical equipment/devices (last 12 mos.)? Therapy (last 6 mos.)? Treatment/counseling (last 6 mos.)? NCBD NCBD NCBD Pediatric AcuteParent Experience w/ Child Personal Dr: Did child's Dr. talk to you about how child is feeling, growing, behaving? Does Dr. understand how the medical/behavioral/health condition affect child's daily life? Does Dr. understand how it affects family's daily life? NCBD NCBD NCBD PediatricParent Experience Shared Decision-Making: Did Dr. tell you there was more than one choice for child's treatment or health care? In last 6 mos. did Dr. present pros and cons of each choice for care? In last 6 mos. when more than 1 choice available, did Dr. ask you which was best? NCBD NCBD NCBD Pediatric
University of California, Davis Center for Healthcare Policy and Research
98
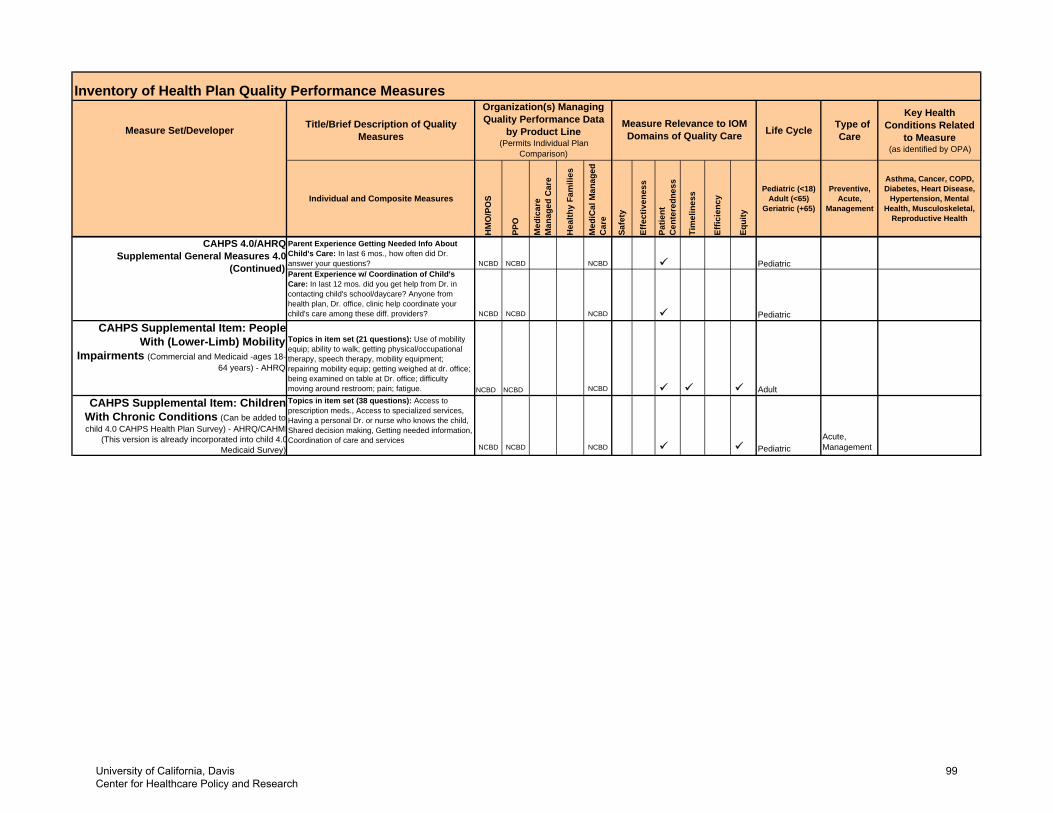
Inventory of Health Plan Quality Performance Measures
Measure Set/Developer Title/Brief Description of Quality Measures Life Cycle Type of
Care
Key Health Conditions Related
to Measure (as identified by OPA)
Individual and Composite Measures
HM
O/P
OS
PPO
Med
icar
e M
anag
ed C
are
Hea
lthy
Fam
ilies
Med
iCal
Man
aged
C
are
Safe
ty
Effe
ctiv
enes
s
Patie
nt
Cen
tere
dnes
s
Tim
elin
ess
Effic
ienc
y
Equi
ty
Pediatric (<18) Adult (<65)
Geriatric (+65)
Preventive, Acute,
Management
Asthma, Cancer, COPD, Diabetes, Heart Disease,
Hypertension, Mental Health, Musculoskeletal,
Reproductive Health
Measure Relevance to IOM Domains of Quality Care
Organization(s) Managing Quality Performance Data
by Product Line (Permits Individual Plan
Comparison)
Parent Experience Getting Needed Info About Child's Care: In last 6 mos., how often did Dr. answer your questions? NCBD NCBD NCBD PediatricParent Experience w/ Coordination of Child's Care: In last 12 mos. did you get help from Dr. in contacting child's school/daycare? Anyone from health plan, Dr. office, clinic help coordinate your child's care among these diff. providers? NCBD NCBD NCBD Pediatric
CAHPS Supplemental Item: People With (Lower-Limb) Mobility
Impairments (Commercial and Medicaid -ages 18-64 years) - AHRQ
Topics in item set (21 questions): Use of mobility equip; ability to walk; getting physical/occupational therapy, speech therapy, mobility equipment; repairing mobility equip; getting weighed at dr. office; being examined on table at Dr. office; difficulty moving around restroom; pain; fatigue. NCBD NCBD NCBD Adult
CAHPS Supplemental Item: Children With Chronic Conditions (Can be added to child 4.0 CAHPS Health Plan Survey) - AHRQ/CAHMI
(This version is already incorporated into child 4.0Medicaid Survey)
Topics in item set (38 questions): Access to prescription meds., Access to specialized services, Having a personal Dr. or nurse who knows the child, Shared decision making, Getting needed information, Coordination of care and services
NCBD NCBD NCBD PediatricAcute,Management
CAHPS 4.0/AHRQSupplemental General Measures 4.0
(Continued)
University of California, Davis Center for Healthcare Policy and Research
99
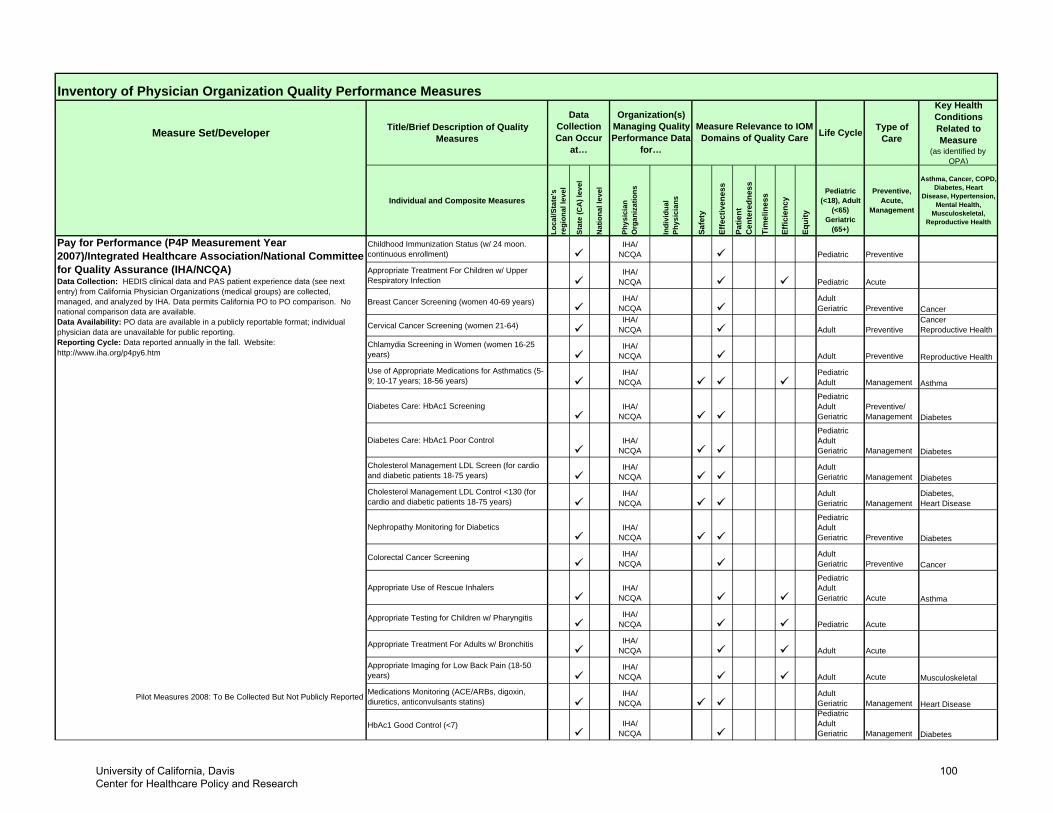
Inventory of Physician Organization Quality Performance Measures
Measure Set/Developer Title/Brief Description of Quality Measures Life Cycle Type of
Care
Key Health Conditions Related to Measure
(as identified by OPA)
Individual and Composite Measures
Loca
l/Sta
te's
re
gion
al le
vel
Stat
e (C
A) l
evel
Nat
iona
l lev
el
Phys
icia
n O
rgan
izat
ions
Indi
vidu
al
Phys
icia
ns
Safe
ty
Effe
ctiv
enes
s
Patie
nt
Cen
tere
dnes
s
Tim
elin
ess
Effic
ienc
y
Equi
ty
Pediatric (<18), Adult
(<65) Geriatric
(65+)
Preventive, Acute,
Management
Asthma, Cancer, COPD, Diabetes, Heart
Disease, Hypertension, Mental Health,
Musculoskeletal, Reproductive Health
Childhood Immunization Status (w/ 24 moon. continuous enrollment)
IHA/ NCQA Pediatric Preventive
Appropriate Treatment For Children w/ Upper Respiratory Infection
IHA/ NCQA Pediatric Acute
Breast Cancer Screening (women 40-69 years) IHA/ NCQA
Adult Geriatric Preventive Cancer
Cervical Cancer Screening (women 21-64)IHA/
NCQA Adult PreventiveCancer Reproductive Health
Chlamydia Screening in Women (women 16-25 years)
IHA/ NCQA Adult Preventive Reproductive Health
Use of Appropriate Medications for Asthmatics (5-9; 10-17 years; 18-56 years)
IHA/ NCQA
Pediatric Adult Management Asthma
Diabetes Care: HbAc1 Screening IHA/ NCQA
Pediatric Adult Geriatric
Preventive/ Management Diabetes
Diabetes Care: HbAc1 Poor Control IHA/ NCQA
Pediatric Adult Geriatric Management Diabetes
Cholesterol Management LDL Screen (for cardio and diabetic patients 18-75 years)
IHA/ NCQA
Adult Geriatric Management Diabetes
Cholesterol Management LDL Control <130 (for cardio and diabetic patients 18-75 years)
IHA/ NCQA
Adult Geriatric Management
Diabetes,Heart Disease
Nephropathy Monitoring for Diabetics IHA/ NCQA
Pediatric Adult Geriatric Preventive Diabetes
Colorectal Cancer Screening IHA/ NCQA
Adult Geriatric Preventive Cancer
Appropriate Use of Rescue Inhalers IHA/ NCQA
Pediatric Adult Geriatric Acute Asthma
Appropriate Testing for Children w/ Pharyngitis IHA/ NCQA Pediatric Acute
Appropriate Treatment For Adults w/ Bronchitis IHA/ NCQA Adult Acute
Appropriate Imaging for Low Back Pain (18-50 years)
IHA/ NCQA Adult Acute Musculoskeletal
Pilot Measures 2008: To Be Collected But Not Publicly Reported Medications Monitoring (ACE/ARBs, digoxin, diuretics, anticonvulsants statins)
IHA/ NCQA
Adult Geriatric Management Heart Disease
HbAc1 Good Control (<7) IHA/ NCQA
Pediatric Adult Geriatric Management Diabetes
Pay for Performance (P4P Measurement Year 2007)/Integrated Healthcare Association/National Committee for Quality Assurance (IHA/NCQA) Data Collection: HEDIS clinical data and PAS patient experience data (see next entry) from California Physician Organizations (medical groups) are collected, managed, and analyzed by IHA. Data permits California PO to PO comparison. No national comparison data are available.Data Availability: PO data are available in a publicly reportable format; individual physician data are unavailable for public reporting.Reporting Cycle: Data reported annually in the fall. Website: http://www.iha.org/p4py6.htm
Measure Relevance to IOM Domains of Quality Care
Organization(s) Managing Quality Performance Data
for…
Data Collection Can Occur
at…
University of California, Davis Center for Healthcare Policy and Research
100
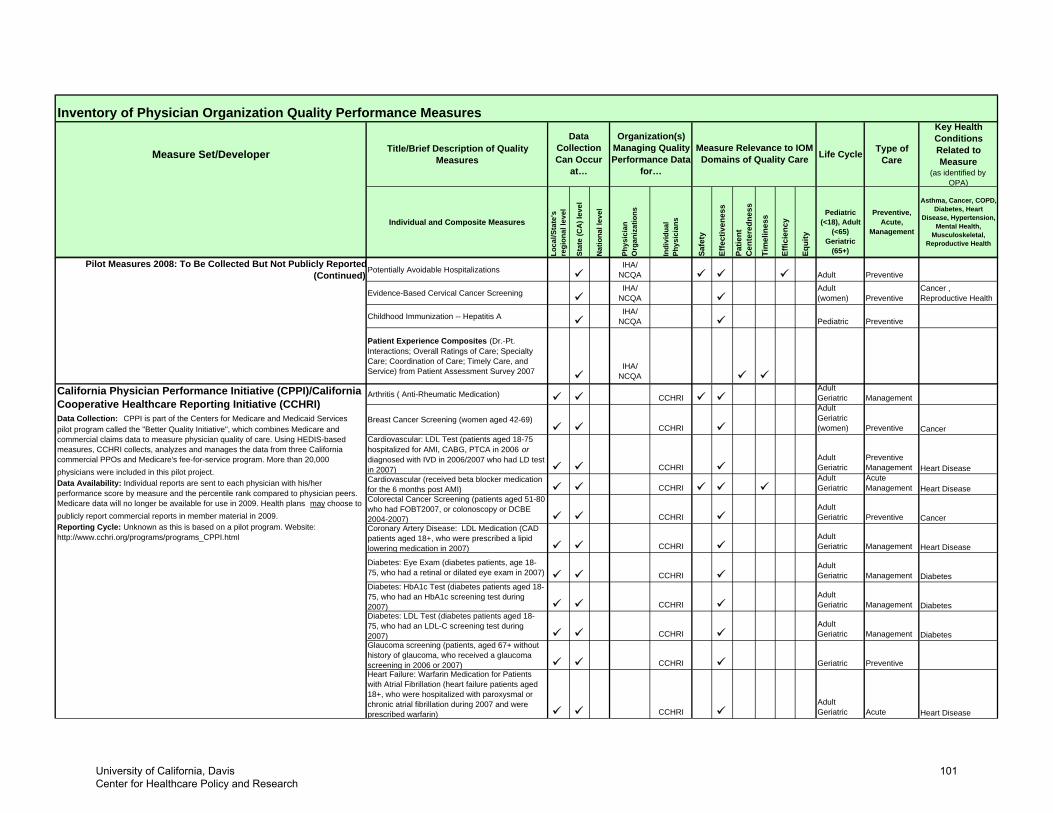
Inventory of Physician Organization Quality Performance Measures
Measure Set/Developer Title/Brief Description of Quality Measures Life Cycle Type of
Care
Key Health Conditions Related to Measure
(as identified by OPA)
Individual and Composite Measures
Loca
l/Sta
te's
re
gion
al le
vel
Stat
e (C
A) l
evel
Nat
iona
l lev
el
Phys
icia
n O
rgan
izat
ions
Indi
vidu
al
Phys
icia
ns
Safe
ty
Effe
ctiv
enes
s
Patie
nt
Cen
tere
dnes
s
Tim
elin
ess
Effic
ienc
y
Equi
ty
Pediatric (<18), Adult
(<65) Geriatric
(65+)
Preventive, Acute,
Management
Asthma, Cancer, COPD, Diabetes, Heart
Disease, Hypertension, Mental Health,
Musculoskeletal, Reproductive Health
Measure Relevance to IOM Domains of Quality Care
Organization(s) Managing Quality Performance Data
for…
Data Collection Can Occur
at…
Pilot Measures 2008: To Be Collected But Not Publicly Reported(Continued) Potentially Avoidable Hospitalizations IHA/
NCQA Adult Preventive
Evidence-Based Cervical Cancer Screening IHA/ NCQA
Adult (women) Preventive
Cancer , Reproductive Health
Childhood Immunization -- Hepatitis A IHA/ NCQA Pediatric Preventive
Patient Experience Composites (Dr.-Pt. Interactions; Overall Ratings of Care; Specialty Care; Coordination of Care; Timely Care, and Service) from Patient Assessment Survey 2007 IHA/
NCQA
Arthritis ( Anti-Rheumatic Medication) CCHRIAdultGeriatric Management
Breast Cancer Screening (women aged 42-69)CCHRI
AdultGeriatric(women) Preventive Cancer
Cardiovascular: LDL Test (patients aged 18-75 hospitalized for AMI, CABG, PTCA in 2006 or diagnosed with IVD in 2006/2007 who had LD test in 2007) CCHRI
AdultGeriatric
PreventiveManagement Heart Disease
Cardiovascular (received beta blocker medication for the 6 months post AMI) CCHRI
AdultGeriatric
AcuteManagement Heart Disease
Colorectal Cancer Screening (patients aged 51-80 who had FOBT2007, or colonoscopy or DCBE 2004-2007) CCHRI
AdultGeriatric Preventive Cancer
Coronary Artery Disease: LDL Medication (CAD patients aged 18+, who were prescribed a lipid lowering medication in 2007) CCHRI
AdultGeriatric Management Heart Disease
Diabetes: Eye Exam (diabetes patients, age 18-75, who had a retinal or dilated eye exam in 2007) CCHRI
AdultGeriatric Management Diabetes
Diabetes: HbA1c Test (diabetes patients aged 18-75, who had an HbA1c screening test during 2007) CCHRI
AdultGeriatric Management Diabetes
Diabetes: LDL Test (diabetes patients aged 18-75, who had an LDL-C screening test during 2007) CCHRI
AdultGeriatric Management Diabetes
Glaucoma screening (patients, aged 67+ without history of glaucoma, who received a glaucoma screening in 2006 or 2007) CCHRI Geriatric PreventiveHeart Failure: Warfarin Medication for Patients with Atrial Fibrillation (heart failure patients aged 18+, who were hospitalized with paroxysmal or chronic atrial fibrillation during 2007 and were prescribed warfarin) CCHRI
AdultGeriatric Acute Heart Disease
California Physician Performance Initiative (CPPI)/California Cooperative Healthcare Reporting Initiative (CCHRI)Data Collection: CPPI is part of the Centers for Medicare and Medicaid Services pilot program called the "Better Quality Initiative", which combines Medicare and commercial claims data to measure physician quality of care. Using HEDIS-based measures, CCHRI collects, analyzes and manages the data from three California commercial PPOs and Medicare's fee-for-service program. More than 20,000 physicians were included in this pilot project.Data Availability: Individual reports are sent to each physician with his/her performance score by measure and the percentile rank compared to physician peers. Medicare data will no longer be available for use in 2009. Health plans may choose to publicly report commercial reports in member material in 2009. Reporting Cycle: Unknown as this is based on a pilot program. Website: http://www.cchri.org/programs/programs_CPPI.html
University of California, Davis Center for Healthcare Policy and Research
101
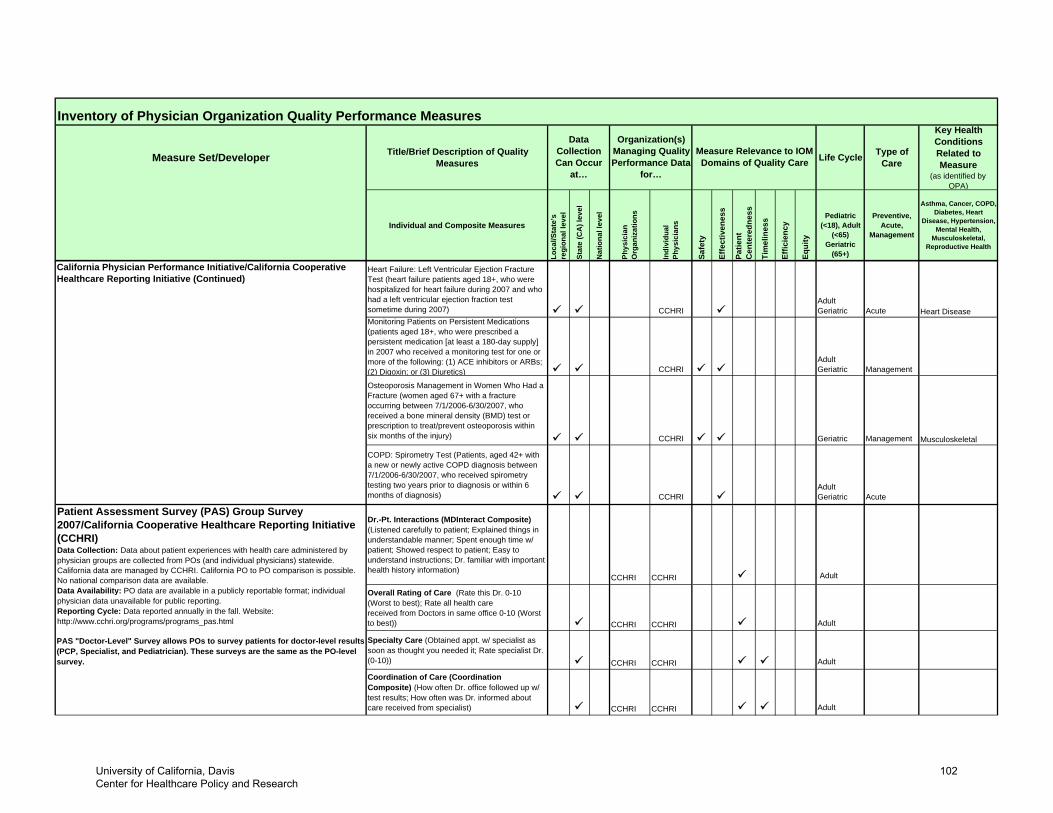
Inventory of Physician Organization Quality Performance Measures
Measure Set/Developer Title/Brief Description of Quality Measures Life Cycle Type of
Care
Key Health Conditions Related to Measure
(as identified by OPA)
Individual and Composite Measures
Loca
l/Sta
te's
re
gion
al le
vel
Stat
e (C
A) l
evel
Nat
iona
l lev
el
Phys
icia
n O
rgan
izat
ions
Indi
vidu
al
Phys
icia
ns
Safe
ty
Effe
ctiv
enes
s
Patie
nt
Cen
tere
dnes
s
Tim
elin
ess
Effic
ienc
y
Equi
ty
Pediatric (<18), Adult
(<65) Geriatric
(65+)
Preventive, Acute,
Management
Asthma, Cancer, COPD, Diabetes, Heart
Disease, Hypertension, Mental Health,
Musculoskeletal, Reproductive Health
Measure Relevance to IOM Domains of Quality Care
Organization(s) Managing Quality Performance Data
for…
Data Collection Can Occur
at…
California Physician Performance Initiative/California Cooperative Healthcare Reporting Initiative (Continued)
Heart Failure: Left Ventricular Ejection Fracture Test (heart failure patients aged 18+, who were hospitalized for heart failure during 2007 and who had a left ventricular ejection fraction test sometime during 2007) CCHRI
AdultGeriatric Acute Heart Disease
Monitoring Patients on Persistent Medications (patients aged 18+, who were prescribed a persistent medication [at least a 180-day supply] in 2007 who received a monitoring test for one or more of the following: (1) ACE inhibitors or ARBs; (2) Digoxin; or (3) Diuretics) CCHRI
AdultGeriatric Management
Osteoporosis Management in Women Who Had a Fracture (women aged 67+ with a fracture occurring between 7/1/2006-6/30/2007, who received a bone mineral density (BMD) test or prescription to treat/prevent osteoporosis within six months of the injury) CCHRI Geriatric Management Musculoskeletal
COPD: Spirometry Test (Patients, aged 42+ with a new or newly active COPD diagnosis between 7/1/2006-6/30/2007, who received spirometry testing two years prior to diagnosis or within 6 months of diagnosis) CCHRI
AdultGeriatric Acute
Dr.-Pt. Interactions (MDInteract Composite) (Listened carefully to patient; Explained things in understandable manner; Spent enough time w/ patient; Showed respect to patient; Easy to understand instructions; Dr. familiar with important health history information)
CCHRI CCHRI Adult
Overall Rating of Care (Rate this Dr. 0-10 (Worst to best); Rate all health care received from Doctors in same office 0-10 (Worst to best)) CCHRI CCHRI Adult
PAS "Doctor-Level" Survey allows POs to survey patients for doctor-level results (PCP, Specialist, and Pediatrician). These surveys are the same as the PO-level survey.
Specialty Care (Obtained appt. w/ specialist as soon as thought you needed it; Rate specialist Dr. (0-10)) CCHRI CCHRI Adult
Coordination of Care (Coordination Composite) (How often Dr. office followed up w/ test results; How often was Dr. informed about care received from specialist) CCHRI CCHRI Adult
Patient Assessment Survey (PAS) Group Survey 2007/California Cooperative Healthcare Reporting Initiative (CCHRI)Data Collection: Data about patient experiences with health care administered by physician groups are collected from POs (and individual physicians) statewide. California data are managed by CCHRI. California PO to PO comparison is possible. No national comparison data are available.Data Availability: PO data are available in a publicly reportable format; individual physician data unavailable for public reporting.Reporting Cycle: Data reported annually in the fall. Website: http://www.cchri.org/programs/programs_pas.html
University of California, Davis Center for Healthcare Policy and Research
102
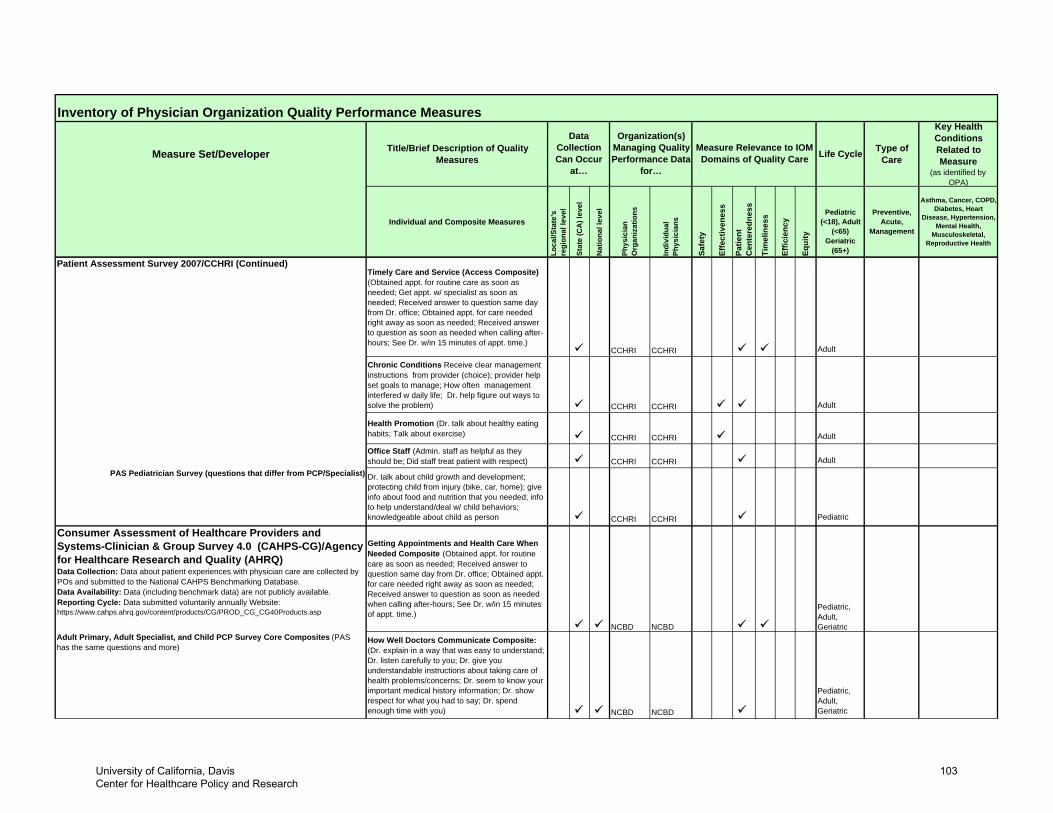
Inventory of Physician Organization Quality Performance Measures
Measure Set/Developer Title/Brief Description of Quality Measures Life Cycle Type of
Care
Key Health Conditions Related to Measure
(as identified by OPA)
Individual and Composite Measures
Loca
l/Sta
te's
re
gion
al le
vel
Stat
e (C
A) l
evel
Nat
iona
l lev
el
Phys
icia
n O
rgan
izat
ions
Indi
vidu
al
Phys
icia
ns
Safe
ty
Effe
ctiv
enes
s
Patie
nt
Cen
tere
dnes
s
Tim
elin
ess
Effic
ienc
y
Equi
ty
Pediatric (<18), Adult
(<65) Geriatric
(65+)
Preventive, Acute,
Management
Asthma, Cancer, COPD, Diabetes, Heart
Disease, Hypertension, Mental Health,
Musculoskeletal, Reproductive Health
Measure Relevance to IOM Domains of Quality Care
Organization(s) Managing Quality Performance Data
for…
Data Collection Can Occur
at…
Patient Assessment Survey 2007/CCHRI (Continued)Timely Care and Service (Access Composite) (Obtained appt. for routine care as soon as needed; Get appt. w/ specialist as soon as needed; Received answer to question same day from Dr. office; Obtained appt. for care needed right away as soon as needed; Received answer to question as soon as needed when calling after-hours; See Dr. w/in 15 minutes of appt. time.)
CCHRI CCHRI Adult
Chronic Conditions Receive clear management instructions from provider (choice); provider help set goals to manage; How often management interfered w daily life; Dr. help figure out ways to solve the problem) CCHRI CCHRI Adult
Health Promotion (Dr. talk about healthy eating habits; Talk about exercise) CCHRI CCHRI Adult
Office Staff (Admin. staff as helpful as they should be; Did staff treat patient with respect) CCHRI CCHRI Adult
PAS Pediatrician Survey (questions that differ from PCP/Specialist) Dr. talk about child growth and development; protecting child from injury (bike, car, home); give info about food and nutrition that you needed; info to help understand/deal w/ child behaviors; knowledgeable about child as person CCHRI CCHRI Pediatric
Adult Primary, Adult Specialist, and Child PCP Survey Core Composites (PAS has the same questions and more)
How Well Doctors Communicate Composite: (Dr. explain in a way that was easy to understand; Dr. listen carefully to you; Dr. give you understandable instructions about taking care of health problems/concerns; Dr. seem to know your important medical history information; Dr. show respect for what you had to say; Dr. spend enough time with you) NCBD NCBD
Pediatric, Adult, Geriatric
Pediatric, Adult, Geriatric
Getting Appointments and Health Care When Needed Composite (Obtained appt. for routine care as soon as needed; Received answer to question same day from Dr. office; Obtained appt. for care needed right away as soon as needed; Received answer to question as soon as needed when calling after-hours; See Dr. w/in 15 minutes of appt. time.)
NCBD
Consumer Assessment of Healthcare Providers and Systems-Clinician & Group Survey 4.0 (CAHPS-CG)/Agency for Healthcare Research and Quality (AHRQ)Data Collection: Data about patient experiences with physician care are collected by POs and submitted to the National CAHPS Benchmarking Database. Data Availability: Data (including benchmark data) are not publicly available. Reporting Cycle: Data submitted voluntarily annually Website: https://www.cahps.ahrq.gov/content/products/CG/PROD_CG_CG40Products.asp
NCBD
University of California, Davis Center for Healthcare Policy and Research
103
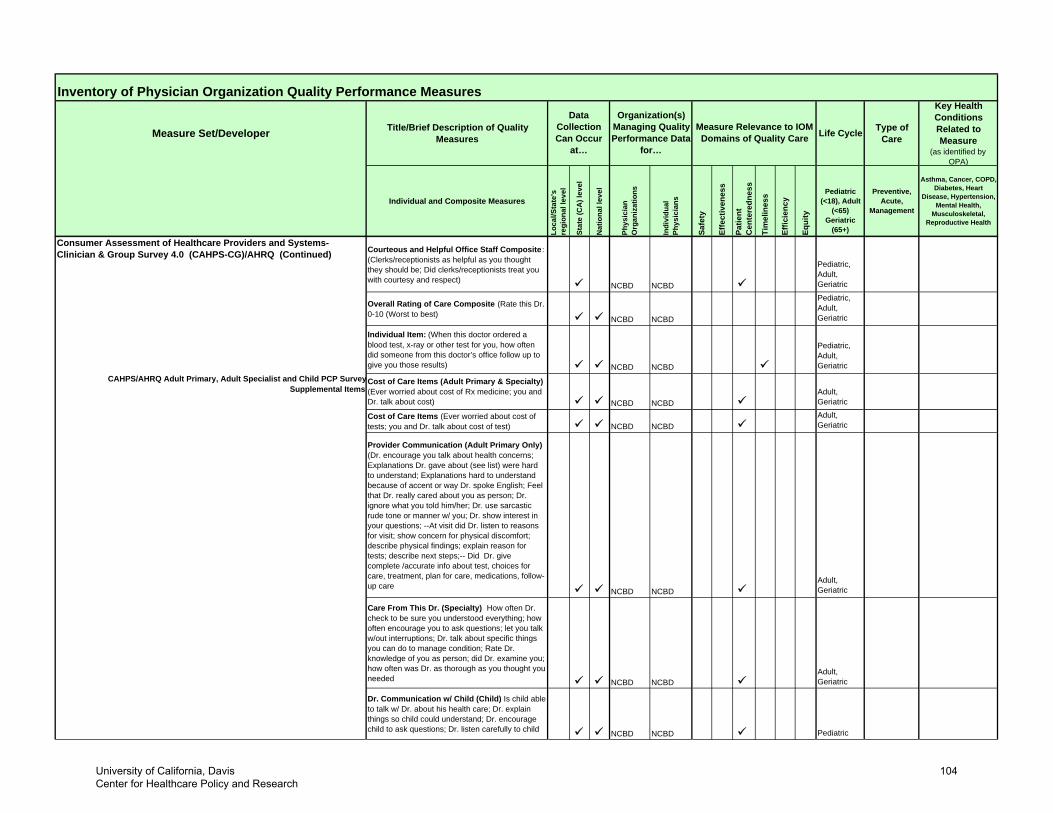
Inventory of Physician Organization Quality Performance Measures
Measure Set/Developer Title/Brief Description of Quality Measures Life Cycle Type of
Care
Key Health Conditions Related to Measure
(as identified by OPA)
Individual and Composite Measures
Loca
l/Sta
te's
re
gion
al le
vel
Stat
e (C
A) l
evel
Nat
iona
l lev
el
Phys
icia
n O
rgan
izat
ions
Indi
vidu
al
Phys
icia
ns
Safe
ty
Effe
ctiv
enes
s
Patie
nt
Cen
tere
dnes
s
Tim
elin
ess
Effic
ienc
y
Equi
ty
Pediatric (<18), Adult
(<65) Geriatric
(65+)
Preventive, Acute,
Management
Asthma, Cancer, COPD, Diabetes, Heart
Disease, Hypertension, Mental Health,
Musculoskeletal, Reproductive Health
Measure Relevance to IOM Domains of Quality Care
Organization(s) Managing Quality Performance Data
for…
Data Collection Can Occur
at…
Consumer Assessment of Healthcare Providers and Systems-Clinician & Group Survey 4.0 (CAHPS-CG)/AHRQ (Continued) Courteous and Helpful Office Staff Composite :
(Clerks/receptionists as helpful as you thought they should be; Did clerks/receptionists treat you with courtesy and respect)
NCBD NCBD
Pediatric, Adult, Geriatric
Overall Rating of Care Composite (Rate this Dr. 0-10 (Worst to best) NCBD NCBD
Pediatric, Adult, Geriatric
Individual Item: (When this doctor ordered a blood test, x-ray or other test for you, how often did someone from this doctor’s office follow up to give you those results) NCBD NCBD
Pediatric, Adult, Geriatric
CAHPS/AHRQ Adult Primary, Adult Specialist and Child PCP SurveySupplemental Items
Cost of Care Items (Adult Primary & Specialty) (Ever worried about cost of Rx medicine; you and Dr. talk about cost) NCBD NCBD
Adult, Geriatric
Cost of Care Items (Ever worried about cost of tests; you and Dr. talk about cost of test) NCBD NCBD
Adult, Geriatric
Provider Communication (Adult Primary Only) (Dr. encourage you talk about health concerns; Explanations Dr. gave about (see list) were hard to understand; Explanations hard to understand because of accent or way Dr. spoke English; Feel that Dr. really cared about you as person; Dr. ignore what you told him/her; Dr. use sarcastic rude tone or manner w/ you; Dr. show interest in your questions; --At visit did Dr. listen to reasons for visit; show concern for physical discomfort; describe physical findings; explain reason for tests; describe next steps;-- Did Dr. give complete /accurate info about test, choices for care, treatment, plan for care, medications, follow-up care
NCBD NCBDAdult, Geriatric
Care From This Dr. (Specialty) How often Dr. check to be sure you understood everything; how often encourage you to ask questions; let you talk w/out interruptions; Dr. talk about specific things you can do to manage condition; Rate Dr. knowledge of you as person; did Dr. examine you; how often was Dr. as thorough as you thought you needed NCBD NCBD
Adult, Geriatric
Dr. Communication w/ Child (Child) Is child able to talk w/ Dr. about his health care; Dr. explain things so child could understand; Dr. encourage child to ask questions; Dr. listen carefully to child NCBD NCBD Pediatric
University of California, Davis Center for Healthcare Policy and Research
104
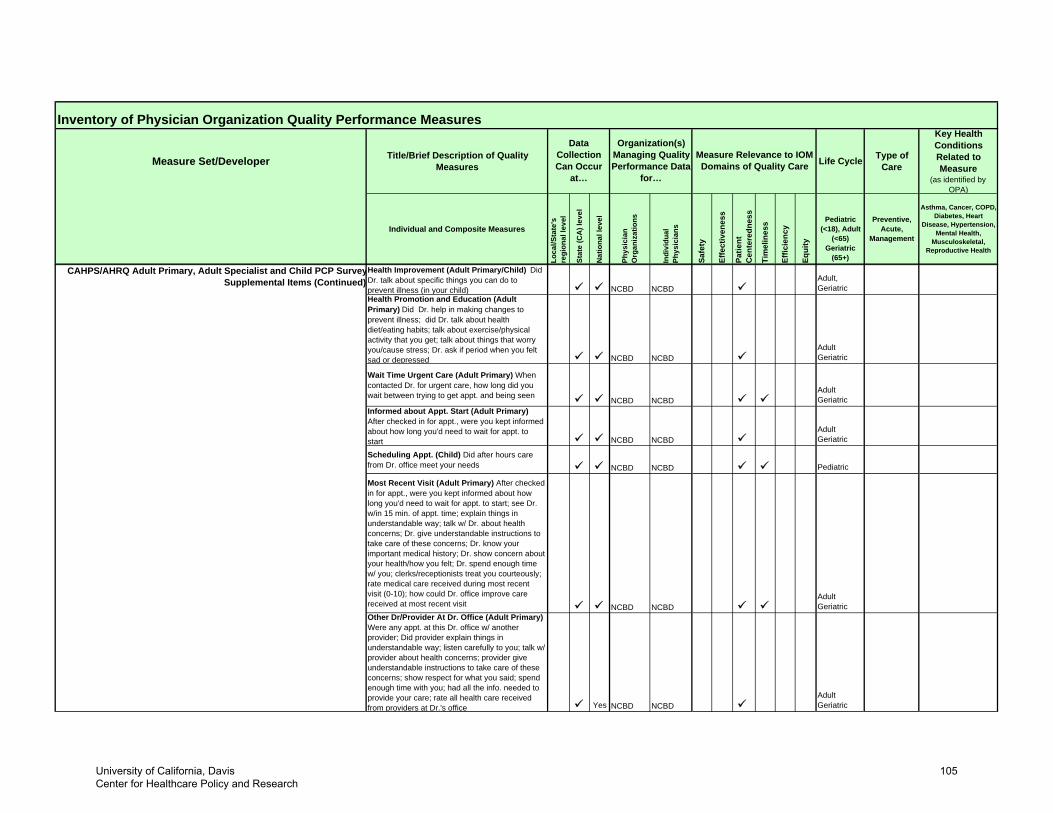
Inventory of Physician Organization Quality Performance Measures
Measure Set/Developer Title/Brief Description of Quality Measures Life Cycle Type of
Care
Key Health Conditions Related to Measure
(as identified by OPA)
Individual and Composite Measures
Loca
l/Sta
te's
re
gion
al le
vel
Stat
e (C
A) l
evel
Nat
iona
l lev
el
Phys
icia
n O
rgan
izat
ions
Indi
vidu
al
Phys
icia
ns
Safe
ty
Effe
ctiv
enes
s
Patie
nt
Cen
tere
dnes
s
Tim
elin
ess
Effic
ienc
y
Equi
ty
Pediatric (<18), Adult
(<65) Geriatric
(65+)
Preventive, Acute,
Management
Asthma, Cancer, COPD, Diabetes, Heart
Disease, Hypertension, Mental Health,
Musculoskeletal, Reproductive Health
Measure Relevance to IOM Domains of Quality Care
Organization(s) Managing Quality Performance Data
for…
Data Collection Can Occur
at…
CAHPS/AHRQ Adult Primary, Adult Specialist and Child PCP SurveySupplemental Items (Continued)
Health Improvement (Adult Primary/Child) Did Dr. talk about specific things you can do to prevent illness (in your child) NCBD NCBD
Adult, Geriatric
Health Promotion and Education (Adult Primary) Did Dr. help in making changes to prevent illness; did Dr. talk about health diet/eating habits; talk about exercise/physical activity that you get; talk about things that worry you/cause stress; Dr. ask if period when you felt sad or depressed NCBD NCBD
Adult Geriatric
Wait Time Urgent Care (Adult Primary) When contacted Dr. for urgent care, how long did you wait between trying to get appt. and being seen NCBD NCBD
Adult Geriatric
Informed about Appt. Start (Adult Primary) After checked in for appt., were you kept informed about how long you'd need to wait for appt. to start NCBD NCBD
Adult Geriatric
Scheduling Appt. (Child) Did after hours care from Dr. office meet your needs NCBD NCBD Pediatric
Most Recent Visit (Adult Primary) After checked in for appt., were you kept informed about how long you'd need to wait for appt. to start; see Dr. w/in 15 min. of appt. time; explain things in understandable way; talk w/ Dr. about health concerns; Dr. give understandable instructions to take care of these concerns; Dr. know your important medical history; Dr. show concern about your health/how you felt; Dr. spend enough time w/ you; clerks/receptionists treat you courteously; rate medical care received during most recent visit (0-10); how could Dr. office improve care received at most recent visit NCBD NCBD
Adult Geriatric
Other Dr/Provider At Dr. Office (Adult Primary) Were any appt. at this Dr. office w/ another provider; Did provider explain things in understandable way; listen carefully to you; talk w/ provider about health concerns; provider give understandable instructions to take care of these concerns; show respect for what you said; spend enough time with you; had all the info. needed to provide your care; rate all health care received from providers at Dr.'s office Yes NCBD NCBD
Adult Geriatric
University of California, Davis Center for Healthcare Policy and Research
105
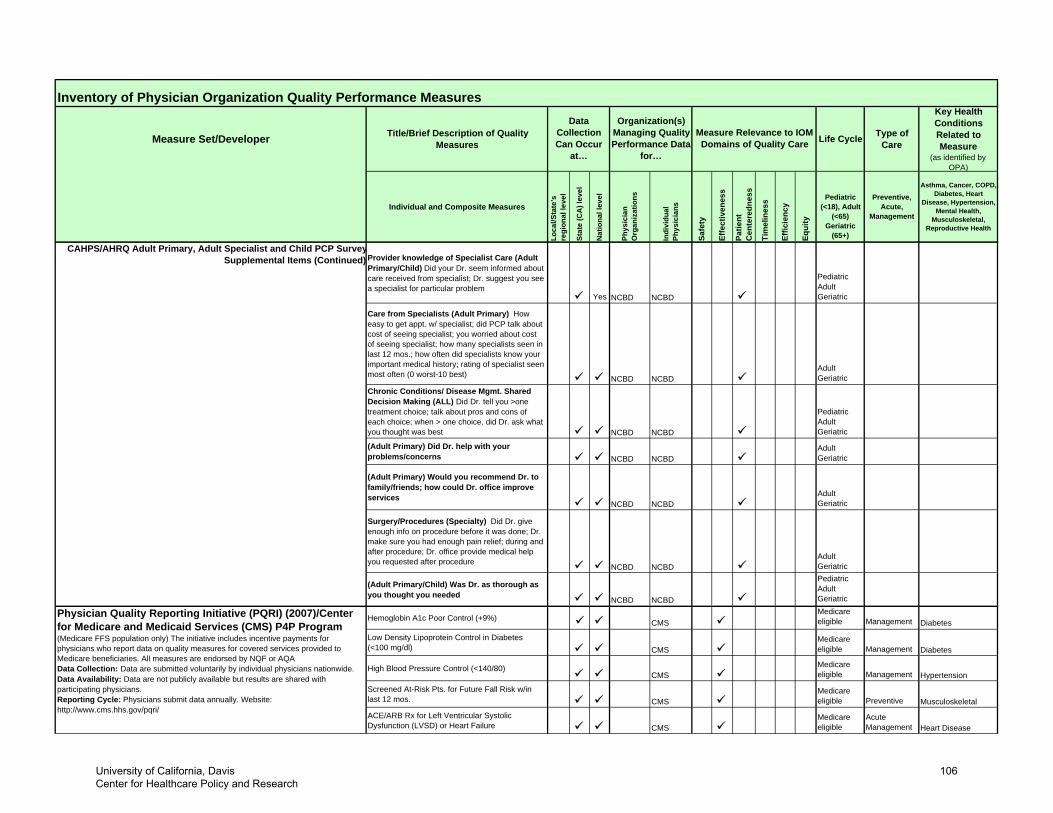
Inventory of Physician Organization Quality Performance Measures
Measure Set/Developer Title/Brief Description of Quality Measures Life Cycle Type of
Care
Key Health Conditions Related to Measure
(as identified by OPA)
Individual and Composite Measures
Loca
l/Sta
te's
re
gion
al le
vel
Stat
e (C
A) l
evel
Nat
iona
l lev
el
Phys
icia
n O
rgan
izat
ions
Indi
vidu
al
Phys
icia
ns
Safe
ty
Effe
ctiv
enes
s
Patie
nt
Cen
tere
dnes
s
Tim
elin
ess
Effic
ienc
y
Equi
ty
Pediatric (<18), Adult
(<65) Geriatric
(65+)
Preventive, Acute,
Management
Asthma, Cancer, COPD, Diabetes, Heart
Disease, Hypertension, Mental Health,
Musculoskeletal, Reproductive Health
Measure Relevance to IOM Domains of Quality Care
Organization(s) Managing Quality Performance Data
for…
Data Collection Can Occur
at…
CAHPS/AHRQ Adult Primary, Adult Specialist and Child PCP SurveySupplemental Items (Continued) Provider knowledge of Specialist Care (Adult
Primary/Child) Did your Dr. seem informed about care received from specialist; Dr. suggest you see a specialist for particular problem
Yes NCBD NCBD
Pediatric Adult Geriatric
Care from Specialists (Adult Primary) How easy to get appt. w/ specialist; did PCP talk about cost of seeing specialist; you worried about cost of seeing specialist; how many specialists seen in last 12 mos.; how often did specialists know your important medical history; rating of specialist seen most often (0 worst-10 best) NCBD NCBD
Adult Geriatric
Chronic Conditions/ Disease Mgmt. Shared Decision Making (ALL) Did Dr. tell you >one treatment choice; talk about pros and cons of each choice; when > one choice, did Dr. ask what you thought was best NCBD NCBD
Pediatric Adult Geriatric
(Adult Primary) Did Dr. help with your problems/concerns NCBD NCBD
Adult Geriatric
(Adult Primary) Would you recommend Dr. to family/friends; how could Dr. office improve services
NCBD NCBDAdult Geriatric
Surgery/Procedures (Specialty) Did Dr. give enough info on procedure before it was done; Dr. make sure you had enough pain relief; during and after procedure; Dr. office provide medical help you requested after procedure
NCBD NCBDAdult Geriatric
(Adult Primary/Child) Was Dr. as thorough as you thought you needed NCBD NCBD
Pediatric Adult Geriatric
Hemoglobin A1c Poor Control (+9%) CMSMedicare eligible Management Diabetes
Low Density Lipoprotein Control in Diabetes (<100 mg/dl) CMS
Medicare eligible Management Diabetes
High Blood Pressure Control (<140/80)CMS
Medicare eligible Management Hypertension
Screened At-Risk Pts. for Future Fall Risk w/in last 12 mos. CMS
Medicare eligible Preventive Musculoskeletal
ACE/ARB Rx for Left Ventricular Systolic Dysfunction (LVSD) or Heart Failure CMS
Medicare eligible
AcuteManagement Heart Disease
Physician Quality Reporting Initiative (PQRI) (2007)/Center for Medicare and Medicaid Services (CMS) P4P Program (Medicare FFS population only) The initiative includes incentive payments for physicians who report data on quality measures for covered services provided to Medicare beneficiaries. All measures are endorsed by NQF or AQAData Collection: Data are submitted voluntarily by individual physicians nationwide. Data Availability: Data are not publicly available but results are shared with participating physicians.Reporting Cycle: Physicians submit data annually. Website: http://www.cms.hhs.gov/pqri/
University of California, Davis Center for Healthcare Policy and Research
106
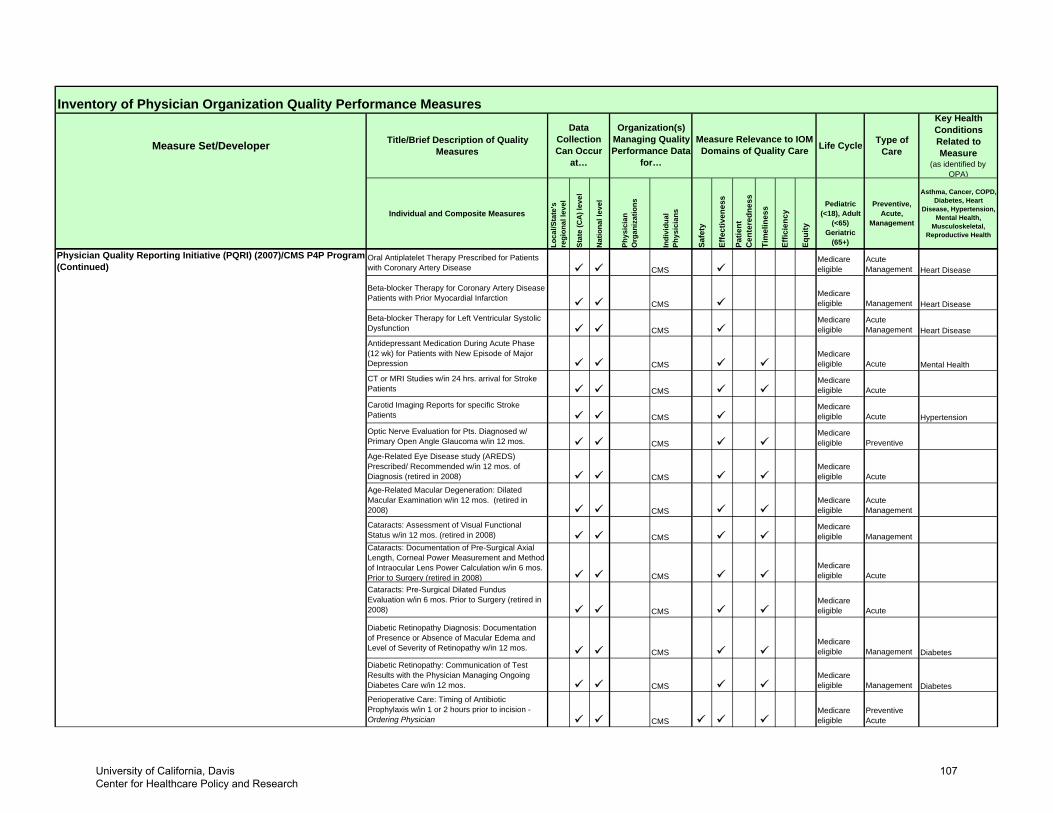
Inventory of Physician Organization Quality Performance Measures
Measure Set/Developer Title/Brief Description of Quality Measures Life Cycle Type of
Care
Key Health Conditions Related to Measure
(as identified by OPA)
Individual and Composite Measures
Loca
l/Sta
te's
re
gion
al le
vel
Stat
e (C
A) l
evel
Nat
iona
l lev
el
Phys
icia
n O
rgan
izat
ions
Indi
vidu
al
Phys
icia
ns
Safe
ty
Effe
ctiv
enes
s
Patie
nt
Cen
tere
dnes
s
Tim
elin
ess
Effic
ienc
y
Equi
ty
Pediatric (<18), Adult
(<65) Geriatric
(65+)
Preventive, Acute,
Management
Asthma, Cancer, COPD, Diabetes, Heart
Disease, Hypertension, Mental Health,
Musculoskeletal, Reproductive Health
Measure Relevance to IOM Domains of Quality Care
Organization(s) Managing Quality Performance Data
for…
Data Collection Can Occur
at…
Physician Quality Reporting Initiative (PQRI) (2007)/CMS P4P Program (Continued)
Oral Antiplatelet Therapy Prescribed for Patients with Coronary Artery Disease CMS
Medicare eligible
Acute Management Heart Disease
Beta-blocker Therapy for Coronary Artery Disease Patients with Prior Myocardial Infarction
CMSMedicare eligible Management Heart Disease
Beta-blocker Therapy for Left Ventricular Systolic Dysfunction CMS
Medicare eligible
Acute Management Heart Disease
Antidepressant Medication During Acute Phase (12 wk) for Patients with New Episode of Major Depression CMS
Medicare eligible Acute Mental Health
CT or MRI Studies w/in 24 hrs. arrival for Stroke Patients CMS
Medicare eligible Acute
Carotid Imaging Reports for specific Stroke Patients CMS
Medicare eligible Acute Hypertension
Optic Nerve Evaluation for Pts. Diagnosed w/ Primary Open Angle Glaucoma w/in 12 mos. CMS
Medicare eligible Preventive
Age-Related Eye Disease study (AREDS) Prescribed/ Recommended w/in 12 mos. of Diagnosis (retired in 2008) CMS
Medicare eligible Acute
Age-Related Macular Degeneration: Dilated Macular Examination w/in 12 mos. (retired in 2008) CMS
Medicare eligible
Acute Management
Cataracts: Assessment of Visual Functional Status w/in 12 mos. (retired in 2008) CMS
Medicare eligible Management
Cataracts: Documentation of Pre-Surgical Axial Length, Corneal Power Measurement and Method of Intraocular Lens Power Calculation w/in 6 mos. Prior to Surgery (retired in 2008) CMS
Medicare eligible Acute
Cataracts: Pre-Surgical Dilated Fundus Evaluation w/in 6 mos. Prior to Surgery (retired in 2008) CMS
Medicare eligible Acute
Diabetic Retinopathy Diagnosis: Documentation of Presence or Absence of Macular Edema and Level of Severity of Retinopathy w/in 12 mos. CMS
Medicare eligible Management Diabetes
Diabetic Retinopathy: Communication of Test Results with the Physician Managing Ongoing Diabetes Care w/in 12 mos. CMS
Medicare eligible Management Diabetes
Perioperative Care: Timing of Antibiotic Prophylaxis w/in 1 or 2 hours prior to incision - Ordering Physician CMS
Medicare eligible
Preventive Acute
University of California, Davis Center for Healthcare Policy and Research
107
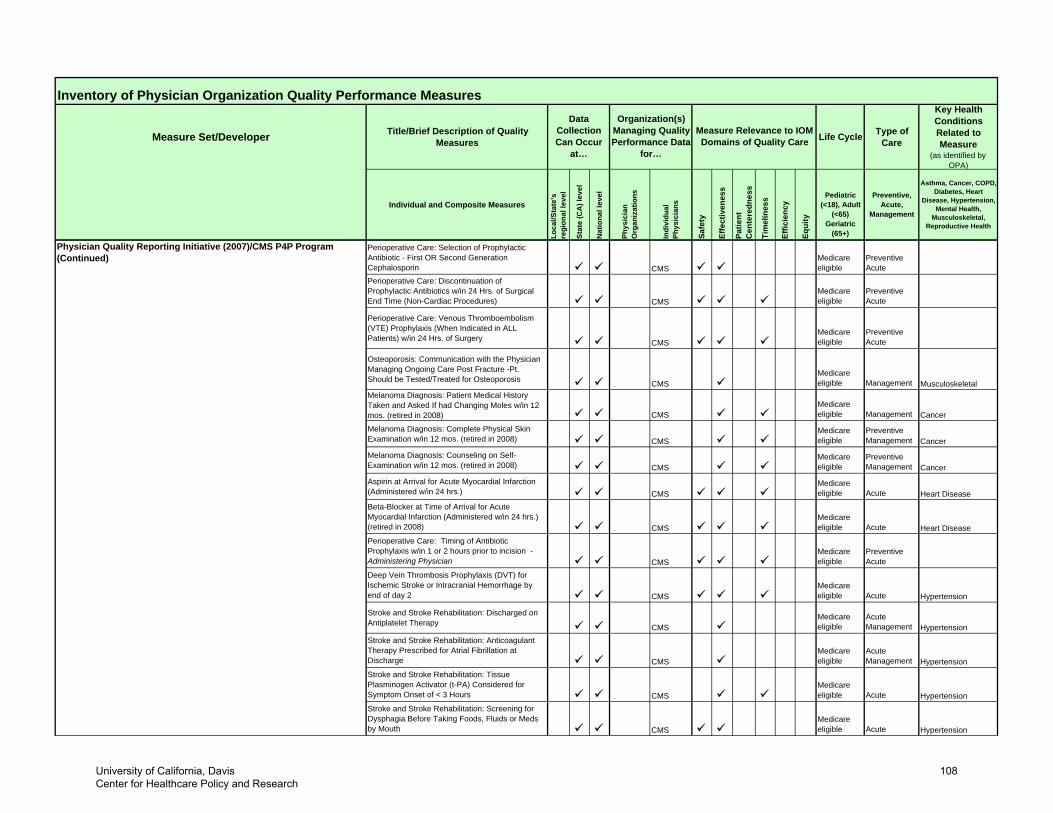
Inventory of Physician Organization Quality Performance Measures
Measure Set/Developer Title/Brief Description of Quality Measures Life Cycle Type of
Care
Key Health Conditions Related to Measure
(as identified by OPA)
Individual and Composite Measures
Loca
l/Sta
te's
re
gion
al le
vel
Stat
e (C
A) l
evel
Nat
iona
l lev
el
Phys
icia
n O
rgan
izat
ions
Indi
vidu
al
Phys
icia
ns
Safe
ty
Effe
ctiv
enes
s
Patie
nt
Cen
tere
dnes
s
Tim
elin
ess
Effic
ienc
y
Equi
ty
Pediatric (<18), Adult
(<65) Geriatric
(65+)
Preventive, Acute,
Management
Asthma, Cancer, COPD, Diabetes, Heart
Disease, Hypertension, Mental Health,
Musculoskeletal, Reproductive Health
Measure Relevance to IOM Domains of Quality Care
Organization(s) Managing Quality Performance Data
for…
Data Collection Can Occur
at…
Physician Quality Reporting Initiative (2007)/CMS P4P Program (Continued)
Perioperative Care: Selection of Prophylactic Antibiotic - First OR Second Generation Cephalosporin CMS
Medicare eligible
Preventive Acute
Perioperative Care: Discontinuation of Prophylactic Antibiotics w/in 24 Hrs. of Surgical End Time (Non-Cardiac Procedures) CMS
Medicare eligible
Preventive Acute
Perioperative Care: Venous Thromboembolism (VTE) Prophylaxis (When Indicated in ALL Patients) w/in 24 Hrs. of Surgery CMS
Medicare eligible
Preventive Acute
Osteoporosis: Communication with the Physician Managing Ongoing Care Post Fracture -Pt. Should be Tested/Treated for Osteoporosis CMS
Medicare eligible Management Musculoskeletal
Melanoma Diagnosis: Patient Medical History Taken and Asked If had Changing Moles w/in 12 mos. (retired in 2008) CMS
Medicare eligible Management Cancer
Melanoma Diagnosis: Complete Physical Skin Examination w/in 12 mos. (retired in 2008) CMS
Medicare eligible
Preventive Management Cancer
Melanoma Diagnosis: Counseling on Self-Examination w/in 12 mos. (retired in 2008) CMS
Medicare eligible
Preventive Management Cancer
Aspirin at Arrival for Acute Myocardial Infarction (Administered w/in 24 hrs.) CMS
Medicare eligible Acute Heart Disease
Beta-Blocker at Time of Arrival for Acute Myocardial Infarction (Administered w/in 24 hrs.) (retired in 2008) CMS
Medicare eligible Acute Heart Disease
Perioperative Care: Timing of Antibiotic Prophylaxis w/in 1 or 2 hours prior to incision - Administering Physician CMS
Medicare eligible
Preventive Acute
Deep Vein Thrombosis Prophylaxis (DVT) for Ischemic Stroke or Intracranial Hemorrhage by end of day 2 CMS
Medicare eligible Acute Hypertension
Stroke and Stroke Rehabilitation: Discharged on Antiplatelet Therapy CMS
Medicare eligible
Acute Management Hypertension
Stroke and Stroke Rehabilitation: Anticoagulant Therapy Prescribed for Atrial Fibrillation at Discharge CMS
Medicare eligible
Acute Management Hypertension
Stroke and Stroke Rehabilitation: Tissue Plasminogen Activator (t-PA) Considered for Symptom Onset of < 3 Hours CMS
Medicare eligible Acute Hypertension
Stroke and Stroke Rehabilitation: Screening for Dysphagia Before Taking Foods, Fluids or Meds by Mouth CMS
Medicare eligible Acute Hypertension
University of California, Davis Center for Healthcare Policy and Research
108
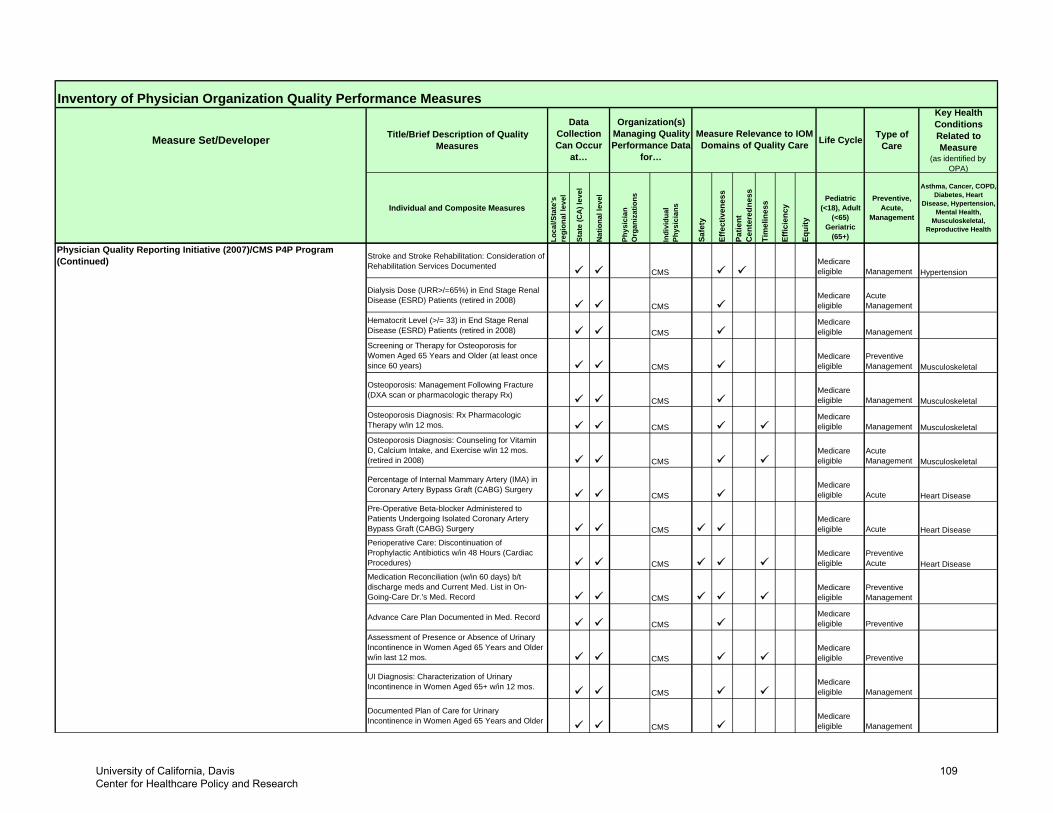
Inventory of Physician Organization Quality Performance Measures
Measure Set/Developer Title/Brief Description of Quality Measures Life Cycle Type of
Care
Key Health Conditions Related to Measure
(as identified by OPA)
Individual and Composite Measures
Loca
l/Sta
te's
re
gion
al le
vel
Stat
e (C
A) l
evel
Nat
iona
l lev
el
Phys
icia
n O
rgan
izat
ions
Indi
vidu
al
Phys
icia
ns
Safe
ty
Effe
ctiv
enes
s
Patie
nt
Cen
tere
dnes
s
Tim
elin
ess
Effic
ienc
y
Equi
ty
Pediatric (<18), Adult
(<65) Geriatric
(65+)
Preventive, Acute,
Management
Asthma, Cancer, COPD, Diabetes, Heart
Disease, Hypertension, Mental Health,
Musculoskeletal, Reproductive Health
Measure Relevance to IOM Domains of Quality Care
Organization(s) Managing Quality Performance Data
for…
Data Collection Can Occur
at…
Physician Quality Reporting Initiative (2007)/CMS P4P Program (Continued) Stroke and Stroke Rehabilitation: Consideration of
Rehabilitation Services DocumentedCMS
Medicare eligible Management Hypertension
Dialysis Dose (URR>/=65%) in End Stage Renal Disease (ESRD) Patients (retired in 2008)
CMSMedicare eligible
Acute Management
Hematocrit Level (>/= 33) in End Stage Renal Disease (ESRD) Patients (retired in 2008) CMS
Medicare eligible Management
Screening or Therapy for Osteoporosis for Women Aged 65 Years and Older (at least once since 60 years) CMS
Medicare eligible
Preventive Management Musculoskeletal
Osteoporosis: Management Following Fracture (DXA scan or pharmacologic therapy Rx)
CMSMedicare eligible Management Musculoskeletal
Osteoporosis Diagnosis: Rx Pharmacologic Therapy w/in 12 mos. CMS
Medicare eligible Management Musculoskeletal
Osteoporosis Diagnosis: Counseling for Vitamin D, Calcium Intake, and Exercise w/in 12 mos. (retired in 2008) CMS
Medicare eligible
Acute Management Musculoskeletal
Percentage of Internal Mammary Artery (IMA) in Coronary Artery Bypass Graft (CABG) Surgery
CMSMedicare eligible Acute Heart Disease
Pre-Operative Beta-blocker Administered to Patients Undergoing Isolated Coronary Artery Bypass Graft (CABG) Surgery CMS
Medicare eligible Acute Heart Disease
Perioperative Care: Discontinuation of Prophylactic Antibiotics w/in 48 Hours (Cardiac Procedures) CMS
Medicare eligible
Preventive Acute Heart Disease
Medication Reconciliation (w/in 60 days) b/t discharge meds and Current Med. List in On-Going-Care Dr.'s Med. Record CMS
Medicare eligible
Preventive Management
Advance Care Plan Documented in Med. RecordCMS
Medicare eligible Preventive
Assessment of Presence or Absence of Urinary Incontinence in Women Aged 65 Years and Older w/in last 12 mos. CMS
Medicare eligible Preventive
UI Diagnosis: Characterization of Urinary Incontinence in Women Aged 65+ w/in 12 mos.
CMSMedicare eligible Management
Documented Plan of Care for Urinary Incontinence in Women Aged 65 Years and Older
CMSMedicare eligible Management
University of California, Davis Center for Healthcare Policy and Research
109
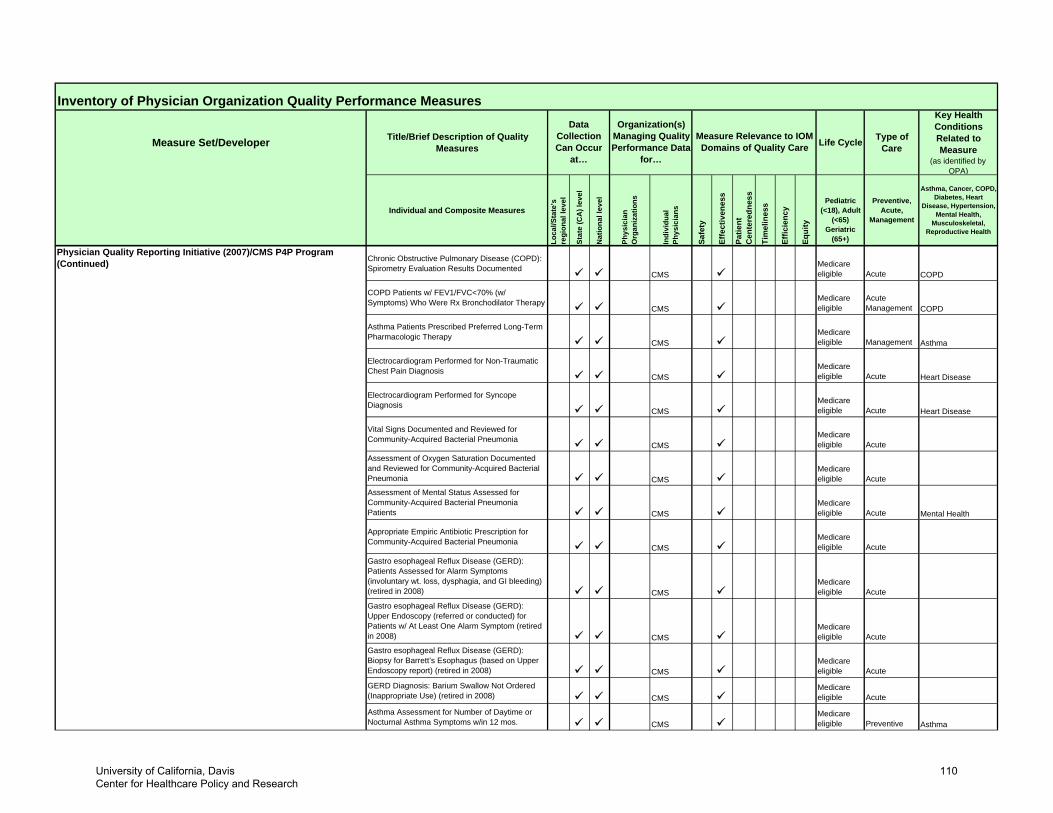
Inventory of Physician Organization Quality Performance Measures
Measure Set/Developer Title/Brief Description of Quality Measures Life Cycle Type of
Care
Key Health Conditions Related to Measure
(as identified by OPA)
Individual and Composite Measures
Loca
l/Sta
te's
re
gion
al le
vel
Stat
e (C
A) l
evel
Nat
iona
l lev
el
Phys
icia
n O
rgan
izat
ions
Indi
vidu
al
Phys
icia
ns
Safe
ty
Effe
ctiv
enes
s
Patie
nt
Cen
tere
dnes
s
Tim
elin
ess
Effic
ienc
y
Equi
ty
Pediatric (<18), Adult
(<65) Geriatric
(65+)
Preventive, Acute,
Management
Asthma, Cancer, COPD, Diabetes, Heart
Disease, Hypertension, Mental Health,
Musculoskeletal, Reproductive Health
Measure Relevance to IOM Domains of Quality Care
Organization(s) Managing Quality Performance Data
for…
Data Collection Can Occur
at…
Physician Quality Reporting Initiative (2007)/CMS P4P Program (Continued) Chronic Obstructive Pulmonary Disease (COPD):
Spirometry Evaluation Results DocumentedCMS
Medicare eligible Acute COPD
COPD Patients w/ FEV1/FVC<70% (w/ Symptoms) Who Were Rx Bronchodilator Therapy
CMSMedicare eligible
Acute Management COPD
Asthma Patients Prescribed Preferred Long-Term Pharmacologic Therapy
CMSMedicare eligible Management Asthma
Electrocardiogram Performed for Non-Traumatic Chest Pain Diagnosis
CMSMedicare eligible Acute Heart Disease
Electrocardiogram Performed for Syncope Diagnosis
CMSMedicare eligible Acute Heart Disease
Vital Signs Documented and Reviewed for Community-Acquired Bacterial Pneumonia
CMSMedicare eligible Acute
Assessment of Oxygen Saturation Documented and Reviewed for Community-Acquired Bacterial Pneumonia CMS
Medicare eligible Acute
Assessment of Mental Status Assessed for Community-Acquired Bacterial Pneumonia Patients CMS
Medicare eligible Acute Mental Health
Appropriate Empiric Antibiotic Prescription for Community-Acquired Bacterial Pneumonia
CMSMedicare eligible Acute
Gastro esophageal Reflux Disease (GERD): Patients Assessed for Alarm Symptoms (involuntary wt. loss, dysphagia, and GI bleeding) (retired in 2008) CMS
Medicare eligible Acute
Gastro esophageal Reflux Disease (GERD): Upper Endoscopy (referred or conducted) for Patients w/ At Least One Alarm Symptom (retired in 2008) CMS
Medicare eligible Acute
Gastro esophageal Reflux Disease (GERD): Biopsy for Barrett’s Esophagus (based on Upper Endoscopy report) (retired in 2008) CMS
Medicare eligible Acute
GERD Diagnosis: Barium Swallow Not Ordered (Inappropriate Use) (retired in 2008) CMS
Medicare eligible Acute
Asthma Assessment for Number of Daytime or Nocturnal Asthma Symptoms w/in 12 mos. CMS
Medicare eligible Preventive Asthma
University of California, Davis Center for Healthcare Policy and Research
110
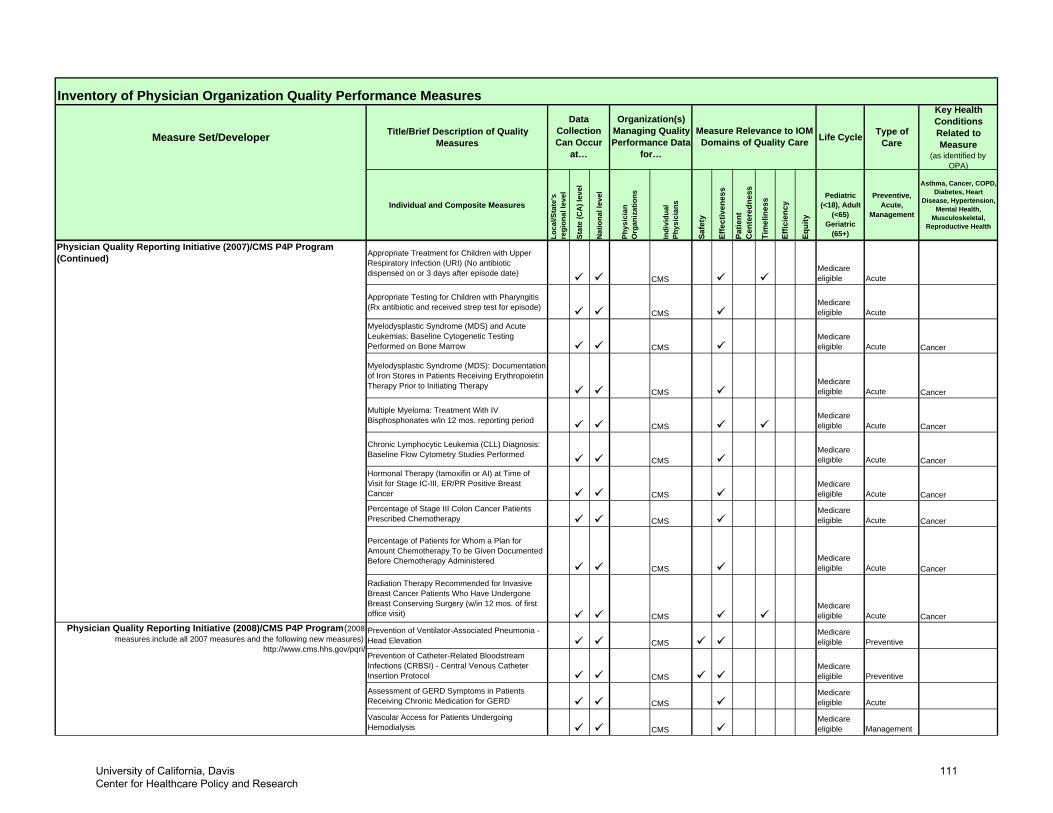
Inventory of Physician Organization Quality Performance Measures
Measure Set/Developer Title/Brief Description of Quality Measures Life Cycle Type of
Care
Key Health Conditions Related to Measure
(as identified by OPA)
Individual and Composite Measures
Loca
l/Sta
te's
re
gion
al le
vel
Stat
e (C
A) l
evel
Nat
iona
l lev
el
Phys
icia
n O
rgan
izat
ions
Indi
vidu
al
Phys
icia
ns
Safe
ty
Effe
ctiv
enes
s
Patie
nt
Cen
tere
dnes
s
Tim
elin
ess
Effic
ienc
y
Equi
ty
Pediatric (<18), Adult
(<65) Geriatric
(65+)
Preventive, Acute,
Management
Asthma, Cancer, COPD, Diabetes, Heart
Disease, Hypertension, Mental Health,
Musculoskeletal, Reproductive Health
Measure Relevance to IOM Domains of Quality Care
Organization(s) Managing Quality Performance Data
for…
Data Collection Can Occur
at…
Physician Quality Reporting Initiative (2007)/CMS P4P Program (Continued) Appropriate Treatment for Children with Upper
Respiratory Infection (URI) (No antibiotic dispensed on or 3 days after episode date)
CMSMedicare eligible Acute
Appropriate Testing for Children with Pharyngitis (Rx antibiotic and received strep test for episode)
CMSMedicare eligible Acute
Myelodysplastic Syndrome (MDS) and Acute Leukemias: Baseline Cytogenetic Testing Performed on Bone Marrow CMS
Medicare eligible Acute Cancer
Myelodysplastic Syndrome (MDS): Documentation of Iron Stores in Patients Receiving Erythropoietin Therapy Prior to Initiating Therapy
CMSMedicare eligible Acute Cancer
Multiple Myeloma: Treatment With IV Bisphosphonates w/in 12 mos. reporting period
CMSMedicare eligible Acute Cancer
Chronic Lymphocytic Leukemia (CLL) Diagnosis: Baseline Flow Cytometry Studies Performed
CMSMedicare eligible Acute Cancer
Hormonal Therapy (tamoxifin or AI) at Time of Visit for Stage IC-III, ER/PR Positive Breast Cancer CMS
Medicare eligible Acute Cancer
Percentage of Stage III Colon Cancer Patients Prescribed Chemotherapy CMS
Medicare eligible Acute Cancer
Percentage of Patients for Whom a Plan for Amount Chemotherapy To be Given Documented Before Chemotherapy Administered
CMSMedicare eligible Acute Cancer
Radiation Therapy Recommended for Invasive Breast Cancer Patients Who Have Undergone Breast Conserving Surgery (w/in 12 mos. of first office visit) CMS
Medicare eligible Acute Cancer
Prevention of Ventilator-Associated Pneumonia - Head Elevation CMS
Medicare eligible Preventive
Prevention of Catheter-Related Bloodstream Infections (CRBSI) - Central Venous Catheter Insertion Protocol CMS
Medicare eligible Preventive
Assessment of GERD Symptoms in Patients Receiving Chronic Medication for GERD CMS
Medicare eligible Acute
Vascular Access for Patients Undergoing Hemodialysis CMS
Medicare eligible Management
Physician Quality Reporting Initiative (2008)/CMS P4P Program (2008 measures include all 2007 measures and the following new measures)
http://www.cms.hhs.gov/pqri/
University of California, Davis Center for Healthcare Policy and Research
111
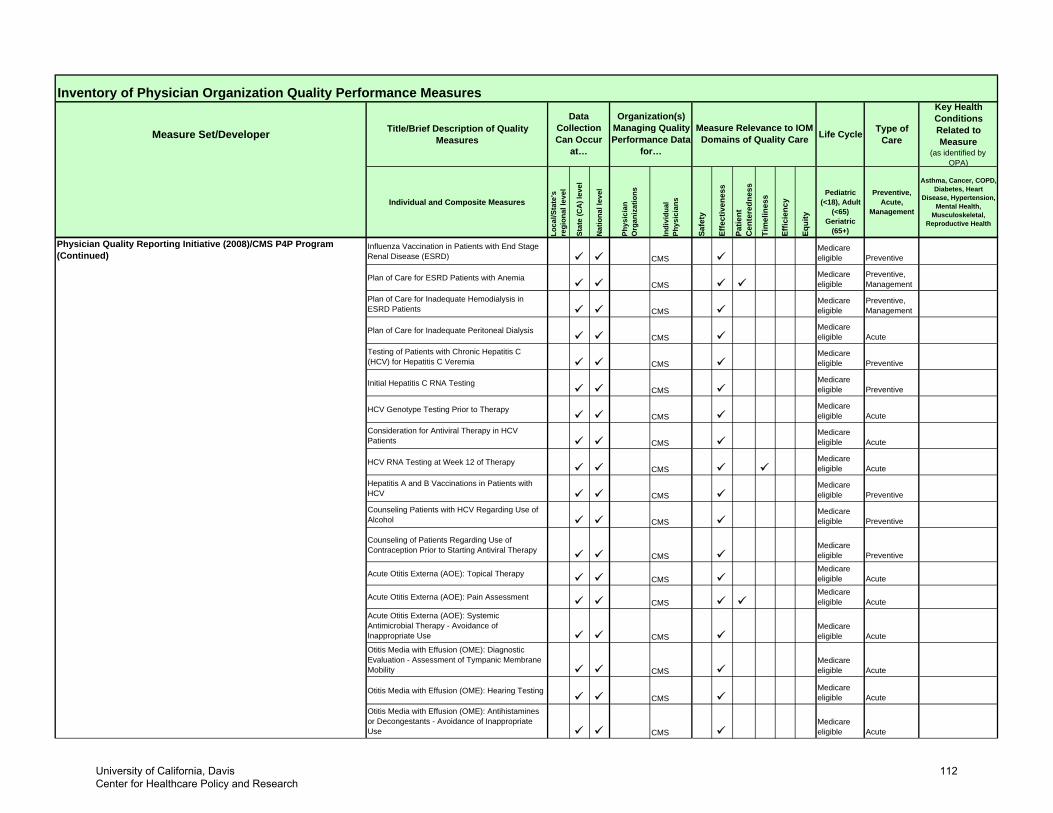
Inventory of Physician Organization Quality Performance Measures
Measure Set/Developer Title/Brief Description of Quality Measures Life Cycle Type of
Care
Key Health Conditions Related to Measure
(as identified by OPA)
Individual and Composite Measures
Loca
l/Sta
te's
re
gion
al le
vel
Stat
e (C
A) l
evel
Nat
iona
l lev
el
Phys
icia
n O
rgan
izat
ions
Indi
vidu
al
Phys
icia
ns
Safe
ty
Effe
ctiv
enes
s
Patie
nt
Cen
tere
dnes
s
Tim
elin
ess
Effic
ienc
y
Equi
ty
Pediatric (<18), Adult
(<65) Geriatric
(65+)
Preventive, Acute,
Management
Asthma, Cancer, COPD, Diabetes, Heart
Disease, Hypertension, Mental Health,
Musculoskeletal, Reproductive Health
Measure Relevance to IOM Domains of Quality Care
Organization(s) Managing Quality Performance Data
for…
Data Collection Can Occur
at…
Physician Quality Reporting Initiative (2008)/CMS P4P Program (Continued)
Influenza Vaccination in Patients with End Stage Renal Disease (ESRD) CMS
Medicare eligible Preventive
Plan of Care for ESRD Patients with AnemiaCMS
Medicare eligible
Preventive,Management
Plan of Care for Inadequate Hemodialysis in ESRD Patients CMS
Medicare eligible
Preventive,Management
Plan of Care for Inadequate Peritoneal DialysisCMS
Medicare eligible Acute
Testing of Patients with Chronic Hepatitis C (HCV) for Hepatitis C Veremia CMS
Medicare eligible Preventive
Initial Hepatitis C RNA TestingCMS
Medicare eligible Preventive
HCV Genotype Testing Prior to TherapyCMS
Medicare eligible Acute
Consideration for Antiviral Therapy in HCV Patients CMS
Medicare eligible Acute
HCV RNA Testing at Week 12 of Therapy CMS
Medicare eligible Acute
Hepatitis A and B Vaccinations in Patients with HCV CMS
Medicare eligible Preventive
Counseling Patients with HCV Regarding Use of Alcohol CMS
Medicare eligible Preventive
Counseling of Patients Regarding Use of Contraception Prior to Starting Antiviral Therapy
CMSMedicare eligible Preventive
Acute Otitis Externa (AOE): Topical TherapyCMS
Medicare eligible Acute
Acute Otitis Externa (AOE): Pain AssessmentCMS
Medicare eligible Acute
Acute Otitis Externa (AOE): Systemic Antimicrobial Therapy - Avoidance of Inappropriate Use CMS
Medicare eligible Acute
Otitis Media with Effusion (OME): Diagnostic Evaluation - Assessment of Tympanic Membrane Mobility CMS
Medicare eligible Acute
Otitis Media with Effusion (OME): Hearing TestingCMS
Medicare eligible Acute
Otitis Media with Effusion (OME): Antihistamines or Decongestants - Avoidance of Inappropriate Use CMS
Medicare eligible Acute
University of California, Davis Center for Healthcare Policy and Research
112
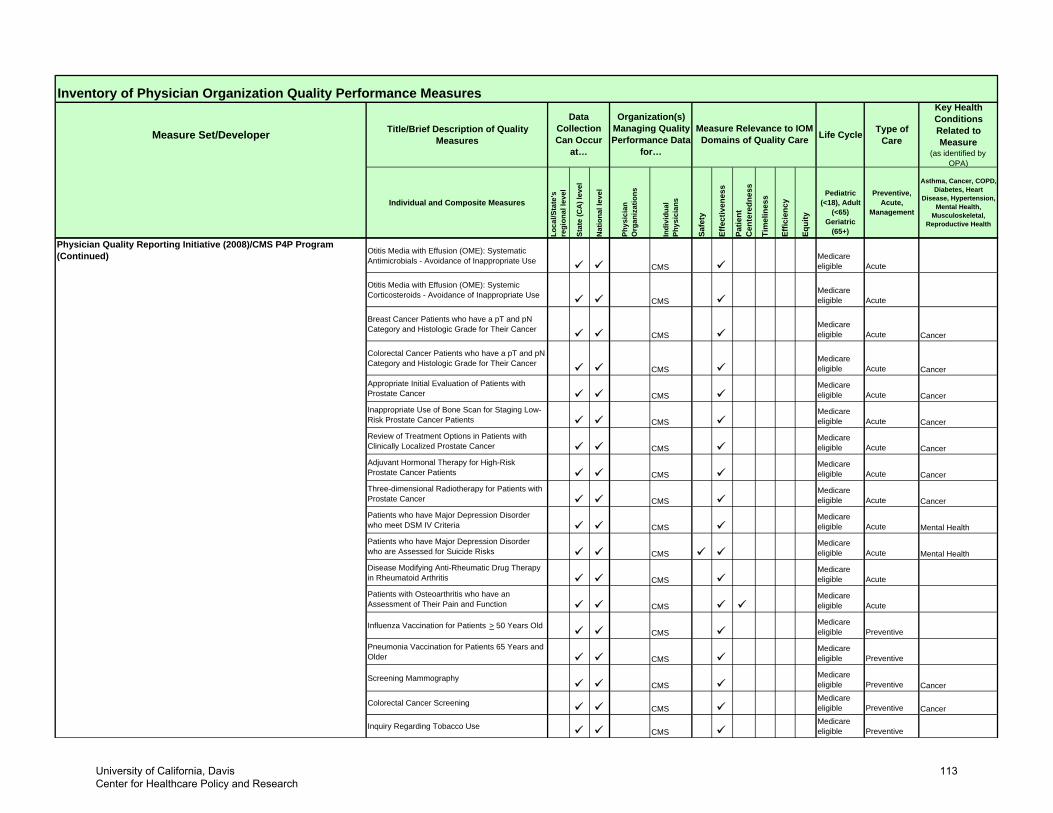
Inventory of Physician Organization Quality Performance Measures
Measure Set/Developer Title/Brief Description of Quality Measures Life Cycle Type of
Care
Key Health Conditions Related to Measure
(as identified by OPA)
Individual and Composite Measures
Loca
l/Sta
te's
re
gion
al le
vel
Stat
e (C
A) l
evel
Nat
iona
l lev
el
Phys
icia
n O
rgan
izat
ions
Indi
vidu
al
Phys
icia
ns
Safe
ty
Effe
ctiv
enes
s
Patie
nt
Cen
tere
dnes
s
Tim
elin
ess
Effic
ienc
y
Equi
ty
Pediatric (<18), Adult
(<65) Geriatric
(65+)
Preventive, Acute,
Management
Asthma, Cancer, COPD, Diabetes, Heart
Disease, Hypertension, Mental Health,
Musculoskeletal, Reproductive Health
Measure Relevance to IOM Domains of Quality Care
Organization(s) Managing Quality Performance Data
for…
Data Collection Can Occur
at…
Physician Quality Reporting Initiative (2008)/CMS P4P Program (Continued) Otitis Media with Effusion (OME): Systematic
Antimicrobials - Avoidance of Inappropriate UseCMS
Medicare eligible Acute
Otitis Media with Effusion (OME): Systemic Corticosteroids - Avoidance of Inappropriate Use
CMSMedicare eligible Acute
Breast Cancer Patients who have a pT and pN Category and Histologic Grade for Their Cancer
CMSMedicare eligible Acute Cancer
Colorectal Cancer Patients who have a pT and pN Category and Histologic Grade for Their Cancer
CMSMedicare eligible Acute Cancer
Appropriate Initial Evaluation of Patients with Prostate Cancer CMS
Medicare eligible Acute Cancer
Inappropriate Use of Bone Scan for Staging Low-Risk Prostate Cancer Patients CMS
Medicare eligible Acute Cancer
Review of Treatment Options in Patients with Clinically Localized Prostate Cancer CMS
Medicare eligible Acute Cancer
Adjuvant Hormonal Therapy for High-Risk Prostate Cancer Patients CMS
Medicare eligible Acute Cancer
Three-dimensional Radiotherapy for Patients with Prostate Cancer CMS
Medicare eligible Acute Cancer
Patients who have Major Depression Disorder who meet DSM IV Criteria CMS
Medicare eligible Acute Mental Health
Patients who have Major Depression Disorder who are Assessed for Suicide Risks CMS
Medicare eligible Acute Mental Health
Disease Modifying Anti-Rheumatic Drug Therapy in Rheumatoid Arthritis CMS
Medicare eligible Acute
Patients with Osteoarthritis who have an Assessment of Their Pain and Function CMS
Medicare eligible Acute
Influenza Vaccination for Patients > 50 Years OldCMS
Medicare eligible Preventive
Pneumonia Vaccination for Patients 65 Years and Older CMS
Medicare eligible Preventive
Screening MammographyCMS
Medicare eligible Preventive Cancer
Colorectal Cancer ScreeningCMS
Medicare eligible Preventive Cancer
Inquiry Regarding Tobacco UseCMS
Medicare eligible Preventive
University of California, Davis Center for Healthcare Policy and Research
113
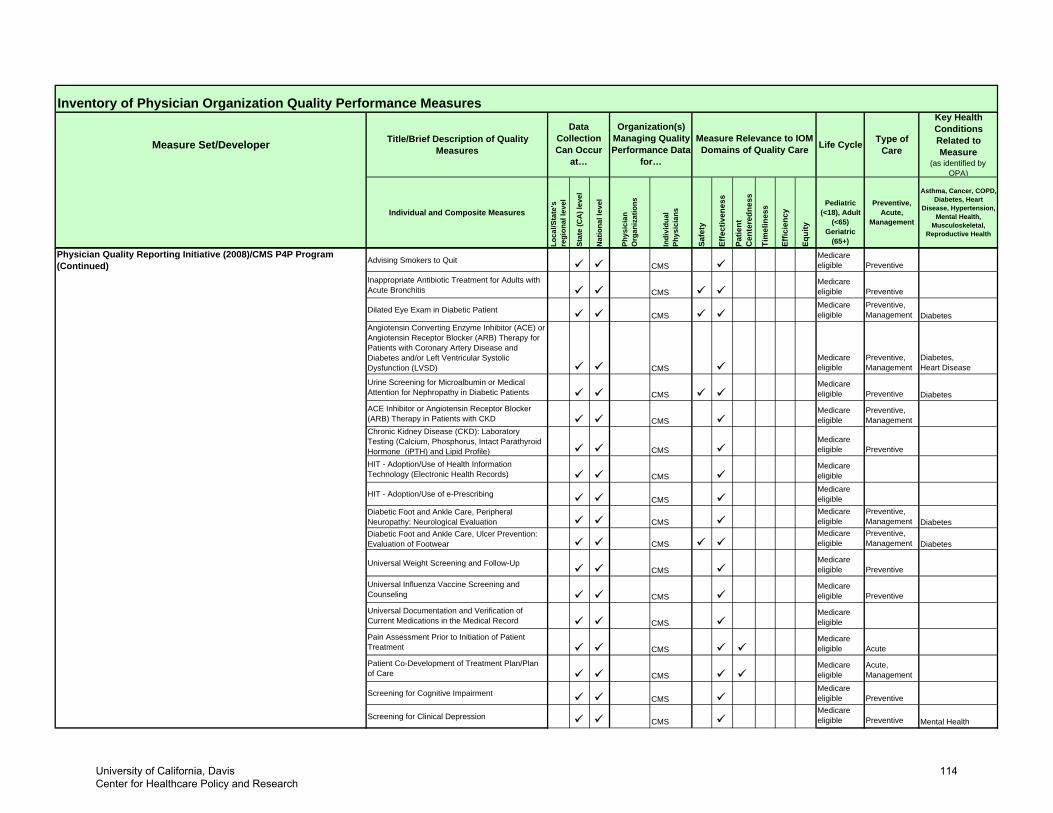
Inventory of Physician Organization Quality Performance Measures
Measure Set/Developer Title/Brief Description of Quality Measures Life Cycle Type of
Care
Key Health Conditions Related to Measure
(as identified by OPA)
Individual and Composite Measures
Loca
l/Sta
te's
re
gion
al le
vel
Stat
e (C
A) l
evel
Nat
iona
l lev
el
Phys
icia
n O
rgan
izat
ions
Indi
vidu
al
Phys
icia
ns
Safe
ty
Effe
ctiv
enes
s
Patie
nt
Cen
tere
dnes
s
Tim
elin
ess
Effic
ienc
y
Equi
ty
Pediatric (<18), Adult
(<65) Geriatric
(65+)
Preventive, Acute,
Management
Asthma, Cancer, COPD, Diabetes, Heart
Disease, Hypertension, Mental Health,
Musculoskeletal, Reproductive Health
Measure Relevance to IOM Domains of Quality Care
Organization(s) Managing Quality Performance Data
for…
Data Collection Can Occur
at…
Advising Smokers to QuitCMS
Medicare eligible Preventive
Inappropriate Antibiotic Treatment for Adults with Acute Bronchitis CMS
Medicare eligible Preventive
Dilated Eye Exam in Diabetic PatientCMS
Medicare eligible
Preventive,Management Diabetes
Angiotensin Converting Enzyme Inhibitor (ACE) or Angiotensin Receptor Blocker (ARB) Therapy for Patients with Coronary Artery Disease and Diabetes and/or Left Ventricular Systolic Dysfunction (LVSD) CMS
Medicare eligible
Preventive,Management
Diabetes,Heart Disease
Urine Screening for Microalbumin or Medical Attention for Nephropathy in Diabetic Patients CMS
Medicare eligible Preventive Diabetes
ACE Inhibitor or Angiotensin Receptor Blocker (ARB) Therapy in Patients with CKD CMS
Medicare eligible
Preventive,Management
Chronic Kidney Disease (CKD): Laboratory Testing (Calcium, Phosphorus, Intact Parathyroid Hormone (iPTH) and Lipid Profile) CMS
Medicare eligible Preventive
HIT - Adoption/Use of Health Information Technology (Electronic Health Records) CMS
Medicare eligible
HIT - Adoption/Use of e-PrescribingCMS
Medicare eligible
Diabetic Foot and Ankle Care, Peripheral Neuropathy: Neurological Evaluation CMS
Medicare eligible
Preventive,Management Diabetes
Diabetic Foot and Ankle Care, Ulcer Prevention: Evaluation of Footwear CMS
Medicare eligible
Preventive,Management Diabetes
Universal Weight Screening and Follow-UpCMS
Medicare eligible Preventive
Universal Influenza Vaccine Screening and Counseling CMS
Medicare eligible Preventive
Universal Documentation and Verification of Current Medications in the Medical Record CMS
Medicare eligible
Pain Assessment Prior to Initiation of Patient Treatment CMS
Medicare eligible Acute
Patient Co-Development of Treatment Plan/Plan of Care CMS
Medicare eligible
Acute,Management
Screening for Cognitive ImpairmentCMS
Medicare eligible Preventive
Screening for Clinical Depression CMSMedicare eligible Preventive Mental Health
Physician Quality Reporting Initiative (2008)/CMS P4P Program (Continued)
University of California, Davis Center for Healthcare Policy and Research
114
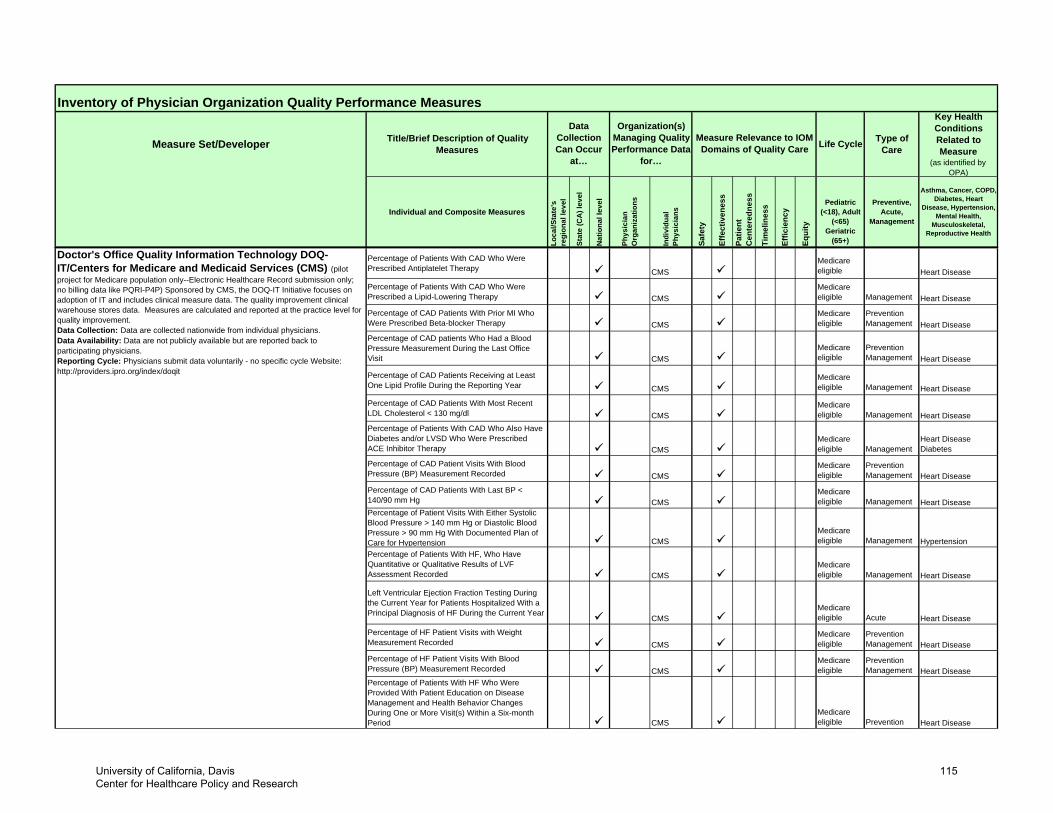
Inventory of Physician Organization Quality Performance Measures
Measure Set/Developer Title/Brief Description of Quality Measures Life Cycle Type of
Care
Key Health Conditions Related to Measure
(as identified by OPA)
Individual and Composite Measures
Loca
l/Sta
te's
re
gion
al le
vel
Stat
e (C
A) l
evel
Nat
iona
l lev
el
Phys
icia
n O
rgan
izat
ions
Indi
vidu
al
Phys
icia
ns
Safe
ty
Effe
ctiv
enes
s
Patie
nt
Cen
tere
dnes
s
Tim
elin
ess
Effic
ienc
y
Equi
ty
Pediatric (<18), Adult
(<65) Geriatric
(65+)
Preventive, Acute,
Management
Asthma, Cancer, COPD, Diabetes, Heart
Disease, Hypertension, Mental Health,
Musculoskeletal, Reproductive Health
Measure Relevance to IOM Domains of Quality Care
Organization(s) Managing Quality Performance Data
for…
Data Collection Can Occur
at…
Percentage of Patients With CAD Who Were Prescribed Antiplatelet Therapy CMS
Medicare eligible Heart Disease
Percentage of Patients With CAD Who Were Prescribed a Lipid-Lowering Therapy CMS
Medicare eligible Management Heart Disease
Percentage of CAD Patients With Prior MI Who Were Prescribed Beta-blocker Therapy CMS
Medicare eligible
Prevention Management Heart Disease
Percentage of CAD patients Who Had a Blood Pressure Measurement During the Last Office Visit CMS
Medicare eligible
Prevention Management Heart Disease
Percentage of CAD Patients Receiving at Least One Lipid Profile During the Reporting Year CMS
Medicare eligible Management Heart Disease
Percentage of CAD Patients With Most Recent LDL Cholesterol < 130 mg/dl CMS
Medicare eligible Management Heart Disease
Percentage of Patients With CAD Who Also Have Diabetes and/or LVSD Who Were Prescribed ACE Inhibitor Therapy CMS
Medicare eligible Management
Heart Disease Diabetes
Percentage of CAD Patient Visits With Blood Pressure (BP) Measurement Recorded CMS
Medicare eligible
Prevention Management Heart Disease
Percentage of CAD Patients With Last BP < 140/90 mm Hg CMS
Medicare eligible Management Heart Disease
Percentage of Patient Visits With Either Systolic Blood Pressure > 140 mm Hg or Diastolic Blood Pressure > 90 mm Hg With Documented Plan of Care for Hypertension CMS
Medicare eligible Management Hypertension
Percentage of Patients With HF, Who Have Quantitative or Qualitative Results of LVF Assessment Recorded CMS
Medicare eligible Management Heart Disease
Left Ventricular Ejection Fraction Testing During the Current Year for Patients Hospitalized With a Principal Diagnosis of HF During the Current Year
CMSMedicare eligible Acute Heart Disease
Percentage of HF Patient Visits with Weight Measurement Recorded CMS
Medicare eligible
Prevention Management Heart Disease
Percentage of HF Patient Visits With Blood Pressure (BP) Measurement Recorded CMS
Medicare eligible
Prevention Management Heart Disease
Percentage of Patients With HF Who Were Provided With Patient Education on Disease Management and Health Behavior Changes During One or More Visit(s) Within a Six-month Period CMS
Medicare eligible Prevention Heart Disease
Doctor's Office Quality Information Technology DOQ-IT/Centers for Medicare and Medicaid Services (CMS) (pilot project for Medicare population only--Electronic Healthcare Record submission only; no billing data like PQRI-P4P) Sponsored by CMS, the DOQ-IT Initiative focuses on adoption of IT and includes clinical measure data. The quality improvement clinical warehouse stores data. Measures are calculated and reported at the practice level for quality improvement.Data Collection: Data are collected nationwide from individual physicians. Data Availability: Data are not publicly available but are reported back to participating physicians.Reporting Cycle: Physicians submit data voluntarily - no specific cycle Website: http://providers.ipro.org/index/doqit
University of California, Davis Center for Healthcare Policy and Research
115
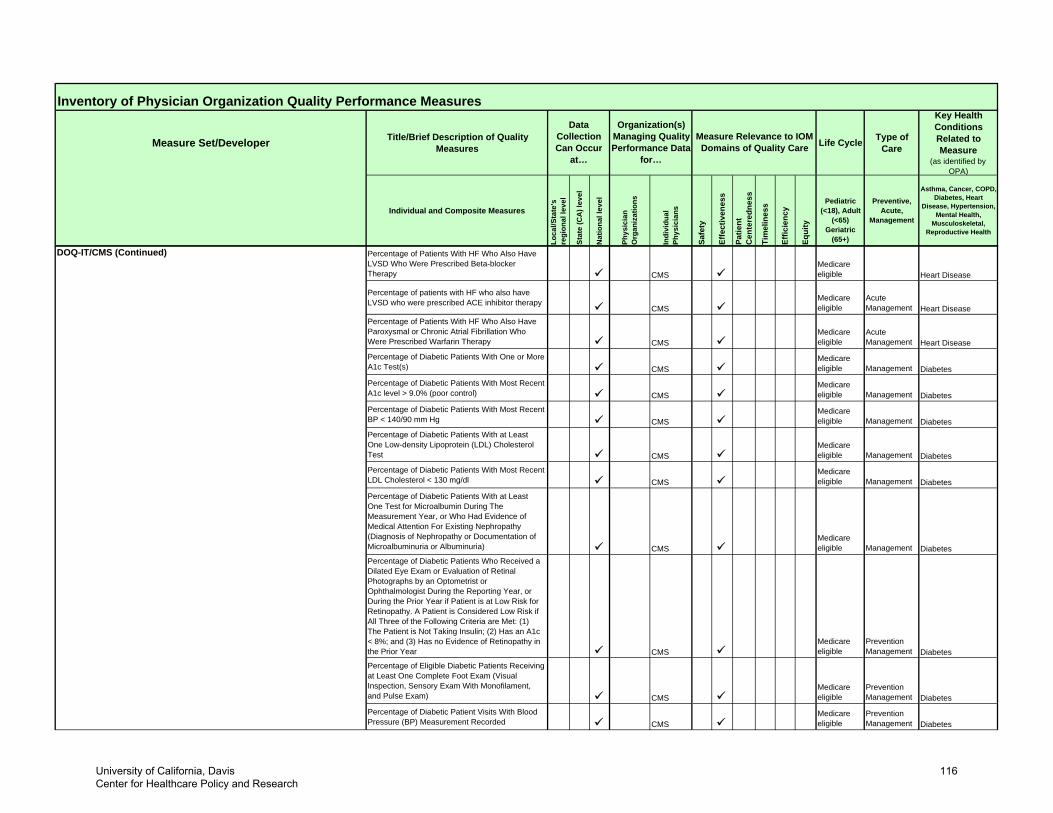
Inventory of Physician Organization Quality Performance Measures
Measure Set/Developer Title/Brief Description of Quality Measures Life Cycle Type of
Care
Key Health Conditions Related to Measure
(as identified by OPA)
Individual and Composite Measures
Loca
l/Sta
te's
re
gion
al le
vel
Stat
e (C
A) l
evel
Nat
iona
l lev
el
Phys
icia
n O
rgan
izat
ions
Indi
vidu
al
Phys
icia
ns
Safe
ty
Effe
ctiv
enes
s
Patie
nt
Cen
tere
dnes
s
Tim
elin
ess
Effic
ienc
y
Equi
ty
Pediatric (<18), Adult
(<65) Geriatric
(65+)
Preventive, Acute,
Management
Asthma, Cancer, COPD, Diabetes, Heart
Disease, Hypertension, Mental Health,
Musculoskeletal, Reproductive Health
Measure Relevance to IOM Domains of Quality Care
Organization(s) Managing Quality Performance Data
for…
Data Collection Can Occur
at…
DOQ-IT/CMS (Continued) Percentage of Patients With HF Who Also Have LVSD Who Were Prescribed Beta-blocker Therapy CMS
Medicare eligible Heart Disease
Percentage of patients with HF who also have LVSD who were prescribed ACE inhibitor therapy
CMSMedicare eligible
Acute Management Heart Disease
Percentage of Patients With HF Who Also Have Paroxysmal or Chronic Atrial Fibrillation Who Were Prescribed Warfarin Therapy CMS
Medicare eligible
Acute Management Heart Disease
Percentage of Diabetic Patients With One or More A1c Test(s) CMS
Medicare eligible Management Diabetes
Percentage of Diabetic Patients With Most Recent A1c level > 9.0% (poor control) CMS
Medicare eligible Management Diabetes
Percentage of Diabetic Patients With Most Recent BP < 140/90 mm Hg CMS
Medicare eligible Management Diabetes
Percentage of Diabetic Patients With at Least One Low-density Lipoprotein (LDL) Cholesterol Test CMS
Medicare eligible Management Diabetes
Percentage of Diabetic Patients With Most Recent LDL Cholesterol < 130 mg/dl CMS
Medicare eligible Management Diabetes
Percentage of Diabetic Patients With at Least One Test for Microalbumin During The Measurement Year, or Who Had Evidence of Medical Attention For Existing Nephropathy (Diagnosis of Nephropathy or Documentation of Microalbuminuria or Albuminuria) CMS
Medicare eligible Management Diabetes
Percentage of Diabetic Patients Who Received a Dilated Eye Exam or Evaluation of Retinal Photographs by an Optometrist or Ophthalmologist During the Reporting Year, or During the Prior Year if Patient is at Low Risk for Retinopathy. A Patient is Considered Low Risk if All Three of the Following Criteria are Met: (1) The Patient is Not Taking Insulin; (2) Has an A1c < 8%; and (3) Has no Evidence of Retinopathy in the Prior Year CMS
Medicare eligible
Prevention Management Diabetes
Percentage of Eligible Diabetic Patients Receiving at Least One Complete Foot Exam (Visual Inspection, Sensory Exam With Monofilament, and Pulse Exam) CMS
Medicare eligible
Prevention Management Diabetes
Percentage of Diabetic Patient Visits With Blood Pressure (BP) Measurement Recorded CMS
Medicare eligible
Prevention Management Diabetes
University of California, Davis Center for Healthcare Policy and Research
116
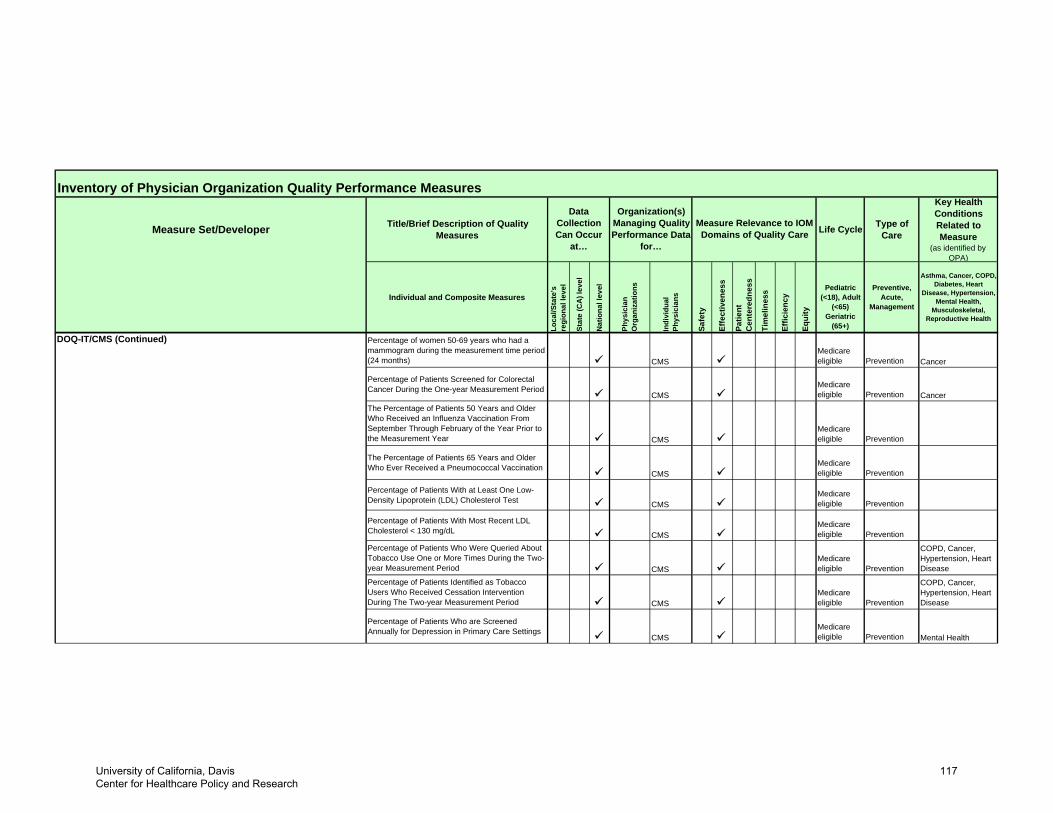
Inventory of Physician Organization Quality Performance Measures
Measure Set/Developer Title/Brief Description of Quality Measures Life Cycle Type of
Care
Key Health Conditions Related to Measure
(as identified by OPA)
Individual and Composite Measures
Loca
l/Sta
te's
re
gion
al le
vel
Stat
e (C
A) l
evel
Nat
iona
l lev
el
Phys
icia
n O
rgan
izat
ions
Indi
vidu
al
Phys
icia
ns
Safe
ty
Effe
ctiv
enes
s
Patie
nt
Cen
tere
dnes
s
Tim
elin
ess
Effic
ienc
y
Equi
ty
Pediatric (<18), Adult
(<65) Geriatric
(65+)
Preventive, Acute,
Management
Asthma, Cancer, COPD, Diabetes, Heart
Disease, Hypertension, Mental Health,
Musculoskeletal, Reproductive Health
Measure Relevance to IOM Domains of Quality Care
Organization(s) Managing Quality Performance Data
for…
Data Collection Can Occur
at…
DOQ-IT/CMS (Continued) Percentage of women 50-69 years who had a mammogram during the measurement time period (24 months) CMS
Medicare eligible Prevention Cancer
Percentage of Patients Screened for Colorectal Cancer During the One-year Measurement Period
CMSMedicare eligible Prevention Cancer
The Percentage of Patients 50 Years and Older Who Received an Influenza Vaccination From September Through February of the Year Prior to the Measurement Year CMS
Medicare eligible Prevention
The Percentage of Patients 65 Years and Older Who Ever Received a Pneumococcal Vaccination
CMSMedicare eligible Prevention
Percentage of Patients With at Least One Low-Density Lipoprotein (LDL) Cholesterol Test CMS
Medicare eligible Prevention
Percentage of Patients With Most Recent LDL Cholesterol < 130 mg/dL CMS
Medicare eligible Prevention
Percentage of Patients Who Were Queried About Tobacco Use One or More Times During the Two-year Measurement Period CMS
Medicare eligible Prevention
COPD, Cancer, Hypertension, Heart Disease
Percentage of Patients Identified as Tobacco Users Who Received Cessation Intervention During The Two-year Measurement Period CMS
Medicare eligible Prevention
COPD, Cancer, Hypertension, Heart Disease
Percentage of Patients Who are Screened Annually for Depression in Primary Care Settings
CMSMedicare eligible Prevention Mental Health
University of California, Davis Center for Healthcare Policy and Research
117
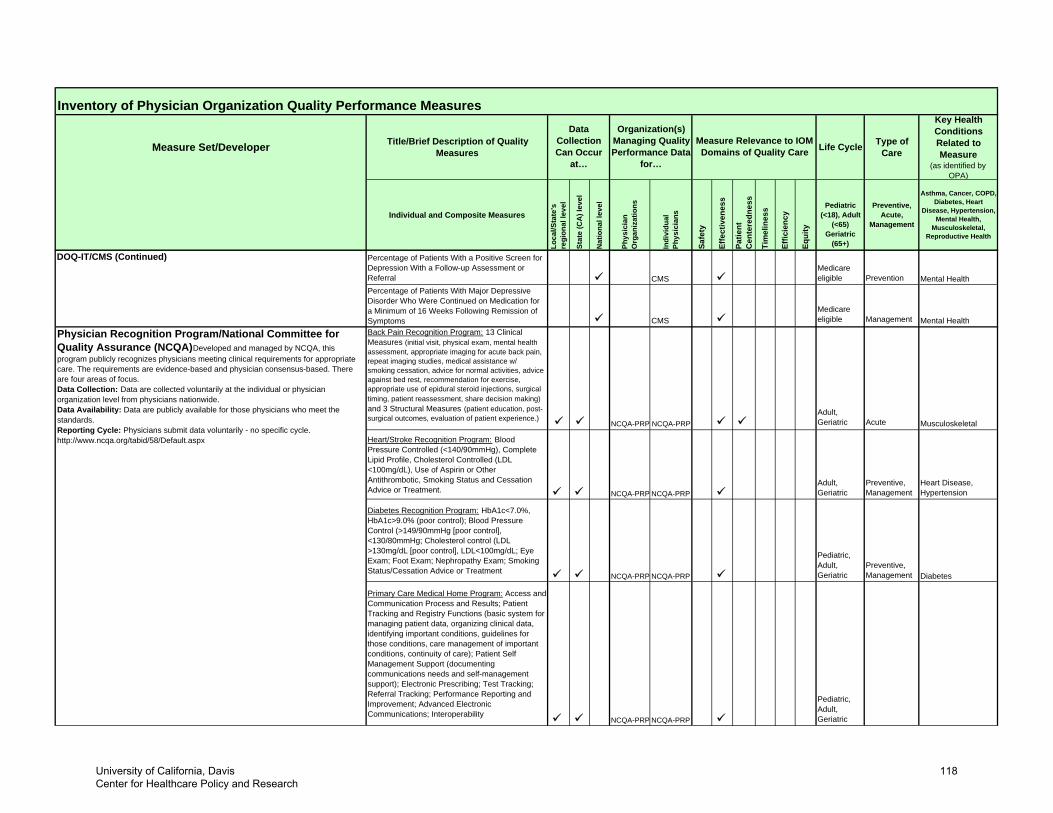
Inventory of Physician Organization Quality Performance Measures
Measure Set/Developer Title/Brief Description of Quality Measures Life Cycle Type of
Care
Key Health Conditions Related to Measure
(as identified by OPA)
Individual and Composite Measures
Loca
l/Sta
te's
re
gion
al le
vel
Stat
e (C
A) l
evel
Nat
iona
l lev
el
Phys
icia
n O
rgan
izat
ions
Indi
vidu
al
Phys
icia
ns
Safe
ty
Effe
ctiv
enes
s
Patie
nt
Cen
tere
dnes
s
Tim
elin
ess
Effic
ienc
y
Equi
ty
Pediatric (<18), Adult
(<65) Geriatric
(65+)
Preventive, Acute,
Management
Asthma, Cancer, COPD, Diabetes, Heart
Disease, Hypertension, Mental Health,
Musculoskeletal, Reproductive Health
Measure Relevance to IOM Domains of Quality Care
Organization(s) Managing Quality Performance Data
for…
Data Collection Can Occur
at…
DOQ-IT/CMS (Continued) Percentage of Patients With a Positive Screen for Depression With a Follow-up Assessment or Referral CMS
Medicare eligible Prevention Mental Health
Percentage of Patients With Major Depressive Disorder Who Were Continued on Medication for a Minimum of 16 Weeks Following Remission of Symptoms CMS
Medicare eligible Management Mental Health
Back Pain Recognition Program: 13 Clinical Measures (initial visit, physical exam, mental health assessment, appropriate imaging for acute back pain, repeat imaging studies, medical assistance w/ smoking cessation, advice for normal activities, advice against bed rest, recommendation for exercise, appropriate use of epidural steroid injections, surgical timing, patient reassessment, share decision making) and 3 Structural Measures (patient education, post-surgical outcomes, evaluation of patient experience.)
NCQA-PRP NCQA-PRPAdult, Geriatric Acute Musculoskeletal
Heart/Stroke Recognition Program: Blood Pressure Controlled (<140/90mmHg), Complete Lipid Profile, Cholesterol Controlled (LDL <100mg/dL), Use of Aspirin or Other Antithrombotic, Smoking Status and Cessation Advice or Treatment. NCQA-PRP NCQA-PRP
Adult, Geriatric
Preventive, Management
Heart Disease, Hypertension
Diabetes Recognition Program: HbA1c<7.0%, HbA1c>9.0% (poor control); Blood Pressure Control (>149/90mmHg [poor control], <130/80mmHg; Cholesterol control (LDL >130mg/dL [poor control], LDL<100mg/dL; Eye Exam; Foot Exam; Nephropathy Exam; Smoking Status/Cessation Advice or Treatment
NCQA-PRP NCQA-PRP
Pediatric, Adult, Geriatric
Preventive, Management Diabetes
Primary Care Medical Home Program: Access and Communication Process and Results; Patient Tracking and Registry Functions (basic system for managing patient data, organizing clinical data, identifying important conditions, guidelines for those conditions, care management of important conditions, continuity of care); Patient Self Management Support (documenting communications needs and self-management support); Electronic Prescribing; Test Tracking; Referral Tracking; Performance Reporting and Improvement; Advanced Electronic Communications; Interoperability
NCQA-PRP NCQA-PRP
Pediatric, Adult, Geriatric
Physician Recognition Program/National Committee for Quality Assurance (NCQA) Developed and managed by NCQA, this program publicly recognizes physicians meeting clinical requirements for appropriate care. The requirements are evidence-based and physician consensus-based. There are four areas of focus. Data Collection: Data are collected voluntarily at the individual or physician organization level from physicians nationwide.Data Availability: Data are publicly available for those physicians who meet the standards. Reporting Cycle: Physicians submit data voluntarily - no specific cycle. http://www.ncqa.org/tabid/58/Default.aspx
University of California, Davis Center for Healthcare Policy and Research
118
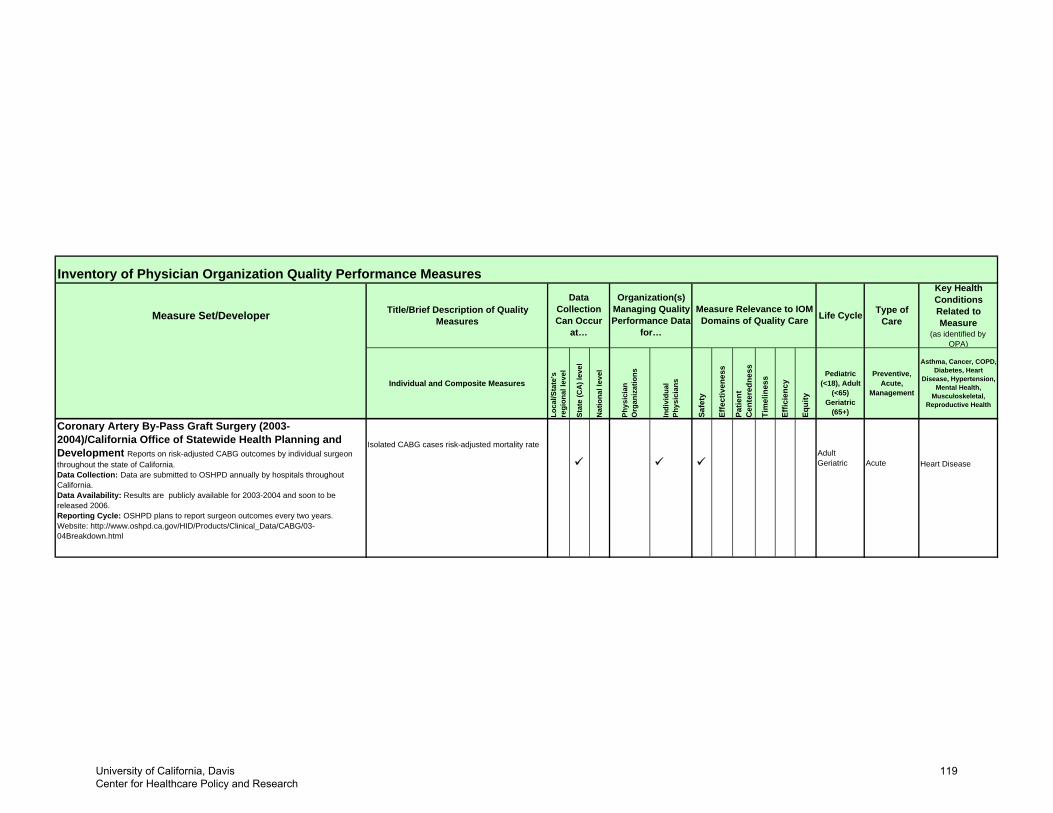
Inventory of Physician Organization Quality Performance Measures
Measure Set/Developer Title/Brief Description of Quality Measures Life Cycle Type of
Care
Key Health Conditions Related to Measure
(as identified by OPA)
Individual and Composite Measures
Loca
l/Sta
te's
re
gion
al le
vel
Stat
e (C
A) l
evel
Nat
iona
l lev
el
Phys
icia
n O
rgan
izat
ions
Indi
vidu
al
Phys
icia
ns
Safe
ty
Effe
ctiv
enes
s
Patie
nt
Cen
tere
dnes
s
Tim
elin
ess
Effic
ienc
y
Equi
ty
Pediatric (<18), Adult
(<65) Geriatric
(65+)
Preventive, Acute,
Management
Asthma, Cancer, COPD, Diabetes, Heart
Disease, Hypertension, Mental Health,
Musculoskeletal, Reproductive Health
Measure Relevance to IOM Domains of Quality Care
Organization(s) Managing Quality Performance Data
for…
Data Collection Can Occur
at…
Isolated CABG cases risk-adjusted mortality rateAdult Geriatric Acute Heart Disease
Coronary Artery By-Pass Graft Surgery (2003-2004)/California Office of Statewide Health Planning and Development Reports on risk-adjusted CABG outcomes by individual surgeon throughout the state of California. Data Collection: Data are submitted to OSHPD annually by hospitals throughout California.Data Availability: Results are publicly available for 2003-2004 and soon to be released 2006.Reporting Cycle: OSHPD plans to report surgeon outcomes every two years. Website: http://www.oshpd.ca.gov/HID/Products/Clinical_Data/CABG/03-04Breakdown.html
University of California, Davis Center for Healthcare Policy and Research
119
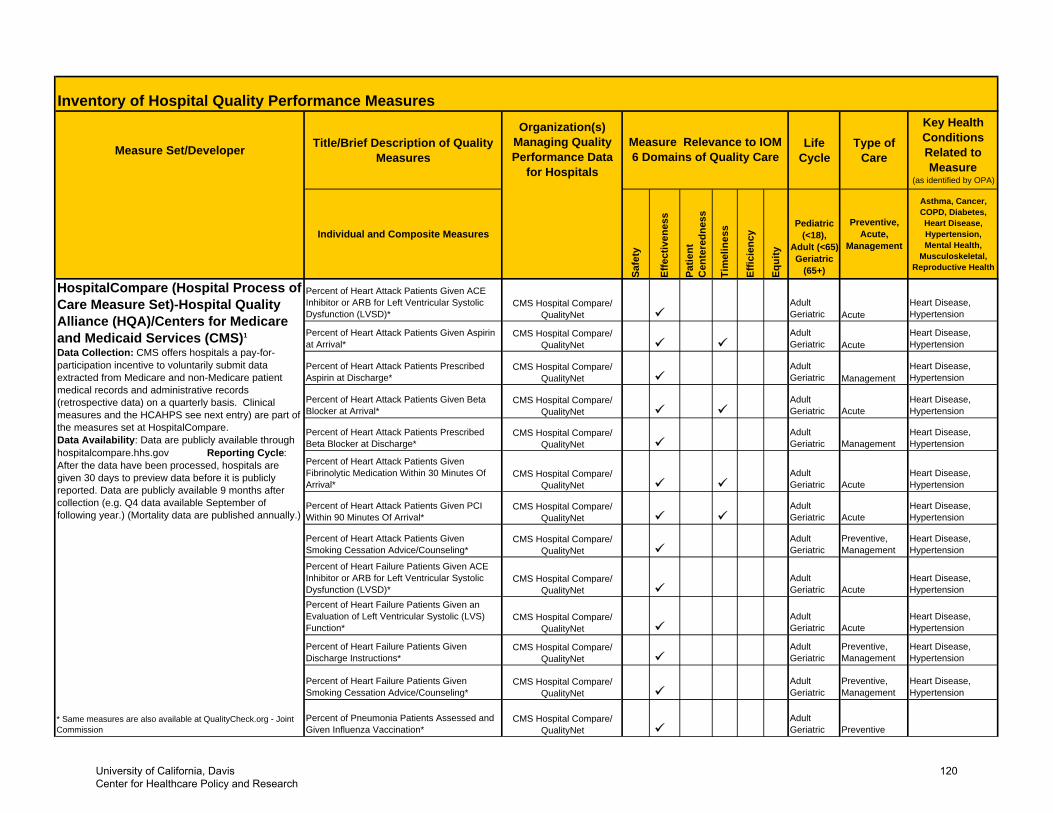
Inventory of Hospital Quality Performance Measures
Measure Set/Developer Title/Brief Description of Quality Measures
Life Cycle
Type of Care
Key Health Conditions Related to Measure
(as identified by OPA)
Individual and Composite Measures
Safe
ty
Effe
ctiv
enes
s
Patie
nt
Cen
tere
dnes
s
Tim
elin
ess
Effic
ienc
y
Equi
ty
Pediatric (<18),
Adult (<65) Geriatric
(65+)
Preventive, Acute,
Management
Asthma, Cancer, COPD, Diabetes, Heart Disease, Hypertension, Mental Health,
Musculoskeletal, Reproductive Health
Percent of Heart Attack Patients Given ACE Inhibitor or ARB for Left Ventricular Systolic Dysfunction (LVSD)*
Adult Geriatric Acute
Heart Disease, Hypertension
Percent of Heart Attack Patients Given Aspirin at Arrival*
Adult Geriatric Acute
Heart Disease, Hypertension
Percent of Heart Attack Patients Prescribed Aspirin at Discharge*
Adult Geriatric Management
Heart Disease, Hypertension
Percent of Heart Attack Patients Given Beta Blocker at Arrival*
Adult Geriatric Acute
Heart Disease, Hypertension
Percent of Heart Attack Patients Prescribed Beta Blocker at Discharge*
Adult Geriatric Management
Heart Disease, Hypertension
Percent of Heart Attack Patients Given Fibrinolytic Medication Within 30 Minutes Of Arrival*
Adult Geriatric Acute
Heart Disease, Hypertension
Percent of Heart Attack Patients Given PCI Within 90 Minutes Of Arrival*
Adult Geriatric Acute
Heart Disease, Hypertension
Percent of Heart Attack Patients Given Smoking Cessation Advice/Counseling*
Adult Geriatric
Preventive, Management
Heart Disease, Hypertension
Percent of Heart Failure Patients Given ACE Inhibitor or ARB for Left Ventricular Systolic Dysfunction (LVSD)*
Adult Geriatric Acute
Heart Disease, Hypertension
Percent of Heart Failure Patients Given an Evaluation of Left Ventricular Systolic (LVS) Function*
Adult Geriatric Acute
Heart Disease, Hypertension
Percent of Heart Failure Patients Given Discharge Instructions*
Adult Geriatric
Preventive, Management
Heart Disease, Hypertension
Percent of Heart Failure Patients Given Smoking Cessation Advice/Counseling*
Adult Geriatric
Preventive, Management
Heart Disease, Hypertension
* Same measures are also available at QualityCheck.org - Joint Commission
Percent of Pneumonia Patients Assessed and Given Influenza Vaccination*
Adult Geriatric Preventive
Measure Relevance to IOM 6 Domains of Quality Care
CMS Hospital Compare/ QualityNet
CMS Hospital Compare/ QualityNet
Organization(s) Managing Quality Performance Data
for Hospitals
CMS Hospital Compare/ QualityNet
HospitalCompare (Hospital Process of Care Measure Set)-Hospital Quality Alliance (HQA)/Centers for Medicare and Medicaid Services (CMS)1
Data Collection: CMS offers hospitals a pay-for-participation incentive to voluntarily submit data extracted from Medicare and non-Medicare patient medical records and administrative records (retrospective data) on a quarterly basis. Clinical measures and the HCAHPS see next entry) are part of the measures set at HospitalCompare. Data Availability: Data are publicly available through hospitalcompare.hhs.gov Reporting Cycle: After the data have been processed, hospitals are given 30 days to preview data before it is publicly reported. Data are publicly available 9 months after collection (e.g. Q4 data available September of following year.) (Mortality data are published annually.)
CMS Hospital Compare/ QualityNet
CMS Hospital Compare/ QualityNet
CMS Hospital Compare/ QualityNet
CMS Hospital Compare/ QualityNet
CMS Hospital Compare/ QualityNet
CMS Hospital Compare/ QualityNet
CMS Hospital Compare/ QualityNet
CMS Hospital Compare/ QualityNet
CMS Hospital Compare/ QualityNet
CMS Hospital Compare/ QualityNet
University of California, Davis Center for Healthcare Policy and Research
120
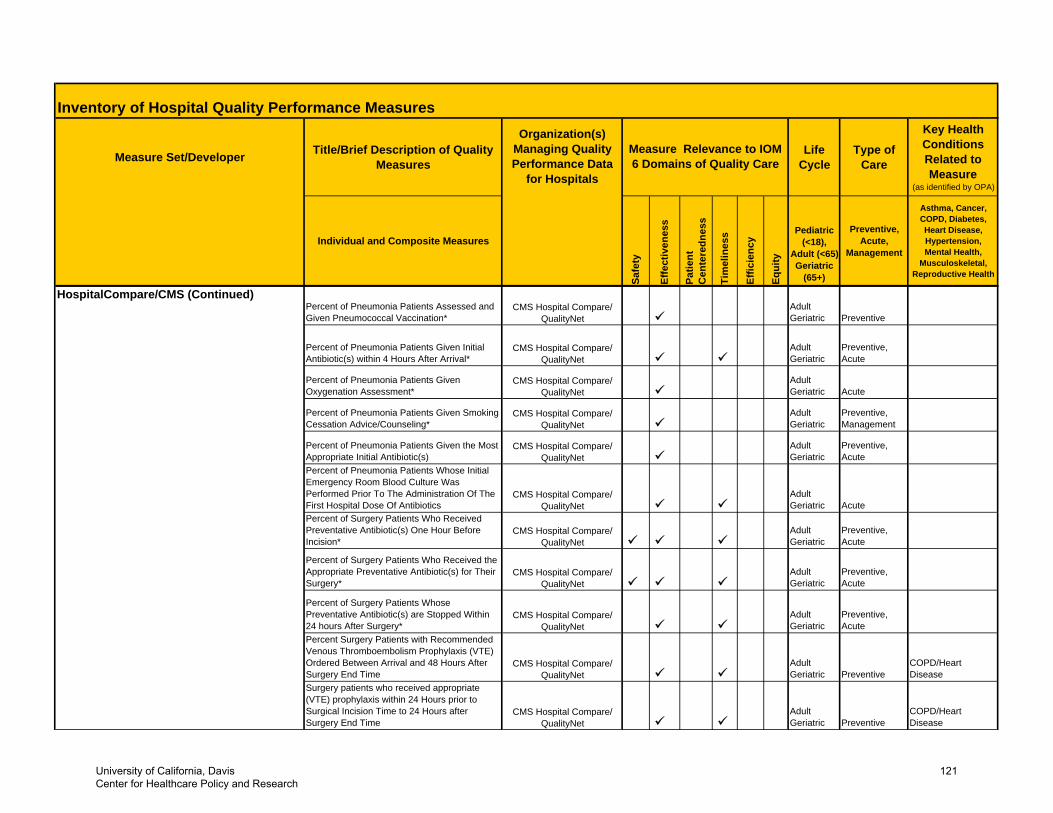
Inventory of Hospital Quality Performance Measures
Measure Set/Developer Title/Brief Description of Quality Measures
Life Cycle
Type of Care
Key Health Conditions Related to Measure
(as identified by OPA)
Individual and Composite Measures
Safe
ty
Effe
ctiv
enes
s
Patie
nt
Cen
tere
dnes
s
Tim
elin
ess
Effic
ienc
y
Equi
ty
Pediatric (<18),
Adult (<65) Geriatric
(65+)
Preventive, Acute,
Management
Asthma, Cancer, COPD, Diabetes, Heart Disease, Hypertension, Mental Health,
Musculoskeletal, Reproductive Health
Measure Relevance to IOM 6 Domains of Quality Care
Organization(s) Managing Quality Performance Data
for Hospitals
HospitalCompare/CMS (Continued)Percent of Pneumonia Patients Assessed and Given Pneumococcal Vaccination*
Adult Geriatric Preventive
Percent of Pneumonia Patients Given Initial Antibiotic(s) within 4 Hours After Arrival*
Adult Geriatric
Preventive, Acute
Percent of Pneumonia Patients Given Oxygenation Assessment*
Adult Geriatric Acute
Percent of Pneumonia Patients Given Smoking Cessation Advice/Counseling*
Adult Geriatric
Preventive, Management
Percent of Pneumonia Patients Given the Most Appropriate Initial Antibiotic(s)
Adult Geriatric
Preventive, Acute
Percent of Pneumonia Patients Whose Initial Emergency Room Blood Culture Was Performed Prior To The Administration Of The First Hospital Dose Of Antibiotics
Adult Geriatric Acute
Percent of Surgery Patients Who Received Preventative Antibiotic(s) One Hour Before Incision*
Adult Geriatric
Preventive, Acute
Percent of Surgery Patients Who Received the Appropriate Preventative Antibiotic(s) for Their Surgery*
Adult Geriatric
Preventive, Acute
Percent of Surgery Patients Whose Preventative Antibiotic(s) are Stopped Within 24 hours After Surgery*
Adult Geriatric
Preventive, Acute
Percent Surgery Patients with Recommended Venous Thromboembolism Prophylaxis (VTE) Ordered Between Arrival and 48 Hours After Surgery End Time
Adult Geriatric Preventive
COPD/Heart Disease
Surgery patients who received appropriate (VTE) prophylaxis within 24 Hours prior to Surgical Incision Time to 24 Hours after Surgery End Time
Adult Geriatric Preventive
COPD/Heart Disease
CMS Hospital Compare/ QualityNet
CMS Hospital Compare/ QualityNet
CMS Hospital Compare/ QualityNet
CMS Hospital Compare/ QualityNet
CMS Hospital Compare/ QualityNet
CMS Hospital Compare/ QualityNet
CMS Hospital Compare/ QualityNet
CMS Hospital Compare/ QualityNet
CMS Hospital Compare/ QualityNet
CMS Hospital Compare/ QualityNet
CMS Hospital Compare/ QualityNet
University of California, Davis Center for Healthcare Policy and Research
121
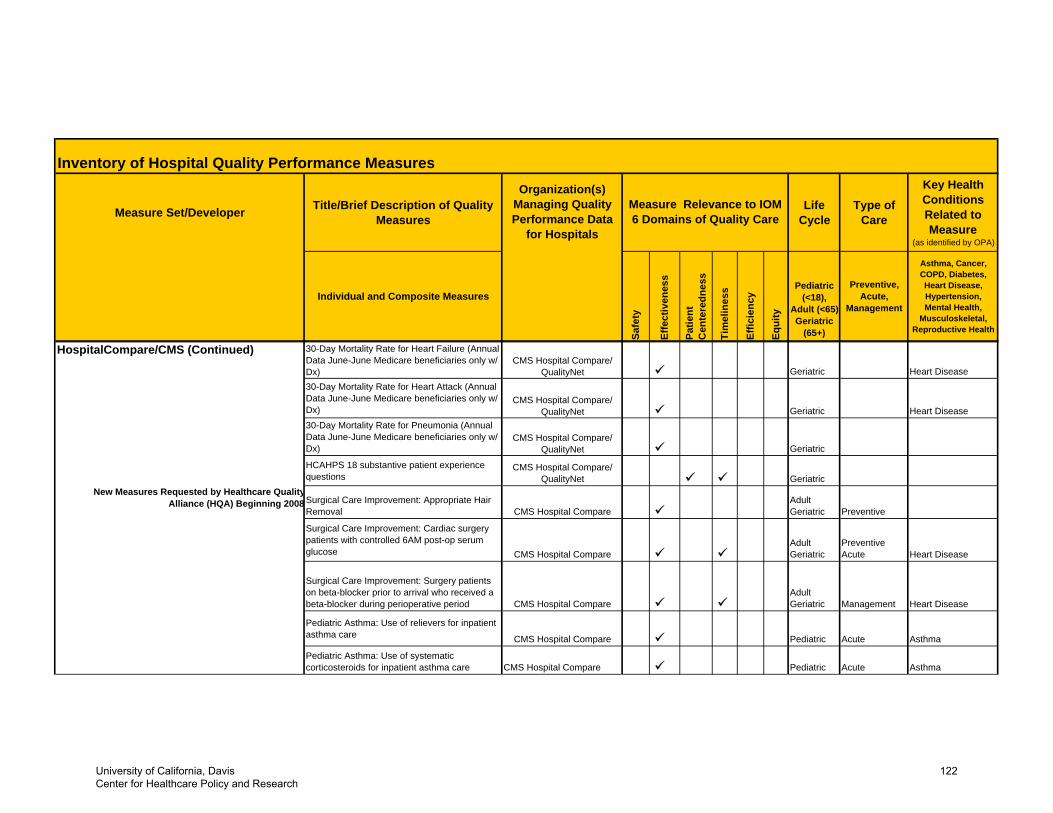
Inventory of Hospital Quality Performance Measures
Measure Set/Developer Title/Brief Description of Quality Measures
Life Cycle
Type of Care
Key Health Conditions Related to Measure
(as identified by OPA)
Individual and Composite Measures
Safe
ty
Effe
ctiv
enes
s
Patie
nt
Cen
tere
dnes
s
Tim
elin
ess
Effic
ienc
y
Equi
ty
Pediatric (<18),
Adult (<65) Geriatric
(65+)
Preventive, Acute,
Management
Asthma, Cancer, COPD, Diabetes, Heart Disease, Hypertension, Mental Health,
Musculoskeletal, Reproductive Health
Measure Relevance to IOM 6 Domains of Quality Care
Organization(s) Managing Quality Performance Data
for Hospitals
HospitalCompare/CMS (Continued) 30-Day Mortality Rate for Heart Failure (Annual Data June-June Medicare beneficiaries only w/ Dx)
Geriatric Heart Disease
30-Day Mortality Rate for Heart Attack (Annual Data June-June Medicare beneficiaries only w/ Dx)
Geriatric Heart Disease
30-Day Mortality Rate for Pneumonia (Annual Data June-June Medicare beneficiaries only w/ Dx) Geriatric
HCAHPS 18 substantive patient experience questions
CMS Hospital Compare/QualityNet Geriatric
Surgical Care Improvement: Appropriate Hair Removal CMS Hospital Compare
Adult Geriatric Preventive
Surgical Care Improvement: Cardiac surgery patients with controlled 6AM post-op serum glucose CMS Hospital Compare
Adult Geriatric
Preventive Acute Heart Disease
Surgical Care Improvement: Surgery patients on beta-blocker prior to arrival who received a beta-blocker during perioperative period CMS Hospital Compare
AdultGeriatric Management Heart Disease
Pediatric Asthma: Use of relievers for inpatient asthma care CMS Hospital Compare Pediatric Acute Asthma
Pediatric Asthma: Use of systematic corticosteroids for inpatient asthma care CMS Hospital Compare Pediatric Acute Asthma
CMS Hospital Compare/ QualityNet
CMS Hospital Compare/ QualityNet
CMS Hospital Compare/ QualityNet
New Measures Requested by Healthcare QualityAlliance (HQA) Beginning 2008
University of California, Davis Center for Healthcare Policy and Research
122
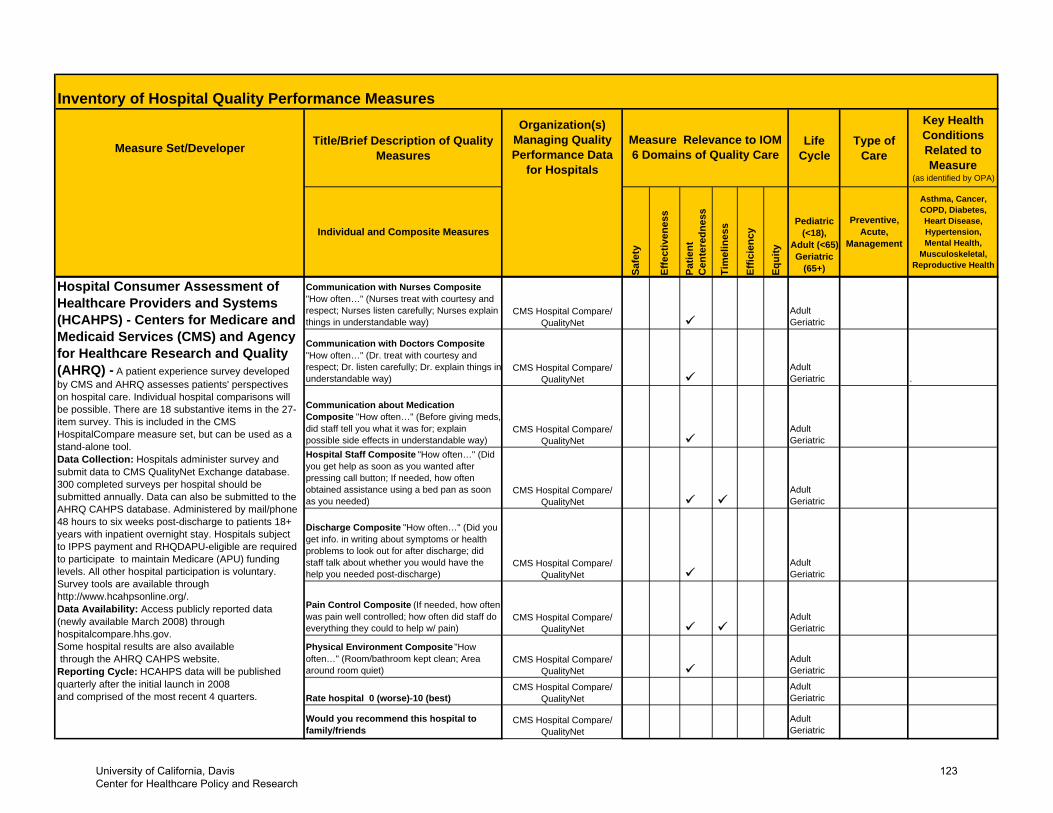
Inventory of Hospital Quality Performance Measures
Measure Set/Developer Title/Brief Description of Quality Measures
Life Cycle
Type of Care
Key Health Conditions Related to Measure
(as identified by OPA)
Individual and Composite Measures
Safe
ty
Effe
ctiv
enes
s
Patie
nt
Cen
tere
dnes
s
Tim
elin
ess
Effic
ienc
y
Equi
ty
Pediatric (<18),
Adult (<65) Geriatric
(65+)
Preventive, Acute,
Management
Asthma, Cancer, COPD, Diabetes, Heart Disease, Hypertension, Mental Health,
Musculoskeletal, Reproductive Health
Measure Relevance to IOM 6 Domains of Quality Care
Organization(s) Managing Quality Performance Data
for Hospitals
Communication with Nurses Composite "How often…" (Nurses treat with courtesy and respect; Nurses listen carefully; Nurses explain things in understandable way)
Adult Geriatric
Communication with Doctors Composite "How often…" (Dr. treat with courtesy and respect; Dr. listen carefully; Dr. explain things in understandable way)
Adult Geriatric .
Communication about Medication Composite "How often…" (Before giving meds, did staff tell you what it was for; explain possible side effects in understandable way)
Adult Geriatric
Hospital Staff Composite "How often…" (Did you get help as soon as you wanted after pressing call button; If needed, how often obtained assistance using a bed pan as soon as you needed)
Adult Geriatric
Discharge Composite "How often…" (Did you get info. in writing about symptoms or health problems to look out for after discharge; did staff talk about whether you would have the help you needed post-discharge)
Adult Geriatric
Pain Control Composite (If needed, how often was pain well controlled; how often did staff do everything they could to help w/ pain)
Adult Geriatric
Physical Environment Composite "How often…" (Room/bathroom kept clean; Area around room quiet)
Adult Geriatric
Rate hospital 0 (worse)-10 (best)Adult Geriatric
Would you recommend this hospital to family/friends
Adult Geriatric
CMS Hospital Compare/ QualityNet
CMS Hospital Compare/ QualityNet
CMS Hospital Compare/ QualityNet
CMS Hospital Compare/ QualityNet
CMS Hospital Compare/ QualityNet
CMS Hospital Compare/ QualityNet
CMS Hospital Compare/ QualityNet
CMS Hospital Compare/ QualityNet
CMS Hospital Compare/ QualityNet
Hospital Consumer Assessment of Healthcare Providers and Systems (HCAHPS) - Centers for Medicare and Medicaid Services (CMS) and Agency for Healthcare Research and Quality (AHRQ) - A patient experience survey developed by CMS and AHRQ assesses patients' perspectives on hospital care. Individual hospital comparisons will be possible. There are 18 substantive items in the 27-item survey. This is included in the CMS HospitalCompare measure set, but can be used as a stand-alone tool. Data Collection: Hospitals administer survey and submit data to CMS QualityNet Exchange database. 300 completed surveys per hospital should be submitted annually. Data can also be submitted to the AHRQ CAHPS database. Administered by mail/phone 48 hours to six weeks post-discharge to patients 18+ years with inpatient overnight stay. Hospitals subject to IPPS payment and RHQDAPU-eligible are required to participate to maintain Medicare (APU) funding levels. All other hospital participation is voluntary. Survey tools are available through http://www.hcahpsonline.org/.Data Availability: Access publicly reported data (newly available March 2008) throughhospitalcompare.hhs.gov. Some hospital results are also available through the AHRQ CAHPS website.Reporting Cycle: HCAHPS data will be publishedquarterly after the initial launch in 2008 and comprised of the most recent 4 quarters.
University of California, Davis Center for Healthcare Policy and Research
123
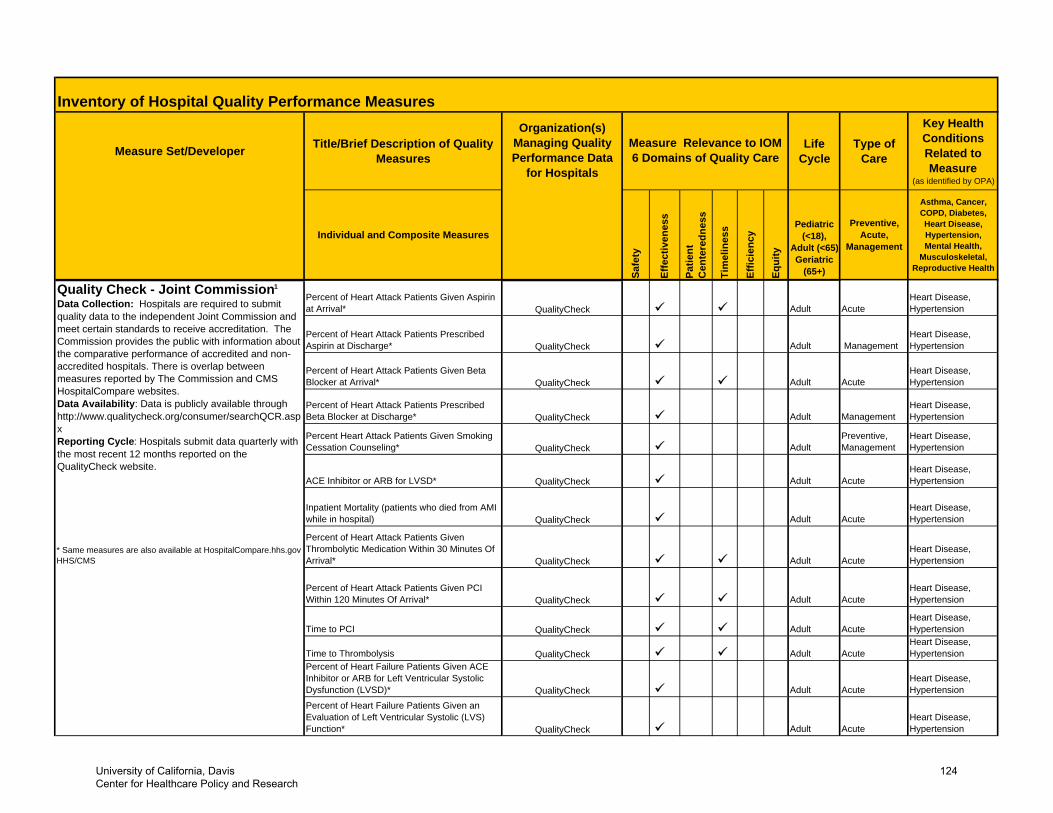
Inventory of Hospital Quality Performance Measures
Measure Set/Developer Title/Brief Description of Quality Measures
Life Cycle
Type of Care
Key Health Conditions Related to Measure
(as identified by OPA)
Individual and Composite Measures
Safe
ty
Effe
ctiv
enes
s
Patie
nt
Cen
tere
dnes
s
Tim
elin
ess
Effic
ienc
y
Equi
ty
Pediatric (<18),
Adult (<65) Geriatric
(65+)
Preventive, Acute,
Management
Asthma, Cancer, COPD, Diabetes, Heart Disease, Hypertension, Mental Health,
Musculoskeletal, Reproductive Health
Measure Relevance to IOM 6 Domains of Quality Care
Organization(s) Managing Quality Performance Data
for Hospitals
Percent of Heart Attack Patients Given Aspirin at Arrival* Adult Acute
Heart Disease, Hypertension
Percent of Heart Attack Patients Prescribed Aspirin at Discharge* Adult Management
Heart Disease, Hypertension
Percent of Heart Attack Patients Given Beta Blocker at Arrival* Adult Acute
Heart Disease, Hypertension
Percent of Heart Attack Patients Prescribed Beta Blocker at Discharge* Adult Management
Heart Disease, Hypertension
Percent Heart Attack Patients Given Smoking Cessation Counseling* QualityCheck Adult
Preventive, Management
Heart Disease, Hypertension
ACE Inhibitor or ARB for LVSD* QualityCheck Adult AcuteHeart Disease, Hypertension
Inpatient Mortality (patients who died from AMI while in hospital) Adult Acute
Heart Disease, Hypertension
* Same measures are also available at HospitalCompare.hhs.gov -HHS/CMS
Percent of Heart Attack Patients Given Thrombolytic Medication Within 30 Minutes Of Arrival* Adult Acute
Heart Disease, Hypertension
Percent of Heart Attack Patients Given PCI Within 120 Minutes Of Arrival* Adult Acute
Heart Disease, Hypertension
Time to PCI Adult AcuteHeart Disease, Hypertension
Time to Thrombolysis Adult AcuteHeart Disease, Hypertension
Percent of Heart Failure Patients Given ACE Inhibitor or ARB for Left Ventricular Systolic Dysfunction (LVSD)* Adult Acute
Heart Disease, Hypertension
Percent of Heart Failure Patients Given an Evaluation of Left Ventricular Systolic (LVS) Function* Adult Acute
Heart Disease, HypertensionQualityCheck
QualityCheck
QualityCheck
QualityCheck
QualityCheck
QualityCheck
Quality Check - Joint Commission1
Data Collection: Hospitals are required to submit quality data to the independent Joint Commission and meet certain standards to receive accreditation. The Commission provides the public with information about the comparative performance of accredited and non-accredited hospitals. There is overlap between measures reported by The Commission and CMS HospitalCompare websites. Data Availability: Data is publicly available through http://www.qualitycheck.org/consumer/searchQCR.aspx Reporting Cycle: Hospitals submit data quarterly with the most recent 12 months reported on the QualityCheck website.
QualityCheck
QualityCheck
QualityCheck
QualityCheck
QualityCheck
University of California, Davis Center for Healthcare Policy and Research
124
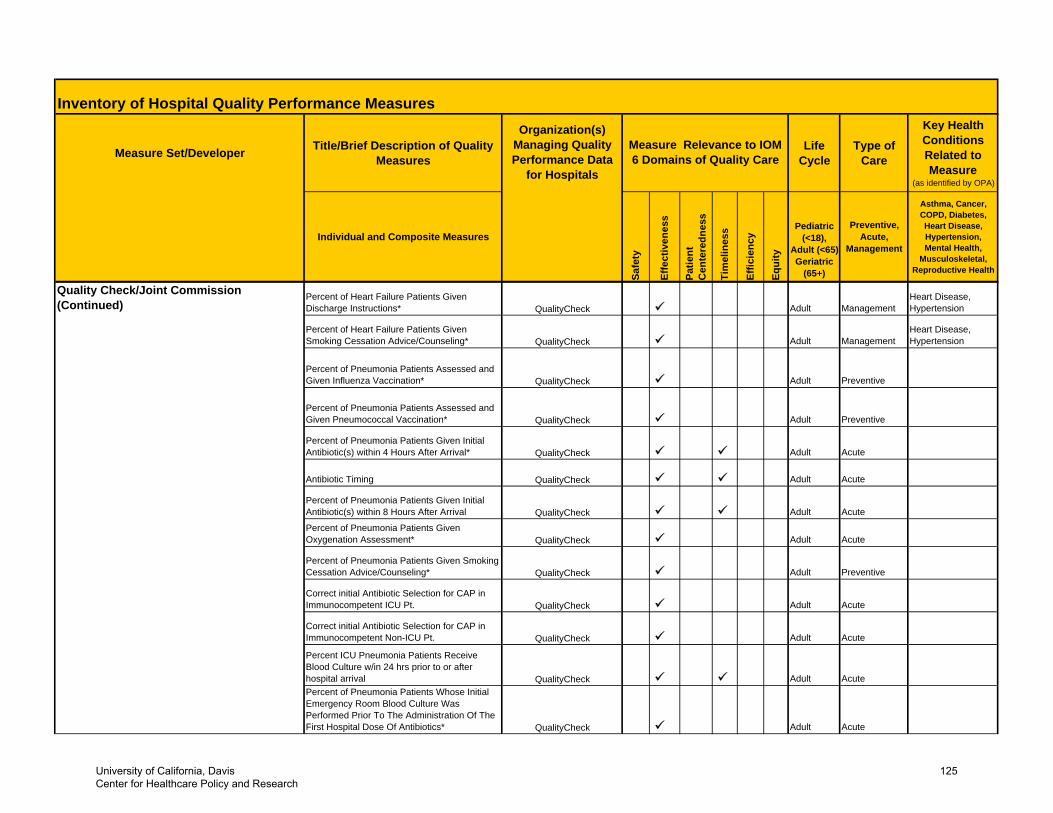
Inventory of Hospital Quality Performance Measures
Measure Set/Developer Title/Brief Description of Quality Measures
Life Cycle
Type of Care
Key Health Conditions Related to Measure
(as identified by OPA)
Individual and Composite Measures
Safe
ty
Effe
ctiv
enes
s
Patie
nt
Cen
tere
dnes
s
Tim
elin
ess
Effic
ienc
y
Equi
ty
Pediatric (<18),
Adult (<65) Geriatric
(65+)
Preventive, Acute,
Management
Asthma, Cancer, COPD, Diabetes, Heart Disease, Hypertension, Mental Health,
Musculoskeletal, Reproductive Health
Measure Relevance to IOM 6 Domains of Quality Care
Organization(s) Managing Quality Performance Data
for Hospitals
Quality Check/Joint Commission (Continued)
Percent of Heart Failure Patients Given Discharge Instructions* Adult Management
Heart Disease, Hypertension
Percent of Heart Failure Patients Given Smoking Cessation Advice/Counseling* Adult Management
Heart Disease, Hypertension
Percent of Pneumonia Patients Assessed and Given Influenza Vaccination* Adult Preventive
Percent of Pneumonia Patients Assessed and Given Pneumococcal Vaccination* Adult Preventive
Percent of Pneumonia Patients Given Initial Antibiotic(s) within 4 Hours After Arrival* Adult Acute
Antibiotic Timing Adult Acute
Percent of Pneumonia Patients Given Initial Antibiotic(s) within 8 Hours After Arrival Adult Acute
Percent of Pneumonia Patients Given Oxygenation Assessment* Adult Acute
Percent of Pneumonia Patients Given Smoking Cessation Advice/Counseling* Adult Preventive
Correct initial Antibiotic Selection for CAP in Immunocompetent ICU Pt. Adult Acute
Correct initial Antibiotic Selection for CAP in Immunocompetent Non-ICU Pt. Adult Acute
Percent ICU Pneumonia Patients Receive Blood Culture w/in 24 hrs prior to or after hospital arrival Adult AcutePercent of Pneumonia Patients Whose Initial Emergency Room Blood Culture Was Performed Prior To The Administration Of The First Hospital Dose Of Antibiotics* Adult AcuteQualityCheck
QualityCheck
QualityCheck
QualityCheck
QualityCheck
QualityCheck
QualityCheck
QualityCheck
QualityCheck
QualityCheck
QualityCheck
QualityCheck
QualityCheck
University of California, Davis Center for Healthcare Policy and Research
125
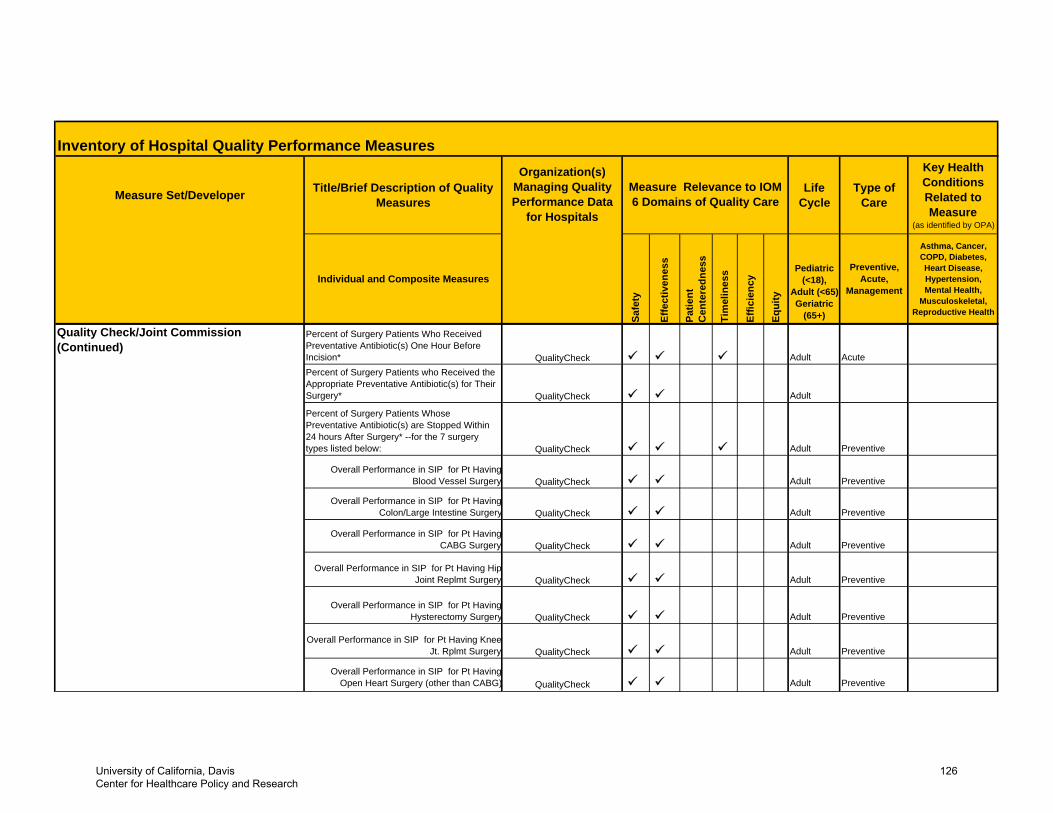
Inventory of Hospital Quality Performance Measures
Measure Set/Developer Title/Brief Description of Quality Measures
Life Cycle
Type of Care
Key Health Conditions Related to Measure
(as identified by OPA)
Individual and Composite Measures
Safe
ty
Effe
ctiv
enes
s
Patie
nt
Cen
tere
dnes
s
Tim
elin
ess
Effic
ienc
y
Equi
ty
Pediatric (<18),
Adult (<65) Geriatric
(65+)
Preventive, Acute,
Management
Asthma, Cancer, COPD, Diabetes, Heart Disease, Hypertension, Mental Health,
Musculoskeletal, Reproductive Health
Measure Relevance to IOM 6 Domains of Quality Care
Organization(s) Managing Quality Performance Data
for Hospitals
Quality Check/Joint Commission (Continued)
Percent of Surgery Patients Who Received Preventative Antibiotic(s) One Hour Before Incision* Adult AcutePercent of Surgery Patients who Received the Appropriate Preventative Antibiotic(s) for Their Surgery* Adult
Percent of Surgery Patients Whose Preventative Antibiotic(s) are Stopped Within 24 hours After Surgery* --for the 7 surgery types listed below: Adult Preventive
Overall Performance in SIP for Pt HavingBlood Vessel Surgery Adult Preventive
Overall Performance in SIP for Pt HavingColon/Large Intestine Surgery Adult Preventive
Overall Performance in SIP for Pt HavingCABG Surgery Adult Preventive
Overall Performance in SIP for Pt Having HipJoint Replmt Surgery Adult Preventive
Overall Performance in SIP for Pt HavingHysterectomy Surgery Adult Preventive
Overall Performance in SIP for Pt Having KneeJt. Rplmt Surgery Adult Preventive
Overall Performance in SIP for Pt HavingOpen Heart Surgery (other than CABG) Adult Preventive
QualityCheck
QualityCheck
QualityCheck
QualityCheck
QualityCheck
QualityCheck
QualityCheck
QualityCheck
QualityCheck
QualityCheck
University of California, Davis Center for Healthcare Policy and Research
126
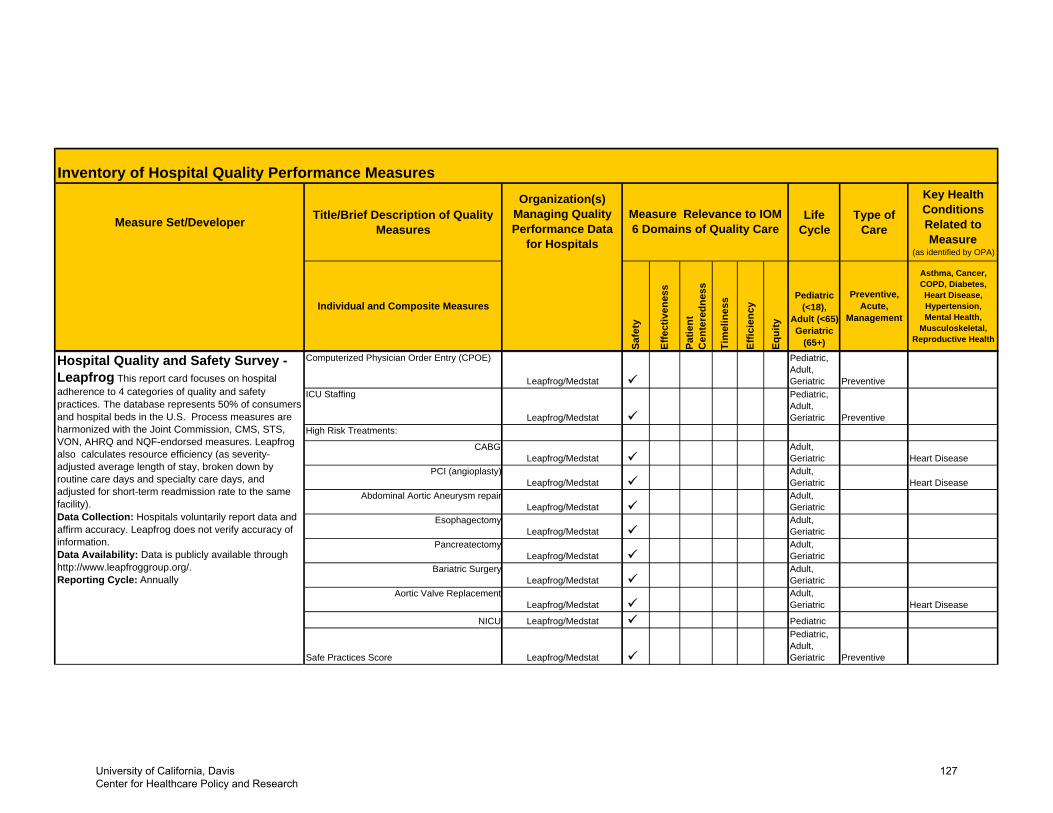
Inventory of Hospital Quality Performance Measures
Measure Set/Developer Title/Brief Description of Quality Measures
Life Cycle
Type of Care
Key Health Conditions Related to Measure
(as identified by OPA)
Individual and Composite Measures
Safe
ty
Effe
ctiv
enes
s
Patie
nt
Cen
tere
dnes
s
Tim
elin
ess
Effic
ienc
y
Equi
ty
Pediatric (<18),
Adult (<65) Geriatric
(65+)
Preventive, Acute,
Management
Asthma, Cancer, COPD, Diabetes, Heart Disease, Hypertension, Mental Health,
Musculoskeletal, Reproductive Health
Measure Relevance to IOM 6 Domains of Quality Care
Organization(s) Managing Quality Performance Data
for Hospitals
Computerized Physician Order Entry (CPOE)
Leapfrog/Medstat
Pediatric, Adult, Geriatric Preventive
ICU Staffing
Leapfrog/Medstat
Pediatric, Adult, Geriatric Preventive
High Risk Treatments:
CABGLeapfrog/Medstat
Adult, Geriatric Heart Disease
PCI (angioplasty)Leapfrog/Medstat
Adult, Geriatric Heart Disease
Abdominal Aortic Aneurysm repair Leapfrog/Medstat
Adult, Geriatric
EsophagectomyLeapfrog/Medstat
Adult, Geriatric
PancreatectomyLeapfrog/Medstat
Adult, Geriatric
Bariatric SurgeryLeapfrog/Medstat
Adult, Geriatric
Aortic Valve ReplacementLeapfrog/Medstat
Adult, Geriatric Heart Disease
NICU Leapfrog/Medstat Pediatric
Safe Practices Score Leapfrog/Medstat
Pediatric, Adult, Geriatric Preventive
Hospital Quality and Safety Survey - Leapfrog This report card focuses on hospital adherence to 4 categories of quality and safety practices. The database represents 50% of consumers and hospital beds in the U.S. Process measures are harmonized with the Joint Commission, CMS, STS, VON, AHRQ and NQF-endorsed measures. Leapfrog also calculates resource efficiency (as severity-adjusted average length of stay, broken down by routine care days and specialty care days, and adjusted for short-term readmission rate to the same facility). Data Collection: Hospitals voluntarily report data and affirm accuracy. Leapfrog does not verify accuracy of information.Data Availability: Data is publicly available through http://www.leapfroggroup.org/.Reporting Cycle: Annually
University of California, Davis Center for Healthcare Policy and Research
127
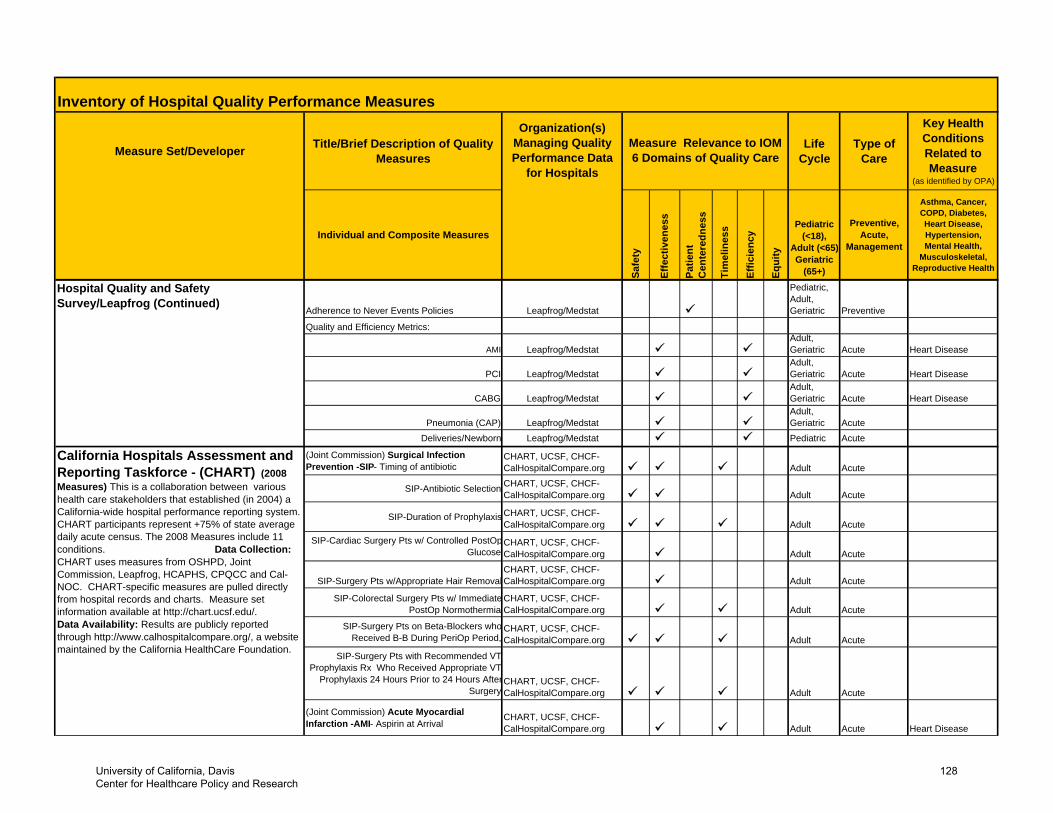
Inventory of Hospital Quality Performance Measures
Measure Set/Developer Title/Brief Description of Quality Measures
Life Cycle
Type of Care
Key Health Conditions Related to Measure
(as identified by OPA)
Individual and Composite Measures
Safe
ty
Effe
ctiv
enes
s
Patie
nt
Cen
tere
dnes
s
Tim
elin
ess
Effic
ienc
y
Equi
ty
Pediatric (<18),
Adult (<65) Geriatric
(65+)
Preventive, Acute,
Management
Asthma, Cancer, COPD, Diabetes, Heart Disease, Hypertension, Mental Health,
Musculoskeletal, Reproductive Health
Measure Relevance to IOM 6 Domains of Quality Care
Organization(s) Managing Quality Performance Data
for Hospitals
Adherence to Never Events Policies Leapfrog/Medstat
Pediatric, Adult, Geriatric Preventive
Quality and Efficiency Metrics:
AMI Leapfrog/MedstatAdult, Geriatric Acute Heart Disease
PCI Leapfrog/MedstatAdult, Geriatric Acute Heart Disease
CABG Leapfrog/MedstatAdult, Geriatric Acute Heart Disease
Pneumonia (CAP) Leapfrog/MedstatAdult, Geriatric Acute
Deliveries/Newborn Leapfrog/Medstat Pediatric Acute
(Joint Commission) Surgical Infection Prevention -SIP- Timing of antibiotic
CHART, UCSF, CHCF-CalHospitalCompare.org Adult Acute
SIP-Antibiotic Selection CHART, UCSF, CHCF-CalHospitalCompare.org Adult Acute
SIP-Duration of Prophylaxis CHART, UCSF, CHCF-CalHospitalCompare.org Adult Acute
SIP-Cardiac Surgery Pts w/ Controlled PostOpGlucose
CHART, UCSF, CHCF-CalHospitalCompare.org Adult Acute
SIP-Surgery Pts w/Appropriate Hair RemovalCHART, UCSF, CHCF-CalHospitalCompare.org Adult Acute
SIP-Colorectal Surgery Pts w/ ImmediatePostOp Normothermia
CHART, UCSF, CHCF-CalHospitalCompare.org Adult Acute
SIP-Surgery Pts on Beta-Blockers whoReceived B-B During PeriOp Period,
CHART, UCSF, CHCF-CalHospitalCompare.org Adult Acute
SIP-Surgery Pts with Recommended VTProphylaxis Rx Who Received Appropriate VT
Prophylaxis 24 Hours Prior to 24 Hours AfterSurgery
CHART, UCSF, CHCF-CalHospitalCompare.org Adult Acute
(Joint Commission) Acute Myocardial Infarction -AMI- Aspirin at Arrival
CHART, UCSF, CHCF-CalHospitalCompare.org Adult Acute Heart Disease
Hospital Quality and Safety Survey/Leapfrog (Continued)
California Hospitals Assessment and Reporting Taskforce - (CHART) (2008 Measures) This is a collaboration between various health care stakeholders that established (in 2004) a California-wide hospital performance reporting system. CHART participants represent +75% of state average daily acute census. The 2008 Measures include 11 conditions. Data Collection: CHART uses measures from OSHPD, Joint Commission, Leapfrog, HCAPHS, CPQCC and Cal-NOC. CHART-specific measures are pulled directly from hospital records and charts. Measure set information available at http://chart.ucsf.edu/. Data Availability: Results are publicly reported through http://www.calhospitalcompare.org/, a website maintained by the California HealthCare Foundation.
University of California, Davis Center for Healthcare Policy and Research
128
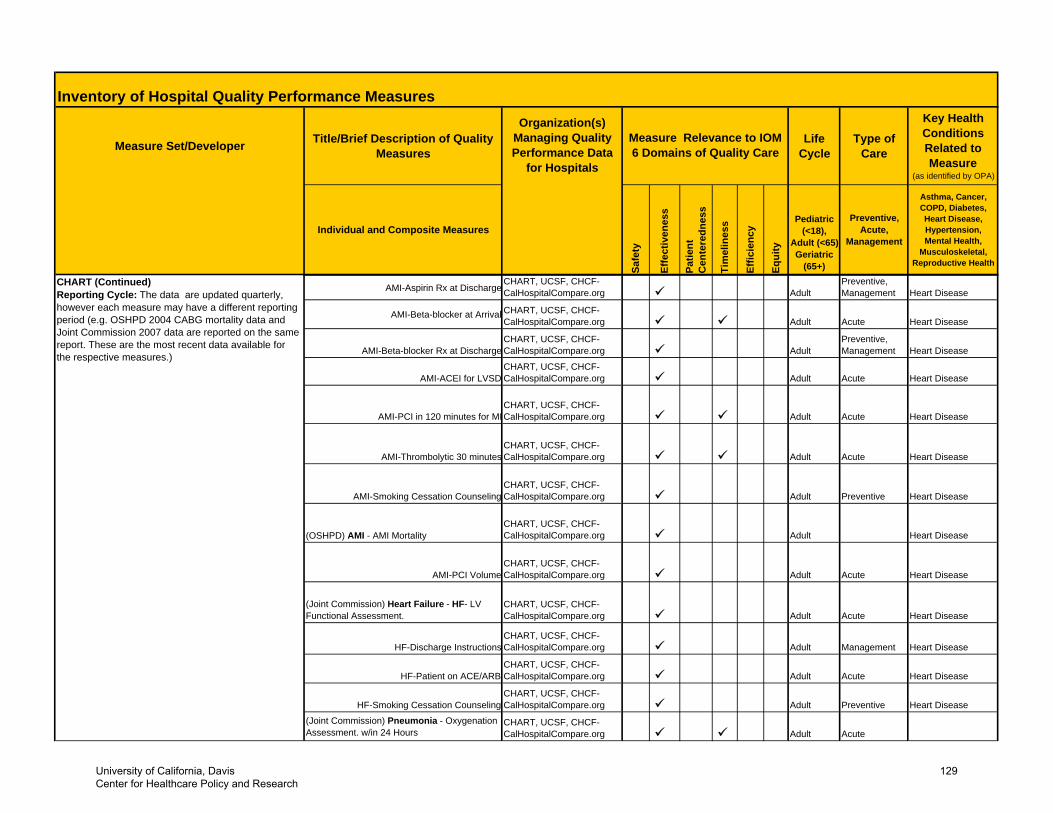
Inventory of Hospital Quality Performance Measures
Measure Set/Developer Title/Brief Description of Quality Measures
Life Cycle
Type of Care
Key Health Conditions Related to Measure
(as identified by OPA)
Individual and Composite Measures
Safe
ty
Effe
ctiv
enes
s
Patie
nt
Cen
tere
dnes
s
Tim
elin
ess
Effic
ienc
y
Equi
ty
Pediatric (<18),
Adult (<65) Geriatric
(65+)
Preventive, Acute,
Management
Asthma, Cancer, COPD, Diabetes, Heart Disease, Hypertension, Mental Health,
Musculoskeletal, Reproductive Health
Measure Relevance to IOM 6 Domains of Quality Care
Organization(s) Managing Quality Performance Data
for Hospitals
AMI-Aspirin Rx at DischargeCHART, UCSF, CHCF-CalHospitalCompare.org Adult
Preventive, Management Heart Disease
AMI-Beta-blocker at Arrival CHART, UCSF, CHCF-CalHospitalCompare.org Adult Acute Heart Disease
AMI-Beta-blocker Rx at DischargeCHART, UCSF, CHCF-CalHospitalCompare.org Adult
Preventive, Management Heart Disease
AMI-ACEI for LVSDCHART, UCSF, CHCF-CalHospitalCompare.org Adult Acute Heart Disease
AMI-PCI in 120 minutes for MICHART, UCSF, CHCF-CalHospitalCompare.org Adult Acute Heart Disease
AMI-Thrombolytic 30 minutesCHART, UCSF, CHCF-CalHospitalCompare.org Adult Acute Heart Disease
AMI-Smoking Cessation CounselingCHART, UCSF, CHCF-CalHospitalCompare.org Adult Preventive Heart Disease
(OSHPD) AMI - AMI MortalityCHART, UCSF, CHCF-CalHospitalCompare.org Adult Heart Disease
AMI-PCI VolumeCHART, UCSF, CHCF-CalHospitalCompare.org Adult Acute Heart Disease
(Joint Commission) Heart Failure - HF- LV Functional Assessment.
CHART, UCSF, CHCF-CalHospitalCompare.org Adult Acute Heart Disease
HF-Discharge InstructionsCHART, UCSF, CHCF-CalHospitalCompare.org Adult Management Heart Disease
HF-Patient on ACE/ARBCHART, UCSF, CHCF-CalHospitalCompare.org Adult Acute Heart Disease
HF-Smoking Cessation CounselingCHART, UCSF, CHCF-CalHospitalCompare.org Adult Preventive Heart Disease
(Joint Commission) Pneumonia - Oxygenation Assessment. w/in 24 Hours
CHART, UCSF, CHCF-CalHospitalCompare.org Adult Acute
CHART (Continued)Reporting Cycle: The data are updated quarterly, however each measure may have a different reporting period (e.g. OSHPD 2004 CABG mortality data and Joint Commission 2007 data are reported on the same report. These are the most recent data available for the respective measures.)
University of California, Davis Center for Healthcare Policy and Research
129
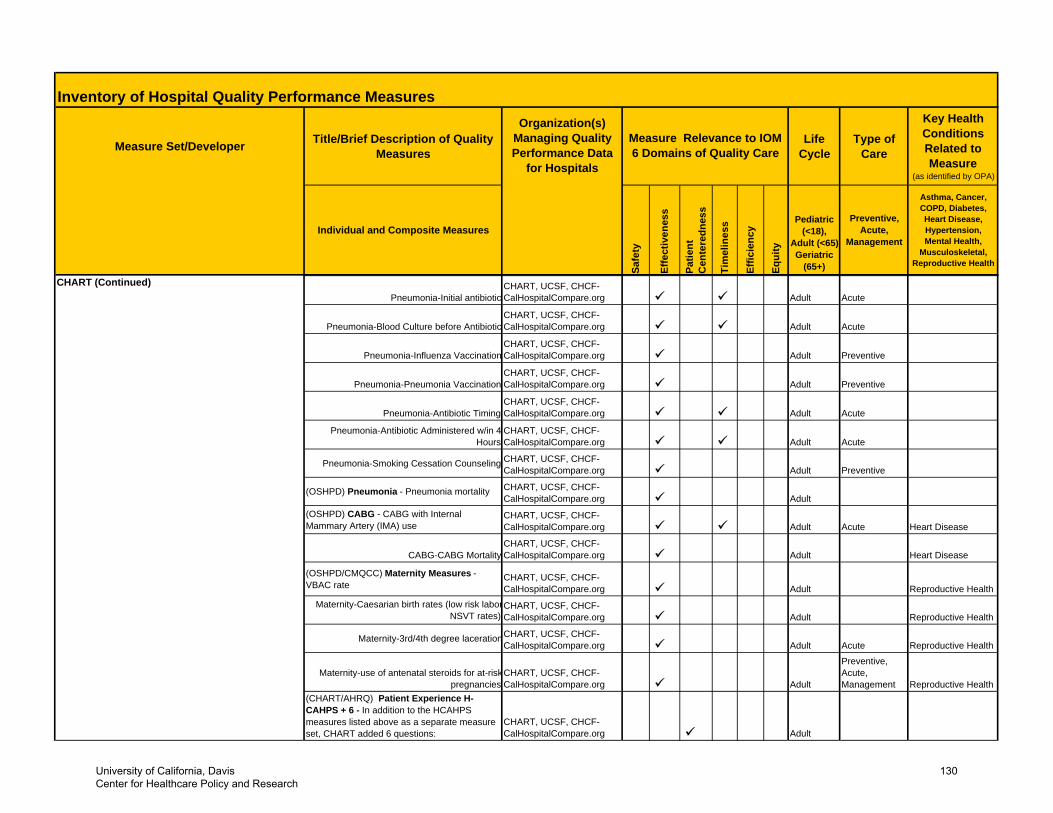
Inventory of Hospital Quality Performance Measures
Measure Set/Developer Title/Brief Description of Quality Measures
Life Cycle
Type of Care
Key Health Conditions Related to Measure
(as identified by OPA)
Individual and Composite Measures
Safe
ty
Effe
ctiv
enes
s
Patie
nt
Cen
tere
dnes
s
Tim
elin
ess
Effic
ienc
y
Equi
ty
Pediatric (<18),
Adult (<65) Geriatric
(65+)
Preventive, Acute,
Management
Asthma, Cancer, COPD, Diabetes, Heart Disease, Hypertension, Mental Health,
Musculoskeletal, Reproductive Health
Measure Relevance to IOM 6 Domains of Quality Care
Organization(s) Managing Quality Performance Data
for Hospitals
CHART (Continued)Pneumonia-Initial antibiotic
CHART, UCSF, CHCF-CalHospitalCompare.org Adult Acute
Pneumonia-Blood Culture before AntibioticCHART, UCSF, CHCF-CalHospitalCompare.org Adult Acute
Pneumonia-Influenza VaccinationCHART, UCSF, CHCF-CalHospitalCompare.org Adult Preventive
Pneumonia-Pneumonia VaccinationCHART, UCSF, CHCF-CalHospitalCompare.org Adult Preventive
Pneumonia-Antibiotic TimingCHART, UCSF, CHCF-CalHospitalCompare.org Adult Acute
Pneumonia-Antibiotic Administered w/in 4 Hours
CHART, UCSF, CHCF-CalHospitalCompare.org Adult Acute
Pneumonia-Smoking Cessation Counseling CHART, UCSF, CHCF-CalHospitalCompare.org Adult Preventive
(OSHPD) Pneumonia - Pneumonia mortality CHART, UCSF, CHCF-CalHospitalCompare.org Adult
(OSHPD) CABG - CABG with Internal Mammary Artery (IMA) use
CHART, UCSF, CHCF-CalHospitalCompare.org Adult Acute Heart Disease
CABG-CABG MortalityCHART, UCSF, CHCF-CalHospitalCompare.org Adult Heart Disease
(OSHPD/CMQCC) Maternity Measures - VBAC rate
CHART, UCSF, CHCF-CalHospitalCompare.org Adult Reproductive Health
Maternity-Caesarian birth rates (low risk laborNSVT rates)
CHART, UCSF, CHCF-CalHospitalCompare.org Adult Reproductive Health
Maternity-3rd/4th degree lacerationCHART, UCSF, CHCF-CalHospitalCompare.org Adult Acute Reproductive Health
Maternity-use of antenatal steroids for at-riskpregnancies
CHART, UCSF, CHCF-CalHospitalCompare.org Adult
Preventive, Acute, Management Reproductive Health
(CHART/AHRQ) Patient Experience H-CAHPS + 6 - In addition to the HCAHPS measures listed above as a separate measure set, CHART added 6 questions:
CHART, UCSF, CHCF-CalHospitalCompare.org Adult
University of California, Davis Center for Healthcare Policy and Research
130
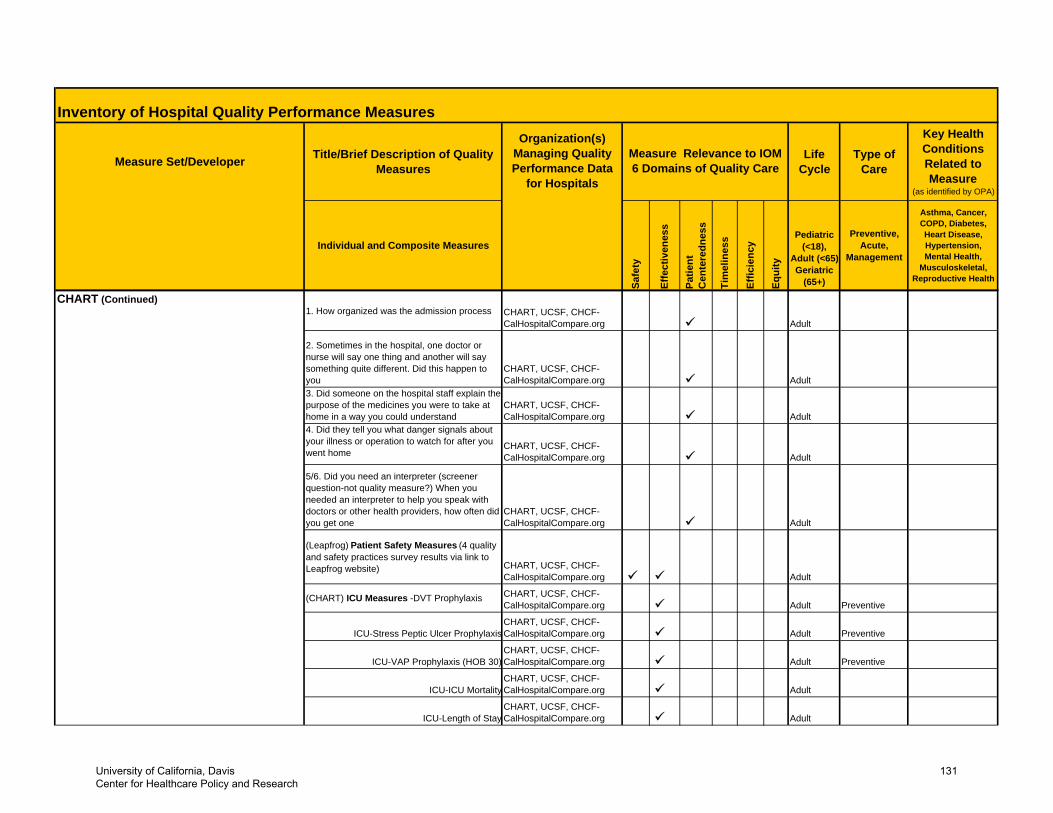
Inventory of Hospital Quality Performance Measures
Measure Set/Developer Title/Brief Description of Quality Measures
Life Cycle
Type of Care
Key Health Conditions Related to Measure
(as identified by OPA)
Individual and Composite Measures
Safe
ty
Effe
ctiv
enes
s
Patie
nt
Cen
tere
dnes
s
Tim
elin
ess
Effic
ienc
y
Equi
ty
Pediatric (<18),
Adult (<65) Geriatric
(65+)
Preventive, Acute,
Management
Asthma, Cancer, COPD, Diabetes, Heart Disease, Hypertension, Mental Health,
Musculoskeletal, Reproductive Health
Measure Relevance to IOM 6 Domains of Quality Care
Organization(s) Managing Quality Performance Data
for Hospitals
CHART (Continued)1. How organized was the admission process CHART, UCSF, CHCF-
CalHospitalCompare.org Adult
2. Sometimes in the hospital, one doctor or nurse will say one thing and another will say something quite different. Did this happen to you
CHART, UCSF, CHCF-CalHospitalCompare.org Adult
3. Did someone on the hospital staff explain the purpose of the medicines you were to take at home in a way you could understand
CHART, UCSF, CHCF-CalHospitalCompare.org Adult
4. Did they tell you what danger signals about your illness or operation to watch for after you went home
CHART, UCSF, CHCF-CalHospitalCompare.org Adult
5/6. Did you need an interpreter (screener question-not quality measure?) When you needed an interpreter to help you speak with doctors or other health providers, how often did you get one
CHART, UCSF, CHCF-CalHospitalCompare.org Adult
(Leapfrog) Patient Safety Measures (4 quality and safety practices survey results via link to Leapfrog website) CHART, UCSF, CHCF-
CalHospitalCompare.org Adult
(CHART) ICU Measures -DVT Prophylaxis CHART, UCSF, CHCF-CalHospitalCompare.org Adult Preventive
ICU-Stress Peptic Ulcer ProphylaxisCHART, UCSF, CHCF-CalHospitalCompare.org Adult Preventive
ICU-VAP Prophylaxis (HOB 30)CHART, UCSF, CHCF-CalHospitalCompare.org Adult Preventive
ICU-ICU MortalityCHART, UCSF, CHCF-CalHospitalCompare.org Adult
ICU-Length of StayCHART, UCSF, CHCF-CalHospitalCompare.org Adult
University of California, Davis Center for Healthcare Policy and Research
131
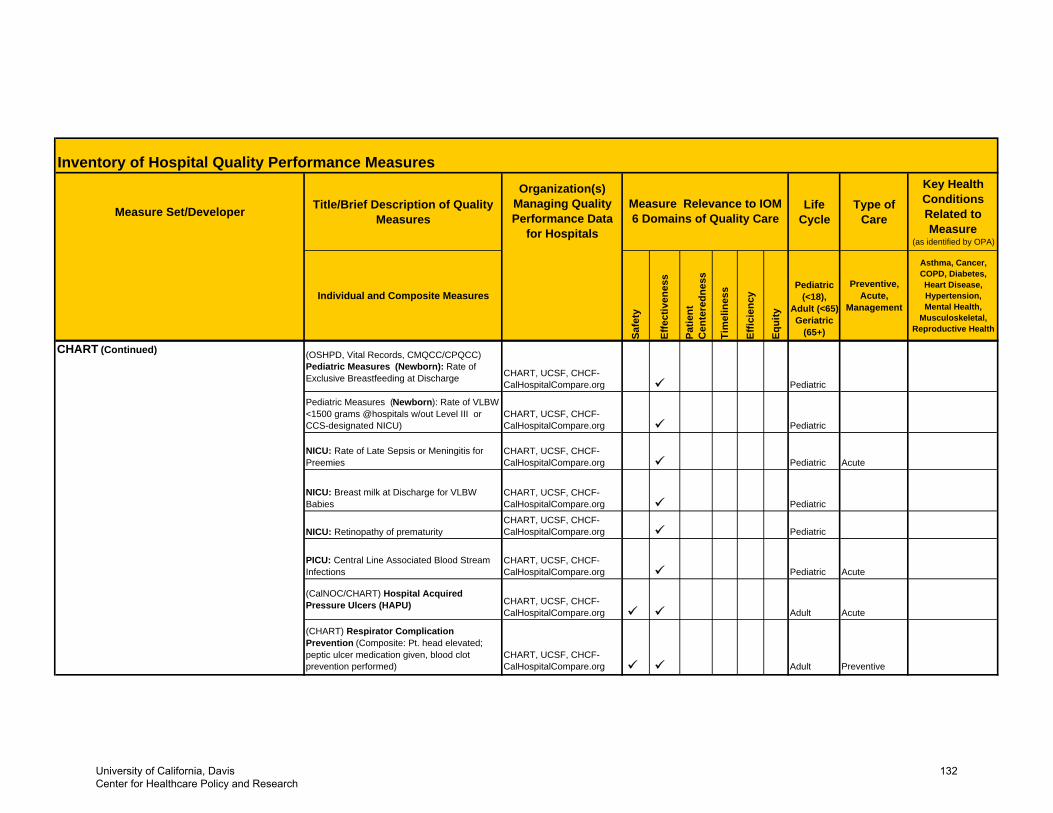
Inventory of Hospital Quality Performance Measures
Measure Set/Developer Title/Brief Description of Quality Measures
Life Cycle
Type of Care
Key Health Conditions Related to Measure
(as identified by OPA)
Individual and Composite Measures
Safe
ty
Effe
ctiv
enes
s
Patie
nt
Cen
tere
dnes
s
Tim
elin
ess
Effic
ienc
y
Equi
ty
Pediatric (<18),
Adult (<65) Geriatric
(65+)
Preventive, Acute,
Management
Asthma, Cancer, COPD, Diabetes, Heart Disease, Hypertension, Mental Health,
Musculoskeletal, Reproductive Health
Measure Relevance to IOM 6 Domains of Quality Care
Organization(s) Managing Quality Performance Data
for Hospitals
CHART (Continued) (OSHPD, Vital Records, CMQCC/CPQCC) Pediatric Measures (Newborn): Rate of Exclusive Breastfeeding at Discharge CHART, UCSF, CHCF-
CalHospitalCompare.org Pediatric
Pediatric Measures (Newborn): Rate of VLBW <1500 grams @hospitals w/out Level III or CCS-designated NICU)
CHART, UCSF, CHCF-CalHospitalCompare.org Pediatric
NICU: Rate of Late Sepsis or Meningitis for Preemies
CHART, UCSF, CHCF-CalHospitalCompare.org Pediatric Acute
NICU: Breast milk at Discharge for VLBW Babies
CHART, UCSF, CHCF-CalHospitalCompare.org Pediatric
NICU: Retinopathy of prematurityCHART, UCSF, CHCF-CalHospitalCompare.org Pediatric
PICU: Central Line Associated Blood Stream Infections
CHART, UCSF, CHCF-CalHospitalCompare.org Pediatric Acute
(CalNOC/CHART) Hospital Acquired Pressure Ulcers (HAPU) CHART, UCSF, CHCF-
CalHospitalCompare.org Adult Acute
(CHART) Respirator Complication Prevention (Composite: Pt. head elevated; peptic ulcer medication given, blood clot prevention performed)
CHART, UCSF, CHCF-CalHospitalCompare.org Adult Preventive
University of California, Davis Center for Healthcare Policy and Research
132
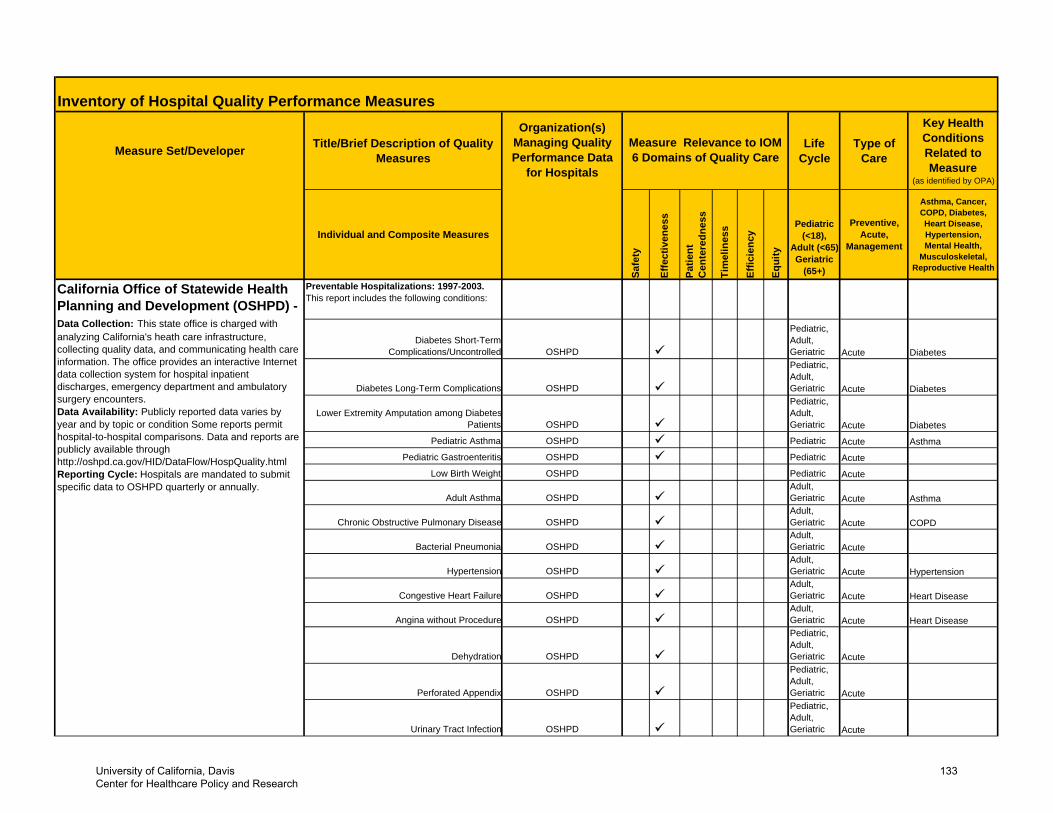
Inventory of Hospital Quality Performance Measures
Measure Set/Developer Title/Brief Description of Quality Measures
Life Cycle
Type of Care
Key Health Conditions Related to Measure
(as identified by OPA)
Individual and Composite Measures
Safe
ty
Effe
ctiv
enes
s
Patie
nt
Cen
tere
dnes
s
Tim
elin
ess
Effic
ienc
y
Equi
ty
Pediatric (<18),
Adult (<65) Geriatric
(65+)
Preventive, Acute,
Management
Asthma, Cancer, COPD, Diabetes, Heart Disease, Hypertension, Mental Health,
Musculoskeletal, Reproductive Health
Measure Relevance to IOM 6 Domains of Quality Care
Organization(s) Managing Quality Performance Data
for Hospitals
Preventable Hospitalizations: 1997-2003. This report includes the following conditions:
Diabetes Short-Term Complications/Uncontrolled OSHPD
Pediatric, Adult, Geriatric Acute Diabetes
Diabetes Long-Term Complications OSHPD
Pediatric, Adult, Geriatric Acute Diabetes
Lower Extremity Amputation among DiabetesPatients OSHPD
Pediatric, Adult, Geriatric Acute Diabetes
Pediatric Asthma OSHPD Pediatric Acute Asthma
Pediatric Gastroenteritis OSHPD Pediatric Acute
Low Birth Weight OSHPD Pediatric Acute
Adult Asthma OSHPDAdult, Geriatric Acute Asthma
Chronic Obstructive Pulmonary Disease OSHPDAdult, Geriatric Acute COPD
Bacterial Pneumonia OSHPDAdult, Geriatric Acute
Hypertension OSHPDAdult, Geriatric Acute Hypertension
Congestive Heart Failure OSHPDAdult, Geriatric Acute Heart Disease
Angina without Procedure OSHPDAdult, Geriatric Acute Heart Disease
Dehydration OSHPD
Pediatric, Adult, Geriatric Acute
Perforated Appendix OSHPD
Pediatric, Adult, Geriatric Acute
Urinary Tract Infection OSHPD
Pediatric, Adult, Geriatric Acute
California Office of Statewide Health Planning and Development (OSHPD) - Data Collection: This state office is charged with analyzing California's heath care infrastructure, collecting quality data, and communicating health care information. The office provides an interactive Internet data collection system for hospital inpatient discharges, emergency department and ambulatory surgery encounters. Data Availability: Publicly reported data varies by year and by topic or condition Some reports permit hospital-to-hospital comparisons. Data and reports are publicly available through http://oshpd.ca.gov/HID/DataFlow/HospQuality.htmlReporting Cycle: Hospitals are mandated to submit specific data to OSHPD quarterly or annually.
University of California, Davis Center for Healthcare Policy and Research
133
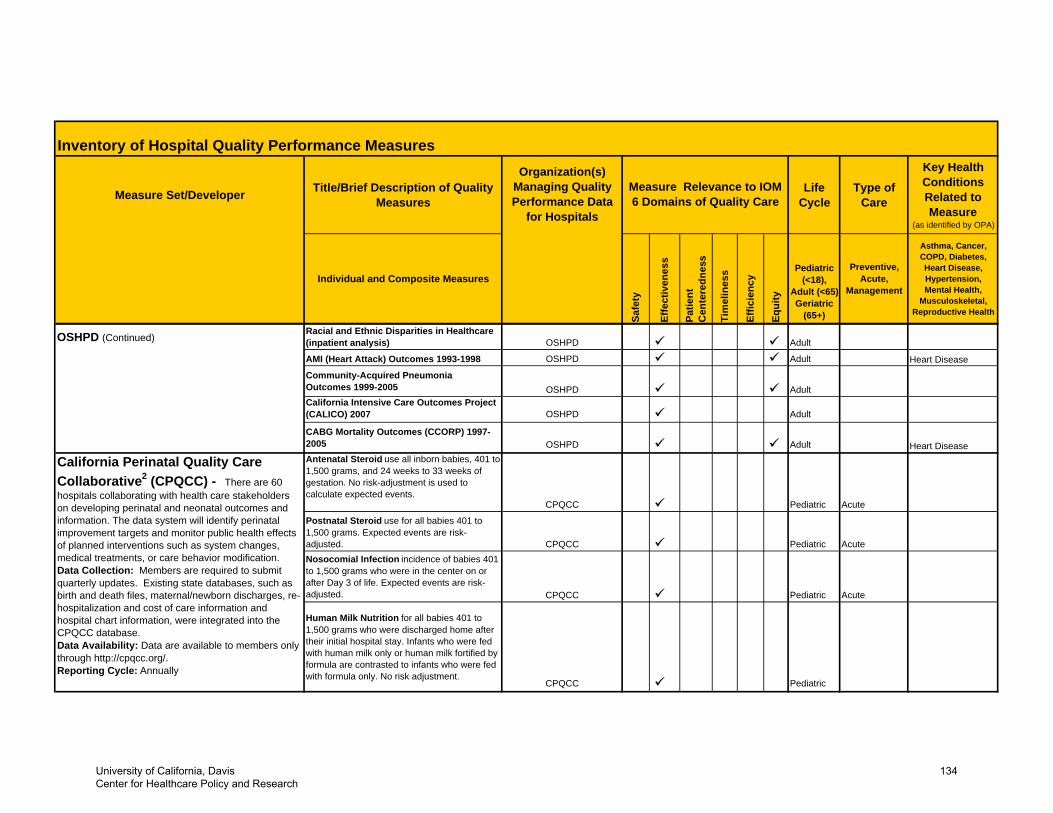
Inventory of Hospital Quality Performance Measures
Measure Set/Developer Title/Brief Description of Quality Measures
Life Cycle
Type of Care
Key Health Conditions Related to Measure
(as identified by OPA)
Individual and Composite Measures
Safe
ty
Effe
ctiv
enes
s
Patie
nt
Cen
tere
dnes
s
Tim
elin
ess
Effic
ienc
y
Equi
ty
Pediatric (<18),
Adult (<65) Geriatric
(65+)
Preventive, Acute,
Management
Asthma, Cancer, COPD, Diabetes, Heart Disease, Hypertension, Mental Health,
Musculoskeletal, Reproductive Health
Measure Relevance to IOM 6 Domains of Quality Care
Organization(s) Managing Quality Performance Data
for Hospitals
OSHPD (Continued)Racial and Ethnic Disparities in Healthcare (inpatient analysis) OSHPD Adult
AMI (Heart Attack) Outcomes 1993-1998 OSHPD Adult Heart Disease
Community-Acquired Pneumonia Outcomes 1999-2005 OSHPD AdultCalifornia Intensive Care Outcomes Project (CALICO) 2007 OSHPD Adult
CABG Mortality Outcomes (CCORP) 1997-2005 OSHPD Adult Heart DiseaseAntenatal Steroid use all inborn babies, 401 to 1,500 grams, and 24 weeks to 33 weeks of gestation. No risk-adjustment is used to calculate expected events.
CPQCC Pediatric Acute
Postnatal Steroid use for all babies 401 to 1,500 grams. Expected events are risk-adjusted. CPQCC Pediatric AcuteNosocomial Infection incidence of babies 401 to 1,500 grams who were in the center on or after Day 3 of life. Expected events are risk-adjusted. CPQCC Pediatric Acute
Human Milk Nutrition for all babies 401 to 1,500 grams who were discharged home after their initial hospital stay. Infants who were fed with human milk only or human milk fortified by formula are contrasted to infants who were fed with formula only. No risk adjustment.
CPQCC Pediatric
California Perinatal Quality Care Collaborative2 (CPQCC) - There are 60 hospitals collaborating with health care stakeholders on developing perinatal and neonatal outcomes and information. The data system will identify perinatal improvement targets and monitor public health effects of planned interventions such as system changes, medical treatments, or care behavior modification.Data Collection: Members are required to submit quarterly updates. Existing state databases, such as birth and death files, maternal/newborn discharges, re-hospitalization and cost of care information and hospital chart information, were integrated into the CPQCC database.Data Availability: Data are available to members only through http://cpqcc.org/.Reporting Cycle: Annually
University of California, Davis Center for Healthcare Policy and Research
134
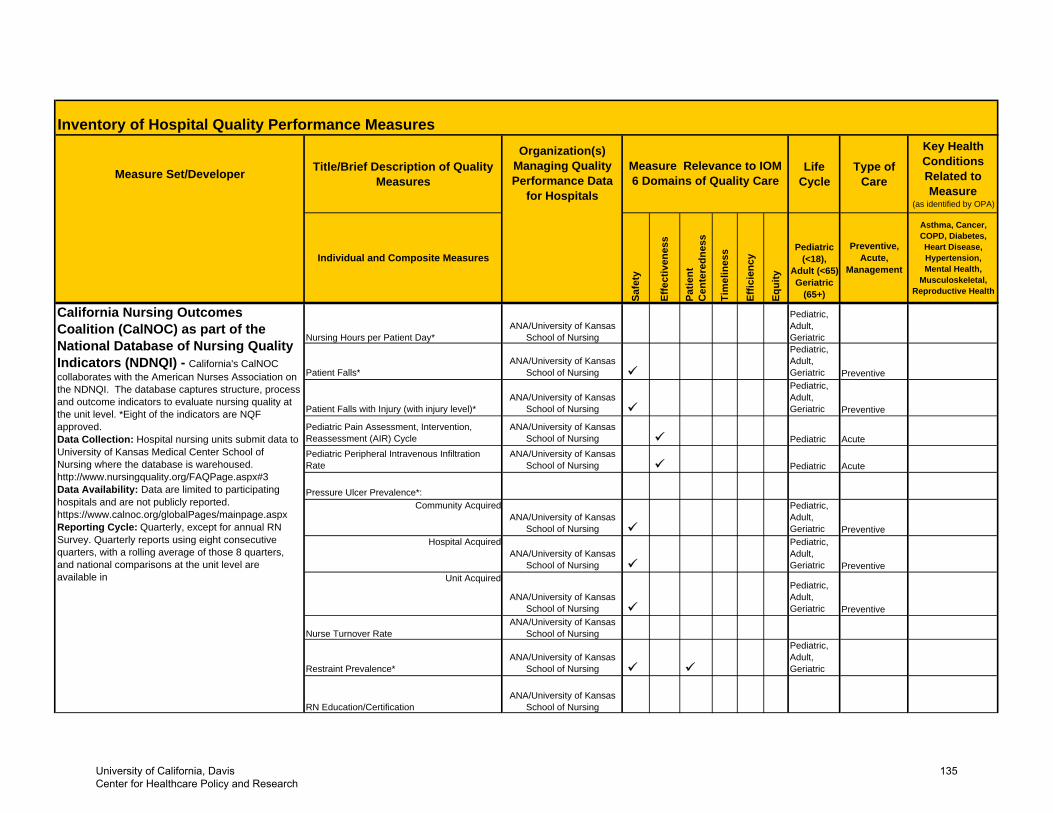
Inventory of Hospital Quality Performance Measures
Measure Set/Developer Title/Brief Description of Quality Measures
Life Cycle
Type of Care
Key Health Conditions Related to Measure
(as identified by OPA)
Individual and Composite Measures
Safe
ty
Effe
ctiv
enes
s
Patie
nt
Cen
tere
dnes
s
Tim
elin
ess
Effic
ienc
y
Equi
ty
Pediatric (<18),
Adult (<65) Geriatric
(65+)
Preventive, Acute,
Management
Asthma, Cancer, COPD, Diabetes, Heart Disease, Hypertension, Mental Health,
Musculoskeletal, Reproductive Health
Measure Relevance to IOM 6 Domains of Quality Care
Organization(s) Managing Quality Performance Data
for Hospitals
Nursing Hours per Patient Day*ANA/University of Kansas
School of Nursing
Pediatric,Adult,Geriatric
Patient Falls*ANA/University of Kansas
School of Nursing
Pediatric,Adult,Geriatric Preventive
Patient Falls with Injury (with injury level)*ANA/University of Kansas
School of Nursing
Pediatric,Adult,Geriatric Preventive
Pediatric Pain Assessment, Intervention, Reassessment (AIR) Cycle
ANA/University of Kansas School of Nursing Pediatric Acute
Pediatric Peripheral Intravenous Infiltration Rate
ANA/University of Kansas School of Nursing Pediatric Acute
Pressure Ulcer Prevalence*:Community Acquired
ANA/University of Kansas School of Nursing
Pediatric,Adult,Geriatric Preventive
Hospital AcquiredANA/University of Kansas
School of Nursing
Pediatric,Adult,Geriatric Preventive
Unit Acquired
ANA/University of Kansas School of Nursing
Pediatric,Adult,Geriatric Preventive
Nurse Turnover RateANA/University of Kansas
School of Nursing
Restraint Prevalence*ANA/University of Kansas
School of Nursing
Pediatric,Adult,Geriatric
RN Education/CertificationANA/University of Kansas
School of Nursing
California Nursing Outcomes Coalition (CalNOC) as part of the National Database of Nursing Quality Indicators (NDNQI) - California's CalNOC collaborates with the American Nurses Association on the NDNQI. The database captures structure, process and outcome indicators to evaluate nursing quality at the unit level. *Eight of the indicators are NQF approved. Data Collection: Hospital nursing units submit data to University of Kansas Medical Center School of Nursing where the database is warehoused. http://www.nursingquality.org/FAQPage.aspx#3 Data Availability: Data are limited to participating hospitals and are not publicly reported. https://www.calnoc.org/globalPages/mainpage.aspxReporting Cycle: Quarterly, except for annual RN Survey. Quarterly reports using eight consecutive quarters, with a rolling average of those 8 quarters, and national comparisons at the unit level are available in
University of California, Davis Center for Healthcare Policy and Research
135
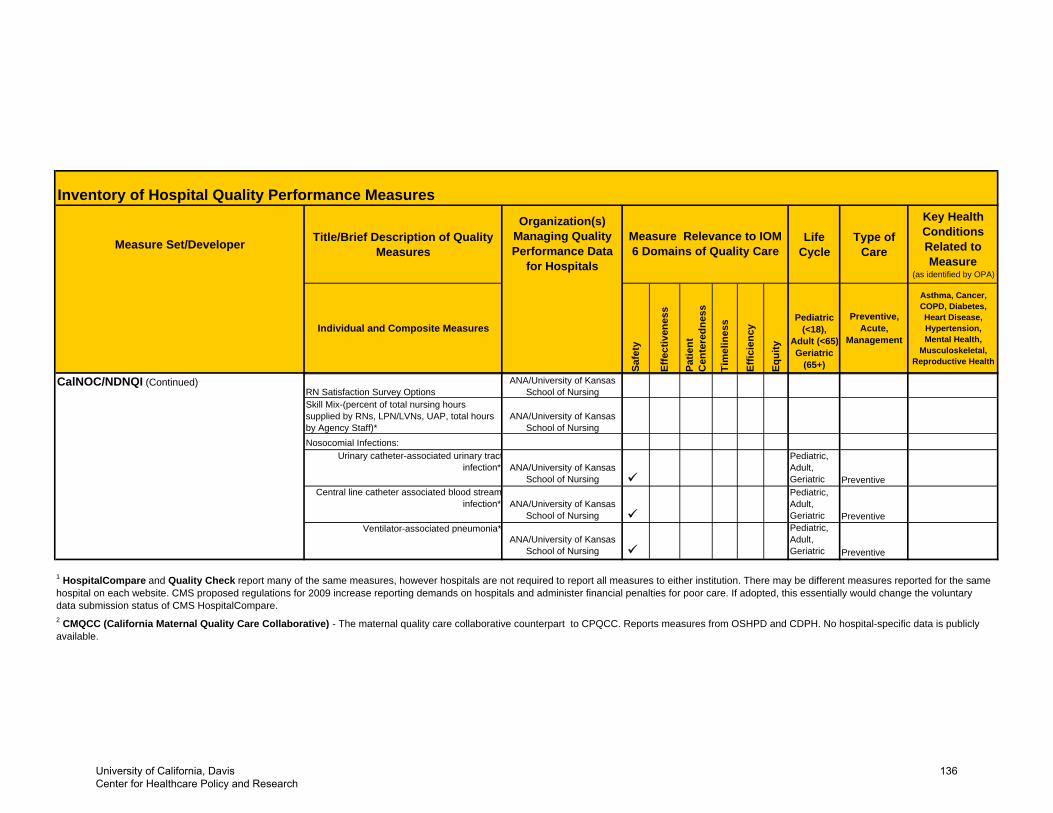
Inventory of Hospital Quality Performance Measures
Measure Set/Developer Title/Brief Description of Quality Measures
Life Cycle
Type of Care
Key Health Conditions Related to Measure
(as identified by OPA)
Individual and Composite Measures
Safe
ty
Effe
ctiv
enes
s
Patie
nt
Cen
tere
dnes
s
Tim
elin
ess
Effic
ienc
y
Equi
ty
Pediatric (<18),
Adult (<65) Geriatric
(65+)
Preventive, Acute,
Management
Asthma, Cancer, COPD, Diabetes, Heart Disease, Hypertension, Mental Health,
Musculoskeletal, Reproductive Health
Measure Relevance to IOM 6 Domains of Quality Care
Organization(s) Managing Quality Performance Data
for Hospitals
CalNOC/NDNQI (Continued)RN Satisfaction Survey Options
ANA/University of Kansas School of Nursing
Skill Mix-(percent of total nursing hours supplied by RNs, LPN/LVNs, UAP, total hours by Agency Staff)*
ANA/University of Kansas School of Nursing
Nosocomial Infections:Urinary catheter-associated urinary tract
infection* ANA/University of Kansas School of Nursing
Pediatric,Adult,Geriatric Preventive
Central line catheter associated blood streaminfection* ANA/University of Kansas
School of Nursing
Pediatric,Adult,Geriatric Preventive
Ventilator-associated pneumonia*ANA/University of Kansas
School of Nursing
Pediatric,Adult,Geriatric Preventive
2 CMQCC (California Maternal Quality Care Collaborative) - The maternal quality care collaborative counterpart to CPQCC. Reports measures from OSHPD and CDPH. No hospital-specific data is publicly available.
1 HospitalCompare and Quality Check report many of the same measures, however hospitals are not required to report all measures to either institution. There may be different measures reported for the same hospital on each website. CMS proposed regulations for 2009 increase reporting demands on hospitals and administer financial penalties for poor care. If adopted, this essentially would change the voluntary data submission status of CMS HospitalCompare.
University of California, Davis Center for Healthcare Policy and Research
136
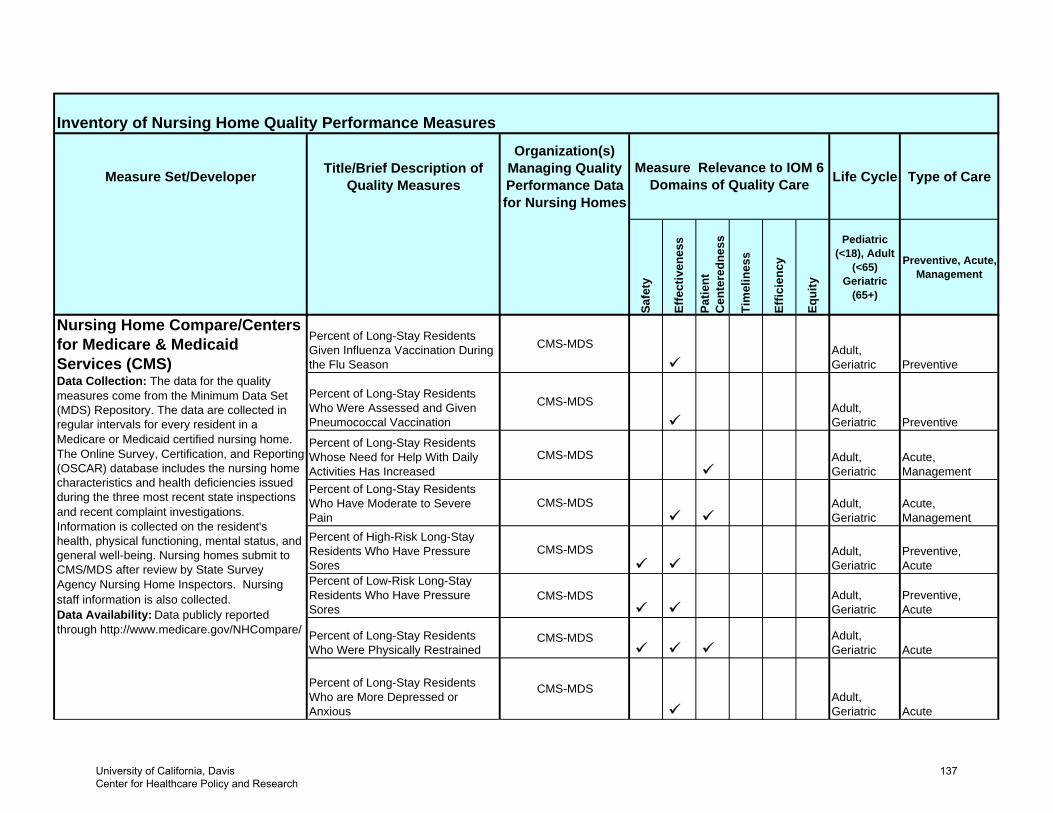
Inventory of Nursing Home Quality Performance Measures
Measure Set/Developer Title/Brief Description of Quality Measures
Organization(s) Managing Quality Performance Data for Nursing Homes
Life Cycle Type of Care
Safe
ty
Effe
ctiv
enes
s
Patie
nt
Cen
tere
dnes
s
Tim
elin
ess
Effic
ienc
y
Equi
ty
Pediatric (<18), Adult
(<65) Geriatric
(65+)
Preventive, Acute, Management
Percent of Long-Stay Residents Given Influenza Vaccination During the Flu Season
CMS-MDS Adult,Geriatric Preventive
Percent of Long-Stay Residents Who Were Assessed and Given Pneumococcal Vaccination
CMS-MDS Adult,Geriatric Preventive
Percent of Long-Stay Residents Whose Need for Help With Daily Activities Has Increased
CMS-MDS Adult,Geriatric
Acute, Management
Percent of Long-Stay Residents Who Have Moderate to Severe Pain
CMS-MDS Adult,Geriatric
Acute, Management
Percent of High-Risk Long-Stay Residents Who Have Pressure Sores
CMS-MDS Adult,Geriatric
Preventive, Acute
Percent of Low-Risk Long-Stay Residents Who Have Pressure Sores
CMS-MDS Adult,Geriatric
Preventive, Acute
Percent of Long-Stay Residents Who Were Physically Restrained
CMS-MDS Adult,Geriatric Acute
Percent of Long-Stay Residents Who are More Depressed or Anxious
CMS-MDSAdult,Geriatric Acute
Measure Relevance to IOM 6 Domains of Quality Care
Nursing Home Compare/Centers for Medicare & Medicaid Services (CMS) Data Collection: The data for the quality measures come from the Minimum Data Set (MDS) Repository. The data are collected in regular intervals for every resident in a Medicare or Medicaid certified nursing home. The Online Survey, Certification, and Reporting (OSCAR) database includes the nursing home characteristics and health deficiencies issued during the three most recent state inspections and recent complaint investigations. Information is collected on the resident's health, physical functioning, mental status, and general well-being. Nursing homes submit to CMS/MDS after review by State Survey Agency Nursing Home Inspectors. Nursing staff information is also collected.Data Availability: Data publicly reported through http://www.medicare.gov/NHCompare/
University of California, Davis Center for Healthcare Policy and Research
137
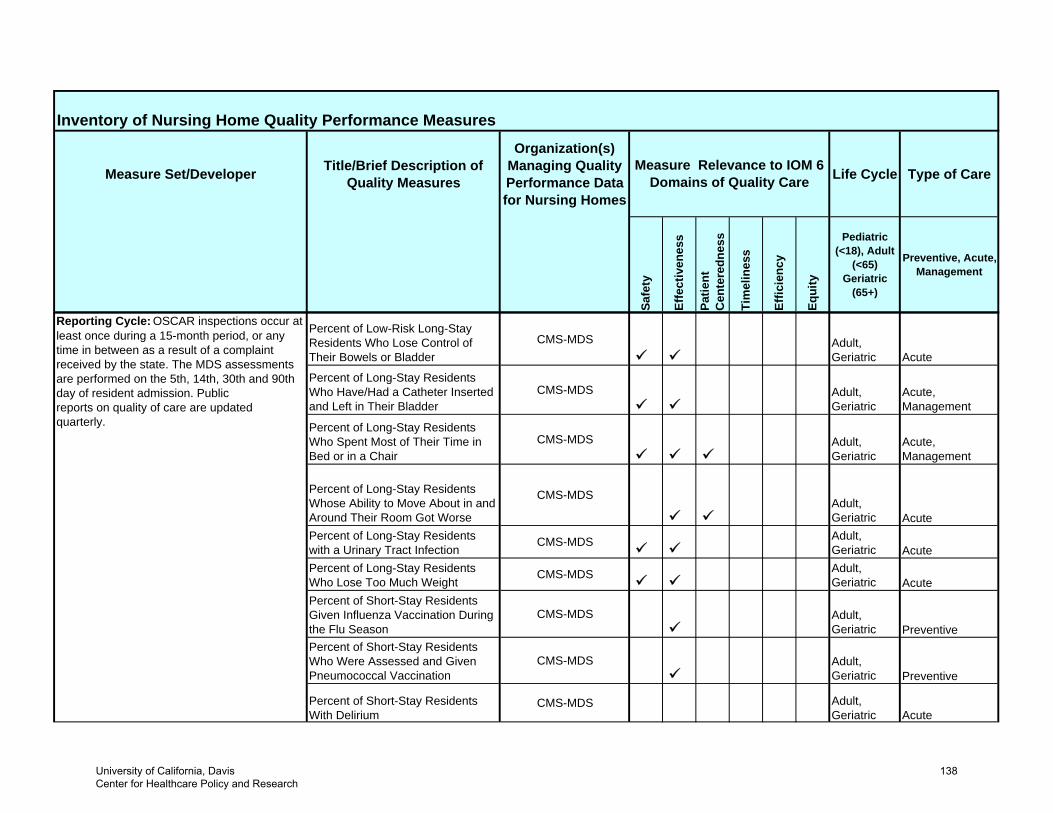
Inventory of Nursing Home Quality Performance Measures
Measure Set/Developer Title/Brief Description of Quality Measures
Organization(s) Managing Quality Performance Data for Nursing Homes
Life Cycle Type of Care
Safe
ty
Effe
ctiv
enes
s
Patie
nt
Cen
tere
dnes
s
Tim
elin
ess
Effic
ienc
y
Equi
ty
Pediatric (<18), Adult
(<65) Geriatric
(65+)
Preventive, Acute, Management
Measure Relevance to IOM 6 Domains of Quality Care
Percent of Low-Risk Long-Stay Residents Who Lose Control of Their Bowels or Bladder
CMS-MDS Adult,Geriatric Acute
Percent of Long-Stay Residents Who Have/Had a Catheter Inserted and Left in Their Bladder
CMS-MDS Adult,Geriatric
Acute,Management
Percent of Long-Stay Residents Who Spent Most of Their Time in Bed or in a Chair
CMS-MDS Adult,Geriatric
Acute,Management
Percent of Long-Stay Residents Whose Ability to Move About in and Around Their Room Got Worse
CMS-MDSAdult,Geriatric Acute
Percent of Long-Stay Residents with a Urinary Tract Infection
CMS-MDS Adult,Geriatric Acute
Percent of Long-Stay Residents Who Lose Too Much Weight
CMS-MDS Adult,Geriatric Acute
Percent of Short-Stay Residents Given Influenza Vaccination During the Flu Season
CMS-MDS Adult,Geriatric Preventive
Percent of Short-Stay Residents Who Were Assessed and Given Pneumococcal Vaccination
CMS-MDS Adult,Geriatric Preventive
Percent of Short-Stay Residents With Delirium
CMS-MDS Adult,Geriatric Acute
Reporting Cycle: OSCAR inspections occur at least once during a 15-month period, or any time in between as a result of a complaint received by the state. The MDS assessments are performed on the 5th, 14th, 30th and 90th day of resident admission. Public reports on quality of care are updated quarterly.
University of California, Davis Center for Healthcare Policy and Research
138
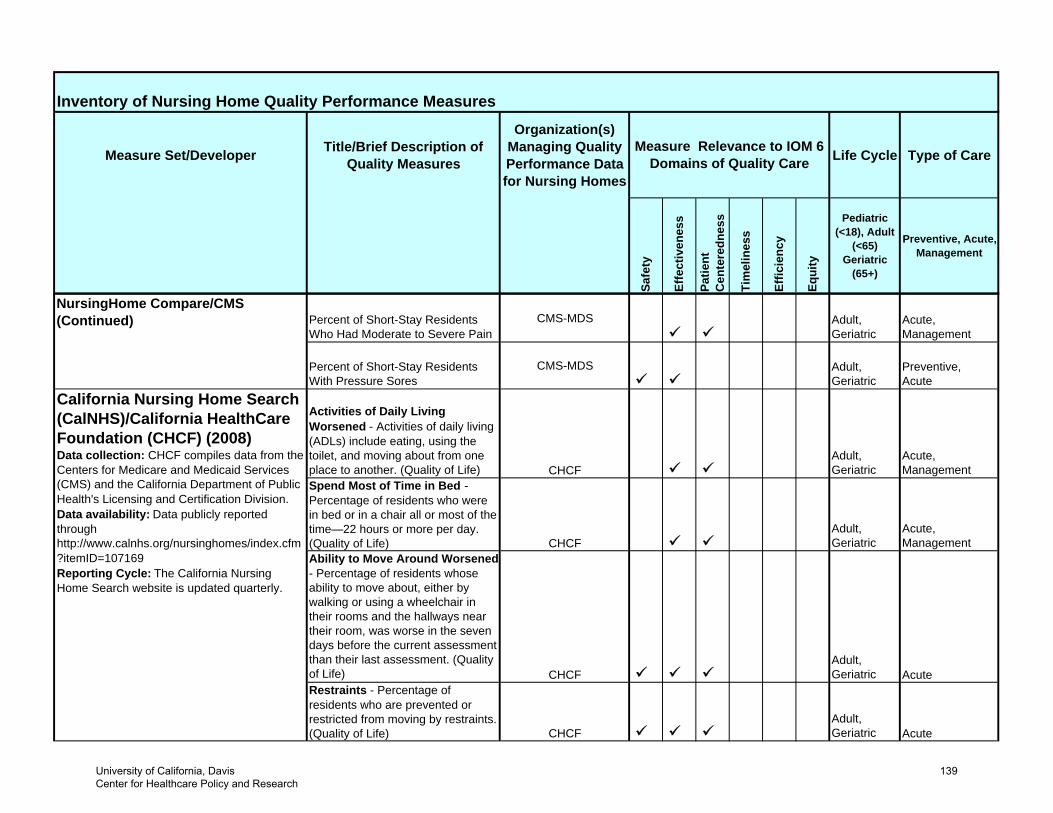
Inventory of Nursing Home Quality Performance Measures
Measure Set/Developer Title/Brief Description of Quality Measures
Organization(s) Managing Quality Performance Data for Nursing Homes
Life Cycle Type of Care
Safe
ty
Effe
ctiv
enes
s
Patie
nt
Cen
tere
dnes
s
Tim
elin
ess
Effic
ienc
y
Equi
ty
Pediatric (<18), Adult
(<65) Geriatric
(65+)
Preventive, Acute, Management
Measure Relevance to IOM 6 Domains of Quality Care
NursingHome Compare/CMS (Continued) Percent of Short-Stay Residents
Who Had Moderate to Severe PainCMS-MDS Adult,
GeriatricAcute, Management
Percent of Short-Stay Residents With Pressure Sores
CMS-MDS Adult,Geriatric
Preventive,Acute
Activities of Daily Living Worsened - Activities of daily living (ADLs) include eating, using the toilet, and moving about from one place to another. (Quality of Life) CHCF
Adult,Geriatric
Acute,Management
Spend Most of Time in Bed -Percentage of residents who were in bed or in a chair all or most of the time—22 hours or more per day. (Quality of Life) CHCF
Adult,Geriatric
Acute,Management
Ability to Move Around Worsened - Percentage of residents whose ability to move about, either by walking or using a wheelchair in their rooms and the hallways near their room, was worse in the seven days before the current assessment than their last assessment. (Quality of Life) CHCF
Adult,Geriatric Acute
Restraints - Percentage of residents who are prevented or restricted from moving by restraints. (Quality of Life) CHCF
Adult,Geriatric Acute
California Nursing Home Search (CalNHS)/California HealthCare Foundation (CHCF) (2008)Data collection: CHCF compiles data from the Centers for Medicare and Medicaid Services (CMS) and the California Department of Public Health's Licensing and Certification Division. Data availability: Data publicly reported through http://www.calnhs.org/nursinghomes/index.cfm?itemID=107169Reporting Cycle: The California Nursing Home Search website is updated quarterly.
University of California, Davis Center for Healthcare Policy and Research
139
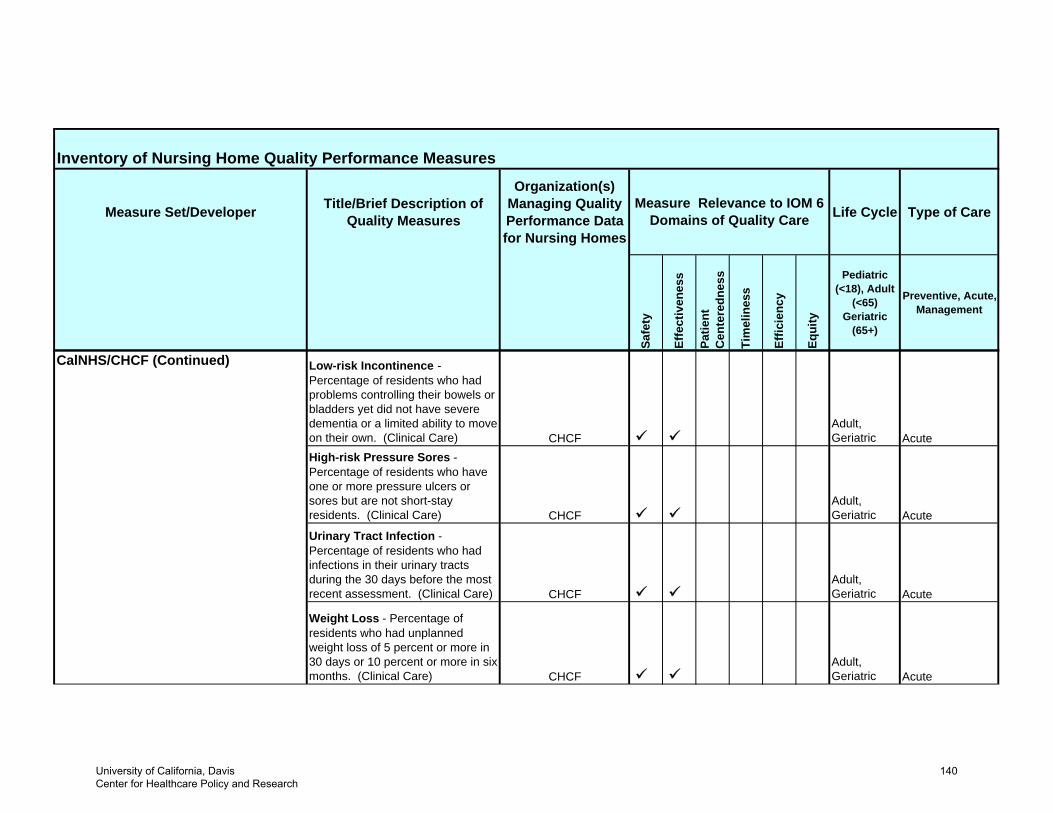
Inventory of Nursing Home Quality Performance Measures
Measure Set/Developer Title/Brief Description of Quality Measures
Organization(s) Managing Quality Performance Data for Nursing Homes
Life Cycle Type of Care
Safe
ty
Effe
ctiv
enes
s
Patie
nt
Cen
tere
dnes
s
Tim
elin
ess
Effic
ienc
y
Equi
ty
Pediatric (<18), Adult
(<65) Geriatric
(65+)
Preventive, Acute, Management
Measure Relevance to IOM 6 Domains of Quality Care
CalNHS/CHCF (Continued) Low-risk Incontinence - Percentage of residents who had problems controlling their bowels or bladders yet did not have severe dementia or a limited ability to move on their own. (Clinical Care) CHCF
Adult,Geriatric Acute
High-risk Pressure Sores - Percentage of residents who have one or more pressure ulcers or sores but are not short-stay residents. (Clinical Care) CHCF
Adult,Geriatric Acute
Urinary Tract Infection - Percentage of residents who had infections in their urinary tracts during the 30 days before the most recent assessment. (Clinical Care) CHCF
Adult,Geriatric Acute
Weight Loss - Percentage of residents who had unplanned weight loss of 5 percent or more in 30 days or 10 percent or more in six months. (Clinical Care) CHCF
Adult,Geriatric Acute
University of California, Davis Center for Healthcare Policy and Research
140
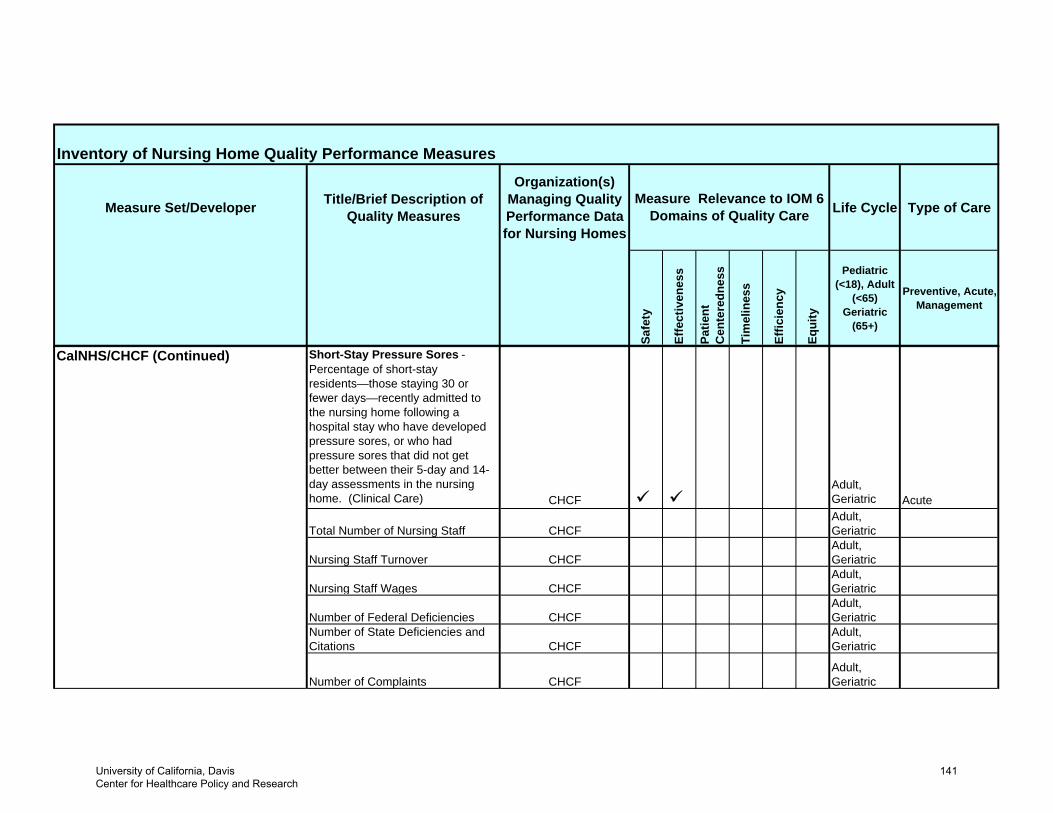
Inventory of Nursing Home Quality Performance Measures
Measure Set/Developer Title/Brief Description of Quality Measures
Organization(s) Managing Quality Performance Data for Nursing Homes
Life Cycle Type of Care
Safe
ty
Effe
ctiv
enes
s
Patie
nt
Cen
tere
dnes
s
Tim
elin
ess
Effic
ienc
y
Equi
ty
Pediatric (<18), Adult
(<65) Geriatric
(65+)
Preventive, Acute, Management
Measure Relevance to IOM 6 Domains of Quality Care
CalNHS/CHCF (Continued) Short-Stay Pressure Sores - Percentage of short-stay residents—those staying 30 or fewer days—recently admitted to the nursing home following a hospital stay who have developed pressure sores, or who had pressure sores that did not get better between their 5-day and 14-day assessments in the nursing home. (Clinical Care) CHCF
Adult,Geriatric Acute
Total Number of Nursing Staff CHCFAdult,Geriatric
Nursing Staff Turnover CHCFAdult,Geriatric
Nursing Staff Wages CHCFAdult,Geriatric
Number of Federal Deficiencies CHCFAdult,Geriatric
Number of State Deficiencies and Citations CHCF
Adult,Geriatric
Number of Complaints CHCFAdult,Geriatric
University of California, Davis Center for Healthcare Policy and Research
141
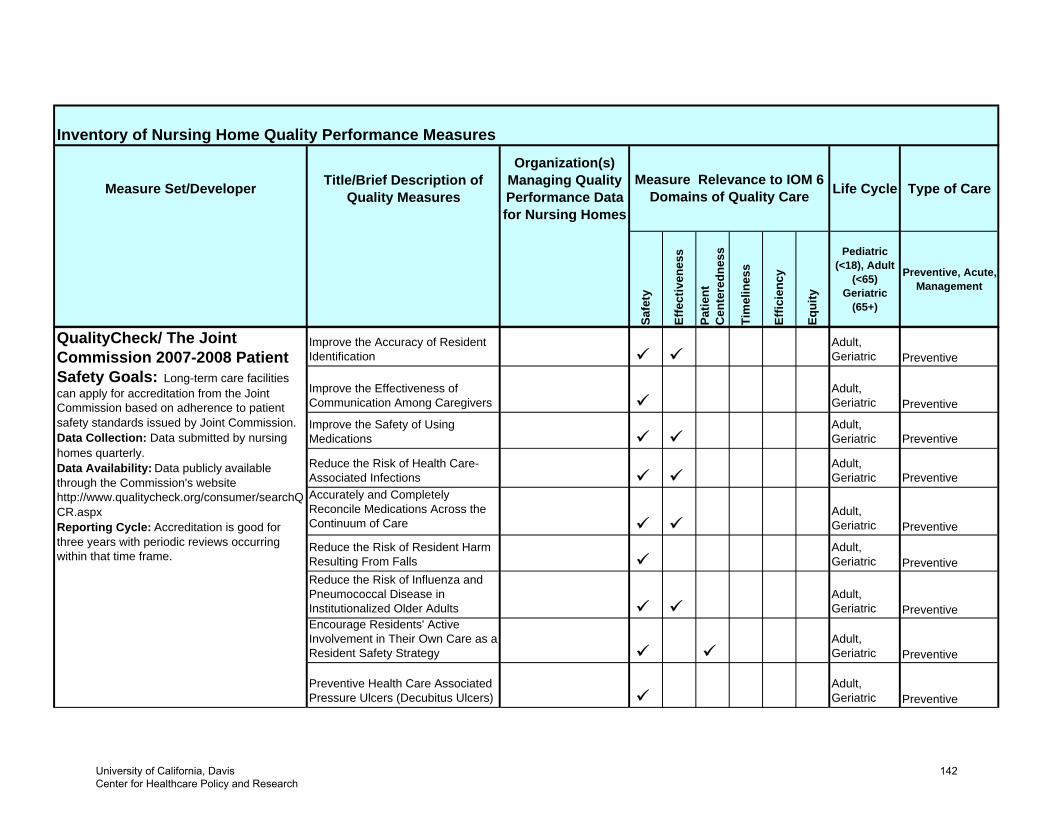
Inventory of Nursing Home Quality Performance Measures
Measure Set/Developer Title/Brief Description of Quality Measures
Organization(s) Managing Quality Performance Data for Nursing Homes
Life Cycle Type of Care
Safe
ty
Effe
ctiv
enes
s
Patie
nt
Cen
tere
dnes
s
Tim
elin
ess
Effic
ienc
y
Equi
ty
Pediatric (<18), Adult
(<65) Geriatric
(65+)
Preventive, Acute, Management
Measure Relevance to IOM 6 Domains of Quality Care
Improve the Accuracy of Resident Identification
Adult,Geriatric Preventive
Improve the Effectiveness of Communication Among Caregivers
Adult,Geriatric Preventive
Improve the Safety of Using Medications
Adult,Geriatric Preventive
Reduce the Risk of Health Care-Associated Infections
Adult,Geriatric Preventive
Accurately and Completely Reconcile Medications Across the Continuum of Care
Adult,Geriatric Preventive
Reduce the Risk of Resident Harm Resulting From Falls
Adult,Geriatric Preventive
Reduce the Risk of Influenza and Pneumococcal Disease in Institutionalized Older Adults
Adult,Geriatric Preventive
Encourage Residents' Active Involvement in Their Own Care as a Resident Safety Strategy
Adult,Geriatric Preventive
Preventive Health Care Associated Pressure Ulcers (Decubitus Ulcers)
Adult,Geriatric Preventive
QualityCheck/ The Joint Commission 2007-2008 Patient Safety Goals: Long-term care facilities can apply for accreditation from the Joint Commission based on adherence to patient safety standards issued by Joint Commission. Data Collection: Data submitted by nursing homes quarterly. Data Availability: Data publicly available through the Commission's website http://www.qualitycheck.org/consumer/searchQCR.aspx Reporting Cycle: Accreditation is good for three years with periodic reviews occurring within that time frame.
University of California, Davis Center for Healthcare Policy and Research
142
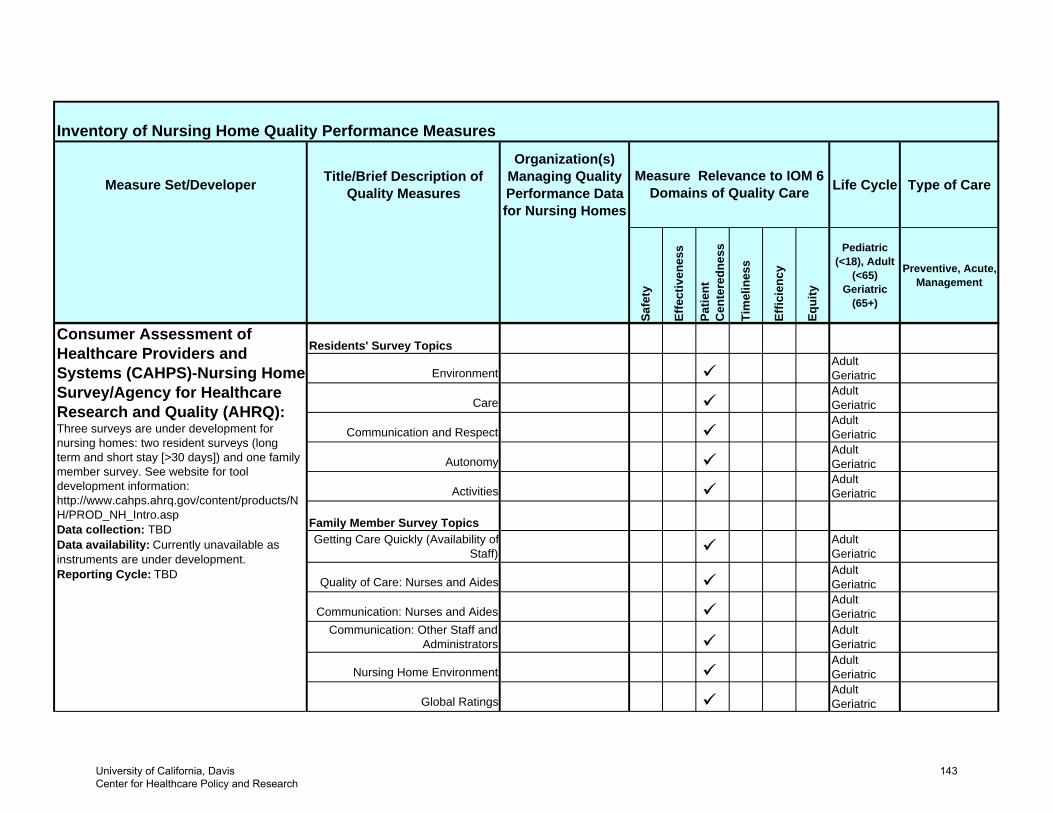
Inventory of Nursing Home Quality Performance Measures
Measure Set/Developer Title/Brief Description of Quality Measures
Organization(s) Managing Quality Performance Data for Nursing Homes
Life Cycle Type of Care
Safe
ty
Effe
ctiv
enes
s
Patie
nt
Cen
tere
dnes
s
Tim
elin
ess
Effic
ienc
y
Equi
ty
Pediatric (<18), Adult
(<65) Geriatric
(65+)
Preventive, Acute, Management
Measure Relevance to IOM 6 Domains of Quality Care
Residents' Survey Topics
EnvironmentAdultGeriatric
CareAdultGeriatric
Communication and RespectAdultGeriatric
AutonomyAdultGeriatric
ActivitiesAdultGeriatric
Family Member Survey TopicsGetting Care Quickly (Availability of
Staff)AdultGeriatric
Quality of Care: Nurses and AidesAdultGeriatric
Communication: Nurses and AidesAdultGeriatric
Communication: Other Staff and Administrators
AdultGeriatric
Nursing Home EnvironmentAdultGeriatric
Global RatingsAdultGeriatric
Consumer Assessment of Healthcare Providers and Systems (CAHPS)-Nursing Home Survey/Agency for Healthcare Research and Quality (AHRQ): Three surveys are under development for nursing homes: two resident surveys (long term and short stay [>30 days]) and one family member survey. See website for tool development information: http://www.cahps.ahrq.gov/content/products/NH/PROD_NH_Intro.aspData collection: TBD Data availability: Currently unavailable as instruments are under development. Reporting Cycle: TBD
University of California, Davis Center for Healthcare Policy and Research
143
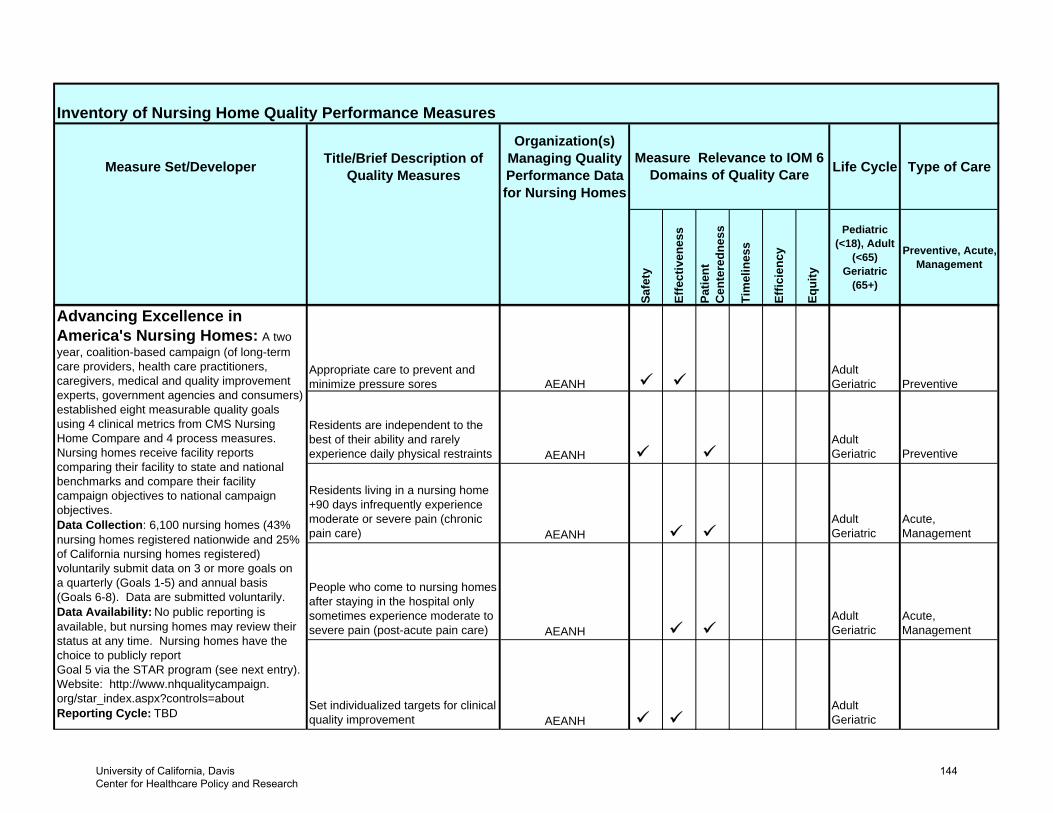
Inventory of Nursing Home Quality Performance Measures
Measure Set/Developer Title/Brief Description of Quality Measures
Organization(s) Managing Quality Performance Data for Nursing Homes
Life Cycle Type of Care
Safe
ty
Effe
ctiv
enes
s
Patie
nt
Cen
tere
dnes
s
Tim
elin
ess
Effic
ienc
y
Equi
ty
Pediatric (<18), Adult
(<65) Geriatric
(65+)
Preventive, Acute, Management
Measure Relevance to IOM 6 Domains of Quality Care
Residents are independent to the best of their ability and rarely experience daily physical restraints AEANH
AdultGeriatric Preventive
Residents living in a nursing home +90 days infrequently experience moderate or severe pain (chronic pain care) AEANH
AdultGeriatric
Acute,Management
People who come to nursing homes after staying in the hospital only sometimes experience moderate to severe pain (post-acute pain care) AEANH
AdultGeriatric
Acute,Management
Set individualized targets for clinical quality improvement AEANH
AdultGeriatric
AEANHAppropriate care to prevent and minimize pressure sores
Advancing Excellence in America's Nursing Homes: A two year, coalition-based campaign (of long-term care providers, health care practitioners, caregivers, medical and quality improvement experts, government agencies and consumers) established eight measurable quality goals using 4 clinical metrics from CMS Nursing Home Compare and 4 process measures. Nursing homes receive facility reports comparing their facility to state and national benchmarks and compare their facility campaign objectives to national campaign objectives. Data Collection: 6,100 nursing homes (43% nursing homes registered nationwide and 25% of California nursing homes registered) voluntarily submit data on 3 or more goals on a quarterly (Goals 1-5) and annual basis (Goals 6-8). Data are submitted voluntarily.Data Availability: No public reporting is available, but nursing homes may review their status at any time. Nursing homes have the choice to publicly report Goal 5 via the STAR program (see next entry). Website: http://www.nhqualitycampaign.org/star_index.aspx?controls=aboutReporting Cycle: TBD
PreventiveAdultGeriatric
University of California, Davis Center for Healthcare Policy and Research
144
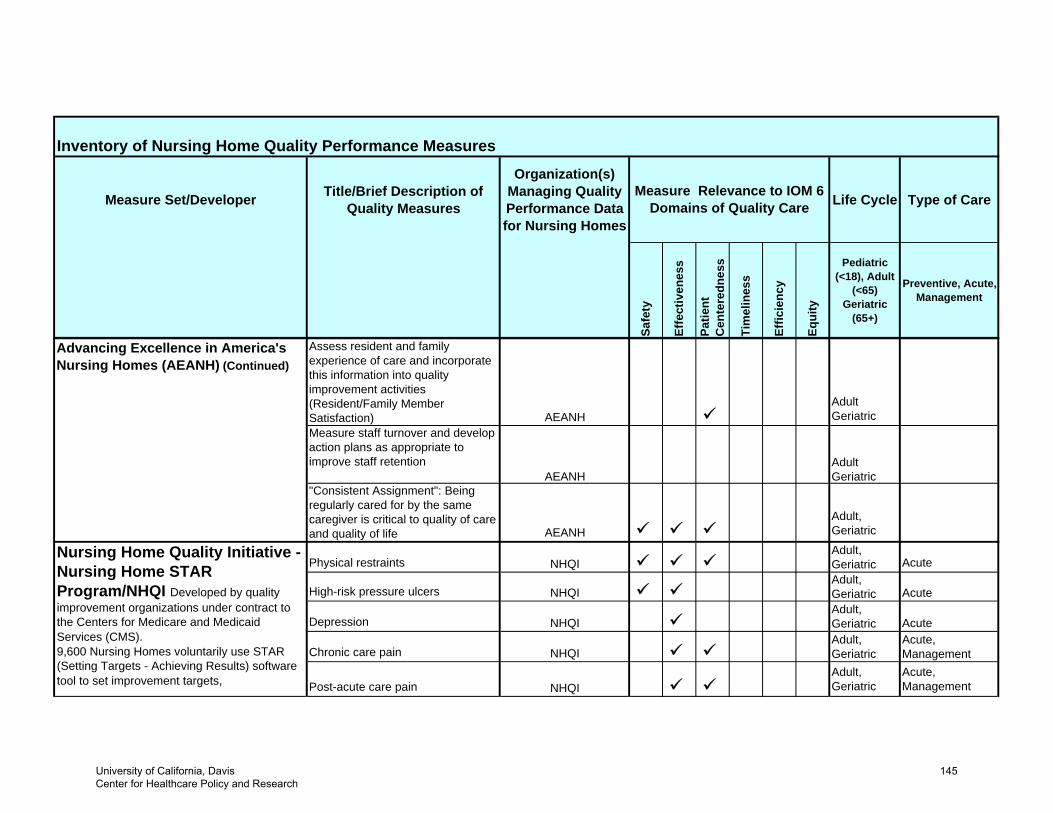
Inventory of Nursing Home Quality Performance Measures
Measure Set/Developer Title/Brief Description of Quality Measures
Organization(s) Managing Quality Performance Data for Nursing Homes
Life Cycle Type of Care
Safe
ty
Effe
ctiv
enes
s
Patie
nt
Cen
tere
dnes
s
Tim
elin
ess
Effic
ienc
y
Equi
ty
Pediatric (<18), Adult
(<65) Geriatric
(65+)
Preventive, Acute, Management
Measure Relevance to IOM 6 Domains of Quality Care
Assess resident and family experience of care and incorporate this information into quality improvement activities (Resident/Family Member Satisfaction) AEANH
AdultGeriatric
Measure staff turnover and develop action plans as appropriate to improve staff retention
AEANHAdultGeriatric
"Consistent Assignment": Being regularly cared for by the same caregiver is critical to quality of care and quality of life AEANH
Adult,Geriatric
Physical restraints NHQIAdult,Geriatric Acute
High-risk pressure ulcers NHQIAdult,Geriatric Acute
Depression NHQIAdult,Geriatric Acute
Chronic care pain NHQIAdult,Geriatric
Acute,Management
Post-acute care pain NHQIAdult,Geriatric
Acute,Management
Nursing Home Quality Initiative - Nursing Home STAR Program/NHQI Developed by quality improvement organizations under contract to the Centers for Medicare and Medicaid Services (CMS).9,600 Nursing Homes voluntarily use STAR (Setting Targets - Achieving Results) software tool to set improvement targets,
Advancing Excellence in America's Nursing Homes (AEANH) (Continued)
University of California, Davis Center for Healthcare Policy and Research
145
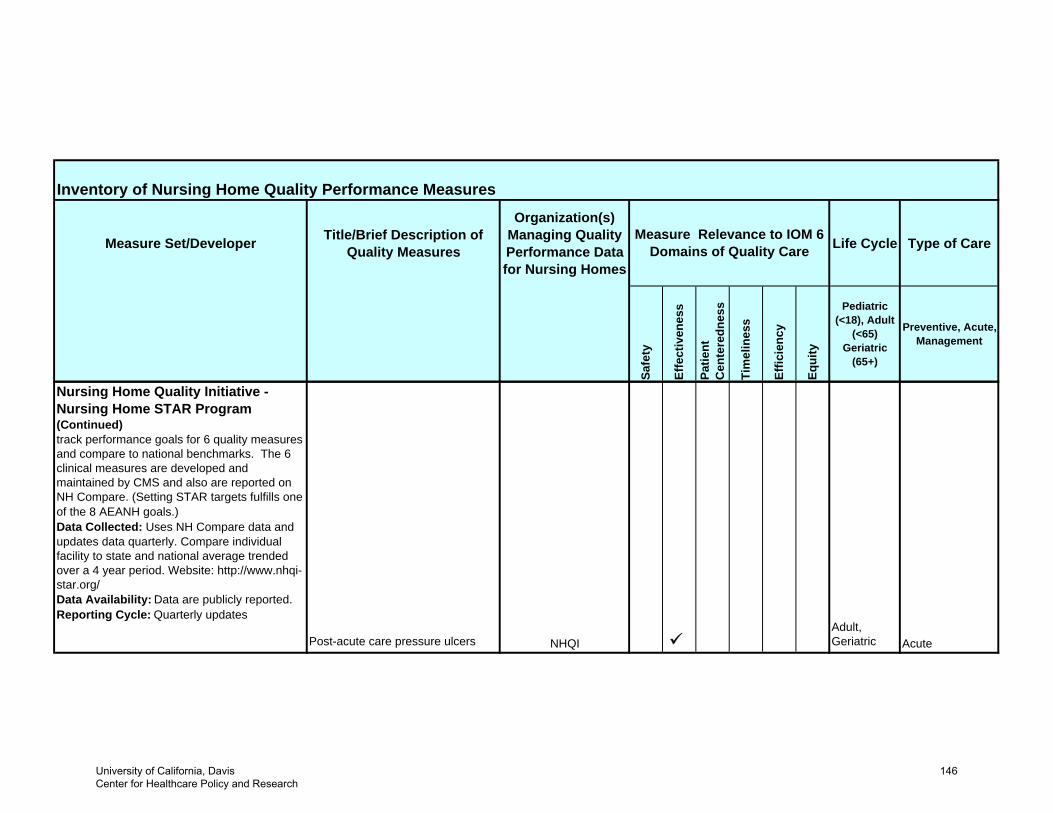
Inventory of Nursing Home Quality Performance Measures
Measure Set/Developer Title/Brief Description of Quality Measures
Organization(s) Managing Quality Performance Data for Nursing Homes
Life Cycle Type of Care
Safe
ty
Effe
ctiv
enes
s
Patie
nt
Cen
tere
dnes
s
Tim
elin
ess
Effic
ienc
y
Equi
ty
Pediatric (<18), Adult
(<65) Geriatric
(65+)
Preventive, Acute, Management
Measure Relevance to IOM 6 Domains of Quality Care
Nursing Home Quality Initiative - Nursing Home STAR Program (Continued) track performance goals for 6 quality measures and compare to national benchmarks. The 6 clinical measures are developed and maintained by CMS and also are reported on NH Compare. (Setting STAR targets fulfills one of the 8 AEANH goals.) Data Collected: Uses NH Compare data and updates data quarterly. Compare individual facility to state and national average trended over a 4 year period. Website: http://www.nhqi-star.org/ Data Availability: Data are publicly reported.Reporting Cycle: Quarterly updates
Post-acute care pressure ulcers NHQIAdult,Geriatric Acute
University of California, Davis Center for Healthcare Policy and Research
146
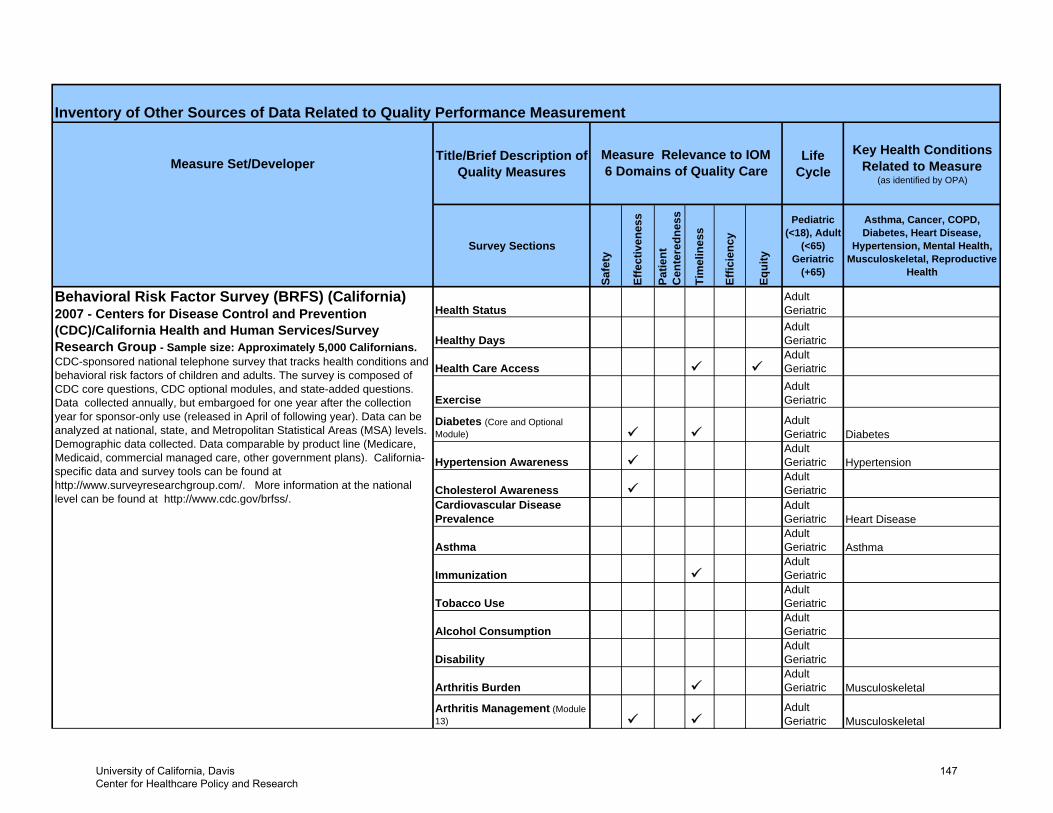
Measure Set/Developer Title/Brief Description of Quality Measures
Life Cycle
Key Health Conditions Related to Measure
(as identified by OPA)
Survey Sections
Safe
ty
Effe
ctiv
enes
s
Patie
nt
Cen
tere
dnes
s
Tim
elin
ess
Effic
ienc
y
Equi
ty
Pediatric (<18), Adult
(<65) Geriatric
(+65)
Asthma, Cancer, COPD, Diabetes, Heart Disease,
Hypertension, Mental Health, Musculoskeletal, Reproductive
Health
Healthy DaysAdult Geriatric
Health Care AccessAdult Geriatric
ExerciseAdult Geriatric
Diabetes (Core and Optional Module)
Adult Geriatric Diabetes
Hypertension AwarenessAdult Geriatric Hypertension
Cholesterol AwarenessAdult Geriatric
Cardiovascular Disease Prevalence
Adult Geriatric Heart Disease
AsthmaAdult Geriatric Asthma
ImmunizationAdult Geriatric
Tobacco UseAdult Geriatric
Alcohol ConsumptionAdult Geriatric
DisabilityAdult Geriatric
Arthritis BurdenAdult Geriatric Musculoskeletal
Arthritis Management (Module 13)
Adult Geriatric Musculoskeletal
Adult Geriatric
Inventory of Other Sources of Data Related to Quality Performance Measurement
Measure Relevance to IOM 6 Domains of Quality Care
Health StatusBehavioral Risk Factor Survey (BRFS) (California) 2007 - Centers for Disease Control and Prevention (CDC)/California Health and Human Services/Survey Research Group - Sample size: Approximately 5,000 Californians. CDC-sponsored national telephone survey that tracks health conditions and behavioral risk factors of children and adults. The survey is composed of CDC core questions, CDC optional modules, and state-added questions. Data collected annually, but embargoed for one year after the collection year for sponsor-only use (released in April of following year). Data can be analyzed at national, state, and Metropolitan Statistical Areas (MSA) levels. Demographic data collected. Data comparable by product line (Medicare, Medicaid, commercial managed care, other government plans). California-specific data and survey tools can be found at http://www.surveyresearchgroup.com/. More information at the national level can be found at http://www.cdc.gov/brfss/.
University of California, Davis Center for Healthcare Policy and Research
147
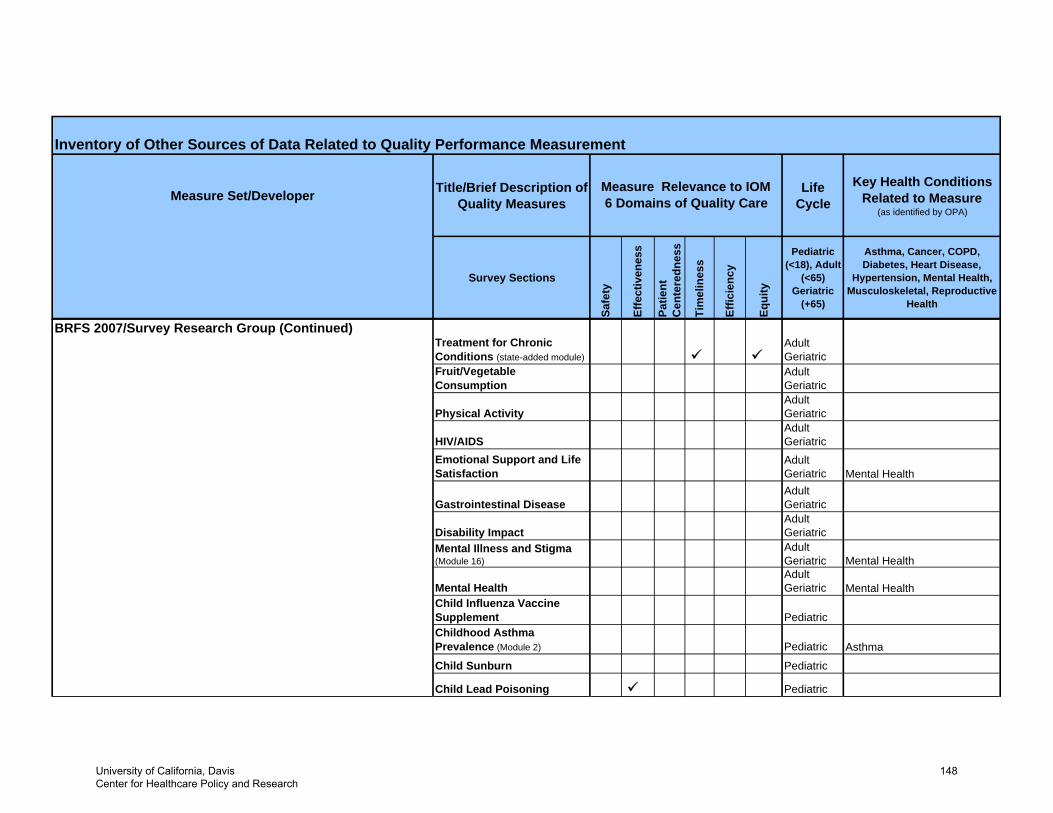
Measure Set/Developer Title/Brief Description of Quality Measures
Life Cycle
Key Health Conditions Related to Measure
(as identified by OPA)
Survey Sections
Safe
ty
Effe
ctiv
enes
s
Patie
nt
Cen
tere
dnes
s
Tim
elin
ess
Effic
ienc
y
Equi
ty
Pediatric (<18), Adult
(<65) Geriatric
(+65)
Asthma, Cancer, COPD, Diabetes, Heart Disease,
Hypertension, Mental Health, Musculoskeletal, Reproductive
Health
Inventory of Other Sources of Data Related to Quality Performance Measurement
Measure Relevance to IOM 6 Domains of Quality Care
BRFS 2007/Survey Research Group (Continued)Treatment for Chronic Conditions (state-added module)
Adult Geriatric
Fruit/Vegetable Consumption
Adult Geriatric
Physical ActivityAdult Geriatric
HIV/AIDSAdult Geriatric
Emotional Support and Life Satisfaction
Adult Geriatric Mental Health
Gastrointestinal DiseaseAdult Geriatric
Disability ImpactAdult Geriatric
Mental Illness and Stigma (Module 16)
Adult Geriatric Mental Health
Mental HealthAdult Geriatric Mental Health
Child Influenza Vaccine Supplement PediatricChildhood Asthma Prevalence (Module 2) Pediatric Asthma
Child Sunburn Pediatric
Child Lead Poisoning Pediatric
University of California, Davis Center for Healthcare Policy and Research
148
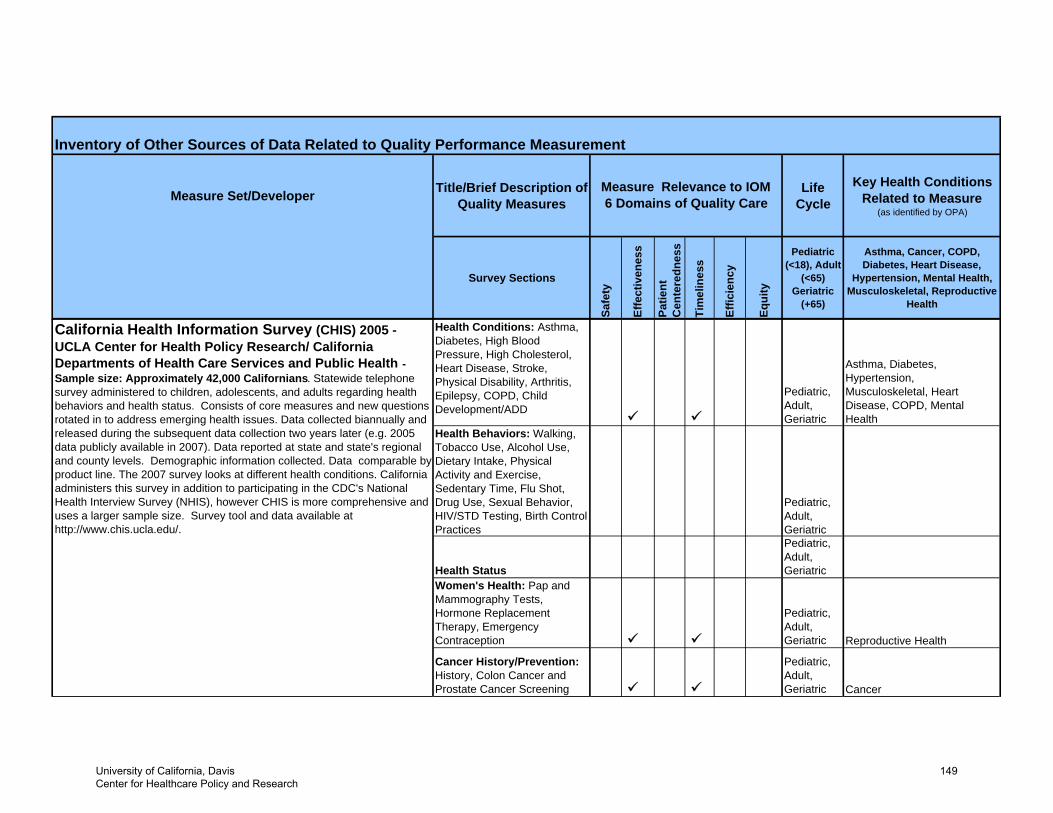
Measure Set/Developer Title/Brief Description of Quality Measures
Life Cycle
Key Health Conditions Related to Measure
(as identified by OPA)
Survey Sections
Safe
ty
Effe
ctiv
enes
s
Patie
nt
Cen
tere
dnes
s
Tim
elin
ess
Effic
ienc
y
Equi
ty
Pediatric (<18), Adult
(<65) Geriatric
(+65)
Asthma, Cancer, COPD, Diabetes, Heart Disease,
Hypertension, Mental Health, Musculoskeletal, Reproductive
Health
Inventory of Other Sources of Data Related to Quality Performance Measurement
Measure Relevance to IOM 6 Domains of Quality Care
Health Behaviors: Walking, Tobacco Use, Alcohol Use, Dietary Intake, Physical Activity and Exercise, Sedentary Time, Flu Shot, Drug Use, Sexual Behavior, HIV/STD Testing, Birth Control Practices
Pediatric, Adult, Geriatric
Health Status
Pediatric, Adult, Geriatric
Women's Health: Pap and Mammography Tests, Hormone Replacement Therapy, Emergency Contraception
Pediatric, Adult, Geriatric Reproductive Health
Cancer History/Prevention: History, Colon Cancer and Prostate Cancer Screening
Pediatric, Adult, Geriatric Cancer
Asthma, Diabetes, Hypertension, Musculoskeletal, Heart Disease, COPD, Mental Health
Pediatric, Adult, Geriatric
California Health Information Survey (CHIS) 2005 - UCLA Center for Health Policy Research/ California Departments of Health Care Services and Public Health - Sample size: Approximately 42,000 Californians. Statewide telephone survey administered to children, adolescents, and adults regarding health behaviors and health status. Consists of core measures and new questions rotated in to address emerging health issues. Data collected biannually and released during the subsequent data collection two years later (e.g. 2005 data publicly available in 2007). Data reported at state and state's regional and county levels. Demographic information collected. Data comparable by product line. The 2007 survey looks at different health conditions. California administers this survey in addition to participating in the CDC's National Health Interview Survey (NHIS), however CHIS is more comprehensive and uses a larger sample size. Survey tool and data available at http://www.chis.ucla.edu/.
Health Conditions: Asthma, Diabetes, High Blood Pressure, High Cholesterol, Heart Disease, Stroke, Physical Disability, Arthritis, Epilepsy, COPD, Child Development/ADD
University of California, Davis Center for Healthcare Policy and Research
149
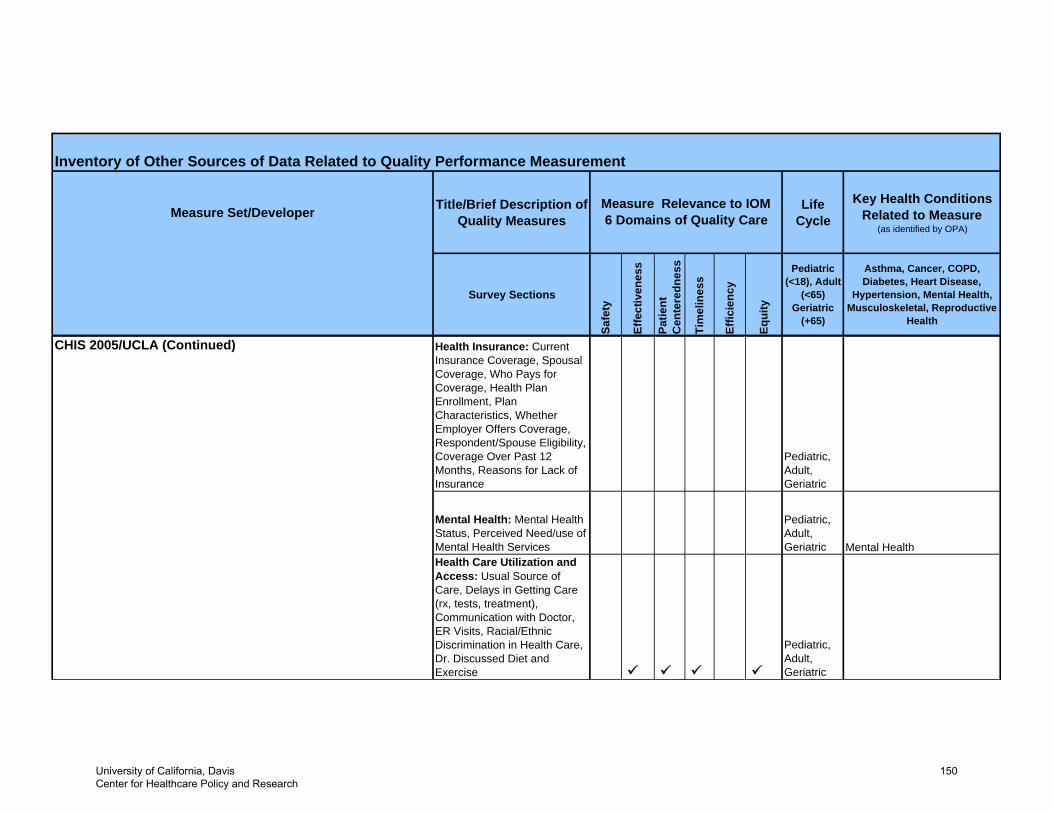
Measure Set/Developer Title/Brief Description of Quality Measures
Life Cycle
Key Health Conditions Related to Measure
(as identified by OPA)
Survey Sections
Safe
ty
Effe
ctiv
enes
s
Patie
nt
Cen
tere
dnes
s
Tim
elin
ess
Effic
ienc
y
Equi
ty
Pediatric (<18), Adult
(<65) Geriatric
(+65)
Asthma, Cancer, COPD, Diabetes, Heart Disease,
Hypertension, Mental Health, Musculoskeletal, Reproductive
Health
Inventory of Other Sources of Data Related to Quality Performance Measurement
Measure Relevance to IOM 6 Domains of Quality Care
CHIS 2005/UCLA (Continued) Health Insurance: Current Insurance Coverage, Spousal Coverage, Who Pays for Coverage, Health Plan Enrollment, Plan Characteristics, Whether Employer Offers Coverage, Respondent/Spouse Eligibility, Coverage Over Past 12 Months, Reasons for Lack of Insurance
Pediatric, Adult, Geriatric
Mental Health: Mental Health Status, Perceived Need/use of Mental Health Services
Pediatric, Adult, Geriatric Mental Health
Health Care Utilization and Access: Usual Source of Care, Delays in Getting Care (rx, tests, treatment), Communication with Doctor, ER Visits, Racial/Ethnic Discrimination in Health Care, Dr. Discussed Diet and Exercise
Pediatric, Adult, Geriatric
University of California, Davis Center for Healthcare Policy and Research
150
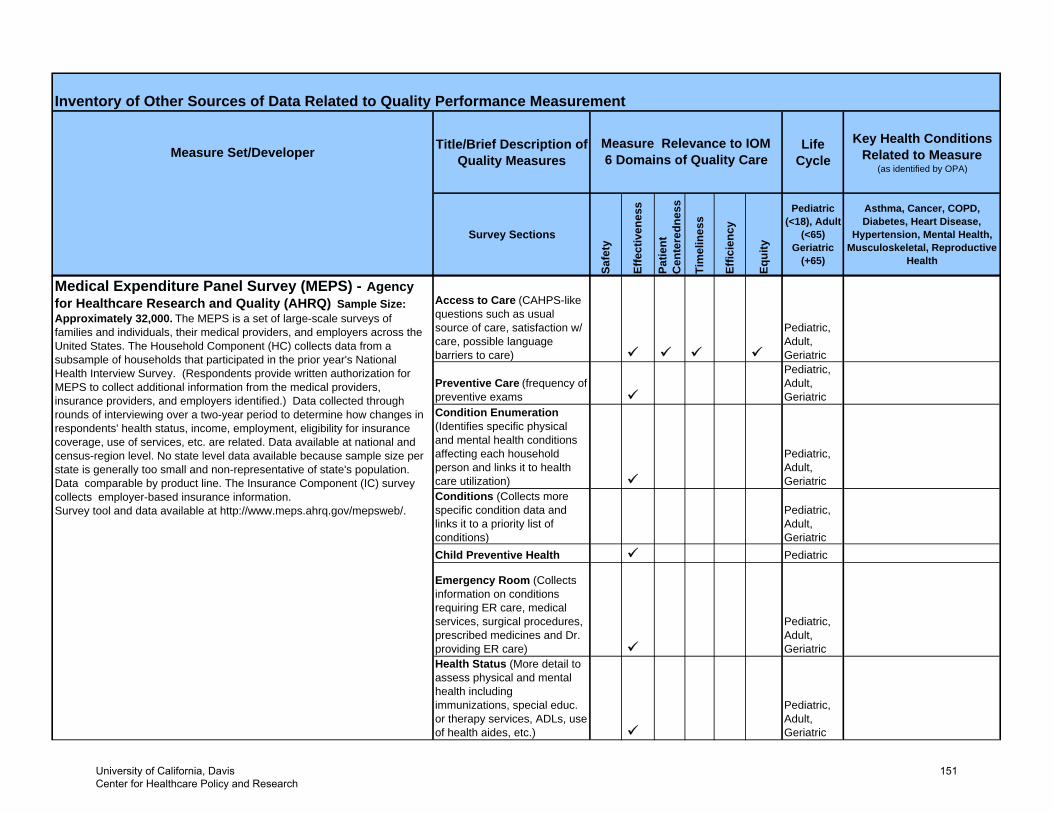
Measure Set/Developer Title/Brief Description of Quality Measures
Life Cycle
Key Health Conditions Related to Measure
(as identified by OPA)
Survey Sections
Safe
ty
Effe
ctiv
enes
s
Patie
nt
Cen
tere
dnes
s
Tim
elin
ess
Effic
ienc
y
Equi
ty
Pediatric (<18), Adult
(<65) Geriatric
(+65)
Asthma, Cancer, COPD, Diabetes, Heart Disease,
Hypertension, Mental Health, Musculoskeletal, Reproductive
Health
Inventory of Other Sources of Data Related to Quality Performance Measurement
Measure Relevance to IOM 6 Domains of Quality Care
Preventive Care (frequency of preventive exams
Pediatric, Adult, Geriatric
Condition Enumeration (Identifies specific physical and mental health conditions affecting each household person and links it to health care utilization)
Pediatric, Adult, Geriatric
Conditions (Collects more specific condition data and links it to a priority list of conditions)
Pediatric, Adult, Geriatric
Child Preventive Health Pediatric
Emergency Room (Collects information on conditions requiring ER care, medical services, surgical procedures, prescribed medicines and Dr. providing ER care)
Pediatric, Adult, Geriatric
Health Status (More detail to assess physical and mental health including immunizations, special educ. or therapy services, ADLs, use of health aides, etc.)
Pediatric, Adult, Geriatric
Pediatric, Adult, Geriatric
Medical Expenditure Panel Survey (MEPS) - Agency for Healthcare Research and Quality (AHRQ) Sample Size: Approximately 32,000. The MEPS is a set of large-scale surveys of families and individuals, their medical providers, and employers across the United States. The Household Component (HC) collects data from a subsample of households that participated in the prior year's National Health Interview Survey. (Respondents provide written authorization for MEPS to collect additional information from the medical providers, insurance providers, and employers identified.) Data collected through rounds of interviewing over a two-year period to determine how changes in respondents' health status, income, employment, eligibility for insurance coverage, use of services, etc. are related. Data available at national and census-region level. No state level data available because sample size per state is generally too small and non-representative of state's population. Data comparable by product line. The Insurance Component (IC) survey collects employer-based insurance information. Survey tool and data available at http://www.meps.ahrq.gov/mepsweb/.
Access to Care (CAHPS-like questions such as usual source of care, satisfaction w/ care, possible language barriers to care)
University of California, Davis Center for Healthcare Policy and Research
151
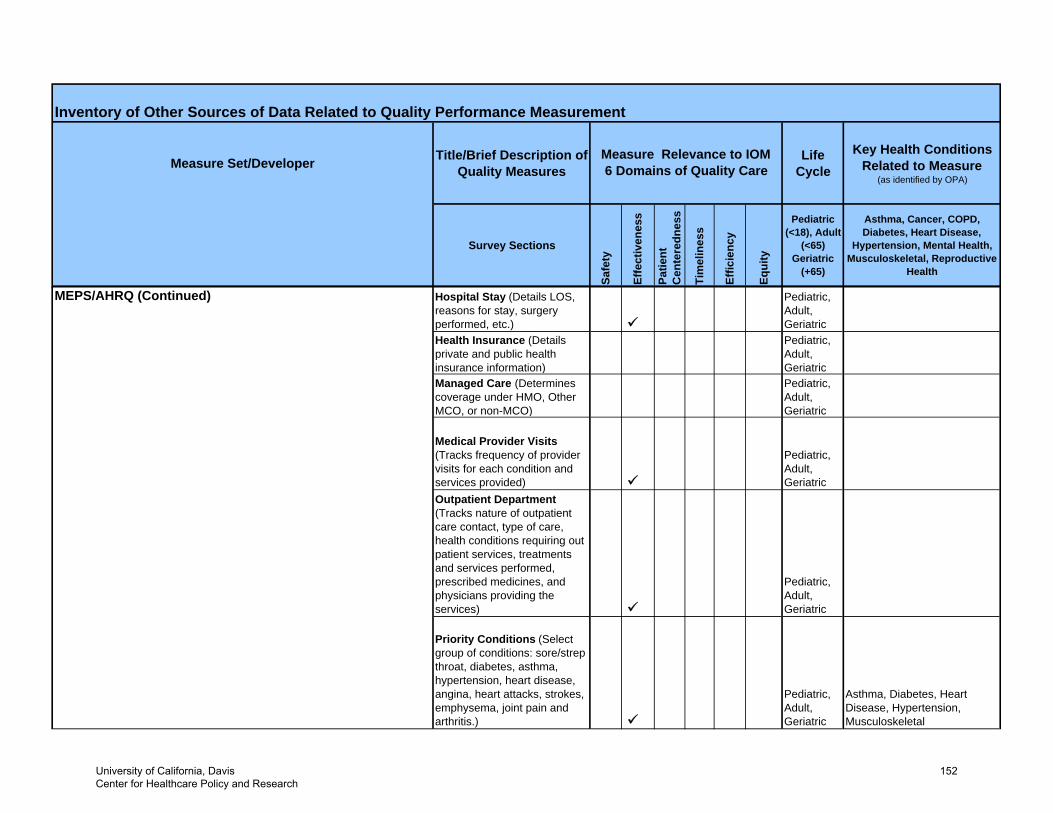
Measure Set/Developer Title/Brief Description of Quality Measures
Life Cycle
Key Health Conditions Related to Measure
(as identified by OPA)
Survey Sections
Safe
ty
Effe
ctiv
enes
s
Patie
nt
Cen
tere
dnes
s
Tim
elin
ess
Effic
ienc
y
Equi
ty
Pediatric (<18), Adult
(<65) Geriatric
(+65)
Asthma, Cancer, COPD, Diabetes, Heart Disease,
Hypertension, Mental Health, Musculoskeletal, Reproductive
Health
Inventory of Other Sources of Data Related to Quality Performance Measurement
Measure Relevance to IOM 6 Domains of Quality Care
MEPS/AHRQ (Continued) Hospital Stay (Details LOS, reasons for stay, surgery performed, etc.)
Pediatric, Adult, Geriatric
Health Insurance (Details private and public health insurance information)
Pediatric, Adult, Geriatric
Managed Care (Determines coverage under HMO, Other MCO, or non-MCO)
Pediatric, Adult, Geriatric
Medical Provider Visits (Tracks frequency of provider visits for each condition and services provided)
Pediatric, Adult, Geriatric
Outpatient Department (Tracks nature of outpatient care contact, type of care, health conditions requiring out patient services, treatments and services performed, prescribed medicines, and physicians providing the services)
Pediatric, Adult, Geriatric
Priority Conditions (Select group of conditions: sore/strep throat, diabetes, asthma, hypertension, heart disease, angina, heart attacks, strokes, emphysema, joint pain and arthritis.)
Pediatric, Adult, Geriatric
Asthma, Diabetes, Heart Disease, Hypertension, Musculoskeletal
University of California, Davis Center for Healthcare Policy and Research
152
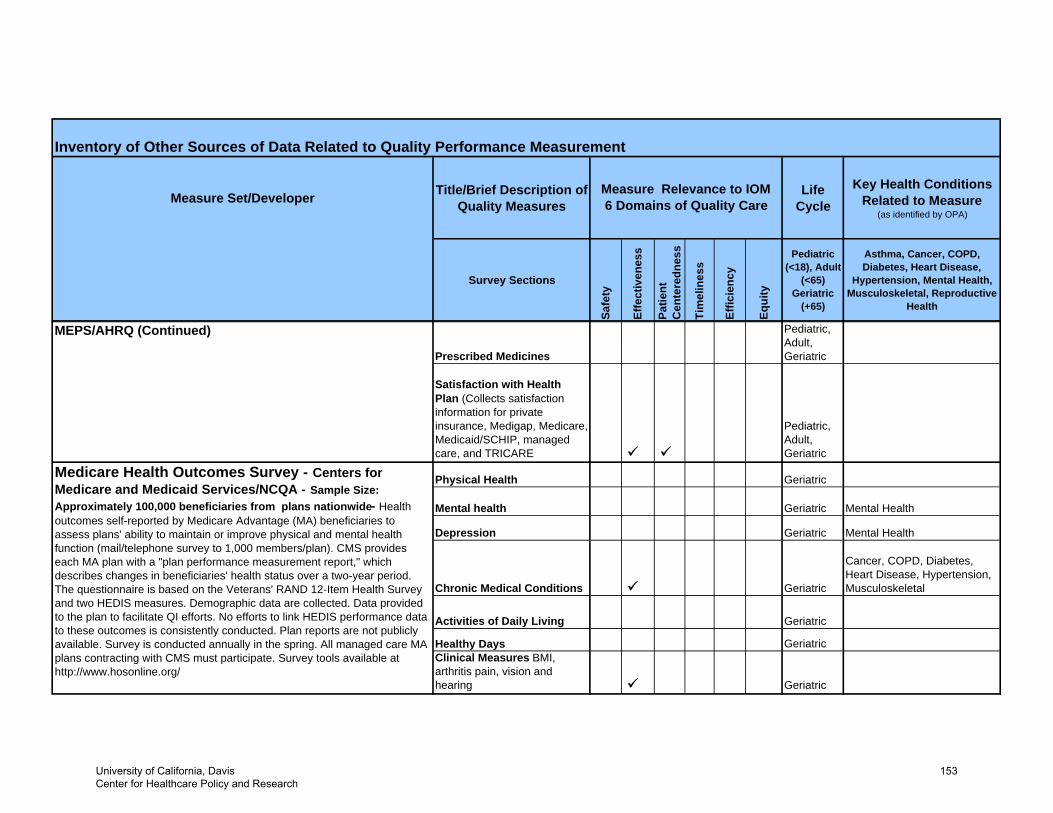
Measure Set/Developer Title/Brief Description of Quality Measures
Life Cycle
Key Health Conditions Related to Measure
(as identified by OPA)
Survey Sections
Safe
ty
Effe
ctiv
enes
s
Patie
nt
Cen
tere
dnes
s
Tim
elin
ess
Effic
ienc
y
Equi
ty
Pediatric (<18), Adult
(<65) Geriatric
(+65)
Asthma, Cancer, COPD, Diabetes, Heart Disease,
Hypertension, Mental Health, Musculoskeletal, Reproductive
Health
Inventory of Other Sources of Data Related to Quality Performance Measurement
Measure Relevance to IOM 6 Domains of Quality Care
MEPS/AHRQ (Continued)
Prescribed Medicines
Pediatric, Adult, Geriatric
Satisfaction with Health Plan (Collects satisfaction information for private insurance, Medigap, Medicare, Medicaid/SCHIP, managed care, and TRICARE
Pediatric, Adult, Geriatric
Mental health Geriatric Mental Health
Depression Geriatric Mental Health
Chronic Medical Conditions Geriatric
Cancer, COPD, Diabetes, Heart Disease, Hypertension, Musculoskeletal
Activities of Daily Living Geriatric
Healthy Days GeriatricClinical Measures BMI, arthritis pain, vision and hearing Geriatric
Physical Health GeriatricMedicare Health Outcomes Survey - Centers for Medicare and Medicaid Services/NCQA - Sample Size: Approximately 100,000 beneficiaries from plans nationwide- Health outcomes self-reported by Medicare Advantage (MA) beneficiaries to assess plans' ability to maintain or improve physical and mental health function (mail/telephone survey to 1,000 members/plan). CMS provides each MA plan with a "plan performance measurement report," which describes changes in beneficiaries' health status over a two-year period. The questionnaire is based on the Veterans' RAND 12-Item Health Survey and two HEDIS measures. Demographic data are collected. Data provided to the plan to facilitate QI efforts. No efforts to link HEDIS performance data to these outcomes is consistently conducted. Plan reports are not publicly available. Survey is conducted annually in the spring. All managed care MA plans contracting with CMS must participate. Survey tools available at http://www.hosonline.org/
University of California, Davis Center for Healthcare Policy and Research
153
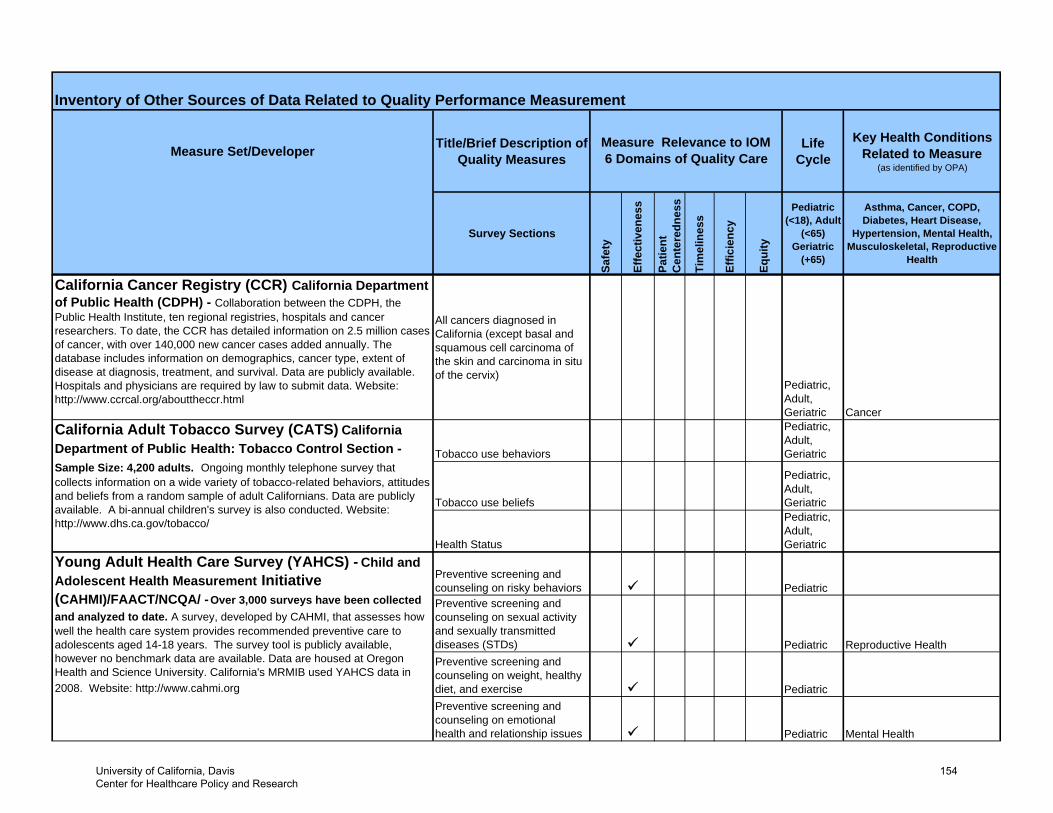
Measure Set/Developer Title/Brief Description of Quality Measures
Life Cycle
Key Health Conditions Related to Measure
(as identified by OPA)
Survey Sections
Safe
ty
Effe
ctiv
enes
s
Patie
nt
Cen
tere
dnes
s
Tim
elin
ess
Effic
ienc
y
Equi
ty
Pediatric (<18), Adult
(<65) Geriatric
(+65)
Asthma, Cancer, COPD, Diabetes, Heart Disease,
Hypertension, Mental Health, Musculoskeletal, Reproductive
Health
Inventory of Other Sources of Data Related to Quality Performance Measurement
Measure Relevance to IOM 6 Domains of Quality Care
California Cancer Registry (CCR) California Department of Public Health (CDPH) - Collaboration between the CDPH, the Public Health Institute, ten regional registries, hospitals and cancer researchers. To date, the CCR has detailed information on 2.5 million cases of cancer, with over 140,000 new cancer cases added annually. The database includes information on demographics, cancer type, extent of disease at diagnosis, treatment, and survival. Data are publicly available. Hospitals and physicians are required by law to submit data. Website: http://www.ccrcal.org/abouttheccr.html
All cancers diagnosed in California (except basal and squamous cell carcinoma of the skin and carcinoma in situ of the cervix)
Pediatric, Adult, Geriatric Cancer
Tobacco use behaviors
Pediatric, Adult, Geriatric
Tobacco use beliefs
Pediatric, Adult, Geriatric
Health Status
Pediatric, Adult, Geriatric
Preventive screening and counseling on risky behaviors PediatricPreventive screening and counseling on sexual activity and sexually transmitted diseases (STDs) Pediatric Reproductive HealthPreventive screening and counseling on weight, healthy diet, and exercise PediatricPreventive screening and counseling on emotional health and relationship issues Pediatric Mental Health
California Adult Tobacco Survey (CATS) California Department of Public Health: Tobacco Control Section - Sample Size: 4,200 adults. Ongoing monthly telephone survey that collects information on a wide variety of tobacco-related behaviors, attitudes and beliefs from a random sample of adult Californians. Data are publicly available. A bi-annual children's survey is also conducted. Website: http://www.dhs.ca.gov/tobacco/
Young Adult Health Care Survey (YAHCS) - Child and Adolescent Health Measurement Initiative (CAHMI)/FAACT/NCQA/ - Over 3,000 surveys have been collected and analyzed to date. A survey, developed by CAHMI, that assesses how well the health care system provides recommended preventive care to adolescents aged 14-18 years. The survey tool is publicly available, however no benchmark data are available. Data are housed at Oregon Health and Science University. California's MRMIB used YAHCS data in 2008. Website: http://www.cahmi.org
University of California, Davis Center for Healthcare Policy and Research
154
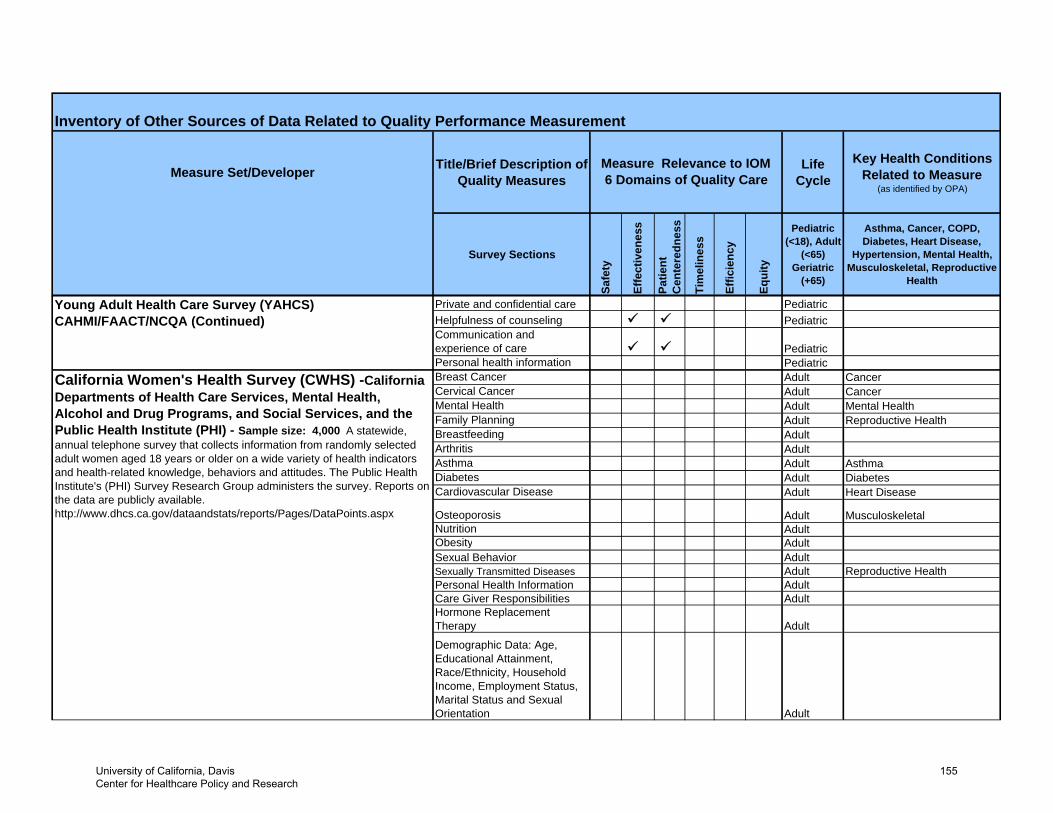
Measure Set/Developer Title/Brief Description of Quality Measures
Life Cycle
Key Health Conditions Related to Measure
(as identified by OPA)
Survey Sections
Safe
ty
Effe
ctiv
enes
s
Patie
nt
Cen
tere
dnes
s
Tim
elin
ess
Effic
ienc
y
Equi
ty
Pediatric (<18), Adult
(<65) Geriatric
(+65)
Asthma, Cancer, COPD, Diabetes, Heart Disease,
Hypertension, Mental Health, Musculoskeletal, Reproductive
Health
Inventory of Other Sources of Data Related to Quality Performance Measurement
Measure Relevance to IOM 6 Domains of Quality Care
Private and confidential care PediatricHelpfulness of counseling PediatricCommunication and experience of care PediatricPersonal health information PediatricBreast Cancer Adult CancerCervical Cancer Adult CancerMental Health Adult Mental HealthFamily Planning Adult Reproductive HealthBreastfeeding AdultArthritis AdultAsthma Adult AsthmaDiabetes Adult DiabetesCardiovascular Disease Adult Heart Disease
Osteoporosis Adult MusculoskeletalNutrition AdultObesity AdultSexual Behavior AdultSexually Transmitted Diseases Adult Reproductive HealthPersonal Health Information AdultCare Giver Responsibilities AdultHormone Replacement Therapy Adult
Demographic Data: Age, Educational Attainment, Race/Ethnicity, Household Income, Employment Status, Marital Status and Sexual Orientation Adult
California Women's Health Survey (CWHS) -California Departments of Health Care Services, Mental Health, Alcohol and Drug Programs, and Social Services, and the Public Health Institute (PHI) - Sample size: 4,000 A statewide, annual telephone survey that collects information from randomly selected adult women aged 18 years or older on a wide variety of health indicators and health-related knowledge, behaviors and attitudes. The Public Health Institute's (PHI) Survey Research Group administers the survey. Reports on the data are publicly available. http://www.dhcs.ca.gov/dataandstats/reports/Pages/DataPoints.aspx
Young Adult Health Care Survey (YAHCS) CAHMI/FAACT/NCQA (Continued)
University of California, Davis Center for Healthcare Policy and Research
155