Embed Size (px)
Citation preview
The Commonwealth Fund
One East 75th Street
New York, NY 10021-2692
Telephone (212) 606-3800
Facsimile (212) 606-3500
www.cmwf.org
Quality of Health Care in the United States: A Chartbook
Sheila LeathermanDouglas McCarthy
April 2002

Cover photo by Marc Asnin

Quality of Health Care in the United States: A Chartbook
Sheila LeathermanDouglas McCarthy
April 2002
Support for this research was provided by The Commonwealth Fund.The views presented here are those of the authors and should not beattributed to The Commonwealth Fund or its directors, officers, or staff.
Copies of this report are available from The Commonwealth Fund bycalling our toll-free publications line at 1-888-777-2744 and orderingpublication number 520. The report can also be found on the Fund’swebsite at www.cmwf.org.
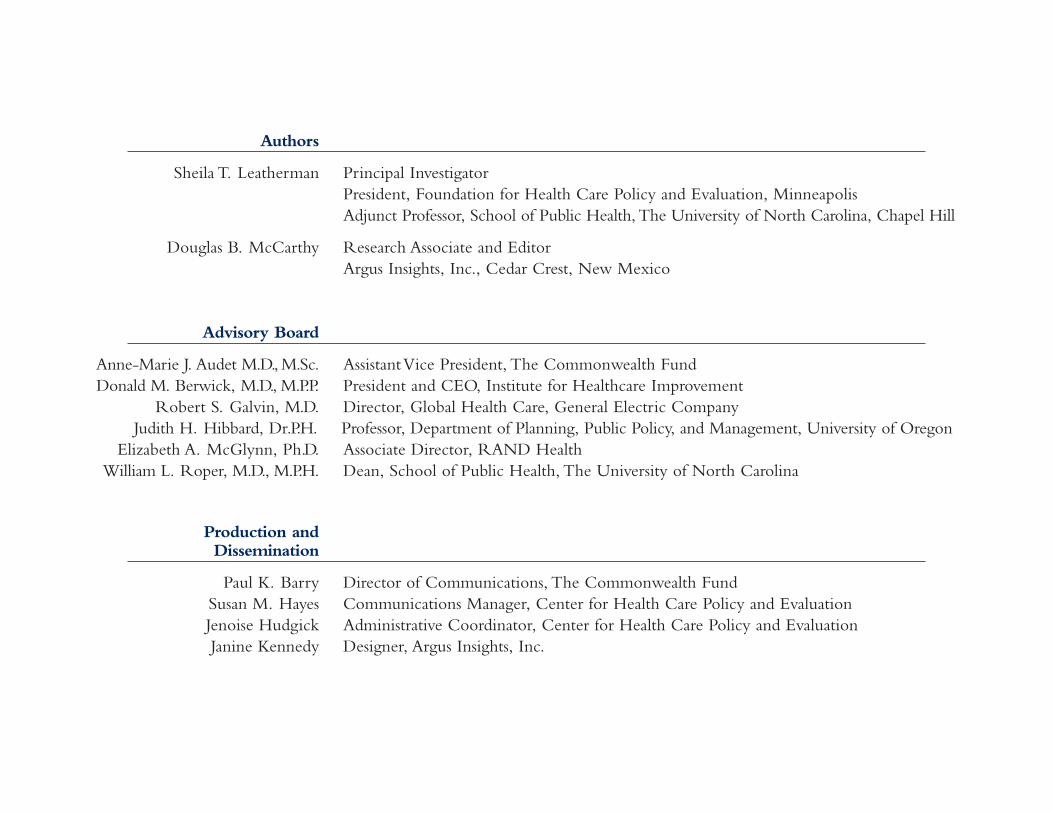
Authors
Sheila T. Leatherman Principal InvestigatorPresident, Foundation for Health Care Policy and Evaluation, MinneapolisAdjunct Professor, School of Public Health, The University of North Carolina, Chapel Hill
Douglas B. McCarthy Research Associate and EditorArgus Insights, Inc., Cedar Crest, New Mexico
Advisory Board
Anne-Marie J. Audet M.D., M.Sc. Assistant Vice President, The Commonwealth FundDonald M. Berwick, M.D., M.P.P. President and CEO, Institute for Healthcare Improvement
Robert S. Galvin, M.D. Director, Global Health Care, General Electric CompanyJudith H. Hibbard, Dr.P.H. Professor, Department of Planning, Public Policy, and Management, University of Oregon
Elizabeth A. McGlynn, Ph.D. Associate Director, RAND HealthWilliam L. Roper, M.D., M.P.H. Dean, School of Public Health, The University of North Carolina
Production and Dissemination
Paul K. Barry Director of Communications, The Commonwealth FundSusan M. Hayes Communications Manager, Center for Health Care Policy and EvaluationJenoise Hudgick Administrative Coordinator, Center for Health Care Policy and EvaluationJanine Kennedy Designer, Argus Insights, Inc.
ContentsAcknowledgements . . . . . . . . . . . . . . . . . . . . . . . . . . . . . . . . . . . . . . . . . . . . . . . . . . . . . . . . . . . . . . . 7
Introduction . . . . . . . . . . . . . . . . . . . . . . . . . . . . . . . . . . . . . . . . . . . . . . . . . . . . . . . . . . . . . . . . . . . . . . . 9
Chapter 1: Effectiveness . . . . . . . . . . . . . . . . . . . . . . . . . . . . . . . . . . . . . . . . . . . . . . . . . . . . . . . . . 19
Staying Healthy
Chart 1–1 Childhood Immunizations . . . . . . . . . . . . . . . . . . . . . . . . . . . . . . . . . . . . . . . . . . . . . . . . . . . . . . . . . 25Chart 1–2 Trend in Immunizations for Older Adults . . . . . . . . . . . . . . . . . . . . . . . . . . . . . . . . . . . . . . . . . . . . . . 27Chart 1–3 Colorectal Cancer Screening . . . . . . . . . . . . . . . . . . . . . . . . . . . . . . . . . . . . . . . . . . . . . . . . . . . . . . . 29Chart 1–4 Trend in Breast Cancer Screening and Outcomes . . . . . . . . . . . . . . . . . . . . . . . . . . . . . . . . . . . . . . . . . 31Chart 1–5 Smoking Cessation Counseling . . . . . . . . . . . . . . . . . . . . . . . . . . . . . . . . . . . . . . . . . . . . . . . . . . . . . . 33
Getting Better When Sick
Chart 1–6 Antibiotic Treatment for Sore Throat . . . . . . . . . . . . . . . . . . . . . . . . . . . . . . . . . . . . . . . . . . . . . . . . . . 35Chart 1–7 Antibiotic Treatment for Pneumonia . . . . . . . . . . . . . . . . . . . . . . . . . . . . . . . . . . . . . . . . . . . . . . . . . . 37
Living with Chronic Illness
Chart 1–8 Appropriateness of Procedures as Rated by Expert Consensus . . . . . . . . . . . . . . . . . . . . . . . . . . . . . . . . 39Chart 1–9 Diabetes Management . . . . . . . . . . . . . . . . . . . . . . . . . . . . . . . . . . . . . . . . . . . . . . . . . . . . . . . . . . . . 41Chart 1–10 Asthma Management . . . . . . . . . . . . . . . . . . . . . . . . . . . . . . . . . . . . . . . . . . . . . . . . . . . . . . . . . . . . . 43Chart 1–11 Stroke Prevention for Patients with Atrial Fibrillation . . . . . . . . . . . . . . . . . . . . . . . . . . . . . . . . . . . . . . 45
Chart 1–12 Treatment and Outcomes for HIV . . . . . . . . . . . . . . . . . . . . . . . . . . . . . . . . . . . . . . . . . . . . . . . . . . . 47Chart 1–13 Medication to Prevent Recurrent Heart Attack . . . . . . . . . . . . . . . . . . . . . . . . . . . . . . . . . . . . . . . . . . 49Chart 1–14 Speed to Treatment with Clot-Dissolving Drugs Following a Heart Attack . . . . . . . . . . . . . . . . . . . . . . . 51Chart 1–15 Mental Health Care: Treatment for Depression . . . . . . . . . . . . . . . . . . . . . . . . . . . . . . . . . . . . . . . . . . . 53
Long-Term Care
Chart 1–16 Nursing Home Care and Outcomes . . . . . . . . . . . . . . . . . . . . . . . . . . . . . . . . . . . . . . . . . . . . . . . . . . 55
Chapter 2: Patient Safety . . . . . . . . . . . . . . . . . . . . . . . . . . . . . . . . . . . . . . . . . . . . . . . . . . . . . . . 57
Chart 2–1 Estimated Deaths Associated with Medical Mistakes Compared to the Leading Causes of Death in the U.S. . . . 61Chart 2–2 Preventable Adverse Events and Causes: New York . . . . . . . . . . . . . . . . . . . . . . . . . . . . . . . . . . . . . . . . 62Chart 2–3 Preventable Adverse Events and Outcomes: Colorado/Utah . . . . . . . . . . . . . . . . . . . . . . . . . . . . . . . . . 63Chart 2–4 Preventable Adverse Drug Events . . . . . . . . . . . . . . . . . . . . . . . . . . . . . . . . . . . . . . . . . . . . . . . . . . . . 65Chart 2–5 Trends and Types of Medication-Prescribing Mistakes . . . . . . . . . . . . . . . . . . . . . . . . . . . . . . . . . . . . . . 67Chart 2–6 Potentially Inappropriate Prescribing for the Elderly . . . . . . . . . . . . . . . . . . . . . . . . . . . . . . . . . . . . . . . 69
Chapter 3: Access and Timeliness . . . . . . . . . . . . . . . . . . . . . . . . . . . . . . . . . . . . . . . . . . . . . . 71
Chart 3–1 Effect of Being Uninsured on Access to Primary Care . . . . . . . . . . . . . . . . . . . . . . . . . . . . . . . . . . . . . . 75Chart 3–2 Effect of Being Uninsured on Access to Preventive Care (Part I) . . . . . . . . . . . . . . . . . . . . . . . . . . . . . . . 76Chart 3–3 Effect of Being Uninsured on Access to Preventive Care (Part II) . . . . . . . . . . . . . . . . . . . . . . . . . . . . . . 77Chart 3–4 Unmet Needs of Children with Special Health Care Needs . . . . . . . . . . . . . . . . . . . . . . . . . . . . . . . . . . 79Chart 3–5 Effect of Having a Regular Source of Health Care on Access to Preventive Care . . . . . . . . . . . . . . . . . . . 81Chart 3–6 Timely Initiation of Prenatal Care . . . . . . . . . . . . . . . . . . . . . . . . . . . . . . . . . . . . . . . . . . . . . . . . . . . . 83Chart 3–7 Dental Care . . . . . . . . . . . . . . . . . . . . . . . . . . . . . . . . . . . . . . . . . . . . . . . . . . . . . . . . . . . . . . . . . . . 85
Chapter 4: Focus on the Patient . . . . . . . . . . . . . . . . . . . . . . . . . . . . . . . . . . . . . . . . . . . . . . . 87
Chart 4–1 Perceptions of Health Care Quality . . . . . . . . . . . . . . . . . . . . . . . . . . . . . . . . . . . . . . . . . . . . . . . . . . . 91Chart 4–2 Public Perceptions of the Health Care System . . . . . . . . . . . . . . . . . . . . . . . . . . . . . . . . . . . . . . . . . . . 93Chart 4–3 Consumer Assessment of Health Plans, Overall Ratings . . . . . . . . . . . . . . . . . . . . . . . . . . . . . . . . . . . . . 95Chart 4–4 Consumer Assessment of Health Plans, Ratings of Access and Timeliness . . . . . . . . . . . . . . . . . . . . . . . . . 96Chart 4–5 Consumer Assessment of Health Plans, Ratings of Physician and Health Plan Communications . . . . . . . . . 97Chart 4–6 Patient Reports of Problems with Hospital Care . . . . . . . . . . . . . . . . . . . . . . . . . . . . . . . . . . . . . . . . . . 99Chart 4–7 Time Spent with Physician . . . . . . . . . . . . . . . . . . . . . . . . . . . . . . . . . . . . . . . . . . . . . . . . . . . . . . . . 101Chart 4–8 Satisfaction with Nursing Home Care . . . . . . . . . . . . . . . . . . . . . . . . . . . . . . . . . . . . . . . . . . . . . . . . 103Chart 4–9 Ratings of Nursing Home Staff and Staffing Levels . . . . . . . . . . . . . . . . . . . . . . . . . . . . . . . . . . . . . . . 104Chart 4–10 Nursing Home Quality of Life . . . . . . . . . . . . . . . . . . . . . . . . . . . . . . . . . . . . . . . . . . . . . . . . . . . . . 105
Chapter 5: Disparities in Health Care . . . . . . . . . . . . . . . . . . . . . . . . . . . . . . . . . . . . . . . 107
Staying Healthy
Chart 5–1 Racial/Ethnic Disparity in Preventive Care . . . . . . . . . . . . . . . . . . . . . . . . . . . . . . . . . . . . . . . . . . . . 111
Living with Chronic Illness
Chart 5–2 Racial Disparity in Lung Cancer Surgery and Survival . . . . . . . . . . . . . . . . . . . . . . . . . . . . . . . . . . . . 113Chart 5–3 Racial Disparity in Use of Invasive Heart Procedures . . . . . . . . . . . . . . . . . . . . . . . . . . . . . . . . . . . . . 115Chart 5–4 Gender Disparity in Heart Attack Treatment . . . . . . . . . . . . . . . . . . . . . . . . . . . . . . . . . . . . . . . . . . . . 117Chart 5–5 Racial Disparity in Access to Kidney Transplants . . . . . . . . . . . . . . . . . . . . . . . . . . . . . . . . . . . . . . . . . 119Chart 5–6 Racial Disparity in Cancer Pain Management . . . . . . . . . . . . . . . . . . . . . . . . . . . . . . . . . . . . . . . . . . . 121
Patient Experience
Chart 5–7 Effect of Race/Ethnicity and Language on Parents’Assessments of Pediatric Care in Medicaid Health Plans . . . 123
Chapter 6: Capacity to Improve . . . . . . . . . . . . . . . . . . . . . . . . . . . . . . . . . . . . . . . . . . . . . . 125
Staying Healthy
Chart 6–1 Improving Immunization Rates . . . . . . . . . . . . . . . . . . . . . . . . . . . . . . . . . . . . . . . . . . . . . . . . . . . . 129
Getting Better When Sick
Chart 6–2 Reducing Unnecessary Antibiotic Use . . . . . . . . . . . . . . . . . . . . . . . . . . . . . . . . . . . . . . . . . . . . . . . . 131
Living with Chronic Illness
Chart 6–3 Improving Diabetes Management . . . . . . . . . . . . . . . . . . . . . . . . . . . . . . . . . . . . . . . . . . . . . . . . . . . 133Chart 6–4 Improving Medical Treatment for Heart Attack . . . . . . . . . . . . . . . . . . . . . . . . . . . . . . . . . . . . . . . . . . 135Chart 6–5 Improving Outcomes of Heart Bypass Surgery . . . . . . . . . . . . . . . . . . . . . . . . . . . . . . . . . . . . . . . . . . 137Chart 6–6 Improving Treatment and Outcomes for Depression . . . . . . . . . . . . . . . . . . . . . . . . . . . . . . . . . . . . . . 139
Long-Term Care
Chart 6–7 Reducing Pressure Ulcers in the Nursing Home . . . . . . . . . . . . . . . . . . . . . . . . . . . . . . . . . . . . . . . . . 141
Patient Safety
Chart 6–8 Preventing Medication Mistakes . . . . . . . . . . . . . . . . . . . . . . . . . . . . . . . . . . . . . . . . . . . . . . . . . . . . 143
Technical Appendix . . . . . . . . . . . . . . . . . . . . . . . . . . . . . . . . . . . . . . . . . . . . . . . . . . . . . . . . . . . . . 145
References . . . . . . . . . . . . . . . . . . . . . . . . . . . . . . . . . . . . . . . . . . . . . . . . . . . . . . . . . . . . . . . . . . . . . . . 153
Leatherman and McCarthy, Quality of Health Care in the United States: A Chartbook, 2002. The Commonwealth Fund 7
AcknowledgementsThis Chartbook is a compendium representing the effortsof many different researchers whom we have cited. We areindebted to them for their contributions. We especiallywish to thank the authors and other individuals who kindlyprovided data, sources, and clarifications: Lori Andersen,National Committee for Quality Assurance; AryneBlumklotz, Foundation for Accountability; Maris AnnBondi, Partnership for Prevention; Erin Carlson, AmericanAssociation of Health Plans; Paul Cleary, Harvard MedicalSchool; Lee Hargraves, Center for Studying Health SystemChange; Charlene Harrington, University of California–San Francisco; Yael Harris and Amy Heller, Centers forMedicare and Medicaid Services; Lucian Leape, HarvardSchool of Public Health; Timothy Lesar, Albany MedicalCenter; David Mechanic, Rutgers–The State University;Eric Peterson, Duke University Medical Center; WilliamRogers, University of Alabama Medical Center; JonathanSa’adah, Intermedia Communications; Kimberly Scoles,Harvard School of Public Health; Dale Shaller; AnthonySuchman, Relationship Centered Health Care; EricThomas, University of Texas–Houston Medical School;Rick Wade, American Hospital Association; John Wennbergand Megan Cooper, Dartmouth Medical School; andGooloo Wunderlich, Institute of Medicine.
Members of the Chartbook Advisory Board generously gavetheir time to provide invaluable advice on content and presen-tation: Anne-Marie Audet, Donald Berwick, Robert Galvin,Judith Hibbard, Elizabeth McGlynn, and William Roper.
At the Center for Health Care Policy and Evaluation, wethank Susan Hayes for project coordination and review,Thomas Rector for consultation, Steven Wickstrom for statis-tical advice, and Jenoise Hudgick for administrative support.
At Argus Insights, we thank Janine Kennedy for outstandingdesign work and Virginia Salas for consultation on infectiousdisease issues.
We are grateful to Gregg Meyer and Thomas Reilly at theAgency for Healthcare Research and Quality for their encour-agement of this project and for helping to ensure that it willcomplement the goals of the National Healthcare Quality Report.
Finally, we acknowledge the financial and moral support ofThe Commonwealth Fund in making the Chartbook a reality;Karen Davis and Stephen Schoenbaum for their vision inchampioning the Chartbook; Anne-Marie Audet for heradvice and personal interest in overseeing the Chartbookproject; and Paul Barry and the communications staff fortheir logistical support.

Leatherman and McCarthy, Quality of Health Care in the United States: A Chartbook, 2002. The Commonwealth Fund 9
In America, we are privileged to have access to some of the best health care in the world. Yet the provision of healthcare is becoming increasingly complex and expensive, withdemands on the system likely to grow over time as the pop-ulation ages and new advances in medicine are introduced.This means that the best use of existing and new resourcesmust be assured, and that the quality of care must be opti-mized, if we are to realize the potential of our health system.
Serious and widespread problems of quality exist in theUnited States, with evidence of underuse of beneficial services, overuse of other procedures that are not medicallynecessary, and mistakes leading to patient injury (IOM 2001a,President’s Advisory Commission 1998). The Institute ofMedicine of the National Academy of Sciences has stated,“that the quality of health care received by the people ofthe United States falls short of what it should be” (IOM2001b).
A common understanding of the magnitude and scope ofthese problems is needed to provide a framework for com-munication among the many stakeholders interested in
improving the performance of the American health caresystem. Such an understanding is essential to garner thenecessary resources—in both the public and private sectors—to improve quality. Unfortunately, there is currently no reliablesingle source providing such a comprehensive and compre-hensible picture of the quality of health care in the U.S.
This Chartbook was developed with the hope of filling that gap by creating an authoritative but usable resource totranslate what is most important about quality into a formatthat interested constituencies can easily understand for theirdecision-making and to provide a platform for public dis-cussion. Our goal is not to create another academic report onquality but rather a tool to educate the public and policymakerson the state of health care quality in the U.S. We have system-atically selected a representative range of quality data presentedthrough graphs and narrative to “tell the story” of the problemsand successes, and, most importantly, the opportunities toimprove health care for the benefit of Americans.
Introduction
Leatherman and McCarthy, Quality of Health Care in the United States: A Chartbook, 2002. The Commonwealth Fund 10
Defining quality: “In the eye of the beholder”
Today, there is growing awareness of the need to improvequality. People legitimately have widely different perceptionsof what they consider to be the critical dimensions of qualityof care. This kaleidoscope of views on quality largely resultsfrom the perspective one adopts as a patient, physician, healthcare manager, purchaser, payer, or public health official. Thesame health care encounter may be differently assessed depend-ing upon one’s role—or, in the vernacular, quality is in theeye of the beholder.
• A physician is likely to view quality in a technical sense,such as whether an accurate diagnosis is made, whether asurgical procedure is performed proficiently and whetherthe patient’s health status has improved. This perspectiveis reflected in the Institute of Medicine’s definition ofquality as “the degree to which health services for indi-viduals and populations increase the likelihood of desiredhealth outcomes and are consistent with current professionalknowledge” (IOM 1990). Measured from this perspective,quality is the gap between what is scientifically sound andpossible, and the actual practice and delivery of healthservices.
• The patient is likely to judge his or her encounter withthe health care system both by its outcome and through amore personal lens, such as whether the physician listenedwell, communicated clearly, and was compassionate as wellas skilled in delivering care.
• The health care manager, payer, or purchaser (health plan,employer, or government program such as Medicare or Medicaid) will want to know if the services are cost-effective—meaning a desired health outcome is achievedin the most efficient and effective manner.
• The public health official will wish to know whether healthcare resources are being used appropriately to optimizepopulation health as well as being provided equitablywithin the population.
Whether through the eyes of the caregivers or the patients,recent surveys show widespread concerns regarding theeroding performance of the health care system. For exam-ple, well over half of U.S. physicians say that their ability todeliver quality care has worsened over the past five years,while little more than half of the American public rates thequality of health care as good or excellent (Blendon andBenson 2001; Blendon et al. 2001; see Chart 4–1). In part,these ratings reflect the very high expectations thatAmericans have for their health care.
Leatherman and McCarthy, Quality of Health Care in the United States: A Chartbook, 2002. The Commonwealth Fund 11
The unique organization and financing of health care inAmerica explains why the World Health Organization(WHO) rates the U.S. as having the most individuallyresponsive health care system in the world, while rankingthe U.S. in 37th place overall (among 191 countries) becauseof the significant disparities that exist between those who havepredictable access to health care when needed and those whodo not (WHO 2000). Inarguably, there is much to appreciateabout our health care system and much to improve upon.
This Chartbook is designed to raise the level of publicawareness about critical gaps in quality by portraying wherewe as a nation have been, where we are today, and where weneed to go in seeking to measure and close gaps in the qualityof American health care. Regardless of differences in perspec-tive, Americans want a health care system that is safe, effective,efficient, responsive, and available when needed.
What do we know about quality in the U.S.?
We know that American health care is respected worldwidein terms of its training and education, technological sophis-tication, focus on the consumer, and relative ease of accessfor those with insurance coverage or ability to pay. We alsoknow the quality problems that exist cannot be cured simplyby more money. In fact, the U.S. spends more on healthcare per capita ($4,637 in 2000) and as a proportion of theGross Domestic Product (GDP) than any other nation inthe world. National Health Expenditures—which stood atapproximately $1.3 trillion dollars in 2000 or 13 percent of the GDP—are projected to reach $2.6 trillion dollars by 2010, consuming 16 percent of GDP (Levit et al. 2002;Heffler et al. 2001). We can and should do much better interms of the way health care is delivered and what is achieved.In some areas, the U.S. is clearly performing more poorlythan other countries. One example is the rate of childhoodimmunizations in the U.S., which tied for 82nd place on itsrate of polio vaccination out of 171 countries reporting datain 2000 to the World Health Organization (WHO 2001).
Leatherman and McCarthy, Quality of Health Care in the United States: A Chartbook, 2002. The Commonwealth Fund 12
It is clear that improvement in six areas of performancecould significantly affect the process and outcomes of healthcare: (1) consistently providing appropriate and effectivecare, (2) reducing unjustified geographic variation in care,(3) eliminating avoidable mistakes, (4) lowering access barriers,including lack of insurance, (5) improving responsiveness topatients, and (6) eliminating racial/ethnic, gender, socioeco-nomic, and other disparities and inequalities in access andtreatment. A brief overview of each area is listed below.
Appropriate and effective treatment and prevention foracute and chronic diseaseIn the U.S., studies published in leading medical journalsconsistently report findings that people with acute andchronic medical conditions receive only about two-thirds of the health care that they need while 20 percent to 30percent of the tests and procedures provided to patients arenot needed or beneficial (Schuster, McGlynn, and Brook1998). This is described as a quality problem of overuse andunderuse. For example, physicians continue to prescribeantibiotics for the common cold even though the evidenceis clear that antibiotics are ineffective—this is overuse. Andin more complex conditions such as heart disease, medicationssuch as beta-blockers that are known to be effective in pre-venting the recurrence of a heart attack are not prescribed—this is underuse (see Chart 1–13). In numerous other clinicalsituations, even when the most effective treatment processes
are known and agreed upon, the care does not reflect goodscience. Representative cases include treatment for pneumonia(see Chart 1–7), diabetes (see Chart 1–9), and others presentedgraphically in Chapter 1.
Geographic variationThe last several decades have produced a large amount ofevidence that there are significant variations in the use ofmedical treatments and procedures, even for patients whosesymptoms and illness are similar (Wennberg and Gittelsohn1973; Wennberg and Cooper 1999). Surgical rates vary dramatically from one region of the country to another, asillustrated in another chartbook, the Dartmouth Atlas on HealthCare Quality in the U.S. (Wennberg and Cooper 1999). Thisquality problem of unjustified variation reflects a failure toconsistently practice in accordance with the scientific evidenceand professional expert consensus, as well as a lack of clearevidence in some situations on what approach works best.Unjustified variation not only has potential implications forpatient outcomes, but also constitutes mismanagement ofresources. For example, physicians in Texas are more likelyto perform invasive heart procedures than physicians in NewYork; however, the outcomes are not any better for the Texaspatients (Guadagnoli et al. 1995).
Leatherman and McCarthy, Quality of Health Care in the United States: A Chartbook, 2002. The Commonwealth Fund 13
Medical mistakesThe number of deaths related to medical mistakes was estimat-ed to be 44,000–98,000 annually according to the Instituteof Medicine (IOM 2000). Although other studies havequestioned these numbers, few dispute the importance ofthe problem. Medical mistakes exist in rare situations suchas amputation of the wrong limb, or much more commonbut potentially more lethal situations of prescribing contraindi-cated drugs or a drug overdose. Advancements in medicineactually may lead to more opportunities for error, such asan increase in medication mistakes as more drugs are used(see Chart 2–5). Chapter 2 illustrates this dimension ofquality in further detail.
Access issuesAccess problems are many and diverse. Lack of insurance is amajor reason for not obtaining access to care when and whereneeded. Those without insurance coverage are less likely toobtain needed medical care and preventive tests (see Charts3–1 to 3–4). These and other issues, such as lack of an estab-lished relationship with a doctor are illustrated in Chapter 3.But even with insurance, people may not be able to obtaincare because of barriers in language, culture, transportation, orgeography. For example, a family may have insurance coveragebut not be able to navigate the health care system becausethey do not speak English (see Chart 5–7). Likewise, merelyhaving insurance coverage is not sufficient if an individualrequires specialist care that is not geographically available.
Responsiveness/patient-centered careQuality from a patient’s view does not relate only to technicalproficiency and skill. Respect, dignity, autonomy, kindness,and convenience are also critical from a patient’s perspectiveand constitute important elements of quality to the public.A great deal of activity is now focused on providing infor-mation to patients enabling them to make better informeddecisions when selecting where to get health care (whatphysician, clinic, HMO, etc.), as well as how to participatemore actively in treatment choices. Research has shown thatpatients do use and make prudent decisions when given goodinformation that is tailored to their needs (Coulter 2001).Chapter 4 illustrates how patients’ perceptions relate to theirexperience with health care in various settings.
We also must pay particular attention to the quality of carefor vulnerable populations, such as nursing home residents.These patients are sometimes overlooked, but their problemscan be serious, even tragic. A recently published survey showedgenerally positive views from people that have a friend orfamily member in a nursing home. However, a significantminority indicate that they, or a person they know, receivedpoor-quality care, with about one-quarter reporting incidentsof abuse or poor treatment by staff (NewsHour with JimLehrer/Kaiser Family Foundation/Harvard School of PublicHealth 2001; see Charts 4–8 to 4–10).
Leatherman and McCarthy, Quality of Health Care in the United States: A Chartbook, 2002. The Commonwealth Fund 14
Disparities and inequalitiesIssues related to quality affect the entire U.S. population,but not equally. Research reveals disparities in treatmentreceived by certain parts of the population. For example,there is significant race, gender, and socioeconomic variationin the rates of medical procedures. In general, the evidenceshows that minorities, as defined by race and ethnicity, are lesslikely to receive routine medical procedures. For example,African-Americans are less likely to receive cardiac treatmentand are also less likely to receive kidney transplantation whensuffering from end stage renal disease (Kressin and Petersen2001; Epstein et al. 2000; see Charts 5–3 and 5–5). Theseand other disparities are illustrated in Chapter 5.
The way forward: What can be done toimprove quality?
Quality will not simply improve over time. In fact, challengesto quality are likely to escalate due to growth in the agingpopulation, which will lead to more serious and chronic illness, increased public demand, and continued resourceconstraints. Historically, quality has largely been addressedthrough professional registration and licensure, accreditationof hospitals, and the less formal professional peer reviewprocesses. While these traditional methods of quality man-agement are important and need to continue, new approachesto improving performance will depend on both better diagnosisof the problems and implementation of effective corrective
strategies. A key lesson from other industries is that mostquality problems can be traced to flawed systems, lack ofproper training, and perverse incentives that hinder peoplefrom performing optimally. Long-term restructuring programsto build knowledge, standardize processes, redesign systems,and reward good performance will be needed. Chapter 6portrays examples of quality improvement initiatives that havebeen effective for improving patient care and responsiveness.
Enhancing knowledgeClosing the gap between what is scientifically known andthe practice patterns of health providers is not simply amatter of exhorting everyone to work better and harder.With thousands of clinical research trials under way, the sheervolume of the medical literature makes it humanly impossiblefor physicians to master all the emerging new knowledge.This is true not only for new and complicated medical treat-ments such as cancer care but even the most routine ones,such as treatment of sore throats. For example, evidence-basedguidelines can help physicians determine the best course oftreatment for sore throat since it is usually caused by a virusand will resolve on its own, rendering antibiotic treatmentuseless in all but the small minority of cases that are likelyto be caused by bacterial infection (see Chart 1–6). Therefore,methods and systems to support the best of medicine, suchas systematic reviews of the literature, guidelines, and com-puterized practice prompts, need to be routinely implemented.
Leatherman and McCarthy, Quality of Health Care in the United States: A Chartbook, 2002. The Commonwealth Fund 15
Making information on quality availableOne reason for the uneven quality of health care is the lackof systematic reliable reporting that objectively describes thenature of the problem and monitors progress. That gap maybe addressed, in part, by The National Healthcare Quality Report,mandated by Congress to be published annually by the Agencyfor Health Care Research and Quality (AHRQ) starting in2003. In 1999, the U.S. Congress requested that a NationalDisparities Report be published annually by AHRQ. It willbe a complement to The National Healthcare Quality Report.The National Disparities Report will describe disparities asthey relate to socioeconomic and racial factors in the areasof access, utilization and quality of health care services.
As important as these national level reports will be, it isimportant to note that quality takes place at the front lines,where the patient and health care provider interact. It is atthis level that fair and useful quality measurement and feed-back needs to take place, allowing caregivers, hospitals, andhealth care systems to understand where improvement isneeded. Fortunately, there is evidence that organizationsand systems of care will use performance data to improveprocesses of care, identify and deal with individuals who arepoor performers, and make changes in response to consumers’complaints (Marshall, Shekelle, Leatherman, et al. 2000).
Increasingly, the individual patient is also regarded as an important audience of quality data. For example, inNovember 2001, the federal government launched a newquality initiative to help people (and their families) whorely on Medicare and Medicaid programs to find the bestnursing homes for their needs. Consumers will be able tocompare the quality of facilities on eleven different qualitymeasures online. Similarly detailed comparisons of othertypes of health care institutions including home care agenciesand hospitals will also be available in the future, according to the federal government (DHHS 2001).
Improving quality through coverageThe title of a recently published report from the Institute ofMedicine says it succinctly: “Coverage Matters.” Though thesubject of this chartbook is quality of health care servicesdelivered in America, it would be remiss not to mentionthe quality implications for the large number of uninsuredin America. Many people who lack insurance tend to forgohealth care until their medical situation becomes intolerable.About 39 million Americans, or 14 percent of the population,were without insurance coverage for all of 2000, accordingto the U.S. Census Bureau. Four-fifths of the uninsured arechildren and adults in working families. Among employees,those who work for small companies are more likely not tohave insurance because small employers say they are unableto afford the high premiums for their workers (IOM 2001c).
Leatherman and McCarthy, Quality of Health Care in the United States: A Chartbook, 2002. The Commonwealth Fund 16
Rewarding qualityPerformance needs to be evaluated and reinforced.Attempts to exploit consumer market forces have had only a marginal effect to date and the need to implementincentives is increasingly recognized. Pay for performance is a concept of interest in both publicly financed and private-pay health systems. The judicious use of incentives requirescareful design in two ways: the reinforcement of positiveperformance and the removal of mechanisms that adverselyaffect performance. Incentives may be of either a financialor non-financial nature. For example, a coalition of largeNew York corporations, on behalf of more than 100,000employees, will pay cash incentives to hospitals that meetcertain safety requirements such as having intensive carespecialists on staff and implementing computerized physicianordering systems to reduce prescribing mistakes (Freudenheim2000). Non-financial incentives may include more innovativeand potentially effective mechanisms such as reductions inoversight and intrusive administrative decisions, as well asprofessional and institutional recognition.
Conclusion
Quality is a challenging issue, defined differently by variousstakeholders and impacted on many levels—from the com-plexity of large organizations to the dynamics of interpersonalrelationships. Even with the multitude of perspectives, thereis little argument that Americans are increasingly concernedabout effectiveness, responsiveness, and access to health care.Information about quality is necessary to identify the prior-ity areas, create a common understanding of the gaps, andpoint to reasonable strategies for improving the Americanhealth care system.
Sheila LeathermanMinneapolis, Minnesota
Douglas McCarthyDurango, Colorado
Leatherman and McCarthy, Quality of Health Care in the United States: A Chartbook, 2002. The Commonwealth Fund 17
Notes on format and content
Organization: The organization of data presented in thisChartbook generally follows the framework recommendedby the Institute of Medicine for Envisioning the National HealthCare Quality Report (IOM 2001b). We depart from that frame-work in certain respects where we felt it beneficial or necessarydue to constraints imposed by the available published dataand the imperative to highlight certain issues such as accessand disparities.
Sources of data: We selected charts based on considerationsof strength of data, balance, and relevance for a lay audience.In most cases, the data displayed in charts has been derivedfrom published studies or from the reports of governmentagencies or research institutions. We conducted a focusedMedline search by disease/condition based on a previousliterature review by RAND (Schuster, McGlynn, and Brook1998) and bibliographies compiled for other relevant reportssuch as those of the Institute of Medicine (IOM 2000; 2001a;2001b), the President’s Advisory Commission (1998), theMedicare Health Care Quality Improvement Initiative(CMS 2000), and Healthy People 2010 (DHHS 2000).
Significance: We generally show only results that are statistically significant, where significance has been reported(i.e., 95 percent confidence or greater that differences arenot due to random chance). In other cases, we report onwhat we considered meaningful results.
State data: State-specific data typically includes the 50 statesplus the District of Columbia. We have omitted Puerto Ricodata where it was included in original sources of state-specificresults, since differences in the organization and financingof health care make comparisons between Puerto Rico andthe States problematic. In some cases, a U.S. average wasreported. In other cases, we have calculated a median. Themedian represents the middle value (middle of the range)when the state rates are ordered from lowest to highest.
Race/ethnicity: We report data on race and ethnicity gen-erally following the usage from the original study or survey(e.g., black or African-American), recognizing that peoplehave different preferences. Due to limited space, we weregenerally unable to report fully on gender, socioeconomic,and geographic disparities.
Please see the Technical Appendix for a more detailedexplanation of sources and methodology.

Chapter 1
Effectiveness
Effectiveness is probably the component of health care most readily identified because ultimately it represents the “bottom line,” that is, whether care leads to improved outcomes in terms of health status and quality of life for patients.
—Institute of Medicine, 2001b

Leatherman and McCarthy, Quality of Health Care in the United States: A Chartbook, 2002. The Commonwealth Fund 21
Effectiveness means “providing services based on scientific knowledge to all who could benefit, and refraining from providingservices to those not likely to benefit” (IOM 2001b). The qualitymeasures included in this chapter represent a variety ofcommon diseases or conditions, organized to depict threeconsumer perspectives on health care:
• Staying healthy means getting help to avoid illness and remain well. This entails preventive care such asimmunizations to prevent infectious diseases, cancerscreenings to promote early detection and treatment of disease, and counseling on healthy behaviors.
• Getting better means getting help to recover from an illness or injury, such as appropriate antibiotic treatmentfor sore throats or pneumonia.
• Living with chronic illness means getting help managingan ongoing condition such as diabetes. This often entailsgetting patient education, proper medication management,and regular follow-up care to prevent complications.
The data show some striking improvements over time:
• a doubling in rates of flu shots for older adults and mammography among women (Charts 1–2 and 1–4),
• a 44 percent increase in appropriate antiretroviral therapyamong adults with HIV (Chart 1–12),
• one-third faster treatment of heart attack victims withclot-dissolving drugs in some hospitals (Chart 1–14), and
• a 50 percent reduction in the use of physical restraintsamong nursing home facilities (Chart 1–16).
Yet, substantial deficits remain in many areas:
• Less than half of adults age 50 and over are screened forcolorectal cancer as recommended (Chart 1–3).
• Antibiotics are overused to treat sore throats but not usedquickly enough to treat pneumonia (Chart 1–6 and 1–7).
• One-third of common surgical procedures are performedfor inappropriate reasons or have questionable benefits forpatients (Chart 1–8).
• Up to three-quarters of adults with diabetes do notreceive recommended care (Chart 1–9).
• Up to half of older hospital patients who would benefitfrom medications to prevent strokes and recurrent heartattacks do not get these drugs (Charts 1–11 and 1–13).
Chapter 1
Effectiveness: Introduction
Leatherman and McCarthy, Quality of Health Care in the United States: A Chartbook, 2002. The Commonwealth Fund 22
Chart 1–1: Childhood Immunizations—Over one-quarter of young children were not up-to-date on five key immunizations nationally in 2000.
Chart 1–2: Trend in Immunizations for Older Adults—More older adults (age 65 and over) received vaccinationsto prevent influenza and pneumonia as recommended overthe past decade, but one-third to one-half still do not receivethese potentially life-saving vaccinations.
Chart 1–3: Colorectal Cancer Screening—In 1999, lessthan half of adults age 50 and over had received recommendedtests that are effective in reducing premature deaths fromcolorectal cancer.
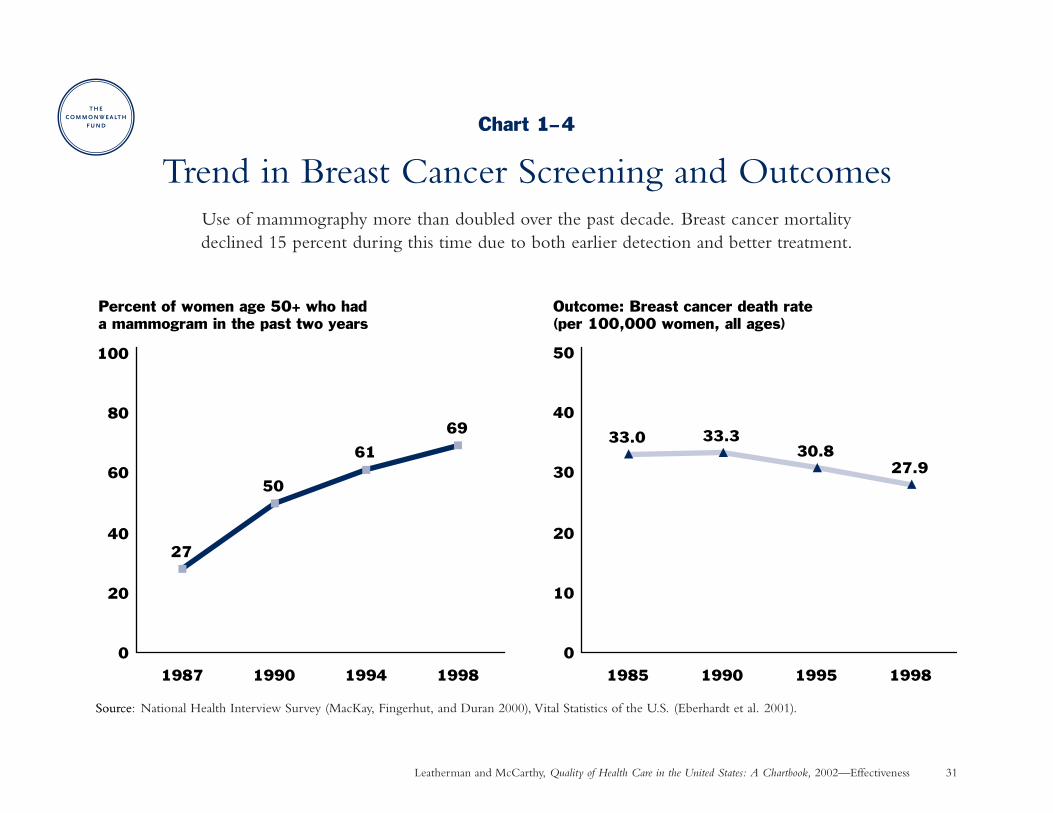
Chart 1–4: Trend in Breast Cancer Screening andOutcomes—Use of mammography more than doubled overthe past decade. Breast cancer mortality declined 15 percentduring this time due to both earlier detection and bettertreatment.
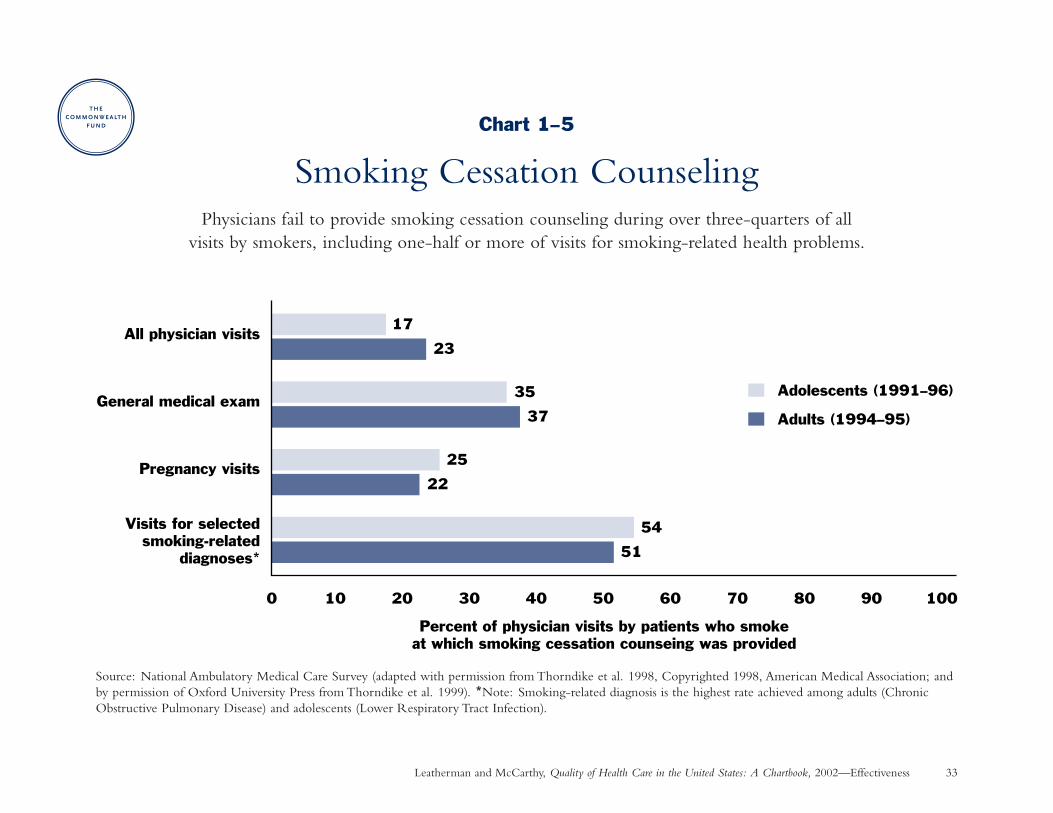
Chart 1–5: Smoking Cessation Counseling—Physiciansfail to provide smoking cessation counseling during overthree-quarters of all visits by smokers, including one-half or more of visits for smoking-related health problems.
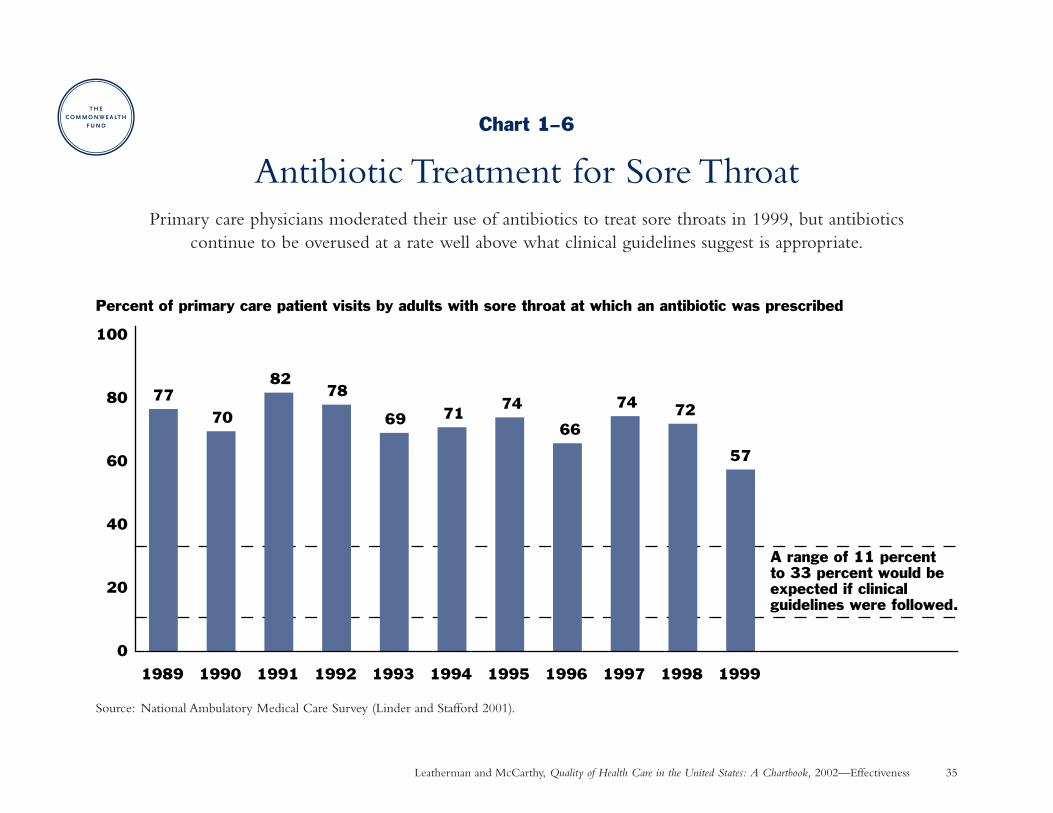
Chart 1–6: Antibiotic Treatment for Sore Throat—Primary care physicians moderated their use of antibioticsto treat sore throats in 1999, but antibiotics continue to beoverused at a rate well above what clinical guidelines suggestis appropriate.
Chart 1–7: Antibiotic Treatment for Pneumonia—In half the states, more than 14 percent of Medicare benefi-ciaries hospitalized with pneumonia did not receive timelyand appropriate antibiotic care during 1998–1999.
Chart 1–8: Appropriateness of Procedures as Rated by Expert Consensus—Over the past two decades, severalstudies have found that about one-third of surgical procedureswere performed for inappropriate reasons or had questionablebenefit for patients.
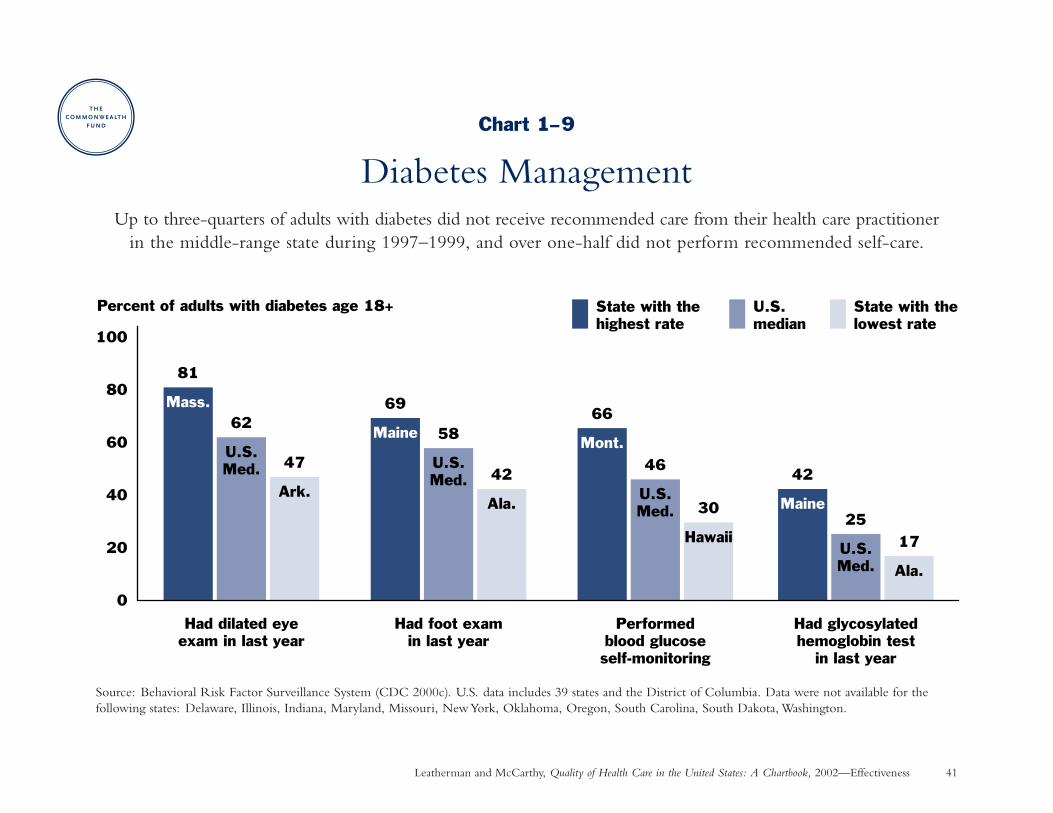
Chart 1–9: Diabetes Management—Up to three-quartersof adults with diabetes did not receive recommended carefrom their health care practitioner in the middle-range stateduring 1997–1999, and over one-half did not perform rec-ommended self-care.
Effectiveness: Summary of Charts and Findings
Leatherman and McCarthy, Quality of Health Care in the United States: A Chartbook, 2002. The Commonwealth Fund 23
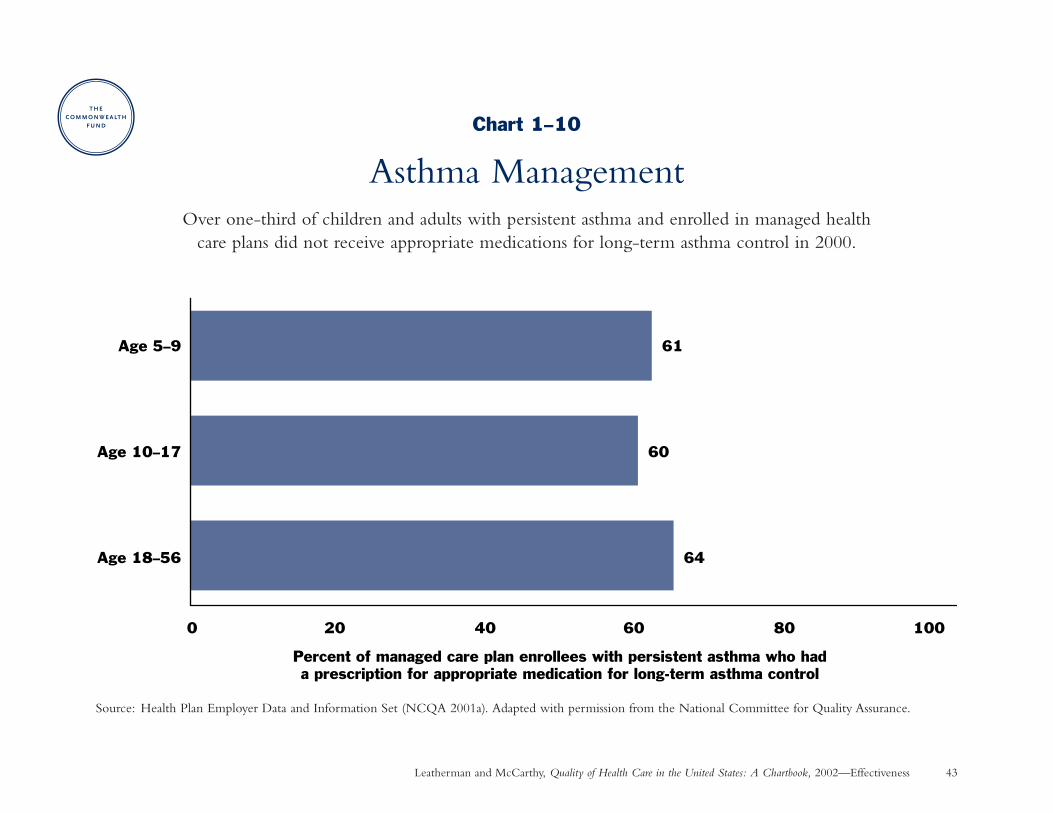
Chart 1–10: Asthma Management—Over one-third ofchildren and adults with persistent asthma enrolled in managedhealth care plans did not receive appropriate medications forlong-term asthma control in 2000.
Chart 1–11: Stroke Prevention for Patients with AtrialFibrillation—In half the states during 1997–1999, 45 percent(or more) of hospitalized Medicare patients with irregularheart beat did not receive blood thinning drugs to reducetheir risk of having a stroke.
Chart 1–12: Treatment and Outcomes for HIV—There was a 44 percent increase in highly active antiretroviraltherapy for adult patients with HIV from 1996 to 1998, withfewer adverse outcomes. Still, one-half of HIV patients didnot have satisfactory care and outcomes.
Chart 1–13: Medication to Prevent Recurrent HeartAttack—In half the states during 1998–1999, over one-quarter of eligible Medicare heart attack patients did notreceive medication that is effective in preventing recurrentheart attacks and improving long-term survival.
Chart 1–14: Speed to Treatment with Clot-DissolvingDrugs Following a Heart Attack—Selected hospitalsreduced the time to start treatment with clot-dissolvingdrugs that restore blood flow to the heart muscle by nearly40 percent, but further improvement is needed to reach thenational goal of 30 minutes.
Chart 1–15: Mental Health Care: Treatment forDepression—More patients with depression received anti-depressant medication in a 1996–1997 study than in a similar1986 study, but a significant proportion of people did notreceive effective treatment.
Chart 1–16: Nursing Home Care and Outcomes—The use of physical restraints declined by half among nursinghomes from 1994 to 2000, suggesting improved quality.The prevalence of pressure ulcers (bed sores) changed onlyslightly from 1994 to 2000, indicating a need for furtherimprovement.
Leatherman and McCarthy, Quality of Health Care in the United States: A Chartbook, 2002. The Commonwealth Fund 24
Effectiveness: Staying Healthy
Childhood ImmunizationsWhy is this important? Vaccination is one of the most cost-effective disease prevention strategies in public health.
Vaccination also protects against mild illnesses that result in absence from school and lost workdays for parents.High vaccination levels must be achieved to protect children against periodic outbreaks of infectious disease.For example, a measles epidemic in 1989–1991 resulted in 11,000 people being hospitalized, 120 deaths, and$100 million in medical costs (DHHS 2000). More recently, nearly 8,000 cases of pertussis were reported in2000, resulting in 62 deaths (CDC 2002a).
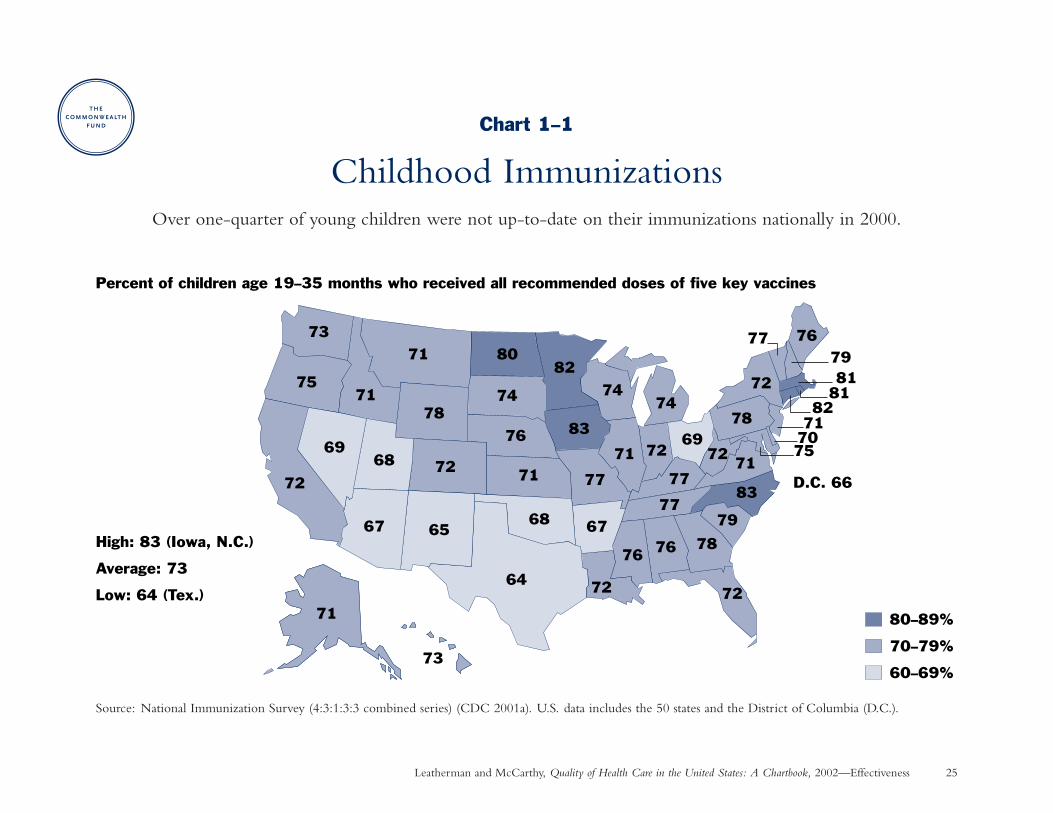
Findings: Over one-quarter of young children age 19 to 35 months were not fully up-to-date on all recommendeddoses of five key vaccines nationally in 2000. Among the states, coverage rates ranged from a low of 64 percent inTexas to a high of 83 percent in Iowa and North Carolina. Source: National Immunization Survey (CDC 2001a).
The vaccines included in this combined series (and their specific rates of coverage in 2000) are: diphtheria-tetanus-pertussis or diphtheria-tetanus (82%), poliovirus (90%), a measles-containing vaccine (91% for themeasles-mumps-rubella vaccine), Haemophilus influenzae type b (93%), and Hepatitis B (90%). The new Varicella(chicken pox) vaccine—which is not included in this combined series—achieved 68 percent coverage in 2000(CDC 2001a).
Implications: The United States lags behind other nations in achieving widespread vaccination of children. Forexample, the U.S. tied for 65th place out of 164 countries worldwide on rates of coverage with three doses ofdiphtheria-tetanus-pertussis vaccine in 2000 (WHO 2001). Immunization rates have risen over the past decadedue to expanded public and private financing and improvement initiatives. Further improvement will requireongoing education as well as better monitoring and reminder systems to reduce missed opportunities for vaccination (CDC 2001a; see Chart 6–1).
Leatherman and McCarthy, Quality of Health Care in the United States: A Chartbook, 2002—Effectiveness 25
73
75
72
71
73
71
71
78
72
80
74
76
82
83
77
72
71
7474
77
77
78
79
83
7172
78
72
71 72
76 76
76
72
Percent of children age 19–35 months who received all recommended doses of five key vaccines
D.C. 66
777981
8182
71707569
68
67 65
64
68 67
69
80–89%
70–79%
60–69%
High: 83 (Iowa, N.C.)
Average: 73
Low: 64 (Tex.)
Chart 1–1
Childhood ImmunizationsOver one-quarter of young children were not up-to-date on their immunizations nationally in 2000.
Source: National Immunization Survey (4:3:1:3:3 combined series) (CDC 2001a). U.S. data includes the 50 states and the District of Columbia (D.C.).
Leatherman and McCarthy, Quality of Health Care in the United States: A Chartbook, 2002. The Commonwealth Fund 26
Effectiveness: Staying Healthy
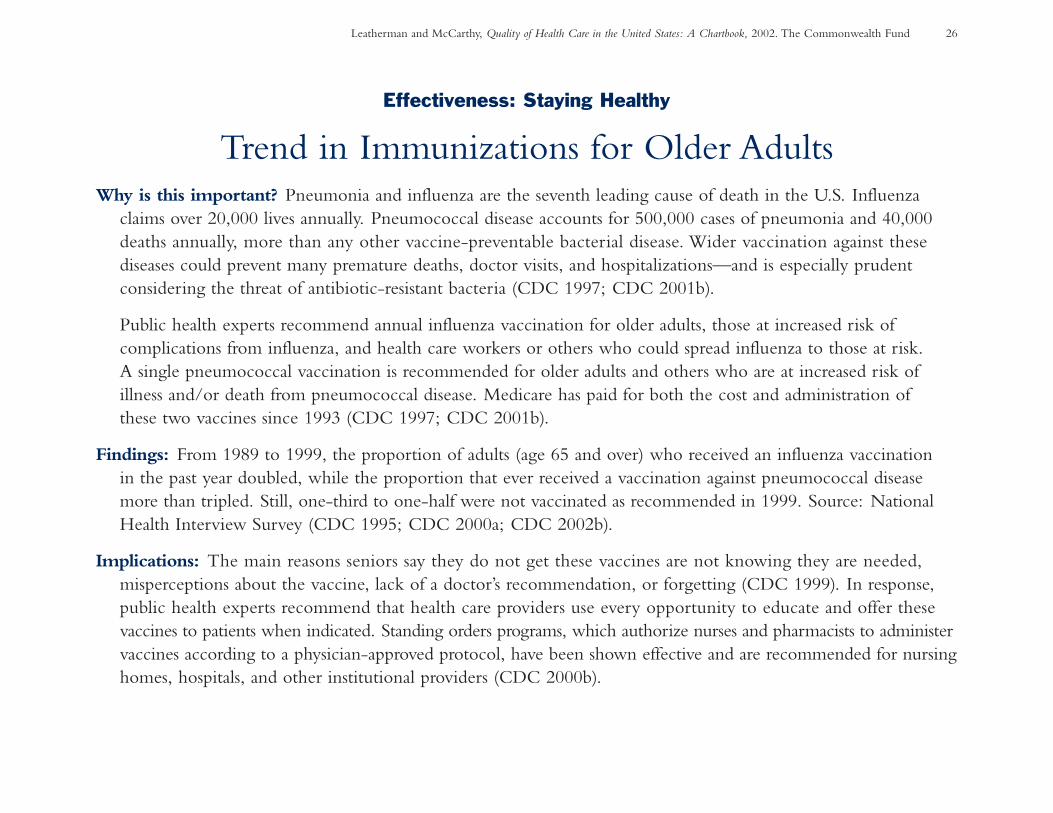
Trend in Immunizations for Older AdultsWhy is this important? Pneumonia and influenza are the seventh leading cause of death in the U.S. Influenza
claims over 20,000 lives annually. Pneumococcal disease accounts for 500,000 cases of pneumonia and 40,000deaths annually, more than any other vaccine-preventable bacterial disease. Wider vaccination against these diseases could prevent many premature deaths, doctor visits, and hospitalizations—and is especially prudent considering the threat of antibiotic-resistant bacteria (CDC 1997; CDC 2001b).
Public health experts recommend annual influenza vaccination for older adults, those at increased risk of complications from influenza, and health care workers or others who could spread influenza to those at risk.A single pneumococcal vaccination is recommended for older adults and others who are at increased risk of illness and/or death from pneumococcal disease. Medicare has paid for both the cost and administration of these two vaccines since 1993 (CDC 1997; CDC 2001b).
Findings: From 1989 to 1999, the proportion of adults (age 65 and over) who received an influenza vaccination in the past year doubled, while the proportion that ever received a vaccination against pneumococcal diseasemore than tripled. Still, one-third to one-half were not vaccinated as recommended in 1999. Source: NationalHealth Interview Survey (CDC 1995; CDC 2000a; CDC 2002b).
Implications: The main reasons seniors say they do not get these vaccines are not knowing they are needed,misperceptions about the vaccine, lack of a doctor’s recommendation, or forgetting (CDC 1999). In response,public health experts recommend that health care providers use every opportunity to educate and offer thesevaccines to patients when indicated. Standing orders programs, which authorize nurses and pharmacists to administervaccines according to a physician-approved protocol, have been shown effective and are recommended for nursinghomes, hospitals, and other institutional providers (CDC 2000b).
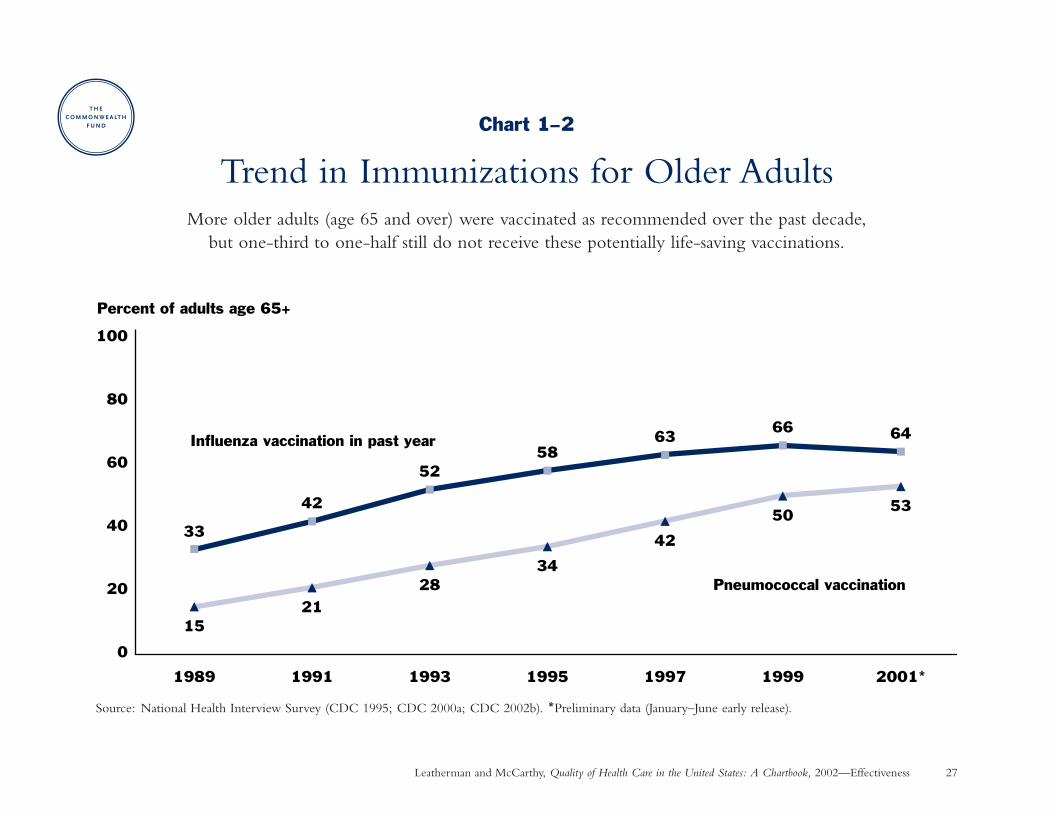
Chart 1–2
Trend in Immunizations for Older AdultsMore older adults (age 65 and over) were vaccinated as recommended over the past decade,
but one-third to one-half still do not receive these potentially life-saving vaccinations.
Leatherman and McCarthy, Quality of Health Care in the United States: A Chartbook, 2002—Effectiveness 27
Source: National Health Interview Survey (CDC 1995; CDC 2000a; CDC 2002b). *Preliminary data (January–June early release).
33
42
5258
6366 64
1521
2834
42
5053
0
20
40
60
80
100
1989 1991 1993 1995 1997 2001*1999
Influenza vaccination in past year
Pneumococcal vaccination
Percent of adults age 65+

Leatherman and McCarthy, Quality of Health Care in the United States: A Chartbook, 2002. The Commonwealth Fund 28
Effectiveness: Staying Healthy
Colorectal Cancer ScreeningWhy is this important? Colorectal (colon or rectum) cancer is the second most common cause of cancer death in the
U.S., claiming 56,000 lives each year and reducing life by 13 years on average (USPSTF 1996; ACS 2001). Expertsrecommend the following screening for adults age 50 and over to detect polyps or cancers at an earlier and moretreatable stage, which can reduce deaths from colorectal cancer by one-third or more (AGA 1997; AMA 2001):
• fecal occult blood test every year (to detect blood hidden in the stool), and/or flexible sigmoidoscopy everyfive years (a thin, lighted tube is used to visually inspect the rectum and the lower part of the large intestine), or
• total colon examination by colonoscopy every 10 years (similar to sigmoidoscopy, except the doctor caninspect the rectum and the entire large intestine), or by double-contrast barium enema every five to 10 years (an X-ray examination of the rectum and the entire large intestine).
Findings: In 1999, only 21 percent of adults age 50 and over reported having a fecal occult blood test in the pastyear, and 40 percent had ever had such a test. Likewise, just 34 percent reported that they had a sigmoidoscopyor colonoscopy in the past five years, and 44 percent had ever had such a test. Overall, 44 percent had either afecal occult blood test in the past year or sigmoidoscopy/colonoscopy in the past 5 years. Rates of screening wererelatively low even in the best performing states. Source: Behavioral Risk Factor Surveillance System (CDC 2001c).
Implications: Screening for colorectal cancer remains widely underused and has not yet garnered the public attentiondevoted to other cancers. Reasons for underuse may include lack of knowledge about colorectal cancer and theeffectiveness of screening, potential cost barriers (Medicare began paying for these tests for screening purposes in2001), embarrassment or perceptions that the tests are uncomfortable, or lack of a physician recommendation.Rates of screening are higher when these tests are recommended by a physician (AGA 1997).
Leatherman and McCarthy, Quality of Health Care in the United States: A Chartbook, 2002—Effectiveness 29
Chart 1–3
Colorectal Cancer ScreeningIn 1999, less than half of adults age 50 and over had received recommended tests that are effective in reducing premature deaths from colorectal cancer.
Source: Behavioral Risk Factor Surveillance System (CDC 2001c). U.S. data include the 50 states plus the District of Columbia (D.C.).
Had sigmoidoscopy or colonoscopyHad fecal occult blood test
0
20
40
60
80
100
Ever In the past year Ever In the past 5 years
Percent of adults age 50+
State with the lowest rate
U.S. average
State with the highest rate
12
Ala.
40
U.S.average
21
U.S.average
36
D.C.
44
U.S.average
34
U.S.average
22
Neb.
46
Del.
Leatherman and McCarthy, Quality of Health Care in the United States: A Chartbook, 2002. The Commonwealth Fund 30
Effectiveness: Staying Healthy
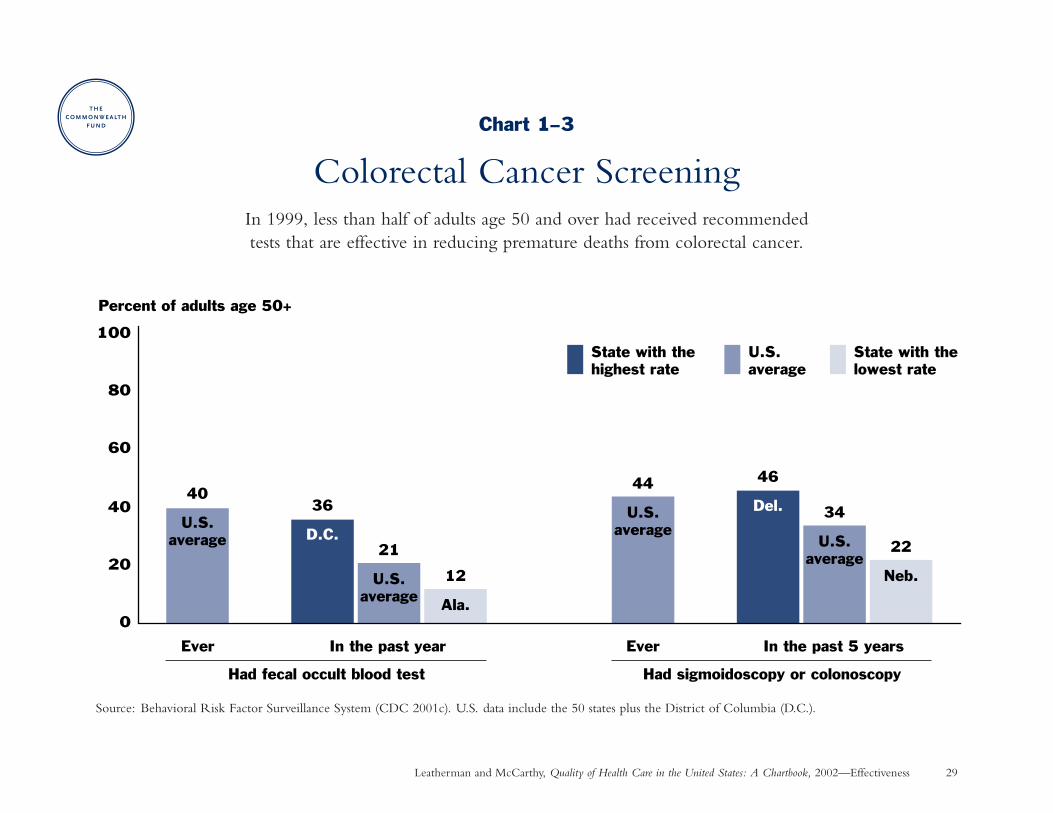
Trend in Breast Cancer Screening and OutcomesWhy is this important? Breast cancer is the most commonly diagnosed, non-skin cancer among U.S. women,
with over 190,000 new cases and 40,000 deaths annually (ACS 2001). Breast cancer victims lose 19 years fromtheir normal life span on average (Brown, Lipscomb, and Snyder 2001).
Breast cancer screening includes breast self-examination, clinical breast examination by a physician or nurse,and mammography. Mammography is a low-dose X-ray of the breast that can detect breast cancer at its earliestand most treatable stage, before a lump can be felt. Routine mammography reduces death from breast cancer by 17 percent to 23 percent when the results of research studies are pooled together. There has been controversyregarding the age at which routine mammography should begin. Many expert bodies, including the U.S. PreventiveServices Task Force, now recommend mammography every one to two years starting at age 40, although theevidence is strongest for screening women age 50–69 (USPSTF 2002). This chart shows screening starting at age50 to reflect the consensus of recommendations during the time period measured.
Findings: The rate of mammography more than doubled from 1987 to 1998. Still, three out of 10 women age 50 and over had not obtained a mammogram in the past two years in 1998. Breast cancer death ratesdeclined 15 percent from 1985 to 1998, most likely as a result of both earlier detection and better treatment(ACS 2001). Source: National Health Interview Survey (MacKay, Fingerhut, and Duran 2000) and VitalStatistics of the U.S. (Eberhardt et al. 2001).
Implications: Increases in mammography rates reflect initiatives such as the National Breast and Cervical CancerEarly Detection Program, private-sector quality improvement programs, better insurance coverage, and widespreadpublic attention to this issue. Important factors are a physician’s recommendation that a woman have a mammogramas well as a woman’s participation with her doctor in the decision to be screened (Phillips et al. 1998).
Leatherman and McCarthy, Quality of Health Care in the United States: A Chartbook, 2002—Effectiveness 31
Source
Chart 1–4
Trend in Breast Cancer Screening and OutcomesUse of mammography more than doubled over the past decade. Breast cancer mortality declined 15 percent during this time due to both earlier detection and better treatment.
Source: National Health Interview Survey (MacKay, Fingerhut, and Duran 2000), Vital Statistics of the U.S. (Eberhardt et al. 2001).
27
50
61
69
0
20
40
60
80
100
1987 1990 1994 1998
Percent of women age 50+ who had a mammogram in the past two years
33.0 33.330.8
27.9
0
10
20
30
40
50
1985 1990 1995 1998
Outcome: Breast cancer death rate (per 100,000 women, all ages)

Leatherman and McCarthy, Quality of Health Care in the United States: A Chartbook, 2002. The Commonwealth Fund 32
Effectiveness: Staying Healthy
Smoking Cessation CounselingWhy is this important? Nearly one-fourth of adults and one-third of high school students smoke cigarettes.
Smoking is the most preventable cause of disease and death in the U.S. (DHHS 2000). Smokers who quitreduce their risk of death from heart disease by one-half after one year and their risk of lung cancer by up to one-half after 10 years. Pregnant women who stop smoking have better birth outcomes (USPSTF 1996).
Many health promotion organizations recommend that physicians counsel smokers to stop smoking. Physiciansinteract with over two-thirds of smokers during regular medical care. Controlled studies have found that physiciancounseling increases abstinence rates, especially when there is consistent and repeated advice from several physicians;even higher quit rates are achieved when counseling pregnant women and patients with heart disease (USPSTF1996).
Findings: Although physicians regularly identify their patients’ smoking status, they counsel patients to stop smokingmuch less often: at less than one in four visits by adults who smoke and one in six visits by adolescent smokers.Even when they are visiting for smoking-related health problems, one-half or more of smokers do not receivesmoking cessation counseling. Source: National Ambulatory Medical Care Survey (Thorndike et al. 1998,Thorndike et al. 1999.)
Implications: Even a small improvement in smoking cessation can have a substantial impact in reducing the burdenof disease associated with smoking. Physicians currently miss many opportunities to counsel patients about smokingcessation. Physicians say that they often do not have enough time to provide more consistent counseling onbehavioral risk factors due to a lack of reimbursement for such services (DHHS 2000). Additional training andsupport for counseling services may be needed to help physicians improve this performance.
Leatherman and McCarthy, Quality of Health Care in the United States: A Chartbook, 2002—Effectiveness 33
Chart 1–5
Smoking Cessation CounselingPhysicians fail to provide smoking cessation counseling during over three-quarters of all
visits by smokers, including one-half or more of visits for smoking-related health problems.
Source: National Ambulatory Medical Care Survey (adapted with permission from Thorndike et al. 1998, Copyrighted 1998, American Medical Association; andby permission of Oxford University Press from Thorndike et al. 1999). *Note: Smoking-related diagnosis is the highest rate achieved among adults (ChronicObstructive Pulmonary Disease) and adolescents (Lower Respiratory Tract Infection).
51
22
37
23
54
25
35
17
0 10 20 30 40 50 60 70 80 90 100
Visits for selectedsmoking-related
diagnoses*
Pregnancy visits
General medical exam
All physician visits
Percent of physician visits by patients who smokeat which smoking cessation counseing was provided
Adults (1994–95)
Adolescents (1991–96)

Leatherman and McCarthy, Quality of Health Care in the United States: A Chartbook, 2002. The Commonwealth Fund 34
Effectiveness: Getting Better When Sick
Antibiotic Treatment for Sore ThroatWhy is this important? Sore throat is one of the most common reasons for adults to visit a doctor. Most sore throats
are caused by a viral infection, against which antibiotic treatment is not effective. Widespread over-prescribing of antibiotics has led to the emergence of new strains of bacteria that are resistant to treatment with antibiotics.To combat the spread of antibiotic-resistant infections, public health experts and physician specialty societies recommend careful antibiotic use for patients who are most likely to benefit (Cooper et al. 2001).
Findings: Primary care physicians have recently moderated the use of antibiotics to treat adults with sore throats,prescribing them during 57 percent of patient visits in 1999 compared to 82 percent of visits in 1991. Still,antibiotics continue to be prescribed at a rate well above what clinical guidelines suggest is necessary. Source:National Ambulatory Medical Care Survey (Linder and Stafford 2001).
Implications: The large difference between the prevalence of “strep” infection among adults with sore throats (5–17%) and the proportion of such patients receiving antibiotic treatment (57% in 1999) suggests that antibioticscontinue to be overused among these patients. Treatment based on clinical guidelines would reduce antibioticuse to a rate of 11–33 percent of adult patients with sore throat (Cooper et al. 2001). Research in Finland showsthat decreasing the use of antibiotics leads to a decrease in the prevalence of antibiotic-resistant bacteria in thecommunity (Seppala et al. 1997). See Chart 6–2 for an example of a multi-faceted intervention that safelyreduced antibiotic use at one health plan.
Leatherman and McCarthy, Quality of Health Care in the United States: A Chartbook, 2002—Effectiveness 35
Chart 1–6
Antibiotic Treatment for Sore ThroatPrimary care physicians moderated their use of antibiotics to treat sore throats in 1999, but antibiotics
continue to be overused at a rate well above what clinical guidelines suggest is appropriate.
Source: National Ambulatory Medical Care Survey (Linder and Stafford 2001).
7770
8278
69 7174
66
74 72
57
0
20
40
60
100
80
1989 1990 1991 1992 1993 1994 1995 1996 1997 1998 1999
Percent of primary care patient visits by adults with sore throat at which an antibiotic was prescribed
A range of 11 percent to 33 percent would be expected if clinical guidelines were followed.
Leatherman and McCarthy, Quality of Health Care in the United States: A Chartbook, 2002. The Commonwealth Fund 36
Effectiveness: Getting Better When Sick
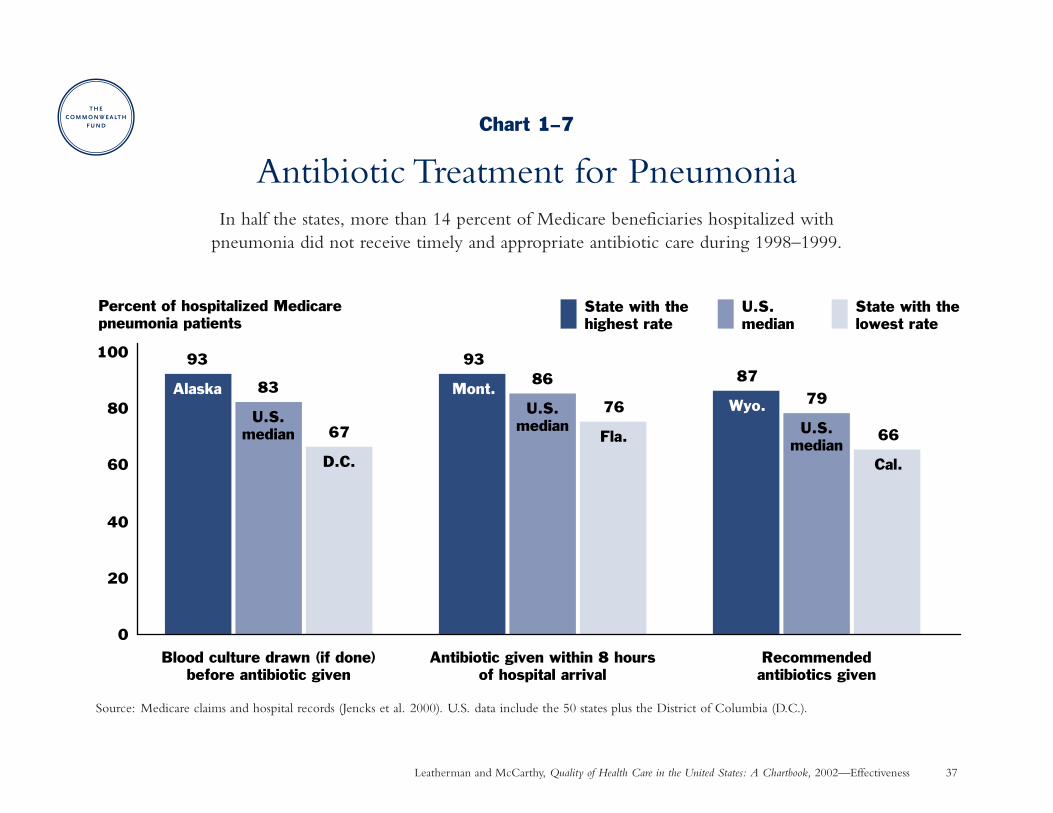
Antibiotic Treatment for PneumoniaWhy is this important? About 600,000 Medicare beneficiaries are hospitalized with pneumonia each year (CMS
2000). Research has found a 15 percent reduced death rate (30-day mortality) when Medicare patients are givenantibiotics within eight hours after hospitalization for pneumonia (Meehan et al. 1997). The American ThoracicSociety and infectious disease experts recommend that a blood culture be drawn before antibiotics are administeredso that treatment can be tailored to the specific form of infection whenever possible (Niederman et al. 2001;Bartlett et al. 2000).
Findings: In half the states, more than 14 percent of Medicare patients hospitalized with pneumonia did not receivetimely and appropriate antibiotic treatment during 1998–1999. Rates of timely antibiotic administration rangedfrom a low of 76 percent in Florida to a high of 93 percent in Montana. Source: Medicare claims and hospitalrecords (Jencks et al. 2000).
Implications: Additional improvement in treatment of pneumonia could avert many premature deaths.Collaborative quality improvement programs at the hospital and state level show that pneumonia treatment practices can change when clinical guidelines are supported with evidence linking process-of-care to better outcomes (Meehan et al 2001). Many hospitalizations for pneumonia could be prevented altogether if moreolder adults were immunized with pneumococcal vaccine as recommended (see Chart 1–2).
Leatherman and McCarthy, Quality of Health Care in the United States: A Chartbook, 2002—Effectiveness 37
Chart 1–7
Antibiotic Treatment for PneumoniaIn half the states, more than 14 percent of Medicare beneficiaries hospitalized with
pneumonia did not receive timely and appropriate antibiotic care during 1998–1999.
Source: Medicare claims and hospital records (Jencks et al. 2000). U.S. data include the 50 states plus the District of Columbia (D.C.).
0
20
40
60
80
100
Percent of hospitalized Medicare pneumonia patients
State with the lowest rate
U.S. median
State with the highest rate
Blood culture drawn (if done)before antibiotic given
Antibiotic given within 8 hoursof hospital arrival
Recommendedantibiotics given
93
Alaska 83
U.S.median 67
D.C.
93
Mont.86
U.S.median
76
Fla.
87
Wyo. 79
U.S.median
66
Cal.
Leatherman and McCarthy, Quality of Health Care in the United States: A Chartbook, 2002. The Commonwealth Fund 38
Effectiveness: Getting Better When Sick and Living with Chronic Illness
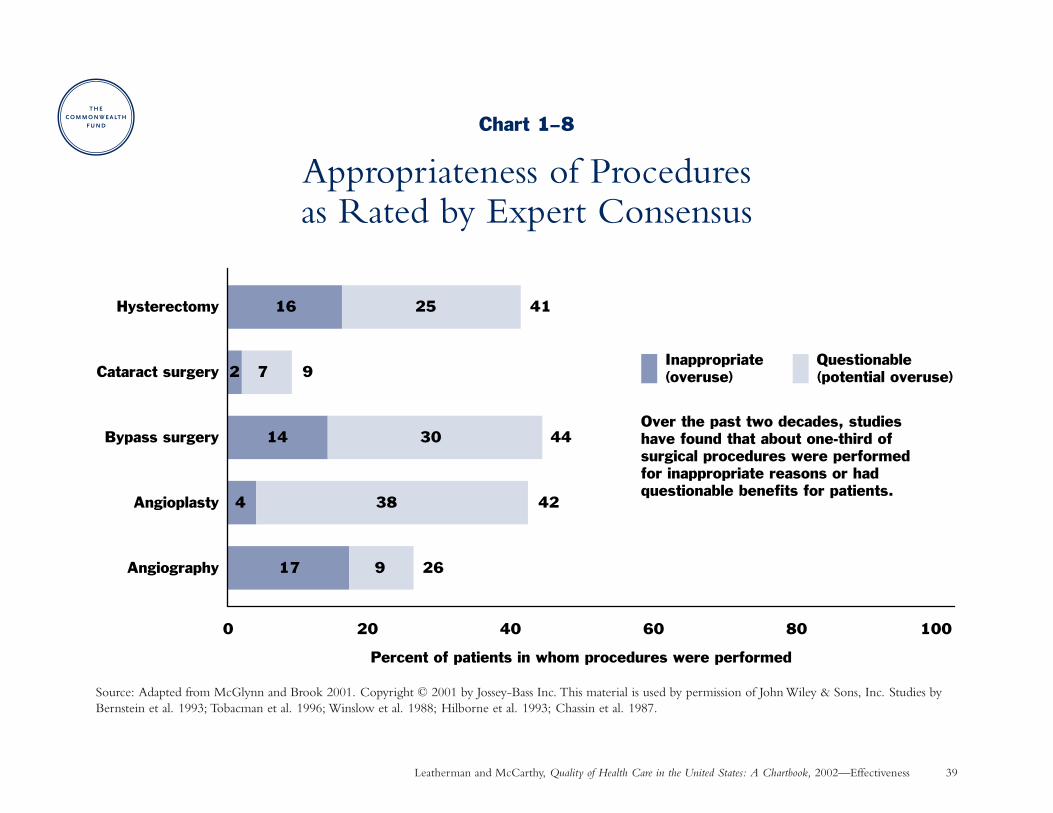
Appropriateness of ProceduresWhy is this important? Appropriateness means that, “for individuals with particular clinical and personal characteristics,
the expected health benefit from doing a . . . procedure exceeds the expected health risk by a sufficient marginso that the intervention is worth doing.” Researchers at RAND and the University of California–Los Angelesdeveloped a method to measure this concept by (1) convening a panel of experts to review the evidence andrate the appropriateness of reasons for doing a medical procedure, and (2) using information from the medicalrecords of patients who had a procedure to determine the reason it was done and assign an appropriateness scorebased on the panel’s ratings (McGlynn and Brook 2001).
Findings: In studies measuring the appropriateness of several medical procedures performed over the past twodecades, 2 percent to 17 percent of the procedures were performed for inappropriate reasons and 9 percent to38 percent were done for questionable clinical reasons. Overall, about one-third of the procedures were consideredinappropriate or had questionable benefit. Sources: Bernstein et al. 1993; Tobacman et al. 1996; Winslow et al.1988; Hilborne et al. 1993; Chassin et al. 1987.
Hysterectomy is the removal of the uterus. Cataract surgery is done to remove a clouded lens from the eye and(typically) implant an artificial lens. Bypass surgery and angioplasty are done to restore blood flow when the arteriesthat supply blood to the heart muscle have become clogged. Angiography is a diagnostic test to determine thelocation and extent of such blockage and the need for bypass surgery or angioplasty.
Implications: The quality of health care—as measured by the appropriateness of procedures—is variable. Otherresearch has found that some of these same procedures are underused when they would have been beneficial topatients who did not receive them (Hemingway et al. 2001). Overuse of procedures exposes patients to unnecessaryrisk of complications and wastes resources that could be put to better use where effective treatment is underused.
Leatherman and McCarthy, Quality of Health Care in the United States: A Chartbook, 2002—Effectiveness 39
Chart 1–8
Appropriateness of Procedures as Rated by Expert Consensus
Source: Adapted from McGlynn and Brook 2001. Copyright © 2001 by Jossey-Bass Inc. This material is used by permission of John Wiley & Sons, Inc. Studies byBernstein et al. 1993; Tobacman et al. 1996; Winslow et al. 1988; Hilborne et al. 1993; Chassin et al. 1987.
17
4
14
2
16
9
38
30
7
25
0 20 40 60 80 100
Angiography
Angioplasty
Bypass surgery
Cataract surgery
Hysterectomy
Percent of patients in whom procedures were performed
Inappropriate (overuse)
Questionable (potential overuse)
41
9
44
42
26
Over the past two decades, studies have found that about one-third of surgical procedures were performed for inappropriate reasons or had questionable benefits for patients.
Leatherman and McCarthy, Quality of Health Care in the United States: A Chartbook, 2002. The Commonwealth Fund 40
Effectiveness: Living with Chronic Illness
Diabetes ManagementWhy is this important? Diabetes, the seventh leading cause of death in the U.S., increased 33 percent in prevalence
during the 1990s and now affects 16 million Americans. Strong research shows that the development and progressionof diabetes complications can be reduced through blood sugar control. Complications of diabetes include blindness,kidney failure, and cardiovascular disease resulting in heart attacks, strokes, and amputations. Treatment for thesecomplications costs nearly $100 billion annually (Mokdad et al. 2000; ADA 2001).
Findings: Many people with diabetes do not receive recommended care from their practitioners nor perform recommended self-care. A survey of people with diabetes conducted in 40 states during 1997–1999 found that:
• Two in five did not have an annual dilated eye examination to check for signs of retinopathy, an eye diseasethat can lead to blindness.
• Almost half did not get a foot examination to check for nerve damage.
• Three-quarters did not report having at least one glycosylated hemoglobin test in the past year (this test gives a three-month average reading of blood sugar control so that the doctor can adjust medications and recommend diet and exercise changes).
• Over half did not monitor their own blood sugar to help in adjusting their diet and medications.
Source: Behavioral Risk Factor Surveillance System (CDC 2000c).
Implications: Diabetes care can be improved. Achieving the standards of care recommended by the AmericanDiabetes Association and other experts will require multi-disciplinary effort among health care professionals,health plans, public health officials, and patients (see Chart 6–3).
Leatherman and McCarthy, Quality of Health Care in the United States: A Chartbook, 2002—Effectiveness 41
Chart 1–9
Diabetes ManagementUp to three-quarters of adults with diabetes did not receive recommended care from their health care practitioner
in the middle-range state during 1997–1999, and over one-half did not perform recommended self-care.
Source: Behavioral Risk Factor Surveillance System (CDC 2000c). U.S. data includes 39 states and the District of Columbia. Data were not available for the following states: Delaware, Illinois, Indiana, Maryland, Missouri, New York, Oklahoma, Oregon, South Carolina, South Dakota, Washington.
0
20
40
60
80
100
Percent of adults with diabetes age 18+ State with the lowest rate
U.S. median
State with the highest rate
Had dilated eyeexam in last year
Had foot examin last year
Performedblood glucoseself-monitoring
Had glycosylatedhemoglobin test
in last year
81
Mass.62
U.S.Med. 47
Ark.
58
U.S.Med.
69
Maine
42
Ala.
46
U.S.Med.
66
Mont.
30
Hawaii25
U.S.Med.
42
Maine
17
Ala.
Leatherman and McCarthy, Quality of Health Care in the United States: A Chartbook, 2002. The Commonwealth Fund 42
Effectiveness: Living with Chronic Illness
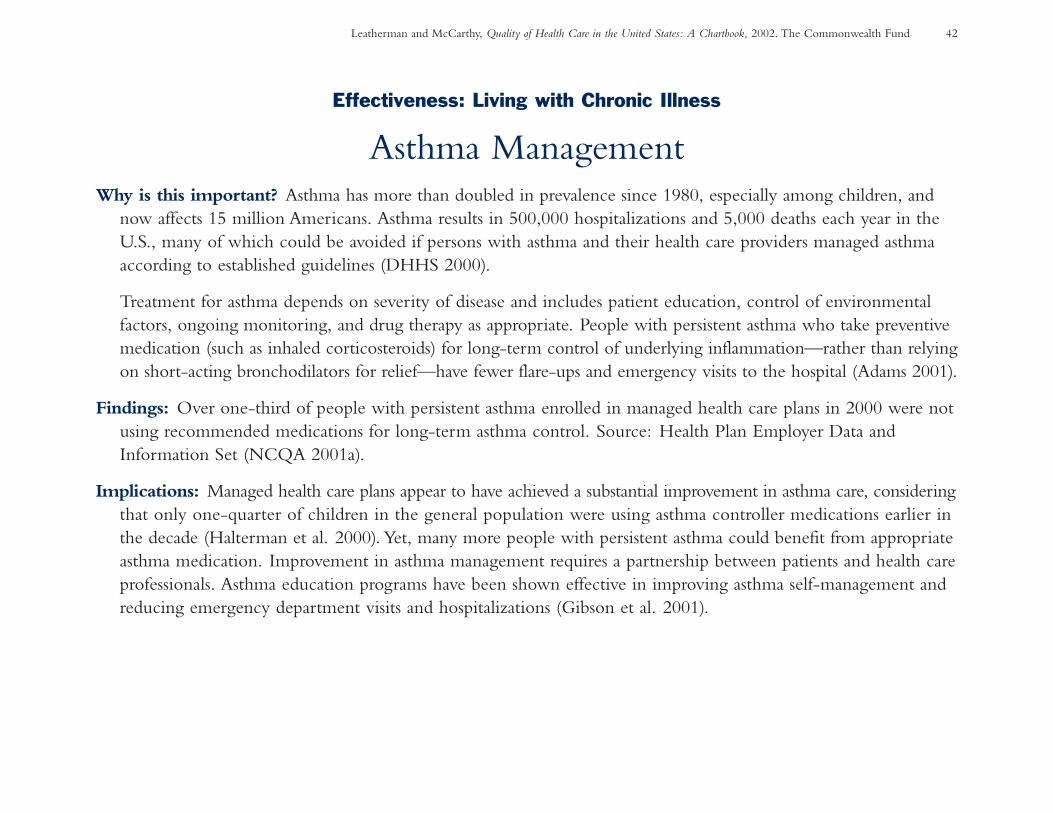
Asthma ManagementWhy is this important? Asthma has more than doubled in prevalence since 1980, especially among children, and
now affects 15 million Americans. Asthma results in 500,000 hospitalizations and 5,000 deaths each year in theU.S., many of which could be avoided if persons with asthma and their health care providers managed asthmaaccording to established guidelines (DHHS 2000).
Treatment for asthma depends on severity of disease and includes patient education, control of environmentalfactors, ongoing monitoring, and drug therapy as appropriate. People with persistent asthma who take preventivemedication (such as inhaled corticosteroids) for long-term control of underlying inflammation—rather than relyingon short-acting bronchodilators for relief—have fewer flare-ups and emergency visits to the hospital (Adams 2001).
Findings: Over one-third of people with persistent asthma enrolled in managed health care plans in 2000 were notusing recommended medications for long-term asthma control. Source: Health Plan Employer Data andInformation Set (NCQA 2001a).
Implications: Managed health care plans appear to have achieved a substantial improvement in asthma care, consideringthat only one-quarter of children in the general population were using asthma controller medications earlier inthe decade (Halterman et al. 2000). Yet, many more people with persistent asthma could benefit from appropriateasthma medication. Improvement in asthma management requires a partnership between patients and health careprofessionals. Asthma education programs have been shown effective in improving asthma self-management andreducing emergency department visits and hospitalizations (Gibson et al. 2001).
Leatherman and McCarthy, Quality of Health Care in the United States: A Chartbook, 2002—Effectiveness 43
Chart 1–10
Asthma ManagementOver one-third of children and adults with persistent asthma and enrolled in managed health
care plans did not receive appropriate medications for long-term asthma control in 2000.
64
60
61
0 20 40 60 80 100
Age 18–56
Age 10–17
Age 5–9
Percent of managed care plan enrollees with persistent asthma who hada prescription for appropriate medication for long-term asthma control
Source: Health Plan Employer Data and Information Set (NCQA 2001a). Adapted with permission from the National Committee for Quality Assurance.
Leatherman and McCarthy, Quality of Health Care in the United States: A Chartbook, 2002. The Commonwealth Fund 44
Effectiveness: Living with Chronic Illness
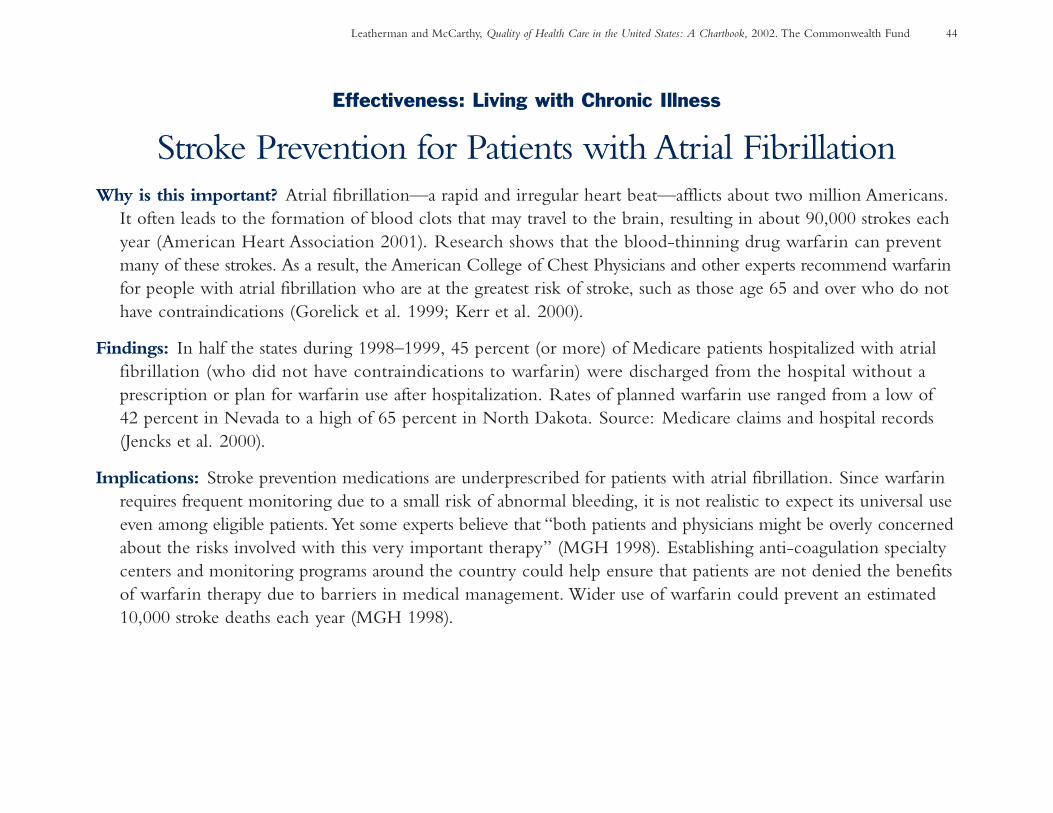
Stroke Prevention for Patients with Atrial FibrillationWhy is this important? Atrial fibrillation—a rapid and irregular heart beat—afflicts about two million Americans.
It often leads to the formation of blood clots that may travel to the brain, resulting in about 90,000 strokes eachyear (American Heart Association 2001). Research shows that the blood-thinning drug warfarin can preventmany of these strokes. As a result, the American College of Chest Physicians and other experts recommend warfarinfor people with atrial fibrillation who are at the greatest risk of stroke, such as those age 65 and over who do nothave contraindications (Gorelick et al. 1999; Kerr et al. 2000).
Findings: In half the states during 1998–1999, 45 percent (or more) of Medicare patients hospitalized with atrialfibrillation (who did not have contraindications to warfarin) were discharged from the hospital without a prescription or plan for warfarin use after hospitalization. Rates of planned warfarin use ranged from a low of 42 percent in Nevada to a high of 65 percent in North Dakota. Source: Medicare claims and hospital records(Jencks et al. 2000).
Implications: Stroke prevention medications are underprescribed for patients with atrial fibrillation. Since warfarinrequires frequent monitoring due to a small risk of abnormal bleeding, it is not realistic to expect its universal useeven among eligible patients. Yet some experts believe that “both patients and physicians might be overly concernedabout the risks involved with this very important therapy” (MGH 1998). Establishing anti-coagulation specialtycenters and monitoring programs around the country could help ensure that patients are not denied the benefitsof warfarin therapy due to barriers in medical management. Wider use of warfarin could prevent an estimated10,000 stroke deaths each year (MGH 1998).

Leatherman and McCarthy, Quality of Health Care in the United States: A Chartbook, 2002—Effectiveness 45
Chart 1–11
Stroke Prevention for Patients with Atrial FibrillationIn half the states during 1997–1999, 45 percent (or more) of hospitalized Medicare patients with irregular heart beat did not receive blood thinning drugs to reduce their risk of having a stroke.
Source: Medicare claims and hospital records (Jencks et al. 2000). *Excludes patients with contraindications to warfarin. U.S. data includes the 50 states plus theDistrict of Columbia (D.C.).
50
57
44
53
46
57
60
58
57
65
61
58
58
57
52
47
51
6051
51
61
5053
60
6145
61
55
55 55
46 50
61
56
Percent of Medicare patients with atrial fibrillation with a prescription or plan for warfarin at hospital discharge*
D.C. 54
58626459
5755
505442
57
56 57
45
52 50
52
60% and over
50–59%
Under 50%
High: 65 (N.Dak.)
Median: 55
Low: 42 (Nev.)
Leatherman and McCarthy, Quality of Health Care in the United States: A Chartbook, 2002. The Commonwealth Fund 46
Effectiveness: Living with Chronic Illness
Treatment and Outcomes for HIVWhy is this important? About 900,000 Americans are infected with human immunodeficiency virus (HIV),
which has become a leading cause of death among young men and an increasing cause of death among youngwomen. Recent advances in treatment for HIV have made the disease a manageable, chronic illness. Whiletreatment is complex to provide, it can prevent complications such as pneumonia, slow the progression to AIDS,and prolong life (CDC 2001d; Asch et al. 2000).
Patients with HIV need regular care from a health professional who can monitor their status and adjust treatmentto include the most up-to-date therapies. Those who are receiving good quality outpatient care should be ableto avoid most emergency room (ER) visits and hospitalizations, though some hospital use may be unavoidable as the disease progresses (Shapiro et al. 1999).
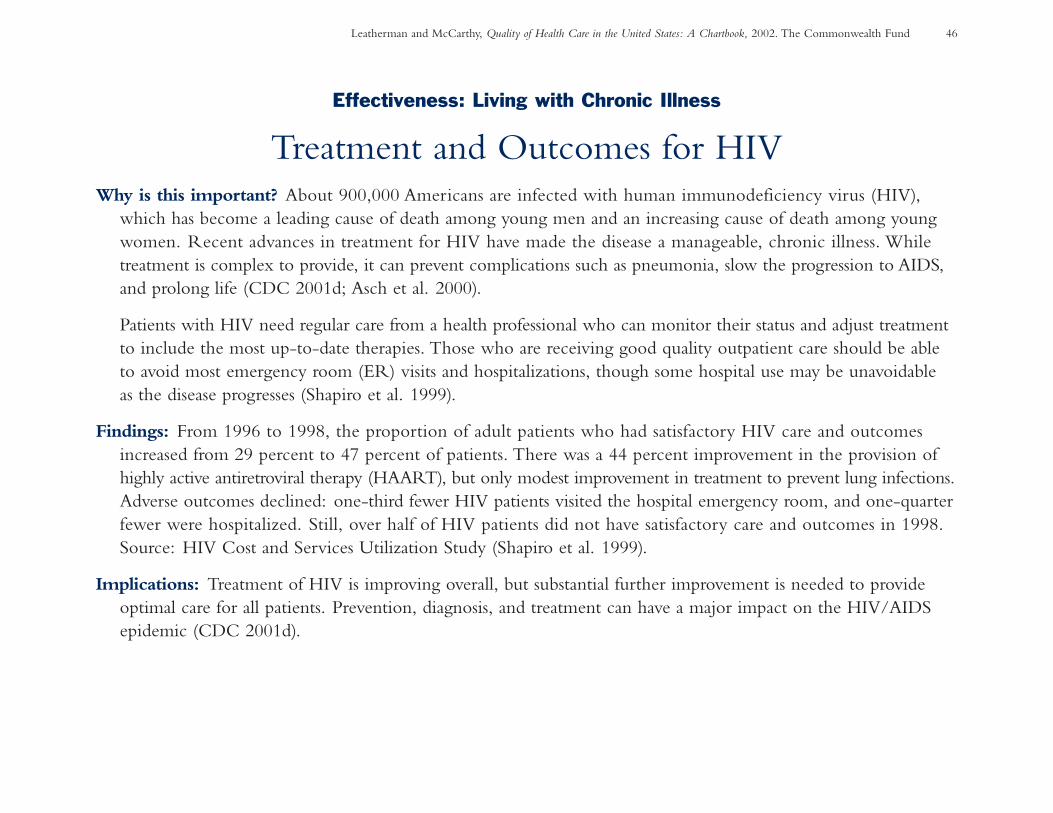
Findings: From 1996 to 1998, the proportion of adult patients who had satisfactory HIV care and outcomesincreased from 29 percent to 47 percent of patients. There was a 44 percent improvement in the provision ofhighly active antiretroviral therapy (HAART), but only modest improvement in treatment to prevent lung infections.Adverse outcomes declined: one-third fewer HIV patients visited the hospital emergency room, and one-quarterfewer were hospitalized. Still, over half of HIV patients did not have satisfactory care and outcomes in 1998.Source: HIV Cost and Services Utilization Study (Shapiro et al. 1999).
Implications: Treatment of HIV is improving overall, but substantial further improvement is needed to provideoptimal care for all patients. Prevention, diagnosis, and treatment can have a major impact on the HIV/AIDSepidemic (CDC 2001d).
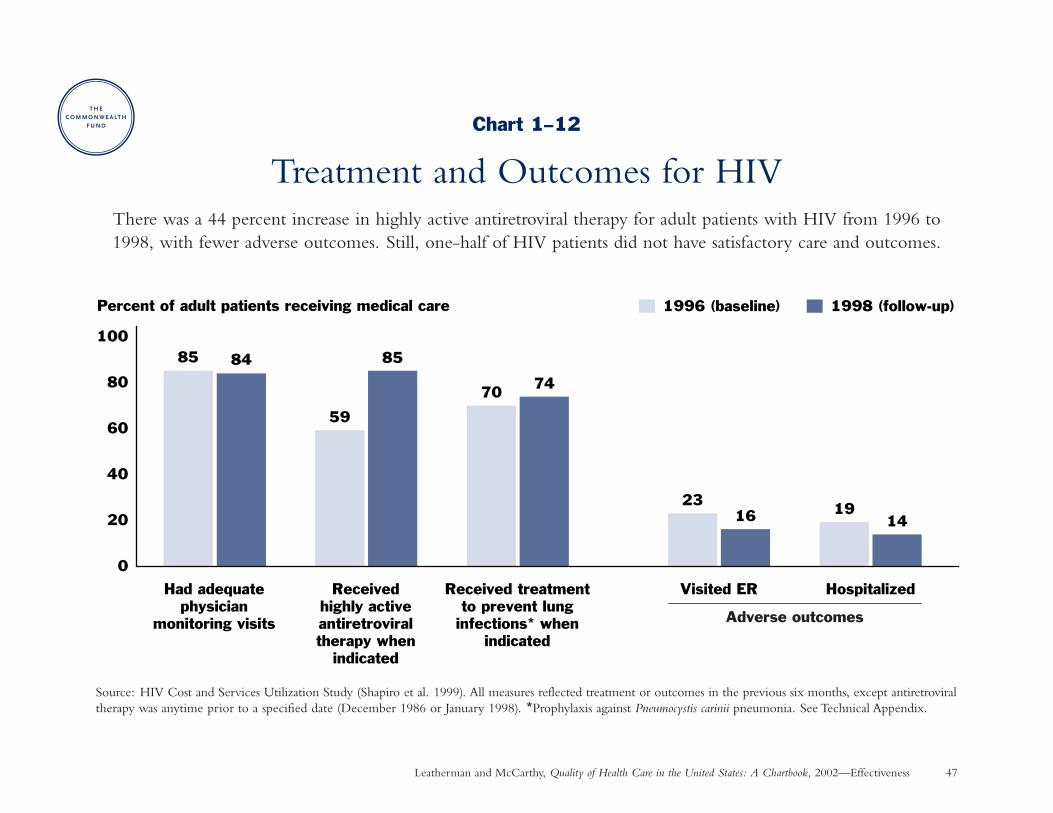
Leatherman and McCarthy, Quality of Health Care in the United States: A Chartbook, 2002—Effectiveness 47
Chart 1–12
Treatment and Outcomes for HIVThere was a 44 percent increase in highly active antiretroviral therapy for adult patients with HIV from 1996 to1998, with fewer adverse outcomes. Still, one-half of HIV patients did not have satisfactory care and outcomes.
Source: HIV Cost and Services Utilization Study (Shapiro et al. 1999). All measures reflected treatment or outcomes in the previous six months, except antiretroviraltherapy was anytime prior to a specified date (December 1986 or January 1998). *Prophylaxis against Pneumocystis carinii pneumonia. See Technical Appendix.
59
85 84 85
70 74
2316 19
14
0
20
40
60
80
100
Had adequatephysician
monitoring visits
Receivedhighly activeantiretroviraltherapy when
indicated
Received treatmentto prevent lung
infections* whenindicated
Visited ER Hospitalized
1996 (baseline) 1998 (follow-up)Percent of adult patients receiving medical care
Adverse outcomes
Leatherman and McCarthy, Quality of Health Care in the United States: A Chartbook, 2002. The Commonwealth Fund 48
Effectiveness: Living with Chronic Illness
Coronary Artery Disease:Medication to Prevent Recurrent Heart Attack
Why is this important? Coronary artery disease—caused by the narrowing and blockage of arteries that supplyblood to the heart—is the number one cause of death among Americans and the leading cause of disability inthe labor force. Over one million people suffer a heart attack each year; about 40 percent die of it (AmericanHeart Association 2001).
Research has shown that certain medications significantly reduce the recurrence of heart attack and improvepatients’ survival when prescribed during hospitalization and afterwards as long-term preventive therapy.Treatment with beta-blockers helps the heart work better and “is one of the most scientifically substantiated,cost-effective preventive medical services,” improving long-term survival by up to 40 percent when used after a heart attack (Soumerai et al. 1997; Ryan et al. 1999).
Findings: In half the states during 1998–1999, over one-quarter of Medicare heart attack patients who were idealcandidates for beta-blockers did not get a prescription for a beta-blocker when they were discharged from thehospital. Rates of beta-blocker prescriptions ranged from a low of 47 percent in Mississippi to a high of 93 percentin the District of Columbia and Massachusetts. Source: Medicare claims and hospital records (Jencks et al. 2000).
Implications: Evidence-based improvement in treatment of heart attack during the 15 years, though gradual, hascontributed to an overall decline in the death rate due to coronary artery disease (McGovern et al. 2001). Up to18,000 more deaths from heart attack could be prevented each year if all patients who were eligible receivedbeta-blockers, based on one estimate (Chassin 1997).
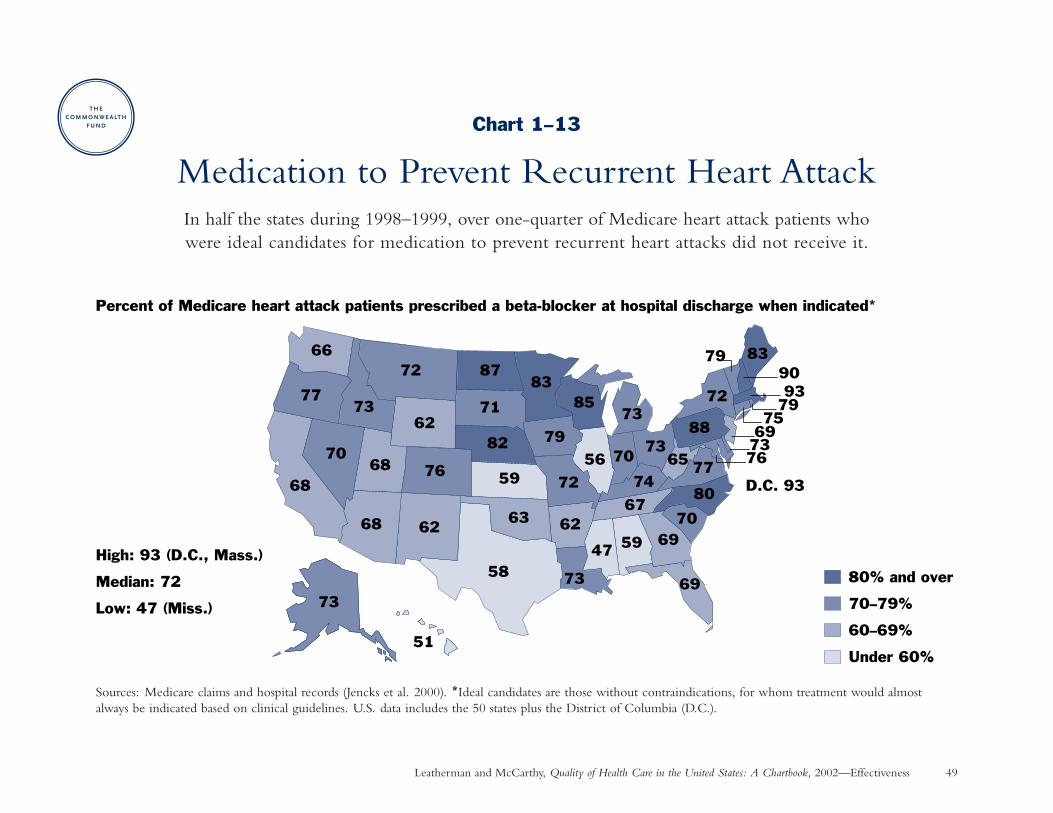
Leatherman and McCarthy, Quality of Health Care in the United States: A Chartbook, 2002—Effectiveness 49
Chart 1–13
Medication to Prevent Recurrent Heart AttackIn half the states during 1998–1999, over one-quarter of Medicare heart attack patients who were ideal candidates for medication to prevent recurrent heart attacks did not receive it.
Sources: Medicare claims and hospital records (Jencks et al. 2000). *Ideal candidates are those without contraindications, for whom treatment would almostalways be indicated based on clinical guidelines. U.S. data includes the 50 states plus the District of Columbia (D.C.).
66
77
68
73
51
73
72
62
76
87
71
82
83
79
72
73
59
8573
74
67
6970
80
7765
88
72
56 70
47 59
83
69
D.C. 93
799093
7975
69737670
68
68 62
58
63 62
73
80% and over
70–79%
60–69%
Under 60%
Percent of Medicare heart attack patients prescribed a beta-blocker at hospital discharge when indicated*
High: 93 (D.C., Mass.)
Median: 72
Low: 47 (Miss.)
Leatherman and McCarthy, Quality of Health Care in the United States: A Chartbook, 2002. The Commonwealth Fund 50
Effectiveness and Timeliness: Living with Chronic Illness
Coronary Artery Disease: Speed to Treatment with Clot-Dissolving Drugs Following a Heart Attack
Why is this important? Thrombolytic therapy dissolves blood clots blocking the flow of blood and oxygen to theheart muscle. If started promptly when indicated after a heart attack, thrombolytic therapy significantly improvespatient survival. The sooner thrombolytic therapy is started, the greater the benefit it confers—35 lives saved per1,000 patients treated in the first hour after symptoms occur, as compared to 16 lives saved per 1,000 treated afterseven to 12 hours have elapsed (the benefits may be less for older patients). Therefore, the National Heart AttackAlert Program advocates a national goal of starting thrombolytic therapy within 30 minutes of a patient’s arrivalat the hospital (Ryan et al. 1996).
Findings: During the 1990s, selected hospitals participating in an industry-sponsored national registry reduced themedian time to start thrombolytic therapy by 40 percent, from 62 minutes to 38 minutes after a patient’s arrivalat these hospitals. Nevertheless, 24 percent of heart attack patients who could have benefited from thrombolytictherapy—including those at the highest risk of death—failed to receive it. Source: National Registry of MyocardialInfarction (Barron et al. 1998; Rogers et al. 2000). Results may not be representative of all hospitals.
Implications: The timely use of thrombolytic therapy has contributed to the overall decline in heart attack deathrates over the past decade (McGovern et al. 2001). Hesitancy to prescribe thrombolytic therapy may arise fromconcern about side-effects or uncertainty about eligibility criteria (Ryan et al. 1999). Up to 4,000 additionaldeaths from heart attack could be averted each year if all patients who were eligible for thrombolytic therapyreceived it on a timely basis along with other recommended treatment (Fendrick, Ricker, and Bloom 1994).
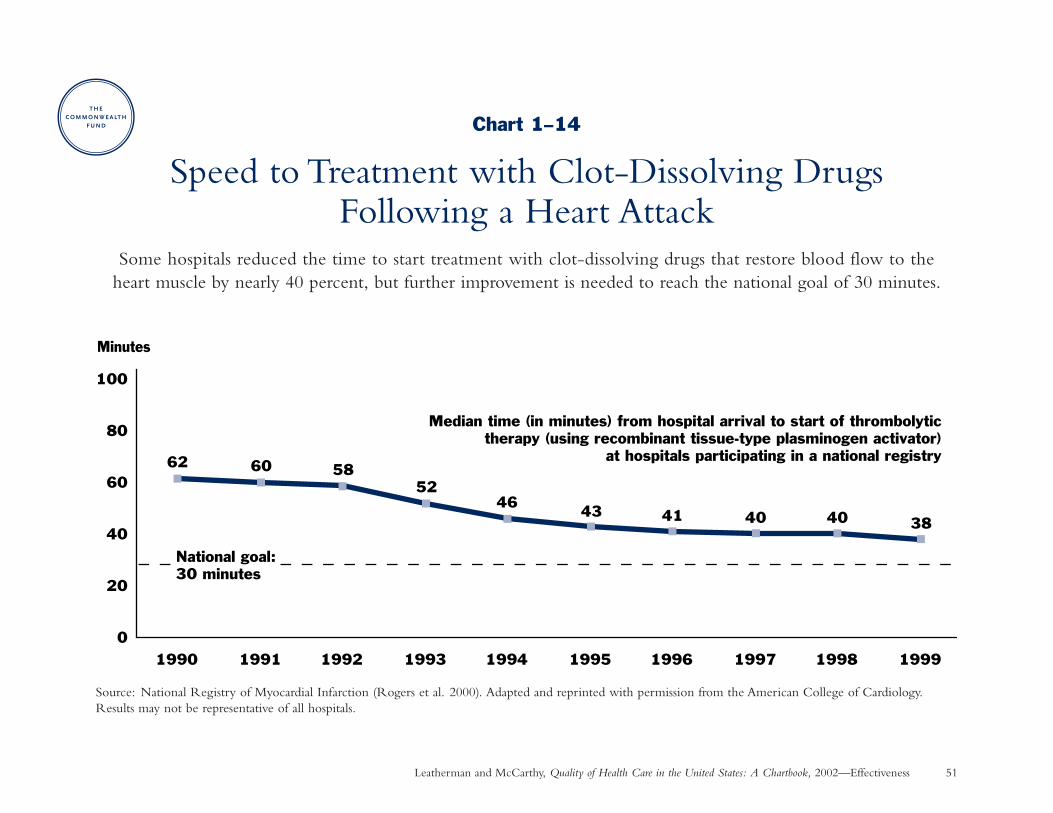
Leatherman and McCarthy, Quality of Health Care in the United States: A Chartbook, 2002—Effectiveness 51
Chart 1–14
Speed to Treatment with Clot-Dissolving DrugsFollowing a Heart Attack
Some hospitals reduced the time to start treatment with clot-dissolving drugs that restore blood flow to the heart muscle by nearly 40 percent, but further improvement is needed to reach the national goal of 30 minutes.
Source: National Registry of Myocardial Infarction (Rogers et al. 2000). Adapted and reprinted with permission from the American College of Cardiology.Results may not be representative of all hospitals.
62 60 5852
46 43 41 40 40 38
0
20
40
60
80
100
1990 1991 1992 1993 1994 1995 1996 1997 1998 1999
Minutes
Median time (in minutes) from hospital arrival to start of thrombolytictherapy (using recombinant tissue-type plasminogen activator)
at hospitals participating in a national registry
National goal: 30 minutes
Leatherman and McCarthy, Quality of Health Care in the United States: A Chartbook, 2002. The Commonwealth Fund 52
Effectiveness: Living with Chronic Illness
Mental Health Care: Treatment for DepressionWhy is this important? Between 5 percent and 10 percent of the U.S. population suffers from depression
in a given year. Depression is the leading cause of suicide and disability, with a social cost of $44 billion including treatment and lost productivity. Many adults with depression do not receive any treatment, even though appropriate treatment with antidepressant medication or certain time-limited psychotherapies is effective and has been recommended by evidence-based national guidelines (Wells et al. 1996; AHRQ 1993; 1999).
Findings: Antidepressant medication was received in an appropriate dose by 35 percent of patients with major and/or chronic depression who were seeing primary care physicians affiliated with seven managed care plans during 1996–1997. In comparison, 24 percent of patients with major depression received any dose of an antidepressant from a primary care physician or mental health specialist in a 1986 study in three cities(only about 60 percent of these patients received an appropriate dose). Sources: Medical Outcomes Study (Wells et al. 1994); Partners in Care Study (Wells et al. 1999). Comparable data on psychotherapy is not available.
Implications: These data suggest an improvement in antidepressant treatment for depression among patients whouse the health care system, though rates of treatment remain low. For example, only about half the patients withdepression received any mental health care, including medication, counseling, or a referral for counseling, fromtheir primary care provider in the 1996–1997 study (Wells et al. 1999). Additional data on psychotherapy isneeded to form a more complete picture, since many people who desire treatment for depression say they wouldprefer counseling rather than medication (Dwight-Johnson et al. 2000).
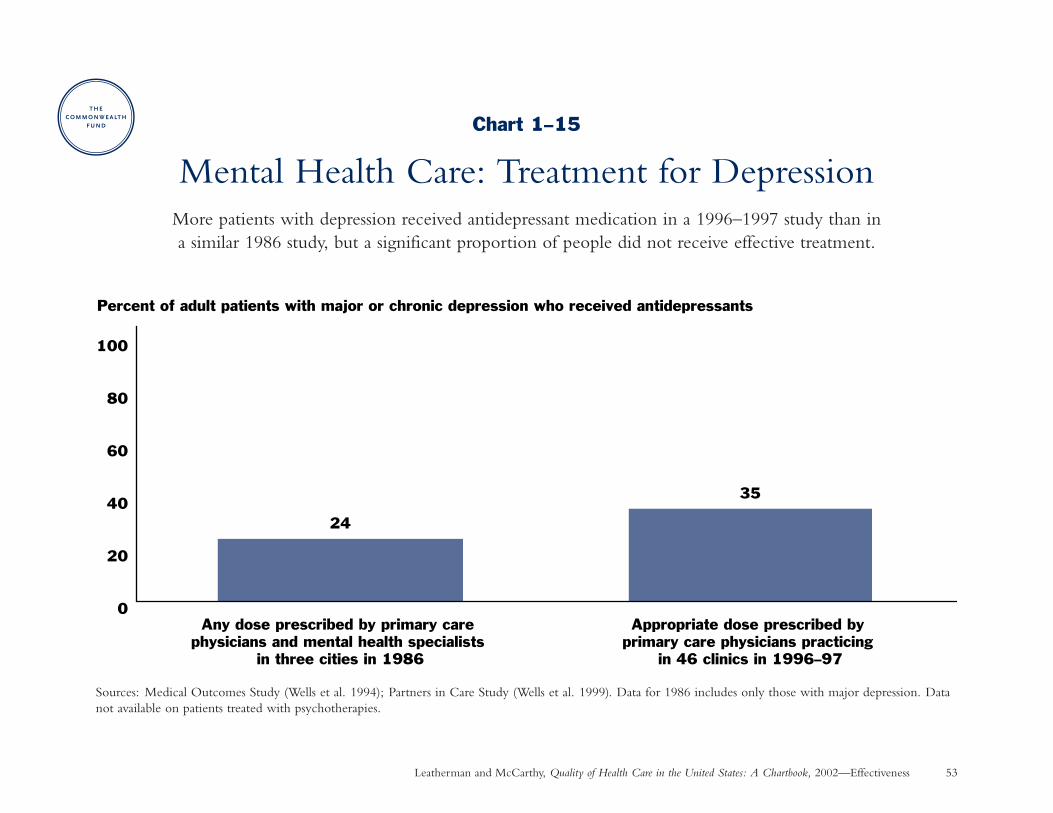
Leatherman and McCarthy, Quality of Health Care in the United States: A Chartbook, 2002—Effectiveness 53
Chart 1–15
Mental Health Care: Treatment for DepressionMore patients with depression received antidepressant medication in a 1996–1997 study than in a similar 1986 study, but a significant proportion of people did not receive effective treatment.
Sources: Medical Outcomes Study (Wells et al. 1994); Partners in Care Study (Wells et al. 1999). Data for 1986 includes only those with major depression. Datanot available on patients treated with psychotherapies.
Percent of adult patients with major or chronic depression who received antidepressants
24
35
0
20
40
60
80
100
Any dose prescribed by primary care physicians and mental health specialists
in three cities in 1986
Appropriate dose prescribed by primary care physicians practicing
in 46 clinics in 1996–97
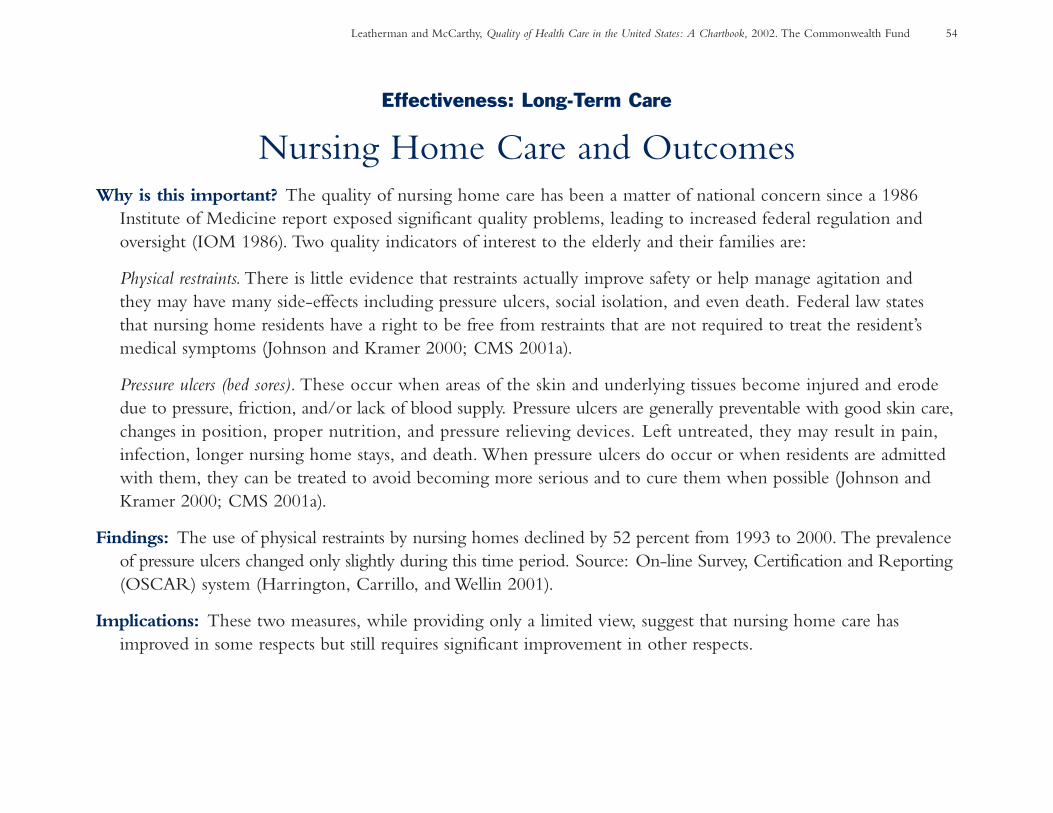
Leatherman and McCarthy, Quality of Health Care in the United States: A Chartbook, 2002. The Commonwealth Fund 54
Effectiveness: Long-Term Care
Nursing Home Care and OutcomesWhy is this important? The quality of nursing home care has been a matter of national concern since a 1986
Institute of Medicine report exposed significant quality problems, leading to increased federal regulation andoversight (IOM 1986). Two quality indicators of interest to the elderly and their families are:
Physical restraints. There is little evidence that restraints actually improve safety or help manage agitation and they may have many side-effects including pressure ulcers, social isolation, and even death. Federal law states that nursing home residents have a right to be free from restraints that are not required to treat the resident’smedical symptoms (Johnson and Kramer 2000; CMS 2001a).
Pressure ulcers (bed sores). These occur when areas of the skin and underlying tissues become injured and erodedue to pressure, friction, and/or lack of blood supply. Pressure ulcers are generally preventable with good skin care,changes in position, proper nutrition, and pressure relieving devices. Left untreated, they may result in pain,infection, longer nursing home stays, and death. When pressure ulcers do occur or when residents are admittedwith them, they can be treated to avoid becoming more serious and to cure them when possible (Johnson andKramer 2000; CMS 2001a).
Findings: The use of physical restraints by nursing homes declined by 52 percent from 1993 to 2000. The prevalenceof pressure ulcers changed only slightly during this time period. Source: On-line Survey, Certification and Reporting(OSCAR) system (Harrington, Carrillo, and Wellin 2001).
Implications: These two measures, while providing only a limited view, suggest that nursing home care hasimproved in some respects but still requires significant improvement in other respects.
Leatherman and McCarthy, Quality of Health Care in the United States: A Chartbook, 2002—Effectiveness 55
Chart 1–16
Nursing Home Care and Outcomes
Source: On-line Survey, Certification, and Reporting (OSCAR) system (Harrington, Carrillo, and Wellin 2001).
7.9 6.9 7.1 7.3
0
20
40
60
80
100
1994 1996 1998 2000
20.2 17.312.3 9.8
0
20
40
60
80
100
Percent of nursing home facilitiesthat used physical restraints
Percent of nursing home residentswith pressure ulcers
The use of physical restraints declined by half among nursing homes from 1994 to 2000, suggesting improved quality.
The prevalence of pressure ulcers (bed sores) changed only slightly from 1994 to 2000, indicating a need for further improvement.
1994 1996 1998 2000

Chapter 2
Patient Safety
Some degree of error is inherent in all human activity. . . . In highly technical, complicated systems, even minor errors may have disastrous consequences.
—Lucian Leape and colleagues, 1991
Leatherman and McCarthy, Quality of Health Care in the United States: A Chartbook, 2002. The Commonwealth Fund 58
Chapter 2
Patient Safety: IntroductionThe Institute of Medicine’s 1999 report, To Err Is Human,shocked the nation with estimates that mistakes and systemfailures in medicine result in 44,000 to 98,000 deaths inhospitals each year, ranking medical mistakes with the lead-ing causes of death in the U.S. (IOM 2000; Chart 2–1).
Although the number of deaths due to medical mistakesremains a matter for debate, few dispute that medical mis-takes are a serious problem and that their reduction must be a national priority.
Medical mistakes may well be the most easily understoodarea of health care quality. Newspaper stories offer tragicexamples, such as:
• a patient who dies due to a drug mix-up in the hospital,
• a missed or delayed diagnosis for cancer, and
• surgery done on the wrong side of a patient’s body.
While compelling, these stories do not provide the fullscope of the problem. The charts in this section describemedical mistakes globally in terms of frequency, types,and outcomes.
The good news is that many medical mistakes are preventable.Other industries have learned to design systems so that theyachieve “zero defects.” This knowledge as well as experiencefrom within the health care community provides practicalroadmaps for making the health care system safer. Provenstrategies include better training and team communicationas well as standardization of equipment and processes.
• The federal government is redesigning its error reportingdatabases and several states have enacted new reportinglaws so that health care providers can learn from oneanother and prevent the repetition of similar kinds ofmistakes (Adams 2001).
• Some surgeons and hospitals are participating in a programto prominently mark the surgical site in advance of anoperation to prevent wrong-site surgery (JCAHO 2001).
Much more remains to be done at all levels to build safetyinto the health care system so that it holds true to the valueof patient well-being encapsulated in the Hippocratic dictum:“First, do no harm.”
Leatherman and McCarthy, Quality of Health Care in the United States: A Chartbook, 2002. The Commonwealth Fund 59
Patient Safety: Summary of Charts and FindingsChart 2–1: Estimated Deaths Associated with MedicalMistakes—Estimated deaths associated with medical mistakesrank among the leading causes of death in the U.S., exceedingdeaths from motor vehicle accidents, breast cancer, or AIDS.
Chart 2–2 and 2–3: Preventable Adverse Events, Causes,and Outcomes—Medical mistakes resulting in patient dis-ability or prolonged hospital stay occurred in about 2 percentof the hospitalizations in New York (in a seminal 1984 study)and in Utah and Colorado (in a similar 1992 study), account-ing for over half of all adverse events in hospitals in thosestates. Mistakes most commonly occurred during surgery orother procedures. Seven percent resulted in patient death inColorado and Utah, and another 7 percent resulted in apermanent disability.
Chart 2–4: Preventable Adverse Drug Events—In a studyat two large Boston teaching hospitals, patient injuries resultingfrom medication mistakes occurred at a frequency of almosttwo per 100 hospital admissions in 1992. Over half of themedication mistakes occurred when drugs were prescribedby physicians, and another third occurred when drugs wereadministered to patients. One-fifth of the injuries wereconsidered life-threatening.
Chart 2–5: Trends and Types of Medication-Prescribing Mistakes—At one New York State teachinghospital, medication-prescribing mistakes with the potentialfor adverse outcomes more than doubled in proportion tomedication orders, tripled in proportion to patient-days, andquadrupled in proportion to hospital admissions over a nine-year period from 1987 to 1995. The majority of such mistakesinvolved incorrect dosing (overdosing or underdosing).
Chart 2–6: Potentially Inappropriate Prescribing for the Elderly—Medications that could cause harm in or havequestionable effectiveness for the elderly were prescribed for14 percent to 24 percent of elderly patients over the pastdecade.
Leatherman and McCarthy, Quality of Health Care in the United States: A Chartbook, 2002. The Commonwealth Fund 60
Patient Safety
Preventable Adverse Events, Causes, and OutcomesWhy is this important? Medical mistakes or system failures that result in patient disability or prolonged hospital
stay are known as preventable adverse events because they could be avoided with proper medical management or prevention programs. Preventable adverse events (defined in this strict way) should be distinguished frommedical mistakes that do not result in any patient injury, and from other adverse events that are not preventablegiven the current state of medical knowledge.
Findings: Preventable adverse events occurred in about 2 percent of hospitalizations in a seminal 1984 New YorkState study, and in Utah and Colorado in a similar 1992 study, accounting for over half of all adverse events inhospitals (see Charts 2–2 and 2–3). These two studies, though older, represent the most thorough examinationof this phenomenon to date. Sources: Brennan et al. 1991; Thomas et al. 2000.
• The most commonly observed mistakes resulting in patient injury in New York involved the performance of surgical or other medical procedures (Leape et al. 1991; see Chart 2–2).
• Most preventable adverse events resulted in temporary injury, but 7 percent resulted in permanent disabilityand another 7 percent led to the death of the patient in Utah and Colorado (Thomas et al. 1999; Chart 2–3).Extrapolating this rate to the U.S. population as a whole suggests that up to 44,000 deaths in hospitals maybe associated with medical mistakes annually (IOM 2000; see Chart 2–1).
Implications: Medical mistakes resulting in patient injury are relatively common in hospitals, with potentially devastating consequences for patients. Total costs of preventable adverse events—including health care, lostwages, and lost worker productivity—equaled 2 percent of health care expenditures in Utah and Colorado, or$17 billion when extrapolated to the entire U.S. population (Thomas et al. 1999).
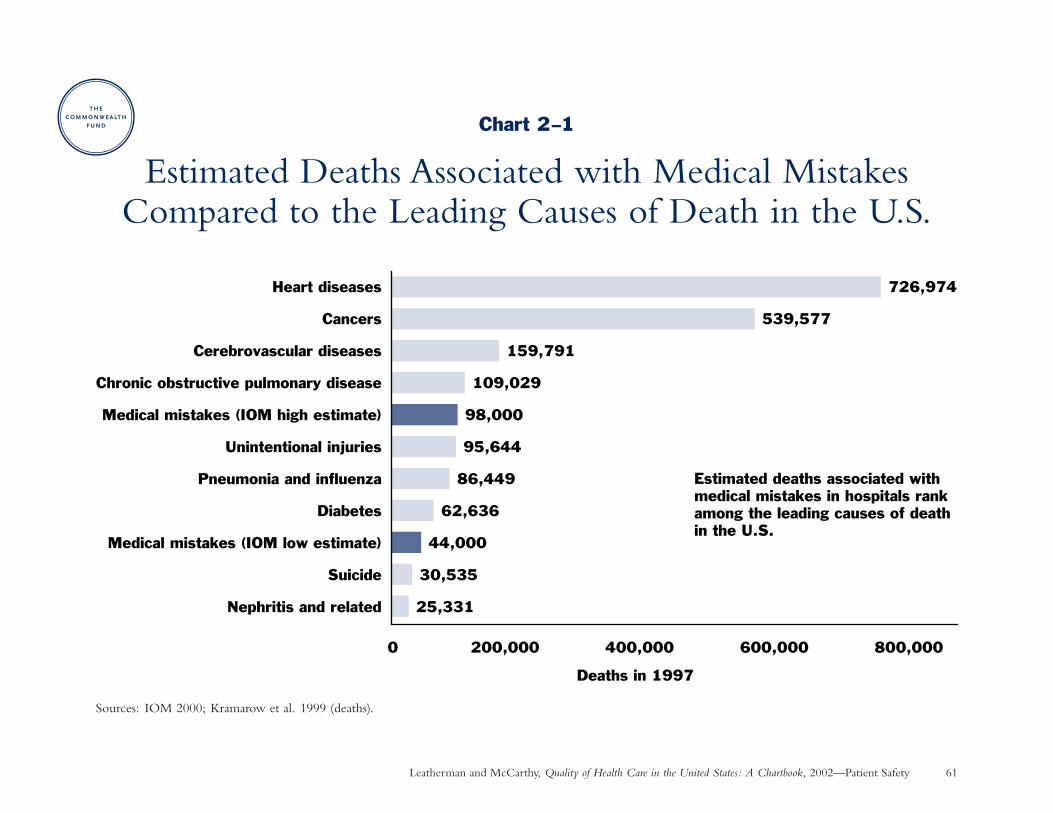
Leatherman and McCarthy, Quality of Health Care in the United States: A Chartbook, 2002—Patient Safety 61
Chart 2–1
Estimated Deaths Associated with Medical MistakesCompared to the Leading Causes of Death in the U.S.
Sources: IOM 2000; Kramarow et al. 1999 (deaths).
25,331
30,535
44,000
62,636
86,449
95,644
98,000
109,029
159,791
539,577
726,974
0 200,000 400,000 600,000 800,000
Nephritis and related
Suicide
Medical mistakes (IOM low estimate)
Diabetes
Pneumonia and influenza
Unintentional injuries
Medical mistakes (IOM high estimate)
Chronic obstructive pulmonary disease
Cerebrovascular diseases
Cancers
Heart diseases
Deaths in 1997
Estimated deaths associated with medical mistakes in hospitals rank among the leading causes of death in the U.S.
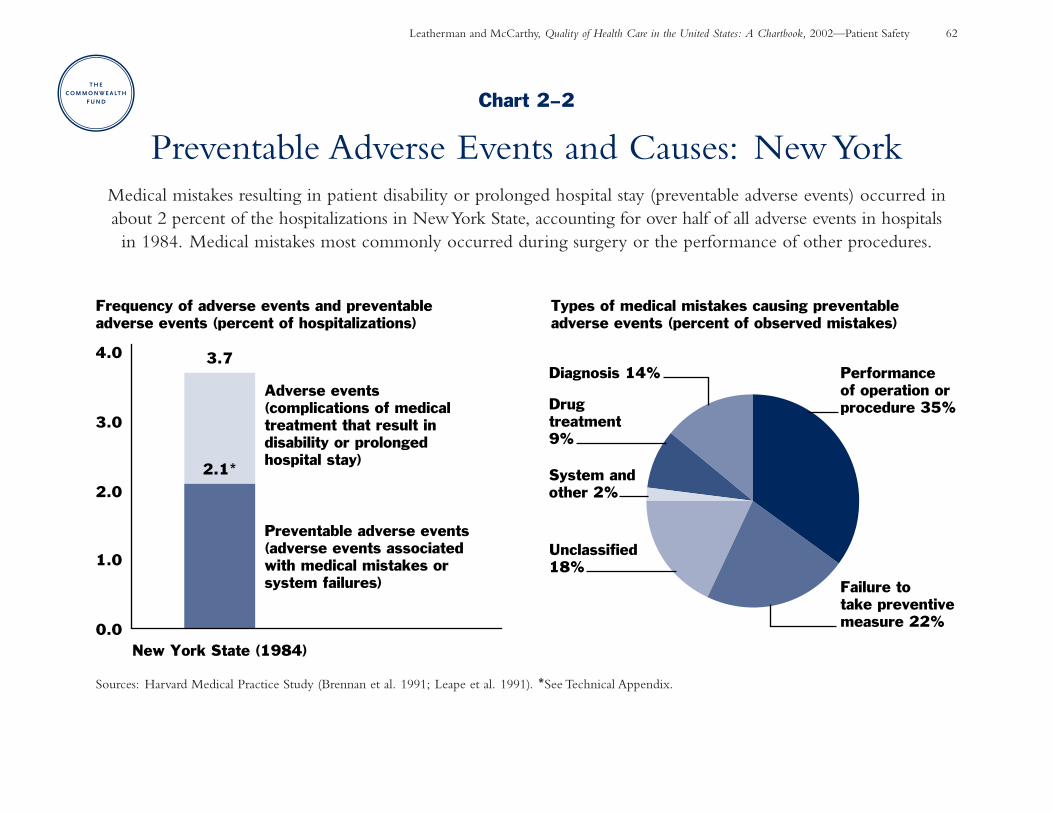
Leatherman and McCarthy, Quality of Health Care in the United States: A Chartbook, 2002—Patient Safety 62
Chart 2–2
Preventable Adverse Events and Causes: New YorkMedical mistakes resulting in patient disability or prolonged hospital stay (preventable adverse events) occurred inabout 2 percent of the hospitalizations in New York State, accounting for over half of all adverse events in hospitals in 1984. Medical mistakes most commonly occurred during surgery or the performance of other procedures.
Sources: Harvard Medical Practice Study (Brennan et al. 1991; Leape et al. 1991). *See Technical Appendix.
3.7
2.1*
0.0
1.0
2.0
3.0
4.0
New York State (1984)
Adverse events (complications of medical treatment that result in disability or prolonged hospital stay)
Preventable adverse events (adverse events associated with medical mistakes or system failures)
Frequency of adverse events and preventable adverse events (percent of hospitalizations)
Types of medical mistakes causing preventable adverse events (percent of observed mistakes)
Failure to take preventive measure 22%
Performance of operation or procedure 35%
Diagnosis 14%
Drug treatment 9%
System and other 2%
Unclassified 18%
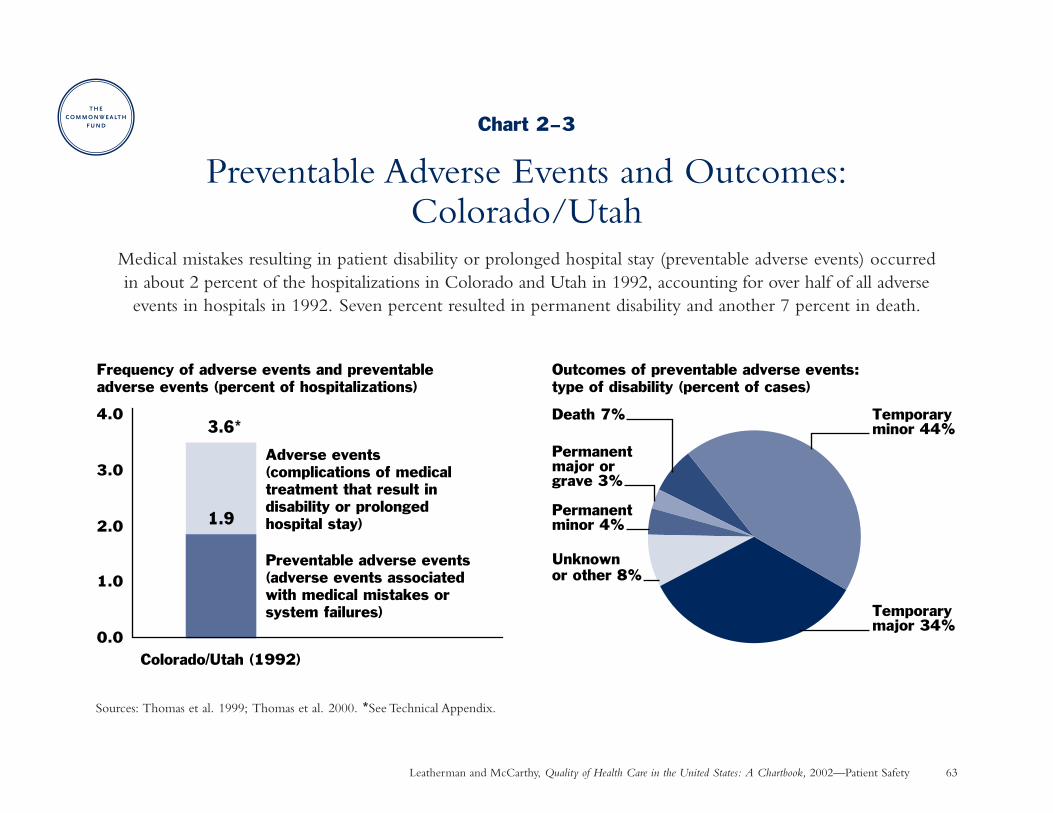
Leatherman and McCarthy, Quality of Health Care in the United States: A Chartbook, 2002—Patient Safety 63
Chart 2–3
Preventable Adverse Events and Outcomes:Colorado/Utah
Medical mistakes resulting in patient disability or prolonged hospital stay (preventable adverse events) occurred in about 2 percent of the hospitalizations in Colorado and Utah in 1992, accounting for over half of all adverse events in hospitals in 1992. Seven percent resulted in permanent disability and another 7 percent in death.
Sources: Thomas et al. 1999; Thomas et al. 2000. *See Technical Appendix.
Frequency of adverse events and preventable adverse events (percent of hospitalizations)
Outcomes of preventable adverse events: type of disability (percent of cases)
0.0
1.0
2.0
3.0
4.0
Adverse events (complications of medical treatment that result in disability or prolonged hospital stay)
Preventable adverse events (adverse events associated with medical mistakes or system failures)
Colorado/Utah (1992)
1.9
3.6*Temporaryminor 44%
Temporarymajor 34%
Unknown or other 8%
Death 7%
Permanent major or grave 3%
Permanent minor 4%
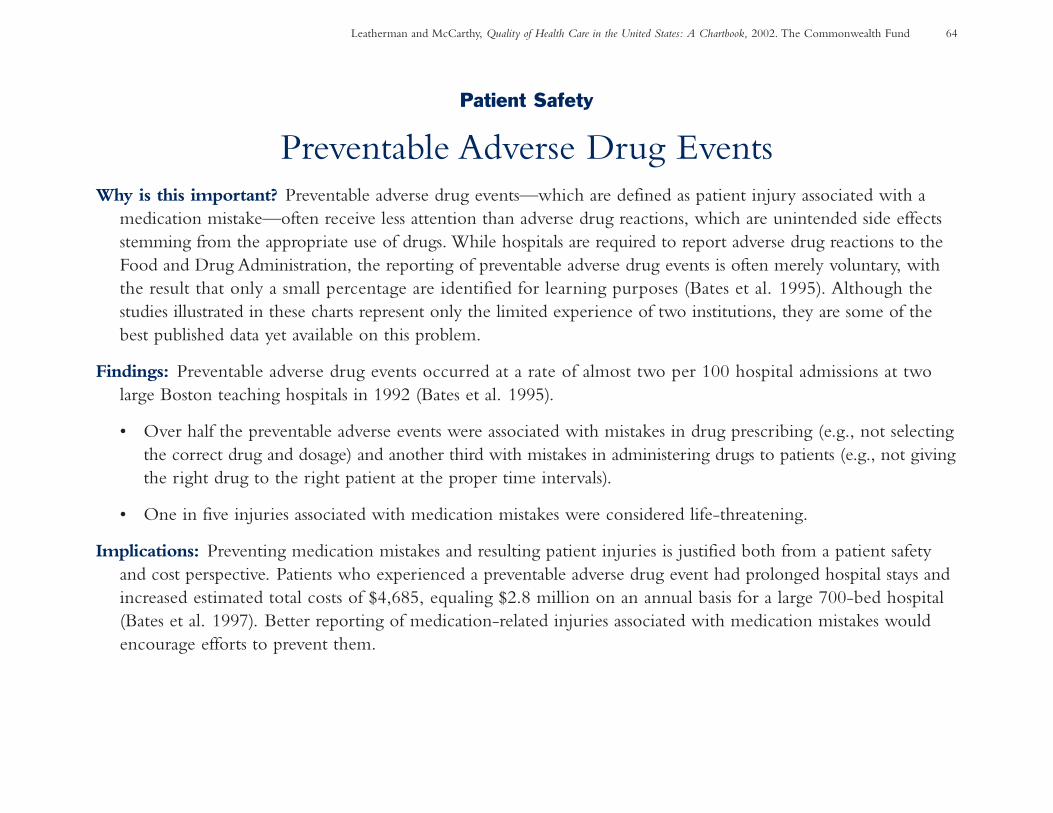
Leatherman and McCarthy, Quality of Health Care in the United States: A Chartbook, 2002. The Commonwealth Fund 64
Patient Safety
Preventable Adverse Drug EventsWhy is this important? Preventable adverse drug events—which are defined as patient injury associated with a
medication mistake—often receive less attention than adverse drug reactions, which are unintended side effectsstemming from the appropriate use of drugs. While hospitals are required to report adverse drug reactions to theFood and Drug Administration, the reporting of preventable adverse drug events is often merely voluntary, withthe result that only a small percentage are identified for learning purposes (Bates et al. 1995). Although thestudies illustrated in these charts represent only the limited experience of two institutions, they are some of thebest published data yet available on this problem.
Findings: Preventable adverse drug events occurred at a rate of almost two per 100 hospital admissions at two large Boston teaching hospitals in 1992 (Bates et al. 1995).
• Over half the preventable adverse events were associated with mistakes in drug prescribing (e.g., not selecting the correct drug and dosage) and another third with mistakes in administering drugs to patients (e.g., not givingthe right drug to the right patient at the proper time intervals).
• One in five injuries associated with medication mistakes were considered life-threatening.
Implications: Preventing medication mistakes and resulting patient injuries is justified both from a patient safetyand cost perspective. Patients who experienced a preventable adverse drug event had prolonged hospital stays andincreased estimated total costs of $4,685, equaling $2.8 million on an annual basis for a large 700-bed hospital(Bates et al. 1997). Better reporting of medication-related injuries associated with medication mistakes wouldencourage efforts to prevent them.
Leatherman and McCarthy, Quality of Health Care in the United States: A Chartbook, 2002—Patient Safety 65
Chart 2–4
Preventable Adverse Drug EventsIn a study at two large Boston teaching hospitals, patient injuries resulting from medication mistakes (known as
preventable adverse drug events) occurred at a frequency of almost two per 100 hospital admissions in 1992. Overhalf of the medication mistakes occurred when drugs were prescribed by physicians, and another third of the mistakesoccurred when drugs were administered to patients. One in five of resulting injuries were considered life-threatening.
Source: Bates et al. 1995.
Stage of medication process at which medication mistakes occured
Severity of injuries resulting from medication mistakes
Administration 34%
Dispensing 4%
Transcription 6%
Prescribing 56%
Significant37%
Serious 43%
Life-threatening20%
Leatherman and McCarthy, Quality of Health Care in the United States: A Chartbook, 2002. The Commonwealth Fund 66
Patient Safety
Trends and Types of Medication-Prescribing MistakesWhy is this important? Medication mistakes occur most frequently at the prescribing stage. Such mistakes may
become more frequent as the number of available drugs multiplies and as patients take more drugs, requiringthat physicians know about the appropriate use and potential interactions of more drugs. Very little data has beenpublished on trends in medication-prescribing mistakes over time.
Findings: Rates of medication-prescribing mistakes with the potential for adverse outcomes more than doubled inproportion to medication orders (from 1.8 to 4.1 per 1,000), tripled in proportion to hospital admissions (from2.4 to 8.4 per 100), and quadrupled in proportion to patient-days (from 2.5 to 11.3 per 1,000) at one teachinghospital over a nine-year period. This trend is most likely due to increased drug use (medication orders peradmission increased 50 percent during this time), patients being sicker on average, and better detection by pharmacists. Source: Lesar, Lomaestro, and Pohl 1997; personal communication with Timothy Lesar 2002.
• The majority of medication-prescribing mistakes at this institution involved over- or underdosing.
• Similar mistakes were repeated with increasing frequency; in addition, new errors were discovered as newtypes of drugs therapies were introduced.
• All of these medication mistakes were detected and prevented through a rigorous program of pharmacistreview of prescriptions at this institution.
Implications: Although these results represent the experience of only one institution, they suggest that the risk ofadverse drug events may be rising along with the intensity of drug therapy, highlighting the need for systematicefforts to identify and prevent such mistakes.
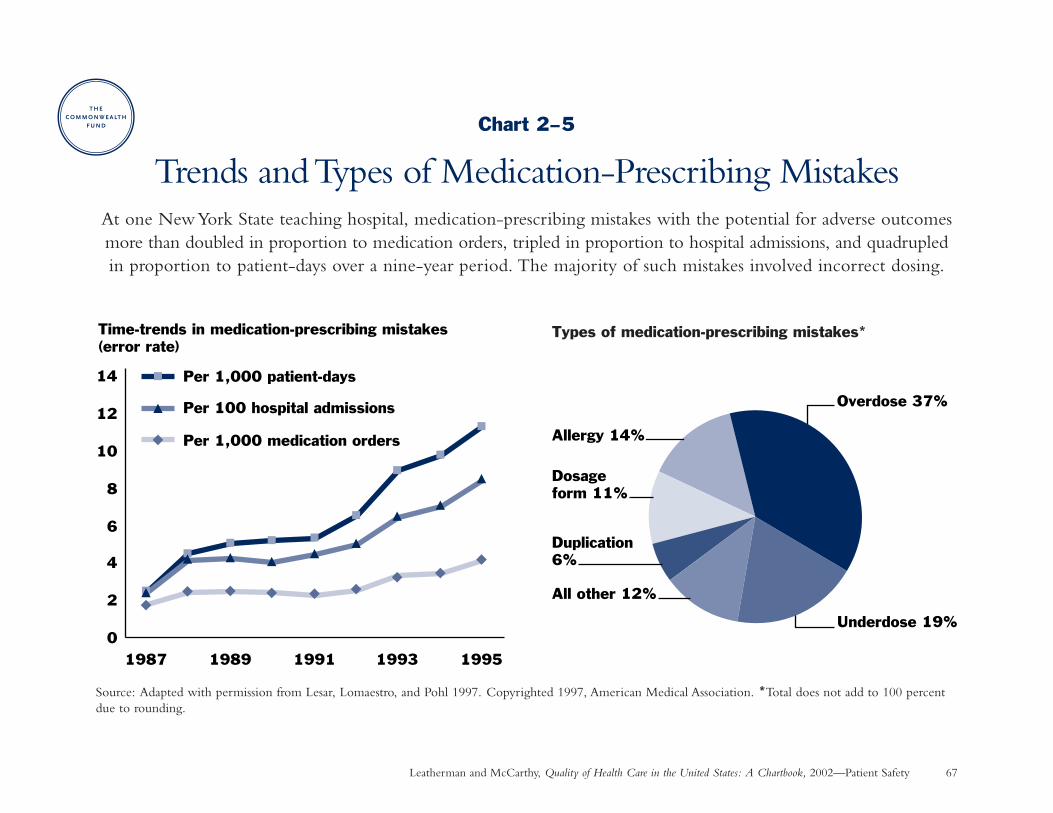
Leatherman and McCarthy, Quality of Health Care in the United States: A Chartbook, 2002—Patient Safety 67
Chart 2–5
Trends and Types of Medication-Prescribing MistakesAt one New York State teaching hospital, medication-prescribing mistakes with the potential for adverse outcomesmore than doubled in proportion to medication orders, tripled in proportion to hospital admissions, and quadrupledin proportion to patient-days over a nine-year period. The majority of such mistakes involved incorrect dosing.
Source: Adapted with permission from Lesar, Lomaestro, and Pohl 1997. Copyrighted 1997, American Medical Association. *Total does not add to 100 percentdue to rounding.
0
2
4
6
8
10
12
14
1987 1989 1991 1993 1995
Time-trends in medication-prescribing mistakes(error rate)
Per 1,000 patient-days
Per 100 hospital admissions
Per 1,000 medication orders
Types of medication-prescribing mistakes*
Underdose 19%
Overdose 37%
All other 12%
Duplication 6%
Dosage form 11%
Allergy 14%
Leatherman and McCarthy, Quality of Health Care in the United States: A Chartbook, 2002. The Commonwealth Fund 68
Patient Safety
Potentially Inappropriate Prescribing for the ElderlyWhy is this important? The prescription of medications that are inappropriate for the elderly is a major patient
safety issue (GAO 1995). Inappropriate medications are those for which the risk outweighs the benefits; somemedications create higher risks for elderly persons. Beers and his colleagues developed expert criteria for measuringpotentially inappropriate drug prescribing among the elderly. The Beers criteria has been modified and used inseveral studies over the past decade (Aparasu and Mort 2000).
Findings: A review of six studies that were conducted during the past decade using similar criteria shows that 14 percent to 24 percent of elderly people were prescribed medications that could potentially cause harm in or havequestionable effectiveness for the elderly. In a recent national study of noninstitutionalized elderly people livingin the community, experts further delineated inappropriate medication use in 1996 as follows (Zhan et al. 2001):
• 2.6 percent had used one of 11 medications that should always be avoided in the elderly.
• 9.1 percent had used one of eight drugs that are appropriate only in rare circumstances.
• 13.3 percent had used one of 14 drugs that may sometimes be indicated but are often misused.
Sources: Wilcox, Himmelstein, and Woolhandler 1994; Stuck et al. 1994; GAO 1995; Spore et al. 1997; Zhanet al. 2001; Meredith et al. 2001.
Implications: Much of the drug-related injury in elderly people is avoidable (Lindley et al. 1992). Drug utilizationreview programs are one mechanism for accomplishing this, both to alert pharmacists about potentially inappropriatedrugs before prescriptions are filled, and to provide feedback to physicians so that they can change their prescribingpractices in the future.
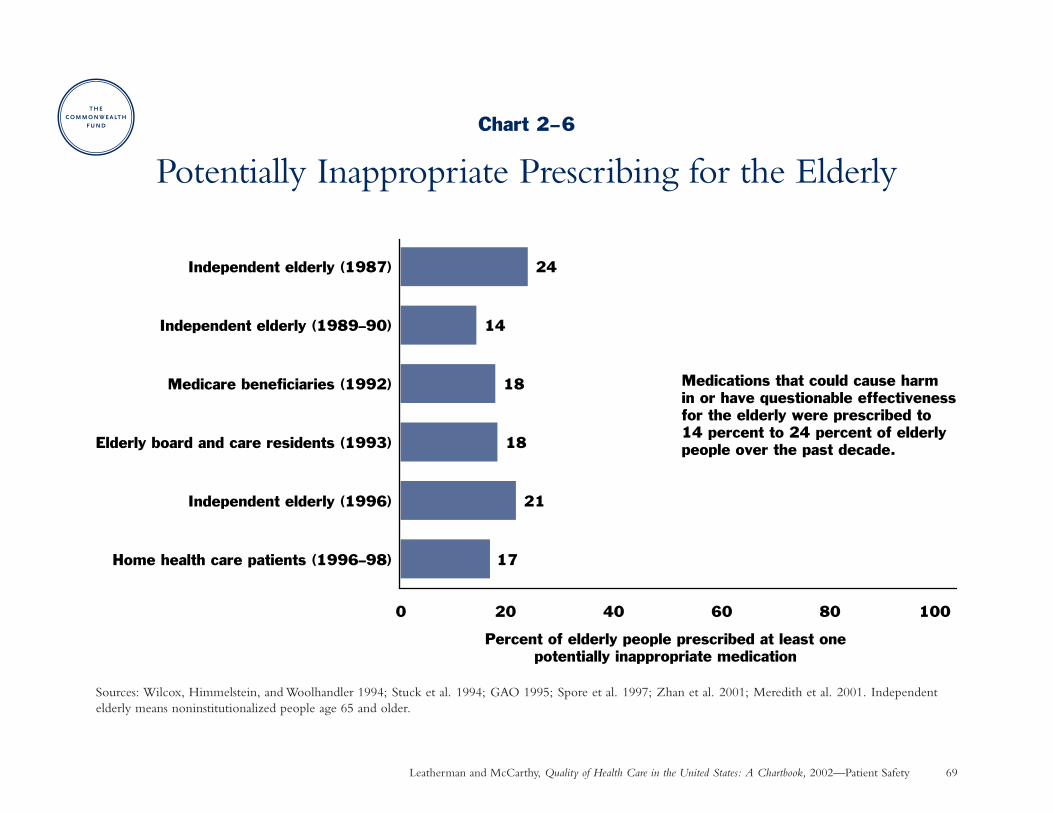
Leatherman and McCarthy, Quality of Health Care in the United States: A Chartbook, 2002—Patient Safety 69
Chart 2–6
Potentially Inappropriate Prescribing for the Elderly
Sources: Wilcox, Himmelstein, and Woolhandler 1994; Stuck et al. 1994; GAO 1995; Spore et al. 1997; Zhan et al. 2001; Meredith et al. 2001. Independentelderly means noninstitutionalized people age 65 and older.
17
21
18
18
14
24
0 20 40 60 80 100
Home health care patients (1996–98)
Independent elderly (1996)
Elderly board and care residents (1993)
Medicare beneficiaries (1992)
Independent elderly (1989–90)
Independent elderly (1987)
Percent of elderly people prescribed at least onepotentially inappropriate medication
Medications that could cause harm in or have questionable effectiveness for the elderly were prescribed to 14 percent to 24 percent of elderly people over the past decade.

Chapter 3
Access and Timeliness
. . . the benefits of American medicine are available only to those with access to the health care system.
— American College of Physicians/American Society of Internal Medicine, 2000
Leatherman and McCarthy, Quality of Health Care in the United States: A Chartbook, 2002. The Commonwealth Fund 72
Chapter 3
Access and Timeliness: IntroductionThis chapter encompasses two concepts that are closelyrelated to health care quality: the ability to obtain neededcare and minimizing unnecessary delays in getting care. Thequality of health care hardly matters if people do not havetimely access to needed services in the first place. Due tooverlapping subject matter, some of the charts illustrating these con-cepts also can be found in Chapters 1, 4, and 5 as noted below.
Nearly 39 million Americans—one in seven—lacked healthinsurance coverage during 2000 (U.S. Census Bureau 2001).Moreover, certain groups are more likely to be uninsured:younger adults (age 18–24), those with lower levels of edu-cation, people of Hispanic ethnicity, and those who workpart-time (ACP/ASIM 2000).
Those who lack health insurance face financial barriers thatcause them to delay or forgo needed medical care and pre-ventive services (ACP/ASIM 2000; Charts 3–1 to 3–4). Theyalso are less likely to have a regular provider of health care,another risk factor for not getting timely care (IOM 1993;Chart 3–5). Lack of dental insurance and cost are main reasonsthat one-third of Americans don’t see a dentist (Chart 3–7).
Even when people have financial access to the health caresystem, delays in treatment can be detrimental to healthoutcomes. For example:
• Medicare patients with pneumonia have a reduced risk of death when they get antibiotics within eight hours ofadmission to the hospital (Chart 1–7).
• Heart attack victims who get clot-dissolving drugs withinan hour after their symptoms occur have significantly bet-ter survival than those who don’t get reperfusion until 7 to12 hours later (Chart 1–14).
• Starting prenatal care in the first trimester allows for earlydetection of risk factors that are amenable to treatment(Chart 3–6).
In addition to objective measures, one of the best ways tomeasure these concepts is to ask patients about their experi-ences (Chart 4–4). Up to a quarter of the insured reportaccess problems, especially Asian and Hispanic parents whodo not speak English as a first language (Chart 5–7).
Leatherman and McCarthy, Quality of Health Care in the United States: A Chartbook, 2002. The Commonwealth Fund 73
Access and Timeliness: Summary of Charts and FindingsCharts 3–1 to 3–3: Effect of Being Uninsured on Accessto Primary and Preventive Care—Uninsured adults (non-elderly) were up to three times more likely than insuredadults to report not being able to see a doctor when neededdue to cost and not receiving recommended preventive careduring 1997–1998.
Chart 3–4: Unmet Needs of Children with SpecialHealth Care Needs—Children with special health careneeds were three times more likely to report being unable to get needed health care during 1994–1995 if they wereuninsured.
Chart 3–5: Effect of Having a Regular Source of HealthCare on Access to Preventive Care—Adults with a regu-lar physician or clinic were up to five times more likely toreceive preventive care in 1998 than those without a regularsource of health care.
Chart 3–6: Timely Initiation of Prenatal Care—The pro-portion of women who initiated prenatal care in their firsttrimester of pregnancy increased 7 percentage points from 1980to 1999, with the greatest improvement (up to 14 percentagepoints) among blacks, Hispanics, and Native Americans,who had the greatest historical deficits in prenatal care.
Chart 3–7: Dental Care—One-third of all Americans andover half of those with low income did not have a dentalvisit in 1999. Lack of dental insurance coverage and costwere cited as major barriers.
Charts in Other Chapters
Chart 1–7: Antibiotic Treatment of Pneumonia—Fourteen percent of Medicare patients hospitalized forpneumonia did not receive an antibiotic within eight hours of hospital arrival in the middle-range state during1998–1999.
Chart 1–14: Speed to Treatment with Clot-DissolvingDrugs Following a Heart Attack—Certain hospitalsreduced the median time to start thrombolytic therapy by 40 percent, from 62 to 38 minutes after hospital arrival,from 1990 to 1999.
Chart 4–4: Consumer Assessment of Health Plans,Ratings of Access and Timeliness—Problems with accessto and timeliness of health care were reported by about 15percent of the elderly in Medicare plans and children incommercial plans and by about 25 percent of adults incommercial and Medicaid plans in 2000.
Leatherman and McCarthy, Quality of Health Care in the United States: A Chartbook, 2002. The Commonwealth Fund 74
Access and Timeliness
Effect of Being Uninsured on Access to Primary and Preventive Care
Why is this important? Nearly 39 million Americans—or one in seven—reported that they lacked health insurance coverage during the year 2000 (U.S. Census Bureau 2001). Research shows that uninsured adults face financial barriers that cause them to delay or completely forgo getting needed medical care, including preventive care services (ACP/ASIM 2000).
Findings: Uninsured adults (non-elderly) were up to three times more likely to report not seeing a physician when needed and not receiving recommended preventive services than those with public or private insurancecoverage during 1997–1998. Unmet health care needs were greatest for those who had been uninsured for ayear or longer. There were also deficits in access to primary care and some preventive services for those whowere uninsured less than a year (data on short-term uninsured are not shown for preventive care). Source:Behavioral Risk Factor Surveillance System (Ayanian et al. 2000).
Implications: Improving the quality of health care depends in some measure on improving public or private insurance coverage for the uninsured. Of particular concern are the uninsured in poor health and with chronicconditions such as diabetes that require regular medical care and follow-up.
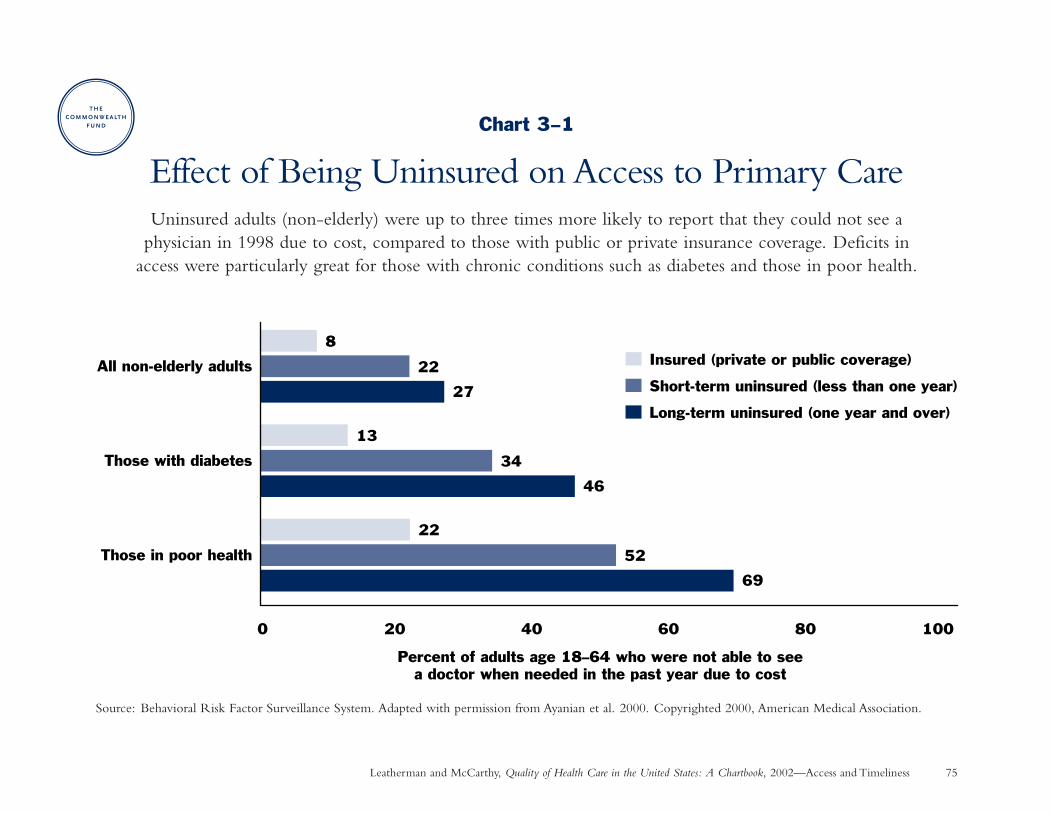
Leatherman and McCarthy, Quality of Health Care in the United States: A Chartbook, 2002—Access and Timeliness 75
Chart 3–1
Effect of Being Uninsured on Access to Primary CareUninsured adults (non-elderly) were up to three times more likely to report that they could not see a
physician in 1998 due to cost, compared to those with public or private insurance coverage. Deficits in access were particularly great for those with chronic conditions such as diabetes and those in poor health.
Source: Behavioral Risk Factor Surveillance System. Adapted with permission from Ayanian et al. 2000. Copyrighted 2000, American Medical Association.
69
46
27
52
34
22
22
13
8
0 20 40 60 80 100
Percent of adults age 18–64 who were not able to seea doctor when needed in the past year due to cost
Insured (private or public coverage)
Short-term uninsured (less than one year)
Long-term uninsured (one year and over)
All non-elderly adults
Those with diabetes
Those in poor health
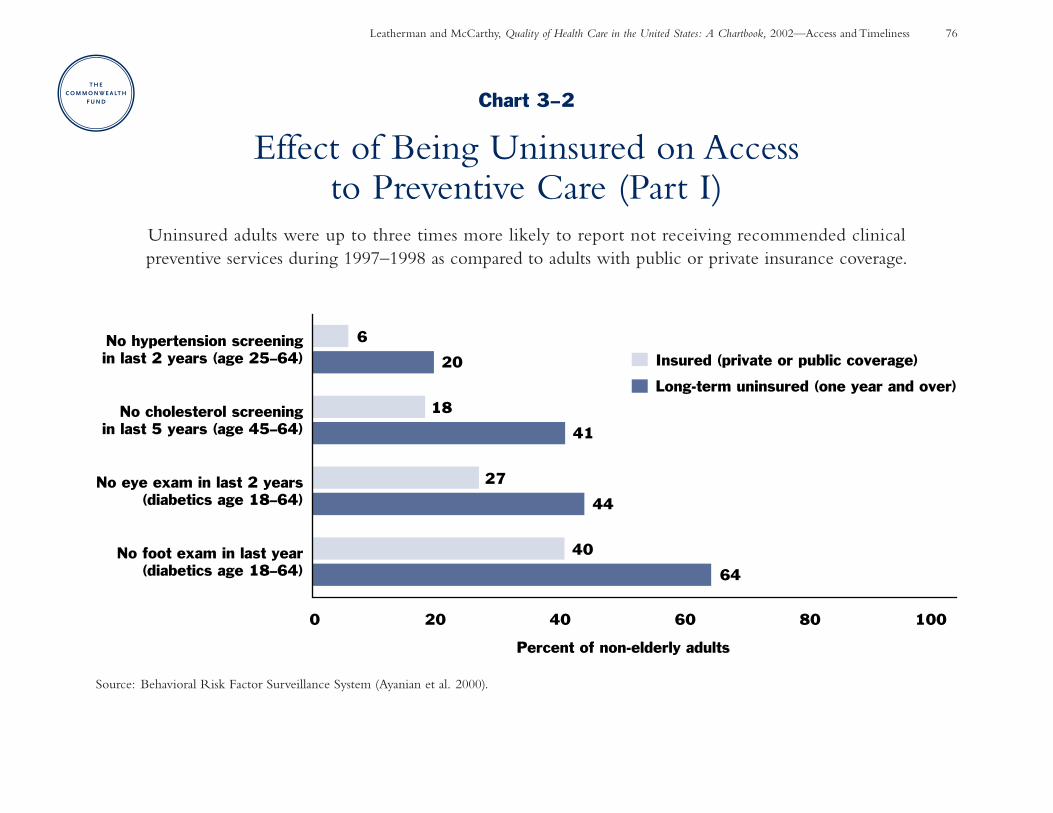
Leatherman and McCarthy, Quality of Health Care in the United States: A Chartbook, 2002—Access and Timeliness 76
Chart 3–2
Effect of Being Uninsured on Access to Preventive Care (Part I)
Uninsured adults were up to three times more likely to report not receiving recommended clinical preventive services during 1997–1998 as compared to adults with public or private insurance coverage.
Source: Behavioral Risk Factor Surveillance System (Ayanian et al. 2000).
64
44
41
20
40
27
18
6
0 20 40 60 80 100
No foot exam in last year(diabetics age 18–64)
No eye exam in last 2 years(diabetics age 18–64)
No cholesterol screeningin last 5 years (age 45–64)
No hypertension screeningin last 2 years (age 25–64)
Percent of non-elderly adults
Insured (private or public coverage)
Long-term uninsured (one year and over)
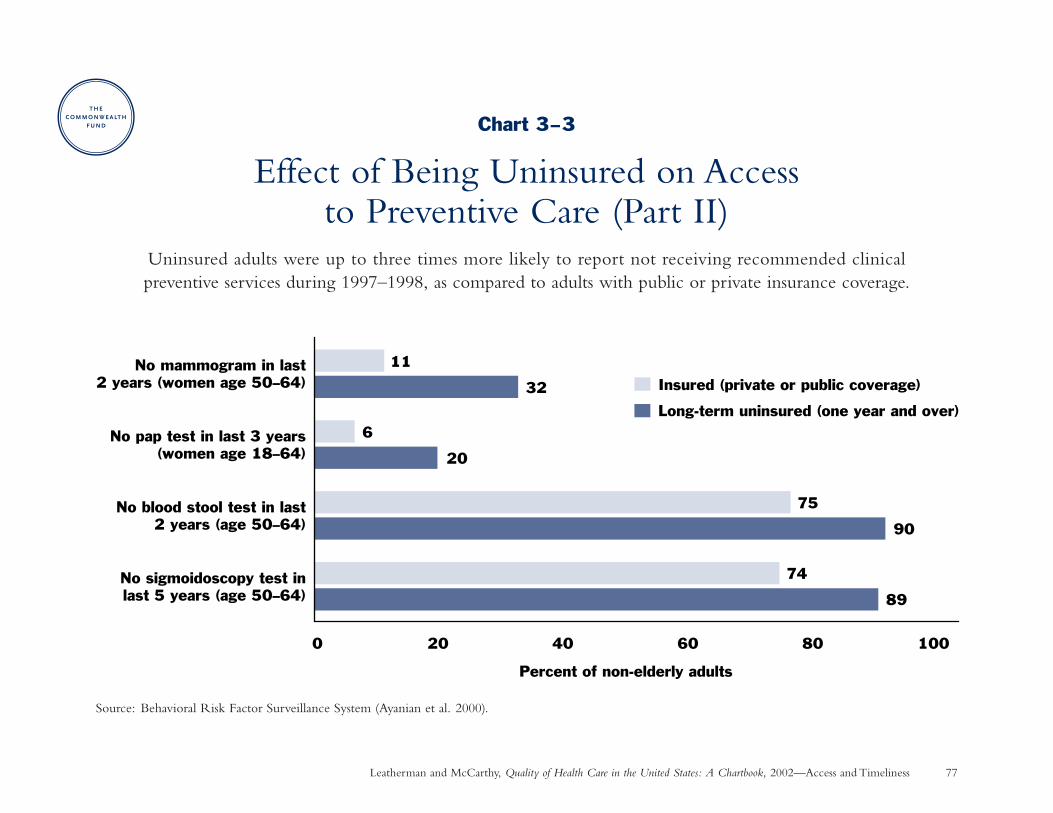
Leatherman and McCarthy, Quality of Health Care in the United States: A Chartbook, 2002—Access and Timeliness 77
Chart 3–3
Effect of Being Uninsured on Access to Preventive Care (Part II)
Uninsured adults were up to three times more likely to report not receiving recommended clinical preventive services during 1997–1998, as compared to adults with public or private insurance coverage.
Source: Behavioral Risk Factor Surveillance System (Ayanian et al. 2000).
89
90
20
32
74
75
6
11
0 20 40 60 80 100
No sigmoidoscopy test inlast 5 years (age 50–64)
No blood stool test in last2 years (age 50–64)
No pap test in last 3 years(women age 18–64)
No mammogram in last2 years (women age 50–64)
Percent of non-elderly adults
Insured (private or public coverage)
Long-term uninsured (one year and over)
Leatherman and McCarthy, Quality of Health Care in the United States: A Chartbook, 2002. The Commonwealth Fund 78
Access and Timeliness
Unmet Needs of Children with Special Health Care Needs
Why is this important? Children with special health care needs are defined as those at increased risk for chronicphysical, developmental, behavioral, and/or emotional conditions that require health and related services of adifferent type and/or intensity than other children (McPherson et al. 1998). Access to appropriate medical careis especially important for such children.
Findings: Children with special health care needs who lacked health insurance were three times more likely thansimilar children with insurance to report at least one unmet health care need. Source: National Health InterviewSurvey on Disability (Newacheck et al. 2000).
Implications: Quality matters little if children cannot obtain needed care in the first place. Improving insurancecoverage is important to ensure that children with special needs are able to obtain timely and appropriate care.
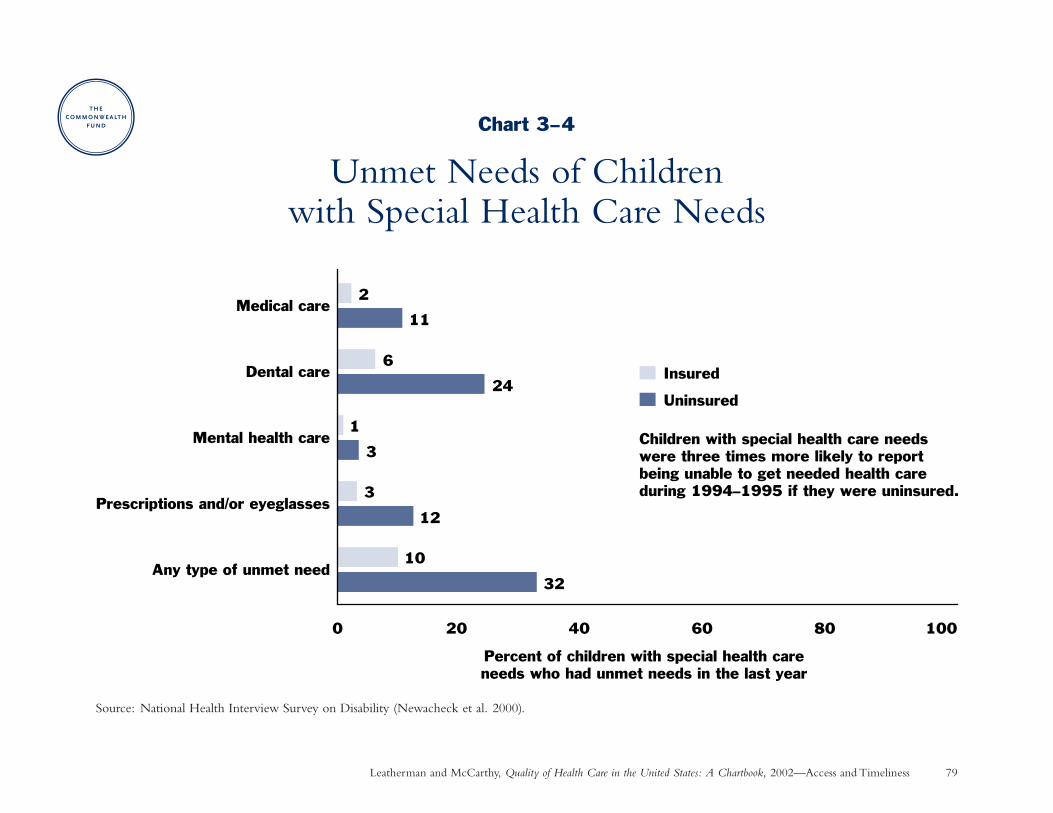
Leatherman and McCarthy, Quality of Health Care in the United States: A Chartbook, 2002—Access and Timeliness 79
Chart 3–4
Unmet Needs of Children with Special Health Care Needs
Source: National Health Interview Survey on Disability (Newacheck et al. 2000).
32
12
3
24
11
10
3
1
6
2
0 20 40 60 80 100
Any type of unmet need
Prescriptions and/or eyeglasses
Mental health care
Dental care
Medical care
Percent of children with special health careneeds who had unmet needs in the last year
Insured
Uninsured
Children with special health care needs were three times more likely to report being unable to get needed health care during 1994–1995 if they were uninsured.
Leatherman and McCarthy, Quality of Health Care in the United States: A Chartbook, 2002. The Commonwealth Fund 80
Access and Timeliness
Effect of Having a Regular Source of Health Care on Access to Preventive Care
Why is this important? Having a regular place to go for health care—such as a physician’s office or clinic—is aneven more powerful predictor of whether someone receives preventive care services than having health insurancecoverage (Breen et al. 2001). Nearly 18 percent of adults under age 65 lacked a regular source of health care in1998–1999; this rate was higher among males (24%), Hispanics (29%), and the uninsured (47%) (Eberhardt et al.2001). In contrast, a much smaller percentage of adults age 65 and over—who have near-universal insurancecoverage through Medicare—lack a regular source of health care (4% in 2001) (CDC 2002b).
Findings: Adults with a regular source of health care were up to five times more likely to receive preventive care—such as mammograms, pap smears, and colorectal cancer screening—than those without a regular health careprovider in 1998. These differences persisted even among older adults who have near-universal Medicare coverage.Source: National Health Interview Survey (Breen et al. 2001).
Implications: Having health insurance coverage and a regular source of health care are both important to assureaccess to preventive care (O’Malley et al. 2001). The importance of a regular health care provider can be seen in the fact that a doctor’s recommendation greatly influences whether people receive preventive care (Hawley et al. 2000).
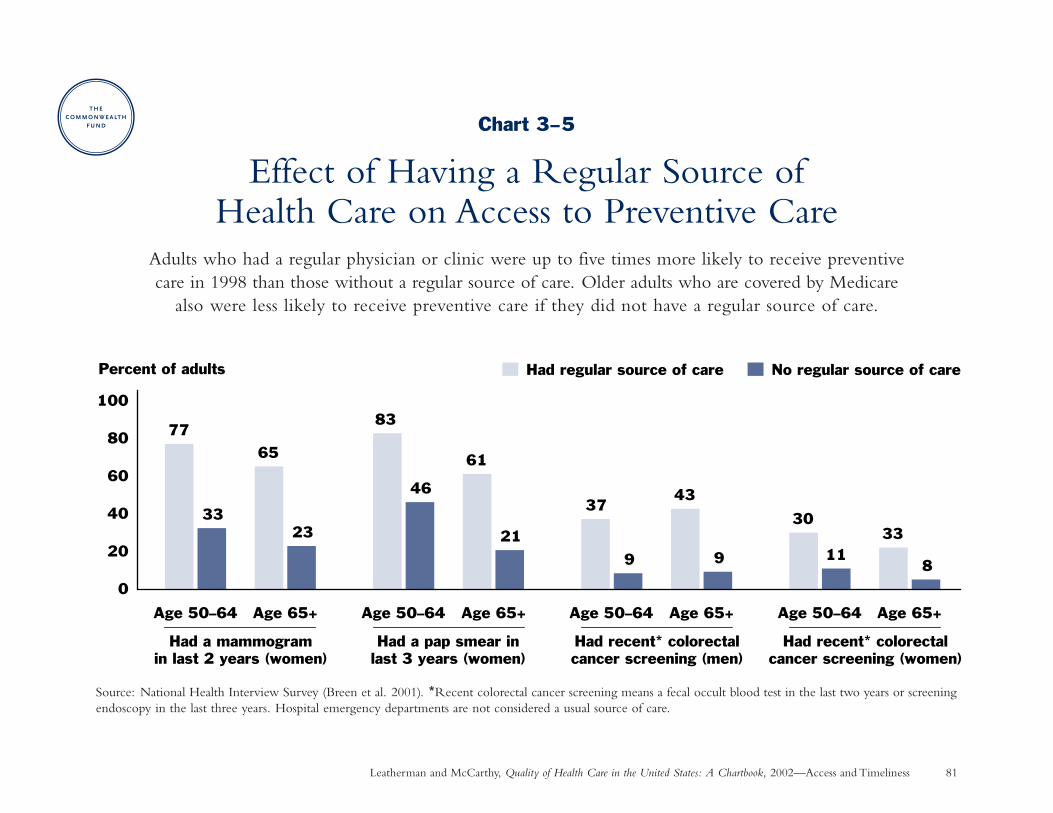
Leatherman and McCarthy, Quality of Health Care in the United States: A Chartbook, 2002—Access and Timeliness 81
Chart 3–5
Effect of Having a Regular Source of Health Care on Access to Preventive Care
Adults who had a regular physician or clinic were up to five times more likely to receive preventive care in 1998 than those without a regular source of care. Older adults who are covered by Medicare
also were less likely to receive preventive care if they did not have a regular source of care.
Source: National Health Interview Survey (Breen et al. 2001). *Recent colorectal cancer screening means a fecal occult blood test in the last two years or screeningendoscopy in the last three years. Hospital emergency departments are not considered a usual source of care.
0
20
40
60
80
100
Had regular source of care No regular source of care
Had a mammogramin last 2 years (women)
Had recent* colorectalcancer screening (women)
Percent of adults
Had recent* colorectalcancer screening (men)
Had a pap smear inlast 3 years (women)
Age 50–64
83
46
61
21
Age 65+ Age 50–64
37
9
43
9
Age 65+ Age 50–64
30
1133
8
Age 65+Age 50–64
77
33
65
23
Age 65+
Leatherman and McCarthy, Quality of Health Care in the United States: A Chartbook, 2002. The Commonwealth Fund 82
Access and Timeliness
Timely Initiation of Prenatal CareWhy is this important? Early initiation of prenatal care during the first three months of pregnancy allows for
identification of high-risk factors that are amenable to intervention, such as smoking, substance abuse, highblood pressure, and diabetes. For example, pregnancy-induced hypertension occurs in 5 percent to 10 percent of pregnancies. Screening for high blood pressure during the first trimester of pregnancy allows better diagnosisof preeclampsia to prevent complications such as seizures or death (McGlynn et al. 2000).
Findings: Timely initiation of prenatal care increased 7 percentage points over the past two decades for the U.S.population as a whole, from 76 percent of live births in 1980 to 83 percent in 1999. Certain racial/ethnicgroups show generally lower but greatly improving rates of early prenatal care, with rates increasing up to 14 percentage points among non-Hispanic blacks (from 61% to 74%), Hispanics (from 60% to 74%), and NativeAmericans (from 56% to 70%). Source: National Vital Statistics System (Eberhardt et al. 2001).
Implications: Improvement in timely prenatal care may be attributed in part to expansion of Medicaid coveragefor low-income pregnant women of all races (Dubay et al. 2001), as well as greater general awareness of thebenefits of prenatal care. It is unclear, however, whether increases in timely prenatal care will result in improvedbirth outcomes, such as low birthweight, without also addressing other socioeconomic and behavioral factorsthat influence maternal and child health (Dubay et al. 2001).
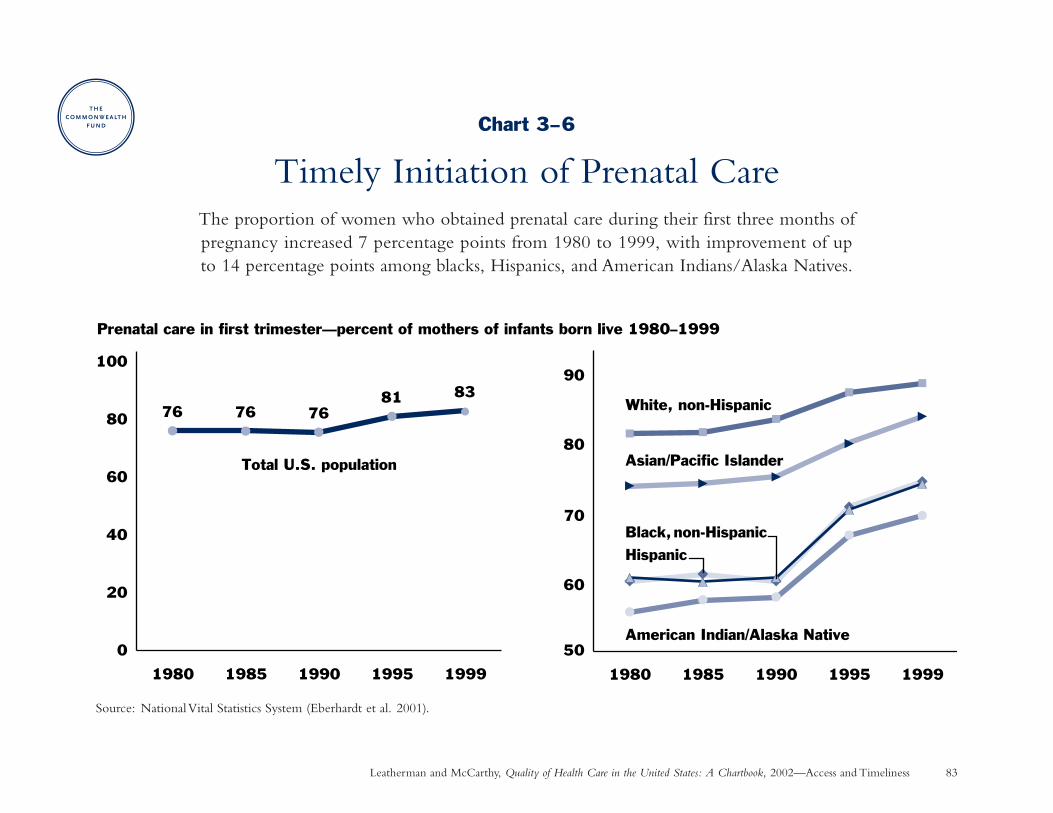
Leatherman and McCarthy, Quality of Health Care in the United States: A Chartbook, 2002—Access and Timeliness 83
Chart 3–6
Timely Initiation of Prenatal CareThe proportion of women who obtained prenatal care during their first three months of pregnancy increased 7 percentage points from 1980 to 1999, with improvement of up to 14 percentage points among blacks, Hispanics, and American Indians/Alaska Natives.
Source: National Vital Statistics System (Eberhardt et al. 2001).
76 76 7681 83
0
20
40
60
80
100
1980 1985 1990 1995 1999
Prenatal care in first trimester—percent of mothers of infants born live 1980–1999
Total U.S. population
60
80
50
70
90
1980 1985 1990 1995 1999
White, non-Hispanic
Black, non-HispanicHispanic
Asian/Pacific Islander
American Indian/Alaska Native
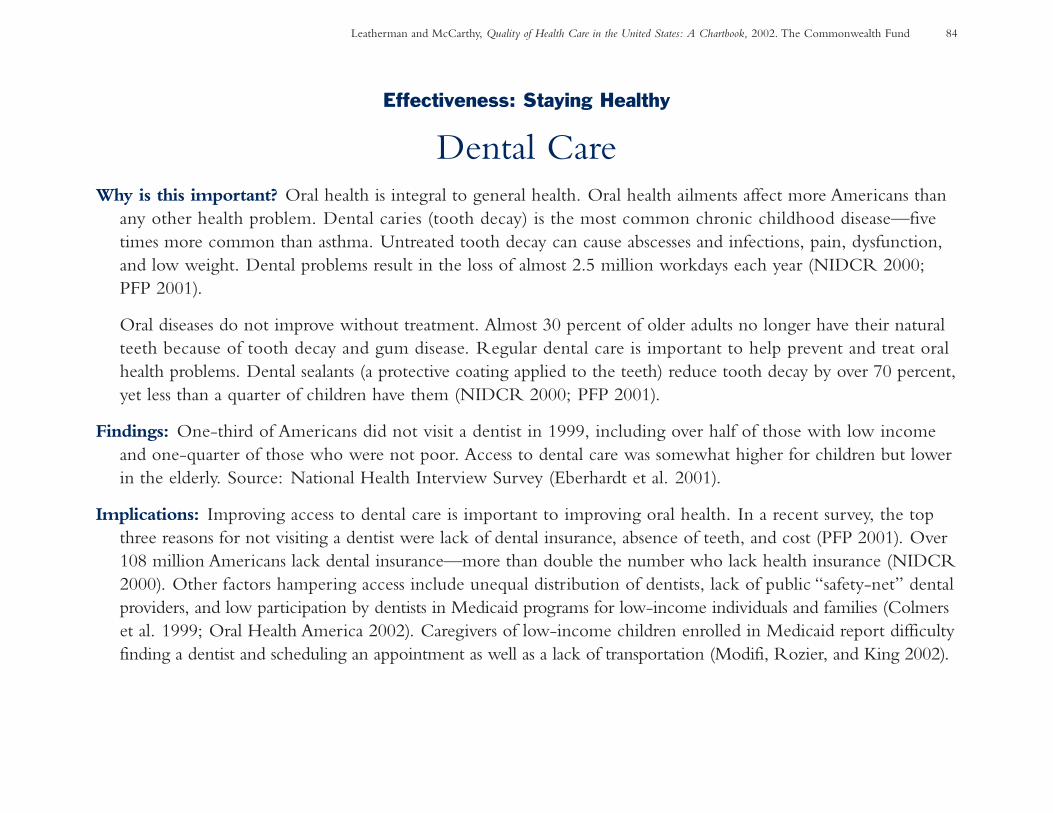
Leatherman and McCarthy, Quality of Health Care in the United States: A Chartbook, 2002. The Commonwealth Fund 84
Effectiveness: Staying Healthy
Dental CareWhy is this important? Oral health is integral to general health. Oral health ailments affect more Americans than
any other health problem. Dental caries (tooth decay) is the most common chronic childhood disease—fivetimes more common than asthma. Untreated tooth decay can cause abscesses and infections, pain, dysfunction,and low weight. Dental problems result in the loss of almost 2.5 million workdays each year (NIDCR 2000;PFP 2001).
Oral diseases do not improve without treatment. Almost 30 percent of older adults no longer have their naturalteeth because of tooth decay and gum disease. Regular dental care is important to help prevent and treat oralhealth problems. Dental sealants (a protective coating applied to the teeth) reduce tooth decay by over 70 percent,yet less than a quarter of children have them (NIDCR 2000; PFP 2001).
Findings: One-third of Americans did not visit a dentist in 1999, including over half of those with low incomeand one-quarter of those who were not poor. Access to dental care was somewhat higher for children but lowerin the elderly. Source: National Health Interview Survey (Eberhardt et al. 2001).
Implications: Improving access to dental care is important to improving oral health. In a recent survey, the topthree reasons for not visiting a dentist were lack of dental insurance, absence of teeth, and cost (PFP 2001). Over108 million Americans lack dental insurance—more than double the number who lack health insurance (NIDCR2000). Other factors hampering access include unequal distribution of dentists, lack of public “safety-net” dentalproviders, and low participation by dentists in Medicaid programs for low-income individuals and families (Colmerset al. 1999; Oral Health America 2002). Caregivers of low-income children enrolled in Medicaid report difficultyfinding a dentist and scheduling an appointment as well as a lack of transportation (Modifi, Rozier, and King 2002).
Chart 3–7
Dental CareOne-third of all Americans and over half of those with low income did not have a
dental visit in 1999. Lack of insurance coverage and cost were cited as major barriers.
Leatherman and McCarthy, Quality of Health Care in the United States: A Chartbook, 2002—Access and Timeliness 85
Source: National Health Interview Survey (Eberhardt et al. 2001). “Poor” means income below the federal poverty threshold. “Non-poor” means income 200 percent or greater than poverty. The category “near poor” was omitted for clarity.
6573
65
55
46
58
46
32
72
80
7164
0
20
40
60
80
100
Total (Age 2+) Age 2–17 Age 18–64 Age 65+
Percent of U.S. population (by age group) visiting a dentist Total population Poor Non-poor

Chapter 4
Focus on the Patient
What patients experience, and what they think of that experience, should also matter . . .because that experience, as much as the technical quality of care, will determine how peopleuse the health care system and how they benefit from it.
—Margaret Gerteis and colleagues, 1993
Leatherman and McCarthy, Quality of Health Care in the United States: A Chartbook, 2002. The Commonwealth Fund 88
Chapter 4
Focus on the Patient: IntroductionQuality of health care has two major dimensions: the tech-nical proficiency with which it is delivered, and the subjectiveexperience of patients who have encounters with health careprofessionals and institutions (Gerteis et al. 1993). “Both tech-nical care and interpersonal interactions should be shaped to meet the needs and preferences of individual patients,”according to the Institute of Medicine (2001a). This chapterfocuses on patients’ experience with their care.
An important aspect is the degree to which patients andtheir health care providers establish a partnership “to ensurethat decisions respect patients’ wants, needs, and preferencesand that patients have the education and support they needto make decisions and participate in their own care” (IOM2001b). There are, unfortunately, only limited data nationallyto measure this concept in specific circumstances.
Much work has been done to measure patient experienceglobally among health plan members and hospital patients.
• The Consumer Assessment of Health Plans survey(CAHPS®), which was developed with federal govern-ment support, is now being used by many health plans as well as public and private purchasers to measure the
responsiveness of health plans and their participatingproviders to consumer needs and expectations. Over 90 million Americans can now get CAHPS® ratings of health plans available to them (Eisenberg 2001).
• Picker Institute surveys are used in hundreds of hospitalsnationwide and internationally to better understand patients’impressions of specific aspects of their hospital care expe-rience. They also have been used as part of an industry-wideeffort to stimulate improvements in hospital quality (Clearyet al. 1991; American Hospital Association 1996).
• One objective measure of responsiveness included in thischapter is the average length of a physician office visit.
The quality of nursing home care has been a continuingnational concern for some time, but there is little publiclyavailable data on patient experience and quality of life. Tofill this gap, a recent national public opinion poll asked aboutnursing home care among those who had substantial nursinghome experience (Charts 4–8 to 4–10).
CAHPS® is a registered trademark of the Agency for Healthcare Researchand Quality
Leatherman and McCarthy, Quality of Health Care in the United States: A Chartbook, 2002. The Commonwealth Fund 89
Focus on the Patient: Summary of Charts and FindingsChart 4–1: Perceptions of Health Care Quality—Littlemore than half of the American public think that the qualityof health care in the U.S. is good or excellent. The majorityof U.S. physicians said that their ability to deliver high-qualityhealth care has deteriorated.
Chart 4–2: Public Perceptions of the Health CareSystem—A large majority of people said that hospitals and their own physician were doing a good job in 2000,but many have concerns about the leaders of medicine,health insurers, and managed care. One-third were notconfident about their ability to pay for a major illness.
Charts 4–3 to 4–5: Consumer Assessment of HealthPlans—In 2000, most health plan members rated theirhealth care highly overall. Ratings were highest among theelderly in Medicare plans and for children in commercialplans. Problems with access to and timeliness of health carewere reported by about 15 percent of the elderly in Medicareplans and children in commercial plans and by about 25percent of adults in commercial and Medicaid plans. From 6 percent to 14 percent of health plan members reported
problems communicating with their physician, while 28percent to 36 percent reported problems with health plancustomer service.
Chart 4–6: Patient Reports of Problems with HospitalCare—Patients at 272 hospitals frequently reported problemswith some aspects of their care during 1998–1999.
Chart 4–7: Time Spent with Physician—Physicians spentone to three minutes longer with patients, on average, duringoffice visits in 1999 than a decade earlier, in 1989.
Charts 4–8 to 4–10: Satisfaction with Nursing HomeCare—In 2001, among people with substantial nursing homeexperience: one-third were dissatisfied with the care thatthey, a family member, or a friend received over the pastthree years; a large minority reported inadequacies withstaffing or mistreatment or abuse of residents by staff; andone-quarter or more reported dissatisfaction with quality of life in the nursing home or a quality problem, such asthe development of bed sores.
Leatherman and McCarthy, Quality of Health Care in the United States: A Chartbook, 2002. The Commonwealth Fund 90
Focus on the Patient
Perceptions of Health Care QualityWhy is this important? Knowing what physicians and the public think about health care quality helps bring
meaningful measures of quality into the context of patient experience.
Findings: Physicians and the general public appear to share a common concern about the quality of Americanhealth care in general:
• Little more than half of Americans believe that the overall quality of care in the United States is good orexcellent, based on responses to a nationally representative opinion poll of 1,000 Americans conducted in2001.
• Nearly three in five U.S. doctors agreed with the statement that quality of care has deteriorated over the pastfive years, based on a survey of 500 American physicians conducted in 2000 as part of a five-country survey.Doctors in Australia, New Zealand, and the United Kingdom (but not Canada) had a slightly more favorableimpression of quality.
Sources: Gallup (National Journal Poll Track 2001); Commonwealth Fund International Health Policy Survey(Blendon et al. 2001).
Implications: These responses appear to reflect a fundamental gap between the level of quality that people expectfrom the health care system and what it currently delivers. Perceptions of quality also may be influenced by people’sviews of access and health insurance coverage. Public concern about the state of the health care system extendsacross numerous developed countries (Donelan et al. 1999).
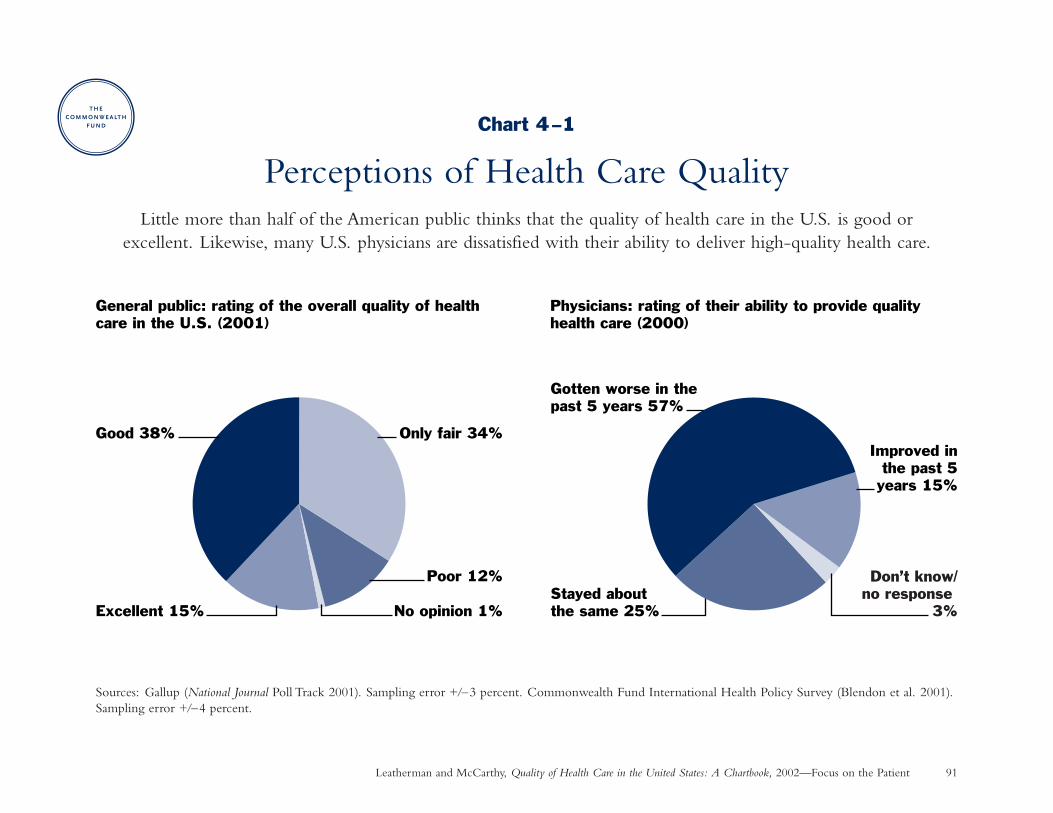
Leatherman and McCarthy, Quality of Health Care in the United States: A Chartbook, 2002—Focus on the Patient 91
Chart 4–1
Perceptions of Health Care QualityLittle more than half of the American public thinks that the quality of health care in the U.S. is good or
excellent. Likewise, many U.S. physicians are dissatisfied with their ability to deliver high-quality health care.
Sources: Gallup (National Journal Poll Track 2001). Sampling error +/–3 percent. Commonwealth Fund International Health Policy Survey (Blendon et al. 2001).Sampling error +/–4 percent.
Excellent 15% No opinion 1%
Poor 12%
Only fair 34%Good 38%
Stayed aboutthe same 25%
Improved inthe past 5
years 15%
Gotten worse in thepast 5 years 57%
General public: rating of the overall quality of health care in the U.S. (2001)
Physicians: rating of their ability to provide quality health care (2000)
Don’t know/no response
3%
Leatherman and McCarthy, Quality of Health Care in the United States: A Chartbook, 2002. The Commonwealth Fund 92
Focus on the Patient
Public Perceptions of the Health Care SystemWhy is this important? Knowing what the public thinks about the health care system can help policymakers
gauge the need for changes.
Findings:
• About three-quarters of Americans are confident that hospitals are doing a good job, a rating that hasdeclined only slightly from 77 percent in 1997 to 72 percent in 2000.
• Satisfaction with one’s last physician visit has remained relatively high over the past two decades, rising from 88 percent in 1978 to 93 percent in 1982, down to 84 percent in 2000.
• In contrast to views about their personal physician, Americans’ confidence in the people running medicinehas declined from 73 percent in 1966 to 44 percent in 2000.
• Confidence in health insurers has declined from 55 percent in 1997 to 39 percent in 2000. Over half of people think that managed care will harm the quality of health care.
• Although nearly one-third of people are not confident about their ability to pay for a serious illness,confidence has increased since 1978, when about half of people expressed this concern.
Sources: Various nationally representative public opinion polls (Blendon and Benson 2001).
Implications: Public confidence in institutions of all types has declined over the past few years, but hospitals andpersonal doctors appear to have maintained relatively high standing. While individuals report generally positiveexperience with medical care, public confidence and trust in the system at large is eroding.
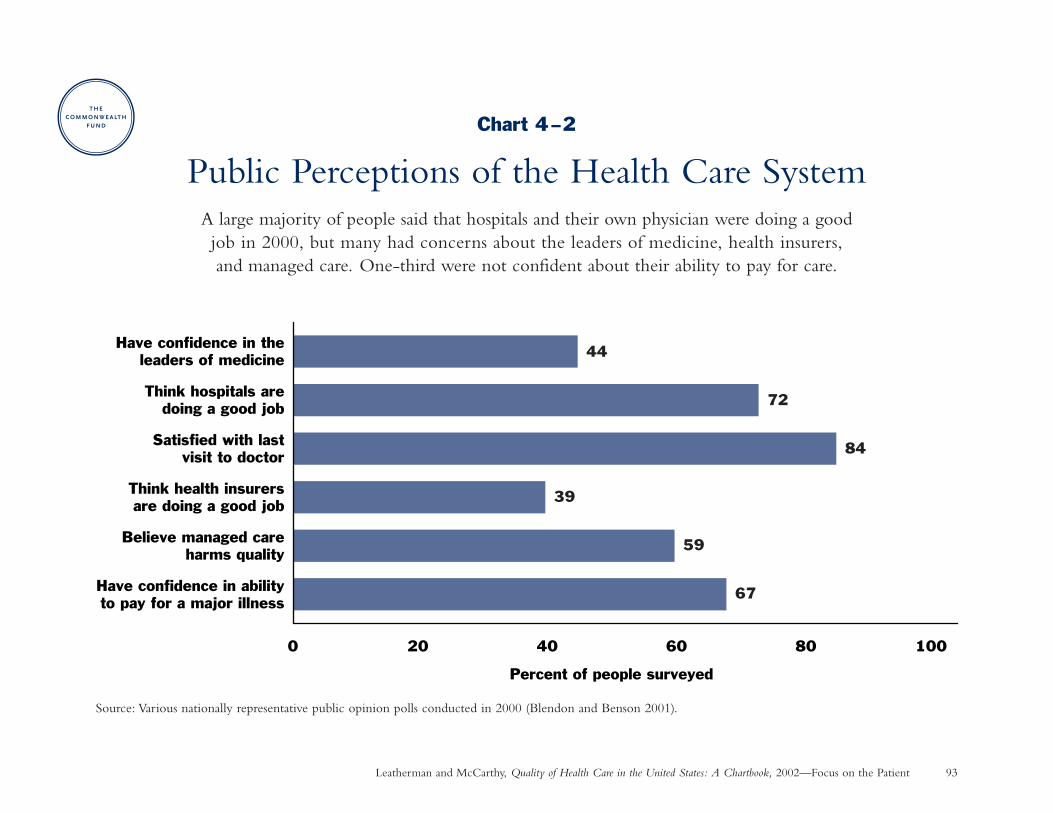
Leatherman and McCarthy, Quality of Health Care in the United States: A Chartbook, 2002—Focus on the Patient 93
Chart 4–2
Public Perceptions of the Health Care SystemA large majority of people said that hospitals and their own physician were doing a good job in 2000, but many had concerns about the leaders of medicine, health insurers,and managed care. One-third were not confident about their ability to pay for care.
Source: Various nationally representative public opinion polls conducted in 2000 (Blendon and Benson 2001).
67
59
39
84
72
44
0 20 40 60 80 100
Have confidence in abilityto pay for a major illness
Believe managed careharms quality
Think health insurersare doing a good job
Satisfied with lastvisit to doctor
Think hospitals aredoing a good job
Have confidence in theleaders of medicine
Percent of people surveyed
Leatherman and McCarthy, Quality of Health Care in the United States: A Chartbook, 2002. The Commonwealth Fund 94
Focus on the Patient
Consumer Assessment of Health PlansWhy is this important? When making decisions about health care providers and plans, consumers are often most
interested in learning about the experiences of other people like themselves (KFF/AHRQ 1996). In response,many health plans as well as public and private purchasers now use a standard survey known as the ConsumerAssessment of Health Plans (CAHPS®) to measure the responsiveness of health plans and their participating providers.
Findings: Most health plan members rated their health care highly overall in 2000, but fewer gave high ratings totheir health plan. Ratings were generally higher among the elderly in Medicare health plans and children incommercial health plans (childrens’ experience was rated by a parent). Sources: CMS 2001b; NCQA 2001b.Specific gaps in consumer expectations include the following:
• From 15 percent to 27 percent reported problems getting needed care.
• From 13 percent to 22 percent reported only sometimes or never getting care as quickly as desired.
• From 6 percent to 14 percent reported that their doctor only sometimes or never communicated well.
• From 28 percent to 36 percent reported problems with their health plan customer service.
Implications: Quality of care can be assessed by consumers. This information has been shown effective in helpingconsumers make health plan choices and in helping health plans assess the need to improve their performance(Guadagnoli et al. 2000; Scanlon et al. 2001).
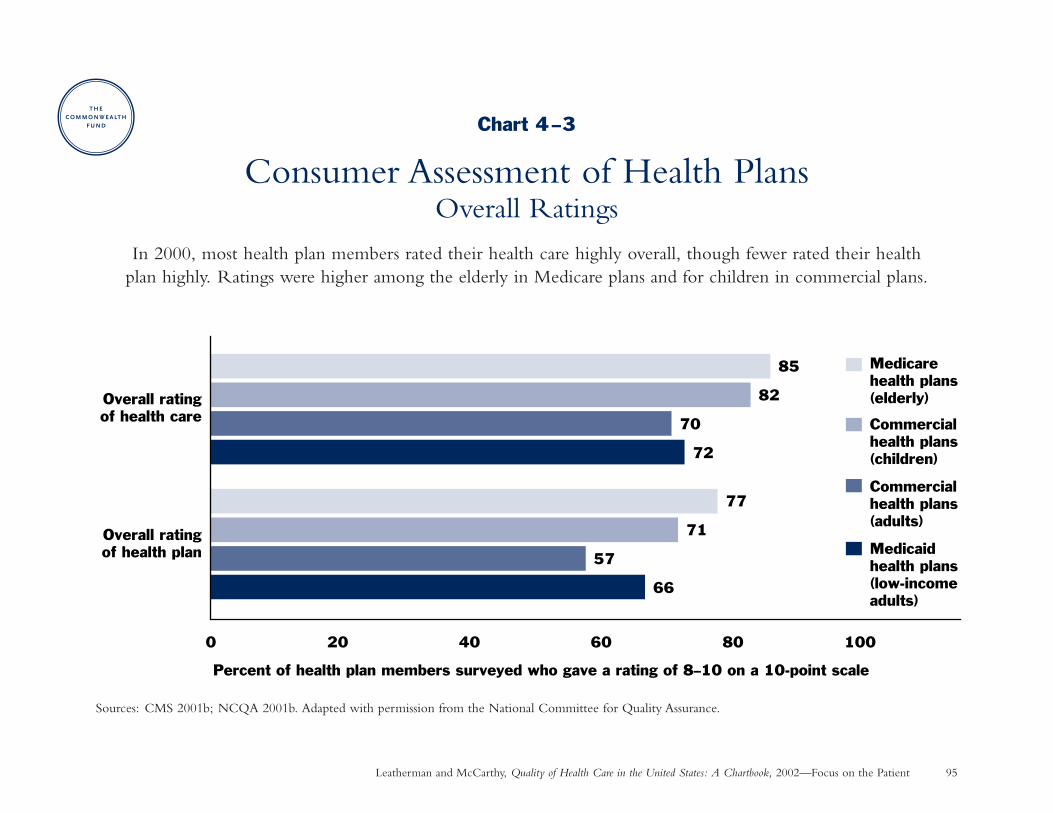
Leatherman and McCarthy, Quality of Health Care in the United States: A Chartbook, 2002—Focus on the Patient 95
Chart 4–3
Consumer Assessment of Health PlansOverall Ratings
In 2000, most health plan members rated their health care highly overall, though fewer rated their health plan highly. Ratings were higher among the elderly in Medicare plans and for children in commercial plans.
Sources: CMS 2001b; NCQA 2001b. Adapted with permission from the National Committee for Quality Assurance.
66
72
57
70
71
82
77
85
0 20 40 60 80 100
Overall rating of health plan
Overall ratingof health care
Medicare health plans(elderly)
Commercial health plans (children)
Commercial health plans (adults)
Medicaid health plans (low-incomeadults)
Percent of health plan members surveyed who gave a rating of 8–10 on a 10-point scale
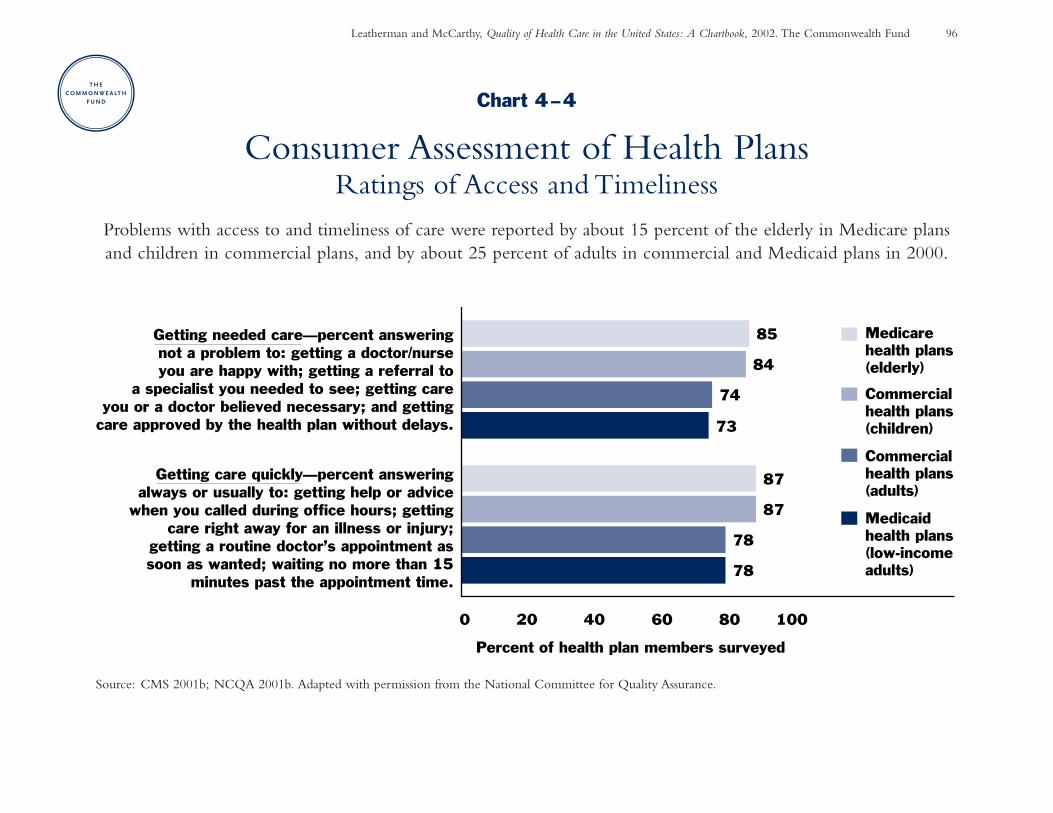
Leatherman and McCarthy, Quality of Health Care in the United States: A Chartbook, 2002. The Commonwealth Fund 96
Chart 4–4
Consumer Assessment of Health PlansRatings of Access and Timeliness
Problems with access to and timeliness of care were reported by about 15 percent of the elderly in Medicare plans and children in commercial plans, and by about 25 percent of adults in commercial and Medicaid plans in 2000.
Source: CMS 2001b; NCQA 2001b. Adapted with permission from the National Committee for Quality Assurance.
0 20 40 60 80 100
Percent of health plan members surveyed
Getting care quickly—percent answeringalways or usually to: getting help or advice
when you called during office hours; gettingcare right away for an illness or injury;
getting a routine doctor’s appointment assoon as wanted; waiting no more than 15
minutes past the appointment time.
Getting needed care—percent answeringnot a problem to: getting a doctor/nurseyou are happy with; getting a referral to
a specialist you needed to see; getting careyou or a doctor believed necessary; and getting
care approved by the health plan without delays.
78
73
78
74
87
84
87
85 Medicare health plans(elderly)
Commercial health plans (children)
Commercial health plans (adults)
Medicaid health plans (low-incomeadults)
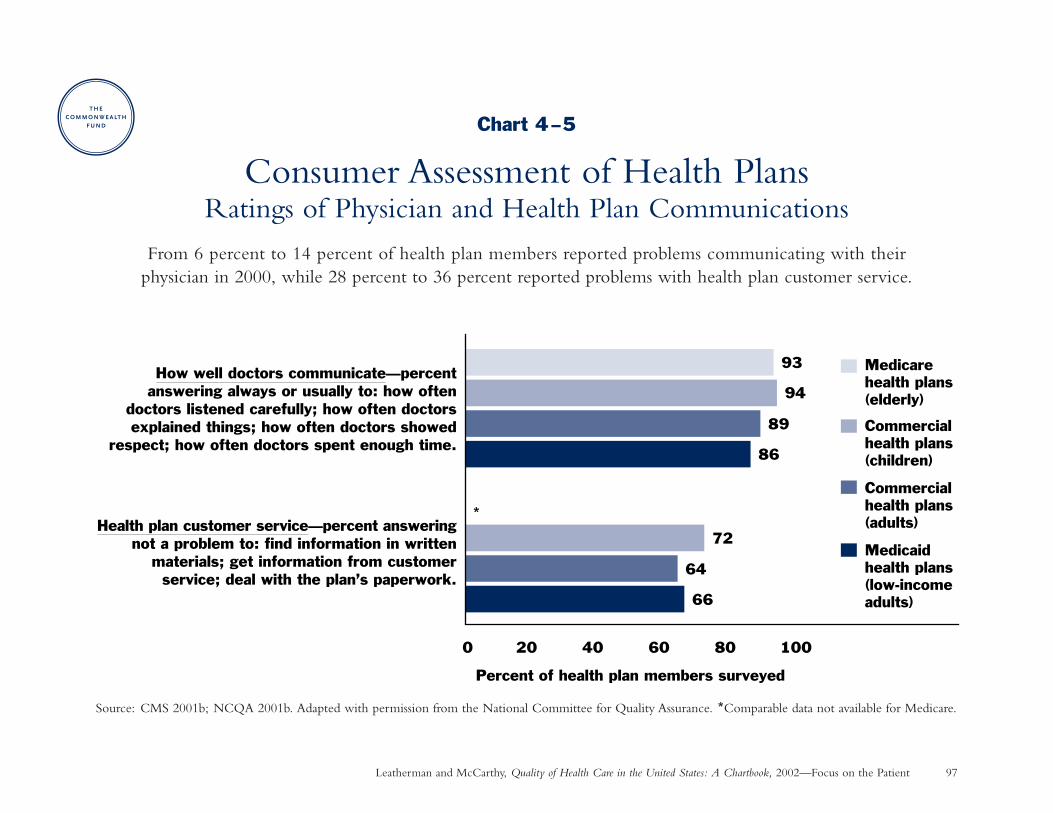
Leatherman and McCarthy, Quality of Health Care in the United States: A Chartbook, 2002—Focus on the Patient 97
Chart 4–5
Consumer Assessment of Health PlansRatings of Physician and Health Plan Communications
From 6 percent to 14 percent of health plan members reported problems communicating with their physician in 2000, while 28 percent to 36 percent reported problems with health plan customer service.
Source: CMS 2001b; NCQA 2001b. Adapted with permission from the National Committee for Quality Assurance. *Comparable data not available for Medicare.
0 20 40 60 80 100
Percent of health plan members surveyed
How well doctors communicate—percentanswering always or usually to: how often
doctors listened carefully; how often doctorsexplained things; how often doctors showed
respect; how often doctors spent enough time.
*Health plan customer service—percent answering
not a problem to: find information in writtenmaterials; get information from customerservice; deal with the plan’s paperwork.
86
89
94
93
72
66
64
Medicare health plans(elderly)
Commercial health plans (children)
Commercial health plans (adults)
Medicaid health plans (low-incomeadults)
Leatherman and McCarthy, Quality of Health Care in the United States: A Chartbook, 2002. The Commonwealth Fund 98
Focus on the Patient
Patient Reports of Problems with Hospital CareWhy is this important? Many hospitals are interested in learning about patients’ experiences in an effort to ensure
humane caregiving. Picker Institute surveys are used in hundreds of hospitals internationally to better understandpatients’ impressions of specific aspects of care (Cleary et al. 1991). Though patients are often unable to judgethe technical quality of care, their experience is important when assessing vital personal aspects of the healthcare encounter.
Findings: Patients at 272 hospitals reported problems on 10 percent to 28 percent of the questions asked aboutseven aspects of care (multiple questions were asked for each aspect of care): (1) continuity and transition of care,e.g., not getting information about medication side effects or danger signals to watch for at home; (2) emotionalsupport, e.g., difficulty discussing anxieties and concerns or lacking confidence in some of the health professionalsresponsible for their care; (3) information and education, e.g., problems communicating with medical staff;(4) coordination of care, e.g., not being told the name of the doctor in charge; (5) respect for patients’ preferences,e.g., failure to involve patients in treatment decisions; (6) involvement of family and friends; and (7) physicalcomfort, e.g., not being helped to the toilet or inadequate pain management. Source: Picker Surveys (Coulterand Cleary 2001). Results may not be representative of all U.S. hospitals.
Implications: Patients perceive problems in many aspects of hospital care that are not detected in overall questionsabout satisfaction, demonstrating the importance of asking specific questions about patient experience. Hospitalsgenerally did well in meeting patients’ expectations for physical comfort, but did not rate as well in providingemotional support or in preparing patients to leave the hospital.
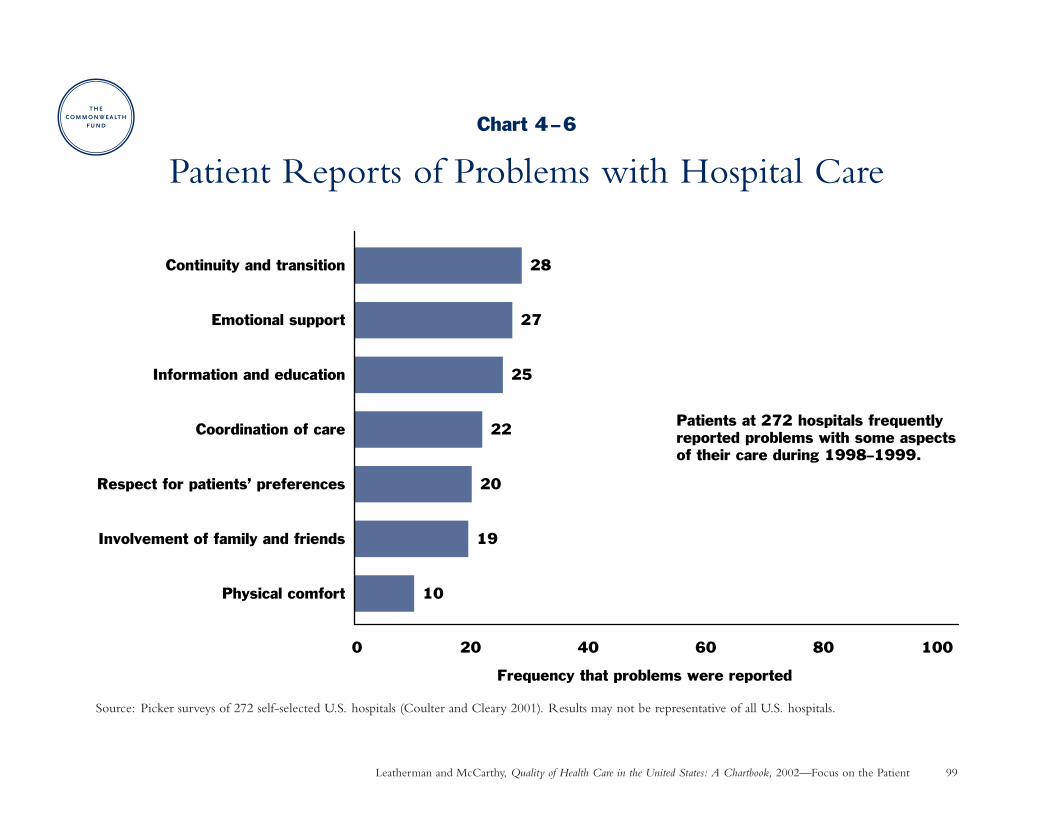
Leatherman and McCarthy, Quality of Health Care in the United States: A Chartbook, 2002—Focus on the Patient 99
Chart 4–6
Patient Reports of Problems with Hospital Care
Source: Picker surveys of 272 self-selected U.S. hospitals (Coulter and Cleary 2001). Results may not be representative of all U.S. hospitals.
10
19
20
22
25
27
28
0 20 40 60 80 100
Physical comfort
Involvement of family and friends
Respect for patients’ preferences
Coordination of care
Information and education
Emotional support
Continuity and transition
Frequency that problems were reported
Patients at 272 hospitals frequently reported problems with some aspects of their care during 1998–1999.
Leatherman and McCarthy, Quality of Health Care in the United States: A Chartbook, 2002. The Commonwealth Fund 100
Focus on the Patient
Time Spent with PhysicianWhy is this important? The amount of time physicians spend with their patients is one measure of the responsiveness
of the health care system to patient needs. A common perception is that recent cost-containment pressures andpaperwork burdens are squeezing out time for patient care.
Findings: The average duration of a physician office visit increased from 1989 to 1999 by nearly one minute basedon calculations of time and visit data reported by physicians to the American Medical Association’s SocioeconomicMonitoring System, and by three minutes based on visit length reported by physicians to the government’sNational Ambulatory Medical Care Survey.
This upward trend cannot be explained by increases in physician supply, the aging of the population, or thecomplexity of care for sicker patients. The trend toward longer physician office visits occurred for both new andestablished patients as well as both routine and complex cases. Sources: Mechanic, McAlpine, and Rosenthal2001; personal communication with David Mechanic 2001.
Implications: In recent surveys, 42 percent of physicians said that they do not spend enough time with patients todeliver quality care (Blendon et al. 2001), while nearly one-quarter of patients said that the time they spent withtheir doctor was too short (Donelan et al. 1999). Yet, physicians are spending more time with patients todaythan ten years ago.
The perception that less time is spent with patients may arise from the need to do more during a patient visit,including provide preventive care and more fully explain a larger number of treatment options as patients askmore questions.
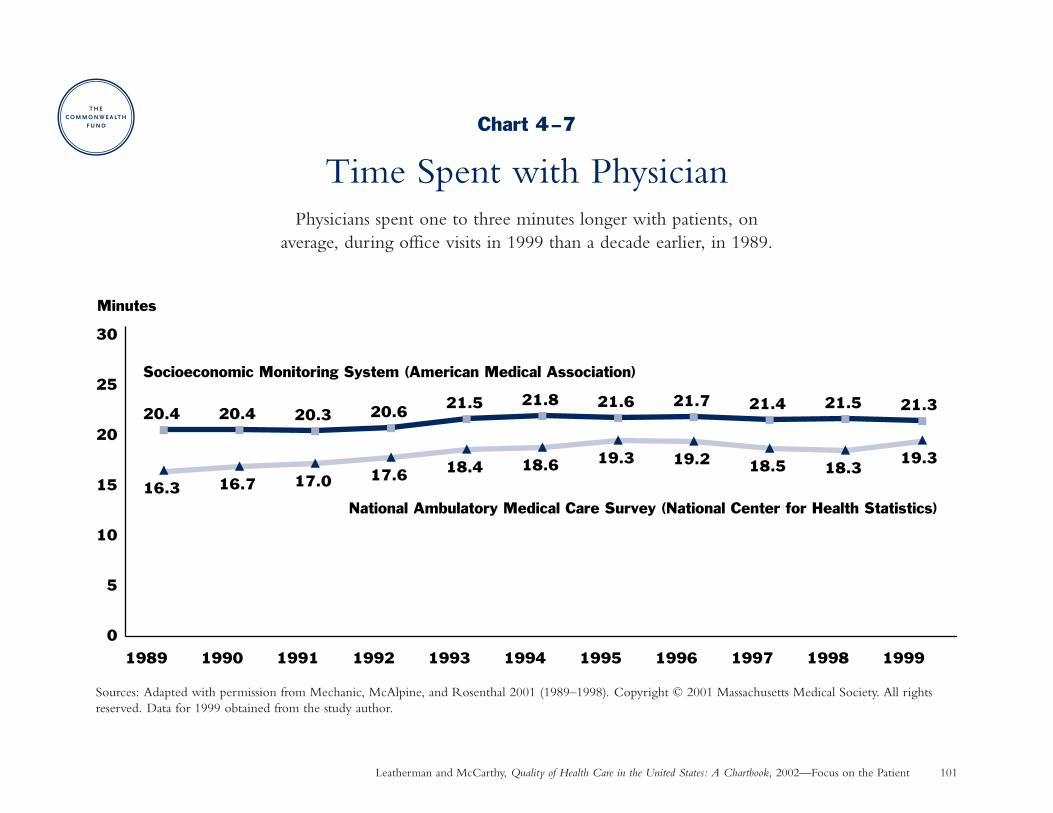
Leatherman and McCarthy, Quality of Health Care in the United States: A Chartbook, 2002—Focus on the Patient 101
Chart 4–7
Time Spent with PhysicianPhysicians spent one to three minutes longer with patients, on
average, during office visits in 1999 than a decade earlier, in 1989.
Sources: Adapted with permission from Mechanic, McAlpine, and Rosenthal 2001 (1989–1998). Copyright © 2001 Massachusetts Medical Society. All rightsreserved. Data for 1999 obtained from the study author.
16.3 16.7 17.0 17.6 18.4 18.6 19.3 19.2 18.5 18.319.3
20.4 20.4 20.3 20.6 21.5 21.6 21.7 21.4 21.5 21.321.8
0
5
10
15
20
25
30
1989 1990 1991 1992 1993 1994 1995 1996 1997 1998 1999
Minutes
Socioeconomic Monitoring System (American Medical Association)
National Ambulatory Medical Care Survey (National Center for Health Statistics)
Leatherman and McCarthy, Quality of Health Care in the United States: A Chartbook, 2002. The Commonwealth Fund 102
Focus on the Patient
Perceptions of Nursing Home CareWhy is this important? About 1.5 million Americans reside in nursing homes at any given time—a population
that is vulnerable and has many medical and psychosocial needs. Yet little is known about their experiences withcare since there is no national standardized survey of nursing home patient experience. To fill this gap, a recentnational opinion poll assessed the perceptions of a subgroup of the general population who had substantial nursinghome experience, either as a nursing home resident or from regularly visiting family or friends in nursing homes.
Findings: Among those with substantial nursing home experience:
• Over one-third were not satisfied with the care that they or friend or family member had received andwould not recommend the nursing home to someone else.
• A sizable proportion reported inadequacies with certain aspects of staffing, living environment, and caregiving.For example, about a quarter reported serious problems such as mistreatment or abuse of residents by nursinghome staff.
Source: National Survey on Nursing Homes (NewsHour with Jim Lehrer/Kaiser Family Foundation/HarvardSchool of Public Health 2001). The data shown represents a subset of the complete survey results.
Implications: Perceptions of nursing home care are mixed, with a fundamental gap in expectations for a largeminority of people with substantial nursing home experience. Feedback such as this can help nursing homeadministrators focus efforts where improvements can be made. The public as well as state and federal governmentsmay benefit from more complete and ongoing data on nursing home patient experience to better judge andregulate the quality of nursing home care.
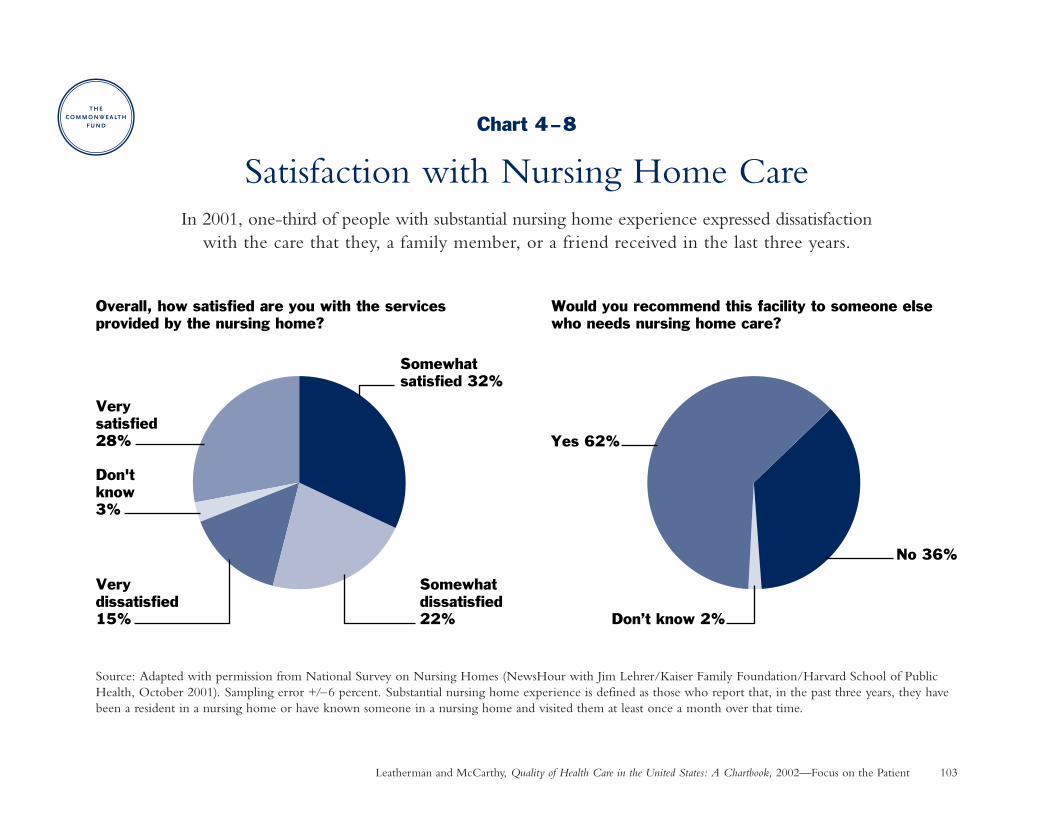
Leatherman and McCarthy, Quality of Health Care in the United States: A Chartbook, 2002—Focus on the Patient 103
Chart 4–8
Satisfaction with Nursing Home CareIn 2001, one-third of people with substantial nursing home experience expressed dissatisfaction
with the care that they, a family member, or a friend received in the last three years.
Source: Adapted with permission from National Survey on Nursing Homes (NewsHour with Jim Lehrer/Kaiser Family Foundation/Harvard School of PublicHealth, October 2001). Sampling error +/–6 percent. Substantial nursing home experience is defined as those who report that, in the past three years, they havebeen a resident in a nursing home or have known someone in a nursing home and visited them at least once a month over that time.
Very satisfied 28%
Don't know 3%
Very dissatisfied 15%
Somewhatdissatisfied 22%
Somewhatsatisfied 32%
Don’t know 2%
No 36%
Yes 62%
Would you recommend this facility to someone else who needs nursing home care?
Overall, how satisfied are you with the services provided by the nursing home?
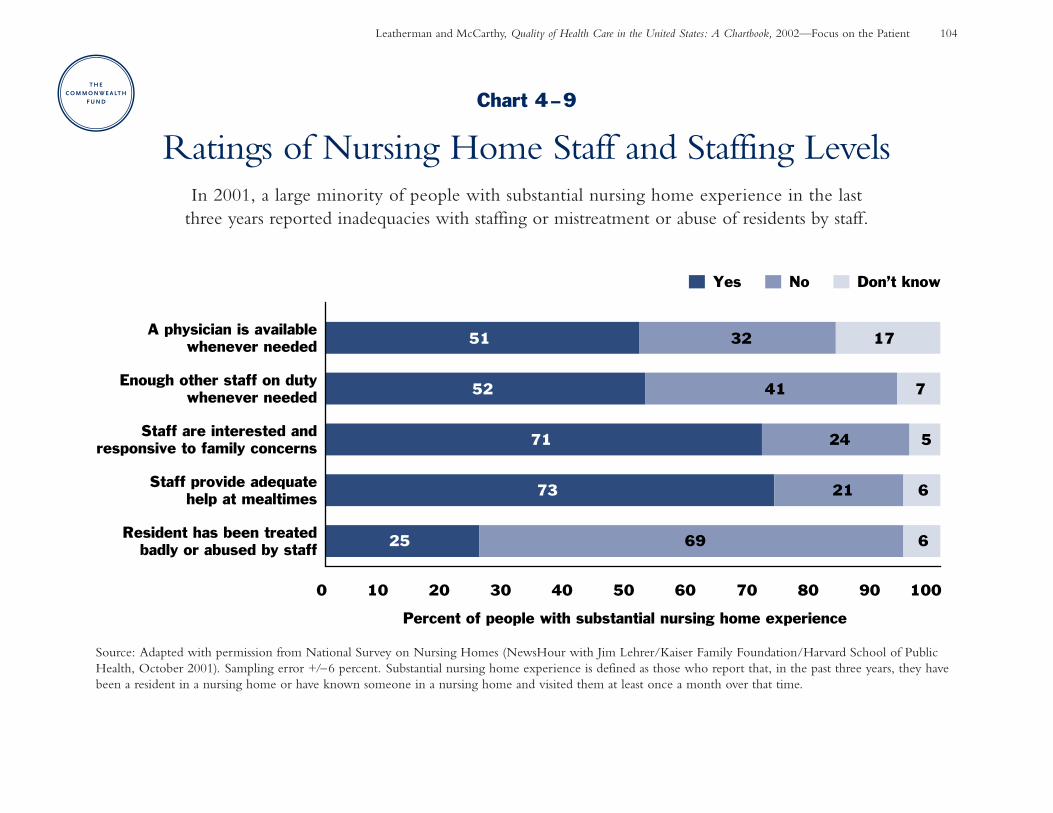
Leatherman and McCarthy, Quality of Health Care in the United States: A Chartbook, 2002—Focus on the Patient 104
Chart 4–9
Ratings of Nursing Home Staff and Staffing LevelsIn 2001, a large minority of people with substantial nursing home experience in the last
three years reported inadequacies with staffing or mistreatment or abuse of residents by staff.
Source: Adapted with permission from National Survey on Nursing Homes (NewsHour with Jim Lehrer/Kaiser Family Foundation/Harvard School of PublicHealth, October 2001). Sampling error +/–6 percent. Substantial nursing home experience is defined as those who report that, in the past three years, they havebeen a resident in a nursing home or have known someone in a nursing home and visited them at least once a month over that time.
25
73
71
52
51
69
21
24
41
32
6
6
5
7
17
0 10 20 30 40 50 60 70 80 90 100
Resident has been treatedbadly or abused by staff
Staff provide adequatehelp at mealtimes
Staff are interested andresponsive to family concerns
Enough other staff on dutywhenever needed
A physician is availablewhenever needed
Percent of people with substantial nursing home experience
Yes No Don’t know
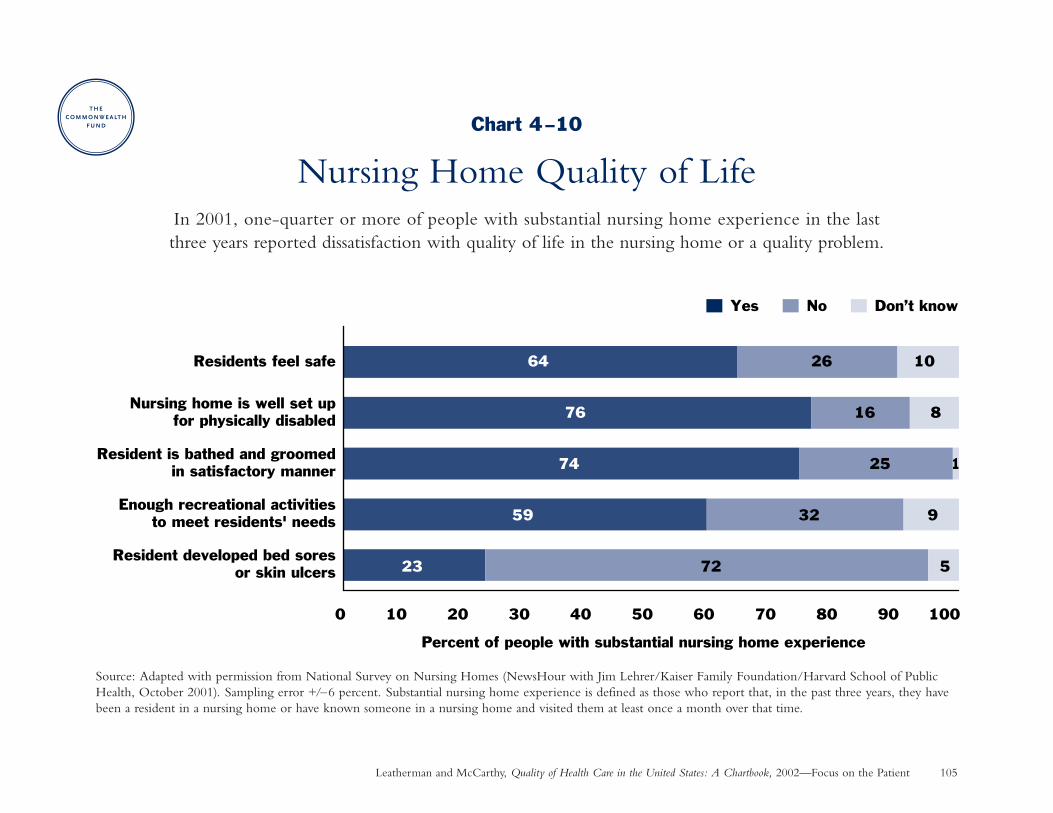
Leatherman and McCarthy, Quality of Health Care in the United States: A Chartbook, 2002—Focus on the Patient 105
Chart 4–10
Nursing Home Quality of LifeIn 2001, one-quarter or more of people with substantial nursing home experience in the last three years reported dissatisfaction with quality of life in the nursing home or a quality problem.
Source: Adapted with permission from National Survey on Nursing Homes (NewsHour with Jim Lehrer/Kaiser Family Foundation/Harvard School of PublicHealth, October 2001). Sampling error +/–6 percent. Substantial nursing home experience is defined as those who report that, in the past three years, they havebeen a resident in a nursing home or have known someone in a nursing home and visited them at least once a month over that time.
23
59
74
76
64
72
32
25
16
26
5
9
8
10
0 10 20 30 40 50 60 70 80 90 100
Resident developed bed soresor skin ulcers
Enough recreational activitiesto meet residents' needs
Resident is bathed and groomedin satisfactory manner
Nursing home is well set upfor physically disabled
Residents feel safe
Percent of people with substantial nursing home experience
Yes No Don’t know
1

Chapter 5
Disparities in Health Care
. . . all individuals rightly expect to be treated fairly by social institutions, including health careinstitutions.The availability of care and quality of services should be based on individuals’particular needs and not on personal characteristics unrelated to the patient’s condition or tothe reason for seeking care. In particular, the quality of care should not differ because of suchcharacteristics as gender, race, age, ethnicity, income, education, disability, sexual orientation,or location of residence.
—Institute of Medicine, 2001a
Leatherman and McCarthy, Quality of Health Care in the United States: A Chartbook, 2002. The Commonwealth Fund 108
Chapter 5
Disparities in Health Care: IntroductionA substantial body of research has demonstrated that minor-ity Americans are worse off than white Americans on a widevariety of indicators of health care access and quality thatdetermine health outcomes (Collins, Hall, and Neuhaus1999). Research has also found that women sometimes receiveless treatment (such as cardiac procedures) than men (Ganet al. 2000).
These findings have provoked debate about the degree towhich disparities reflect overt bias in the health care systemor other factors, such as distribution of resources or differ-ences in patients’ clinical characteristics. Understanding thesefactors is important to identifying root causes that are amenableto change by the health care system or that require changesin wider social policies impacting health care. For example:
• Socioeconomic factors such as income and educationgenerally are stronger determinants of primary health care use than race or ethnicity alone (Fiscella et al. 2000).Interventions can be targeted to address needs related tothese factors, such as transportation to see the doctor.
• Both physician decision-making and patient preferencesmay account for some of the racial difference in access tocardiac procedures (Sedlis et al. 1997), though differences
in preferences accounted for little of the disparity in accessto kidney transplants (Ayanian et al. 1999). Patient pref-erences may change with better patient communicationand education.
• Insurance coverage and ability to pay are necessary butnot sufficient conditions for equal treatment, as disparitiesremain among those who are equally insured.
Disparities in health care can be reduced and even eliminatedwith concerted effort, as seen in successful efforts to providemammography and hypertension services equally to all(Fiscella et al. 2000). More examples of successful approachesare needed to guide policy.
The increasing diversity of the United States population—with projections that minority groups will outnumber whiteswithin 50 years, as they already do in California—makes theissue of disparities even more urgent (Smith and Edmonston1997; Johnson 1999). Most research on racial disparities hasfocused on African-Americans, which explains its predomi-nance among these charts. Additional research on otherminority groups is needed to understand their uniqueexperiences.
Leatherman and McCarthy, Quality of Health Care in the United States: A Chartbook, 2002. The Commonwealth Fund 109
Disparities in Health Care: Summary of Charts and FindingsChart 5–1: Racial/Ethnic Disparity in PreventiveCare—Hispanics and African-Americans are less likely thanwhites to get smoking cessation counseling and flu shotsduring 1998–1999. Hispanic women were slightly less like-ly to get a mammogram than white and African-Americanwomen.
Chart 5–2: Racial Disparity in Lung Cancer Surgeryand Survival—Among Medicare patients diagnosed withan early-stage, treatable form of lung cancer in 10 cancerregistry areas during 1985–1993, blacks had worse survivaloutcomes than whites, mainly due to a lower rate of surgery.
Chart 5–3: Racial Disparity in Use of Invasive HeartProcedures—From 1984 to 1992, black patients with coro-nary artery disease were less likely than white patients toreceive procedures that restore blood flow to the heart muscle, regardless of disease severity, at one teaching hospital.
Chart 5–4: Gender Disparity in Heart AttackTreatment—Among Medicare beneficiaries patients hospi-talized for heart attack during 1994–1995 who were idealcandidates for drug therapies that are known to be effectivein improving survival, women were somewhat less likely
than men to receive most drug therapies and were less likely to receive time-sensitive therapies on a timely basis.
Chart 5–5: Racial Disparity in Access to KidneyTransplants—White patients were more likely than blackpatients to be referred for and receive a kidney transplant,regardless of clinical appropriateness or patient preferences,among kidney dialysis patients in four regions during1996–1999.
Chart 5–6: Racial Disparity in Cancer PainManagement—Many cancer patients did not receive adequate pain management in two studies during the lastdecade. Minorities were more likely than nonminorities to have inadequate pain management.
Chart 5–7: Effect of Race/Ethnicity and Language on Parents’Assessments of Pediatric Care in MedicaidHealth Plans—Minority parents in six states rated certainaspects of their children’s health care lower than white parentsduring 1997–1998. Language barriers were a major factorin racial/ethnic disparities for Asian and Hispanic groups.
Leatherman and McCarthy, Quality of Health Care in the United States: A Chartbook, 2002. The Commonwealth Fund 110
Disparities: Staying Healthy
Racial/Ethnic Disparity in Preventive CareWhy is this important? Long-standing disparities in rates of preventive care for minorities have narrowed for some
services, such as screening mammography, but not for others (Breen et al. 2001). This chart provides a snapshotof national disparities in three preventive measures at a fairly recent point in time.
Findings: Blacks and Hispanics were less likely than whites to receive some preventive care services during 1998–1999.
• Mammography rates: African-American women have achieved parity with white women, but Hispanic womenstill lag behind both groups slightly, by 3 percentage points.
• Smoking cessation counseling: African-Americans lag behind whites by 4 percentage points, while Hispanicstrail whites by 13 percentage points.
• Flu shots for older adults: compared to whites, the vaccination rate for African-Americans was 18 percentagepoints lower, while the rate for Hispanics was 13 percentage points lower.
Source: Community Tracking Study Household Survey (Hargraves 2001).
Implications: Disparities in rates of influenza vaccination are most striking, since Medicare covers this preventiveservice equally for all elderly beneficiaries—indicating that insurance coverage alone is not enough to ensureequality in access. While language barriers appear to be the major cause of disparity among Spanish-speakingHispanics, a better understanding is needed of the causes of racial disparity in influenza vaccination (Fiscella etal. 2002). Research on mammography suggests that helping people overcome access barriers—in combinationwith patient or physician reminders—is the most effective way to increase preventive care among groups forwhich it has been historically low (Legler et al. 2002).
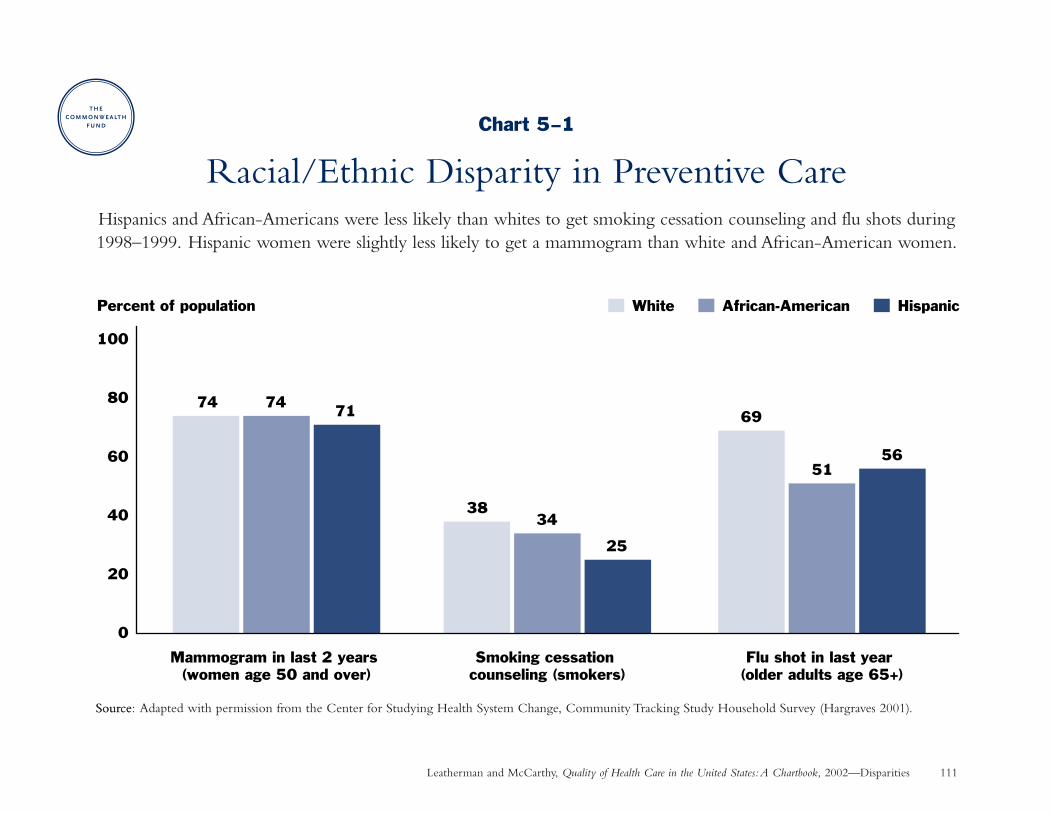
Leatherman and McCarthy, Quality of Health Care in the United States:A Chartbook, 2002—Disparities 111
Source
0
20
40
60
80
100
74 74 71
Mammogram in last 2 years (women age 50 and over)
3834
25
Smoking cessation counseling (smokers)
69
5156
Flu shot in last year (older adults age 65+)
White African-American HispanicPercent of population
Chart 5–1
Racial/Ethnic Disparity in Preventive CareHispanics and African-Americans were less likely than whites to get smoking cessation counseling and flu shots during1998–1999. Hispanic women were slightly less likely to get a mammogram than white and African-American women.
Source: Adapted with permission from the Center for Studying Health System Change, Community Tracking Study Household Survey (Hargraves 2001).
Leatherman and McCarthy, Quality of Health Care in the United States: A Chartbook, 2002. The Commonwealth Fund 112
Disparities: Living with Chronic Illness
Racial Disparity in Lung Cancer Surgery and SurvivalWhy is this important? Lung cancer is the leading cause of cancer deaths, taking 150,000 lives each year. About
one-third of those with the most common form of lung cancer receive their diagnosis at an early, treatable stageof disease. Surgery is the optimal treatment strategy for such patients, resulting in a 40 percent chance of survivingfive years or more. Those with more advanced cancers or who do not undergo surgery typically survive less thanone year (Bach et al. 1999).
Findings: Among elderly Medicare patients diagnosed with an early stage, treatable form of lung cancer, the rate of surgery was about 13 percentage points lower for blacks than whites.
• Black patients overall experienced worse survival outcomes, about 8 percentage points lower than whites.Most of this difference was due to a lower rate of surgery among blacks.
• Black patients and white patients who underwent surgery had similar survival outcomes. Survival outcomeswere similarly low for both blacks and whites who did not undergo surgery.
Source: Linked Medicare–SEER tumor registry data for 10 areas between 1985–1993 (Bach et al. 1999).
Implications: The lower rate of surgery among older black lung cancer patients is linked to more deaths. To illustratethe effects of this difference, in a group of 1,000 white patients and 1,000 black patients, 77 fewer blacks wouldsurvive after five years, and 44 of these 77 deaths would be due to the lower rate of surgery among blacks (Bachet al. 1999). This disparity is striking considering that an effective treatment strategy for early-stage lung diseaseis clearly known and all these patients had Medicare coverage. Efforts should be directed to discovering the reasonsfor lower rates of surgery among blacks and taking corrective action.
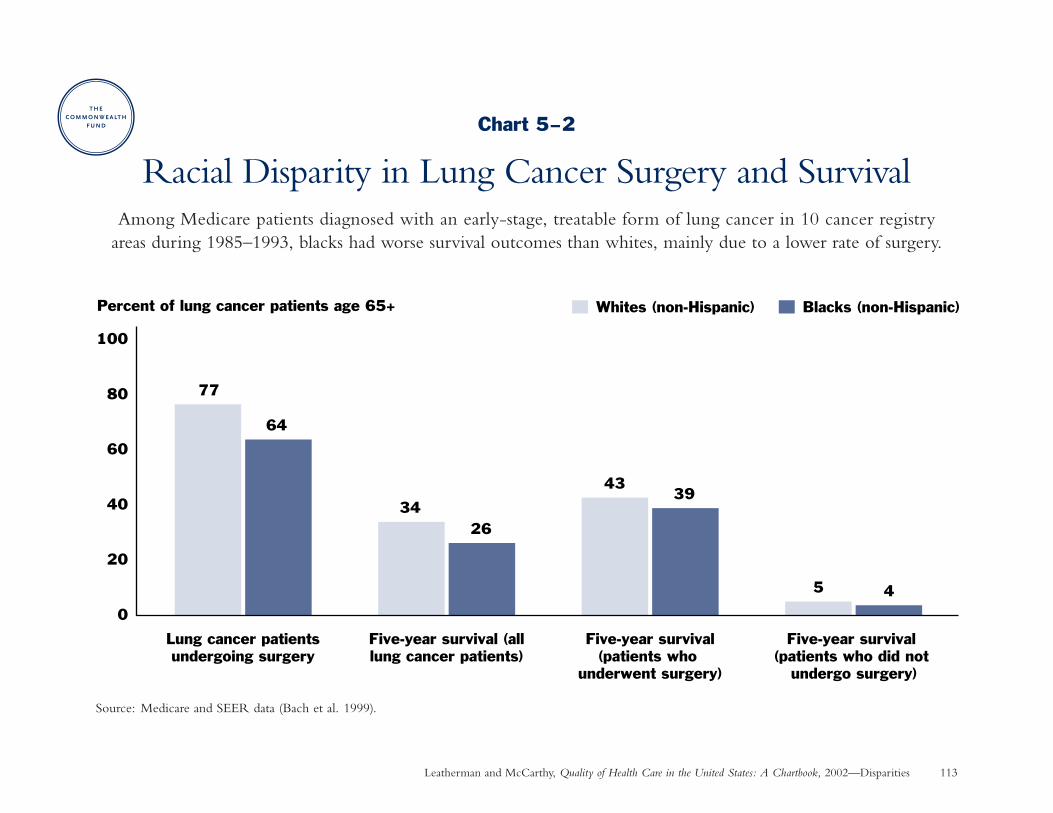
Leatherman and McCarthy, Quality of Health Care in the United States: A Chartbook, 2002—Disparities 113
Chart 5–2
Racial Disparity in Lung Cancer Surgery and SurvivalAmong Medicare patients diagnosed with an early-stage, treatable form of lung cancer in 10 cancer registry
areas during 1985–1993, blacks had worse survival outcomes than whites, mainly due to a lower rate of surgery.
Source: Medicare and SEER data (Bach et al. 1999).
0
20
40
60
80
100
77
64
Lung cancer patientsundergoing surgery
3426
Five-year survival (alllung cancer patients)
4339
Five-year survival(patients who
underwent surgery)
5 4
Five-year survival (patients who did not
undergo surgery)
Whites (non-Hispanic) Blacks (non-Hispanic)Percent of lung cancer patients age 65+
Leatherman and McCarthy, Quality of Health Care in the United States: A Chartbook, 2002. The Commonwealth Fund 114
Disparities: Living with Chronic Illness
Racial Disparity in Use of Invasive Heart ProceduresWhy is this important? Revascularization procedures—including angioplasty and heart bypass surgery—represent
sophisticated medical technologies that are done to restore blood flow when the arteries that supply blood to theheart muscle have become clogged. Racial differences in the use of these invasive procedures have been found inmany studies, but often without concluding whether the procedures are overused in whites or underused in blacks.This study represents one of the strongest done to date to answer that question.
Findings: In this study, all patients had undergone diagnostic testing at a single teaching hospital to determine theseverity of their heart disease and the need for revascularization. Subsequently, blacks were only marginally lesslikely than whites to undergo angioplasty, but blacks were 32 percent less likely to undergo bypass surgery and35 percent less likely to get either type of revascularization procedure, after taking into account the severity ofdisease and other clinical and access factors. Furthermore, the racial disparity in bypass surgery was greatest amongthose with more severe disease, who would have benefited most from surgery. As a result, blacks were 18 percentmore likely to die than whites over five years of follow-up. Differences in patients’ insurance coverage status werenot found to determine differences in treatment. Source: Peterson et al. 1997.
Implications: Revascularization procedures were underused among black patients represented in this study. In areview of similar clinical studies conducted at other institutions and in other states, 17 of 25 found that blacks hada lower likelihood of receiving some procedures than whites. In particular, blacks were 13 percent to 80 percentless likely to receive angioplasty, and 32 percent to 78 percent less likely to receive heart bypass surgery (Kressinand Petersen 2001). These disparities held even after controlling for differences in patient characteristics and accessto specialty care. Actions must be directed to understanding and ameliorating the causes of these disparities.
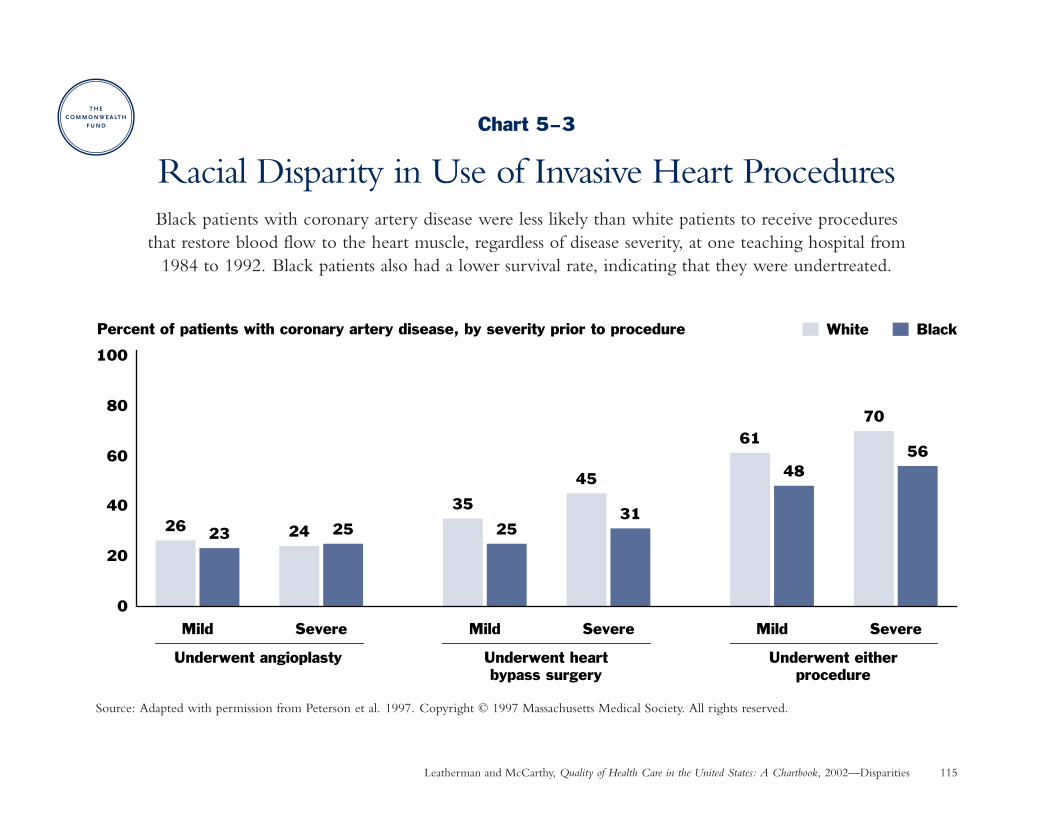
Leatherman and McCarthy, Quality of Health Care in the United States: A Chartbook, 2002—Disparities 115
Chart 5–3
Racial Disparity in Use of Invasive Heart ProceduresBlack patients with coronary artery disease were less likely than white patients to receive procedures
that restore blood flow to the heart muscle, regardless of disease severity, at one teaching hospital from 1984 to 1992. Black patients also had a lower survival rate, indicating that they were undertreated.
Source: Adapted with permission from Peterson et al. 1997. Copyright © 1997 Massachusetts Medical Society. All rights reserved.
0
20
40
60
80
100
26 23
Mild
24 25
Severe
35
25
Mild
45
31
Severe
61
48
Mild
70
56
Severe
White BlackPercent of patients with coronary artery disease, by severity prior to procedure
Underwent angioplasty Underwent heartbypass surgery
Underwent eitherprocedure
Leatherman and McCarthy, Quality of Health Care in the United States: A Chartbook, 2002. The Commonwealth Fund 116
Disparities: Living with Chronic Illness
Gender Disparity in Heart Attack TreatmentWhy is this important? Several studies have reported that women receive less aggressive hospital-based treatment
for heart attack as compared to men. This finding is disturbing, since research shows that such treatment is justas beneficial for women as men (Gan et al. 2000).
Findings: Among Medicare patients hospitalized for heart attack who were ideally suited to receive recommendedmedications, women as compared to men were:
• three percent less likely to receive thrombolytic therapy and, among those who did receive it, 7 percent lesslikely to receive it within one hour after arriving at the hospital (thrombolytic therapy dissolves clots thatblock blood supply to the heart and is most beneficial when given quickly after a heart attack),
• four percent less likely to get aspirin within 24 hours of hospital arrival, and 5 percent less likely to receiveaspirin at hospital discharge (aspirin helps prevent dangerous blood clots from forming),
• equally likely to receive a beta-blocker prescription at hospital discharge (beta-blockers help the heart workbetter by decreasing its need for blood and oxygen; data not shown), and
• five percent more likely to receive an ACE inhibitor prescription at hospital discharge (ACE inhibitors lower blood pressure and increase the supply of blood and oxygen to the heart).
Women and men had similar 30-day adjusted death rates; long-term outcomes were not measured. Source:Medicare Cooperative Cardiovascular Project: 1994–1995 (Gan et al. 2000).
Implications: Women would benefit from more aggressive heart attack treatment where there is clear evidencethat certain effective drug therapies are being underused or not provided in a timely manner.
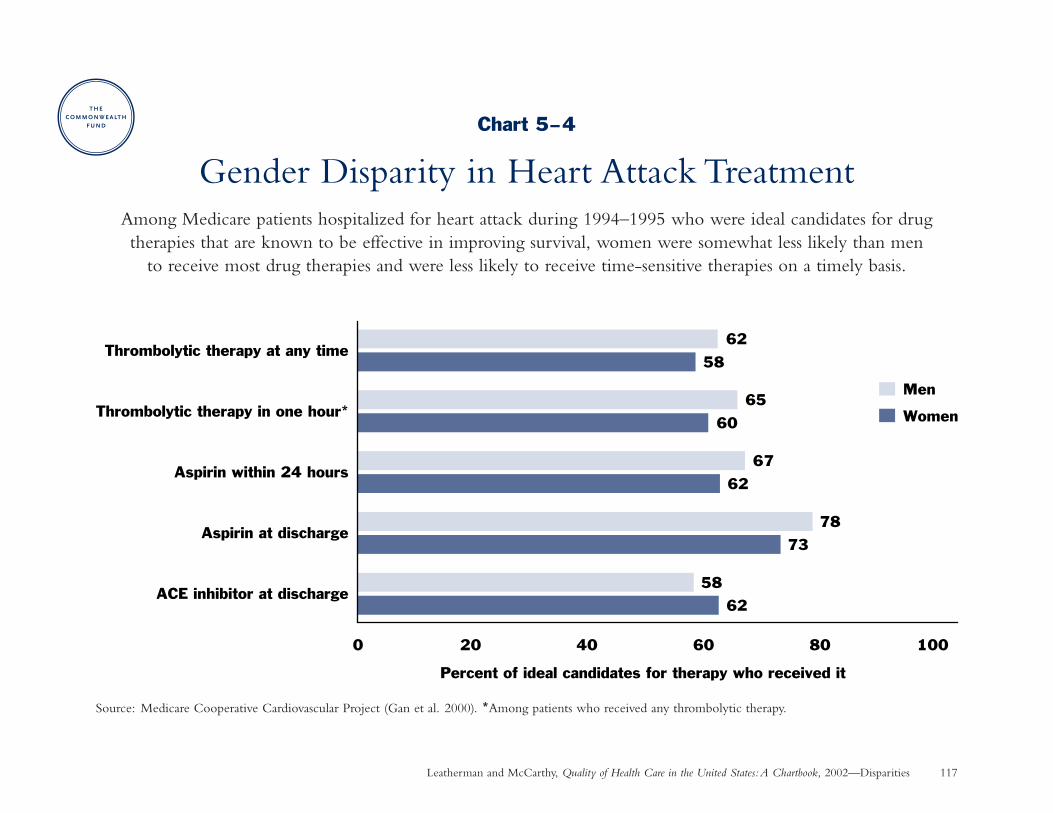
Leatherman and McCarthy, Quality of Health Care in the United States:A Chartbook, 2002—Disparities 117
Chart 5–4
Gender Disparity in Heart Attack TreatmentAmong Medicare patients hospitalized for heart attack during 1994–1995 who were ideal candidates for drug therapies that are known to be effective in improving survival, women were somewhat less likely than men
to receive most drug therapies and were less likely to receive time-sensitive therapies on a timely basis.
Source: Medicare Cooperative Cardiovascular Project (Gan et al. 2000). *Among patients who received any thrombolytic therapy.
62
58
73
78
62
67
60
65
58
62
0 20 40 60 80 100
ACE inhibitor at discharge
Aspirin at discharge
Aspirin within 24 hours
Thrombolytic therapy in one hour*
Thrombolytic therapy at any time
Percent of ideal candidates for therapy who received it
Men
Women
Leatherman and McCarthy, Quality of Health Care in the United States: A Chartbook, 2002. The Commonwealth Fund 118
Disparities: Living with Chronic Illness
Racial Disparity in Access to Kidney TransplantsWhy is this important? More than 88,000 Americans began treatment for kidney failure (end-stage renal disease or
ESRD) and 13,483 received a kidney transplant in 1999 (USRDS 2001). Patients who receive a kidney transplanthave a longer life expectancy, better quality of life, and lower costs than those who remain on lifelong kidneydialysis (Ayanian et al. 1999).
Findings: Almost all ESRD patients have Medicare coverage, which should minimize disparity in financial accessto care. Yet among ESRD patients age 18 to 54 who started kidney dialysis:
• Blacks were less likely than whites to be referred for evaluation and to receive a transplant among those patientswho were clinically appropriate candidates. In contrast, among patients for whom transplantation was inappropriate,whites were more likely than blacks to be referred for evaluation and to receive a transplant.
• Blacks were somewhat less likely to desire a transplant, but differences in patient preferences accounted forvery little of the overall disparity. Even among those who wanted a transplant, blacks were still less likely than whites to be placed on a waiting list or get a transplant.
Source: Medical records and patient surveys for ESRD patients in four regions who started dialysis during1996–1997 (Epstein et al. 2000; Ayanian et al. 1999).
Implications: Kidney transplants were overused when inappropriate mainly among white patients, a troublingfinding considering the scarcity of human organs for transplantation. Kidney transplants were underused relativelymore often among black patients who would benefit from—and who desired—transplantation. Some of the difference in transplant rates was due to immunologic matching criteria at the time of the study, which havesince been relaxed allowing more blacks to obtain transplants (Epstein et al. 2000).
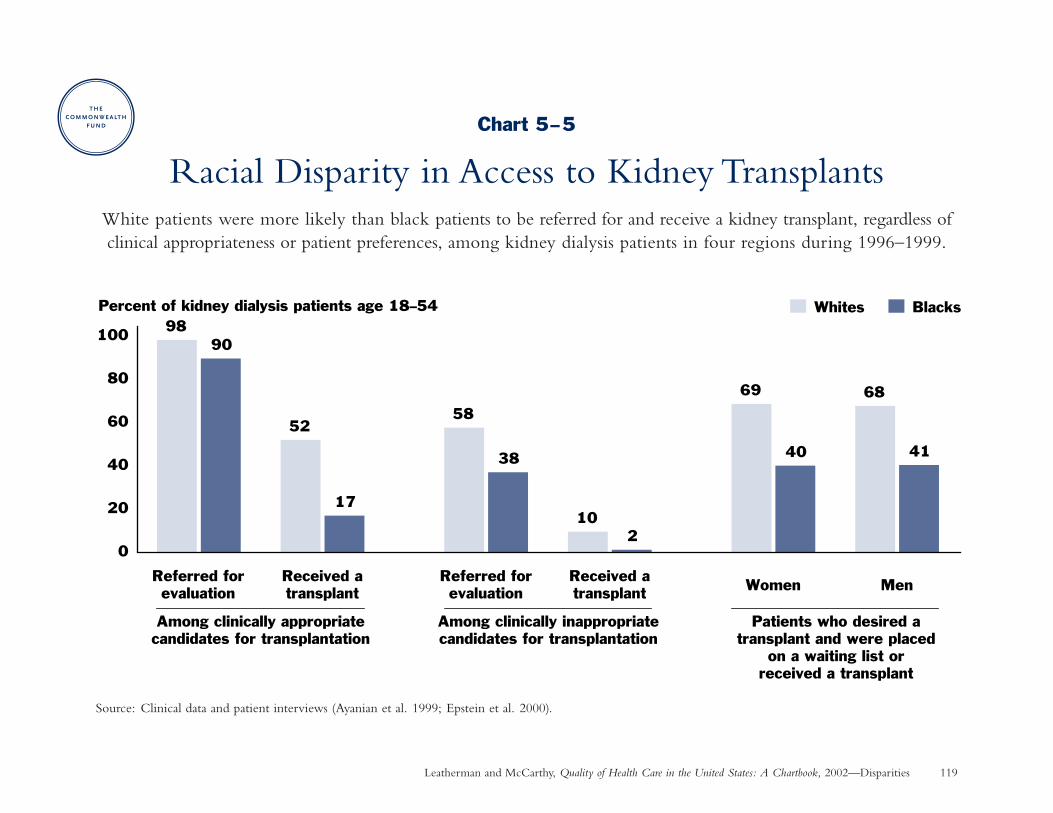
Leatherman and McCarthy, Quality of Health Care in the United States: A Chartbook, 2002—Disparities 119
Chart 5–5
Racial Disparity in Access to Kidney TransplantsWhite patients were more likely than black patients to be referred for and receive a kidney transplant, regardless ofclinical appropriateness or patient preferences, among kidney dialysis patients in four regions during 1996–1999.
Source: Clinical data and patient interviews (Ayanian et al. 1999; Epstein et al. 2000).
9890
52
17
69 68
41
102
38
58
0
20
40
60
80
100
Referred forevaluation
Received atransplant
Referred forevaluation
Received atransplant Women Men
40
Whites BlacksPercent of kidney dialysis patients age 18–54
Among clinically appropriatecandidates for transplantation
Among clinically inappropriatecandidates for transplantation
Patients who desired atransplant and were placed
on a waiting list orreceived a transplant
Leatherman and McCarthy, Quality of Health Care in the United States: A Chartbook, 2002. The Commonwealth Fund 120
Disparities: Living with Chronic Illness
Racial Disparity in Cancer Pain ManagementWhy is this important? Pain is the most persistent and troubling symptom of cancer, often appearing long
before cancer reaches the terminal phase. Cancer-related pain can be severe enough to restrict the individual’sdaily functioning and quality-of-life, even when treated appropriately (Cleeland et al. 1994).
Findings: Many physicians are very conservative in their approach to pain management, with the result that cancer pain is often inadequately managed (Cleeland et al. 1994).
• Among elderly nursing home residents who had cancer and reported being in daily pain, 34 percent ofAfrican-Americans and 25 percent of white residents did not receive any pain medication. Source: Nursinghome resident assessments in five states for 1992–1995 (Bernabei et al. 1998).
• Among cancer patients visiting 54 outpatient clinics, 59 percent of minority patients and 38 percent of whitepatients had inadequate pain management based on an assessment of their pain severity and the medicationprescribed to treat it (if any). Source: Eastern Cooperative Oncology Group study during 1990–1991 (Cleelandet al. 1994).
Implications: The overall level of inadequate pain management among cancer patients is troubling, while thegreater inadequacy among minorities is even more disturbing. Action is needed to address this indicator of poorquality care. Achieving more appropriate pain management will require improving knowledge and acceptance of aggressive pain management guidelines among physicians who treat the elderly as well as overcoming barrierssuch as inadequate nursing home staffing (Bernabei et al. 1998).
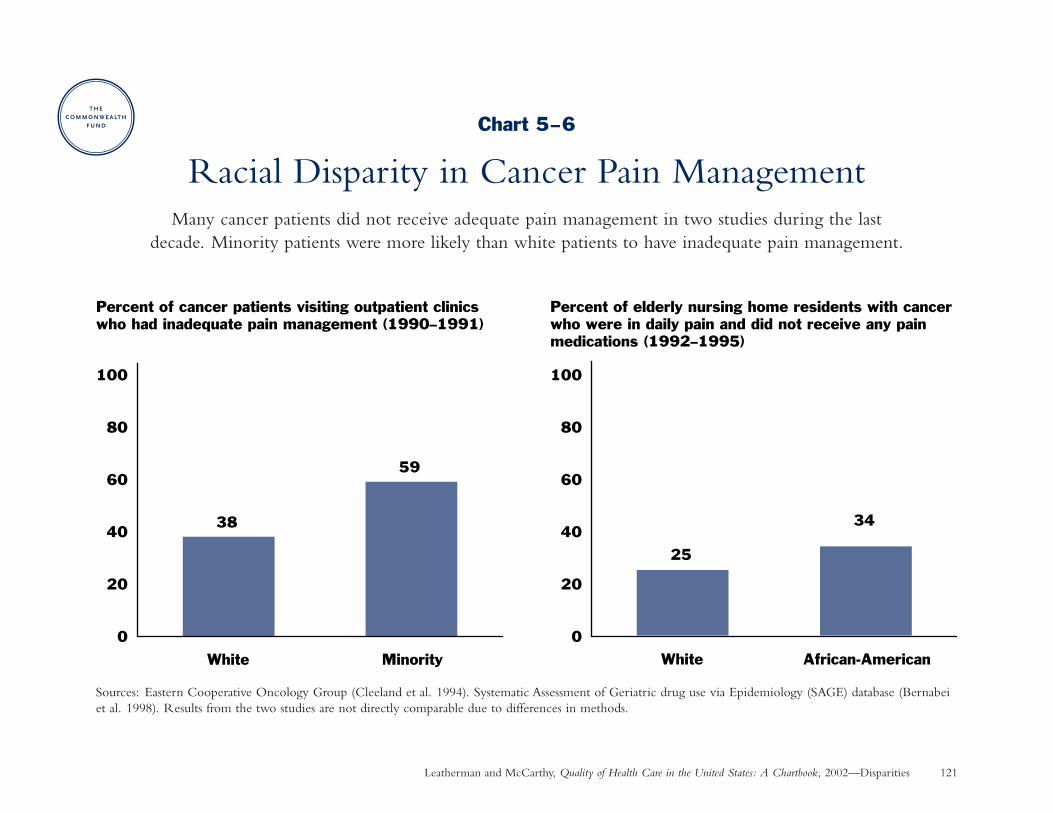
Leatherman and McCarthy, Quality of Health Care in the United States: A Chartbook, 2002—Disparities 121
Chart 5–6
Racial Disparity in Cancer Pain ManagementMany cancer patients did not receive adequate pain management in two studies during the last
decade. Minority patients were more likely than white patients to have inadequate pain management.
Sources: Eastern Cooperative Oncology Group (Cleeland et al. 1994). Systematic Assessment of Geriatric drug use via Epidemiology (SAGE) database (Bernabeiet al. 1998). Results from the two studies are not directly comparable due to differences in methods.
25
34
White African-American
38
59
0
20
40
60
80
100
0
20
40
60
80
100
White Minority
Percent of cancer patients visiting outpatient clinics who had inadequate pain management (1990–1991)
Percent of elderly nursing home residents with cancer who were in daily pain and did not receive any pain medications (1992–1995)
Leatherman and McCarthy, Quality of Health Care in the United States: A Chartbook, 2002. The Commonwealth Fund 122
Disparities: Patient Experience
Effect of Race/Ethnicity and Language on Parents’Assessments of Pediatric Care in Medicaid Health Plans
Why is this important? Racial and ethnic minorities have unique needs and expectations that may affect theirexperience with and ratings of health care. People over the age of five who speak a language other than Englishat home now number 44 million or 16 percent of the U.S. population (KFF 2001). People who are not proficientor have limited proficiency in English are less likely to receive information about their therapy, understand medicationinstructions, receive preventive services, seek medical care, and keep follow-up appointments after an encounterinvolving another language (KFF 2001).
Findings: Minority parents generally rated certain aspects of their children’s health care lower than white parents.Among Asian and Hispanic parents, those who did not speak English as their primary language gave significantlyworse ratings than English speakers; there was no statistically significant difference in ratings between whitesand English-speaking Hispanics and Asians. Source: Consumer Assessment of Health Plans surveys for Medicaidbeneficiaries in six states during 1997–1998 (Weech-Maldonado et al. 2001). See Charts 4–4 and 4–5 for thespecific aspects of care measured by these domains.
Implications: Racial and ethnic minorities face disparities in their experience of health care, even when they arecovered equally by the same type of insurance. Language barriers are a major cause of disparity in health care forHispanics and Asians who are not fluent in English (Flores et al. 1998). Health plans and health care providersmust give increased attention to the unique communication needs of racial and ethnic minorities. Policymakersshould consider the need to increase the availability of competent interpreter services and bilingual health careproviders to improve health care delivery for minorities.
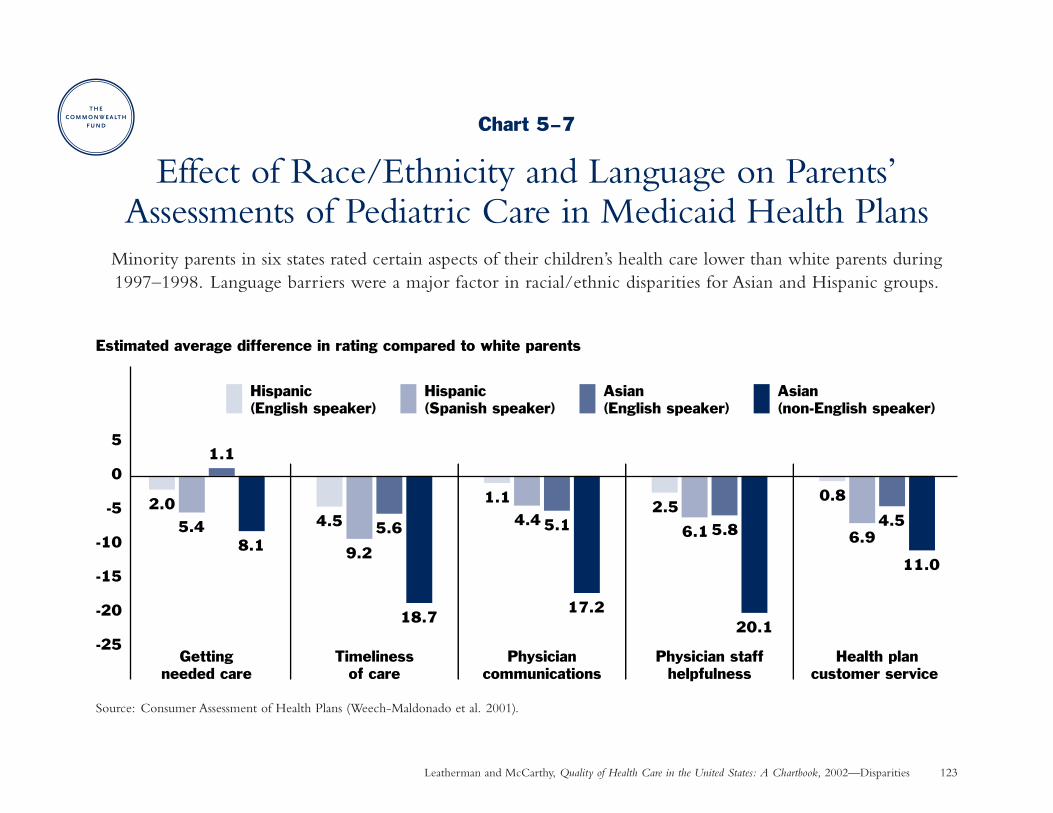
Leatherman and McCarthy, Quality of Health Care in the United States: A Chartbook, 2002—Disparities 123
Chart 5–7
Effect of Race/Ethnicity and Language on Parents’Assessments of Pediatric Care in Medicaid Health Plans
Minority parents in six states rated certain aspects of their children’s health care lower than white parents during1997–1998. Language barriers were a major factor in racial/ethnic disparities for Asian and Hispanic groups.
Source: Consumer Assessment of Health Plans (Weech-Maldonado et al. 2001).
2.04.5
1.12.5
0.8
5.4 5.6 5.1 5.84.5
6.96.14.4
9.211.0
20.117.2
18.7
8.1
-25
-20
-15
-10
-5
0
5
Hispanic (English speaker)
Hispanic (Spanish speaker)
Asian (English speaker)
Asian (non-English speaker)
Gettingneeded care
Timelinessof care
Physiciancommunications
Physician staffhelpfulness
Health plancustomer service
Estimated average difference in rating compared to white parents
1.1

Chapter 6
Capacity to Improve
Our current methods of organizing and delivering care are unable to meet the expectations ofpatients and their families because the science and technologies involved in health care . . . haveadvanced more rapidly than our ability to deliver them safely, effectively, and efficiently. . . .Without substantial changes in the ways health care is delivered, the problems resulting fromthe growing complexity of health care science and technology are unlikely to abate; in fact, theywill increase.
—Institute of Medicine 2001a
Leatherman and McCarthy, Quality of Health Care in the United States: A Chartbook, 2002. The Commonwealth Fund 126
Chapter 6
Capacity to Improve: IntroductionThe purpose of the health care system is “to continuallyreduce the burden of illness, injury, and disability, and toimprove the health and functioning of the people of theUnited States” (IOM 2001a). The nation’s effort to achievethis goal through increased funding for biomedical researchand development has achieved stunning advances in knowl-edge and technologies to prolong and enhance the qualityof life.
Yet health care delivery has not kept pace with these advancesin science and technology or with patient expectations, asthe preceding chapters illustrate. These gaps represent acompelling need for quality improvement. For example,widespread adoption of methods to remind physicians whenpreventive care is due could achieve as great a benefit interms of lives saved as some advances in treatment (Balas et al. 2000).
Quality can be measured and improved. Quality improve-ment initiatives provide the information and tools needed byphysicians and other health providers to practice in accordancewith the current state of medical knowledge. As the Instituteof Medicine reported, “no one clinician can retain all theinformation necessary for sound, evidence-based practice”
(IOM 2001a). Improving performance requires more sys-tematic approaches to evaluate and incorporate evidenceinto practice, more effective education for patients andpractitioners, more rigorous methods of assessment andaccountability, and greater teamwork among health careprofessionals and other stakeholders in the health care system.
To improve the quality of care, physicians need to knowwhat processes of care—such as testing, treating, or educating patients—achieve better or worse health out-comes under given circumstances (Hammermeister et al.1995). Organizational attributes such as leadership, culture,and information systems are also important factors in deter-mining the success of efforts at improvement (Ferlie andShortell 2001).
Finally, quality improvement interventions must be rigor-ously evaluated to determine whether and when they arecost-effective in achieving their aims for improving healthoutcomes and patient experience with the health system.The charts on the following pages illustrate interventionsthat have been evaluated on a relatively short-term basis;a critical challenge is to ensure that these gains are sustainedover time.
Leatherman and McCarthy, Quality of Health Care in the United States: A Chartbook, 2002. The Commonwealth Fund 127
Capacity to Improve: Summary of Charts and FindingsChart 6–1: Improving Immunization Rates—Patientswho received reminders about upcoming or overdueimmunizations were two-and-a-half times more likely to be vaccinated or up-to-date on vaccinations than those who did not receive reminders.
Chart 6–2: Reducing Unnecessary Antibiotic Use—A multi-faceted educational intervention aimed at bothpatients and physicians, along with performance feedbackfor physicians, safely reduced antibiotic prescribing by overone-third among patients with uncomplicated bronchitis atone health plan.
Chart 6–3: Improving Diabetes Management—Processand outcomes of care improved among Medicare patientswith diabetes after six health plans collaborated for performancemonitoring and implementing plan-specific interventions.
Chart 6–4: Improving Medical Treatment for HeartAttack—Medical treatment of heart attack improved afterMedicare Peer Review Organizations in four states providedperformance feedback to physicians and encouraged themto make practice improvements.
Chart 6–5: Improving Outcomes of Heart BypassSurgery—Bypass surgery death rates declined nearly one-quarter at five Northern New England hospitalscollaborating in a quality improvement intervention.
Chart 6–6: Improving Treatment and Outcomes forDepression—Improving opportunities for appropriatedepression treatment had a positive affect on the quality and outcomes of depression care in primary care clinics.
Chart 6–7: Reducing Pressure Ulcers in the NursingHome—The development of new bed sores declined 30percent over four years in a national nursing home chain.
Chart 6–8: Preventing Medication Mistakes—Over 80percent of medication mistakes were prevented through theuse of a computerized physician order-entry system, leadingto a reduction in preventable adverse drug events (patientinjuries).
Leatherman and McCarthy, Quality of Health Care in the United States: A Chartbook, 2002. The Commonwealth Fund 128
Capacity to Improve: Staying Healthy
Improving Immunization RatesWhy is this important? Many patients or parents cannot remember the recommended immunization schedule for
childhood or adult vaccination. Patient reminder systems are recommended by expert bodies including the Centersfor Disease Control and Prevention’s Advisory Committee on Immunization Practices. Yet, only 21 percent to 35 percent of pediatricians and family physicians reported using patient reminder systems (CDC 1998b; Schaffer etal. 2001).
Findings: Thirty-three (80%) of 41 controlled studies conducted over the past three decades found that remindingpatients about immunizations improved vaccination rates among children and adults. Source: Cochrane systematicreview (Szilagyi et al. 2000).
• Overall, patients who received reminders about upcoming or overdue immunizations were two-and-a-halftimes more likely to be vaccinated or up-to-date on their vaccinations than those who did not receivereminders. Many types of reminders were effective, including postcards, letters, and telephone—which was the most effective but costliest method.
• Among children, routine immunization rates increased 16 percentage points at the median (middle of therange), while influenza vaccination rates increased 25 percentage points.
• Among adults, influenza vaccination rates increased 7 percentage points at the median (middle of the range),while pneumococcal and tetanus vaccination rates increased 11 percentage points.
Implications: Patient reminder systems are highly effective. Although the costs of implementing such systems canrange from $7 to $63 per child vaccinated, advances in automated billing systems and immunization registriesare making reminder systems increasingly affordable for more physicians (Szilagyi et al. 2000).
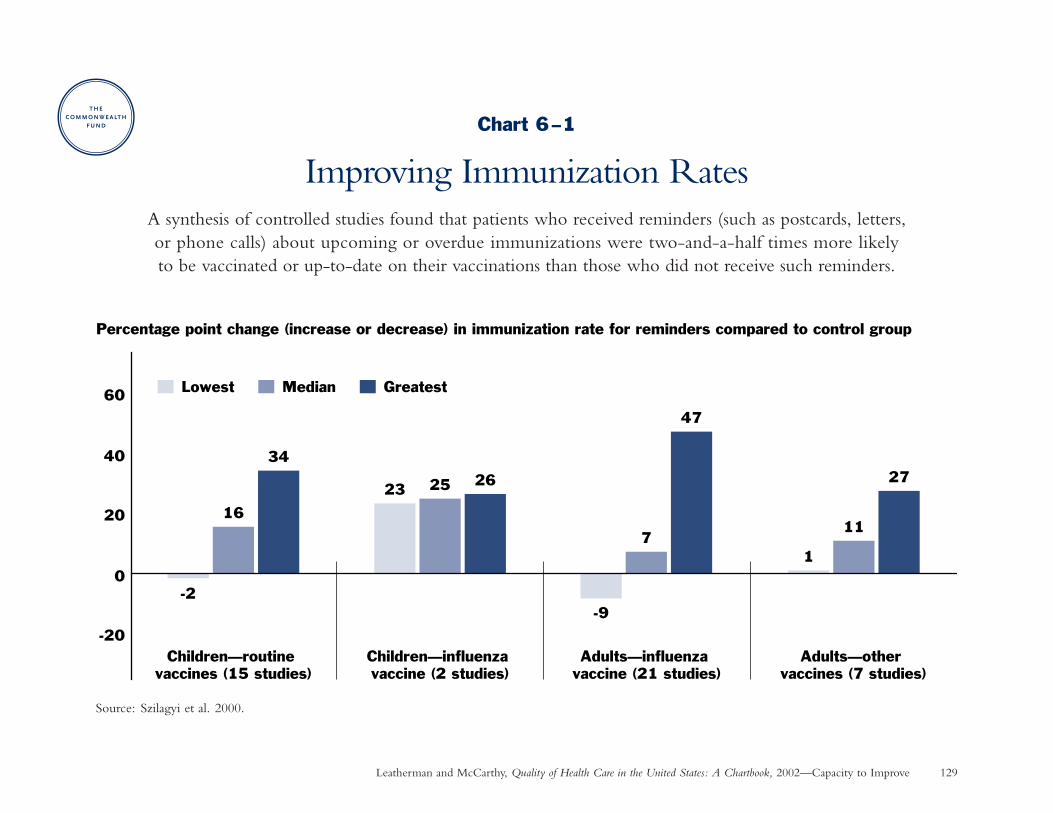
Leatherman and McCarthy, Quality of Health Care in the United States: A Chartbook, 2002—Capacity to Improve 129
Chart 6–1
Improving Immunization RatesA synthesis of controlled studies found that patients who received reminders (such as postcards, letters,or phone calls) about upcoming or overdue immunizations were two-and-a-half times more likely to be vaccinated or up-to-date on their vaccinations than those who did not receive such reminders.
Source: Szilagyi et al. 2000.
Percentage point change (increase or decrease) in immunization rate for reminders compared to control group
-20
0
20
40
60
-2
16
34
Children—routine vaccines (15 studies)
23 25 26
Children—influenza vaccine (2 studies)
-9
7
47
Adults—influenza vaccine (21 studies)
1
11
27
Adults—other vaccines (7 studies)
Lowest Median Greatest
Leatherman and McCarthy, Quality of Health Care in the United States: A Chartbook, 2002. The Commonwealth Fund 130
Capacity to Improve: Getting Better When Sick
Reducing Unnecessary Antibiotic UseWhy is this important? To curb the spread of antibiotic-resistant pathogens, the widespread overuse of antibiotics
must be reduced. In response to patient expectations, however, physicians continue to prescribe antibiotics in upto half of patient visits for colds and other upper respiratory infections and up to four-fifths of office visits forbronchitis. Since most of these illnesses are caused by a virus, such prescribing is often not indicated or effective(Gonzales et al. 1999).
Findings: A combination of patient education materials mailed to patients’ homes and displayed at physician officesas well as professional education and performance feedback for physicians was successful in safely reducingantibiotic prescribing by over one-third among adult patients with uncomplicated bronchitis who visited clinicsaffiliated with one health plan during 1997–1998.*
Reduced antibiotic use did not lead to more return office visits for bronchitis or pneumonia, increased use ofnon-antibiotic prescription treatments compared to the control group, or reduced patient satisfaction. Sources:Gonazales et al. 1999; Gonzales et al. 2001.
Implications: A multi-faceted educational intervention for both patients and physicians, combined with performancefeedback for physicians, was successful in safely reducing the overuse of antibiotics.
* There was no significant difference in antibiotic prescribing for a limited intervention involving only education in physician offices, so results for this grouphave not been shown for simplicity.
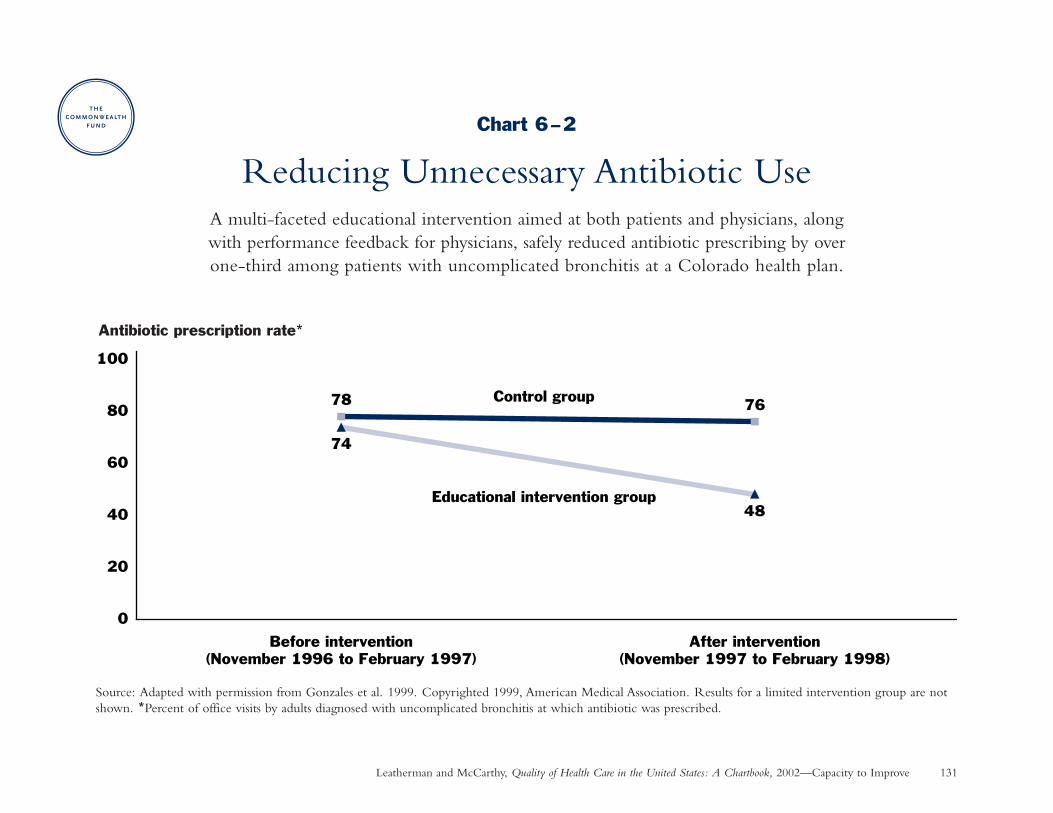
Leatherman and McCarthy, Quality of Health Care in the United States: A Chartbook, 2002—Capacity to Improve 131
Chart 6–2
Reducing Unnecessary Antibiotic UseA multi-faceted educational intervention aimed at both patients and physicians, along with performance feedback for physicians, safely reduced antibiotic prescribing by over one-third among patients with uncomplicated bronchitis at a Colorado health plan.
Source: Adapted with permission from Gonzales et al. 1999. Copyrighted 1999, American Medical Association. Results for a limited intervention group are notshown. *Percent of office visits by adults diagnosed with uncomplicated bronchitis at which antibiotic was prescribed.
76
74
48
78
0
20
40
60
80
100
Before intervention(November 1996 to February 1997)
After intervention(November 1997 to February 1998)
Control group
Educational intervention group
Antibiotic prescription rate*
Leatherman and McCarthy, Quality of Health Care in the United States: A Chartbook, 2002. The Commonwealth Fund 132
Capacity to Improve: Living with Chronic Illness
Improving Diabetes ManagementWhy is this important? Care for diabetes requires regular follow-up, education, and monitoring. Since the
average physician participates with multiple health plans and patients often move from plan to plan, improvementsin diabetes management may require collaborative effort between public health organizations, health plans, andphysicians.
Findings: The quality of diabetes care among Medicare patients improved when six managed health care plans in Arizona collaborated with the state’s Medicare Peer Review Organization (PRO) on a quality improvementinitiative. After one year:
• A greater proportion of patients received all needed services including diabetes monitoring, education,and follow-up treatment (34 percent before vs. 55 percent after the intervention).
• The proportion of patients with their blood sugar under control (glycosylated hemoglobin A1c below 8 percent) rose from 40 percent of patients prior to 62 percent after the intervention.
The PRO measured and provided comparative feedback on health plan performance at the beginning of theproject and one year later. Each health plan designed its own intervention, which included case management,physician-developed tracking forms, medical record reminder systems, data feedback for individual physicians,and patient education. Source: Marshall, Bluestein, Briere, et al. 2000.
Implications: This experience demonstrates the feasibility of collaboration among competing health care organizationsto improve the management of diabetes care by primary care physicians through case management, tracking andreminders systems, performance feedback, and patient education.
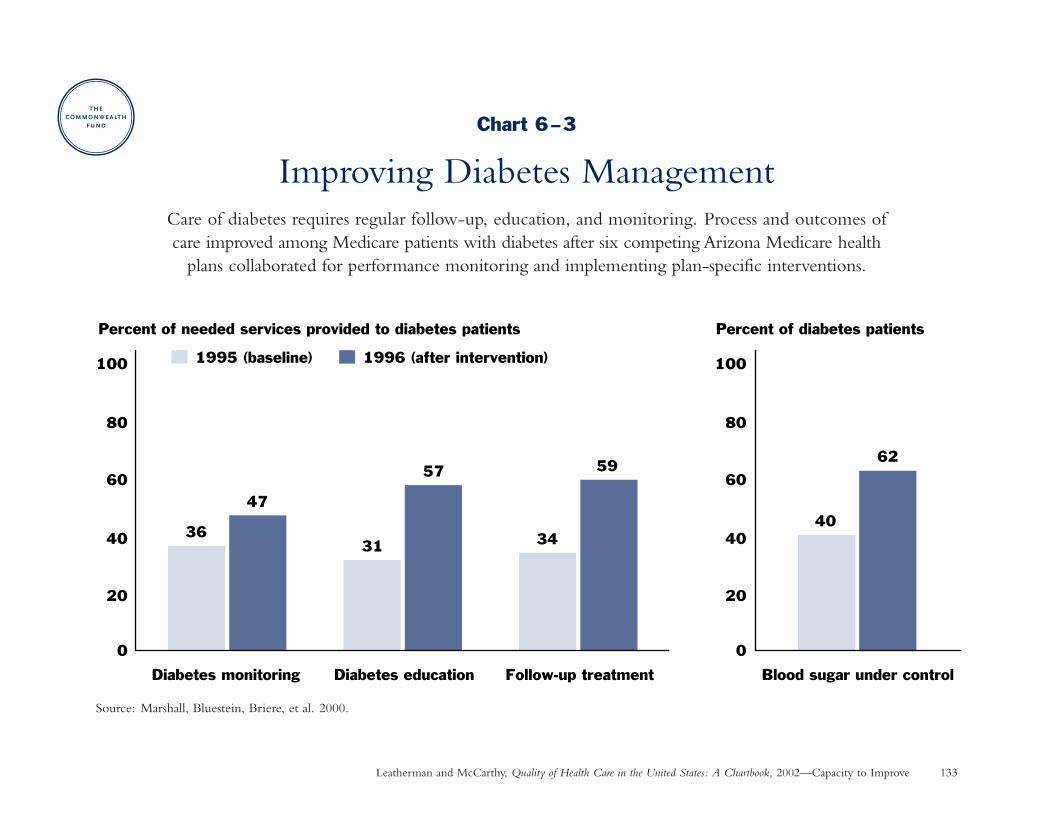
Leatherman and McCarthy, Quality of Health Care in the United States: A Chartbook, 2002—Capacity to Improve 133
Chart 6–3
Improving Diabetes ManagementCare of diabetes requires regular follow-up, education, and monitoring. Process and outcomes of care improved among Medicare patients with diabetes after six competing Arizona Medicare health
plans collaborated for performance monitoring and implementing plan-specific interventions.
Source: Marshall, Bluestein, Briere, et al. 2000.
Percent of needed services provided to diabetes patients
3631 34
47
57 59
0
20
40
60
80
100
Diabetes monitoring Diabetes education Follow-up treatment
1995 (baseline) 1996 (after intervention)
Percent of diabetes patients
40
62
0
20
40
60
80
100
Blood sugar under control
Leatherman and McCarthy, Quality of Health Care in the United States: A Chartbook, 2002. The Commonwealth Fund 134
Capacity to Improve: Living with Chronic Illness
Improving Medical Treatment for Heart AttackWhy is this important? Certain medications—aspirin, beta-blockers, and angiotensin-converting enzyme (ACE)
inhibitors, when indicated—significantly reduce the recurrence of heart attack and improve patients’ survivalwhen prescribed during hospitalization and afterwards as long-term preventive therapy for heart attack victims.Many patients, however, do not get the medications.
Findings: Medical treatment of heart attacks improved after Medicare Peer Review Organizations in four statesprovided performance feedback to physicians and encouraged them to make improvements. Source: CooperativeCardiovascular Project (Marciniak et al 1998). Among Medicare patients who were ideal candidates for drugtherapy:
• Aspirin use increased by 7 percentage points during hospitalization and by 10 percentage points at hospitaldischarge (aspirin helps prevent dangerous blood clots from forming).
• Beta-blocker and ACE inhibitor prescriptions at discharge increased by 20 percentage points and 14 percentagepoints, respectively (beta-blockers help the heart work better by decreasing its need for blood and oxygen; ACEinhibitors lower blood pressure and increase the supply of blood and oxygen to the heart).
• There was a 10 percent relative reduction in death rates measured at 30 days and one year after hospitalization,to a level slightly better than the rest of the nation.
Implications: A quality improvement initiative that includes collaborative sharing of performance data can have ameasurable impact on improving quality-of-care and health outcomes, including reduced mortality.
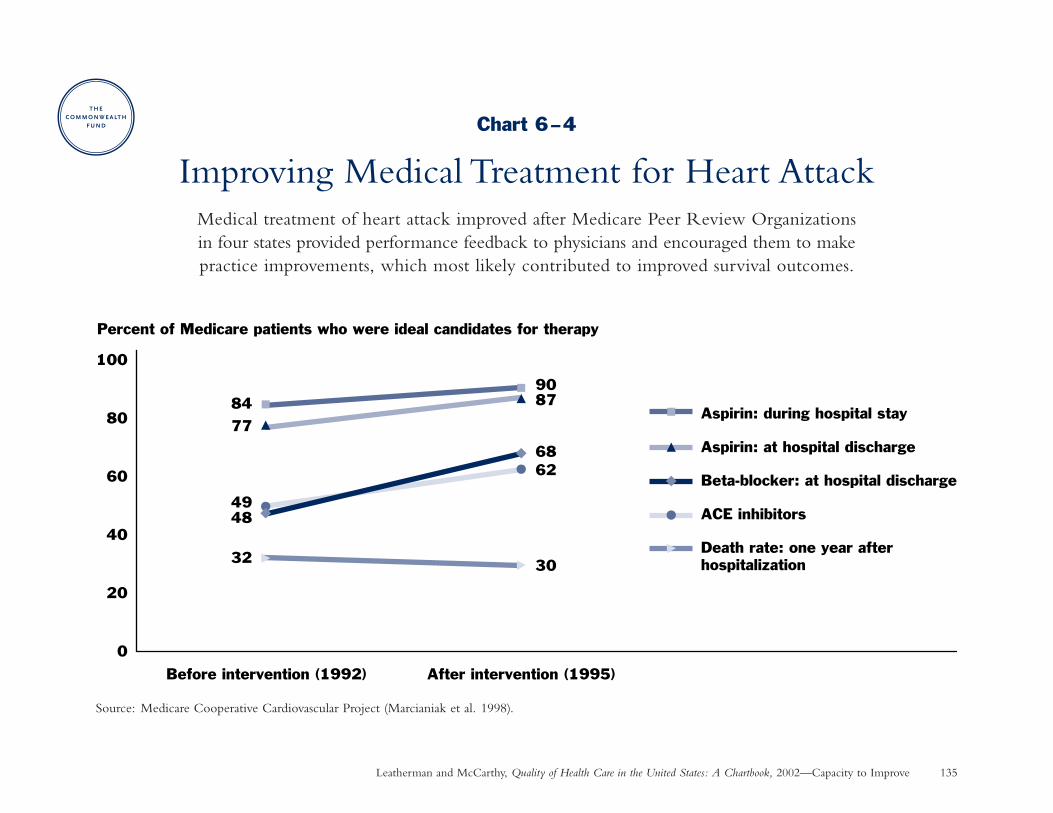
Leatherman and McCarthy, Quality of Health Care in the United States: A Chartbook, 2002—Capacity to Improve 135
Chart 6–4
Improving Medical Treatment for Heart AttackMedical treatment of heart attack improved after Medicare Peer Review Organizations in four states provided performance feedback to physicians and encouraged them to make practice improvements, which most likely contributed to improved survival outcomes.
Source: Medicare Cooperative Cardiovascular Project (Marcianiak et al. 1998).
8490
77
87
48
62
32 30
68
49
0
20
40
60
80
100
Before intervention (1992) After intervention (1995)
Percent of Medicare patients who were ideal candidates for therapy
Aspirin: during hospital stay
Aspirin: at hospital discharge
Beta-blocker: at hospital discharge
ACE inhibitors
Death rate: one year after hospitalization
Leatherman and McCarthy, Quality of Health Care in the United States: A Chartbook, 2002. The Commonwealth Fund 136
Capacity to Improve: Living with Chronic Illness
Improving Outcomes of Heart Bypass SurgeryWhy is this important? Heart bypass surgery—one of the most frequently performed surgical procedures—has
received much attention in quality improvement efforts. One of the most rigorous is the Northern New EnglandCardiovascular Disease Study Group, a voluntary consortium of hospitals founded in 1987. By collecting detailedclinical data over time, the group discovered wide variation in bypass surgery death rates—ranging from 2 percentto 10 percent among surgeons. In response, the consortium implemented a cooperative quality improvementintervention.
Findings: After Northern New England hospitals and surgeons implemented a cooperative quality improvementintervention, the regional in-hospital bypass surgery death rate fell to a level 24 percent lower than expectedbased on historical regional data (3.3% vs. 4.3%)—resulting in 74 fewer deaths from 1991 to 1993 (the timeperiod measured in a post-intervention study).
The intervention consisted of: (1) regular confidential feedback of outcomes data to each surgeon and hospital inthe region, (2) training in quality improvement techniques, and (3) a series of site visits to discover best practicesat each institution. As a result of these efforts, numerous changes were initiated at each hospital based on a betterunderstanding about the relationship between processes and outcomes of care. Source: O’Connor et al. 1996;Wennberg and Cooper 1999.
Implications: Rigorous methods of peer review and benchmarking such as these are still relatively rare in the U.S.Their success urges that policymakers—public and private—examine the feasibility of adopting similar methodselsewhere.
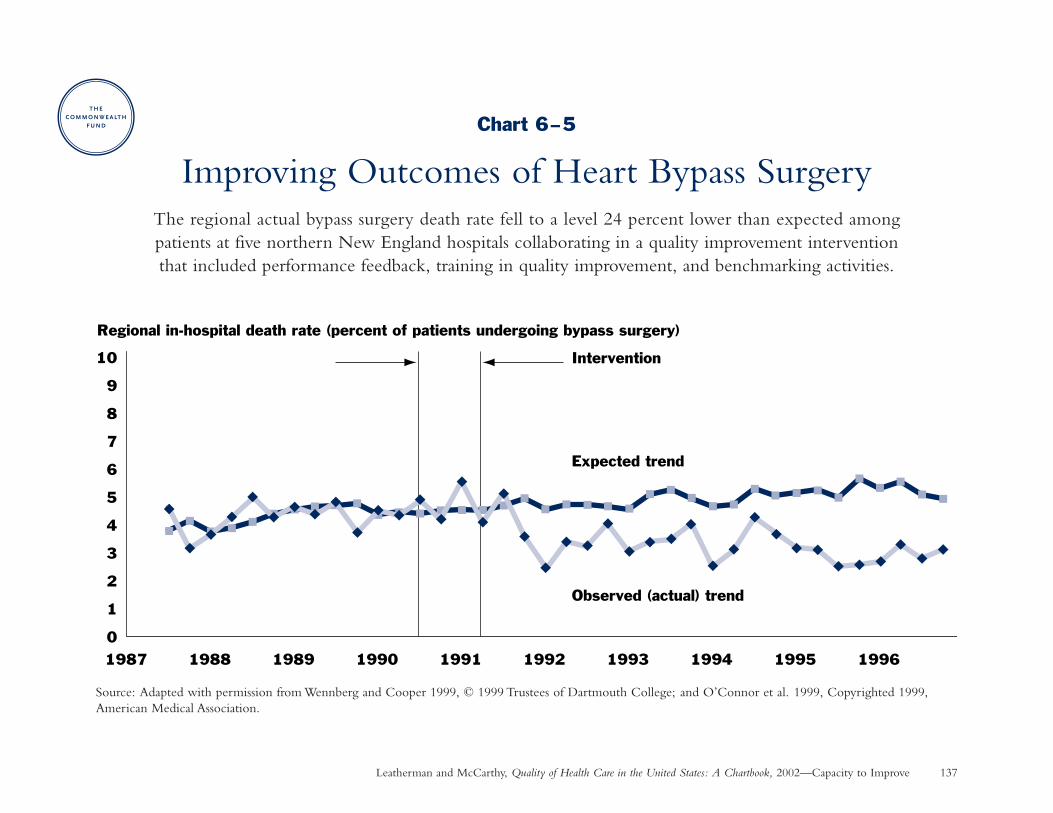
Leatherman and McCarthy, Quality of Health Care in the United States: A Chartbook, 2002—Capacity to Improve 137
Chart 6–5
Improving Outcomes of Heart Bypass SurgeryThe regional actual bypass surgery death rate fell to a level 24 percent lower than expected among patients at five northern New England hospitals collaborating in a quality improvement intervention that included performance feedback, training in quality improvement, and benchmarking activities.
Source: Adapted with permission from Wennberg and Cooper 1999, © 1999 Trustees of Dartmouth College; and O’Connor et al. 1999, Copyrighted 1999,American Medical Association.
1988 1989
10
9
8
7
6
5
4
3
2
1
01992199119901987 199519941993 1996
Expected trend
Observed (actual) trend
Intervention
Regional in-hospital death rate (percent of patients undergoing bypass surgery)
Leatherman and McCarthy, Quality of Health Care in the United States: A Chartbook, 2002. The Commonwealth Fund 138
Capacity to Improve: Living with Chronic Illness
Improving Treatment and Outcomes for DepressionWhy is this important? Care for depressive disorder is often not optimal, despite research showing the effectiveness
of antidepressant medication and specific psychotherapies. In the past, guidelines and performance feedback havehad little effect on improving depression care.
Findings: Short-term interventions designed to improve treatment of patients with depressive symptoms in primarycare practices had significant positive effects on quality of care and patient outcomes after one year as comparedto patients who received usual care.
• Quality improvement patients were more likely to receive appropriate care (counseling or antidepressantmedication at an appropriate dose), to see a mental health specialist, and to get care that matched their preferences. There was no overall increase in medical visits.
• Quality improvement patients were less likely to have probable depressive order and were more likely to be employed after one year.
The intervention included: (1) explicit commitment to quality improvement, (2) training local experts to provideeducation and feedback to clinicians, (3) training local nurses to provide patient assessment and education, and(4) identifying potentially depressed patients. In a Quality Improvement Meds intervention group, local nurseswere trained to provide follow-up assessments to support medication adherence. In a Quality ImprovementTherapy group, local psychotherapists were trained to provide cognitive behavior therapy, for which health plansreduced their normal patient copayment. Source: Wells et al. 2000; Dwight-Johnson et al. 2001.
Implications: A carefully designed quality improvement program can significantly improve the process and outcomes ofdepression care. Cost-effectiveness was comparable to other accepted medical interventions (Schoenbaum et al. 2001).
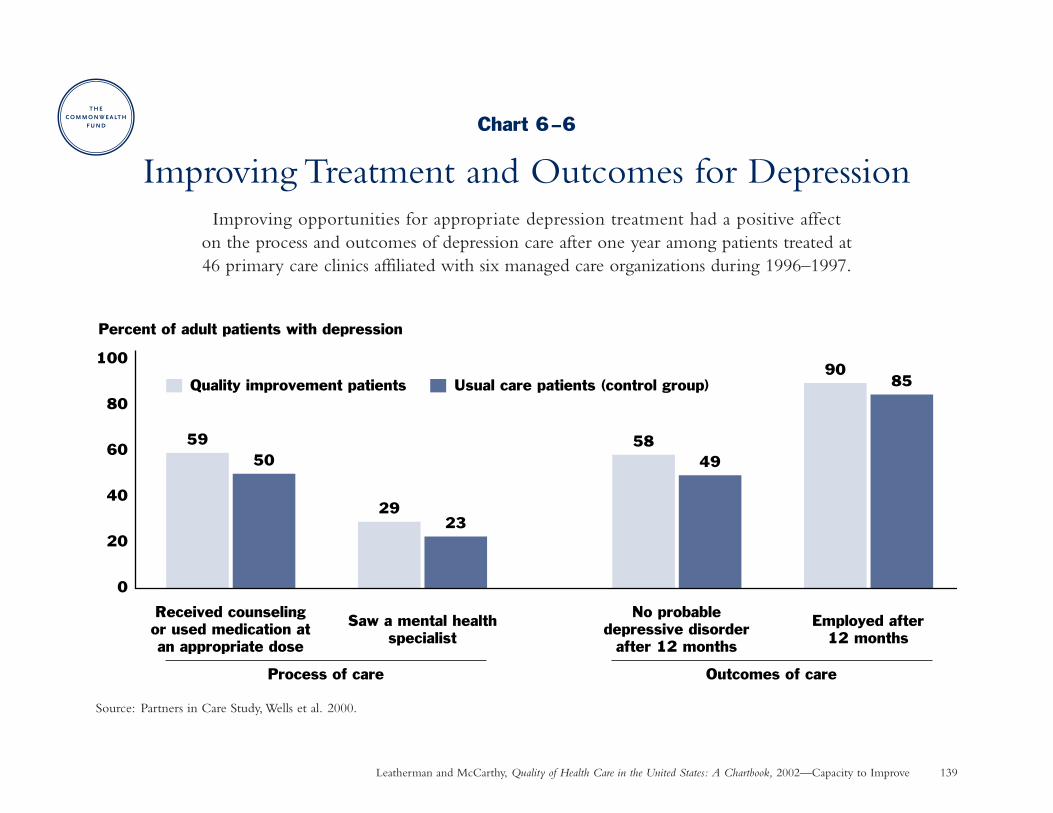
Leatherman and McCarthy, Quality of Health Care in the United States: A Chartbook, 2002—Capacity to Improve 139
Chart 6–6
Improving Treatment and Outcomes for DepressionImproving opportunities for appropriate depression treatment had a positive affect
on the process and outcomes of depression care after one year among patients treated at 46 primary care clinics affiliated with six managed care organizations during 1996–1997.
Source: Partners in Care Study, Wells et al. 2000.
5950
2923
5849
9085
0
20
40
60
80
100
Received counselingor used medication atan appropriate dose
Saw a mental healthspecialist
No probabledepressive disorder
after 12 months
Employed after12 months
Percent of adult patients with depression
Quality improvement patients Usual care patients (control group)
Outcomes of careProcess of care
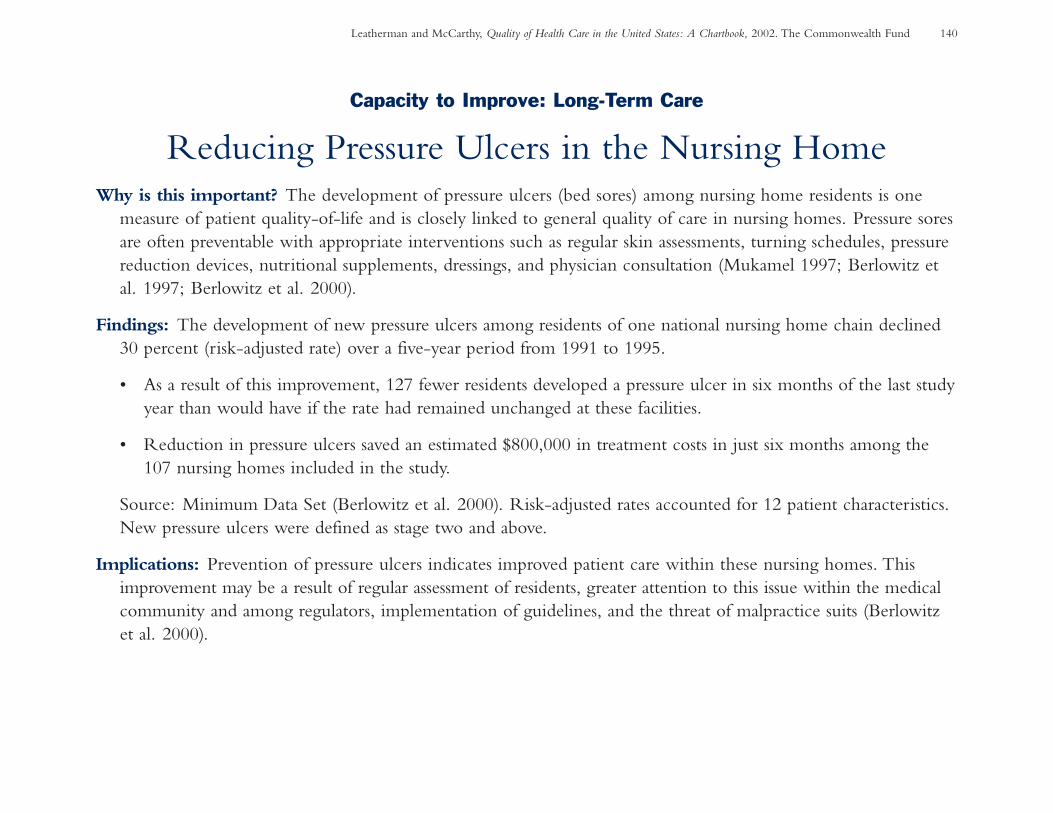
Leatherman and McCarthy, Quality of Health Care in the United States: A Chartbook, 2002. The Commonwealth Fund 140
Capacity to Improve: Long-Term Care
Reducing Pressure Ulcers in the Nursing HomeWhy is this important? The development of pressure ulcers (bed sores) among nursing home residents is one
measure of patient quality-of-life and is closely linked to general quality of care in nursing homes. Pressure soresare often preventable with appropriate interventions such as regular skin assessments, turning schedules, pressurereduction devices, nutritional supplements, dressings, and physician consultation (Mukamel 1997; Berlowitz etal. 1997; Berlowitz et al. 2000).
Findings: The development of new pressure ulcers among residents of one national nursing home chain declined30 percent (risk-adjusted rate) over a five-year period from 1991 to 1995.
• As a result of this improvement, 127 fewer residents developed a pressure ulcer in six months of the last studyyear than would have if the rate had remained unchanged at these facilities.
• Reduction in pressure ulcers saved an estimated $800,000 in treatment costs in just six months among the107 nursing homes included in the study.
Source: Minimum Data Set (Berlowitz et al. 2000). Risk-adjusted rates accounted for 12 patient characteristics.New pressure ulcers were defined as stage two and above.
Implications: Prevention of pressure ulcers indicates improved patient care within these nursing homes. Thisimprovement may be a result of regular assessment of residents, greater attention to this issue within the medicalcommunity and among regulators, implementation of guidelines, and the threat of malpractice suits (Berlowitzet al. 2000).
Leatherman and McCarthy, Quality of Health Care in the United States: A Chartbook, 2002—Capacity to Improve 141
Chart 6–7
Reducing Pressure Ulcers in the Nursing HomeThe development of new pressure ulcers (bed sores) declined 30 percent among residents of 107 nursing homes affiliated with a national nursing home chain in nine states, suggesting improved quality of care.
Source: Minimum Data Set (Berlowitz et al. 2000).
Six-month risk-adjusted rate of pressure ulcer development (percent)
2.7 2.6
2.2
2.6
1.9
2.72.5
1.9 1.9 1.9
0.0
0.5
1.0
1.5
2.0
2.5
3.0
3.5
4.0
19951994199319921991
Leatherman and McCarthy, Quality of Health Care in the United States: A Chartbook, 2002. The Commonwealth Fund 142
Capacity to Improve: Patient Safety
Preventing Medication MistakesWhy is this important? Medication mistakes are a common occurrence in hospitals. Although most medication
errors are not serious, a small percentage result in patient injury while others represent “near misses” that couldresult in injury under different circumstances.
Findings: Implementation of a computerized physician order entry system in a large Boston teaching hospital reducedthe rate of overall medication errors (other than missing doses) by 80 percent when the system was fully developedto detect drug allergies and dangerous drug-drug interactions. Source: Bates et al. 1999.
• Serious medication errors (nonintercepted)—those that actually caused injury or had the potential to causeinjury and were not caught before reaching the patient—fell by 86 percent.
• Preventable adverse drug events—injury due to medication mistakes—declined by 62 percent.
• Potential adverse drug events (nonintercepted)—“near misses” that reached the patient but didn’t cause injuryby chance—were reduced 100 percent to zero.
• Error reductions occurred at all stages of the medication use process (drug ordering, transcribing, dispensing,and administering).
Implications: Computerized physician prescribing in every non-rural hospital in the United States could preventabout 522,000 serious medication errors each year. Over 500 deaths could be prevented each year as a result ofhospital-based computerized prescribing if only one-tenth of one percent of such errors resulted in the death ofthe patient. Currently, only 3 percent of U.S. hospitals have implemented computerized physician prescribingsystems (Birkmeyer and Birkmeyer 2000; Leapfrog Group 2002).
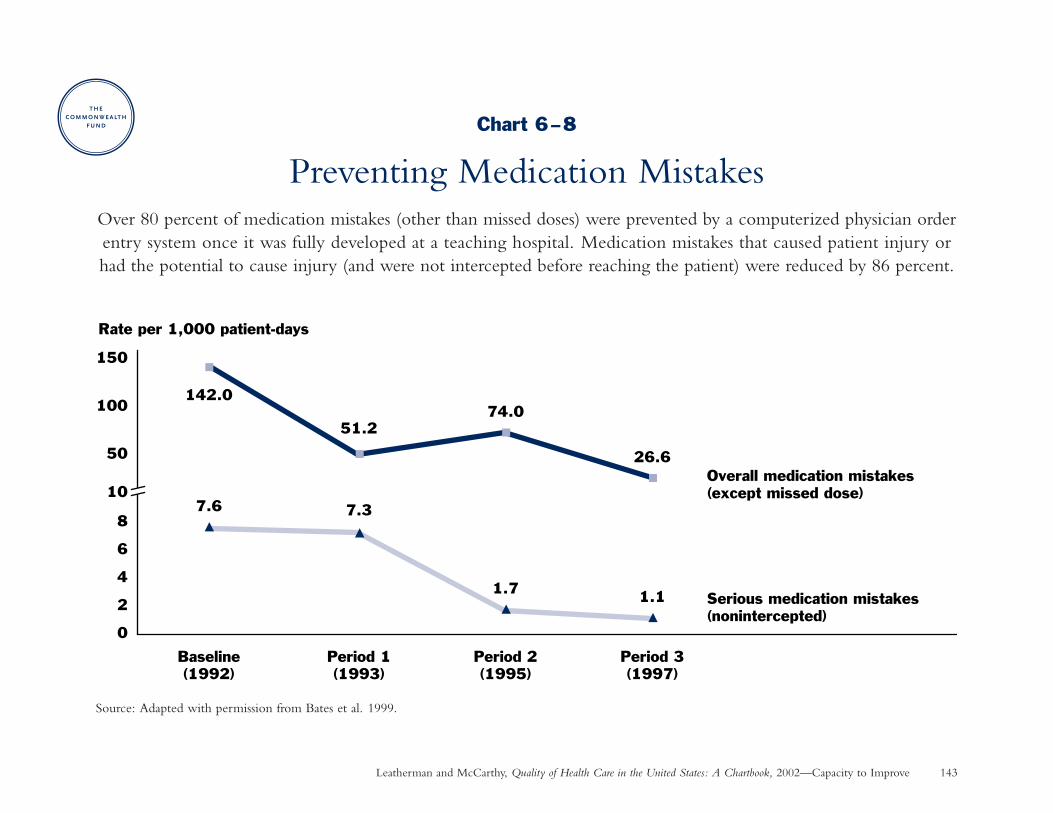
Leatherman and McCarthy, Quality of Health Care in the United States: A Chartbook, 2002—Capacity to Improve 143
Chart 6–8
Preventing Medication MistakesOver 80 percent of medication mistakes (other than missed doses) were prevented by a computerized physician orderentry system once it was fully developed at a teaching hospital. Medication mistakes that caused patient injury orhad the potential to cause injury (and were not intercepted before reaching the patient) were reduced by 86 percent.
Source: Adapted with permission from Bates et al. 1999.
142.0
51.274.0
26.6
7.6 7.3
1.7 1.1
10
50
100
150
0
2
4
6
8
Baseline(1992)
Period 1(1993)
Period 2(1995)
Period 3(1997)
Rate per 1,000 patient-days
Overall medication mistakes (except missed dose)
Serious medication mistakes (nonintercepted)

Leatherman and McCarthy, Quality of Health Care in the United States: A Chartbook, 2002. The Commonwealth Fund 145
Technical AppendixThis appendix provides more detailed information on data sources and studymethodologies. Since the Chartbook presents data from many different kindsof sources and studies conducted by different researchers, methodologies differfrom chart to chart. All differences described as statistically significant reflect a95 confidence level or greater.
Chart 1–1: Childhood Immunizations. The National Immunization Survey(NIS) is an annual, random telephone survey of households with children whoare age-eligible for vaccinations (34,087 household interviews were completedin 2000), supplemented by vaccination records obtained from health care providers(for 22,958 children in 2000). The NIS is conducted by the National Center forHealth Statistics (NCHS), Centers for Disease Control and Prevention (CDC).Final estimates were weighted to represent all children surveyed and adjustedto account for nonresponding households, households without telephones,and changes in birthrates (Eberhardt et al. 2001; CDC 2001a).
Chart 1–2: Immunizations for Older Adults. The National HealthInterview Survey is conducted by the NCHS through personal interviewswith a sample of 36,000 to 47,000 households, depending upon the year.Response rates have ranged from 94 to 98 percent on the core survey. Resultsare weighted to be representative of the entire U.S. civilian, noninstitutionalizedpopulation. Respondents who did not know their vaccination status wereexcluded from the analysis for the years 1995–2001; rates for 1989–1993 wouldbe slightly higher if a similar methodology had been used in those years. For1997–2001, crude rates shown in the graph did not differ by more than onepercentage point from 2000 age-standardized rates (Eberhardt et al. 2001; CDC1995; 2000a; 2002b; www.cdc.gov).
Chart 1–3: Colorectal Cancer Screening. The Behavioral Risk FactorSurveillance System (BRFSS) is a state-based, random telephone survey of the U.S. civilian, noninstitutionalized adult population (age 18 and older)conducted in cooperation between the CDC and state health departments.
Data for 1999 included 63,555 respondents age 50 and older (median responserate of 57%). Rates were weighted to be representative of each state’s adultpopulation and age standardized to the 1999 BRFSS population. Those whodidn’t respond or didn’t know if they had been screened were excluded fromthe analysis (CDC 2001c). Excluding Puerto Rico from the results did notsubstantially change the national averages, e.g., for fecal occult blood test inthe last year: 20.6 percent with Puerto Rico vs. 20.9 percent without PuertoRico.
Chart 1–4: Breast Cancer Screening and Outcomes. Mammography dataare derived from supplements to the National Health Interview Survey (NHIS;see Chart 1–2 for description) in certain years; response rates were somewhatlower (e.g., 80%) than for the core NHIS survey. The breast cancer death ratewas age-standardized to the 2000 population to control for the changing agecomposition of the population over time; the NCHS obtains data on all deathsrecorded by state registration offices (Eberhardt et al. 2001, Table 41; MacKay,Fingerhut, and Duran 2000, Table 82).
Chart 1–5: Smoking Cessation Counseling. The National AmbulatoryMedical Care Survey is an annual survey of office-based physicians conducted bythe NCHS using a complex sampling design. Participating physicians completea one-page encounter form after patient visits during a randomly selected week.Physician response rates ranged from 70–73 percent from 1991–1995. Dataincluded 145,716 adult patients visits during 1991–1995 and 16,648 visits byadolescents age 11 to 21 during 1991–1996. The rate of counseling for smoking-related diagnoses shown in the chart represents the best performance for anyof the most common smoking-related primary diagnoses among smokers inthe sample. All rates were weighted to reflect national estimates (Thorndike et al. 1998; 1999).
Leatherman and McCarthy, Quality of Health Care in the United States: A Chartbook, 2002. The Commonwealth Fund 146
Chart 1–6: Antibiotic Treatment for Sore Throat. Data are from the 1989–1999 National Ambulatory Medical Care Survey (see Chart 1–5 for description).Physician response rates declined from 74 percent in 1989 to 63 percent in1999. The analysis included 2,244 visits to primary care physicians by adultpatients (age 18 and older) with a chief complaint of sore throat, excludingcertain types of patients and visits that might provide an alternative reason forantibiotic use. There was a statistically significant temporal trend toward lowerantibiotic prescribing: from 76 percent on average during 1989–1992, to 69percent on average during 1997–1999 (Linder and Stafford 2001).
Chart 1–7: Antibiotic Treatment for Pneumonia. Baseline data for theMedicare Health Care Quality Improvement Program was collected during1998 and 1999, including a sample of up to 750 hospital discharges for a six-month period in each state among traditional (fee-for-service) Medicarebeneficiaries with a principal diagnosis of pneumonia (Jencks et al. 2000).Excluding Puerto Rico from the results changed median rates only slightly:for blood culture, 82 percent with Puerto Rico vs. 83 percent withoutPuerto Rico; for antibiotic administration within eight hours, 85 percentwith Puerto Rico vs. 86 percent without Puerto Rico.
Chart 1–8: Appropriateness of Procedures. Studies were chosen to be representative of sentinel RAND appropriateness studies. Data were drawn fromrandom samples, including: (1) 642 nonemergency, nonmalignant hysterectomiesperformed between August 1989 and July 1990 among patients enrolled inseven managed care organizations (Bernstein et al. 1993); (2) 1,139 cataractsurgery patients at 10 academic medical centers during 1990 (Tobacman et al.1996); (3) 386 patients who underwent coronary artery bypass surgery in threerandomly selected hospitals (nongovernmental and nonspecialty) in a westernstate during the years 1979, 1980, and 1982 (Winslow et al. 1988); (4) 1,306patients undergoing percutaneous transluminal coronary angioplasty in NewYork State in 1990 (Hilborne et al. 1993); (5) 1,677 Medicare patients undergoingcoronary angiography in 1981 at three sites selected from a larger study thatincluded 13 sites in eight states (Chassin et al. 1987).
Chart 1–9: Diabetes Management. Data are from the Behavioral RiskFactor Surveillance System (see Chart 1–3 for description). Estimates for thischart represent 3-year averages for 1997–1999, age-standardized to the 2000
U.S. adult population. Respondents included those who reported that theirdoctor told them they had diabetes; women who had diabetes only duringpregnancy were excluded from the analysis (CDC 2000c).
Chart 1–10: Asthma Management. Data for this Health Plan Employer Dataand Information Set measure are collected by health plans from administrativerecords, as specified by the National Committee for Quality Assurance, andaudited by certified independent auditors. Data shown for 2000 representsapproximately 272 commercial managed health care organizations covering 63 million lives. The list of medications considered acceptable for long-termasthma control is derived from the National Heart, Lung and Blood Institute’sNational Asthma Education and Prevention Program guidelines (NCQA 2001a;2001c).
Chart 1–11: Stroke Prevention. The source is baseline data for the MedicareHealth Care Quality Improvement Program (see Chart 1–7 for description)for any hospital discharge diagnosis of atrial fibrillation among patients withoutcontraindications for warfarin (Jencks et al. 2000). Excluding Puerto Rico fromthe results did not substantially affect the median rate reported.
Chart 1–12: Treatment and Outcomes for HIV. Data included a sample of 2,864 respondents at baseline (1996) and 2,267 at second follow-up (1998)representative of all adults (age 18 and older) with known HIV receivingmedical care in the continental U.S. from physicians or facilities other thanemergency departments, the military, or prisons. Utilization measures weredefined as follows: (1) prophylaxis against Pneumocystis carinii pneumonia in thelast six months when indicated (CD4 count less than 0.20 x 10⁹/L); (2) anyantiretroviral therapy prior the interview when indicated (CD4 count less than0.50 x 109/L); this measure is not shown on the graph due to limited space(94% and 97% compliance in 1996 and 1998, respectively); (3) highly activeantiretroviral therapy (protease inhibitor or nonnucleoside reverse transcriptaseinhibitor) when indicated by December 1986 (baseline) or January 1998 (follow-up); (4) at least two physician visits in the last six months; (5) one or moreemergency department visits without an associated hospitalization in the lastsix months, and (6) one or more hospitalizations in the last six months(Shapiro et al. 1999).
Leatherman and McCarthy, Quality of Health Care in the United States: A Chartbook, 2002. The Commonwealth Fund 147
Chart 1–13: Medication to Prevent Recurrent Heart Attack. The sourceis baseline data for the Medicare Health Care Quality Improvement Program(see Chart 1–7 for description) for hospital discharges with a principal diagnosisof acute myocardial infarction (Jencks et al. 2000). Patients defined as “idealcandidates for treatment” in the study means patients who met eligibility criteriaand did not have documented contraindications to treatment. Excluding PuertoRico from the results did not substantially affect the median rate reported.
Chart 1–14: Speed to Treatment with Clot-Dissolving Drugs Followinga Heart Attack. Data represents 295,056 patients treated from 1990 to 1999with recombinant tissue-type plasminogen activator (rt-PA) in the NationalRegistry of Myocardial Infarction, an observational study sponsored by Genetech,Inc., which manufacturers an rt-PA agent. In a separate analysis of 266,177patients who received any type of intravenous thrombolytic agent from 1994to 1999, the median time to treatment was 47 minutes in 1994, compared to46 minutes shown in chart, and 38 minutes in 1999, the same rate reportedin the chart (Rogers et al. 2000).
Chart 1–15: Treatment for Depression. The 1986 Medical Outcomes Studysites included large group-practice HMOs; multi-specialty, mixed prepaid andfee-for-service group practices; and single-specialty, small-group or solo practicesin Los Angeles, Boston, and Chicago. Data on use of psychotropic medicationswas obtained in person or over the telephone for a sample of 634 depressedpatients who had an ongoing care relationship, screened positive for currentdepressive symptoms, and completed a mental health diagnostic test. The 1996–1997 Partners in Care study was an Agency for Healthcare Research and QualityPatient Outcomes Research Team (PORT-II). Sites included geographicallydispersed staff-model HMOs, primary care networks, and one rural publichealth system. Baseline data were collected on 1,204 patients who screenedpositive for probable depressive disorder, completed a patient assessmentquestionnaire, planned to use the clinic for the next year, and whose insurancecovered behavioral health care provided through the intervention. Medicationswere assessed when used any day in the previous month, or daily for at least a month during the preceding six months. Appropriate dosage was assessedusing a conservative clinician consensus approach in 1986 and based on updatedAgency for Healthcare Research and Quality guidelines in 1996–1997 (Wellset al. 1994; Wells et al. 1999).
Chart 1–16: Nursing Home Care. The On-line Survey, Certification, andReporting (OSCAR) system is a uniform, computerized database of state surveysof all certified nursing facilities in the U.S. Resident characteristics are reportedby the nursing facilities based on comprehensive resident assessments done forcare planning. State surveyors check accuracy through a review of medicalrecords, interviews, and direct observation (Harrington, Carrillo, and Wellin2001).
Chart 2–1: Estimated Deaths Associated with Medical Mistakes. TheIOM high estimate is an extrapolation of findings from the New York Statestudy (Chart 2–2) to all hospital admission in the U.S. in 1997, assuming thatoutcomes of preventable adverse events were similar to outcomes of adverseevents; the IOM low estimate is an extrapolation of findings from the Colorado/Utah Study to all hospitalizations in 1997 (Chart 2–3) (IOM 2001c).
Chart 2–2: Preventable Adverse Events in New York. The Harvard MedicalPractice Study—the most extensive study of adverse events to date—reviewedrecords of more than 30,000 randomly selected discharges from 51 randomlyselected nonpsychiatric hospitals in New York State in 1984. Records werescreened by trained nurses and analysts; positive records were independentlyreviewed by two trained physicians (Brennan et al. 1991). The preventableadverse event rate shown in the chart was calculated by the Chartbookauthors as 58 percent of the adverse event rate (Leape et al. 1991).
Chart 2–3: Preventable Adverse Events in Colorado/Utah. Data includeda random sample of 15,000 nonpsychiatric discharges from a representativesample of hospitals in Colorado and Utah in 1992 (Thomas et al. 2000).Methodology was similar to the Harvard Medical Practice Study, except thatrecords were reviewed by one physician each. The adverse event rate shownin the chart was recalculated to exclude newborns so as to be comparable tothe preventable adverse event rate reported in a separate analysis (Thomas et al.1999), and therefore differs from the 2.9 percent rate reported in the source(personal communication with Eric Thomas, 2001).
Leatherman and McCarthy, Quality of Health Care in the United States: A Chartbook, 2002. The Commonwealth Fund 148
Chart 2–4: Preventable Adverse Drug Events. The study included all 4,031adult admissions to a stratified random sample of 11 medical and surgical unitsin two tertiary care hospitals from February to July 1993. Incidents were reportedby nurses and pharmacists and detected by daily chart review. Two independentreviewers classified the incidents (Bates et al. 1995).
Chart 2–5: Medication-Prescribing Mistakes. Mistakes were identified byhospital pharmacists, confirmed with the prescribing physician, and reviewedby another clinical pharmacist and one of the study authors. The potential foradverse outcomes was determined based on patient and pharmacological data.A total of 11,186 confirmed medication-prescribing mistakes with potential foradverse events were detected and averted during the nine-year study period(Lesar, Lomaestro, and Pohl 1997).
Chart 2–6: Potentially Inappropriate Prescribing for the Elderly. Allstudies used modified Beers consensus-based expert criteria (based on the 1991original list or 1997 update) for drugs that should generally be avoided in theelderly regardless of dosage, frequency, or duration of treatment. Data included:(1) a sample of 6,171 respondents age 65 and older from the 1987 NationalMedical Expenditure Survey, conducted by the Agency for Healthcare Researchand Quality and representative of the U.S. civilian, noninstitutionalized population(Wilcox, Himmelstein, and Woolhandler 1994); (2) in-home interviews conductedduring 1989–1990 with 414 elderly people age 75 and older living in SantaMonica, California (Stuck et al. 1994); (3) a sample of 9,182 respondents tothe 1992 Medicare Current Beneficiary Survey, representative of noninstitutional-ized Medicare beneficiaries age 65 and older (GAO 1995); (4) interviews witha sample of 2,054 elderly residents of 410 board and care facilities in 10 statesduring 1993 (Spore et al. 1997); (5) a sample of 2,455 respondents age 65 andolder from the 1996 Medical Expenditure Panel Survey representative of theU.S. civilian, noninstitutionalized population (Zhan et al. 2001); (6) admissionrecords and a nursing questionnaire for 6,718 home health care patients age 65and older admitted to selected offices of two large urban agencies from October1996 to September 1998 (Meredith et al. 2001).
Chart 3–1 to 3–3: Effect of Being Uninsured on Access to Primary andPreventive Care. Data from the Behavioral Risk Factor Surveillance System(see Chart 1–3 for description) included over 100,000 adults in both 1997and 1998 in all 50 states and the District of Columbia, except that questions
about diabetic eye and foot exam were asked in 37 states. Preventive caremeasures shown in the graph represent a subset of those reported in the study.Questions about mammography, pap tests, and diabetic eye and foot exams wereasked in 1998; questions about screening for colorectal cancer, hypertension,and cholesterol were asked in 1997. Rates shown in the graphs were adjustedto control for the effects of age, gender, race/ethnicity, region, employmentstatus, education, and income; all differences between the uninsured and theinsured shown in the graphs were statistically significant (Ayanian et al. 2000).
Chart 3–4: Unmet Needs of Children with Special Health Care Needs.Data represents 57,553 interviews with adults knowledgeable about the healthstatus of sample children (under age 18), from the 1994–1995 National HealthInterview Survey on Disability, conducted by the Census Bureau for the NCHS.Rates were statistically weighted to reflect the national population. In a separateanalysis, differences in access shown in the graph remained statistically significantafter adjusting for confounding factors including age, gender, race/ethnicity,poverty status, parental education, living arrangement, region, place of residence,and health status (Newacheck et al. 2000).
Chart 3–5: Effect of Having a Regular Source of Health Care on Accessto Preventive Care. Data are from the 1998 National Health Interview Survey(see Chart 1–2 for description). Respondents who had never heard of the testor who reported a test within an unknown time period were considered missingresponses. In a separate analysis controlling for age, race, education, and insurancecoverage, those with a usual source of care were 3.5 to 5.2 times more likelyto receive screening tests than those without a usual source of care (Breen etal. 2001).
Chart 3–6: Timely Initiation of Prenatal Care. The National Vital StatisticsSystem, administered by the NCHS, obtains data on prenatal care and race/ethnicity as recorded on birth certificates for the 50 states and the District ofColumbia. Data on ethnicity was available for 22 states in 1980, 23 states andthe District of Columbia (D.C.) for 1985, 48 states and D.C. for 1990, and 50 states and D.C. for 1995 and 1999; data on race was available for all statesand D.C. in all years shown (Eberhardt et al. 2001, Table 6).
Leatherman and McCarthy, Quality of Health Care in the United States: A Chartbook, 2002. The Commonwealth Fund 149
Chart 3–7: Dental Care. Data are from the 1999 National Health InterviewSurvey (see Chart 1–2 for description). The rate for the total population (age 2and older) is age-standardized to the 2000 population. The elderly includes thosewithout teeth, which represent about 29–30 percent of people age 65 and older.In 1997–1999, about 70 percent of elderly people with teeth visited a dentistin the past year, compared to only 17–18 percent of those without teeth(Eberhardt et al. 2001, Table 80).
Chart 4–1: Perceptions of Health Care Quality. Data for the pie chart onpublic perceptions are from a Gallup poll of 1,005 adults conducted November8–11, 2001, with a sampling error of 3 percent (National Journal Poll Track2001). The Commonwealth Fund International Health Policy Survey wasconducted by mail, telephone, and Internet from April to July 2000 by HarrisInteractive and included 528 generalist physicians and a sample of cardiologists,gastroenterologists, and oncologists in the U.S., with a sampling error of 4percent (Blendon et al. 2001).
Chart 4–2: Public Perceptions of the Health Care System. Data are fromthe following public opinion polls: (1) Harris, January 26, 2000; (2) Harris,May 10, 2000; (3) Harvard School of Public Health/ICR, August 16, 2000;(4) Harris, May 10, 2000; (5) Harris, July 19, 2000; and (6) Harvard Schoolof Public Health/ICR, August 16, 2000 (Blendon and Benson 2001).
Chart 4–3 to 4–5: Consumer Assessment of Health Plans (CAHPS®).CAHPS® is a set of standard surveys and report templates established by theAgency for Healthcare Research and Quality and administered by mail ortelephone to a random sample of health plan enrollees by independent surveyvendors, following a standard protocol, with target response rates of 55 percentfor commercial plans and 45 percent for Medicaid plans (NCQA 2001c;www.ahrq.gov). Separate instruments are used for adults to rate their ownexperience and for parents concerning the experience of their children. TheNational Committee for Quality Assurance reports aggregate CAHPS® dataon commercial and Medicaid health plans collected as part of the Health PlanEmployer Data and Information Set (NCQA 2001b). Aggregate data onMedicare health plans is reported by the Centers for Medicare and MedicaidServices, which contracts with a single vendor to administer a MedicareCAHPS® survey (CMS 2001b).
Chart 4–6: Patient Reports of Problems with Hospital Care. Picker surveys were developed from research into which issues patients considerimportant and were extensively pilot-tested. Data are from about 47,576completed surveys (response rate 46%) that were mailed to all patients or arandom sample of patients within one month of discharge from 272 U.S.hospitals during a one-year period in 1998–1999. A total of 40 questions wereasked about seven dimensions of care; a dimension score of zero means therewere no reported problems, while 100 means all items were rated a problem(Coulter and Cleary 2001).
Chart 4–7: Time Spent with Physician. Data from the 1989–1999 NationalAmbulatory Medical Care Survey (see Chart 1–5 for description) included24,715 to 43,469 sampled visits per year (response rate 68% to 74% over the10-year period). The physician or his/her staff provided data about the durationof each sampled visit. The Socioeconomic Monitoring System is conductedby the American Medical Association among nonfederal physicians engagedprimarily in patients care (response rate 52% to 72% over the 10-year period).“The average duration of an office visit was estimated by dividing the averagenumber of hours the physician reported spending with patients in his or heroffice each week by the average number of patients the physician reportedseeing per week.” The increase in office visit duration from 1989 to 1998 wasstatistically significant for both surveys (Mechanic, McAlpine, and Rosenthal 2001).
Charts 4–8 to 4–10: Satisfaction with Nursing Home Care. The NationalNursing Home Survey was based on a telephone survey conducted by ICR/International Communications Research from April 23, 2001 to June 3, 2001among a randomly selected, nationally representative sample of 1,309 adults (age18 and older). Data shown in the charts represents a subsample of 323 respondentswith “substantial nursing home experience” (as defined in the footnote on thechart), with a sampling error of 6 percentage points (NewsHour with Jim Lehrer/Kaiser Family Foundation/Harvard School of Public Health 2001).
Chart 5–1: Racial/Ethnic Disparity in Preventive Care. Data are from thesecond (1998–1999) Household Survey, a nationally representative telephonesurvey of more than 60,000 persons in 33,000 families living in 60 communities,as part of the Center for Studying Health System Change Community TrackingStudy. Results are weighted to be representative of the U.S. civilian, noninsti-tutionalized population (Hargraves 2001).
Leatherman and McCarthy, Quality of Health Care in the United States: A Chartbook, 2002. The Commonwealth Fund 150
Chart 5–2: Racial Disparity in Lung Cancer Surgery and Survival. Dataincluded 10,984 black and white patients age 65 and older diagnosed withresectable, non-small-cell lung cancer (stage I or II) between 1985 and 1993in 10 study areas of the Surveillance, Epidemiology, and End Results (SEER)program. Data are from linked SEER registry database and Medicare hospitaldischarge records. In a separate analysis, black patients were about half as likelyas whites to undergo surgery after controlling for factors that predict candidacyfor surgery: age, gender, stage of disease, income (by ZIP code area), andcoexisting illness (Bach et al. 1999).
Chart 5–3: Racial Disparity in Use of Invasive Heart Procedures. Dataincluded 12,402 black and white patients who underwent a first cardiaccatheterization at Duke University Medical Center from March 1984 throughDecember 1992 and were found to have obstructive coronary disease. Patientswere excluded if they had previously undergone revascularization, underwentcatheterization primarily for evaluation of ventricular arrhythmia, had substantialvalvular disease, underwent only selected right or left angiography, or hadincomplete clinical histories. Patients were contacted yearly (for an average offive years) to track their status and determine whether they had received anyrevascularization procedure. Differences in rates discussed in the narrative reflectodds ratios that were adjusted to take into account baseline demographiccharacteristics, severity of disease, coexisting illness, and access to subspecialtycardiology care. Difference in five-year survival reported in the narrative wasadjusted for baseline prognostic factors (Peterson et al. 1997).
Chart 5–4: Gender Disparity in Heart Attack Treatment. The study population included 138,956 Medicare patients with confirmed acute myocardialinfarction admitted directly to hospitals in 46 states and Puerto Rico during1995–1995 (Gan et al. 2000). Ideal candidates for therapy are those who meteligibility criteria and had no documented contraindications. The graph includesonly drug therapies with statistically significant differences in rates of use amongwomen vs. men, as determined in a separate analysis that controlled for theeffects of age, race, severity of illness, and geographic region. Crude rates areshown in the graph, while adjusted differences (odds) are described in thenarrative. We did not include invasive procedures in the chart due to uncertaintyabout overuse or underuse. Although the study reported no significant differencebetween women and men in short-term adjusted survival rates, longer-termoutcomes need to be measured to determine the full impact of the disparities.
Chart 5–5: Racial Disparity in Access to Kidney Transplants. Data werederived from medical records and a survey of a random sample of 1,518 Medicarepatients age 18 to 54 with end stage renal disease who started kidney dialysisin five states (Alabama, southern California, Michigan, Maryland, and Virginia)and the District of Columbia between May 1996 and June 1997. Survey responseswere obtained for 1,169 (77 percent) of these patients, part of a cohort of 1,392patients in another study that served as the source of data on patient preferencesshown in the chart (Ayanian et al 1999). Appropriateness ratings were based ona literature review and the judgments of an expert panel. Data shown in thechart are unadjusted rates, using referral rates from the chart review. In a separateanalysis, blacks remained significantly less likely to be referred for evaluation, tobe placed on a waiting list, and to receive a transplant after controlling for theeffects of potentially confounding sociodemographic, clinical, and access factors.Although blacks were less likely than whites to be clinically appropriate candidatesfor transplants and to desire a transplant, significant disparity remained evenafter controlling for these factors (Epstein et al. 2000).
Chart 5–6: Racial Disparity in Cancer Pain Management. Data for thefirst study was collected from a survey of 1,308 outpatients with metastatic cancerand their physicians at 54 academic or community hospitals and practices fromOctober 1990 to September 1991; patients who had surgery in the last 30 daysor who were too ill or unable to comprehend the survey were not included.Adequacy of pain was assessed based on World Health Organization guidelinesusing a pain management index that compared patients’ reported severity of painto the most potent analgesic prescribed them. Inadequate pain management isdefined as a negative score on the pain management index. In a separate analysis,minorities were three times more likely to have inadequate pain management(Cleeland et al. 1994). The second study included 13,625 cancer patients age65 and older who were discharged from the hospital to nursing homes in fivestates (Kansas, Maine, Mississippi, New York, and South Dakota) from 1992 to1995. Nursing home personnel recorded pain medications and assessed whethereach resident complained or showed evidence of daily pain over a seven-dayperiod. Crude rates shown in the chart were calculated by the Chartbookauthors from data in Table 4 of the source. In a separate analysis controllingfor potential confounding factors, African-Americans were 63 percent morelikely than white residents not to receive any pain medication when in dailypain (Bernabei et al. 1998).
Leatherman and McCarthy, Quality of Health Care in the United States: A Chartbook, 2002. The Commonwealth Fund 151
Chart 5–7: Effect of Race/Ethnicity and Language on Parents’Assessments of Pediatric Care. Results shown in the chart represent regression beta-coefficients relative to white parents, controlling for parent’sage, gender, and education, as well as child’s health status. Data were derivedfrom the National Consumer Assessment of Health Plans BenchmarkingDatabase 1.0, including 9,540 children (under age 18) enrolled in Medicaidmanaged health care plans in Arkansas, Kansas, Minnesota, Oklahoma,Vermont,and Washington state in 1997 and 1998. Surveys were administered in Englishand Spanish by phone and mail (42% average response rate). Language forHispanic and Asian parents was based on what she/he reported primarilyspeaking at home. Ratings for non-English-speaking Hispanic and Asian parents were significantly different from white parents, except for “GettingNeeded Care” for Hispanic Spanish-speaking parents. Ratings for English-speaking Hispanic and Asian parents were not significantly different fromwhite parents (Weech-Maldonado et al. 2001).
Chart 6–1: Improving Immunization Rates. This chart presents the resultsof a Cochrane systematic review of 41controlled studies published through 1998evaluating the effects of patient reminders for immunizations that were due orimmunization visits that were upcoming, and recall for immunizations that wereoverdue. Studies included randomized controlled trials, controlled before-and-after studies, and interrupted time series studies that met explicit review criteria.The chart shows absolute (percentage point) change in immunization ratesfrom the study. The study also reported weighted, pooled odds ratios forbeing up-to-date or having received vaccinations, as described in the chartnarrative. The odds ratios corresponding to the categories shown in the chartwere statistically significant (Szilagyi et al. 2000).
Chart 6–2: Reducing Unnecessary Antibiotic Use. This was a prospective,nonrandomized, controlled trial measuring antibiotic prescribing for consecutivepatients with uncomplicated acute bronchitis visiting four selected primarycare practices of a group-model health maintenance organization in Denver,Colorado. The sample included 2,462 adult patients at baseline (November1996 to February 1997) and 2,027 in the study period (November 1997 to
February 1998). The change in the antibiotic prescribing rate for the fullintervention site (as described in the chart narrative) was statistically significant.There was no significant change in prescribing at two control (usual care) sitesor at a limited, office-based educational intervention site. A separate analysisfound no increase in antibiotic prescribing for potential substitute diagnosesduring the intervention. Examples of educational materials can be viewed at:www.uchsc.edu/uh/gim/educate/bronchitis.html (Gonzales et al. 1999).
Chart 6–3: Improving Diabetes Management. This was a before-and-afterintervention trial based on two, separate random samples of medical records(380 at baseline in 1995 and 767 at post-intervention remeasurement in 1996)for Medicare patients with type 2 diabetes continuously enrolled for at leastone year in one of six Arizona managed care plans. The Medicare Peer ReviewOrganization (PRO) reviewed the records to determine the proportion of 14 quality indicator services that were provided to patients when needed duringa one-year period. Diabetes monitoring indicators included quarterly bloodpressure measurement, biannual foot exam, biannual glycosylated hemoglobintest, annual eye exam, annual lipid profile, and annual dipstick for urine protein.Diabetes education measures included diet, exercise, medication, and glucoseself-monitoring. Follow-up measured whether an ACE inhibitor was prescribedif the patient had hypertension or proteinuria, treatment was provided forhyperlipidemia, and patients with abnormal eye exams were referred to anophthalmologist (Marshall et al. 2000).
Chart 6–4: Improving Medical Treatment for Heart Attack. This before-and-after study used a pre-intervention sample of 13,946 hospital dischargesfrom June 1992 through December 1992, and a post-intervention sample of8,163 hospital discharges from August 1995 through November 1995, forMedicare patients with a principal diagnosis of acute myocardial infarction inAlabama, Connecticut, Iowa, and Wisconsin. Mortality comparisons usedhospital claims for all Medicare patients nationwide. There was no statisticallysignificant difference in mortality rates between intervention states and therest of the nation at baseline, while intervention states had a slightly but statisticallysignificant lower rate post-intervention (Marciniak et al. 1998).
Leatherman and McCarthy, Quality of Health Care in the United States: A Chartbook, 2002. The Commonwealth Fund 152
Chart 6–5: Improving Outcomes of Heart Bypass Surgery. This was abefore-and-after intervention study using clinical data collected on 15,095consecutive patients undergoing isolated coronary artery bypass graft (CABG)surgery in Maine, New Hampshire, and Vermont from July 1987 through July1993 (with expanded analysis through 1996). A multivariate regression model,which controlled for changes in patients undergoing CABG over time, wasused to predict hospital mortality during the post-intervention period incomparison to observed mortality rates, in order to judge the effects of theintervention, which is described in the chart narrative (O’Connor et al. 1996).
Chart 6–6: Improving Treatment and Outcomes for Depression. ThePartners in Care study was a group-level randomized controlled trial (seeChart 1–15 for description). The sample included 1,356 adult patients, with 913in the intervention group and 443 in the control group. Probable depressivedisorder was defined as having “two weeks or more of depressed mood or lossof interest in pleasurable activities during the last year or persistent depressionover the year, plus having at least one week of depression in the last 30 days.”Enrolled patients completed a telephone interview (95% response rate) and amail survey at baseline (88% response rate), with follow-up surveys every sixmonths (response rate 85% at six months and 83% at 12 months) during 1996–1997. There were no significant differences between intervention and controlpatients at baseline in use of services, health-related quality-of-life, or employmentstatus. Rates shown in the charts are adjusted values at 12-month follow-upfor the control group and combined intervention groups (the intervention isdescribed in the chart narrative). Differences between rates shown for controland intervention groups were statistically significant (Wells et al. 2000).
Chart 6–7: Reducing Pressure Ulcers in the Nursing Home. This studywas based on 144,379 observations recorded between 1991 and 1995 by nursinghome staff on Minimum Data Set resident assessments for 30,510 residents of107 National HealthCare Corporation nursing homes located in nine states.Six-month rates of pressure ulcer development were calculated as the proportionof residents without an ulcer who had a stage 2–4 ulcer on a subsequent assess-ment (stage 1 ulcers are difficult to detect and often do not worsen). Rates wererisk-adjusted to control for changes in resident characteristics. Residents witha readmission during any period were excluded from the analysis in that periodto ensure that any pressure ulcer developed in the nursing home. The temporaldecline in pressure ulcer development was statistically significant (Berlowitz etal. 2000).
Chart 6–8: Preventing Medication Mistakes. The study included all patientsadmitted to two general care medical units and one medical intensive care unitat Brigham and Women’s Hospital, Boston, a 700-bed academic tertiary-carehospital. Data were collected over four years. At baseline (51 days in October–November 1992), all prescriptions were written manually. At Period 1 (68 days,October–December 1993), a physician order entry system was implementedincluding medication name, dose, and frequency selection from standard lists;display of relevant laboratory results; limited drug-allergy checks; redundantmedication checking; and notification of a few life-threatening drug-to-druginteractions and drug-laboratory problems. At Period 2 (49 days, November–December 1995), improved drug-allergy checking was implemented. At Period3 (52 days, March–April 1997), improved drug-to drug interaction checkingwas implemented, along with improved potassium ordering rules. Medicationmistakes, adverse events, and potential adverse events were detected by:1) pharmacists during dispensing and solicited from nurses during daily visits,2) evaluation by trained reviewers of medication sheets received by the pharmacy,and 3) chart review by a study investigator (Bates et al. 1999).
Leatherman and McCarthy, Quality of Health Care in the United States: A Chartbook, 2002. The Commonwealth Fund 153
ReferencesAdams, D. 2001. Push to improve patient safety slow-going. American Medical
News, 7 May.
Adams, R. J., A. Fuhlbrigge, J. A. Finkelstein, et al. 2001. Impact of inhaledanti-inflammatory therapy on hospitalization and emergency departmentvisits for children with asthma. Pediatrics 107:706–711.
Agency for Healthcare Research and Quality (AHRQ). 1993. Treatment of majordepression: Clinical practice guideline Number 5. Washington, D.C.: U.S.Department of Health and Human Services.
Agency for Healthcare Research and Quality (AHRQ). 1999. Treatment ofdepression—newer pharmacotherapies: Evidence report/technology assessmentNumber 7. Washington, D.C.: U.S. Department of Health and HumanServices.
American Cancer Society (ACS). 2001. Cancer facts & figures 2001. Atlanta, Ga.:American Cancer Society.
American College of Physicians/American Society of Internal Medicine(ACP/ASIM). 2000. No health insurance? It’s enough to make you sick.Scientific research linking the lack of health coverage to poor health. Washington,D.C.: ACP/ASIM.
American Diabetes Association (ADA). 2001. Facts & figures:The impact of dia-betes. Alexandria,Va.: American Diabetes Association.
American Gastroenterological Association (AGA). 1997. Colorectal cancerscreening: Clinical guidelines and rationale. Gastroenterology 112:594–642.
American Heart Association (AHA). 2001. Heart and stroke statistical update.Dallas, Tex.: American Heart Association.
American Hospital Association (AHA). 1996. Eye on Patients. Chicago:American Hospital Association and the Picker Institute.
American Medical Association (AMA). 2001. Colorectal cancer: Screening andsurveillance. Quality Care Alert, 12 July.
Aparasu, R. R., and J. R. Mort. 2000. Inappropriate prescribing for the elderly:Beers criteria-based review. Annals of Pharmacotherapy 34:338–346.
Asch, S. M., E. A. Kerr, E. G. Hamilton, et al., eds. 2000. Quality of care foroncologic conditions and HIV: A review of the literature and quality indicators.Santa Monica, Calif.: RAND Health.
Ayanian, J. Z., P. D. Cleary, J. S. Weissman, et al. 1999. The effect of patients’preferences on racial differences in access to renal transplantation. NewEngland Journal of Medicine 341:1661–1669.
Ayanian, J. Z., J. S. Weissman, E. C. Schneider, et al. 2000. Unmet healthneeds of uninsured adults in the United States. Journal of the AmericanMedical Association 284:2061–2069.
Bach, P. B., L. D. Cramer, J. L. Warren, et al. 1999. Racial differences in thetreatment of early-stage lung cancer. New England Journal of Medicine341:1198–1205.
Balas, E. A., S. Weingarten, C. T. Garb, et al. 2000. Improving preventive careby prompting physicians. Archives of Internal Medicine 160:301–308.
Barron, H. V., L. J. Bowlby, R. Breen, et al. 1998. Use of reperfusion therapyfor acute myocardial infarction in the United States: Data from theNational Registry of Myocardial Infarction 2. Circulation 97:1150–1156.
Bartlett, J. G., S. F. Dowell, L. A. Mandell, et al. 2000. Practice guidelines forthe management of community-acquired pneumonia in adults. ClinicalInfectious Diseases 31:347–382.
Bates, D. W., D. J. Cullen, N. Laird, et al. 1995. Incidence of adverse drugevents and potential adverse events. Journal of the American MedicalAssociation 274:29–34.
Bates, D. W., N. Speil, D. J. Cullen, et al. 1997. The costs of adverse drugevents in hospitalized patients. Journal of the American Medical Association277:307–311.
Leatherman and McCarthy, Quality of Health Care in the United States: A Chartbook, 2002. The Commonwealth Fund 154
Bates, D. W., J. M. Teich, J. Lee, et al. 1999. The impact of computerized physician order entry on medication error prevention. Journal of theAmerican Medical Informatics Association 6:313–321.
Berlowitz, D. R., G. H. Brandeis, J. Anderson, et al. 1997. Effect of pressureulcers on the survival of long-term care residents. Journal of Gerontology:Medical Sciences 52A, M106–M110.
Berlowitz, D. R., H. Q. Bezerra, G. H. Brandeis, et al. 2000. Are we improv-ing the quality of nursing home care: The case of pressure ulcers. Journal ofthe American Geriatric Society 48:59–62.
Bernabei, R., G. Gambassi, K. Lapane, et al. 1998. Management of pain in elderlypatients with cancer. Journal of the American Medical Association279:1877–1882.
Bernstein, S. J., E. A. McGlynn, A. L. Siu, et al. 1993. The appropriateness ofhysterectomy: A comparison of care in seven health plans. Journal of theAmerican Medical Association 269:2398–2404.
Birkmeyer, J. D., and C. M. Birkmeyer. 2000. Leapfrog safety standards:The poten-tial benefits of universal adoption. Washington, D.C.: The Leapfrog Group.
Blendon, R. J., and J. M. Benson. 2001. Americans’ views on health policy: Afifty-year historical perspective. Health Affairs 20(2):33–46.
Blendon, R. J., C. Schoen, K. Donelan, et al. 2001. Physicians’ view on qual-ity of care: A five country comparison. Health Affairs 20(3):233–243.
Breen, N., D. K. Wagener, M. L. Brown, et al. 2001. Progress in cancer screen-ing over a decade: Results of cancer screening from the 1987, 1992, and1998 National Health Interview Surveys. Journal of the National CancerInstitute 93:1704–1713.
Brennan T. A., L. L. Leape, N. M. Laird, et al. 1991. Incidence of adverseevents and negligence in hospitalized patients: Results of the HarvardMedical Practice Study I. New England Journal of Medicine 324:370–376.
Brown, M. L., J. Lipscomb, and C. Snyder. 2001. The burden of illness of cancer:economic cost and quality of life. Annual Review of Public Health 22:91–113.
Centers for Disease Control and Prevention (CDC). 1995. Influenza andpneumococcal vaccination coverage levels among persons aged >=65years—United States, 1973–1993. Morbidity and Mortality Weekly Report44:506–515.
Centers for Disease Control and Prevention (CDC). 1997. Prevention of pneu-mococcal disease. Morbidity and Mortality Weekly Report 46(RR–8):1–24.
Centers for Disease Control and Prevention (CDC). 1998a. Demographiccharacteristics of persons without a regular source of medical care—select-ed states, 1995. Morbidity and Mortality Weekly Report 47:277–279.
Centers for Disease Control and Prevention (CDC). 1998b. Recommendationsof the Advisory Committee on Immunization Practices, the AmericanAcademy of Pediatrics, and the American Academy of Family Physicians:Use of reminder and recall by vaccination providers to increase vaccinationrates. Morbidity and Mortality Weekly Report 47:715–717.
Centers for Disease Control and Prevention (CDC). 1999. Reasons reportedby Medicare beneficiaries for not receiving influenza and pneumococcalvaccinations—United States, 1996. Morbidity and Mortality Weekly Report48:886–890.
Centers for Disease Control and Prevention (CDC). 2000a. Influenza, pneu-mococcal, and tetanus toxoid vaccination of adults—United States,1993–1997. Morbidity and Mortality Weekly Report 49(SS09):39–62.
Centers for Disease Control and Prevention (CDC). 2000b. Use of standingorders programs to increase adult vaccination rates. Morbidity and MortalityWeekly Report 49(RR–1):21–26.
Centers for Disease Control and Prevention (CDC). 2000c. Levels of diabetes-related preventive-care practices—United States, 1997–1999. Morbidity andMortality Weekly Report 49:954–957.
Centers for Disease Control and Prevention (CDC). 2001a. National, state, andurban area vaccination coverage levels among children aged 19–35months—United States, 2000. Morbidity and Mortality Weekly Report50:637–641.
Centers for Disease Control and Prevention (CDC). 2001b. Prevention andcontrol of influenza. Morbidity and Mortality Weekly Report 50(RR–4):1–35.
Centers for Disease Control and Prevention (CDC). 2001c. Trends in screen-ing for colorectal cancer—United States, 1997 and 1999. Morbidity andMortality Weekly Report 50:161–166.

Leatherman and McCarthy, Quality of Health Care in the United States: A Chartbook, 2002. The Commonwealth Fund 155
Centers for Disease Control and Prevention (CDC). 2001d. HIV andAIDS—United States, 1981–2000. Morbidity and Mortality Weekly Report50:430–434.
Centers for Disease Control and Prevention (CDC). 2002a. Pertussis—UnitedStates, 1997–2000. Morbidity and Mortality Weekly Report 51:73–76.
Centers for Disease Control and Prevention (CDC). 2002b. Early release ofselected estimates from the National Health Interview Survey. Data fromJanuary–June 2001 (Released 4 February). Hyattsville, Md.: NationalCenter for Health Statistics.
Centers for Medicare and Medicaid Services (CMS). 2000. National clinical top-ics for the Medicare health care quality improvement initiative. Washington, D.C.:U.S. Department of Health and Human Services.
Centers for Medicare and Medicaid Services (CMS). 2001a. Nursing home com-pare. Washington, D.C.: U.S. Department of Health and Human Services,www.medicare.gov/NHCompare/home.asp.
Centers for Medicare and Medicaid Services (CMS). 2001b. Medicare health plancompare (data tables). Washington, D.C.: U.S. Department of Health andHuman Services, http://www.medicare.gov/mphCompare/home.asp.
Chassin, M. R. 1997. Assessing strategies for quality improvement. HealthAffairs 16(3):151–161.
Chassin, M. R., J. Kosecoff, R. E. Park, et al. 1987. Does inappropriate useexplain geographic variations in the use of health care services? Journal ofthe American Medical Association 258:2533–2537.
Cleary, P. D., S. Edgman-Levitan, M. Roberts, et al. 1991. Patients evaluatetheir hospital care: A national survey. Health Affairs 10(4):254–267.
Cleeland, C. S., R. Gonin, A. K. Hatfield, et al. 1994. Pain and its treatmentin outpatients with metastatic cancer. New England Journal of Medicine330:592–596.
Collins, K. S., A. Hall, and C. Neuhaus. 1999. U.S. minority health:A chartbook.New York: The Commonwealth Fund.
Colmers, J. M., D. M. Fox, S. Praeger, et al. 1999. Pediatric dental care in CHIPand Medicaid. New York: Milbank Memorial Fund and The ReformingStates Group, www.milbank.org/990716mrpd.html.
Cooper, R. J., J. R. Hoffman, J. G. Bartlett, et al. 2001. Principles of appro-priate antibiotic use for acute pharyngitis in adults: background. Annals ofInternal Medicine 134:509–517.
Coulter A. 2001. Patient engagement (invited paper). London: TheCommonwealth Fund and the Nuffield Trust.
Coulter, A., and P. D. Cleary. 2001. Patients’ experiences with hospital care infive countries. Health Affairs 20(3):244–252.
Department of Health and Human Services (DHHS). 2000. Healthy people2010: Understanding and improving health. 2nd ed. Washington, D.C.:Government Printing Office.
Department of Health and Human Services (DHHS). 2001. HHS to providenursing home quality information to increase safety and quality in nursing homes(press release). Washington, D.C.: U.S. Department of Health and HumanServices, 19 November.
Donelon, K., R. J. Blendon, C. Schoen, et al. 1999. The cost of health systemchange: public discontent in five nations. Health Affairs 18(3):206–216.
Dubay, T. Joyce, R. Kaestner, et al. 2001. Changes in prenatal care timing andlow birth weight by race and socioeconomic status: implications for theMedicaid expansions for pregnant women. Health Services Research362:373–398.
Dwight-Johnson, M., C. D. Sherbourne, D. Liao, et al. 2000. Treatment pref-erences among depressed primary care patients. Journal of General InternalMedicine 15:527–534.
Dwight-Johnson, J., J. Unützer, C. Sherbourne, et al. 2001. Can qualityimprovement programs for depression in primary care address patient pref-erences for treatment? Medical Care 39:934–944.
Eberhardt, M.S., D. D. Ingram, D. M. Makuc, et al. 2001. Health, United States,2001 (with updated tables as of October 2001). Hyattsville, Md.: NationalCenter for Health Statistics.
Eisenberg, J. M. 2001. Overview of the issue. Health Services Research 36:443–446.
Epstein, A. M., J. Z. Ayanian, J. H. Keogh, et al. 2000. Racial disparities inaccess to renal transplantation. New England Journal of Medicine343:1537–1544.
Leatherman and McCarthy, Quality of Health Care in the United States: A Chartbook, 2002. The Commonwealth Fund 156
Fendrick, A. M., P. M. Ridker, B. S. Bloom. 1994. Improved health benefitsof increased use of thrombolytic therapy. Archives of Internal Medicine154:1605–1609.
Ferlie, E. B., and S. M. Shortell. 2001. Improving the quality of health care inthe United Kingdom and the United States: A framework for change.Milbank Quarterly 79:281–315.
Fiscella, K., P. Franks, M. R. Gold, et al. 2000. Inequality in quality:Addressing socioeconomic, racial, and ethnic disparities in health care.Journal of the American Medical Association 283:2579–2584.
Fiscella, K., P. Franks, M. P. Doescher, et al. 2002. Disparities in health care byrace, ethnicity, and language among the insured: Findings from a nationalsample. Medical Care 40:52–59.
Flores, G., M. Abreu, M. A. Olivar, et al. 1998. Access barriers to health carefor Latino children. Archives of Pediatric and Adolescent Medicine152:1119–1125.
Freudenheim, M. 2000. Companies start fund to reward hospitals for bettercare. The New York Times, 18 January.
Gan, S. C., S. K. Beaver, P. M. Houck, et al. 2000. Treatment of acute myocar-dial infarction and 30-day mortality among women and men. New EnglandJournal of Medicine 342:8–15.
General Accounting Office (GAO). 1995. Prescription drugs and the elderly: Manystill receive potentially harmful drugs despite recent improvements. Report No.GAO/HEHS–95–152. Washington, D.C.: U.S. General Accounting Office.
Gerteis, M., S. Edgman-Levitan, J. Daley, et al, eds. 1993. Through the patient’seyes: Understanding and promoting patient-centered care. San Francisco: Jossey-Bass Publishers.
Gibson, P. G., J. Coughlan, A. J. Wilson, et al. 2001. Self-management educa-tion and regular practitioner review for adults with asthma (Cochranereview). In The Cochrane Library 3, Oxford: Update Software.
Gonzales, R., J. F. Steiner, A. Lum, et al. 1999. Decreasing antibiotic use inambulatory practice: Impact of a multidimensional intervention on thetreatment of uncomplicated acute bronchitis in adults. Journal of theAmerican Medical Association 281:1512–1519.
Gonzales, R., J. F. Steiner, J. Maselli, et al. 2001. Impact of reducing antibiot-ic prescribing for acute bronchitis on patient satisfaction. Effective ClinicalPractice 4(3):105–11.
Gorelick, P. B., R. L. Sacco, D. B. Smith, et al. 1999. Prevention of a firststroke: A review of guidelines and a multidisciplinary consensus statementfrom the National Stroke Association. Journal of the American MedicalAssociation 281:1112–1120.
Guadagnoli, E., A. M. Epstein, A. Zaslavsky, et al. 2000. Providing consumerswith information about the quality of health plans: The ConsumerAssessment of Health Plans demonstration in Washington State. JointCommission Journal of Quality Improvement 26:410–420.
Guadagnoli, E., P. J. Hauptman, J. Z. Ayanian, et al. 1995. Variation in the useof cardiac procedures after acute myocardial infarction. New England Journalof Medicine 333:573–578.
Halterman, J. S., C. A. Aligne, P. Auinger, et al. 2000. Inadequate therapy forasthma among children in the United States. Pediatrics 105:272–276.
Hammermeister, K. E., A. L. Shroyer, G. K. Sethi, et al. 1995. Why it isimportant to demonstrate linkages between outcomes of care and processesand structures of care. Medical Care 33(10 Supplement):OS5–16.
Hargraves, L. J. 2001. Race, ethnicity and preventive services: no gains for Hispanics. IssueBrief No. 34.Washington, D.C.: Center for Studying Health System Change.
Harrington, C., H. Carrillo, and V. Wellin. 2001. Nursing facilities, staffing, resi-dents, and facility deficiencies, 1994 through 2000. San Francisco: University ofCalifornia, Department of Social and Behavioral Sciences.
Hawley, S. T., J. A. Earp, M. O’Malley, et al. 2000. The role of physician rec-ommendation in women’s mammography use: Is it a 2-stage process?Medicare Care 38:392–402.
Heffler, S., K. Levit, S. Smith, et al. 2001. Health spending growth up in 1999.Health Affairs 20(2):193–203.
Hemingway H., A. M. Crook, G. Feder, et al. 2001. Underuse of coronaryrevascularization procedures in patients considered appropriate candidatesfor revascularization. New England Journal of Medicine 344:645–654.
Leatherman and McCarthy, Quality of Health Care in the United States: A Chartbook, 2002. The Commonwealth Fund 157
Hilborne, L. H., L. L. Leape, S. J. Bernstein, et al. 1993. The appropriatenessof use of percutaneous transluminal coronary angioplasty in New YorkState. Journal of the American Medical Association 269:761–765.
Institute of Medicine (IOM). 1986. Improving the quality of care in nursing homes,edited by J. Takeuchi, R. Burke, and M. McGeary. Washington, D.C.:National Academy Press.
Institute of Medicine (IOM). 1990. Medicare:A strategy for quality assurance, edit-ed by Kathleeen Lohr. Washington, D.C.: National Academy Press: 21.
Institute of Medicine (IOM). 1993. Access to health care in America. Washington,D.C.: National Academy Press.
Institute of Medicine (IOM). 2000. To err is human: Building a safer health sys-tem, edited by L. T. Kohn, J. M. Corrigan, and M. S. Donaldson.Washington, D.C.: National Academy Press.
Institute of Medicine (IOM). 2001a. Crossing the quality chasm:A new health sys-tem for the 21st century, edited by J. M. Corrigan, M. S. Donaldson, L. T.Kohn, et al. Washington, D.C.: National Academy Press.
Institute of Medicine (IOM). 2001b. Envisioning the national health care qualityreport, edited by M. P. Hurtado, E. K. Swift, Janet M. Corrigan, et al.Washington, D.C.: National Academy Press.
Institute of Medicine (IOM). 2001c. Coverage matters: Insurance and health care.Washington, D.C.: National Academy Press.
Jencks, S. F., T. Cuerdon, D. R. Burwen, et al. 2000. Quality of medical caredelivered to Medicare beneficiaries: A profile at state and national levels.Journal of the American Medical Association 284:1670–1676.
Johnson, H. P. 1999. How many Californians? A review of population projectionsfor the state. California counts, population trends and profiles. San Francisco:Public Policy Institute of California.
Johnson, M. F., and A. M. Kramer. 2000. Quality of care problems persist in nurs-ing homes despite improvements since the nursing home reform act. Paper preparedfor the Institute of Medicine Committee on Improving Quality in Long-Term Care. Washington, D.C.: Institute of Medicine.
Joint Commission on Accreditation of Healthcare Organizations (JCAHO). 2001.A follow-up review of wrong site surgery. Sentinel Event Alert 24, 5 December.
Kaiser Family Foundation/Agency for Healthcare Research and Quality(KFF/AHRQ). 1996. Americans as health care consumers:The role of qualityinformation. Menlo Park, Calif.: Kaiser Family Foundation/Agency forHealthcare Research and Quality.
Kaiser Family Foundation (KFF). 2001. Hablamos Juntos: Improving patient-provider communication for Latinos. Fact Sheet. Menlo Park, Calif.: KaiserFamily Foundation.
Kramarow, E., H. Lentzner, R. Rooks, et al. 1999. Health, United States, 1999.Hyattsville, Md.: National Center for Health Statistics.
Kerr, E. A., S. A. Asch, E. G. Hamilton, et al., eds. 2000. Quality of care for car-diopulmonary conditions: A review of the literature and quality indicators. SantaMonica, Calif.: RAND Health.
Kressin, N. R., and L. A. Petersen. 2001. Racial differences in the use of inva-sive cardiovascular procedures: Review of the literature and prescriptionfor future research. Annals of Internal Medicine 135:352–366.
Leape L. L., T. A. Brennan, N. Laird, et al. 1991. The nature of adverse eventsin hospitalized patients: Results of the Harvard Medical Practice Study II.New England Journal of Medicine 324:377–384.
Leapfrog Group. 2002. Patient safety survey results summary. Washington, D.C.:The Leapfrog Group, www.leapfroggroup.org.
Legler, J., H. I. Meissner, C. Coyne, et al. 2002. The effectiveness of interven-tions to promote mammography among women with historically lowerrates of screening. Cancer Epidemiology Biomarkers & Prevention 11:59–71.
Lesar, T. S., B. M. Lomaestro, and H. Pohl. 1997. Medication-prescribingerrors in a teaching hospital: A 9-year experience. Archives of InternalMedicine 157:1569–1576.
Levit K., C. Smith, C. Cowan, et al. 2002. Inflation spurs health spending in2000. Health Affairs 21(1):172–181.
Linder, J. A., and R. S. Stafford. 2001. Antibiotic treatment of adults with sorethroat by community primary care physicians: A national survey,1989–1999. Journal of the American Medical Association 286:1181–1186.
Lindley, C., M. Tully,V. Parmasothy, et al. 1992. Inappropriate medication is amajor cause of adverse drug reactions in elderly patients. Age and Ageing21:294–300.

Leatherman and McCarthy, Quality of Health Care in the United States: A Chartbook, 2002. The Commonwealth Fund 158
MacKay, A. P., L. A. Fingerhut, and C. R. Duran. 2000. Health, United States,2000. Hyattsville, Md.: National Center for Health Statistics.
Marciniak, T. A., E. F. Ellerbeck, M. J. Radford, et al. 1998. Improving thequality of care for Medicare patients with acute myocardial infarction:Results from the Cooperative Cardiovascular Project. Journal of theAmerican Medical Association 279:1351–1357.
Marshall, C. L., M. Bluestein, E. Briere, et al. 2000. Improving outpatient dia-betes management through a collaboration of six competing, capitatedMedicare managed care plans. American Journal of Medical Quality 15(2):65–71.
Marshall, M., P. Shekelle, S. Leatherman, et al. 2000. What do we expect togain from the public release of performance data? A review of the evi-dence. Journal of the American Medical Association 283:1866–1874.
Massachusetts General Hospital (MGH). 1998. Warfarin continues to be underusedas stroke preventive (press release). Boston: Massachusetts General Hospital,8 April.
McGlynn, E. A., and R. H. Brook. 2001. Evaluating the quality of care. InChanging the U.S. health care system, edited by R. M. Andersen, T. H. Rice,and G. F. Kominski. San Francisco: Jossey-Bass, 161–161; 165–167.
McGlynn, E. A., E. A. Kerr, C. L. Damberg, et al., eds. 2000. Quality of carefor women: A review of selected clinical conditions and quality indicators. SantaMonica, Calif.: RAND Health.
McGovern, P. G., D. R. Jacobs, E. Shahar, et al. 2001. Trends in acute coro-nary heart disease mortality, morbidity, and medical care from 1985through 1997: The Minnesota heart survey. Circulation 104:19–24.
McPherson, M., P. Arango, H. B. Fox, et al. 1998. A new definition of chil-dren with special health care needs. Pediatrics 102:127–140.
Mechanic, D., D. D. McAlpine, and M. Rosenthal. 2001. Are patients’ officevisits with physicians getting shorter? New England Journal of Medicine344:198–204.
Meehan, T. P., M. J. Fine, H. M. Krumholz, et al. 1997. Quality of care,process, and outcomes in elderly patients with pneumonia. Journal of theAmerican Medical Association 278:2080–2084.
Meehan, T. P., S. R. Weingarten, E. S. Holmboe, et al. 2001. A statewide ini-tiative to improve the care of hospitalized pneumonia patients: TheConnecticut pneumonia pathway project. American Journal of Medicine111:203–210.
Meredith, S., P. H. Feldman, D. Frey, et al. 2001. Possible medication errors inhome healthcare patients. Journal of the American Geriatrics Society 49:719–724.
Modifi, M., R. G. Rozier, and R. S. King. 2002. Problems with access to den-tal care for Medicaid-insured children: What caregivers think. AmericanJournal of Public Health 92:53–58.
Mokdad, A. H., E. S. Ford, B. A. Bowman, et al. 2000. Diabetes trends in theU.S.: 1990–1998. Diabetes Care 23:1278–1283.
Mukamel, D. B. 1997. Risk-adjusted outcome measures and quality of care innursing homes. Medical Care 35:367–385.
National Committee for Quality Assurance (NCQA). 2001a. The state of man-aged care quality: 2001. Washington, D.C.: NCQA.
National Committee for Quality Assurance (NCQA). 2001b. National results forselected 2000 HEDIS® and HEDIS/CAHPS® measures: Commercial auditCAHPS® global proportions; commercial child CAHPS® global proportions;Medicaid adult CAHPS® global proportions. Washington, D.C.: NCQA.
National Committee for Quality Assurance (NCQA). 2001c. HEDIS® 2002Narrative:What’s in it and why it matters. Washington, D.C.: NCQA.
National Institute of Dental and Craniofacial Research (NIDCR). 2000. Oralhealth in America: A report of the Surgeon General. Rockville, Md.: U.S.Department of Health and Human Services.
National Journal Poll Track. 2001. Gallup poll conducted 8–11 November,released 26 November. Washington, D.C.: National Journal.
Newacheck, P. W., M. McManus, H. B. Fox, et al. 2000. Access to health carefor children with special health care needs. Pediatrics 105:760–766.
NewsHour with Jim Lehrer/Kaiser Family Foundation/Harvard School ofPublic Health (NewsHour/KFF/HSPH). 2001. National survey on nursinghomes. Menlo Park, Calif.: The Henry J. Kaiser Family Foundation.
Leatherman and McCarthy, Quality of Health Care in the United States: A Chartbook, 2002. The Commonwealth Fund 159
Niederman, M. S., L. A. Mandell, A. Anzueto, et al.; American ThoracicSociety. 2001. Guidelines for the management of adults with community-acquired pneumonia. American Journal of Respiratory and Critical CareMedicine 163:1730–1754.
O’Connor, G. T., S. K. Plume, E. M. Olmstead, et al. 1996. A regional inter-vention to improve the hospital mortality associated with coronary arterybypass graft surgery. Journal of the American Medical Association 275:841–846.
O’Malley, M. S., J. L. Earp, S. T. Hawley, et al. 2001. The association ofrace/ethnicity, socioeconomic status, and physician recommendation formammography: Who gets the message about breast cancer screening?American Journal of Public Health 91:49–54.
Oral Health America. 2002. Filling the gaps: Oral health in America. Chicago:Oral Health America.
Partnership for Prevention (PFP). 2001. Priorities in prevention: Oral health.Washington, D.C.: Partnership for Prevention.
Peterson, E. D., L. K. Shaw, E. R. DeLong, et al. 1997. Racial variation in theuse of cornary-revascularization procedures. New England Journal ofMedicine 336:480–486.
Phillips, K. A., K. Kerlikowske, L. C. Baker, et al. 1998. Factors associated withwomen’s adherence to mammography screening guidelines. Health ServicesResearch 33:29–54.
President’s Advisory Commission on Consumer Protection and Quality in theHealth Care Industry. 1998. Quality first: Better care for all Americans. Finalreport to the President of the United States. Washington, D.C.: U.S.Government Printing Office.
Rogers, W. J., J. G. Canto, C. T. Lambrew, et al. 2000. Temporal trends in thetreatment of over 1.5 million patients with myocardial infarction in the U.S.from 1990 through 1999: The National Registry of Myocardial Infarction1, 2 and 3. Journal of the American College of Cardiology 36:2056–63.
Ryan, T. J., J. L. Anderson, E. M. Antman, et al. 1996. ACC/AHA guidelinesfor the management of patients with acute myocardial infarction, a report ofthe American College of Cardiology/American Heart Association Task Forceon Practice Guidelines (Committee on Management of Acute MyocardialInfarction). Journal of the American College of Cardiology 28:1328–1428.
Ryan, T. J., E. M. Antman, N. H. Brooks, et al. 1999. ACC/AHA guidelinesfor the management of patients with acute myocardial infarction: 1999 update.Bethesda, Md.: American College of Cardiology/American HeartAssociation Task Force on Practice Guidelines (Committee onManagement of Acute Myocardial Infarction).
Scanlon, D. P., C. Darby, E. Rolph, et al. 2001. Use of performance informa-tion for quality improvement. Health Services Research 36:619–641.
Schaffer, S. J., S. G. Humiston, L. P. Shone, et al. 2001. Adolescent immu-nization practices: A national survey of U.S. physicians. Archives of Pediatricand Adolescent Medicine 155:566–571.
Schoenbaum, M., J. Unützer, C. Sherbourne, et al. 2001. Cost-effectiveness ofpractice-initiated quality improvement for depression: Results of a ran-domized controlled trial. Journal of the American Medical Association286:1325–1330.
Schuster, M. A., E. A. McGlynn, and R. H. Brook. 1998. How good is thequality of health care in the United States? Milbank Quarterly 76:517–563.
Sedlis, S. P.,V. J. Fisher, D. Tice, et al. 1997. Racial differences in performanceof invasive cardiac procedures in a Department of Veterans Affairs MedicalCenter. Journal of Clinical Epidemiology 50:899–901.
Seppala, H., T. Klaukka, J. Vuopio-Varkila, et al. 1997. The effect of changes inthe consumption of macrolide antibiotics on erythromycin resistance ingroup A streptococci in Finland. New England Journal of Medicine337:441–446.
Shapiro, M. F., S. C. Morton, D. F. McCaffrey, et al. 1999. Variations in thecare of HIV-infected adults in the United States. Journal of the AmericanMedical Association 281:2305–2315.
Smith, J. P., and B. Edmonston. 1997. The new Americans: Economic, demographic,and fiscal effects of immigration. Washington, D.C.: National Academy Press.
Soumerai, S. B., T. J. McLaughlin, D. Spiegelman, et al. 1997. Adverse out-comes of underuse of beta-blockers in elderly survivors of acute myocar-dial infarction. Journal of the American Medical Association 277:115–121.
Spore, D. L.,V. Mor, P. Larrat, et al. 1997. Inappropriate drug prescriptions forelderly residents of board and care facilities. American Journal of Public Health87:404–409.
Leatherman and McCarthy, Quality of Health Care in the United States: A Chartbook, 2002. The Commonwealth Fund 160
Stuck, A. E., M. H. Beers, A. Steiner, et al. 1994. Inappropriate medicationuse in community-residing older persons. Archives of Internal Medicine154:2195–2200.
Szilagyi, P. G., C. Bordley, J. C. Vann, et al. 2000. Effect of patientreminder/recall interventions on immunization rates. Journal of the AmericanMedical Association 284:1820–1827.
Thomas, E. J., D. M. Studdert, J. P. Newhouse, et al. 1999. Costs of medicalinjuries in Utah and Colorado. Inquiry 36:255–264.
Thomas, E. J., D. M. Studdert, H. R. Burstin, et al. 2000. Incidence and typesof adverse events and negligent care in Utah and Colorado. Medical Care38:261–271.
Thorndike, A. N., N. A. Rigotti, R. S. Stafford, et al. 1998. National patternsin the treatment of smokers by physicians. Journal of the American MedicalAssociation 279:604–608.
Thorndike, A. N.,T. G. Ferris, R. S. Stafford, et al. 1999. Rates of U.S. physi-cians counseling adolescents about smoking. Journal of the National CancerInstitute 91:1857–1862.
Tobacman, J. K., P. Lee, B. Zimmerman, H. Kolder, et al. 1996. Assessment ofappropriateness of cataract surgery at ten academic medical centers in1990. Ophthalmology 103:207–215.
U.S. Census Bureau. 2001. Health insurance coverage: 2000—highlights.Washington, D.C.: U.S. Census Bureau.
U.S. Preventive Services Task Force (USPSTF). 1996. Guide to clinical preventiveservices, 2nd edition. Washington, D.C.: U.S. Department of Health andHuman Services.
U.S. Preventive Services Task Force (USPSTF). 2002. Screening for breast cancer.Washington, D.C.: Agency for Healthcare Research and Quality.
U.S. Renal Data System (USRDS). 2001. USRDS 2001 annual data report.Bethesda, Md.: National Institutes of Health, National Institute ofDiabetes and Digestive and Kidney Diseases.
Weech-Maldonado, R., L. S. Morales, K. Spritzer, et al. 2001. Racial and eth-nic differences in parents’ assessments of pediatric care in Medicaid man-aged care. Health Services Research 36:575–594.
Wells, K. B., W. Katon, B. Rogers, et al. 1994. Use of minor tranquilizers andantidepressant medications by depressed outpatients: Results from theMedical Outcomes Study. American Journal of Psychiatry 151:694–700.
Wells, K. B., M. Schoenbaum, J. Unützer, et al. 1999. Quality of care for pri-mary care patients with depression in managed care. Archives of FamilyMedicine 8:529–536.
Wells, K. B., C. Sherbourne, M. Schoenbaum, et al. 2000. Impact of dissem-inating quality improvement programs for depression in managed primarycare: A randomized controlled trial. Journal of the American MedicalAssociation 283:212–220.
Wells, K. B., R. Sturm, C. D. Sherbourne, et al. 1996. Caring for depression.Cambridge: Harvard University Press.
Wennberg, J. E., and M. M. Cooper, eds. 1999. The Dartmouth atlas of healthcare in the United States. Dartmouth Medical School/AHA Press.
Wennberg, J. E., and A. Gittelsohn. 1973. Small area variations in health caredelivery. Science 182:1102–1109.
Wilcox, S. M., D. U. Himmelstein, and S. Woolhandler. 1994. Inappropriatedrug prescribing for the community-dwelling elderly. Journal of theAmerican Medical Association 272:292–296.
Winslow, C. M., J. B. Kosecoff, M. Chassin, et al. 1988. The appropriatenessof performing coronary artery bypass surgery. Journal of the American MedicalAssociation 260:505–509.
World Health Organization (WHO). 2000. World health report 2000. Geneva:World Health Organization.
World Health Organization (WHO). 2001. WHO vaccine-preventable diseasemonitoring system, 2001 global summary. Geneva: World HealthOrganization.
Zhan, C., J. Sangl, A. S. Bierman, et al. 2001. Potentially inappropriate med-ication use in the community-dwelling elderly. Journal of the AmericanMedical Association 286:2823–2829.

The Commonwealth Fund
One East 75th Street
New York, NY 10021-2692
Telephone (212) 606-3800
Facsimile (212) 606-3500
www.cmwf.org
The Commonwealth Fund
The Commonwealth Fund is a private foundation established in 1918 by Anna M. Harkness with
the broad charge to enhance the common good. The Fund carries out this mandate by supporting
efforts that help people live healthy and productive lives, and by assisting specific groups with serious
and neglected problems. The Fund supports independent research on health and social issues and
makes grants to improve health care practice and policy.
The Fund’s two national program areas are improving health insurance coverage and access to care
and improving the quality of health care services. The Fund is dedicated to helping people become
more informed about their health care, and improving care for vulnerable populations such as children,
elderly people, low-income families, minority Americans, and the uninsured. An international program
in health policy is designed to stimulate innovative policies and practices in the United States and
other industrialized countries. In its own community, New York City, the Fund makes grants to
improve health care and enhance public spaces and services.