Embed Size (px)
Citation preview
Advanced Methodology for European Laeken Indicators
Deliverable 5.1
Quality of EU-SILC data
Version: 2011
Monique Graf, Ariane Wenger, and Desislava Nedyalkova
The project FP7–SSH–2007–217322 AMELI is supported by European Commissionfunding from the Seventh Framework Programme for Research.
http://ameli.surveystatistics.net/
II
Contributors to Deliverable 5.1
Chapter 1: Monique Graf and Ariane Wenger and Desislava Nedyalkova, Swiss FederalStatistical Office.
Chapter 2: Ariane Wenger and Desislava Nedyalkova, Swiss Federal Statistical Office.
Chapter 3: Desislava Nedyalkova, Swiss Federal Statistical Office.
Main responsibility
Monique Graf, Ariane Wenger, and Desislava Nedyalkova, Swiss Federal Statistical Office.
Evaluators
Internal expert: Beat Hulliger, University of Applied Sciences Northwestern Switzer-land.
AMELI-WP5-D5.1
III
Aim and Objectives of Deliverable 5.1
EU regulations 1177/2003 and 28/2004 describe the quality reporting of EU-SILC andthe indicators on poverty and social exclusion as to be performed by the member stateswithin the ESS. Since EU-SILC is newly setup, implementation details of the differentEU surveys are needed to be known for building an appropriate methodology which takesinto consideration possible peculiarities of data and other concerns from praxis.
The aim of the work package consists of two issues:
1. Collecting metadata and quality information of the EU-SILC Laeken indicatorsincluding survey designs of the participating NSIs;
2. Further, possible peculiarities of data and procedures will be investigated as possibleinput for the simulation study.
The present report gives an overview of selected standard quality reports on SILC. Theoverview focuses on the AMELI relevant tasks such as the income variables and thesampling designs which are essentially needed as input for the simulation study.
© http://ameli.surveystatistics.net/ - 2011
Contents
1 Description and Quality of the EU-SILC User Database 2
1.1 Introduction . . . . . . . . . . . . . . . . . . . . . . . . . . . . . . . . . . . 2
1.2 User Database and Target Variables . . . . . . . . . . . . . . . . . . . . . . 2
1.2.1 Description of the UDB . . . . . . . . . . . . . . . . . . . . . . . . 3
1.2.2 Description of the Variables . . . . . . . . . . . . . . . . . . . . . . 4
1.2.3 Guidelines in Progress . . . . . . . . . . . . . . . . . . . . . . . . . 6
1.3 Indicators . . . . . . . . . . . . . . . . . . . . . . . . . . . . . . . . . . . . 6
1.4 Quality . . . . . . . . . . . . . . . . . . . . . . . . . . . . . . . . . . . . . . 6
1.4.1 Quality Reports . . . . . . . . . . . . . . . . . . . . . . . . . . . . . 7
1.4.2 Quality Documents . . . . . . . . . . . . . . . . . . . . . . . . . . . 11
1.4.3 Weighting . . . . . . . . . . . . . . . . . . . . . . . . . . . . . . . . 11
1.5 Variability . . . . . . . . . . . . . . . . . . . . . . . . . . . . . . . . . . . . 12
1.5.1 Extreme Income . . . . . . . . . . . . . . . . . . . . . . . . . . . . . 13
1.5.2 Variance . . . . . . . . . . . . . . . . . . . . . . . . . . . . . . . . . 13
1.6 Remarks . . . . . . . . . . . . . . . . . . . . . . . . . . . . . . . . . . . . . 13
2 Recommended and Provided Equivalised Income 14
2.1 Introduction . . . . . . . . . . . . . . . . . . . . . . . . . . . . . . . . . . . 14
2.1.1 Equivalised disposable income . . . . . . . . . . . . . . . . . . . . . 14
2.1.2 Equivalised household size . . . . . . . . . . . . . . . . . . . . . . . 15
2.1.3 Total disposable household income . . . . . . . . . . . . . . . . . . 15
2.2 Calculation of EQ SS and EQ INC i . . . . . . . . . . . . . . . . . . . . 16
2.2.1 Calculation of EQ SS . . . . . . . . . . . . . . . . . . . . . . . . . 17
2.2.2 Comparison with HX050 . . . . . . . . . . . . . . . . . . . . . . . 17
2.2.3 Calculation of EQ INCi . . . . . . . . . . . . . . . . . . . . . . . . 18
2.2.4 Comparison with HX090 . . . . . . . . . . . . . . . . . . . . . . . 18
2.3 Conclusion . . . . . . . . . . . . . . . . . . . . . . . . . . . . . . . . . . . . 22
AMELI-WP5-D5.1

3 Summary and recommandations 23
3.1 Summary . . . . . . . . . . . . . . . . . . . . . . . . . . . . . . . . . . . . 23
3.2 Recommendations . . . . . . . . . . . . . . . . . . . . . . . . . . . . . . . . 23
3.3 Acknowledgements . . . . . . . . . . . . . . . . . . . . . . . . . . . . . . . 24
Bibliography 25
A EU-SILC sampling designs 2004 30
Chapter 1
Description and Quality of theEU-SILC User Database
1.1 Introduction
The goal of this chapter is to collect metadata and quality information on the EU-SILCLaeken indicators both at the European and at the national level.
Section 1.2 is devoted to the user database description. Section 1.2.1 covers the aimof the survey, the legal basis, the reference population, the sampling plan, the surveys,the weights, the imputation and finally the data sets and the variables. Section 1.2.2is devoted to the construction of the target variables which are divided in four types:household register, personal register, household data and person variables.
In Section 1.3, we quote two documents about the calculation of the overarching andpensions indicators based on EU-SILC, adopted under the Open Method of Coordination(OMC).
The quality documents of EU-SILC are available in Section 1.4 which is divided in threeparts. Section 1.4.1 collects national quality reports from the national statistical institutesparticipating in the AMELI project, namely Austria, Estonia, Germany, Slovenia andFinland. Section 1.4.2 contains quality documents from a supranational perspective. Next,Section 1.4.3 addresses the problem of weighting.
Section 1.5 is devoted to measurement problems. Section 1.5.1 collects documents aboutthe impact of extreme incomes on the precision of poverty and inequality indicators andSection 1.5.2 about their variance estimation.
1.2 User Database and Target Variables
In this section, we find a general description of the user database EU-SILC from the goal ofthe project to the construction of the target variables. EU-SILC is an instrument aiming
© http://ameli.surveystatistics.net/ - 2011
1.2 User Database and Target Variables 3
at collecting timely and comparable cross-sectional and longitudinal multidimensionalmicro data on income poverty and social exclusion. This instrument is anchored in theEuropean Statistical System (ESS).
Clemenceau and Museux (2007) proposed the first evaluation of the project afteralmost five years of activity, from its launching up to the Conference on ComparativeEU Statistics on income and living conditions: issues and challengesın Helsinki, from theperspective of the European Commission and from the perspective of each country.The EU-SILC project has been implemented over the last years on a step by step basis.It has been launched in 2003, on the basis of a ’gentlemen agreement’ in seven countries(AT, BE, DK, GR, IE, LU, and NO). The user database (UDB) 2004 was issued by 15countries (AT, BE, DK, EE, ES, FI, FR, GR, IE, IS, IT, LU, NO, PT and SE). Then 26countries (Norway, Iceland and the 25 member states except Malta) participated in theEU-SILC UDB 2005 - 2007. Bulgaria (BG) and Romania (RO) joined the survey in 2008.Switzerland (CH) and Turkey (TR) will join the project in the subsequent years.
Two types of data are provided:
• Cross-sectional data pertaining to a given time or a certain time period with vari-ables on income, poverty, social exclusion and other living conditions;
• Longitudinal data pertaining to individual-level changes over time, observed peri-odically over, typically, a four-years period.
The launching of EU-SILC experiences a transition period till 2007 during which NSI’scan adapt their tool to common standard, for instance, imputed rent, employer socialcontribution, income component at gross level. Release 2004 corresponds to cross-sectionaldata for a limited set of countries. The first longitudinal data were available by July 2007for the UDB 2005 for 13 countries: AT, BE, EE, ES, FI, FR, GR, IE, IS, IT, LU, NO,SE. In 2008, the longitudinal data are available for the 26 countries. The first 4 years’individual trajectories will be available by July 2009.
In the sequel, certain documents are quoted twice: in Section 1.2.1 for the general de-scription of the UDB and in Section 1.2.2 for the variables.
1.2.1 Description of the UDB
The documents contained in this subsection are classified by the year of the UDB. The2004 information was designed to be general and to be reusable for subsequent releases.Nevertheless, besides the ground information, each year is devoted to a particular topic.This framework allows for flexibility and different implementations. Information on cur-rent status of the implementation in the different Member States (MS) is provided asan addendum to the different sections and complements the general presentation. Thetransitional measures valid till 2007 are also underlined whenever relevant.
The topics about the general description of the UDB are: aim of the survey, legal basis,reference population, sampling designs, survey characteristics (survey units, modes ofcollection, survey duration and time, tracing rules), weights (legal aspects, theoretical
AMELI-WP5-D5.1
4 Chapter 1. Description and Quality of the EU-SILC User Database
aspects and EU-SILC weights), imputation (missing data in EU-SILC and EU-SILC targetvariables for imputation) and database (data availability, domains and areas, the files,format, the data sets, variables and list of variables).
1. UDB 2003 - 2006:A general description of the UDB for years 2003 - 2006 is given in Bernard (2008).The EU-SILC sampling designs for 2004 are given in Annex 2.
2. UDB 2007:The document of Bernard (2009) contains the description of the UDB and theEU-SILC sample designs for 2007 (in Annex 3).
3. UDB 2008:The document Eurostat (2010) contains the description of the UDB, the targetvariables and the secondary target variables.
4. UDB 2009:The document Eurostat (2009f) contains the description of the UDB, the targetvariables and the secondary target variables.
1.2.2 Description of the Variables
In this subsection, we are interested in the structure of the database which is dividedin two parts: the main target variables, i.e. the variables which are present every yearand the secondary target variables which are part of the module of the year considered.Indeed, every year the survey treats a particular topic like intergenerational transmissionof poverty (module 2005), social participation (module 2006), housing conditions (module2007), over-indebtedness and financial exclusion (module 2008) and material deprivation(module 2009)(see above).
The documents about the main variables are built in the following way. For each variable,the following is provided:
• Kind of data:
A. If the variable is a household variable, it is either:
1. Basic data (basic household data including degree of urbanisation);
2. Income (total household income and gross income components at householdlevel);
3. Social exclusion (non-monetary household deprivation indicators, includingproblems in making ends meet, extent of debt and enforced lack of basic amen-ities);
4. Labour information (child care);
5. Housing (Dwelling type, tenure status and housing conditions, amenities indwelling and housing costs).
© http://ameli.surveystatistics.net/ - 2011
1.2 User Database and Target Variables 5
B. If the variable is a person variable, it is either:
1. Basic data (basic personal data and demographic data);
2. Education;
3. Labour information (basic labour information on current activity status and oncurrent main job, including information on last main job for unemployed, basicinformation on activity status during income reference period, total numberof hours worked on current second/third ... jobs, detailed labour information,activity history and calendar of activities);
4. Health (health, including health status and chronic illness or condition, andaccess to health care);
5. Income (gross personal income, total and components at personal level).
• Type of variable: cross-sectional or longitudinal;
• Reference period (constant, current, income reference period, last twelve months,since last year, working life and childcare reference period);
• Unit (household, household member, former household member, selected respondentand household members aged 16 and over);
• Mode of collection (constructed, frame, register, interviewer, household respondent,personal interview and proxy);
• Values (range);
• Flags.
Like before the documents are classified by year of the UDB.
Finally, we have:
1. UDB 2003 - 2006:The description of the target variables is given in Eurostat (2008e).
2. UDB 2005:The secondary target variables used in the module 2005, Intergenerational trans-mission of poverty, are described in Eurostat (2008c).
3. UDB 2006:The secondary target variables used in the module 2006, Social participation, aredescribed in Eurostat (2008d).
4. UDB 2007:The description of the target variables is given in Eurostat (2009e). The second-ary target variables used in the module 2007, housing conditions, are described inEurostat (2008b).
AMELI-WP5-D5.1
6 Chapter 1. Description and Quality of the EU-SILC User Database
5. UDB 2008:The description of the target variables is given in Eurostat (2010). A descriptionof the secondary target variables in module 2008, Over-indebtedness and financialexclusion, is given in Annexe 8.
6. UDB 2009:The description of target variables is given in Eurostat (2009f). A descriptionof the secondary target variables in module 2009, Material deprivation, is given inAnnex 8.
Comparison between recommended and provided equivalised disposable income on thebasis of EU-SILC UDB 2004-2006 is provided in the next chapter.
1.2.3 Guidelines in Progress
The subject of Eurostat (2008f) is the harmonisation of SILC and EHIS1. Part of SILCquestionnaire is in fact about health. So it is recommended to coordinate activities atthe national level between SILC and EHIS counterparts in order to have EHIS standardsimplemented in the SILC questions on health according to the new SILC revised guidelinesfrom 2008 data collection onwards Eurostat (2010).
1.3 Indicators
The portfolio of Overarching Indicators is available in Eurostat (2009a). The objectives,definition and computation of these indicators are presented.
Eurostat (2009b) contains a background about the development of Pensions indicatorsunder the Open Method of Coordination. Further, we can find a portfolio of Pension In-dicators calculated from SILC with detailed methodological notes about the calculations.
1.4 Quality
This Section contains different documents about quality. In Section 1.4.1 the Quality Re-ports follow a special structure that is mandatory by the Commission, assuring a continu-ous documentation of quality. The documents in Section 1.4.2 develop a more prospectivepoint of view about the assessment of statistical quality in EU-SILC. Finally, in Section1.4.3, we have collected several documents about the weighting procedure in EU-SILC.
1EHIS: European Health Interview Survey
© http://ameli.surveystatistics.net/ - 2011
1.4 Quality 7
1.4.1 Quality Reports
All these documents follow the structure outlined in the Commission Regulation No.28/2004 (Eurostat (2004a)). This regulation defines four chapters. The first chapterprovides the common cross-sectional indicators and other indicators of interest computedon the basis of EU-SILC. The second chapter deals with accuracy, meaning that all factorsthat affect the closeness of estimations and results to the exact or true value shouldbe described. The third chapter reports on comparability and describes all differencesbetween the standard EU definitions and the definitions applied by the countries. Thefourth and last chapter, reporting on coherence, presents the comparisons of the EU-SILCdata with external sources.
The comparative final quality report for 2005, Eurostat (2008a) gathers and summarizesall the information contained in the 2005 national final quality reports that the memberstates have sent to Eurostat. The objective here is to evaluate the quality of the instrumentfrom the European point of view, i.e. by establishing between-country comparisons ofsome of its key quality dimensions. Quality reports for 2006 and 2007 are also available(Eurostat (2009c,d)).
In the following subsection, we find the national final quality reports of those NSI’s thatare involved in AMELI for different years.
Austria Quality Report
Austria uses a simple random sample of addresses. Sampling units are dwelling unitsregistered in the Central Residence Register (ZMR, Zentrales Melderegister). At the end,all households and individuals living at the eligible addresses were interviewed.
All the responding households in 2004 have been kept in the sample for the 2005 survey.In addition, a new sample of addresses was selected in 2005 by simple random sampling.This sample was supplemented by another sample of addresses, which was drawn likewise.At the end, all the households and the individuals living at the eligible addresses wereinterviewed.
In 2006 the sample consists of two quarters that entered the survey in 2004, one quarterthat started in 2005 and a further quarter that entered the survey in 2006. More details forthe UDB 2003, UDB 2004, UDB 2005 and UDB 2006 are available in these quality reports(Statistics Austria (2004)), (Statistics Austria (2005)), (Statistics Austria(2007)), (Statistics Austria (2008a)) and (Statistics Austria (2008b)).
Estonia Quality Report
There are three quality reports, one for the UDB 2004 (Statistics Estonia (2006)),one for the UDB 2005(Statistics Estonia (2007a)) and the last one for the UDB 2006(Statistics Estonia (2007b)).
AMELI-WP5-D5.1
8 Chapter 1. Description and Quality of the EU-SILC User Database
The design used is one-stage stratified unequal probability sampling of households, witha household selected with probability proportional to the number of persons aged 14and over. The Estonian EU-SILC sample is selected according to the following samplingprocedure:
• Stratification by county level into three strata by population size: big counties,small counties and the Hiiu County, which forms a separate stratum as the smallestcounty in terms of population size.
• A sample of persons aged 14 and over is selected with equal probabilities withinstrata.
All the households of the selected persons are identified and all eligible persons in thehousehold are interviewed.As 2006 operation was the third round of EU-SILC in Estonia, the sample comprised ofthree parts: 1. The first part consists of households selected for the survey in 2004 andfollowed up in 2005 and 2006. Initially, this part consisted of 4 rotational groups, one ofwhich was to be dropped after the 2004 operation and another after the 2005 operation.However, due to the smaller than expected response rates, it was decided to keep all rota-tional groups in the sample up to 2006. 2. The second part consists of households selectedfor the survey in 2005 and followed-up in 2006. 3. Sample of new households introducedinto the survey in 2006.
Weighting scheme was generally in line with documents Osier et al. (2006) and Verma(2006), with some peculiarities due to modified rotational scheme.The sample of year 2006 consists of three subsamples to be weighted independently andcombined thereafter:
• s3: households started in 2004 and their split-offs, participate for the third time (=4 rotational groups)
• s2: households started in 2005 and their split-offs, participate for the second time(= one rotational group)
• s1: households started in 2006, participate for the first time (= one rotational group)
First, we need to calculate base weights of year 2006 for each subsample. Since weightingprocedure was different in 2005, base weights of 2005 also need to be recalculated. In thefollowing years, no recalculation will be needed, besides correction for attrition.
More details are available in the above quality reports.
© http://ameli.surveystatistics.net/ - 2011
1.4 Quality 9
Germany Quality Report
For Germany, we have two quality reports.For the UDB 2005, Federal Statistical Office Germany (2007) and for the UDB2006, Federal Statistical Office Germany (2008).
The German SILC survey is organised as a rotational panel containing 4 subsamples. In2005 the survey started with 3 quota samples and 1 random sample. In 2006 one quotasample was replaced by a further random sample, i.e. in 2006 there were 2 quota sub-samples and 2 random subsamples. And so on, until from 2008 where there are only fourrandom samples.The sampling frame for the random subsamples is the permanent sample (DSP), a samplingframe recruited among former participants of the German Microcensus (access panel).
For both random and quota part, the stratification criteria within the German Microcensuswere in 2006 (as in 2005): Federal state (Bundesland); Household type; Social status ofthe main income earner; Household net income; Farm household (separate stratum foreach federal state). All the individuals living at the selected addresses were eligible forinterview.
Slovenia Quality Report
For Slovenia, we have the quality report of the UDB 2005,Statistical Office of the Republic of Slovenia (2007a) and of the UDB 2006,Statistical Office of the Republic of Slovenia (2007b).
The sample for the Slovenian EU-SILC was selected according to a stratified two-stagedesign.
• The strata were defined according to the size of the settlement (clusters of enumera-tion areas defined according to the population size) and its proportion of agriculturalhouseholds and sorted according to the statistical regions, see Statistical Officeof the Republic of Slovenia (2007a) for more details.
• In each stratum Primary Sampling Units (PSU), i.e. enumeration areas, were firstlysystematically selected.
• In the second stage seven persons aged 16 and over were selected in each PSU.
Finally, the entire household, a selected person belongs to, was eligible for contact.
Since in 2005 a lower interviewing rate than expected was experienced, the sample for2006 was enlarged; otherwise the sample size after four years would be too small for lon-gitudinal analysis.
AMELI-WP5-D5.1
10 Chapter 1. Description and Quality of the EU-SILC User Database
In 2006 the fourth wave from 2005 would be dropped out, but it was kept and divided intothree parts, which were reallocated to the remaining three waves from 2005. Therefore,all households which responded in 2005 were interviewed again in 2006.
Since this was decided before data processing of the 2005 survey, selected sampling unitswere initially renumbered so that instead of four, there are three rotational groups. Noneof the rotational groups were dropped out in 2005. In 2006 only one new rotational groupwas added, so there are four rotational groups in 2006.
Finland Quality Report
For Finland, we have three quality reports: UDB 2004: Statistics Finland (2005);UDB 2005: Statistics Finland (2008); UDB 2006: Statistics Finland (2007).
The sampling design of the Finnish EU-SILC survey 2006 is a two-phase sampling design.The Finnish cross-sectional SILC data collection 2006 contains two groups based on theIncome Distribution Survey (IDS): one is a new rotation group and the other is a set ofresponding households of the IDS of the previous year. Both of them had been selectedaccording to the following two-phase sampling design:
• A systematic sampling of persons aged 16 years and more is carried out in thePopulation Register in order to get the basis for a Master Sample. Then, all thedwellings with at least one selected person are included in that Master Sample.
• The Master Sample is stratified according to socio-economic criteria.
• A simple random sample without replacement of dwellings is selected in each stratum.
Finally, all the households and the individuals living in the selected dwellings were eligiblefor interview.
There are some changes in the used questionnaires.The 2005 questionnaire was partly rebuilt. The section on labour market activity wastotally reconstructed, since the three tests of the 2004 questionnaire carried out by theCognitive Laboratory showed major problems in the interviewing process. However, thetrouble seemed to come from the ordering of the questions, not from wordings. The or-dering of the questions was changed thoroughly in 2005.
The changes in the questionnaire for 2006, which were not so many, were introduced tothe interviewers in a separate written report and, of course, in the instructions book. Theinstructions book is rewritten every year and it is also under constant development. Nointerviewers’ training courses were arranged in 2006 for the interviewers who had beentrained in earlier years. The training material was available in the form of the computer-assisted telephone interview (CATI) questionnaire and interviewer instructions and theinterviewers were paid to study the material.
© http://ameli.surveystatistics.net/ - 2011
1.4 Quality 11
1.4.2 Quality Documents
The documents in this section investigate the assessment and possible improvement of thestatistical quality in EU-SILC.
Verma (2007) develops and discusses a framework for the assessment of statistical qual-ity in EU-SILC, with focus on comparability as a central dimension of quality. The dataquality is viewed as a multidimensional concept, covering not only statistical accuracybut also the relevance, timeliness, comprehensiveness, etc., of the data. There is a broadagreement on what dimensions make up the overall quality of statistical data, and thesedimensions are briefly reviewed, noting some relationships between them.This paper proceeds to identify a number of specific aspects where problems of compar-ability are likely to arise in EU-SILC, and elaborates methodologies for the study of someof the more important ones among them.
Figari et al. (2007) explore the prospects for using the EU-SILC as the underlying micro-database for policy simulation across the EU. In particular it considers the issues to beaddressed, and the advantages arising, from building a database from the EU-SILC forthe EU tax-benefit model, EUROMOD. In order to identify the issues and illustrate theirimportance, a trial database for Spain has been constructed. It is used within EUROMODto calculate some selected social indicators as well as indicators of work incentives andthe effects of fiscal drag in Spain between 2003 and 2006. They conclude that, althoughtransforming the EU-SILC into a database for EUROMOD would require a significantamount of effort, this is likely to be worthwhile because of the consequent improvementsin comparability across countries, efficiency in developing and maintaining the model formany countries and simplification of access arrangements. Therefore some suggestions forhow to improve the User Database for this purpose are offered.
1.4.3 Weighting
The weighting methodology is an important topic in the EU-SILC survey and severaldocuments address this topic. Indeed, although the calculation of weights is a country’sresponsibility, Eurostat has provided guidelines on how to calculate weights within thetwo documents: Eurostat (2003b) and Eurostat (2003c).They furnish information about the construction of a sample of households and persons,design weights, cross-sectional weights and longitudinal weights.
The objective of Eurostat (2004b) is to further the concept of sample weights and toprovide a systematic procedure to obtain them. The weighting procedures are describedfor the units of the subsamples that appear for the first time in the EU-SILC sample, onlyin situations where a rotational design is used.
Eurostat (2005) proposes a procedure to compute the cross-sectional weights fromsecond year onwards, when a rotational design with four panels, as recommended by
AMELI-WP5-D5.1
12 Chapter 1. Description and Quality of the EU-SILC User Database
Eurostat, is supposed to have been applied.In the first part of the document, the basic principle of the rotational design is recalled anda panel terminology (panel person, sample household and co-resident), appearing through-out the document, is compiled in a second part. The third part provides guidelines fora satisfying weight computation, by distinguishing whether a sample of households or asample of persons has been drawn.
The proposal of Eurostat (2004c) is to adjust the distribution of children for each yearof age. This involves the adjustment of personal cross-sectional weights so as to make thedistribution, according to age characteristics, of the children covered in the sample agreewith the same information from some more reliable external source (age distribution ofchildren aged 0 to 12 in private households).
Apart from Eurostat’s documents, here is a list of papers on the weighting scheme.
Osier et al. (2006) and Verma et al. (2007) build on Verma (2006) and provide acomprehensive description of an integrated system of cross-sectional and longitudinalweighting for rotational household panel surveys. The two papers provide a system-atic description of the weighting procedures, also introducing some refinements so as toenhance the consistency and completeness of original recommendations.The papers begin with a summary of the main features of EU-SILC and an overview of theintegrated weighting system for the different types of data coming out of the rotationalpanel annually. They describe a step-by-step procedure for construction of initial weightsto be applied to each new sample as it is introduced into the survey. The objective is topropose a unified structure for the whole weighting procedure for the standard integratedEU-SILC design, covering the initial sample, and its cross-sectional as well as longitudinaldevelopment.The document is outlined as follows: 1. Weighting for the first year of each subsample(panel); 2. Computation of base weights; 3. Cross-sectional weights, year 2 onwards; 4.Longitudinal weights.
Ardilly and Lavallee (2007) discusses the longitudinal and cross-sectional weightingfor the French SILC survey, that are designed to produce approximately unbiased estim-ators.
Graf (2009) gives a very detailed description of the weighting procedure (cross-sectionaland longitudinal) in the case of the Swiss Household Panel. Similar steps are taken upfor the Swiss SILC.
1.5 Variability
The precision of the Laeken Indicators depends on the variability of the underlying incomevariables. It is thus of importance to compute the variance of the equivalised income andto take the presence of extremes into account.
© http://ameli.surveystatistics.net/ - 2011
1.6 Remarks 13
1.5.1 Extreme Income
The micro-data estimates of welfare indices are known to be sensitive to observations fromtails of the income distribution. It is therefore usual to make adjustments to extreme databefore proceeding with estiamtion of inequality and poverty statistics. Kerm (2007a)systematically evaluates the impact of such adjustments on indicators estimated from theEU-SILC by a Pareto distribution.
Kerm (2007b) presents the results of a large scale sensitivity analysis considering bothsimple, classical adjustments and a more sophisticated approach based on modeling para-metrically the tails of the income distribution.
1.5.2 Variance
In Osier and Museux (2006) the principle of the variance estimation approach based onlinearization techniques is presented.
Leiten and Traat (2008) contains the estimation formulae for Laeken indicators andthen concentrates on their variance estimation by resampling and linearization methods(Jacknife method). Then, the variance formulae of Laeken indicators, such as median,at-risk-of-poverty threshold, at-risk-of-poverty rate and related quantities are developed,for the EU-SILC design of Estonia.
1.6 Remarks
Up-to-date documentation on EU-SILC can be found on EU-SILC Library. All citeddocuments are available on demand (in pdf or doc format).
AMELI-WP5-D5.1
Chapter 2
Comparison between Recommendedand Provided Equivalised DisposableIncome on the basis of EU-SILCUDB 2004-2006
2.1 Introduction
This chapter is intended as a study of the equivalised disposable income, which is the basicconcept in the construction of the EU-SILC Laeken Indicators. First, we recall the defini-tion of the equivalised disposable income. Then, we use the R software to reconstruct thisincome in the EU-SILC 2004-2006 User Database (UDB). From the results, we comparethe equivalised disposable income that we have constructed with the one provided in theUDB and conclude.
2.1.1 Equivalised disposable income
The theoretical definition of the equivalised disposable income, called EQ INCi, is thefollowing:
For each person i, EQ INCi is defined as the household’s total disposable income correc-ted for individual non-response, TDHI, divided by the equivalent household size, EQ SS.
In other terms,
EQ INCi =TDHI
EQ SS, (2.1)
where:
• TDHI = HY 020 × HY 025, where
© http://ameli.surveystatistics.net/ - 2011
2.1 Introduction 15
• HY 020 is the total disposable household income1,
• HY 025 is a within-household non-response inflation factor23 and is defined by:
HY 025 =HY 020c + HY 020i
HY 020c
, (2.2)
where:
HY 020c: collected total disposable income;HY 020i: imputed total disposable income.
• EQ SS is the equivalised household size.
2.1.2 Equivalised household size
In order to take account of the differences in the size and the composition of a household,the equivalised household size is defined using the so called modified OECDßcale, whichgives a weight of 1.0 to the first adult, a weight of 0.5 to other household members aged14 or over and a weight 0.3 to other household members aged 13 or less:
EQ SS = 1 + 0.5(HM14+ − 1) + 0.3HM13−, (2.3)
where:
HM14+ = number of household members aged 14 and over (at the end
of income reference period)
HM13− = number of household members aged 13 or less (at the end
of income reference period)
The definition of age as the age at the end of the income reference period can be foundin Eurostat (2008e).
2.1.3 Total disposable household income
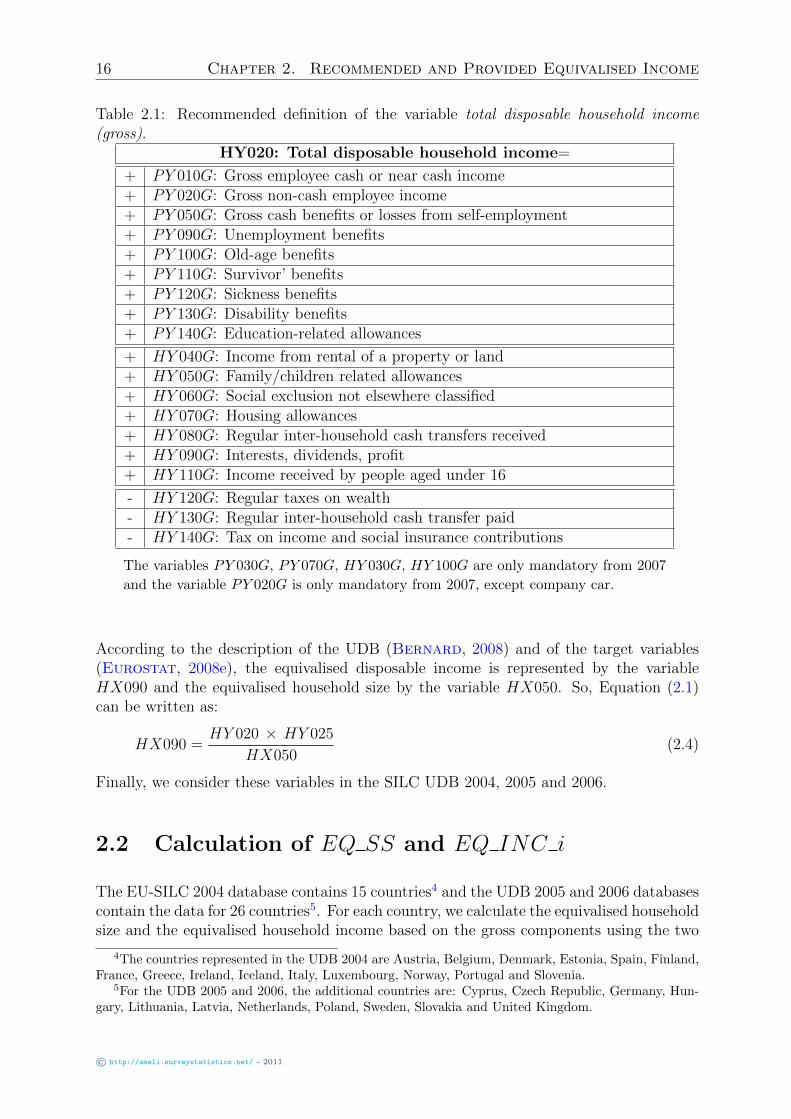
The total disposable income of a household is calculated by adding together the personalincome components received by each household member plus income components receivedat household level minus some deductions. It is described in details in Eurostat (2008e).In Eurostat (2009a), we can find three definitions of the variable HY 020, based ongross income components, on net income components, and on a mixture of gross and netincome components. However, the recommendations for SILC are to use the gross incomecomponents. The first and recommended definition of the total disposable income, basedon the gross income components, is given in Table (2.1):
1From 2007, the variable HY 020 will represent the corrected for individual non-response disposableincome.
2Factor used to multiply the total gross income, the total disposable income, or the total disposableincome before social transfers, to compensate for the non-response in individual questionnaires. It isnecessary to correct the effect of non-responding individuals within a household, otherwise the income ofindividuals interviewed doesn’t sum up to the total household income.
3From 2007, the variable HY 020 will represent the corrected for individual non-response disposableincome.
AMELI-WP5-D5.1
16 Chapter 2. Recommended and Provided Equivalised Income
Table 2.1: Recommended definition of the variable total disposable household income(gross).
HY020: Total disposable household income=
+ PY 010G: Gross employee cash or near cash income+ PY 020G: Gross non-cash employee income+ PY 050G: Gross cash benefits or losses from self-employment+ PY 090G: Unemployment benefits+ PY 100G: Old-age benefits+ PY 110G: Survivor’ benefits+ PY 120G: Sickness benefits+ PY 130G: Disability benefits+ PY 140G: Education-related allowances
+ HY 040G: Income from rental of a property or land+ HY 050G: Family/children related allowances+ HY 060G: Social exclusion not elsewhere classified+ HY 070G: Housing allowances+ HY 080G: Regular inter-household cash transfers received+ HY 090G: Interests, dividends, profit+ HY 110G: Income received by people aged under 16
- HY 120G: Regular taxes on wealth- HY 130G: Regular inter-household cash transfer paid- HY 140G: Tax on income and social insurance contributions
The variables PY 030G, PY 070G, HY 030G, HY 100G are only mandatory from 2007
and the variable PY 020G is only mandatory from 2007, except company car.
According to the description of the UDB (Bernard, 2008) and of the target variables(Eurostat, 2008e), the equivalised disposable income is represented by the variableHX090 and the equivalised household size by the variable HX050. So, Equation (2.1)can be written as:
HX090 =HY 020 × HY 025
HX050(2.4)
Finally, we consider these variables in the SILC UDB 2004, 2005 and 2006.
2.2 Calculation of EQ SS and EQ INC i
The EU-SILC 2004 database contains 15 countries4 and the UDB 2005 and 2006 databasescontain the data for 26 countries5. For each country, we calculate the equivalised householdsize and the equivalised household income based on the gross components using the two
4The countries represented in the UDB 2004 are Austria, Belgium, Denmark, Estonia, Spain, Finland,France, Greece, Ireland, Iceland, Italy, Luxembourg, Norway, Portugal and Slovenia.
5For the UDB 2005 and 2006, the additional countries are: Cyprus, Czech Republic, Germany, Hun-gary, Lithuania, Latvia, Netherlands, Poland, Sweden, Slovakia and United Kingdom.
© http://ameli.surveystatistics.net/ - 2011
2.2 Calculation of EQ SS and EQ INC i 17
R functions described in Sections 2.2.1 and 2.2.3 (see the accompanying documents forcode and more details on the used R functions). Then, in Sections 2.2.2 and 2.2.4, wecompare the results obtained by calculations with the provided EU-SILC variables.
2.2.1 Calculation of EQ SS
We use the R function eqSS created by Andreas Alfons (Vienna University of Technology).This function corresponds to Definition (2.3) of the equivalised household size, when thereare no missing values in the variable RX020 (see below). The arguments of this functionare the household identifier (variable DB030), the year of the interview (variable RB010)and the age of each person in the household. For the age, there are two available variables:
1. RX010: age at the end of interview (UDB definition);
2. RX020: age at the end of the income reference period (UDB definition).
We have to use the second variable, RX020, in the calculation of the equivalised householdsize. Note that missing values in the variable RX020 are systematically imputed by theR function as being a person aged 14 and over. For example, for a person with missingage in a household consisting of 5 persons of age, respectively:
P1: 40 years oldP3: 38 years oldP3: 10 years oldP4: NAP5: 3 years old
⇒ HM14+ = 3 and HM13− = 2
we have EQ SS = 1 + 0.5(HM14+ − 1) + 0.3HM13− = 2.6.
2.2.2 Comparison with HX050
We can compare the variable provided by the database, i.e. HX050, with the one we justhave calculated, i.e. EQ SS. We note that
EQ SS = HX050
for all persons in all countries except Norway.
Indeed, for the latter we note a few cases where EQ SS is not equal to HX050. Thereare 11 cases (4 households) in the UDB 2004 and 131 cases (35 households) in the UDB2006. This is because, in each of these households, one or more persons have the variableRX020 (age) missing. And so, we fall in the case reported in the calculation of EQ SS,where the function EQ SS attributes the age of these persons as being 14 and over.
AMELI-WP5-D5.1
18 Chapter 2. Recommended and Provided Equivalised Income
The problem comes from the fact that countries do not force the missing age to be includedin HM14+. Instead, according to Eurostat (2008e), they use another variable whichallows us to know if the person, whose age is missing, is included in HM14+ or in HM13−.The variable is RB245 (Respondent status). So, if we have missing values in RX020,then the variable RB245 is used in the following way:
if RB245 = 1, 2 or 3, then HM14+ = 1if RB245 = 4, then HM13− = 1otherwise, HM14+ = HM13− = 0
2.2.3 Calculation of EQ INCi
In order to calculate EQ INCi, we use the R function eqInc, created by Andreas Alfons.Using as arguments the gross income variables from the recommended definition of HY 020(see Section 1.4), the function returns as result the calculated total disposable income,which we will denote HY 020′, divided by EQ SS. Then, if we multiply this result by thevariable HY 025, present in the UDB, we obtain the total equivalised disposable income:
EQ INCi =HY 020′ × HY 025
EQ SS
Note that if one of the arguments (i.e. an income variable) is missing, the functionconsiders it equal to zero. Thus, if all income variables are missing, the obtained result isequal to zero:
HY 020′
EQ SS= 0
The obtained equivalised disposable income can have the following different values:
1. real value;
2. 0, when all components are missing and HY 025 is available;
3. NA, when HY 025 is missing.
2.2.4 Comparison with HX090
We want to compare the so obtained equivalised income EQ INCi with the variableHX090 present in the UDB. In order to that, we define
∆ = abs(EQ INCi −HX090) (2.5)
The comparison is done using two R functions - critical and f_stat.
© http://ameli.surveystatistics.net/ - 2011
2.2 Calculation of EQ SS and EQ INC i 19
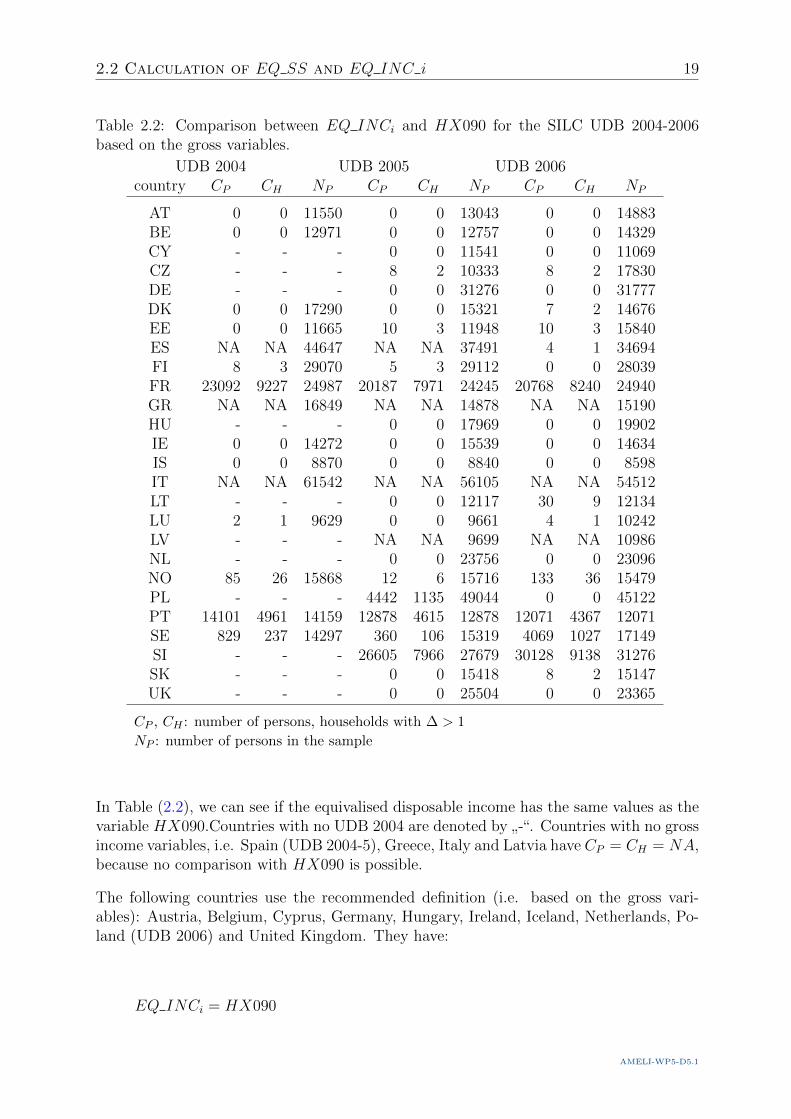
Table 2.2: Comparison between EQ INCi and HX090 for the SILC UDB 2004-2006based on the gross variables.
UDB 2004 UDB 2005 UDB 2006country CP CH NP CP CH NP CP CH NP
AT 0 0 11550 0 0 13043 0 0 14883BE 0 0 12971 0 0 12757 0 0 14329CY - - - 0 0 11541 0 0 11069CZ - - - 8 2 10333 8 2 17830DE - - - 0 0 31276 0 0 31777DK 0 0 17290 0 0 15321 7 2 14676EE 0 0 11665 10 3 11948 10 3 15840ES NA NA 44647 NA NA 37491 4 1 34694FI 8 3 29070 5 3 29112 0 0 28039FR 23092 9227 24987 20187 7971 24245 20768 8240 24940GR NA NA 16849 NA NA 14878 NA NA 15190HU - - - 0 0 17969 0 0 19902IE 0 0 14272 0 0 15539 0 0 14634IS 0 0 8870 0 0 8840 0 0 8598IT NA NA 61542 NA NA 56105 NA NA 54512LT - - - 0 0 12117 30 9 12134LU 2 1 9629 0 0 9661 4 1 10242LV - - - NA NA 9699 NA NA 10986NL - - - 0 0 23756 0 0 23096NO 85 26 15868 12 6 15716 133 36 15479PL - - - 4442 1135 49044 0 0 45122PT 14101 4961 14159 12878 4615 12878 12071 4367 12071SE 829 237 14297 360 106 15319 4069 1027 17149SI - - - 26605 7966 27679 30128 9138 31276SK - - - 0 0 15418 8 2 15147UK - - - 0 0 25504 0 0 23365
CP , CH : number of persons, households with ∆ > 1
NP : number of persons in the sample
In Table (2.2), we can see if the equivalised disposable income has the same values as thevariable HX090.Countries with no UDB 2004 are denoted by
”-“. Countries with no gross
income variables, i.e. Spain (UDB 2004-5), Greece, Italy and Latvia have CP = CH = NA,because no comparison with HX090 is possible.
The following countries use the recommended definition (i.e. based on the gross vari-ables): Austria, Belgium, Cyprus, Germany, Hungary, Ireland, Iceland, Netherlands, Po-land (UDB 2006) and United Kingdom. They have:
EQ INCi = HX090
AMELI-WP5-D5.1
20 Chapter 2. Recommended and Provided Equivalised Income
HY 020′ = HY 020
The same definition is used by the Czech Republic, Denmark, Estonia, Finland, Lithuania,Luxembourg, Norway and Slovakia except for very few cases where EQ INCi is not equalto HX090.
For Poland (UDB 2005), the equivalised disposable income was taken from another source(see Central Statistical Office of Poland, 2007, 2008).
Some countries use alternative definitions of HY 020 to compute the equivalised disposableincome (Eurostat, 2009a):
Second definition of HY 020
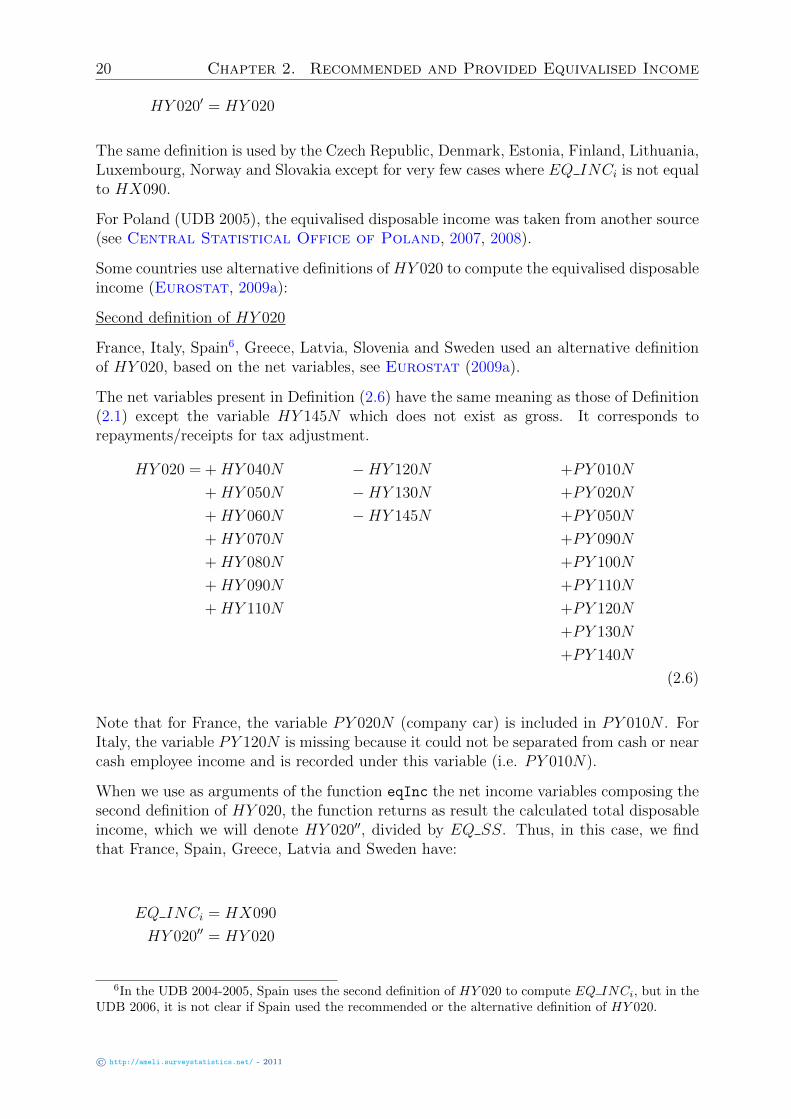
France, Italy, Spain6, Greece, Latvia, Slovenia and Sweden used an alternative definitionof HY 020, based on the net variables, see Eurostat (2009a).
The net variables present in Definition (2.6) have the same meaning as those of Definition(2.1) except the variable HY 145N which does not exist as gross. It corresponds torepayments/receipts for tax adjustment.
HY 020 = + HY 040N −HY 120N +PY 010N
+ HY 050N −HY 130N +PY 020N
+ HY 060N −HY 145N +PY 050N
+ HY 070N +PY 090N
+ HY 080N +PY 100N
+ HY 090N +PY 110N
+ HY 110N +PY 120N
+PY 130N
+PY 140N
(2.6)
Note that for France, the variable PY 020N (company car) is included in PY 010N . ForItaly, the variable PY 120N is missing because it could not be separated from cash or nearcash employee income and is recorded under this variable (i.e. PY 010N).
When we use as arguments of the function eqInc the net income variables composing thesecond definition of HY 020, the function returns as result the calculated total disposableincome, which we will denote HY 020′′, divided by EQ SS. Thus, in this case, we findthat France, Spain, Greece, Latvia and Sweden have:
EQ INCi = HX090
HY 020′′ = HY 020
6In the UDB 2004-2005, Spain uses the second definition of HY 020 to compute EQ INCi, but in theUDB 2006, it is not clear if Spain used the recommended or the alternative definition of HY 020.
© http://ameli.surveystatistics.net/ - 2011
2.2 Calculation of EQ SS and EQ INC i 21
In Slovenia (UDB2005-6) (see Statistical Office of the Republic of Slovenia,2007a,b) and Italy (UDB 2004), we have HY 020′′ = HY 020, but EQ INCi 6= HX090,because other sources are used.
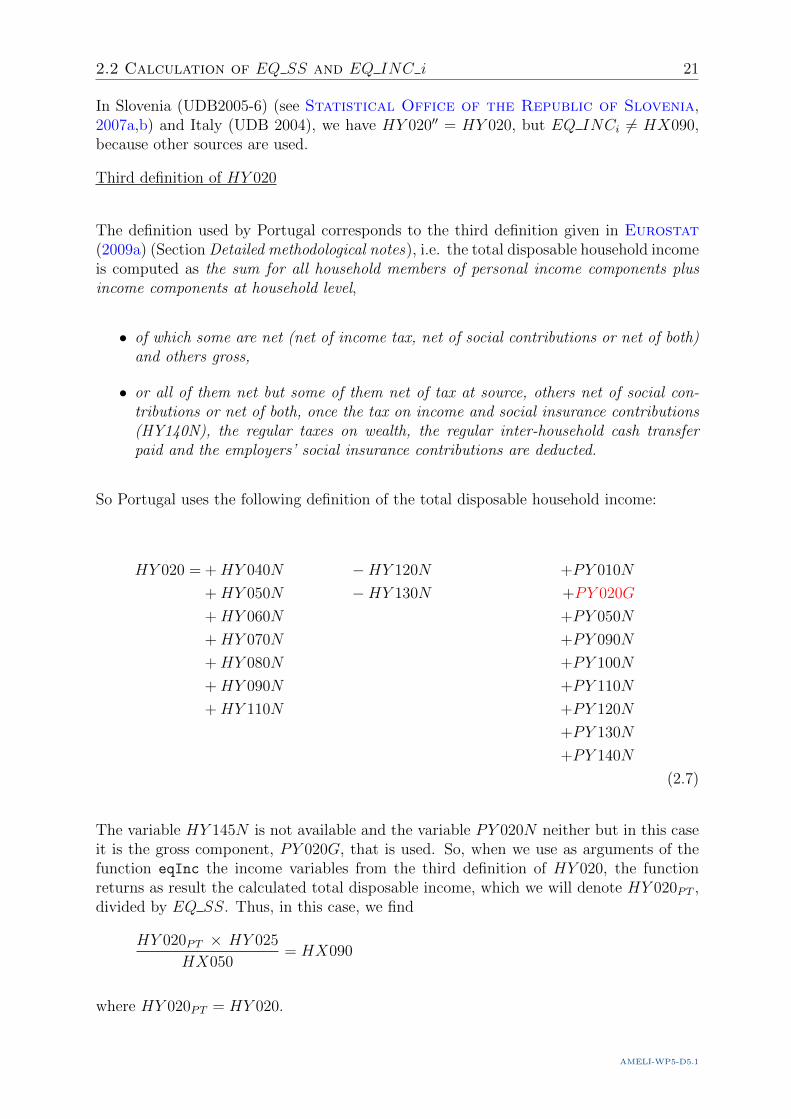
Third definition of HY 020
The definition used by Portugal corresponds to the third definition given in Eurostat(2009a) (Section Detailed methodological notes), i.e. the total disposable household incomeis computed as the sum for all household members of personal income components plusincome components at household level,
• of which some are net (net of income tax, net of social contributions or net of both)and others gross,
• or all of them net but some of them net of tax at source, others net of social con-tributions or net of both, once the tax on income and social insurance contributions(HY140N), the regular taxes on wealth, the regular inter-household cash transferpaid and the employers’ social insurance contributions are deducted.
So Portugal uses the following definition of the total disposable household income:
HY 020 = + HY 040N −HY 120N +PY 010N
+ HY 050N −HY 130N +PY 020G
+ HY 060N +PY 050N
+ HY 070N +PY 090N
+ HY 080N +PY 100N
+ HY 090N +PY 110N
+ HY 110N +PY 120N
+PY 130N
+PY 140N
(2.7)
The variable HY 145N is not available and the variable PY 020N neither but in this caseit is the gross component, PY 020G, that is used. So, when we use as arguments of thefunction eqInc the income variables from the third definition of HY 020, the functionreturns as result the calculated total disposable income, which we will denote HY 020PT ,divided by EQ SS. Thus, in this case, we find
HY 020PT × HY 025
HX050= HX090
where HY 020PT = HY 020.
AMELI-WP5-D5.1
22 Chapter 2. Recommended and Provided Equivalised Income
2.3 Conclusion
This study on equivalised disposable income clarifies the definition of the total disposableincome (HY 020) used by each country in the EU-SILC 2004-2006.
Austria, Belgium, Cyprus, Czech Republic, Denmark, Estonia, Finland, Germany, Hun-gary, Ireland, Iceland, Lithuania, Luxembourg, Netherlands, Norway, Poland (UDB 2006),Slovakia and United Kingdom use the recommended definition of HY 020, defined in (2.1),and have EQ INCi = HX090 (see Table (2.2)). For Poland (UDB 2005), the equival-ised disposable income was taken from another source. Eurostat recommends to use thisdefinition, but some countries use alternative definitions.
Indeed, Greece, Spain, France, Italy, Latvia, Slovenia and Sweden use the second definitionof HY 020, defined in (2.6), where only the net income variables are used, except for Italy(UDB 2004) and Slovenia (UDB2005-6) who use other sources.
Finally, Portugal uses a mix between net and gross income components to compute thetotal disposable income HY 020PT defined in (2.7) and obtains EQ INCi = HX090.
Note that, Greece, Spain, France, Italy and Portugal are supposed to deliver gross incomedata as from 2007, which is an important step towards the harmonisation of the survey.
© http://ameli.surveystatistics.net/ - 2011
Chapter 3
Summary and recommandations
In this chapter, we present a short summary of the previous chapters and give our generalremarks and recommendations.
3.1 Summary
In Chapter 1, we revised and summarized the existing documentation on EU-SILC, i.e.description of the user data base, national quality reports, EUROSTAT quality reports,EUROSTAT guidelines, documents about the social inclusion, pensions and healthcareindicators. We presented a detailed bibliographical record.
In Chapter 2, we presented the different manners in which the equivalised disposableincome is calculated in the EU-SILC participating countries. Using R functions created atTUWIEN and SFSO, we calculated the equivalised household size and the equivalised totaldisposable income for each country and we compare the results with the correspondingvariables present in the UDB. Peculiarities in the data and differences between countrieshave been investigated.
3.2 Recommendations
Conforming to the initial aims of Work Package 5, we will therefore present some basic re-commendations, which could be helpful for the simulation study. These recommendationsinclude:
• the sampling designs,
• the income variables.
The EU-SILC Commission Regulation on sampling and tracing rules Eurostat (2003a)suggests the selection of nationally representative probabilistic samples. A table summar-izing the sampling designs by country is given in Eurostat’s Intermediate Quality Report
AMELI-WP5-D5.1
24 Chapter 3. Summary and recommandations
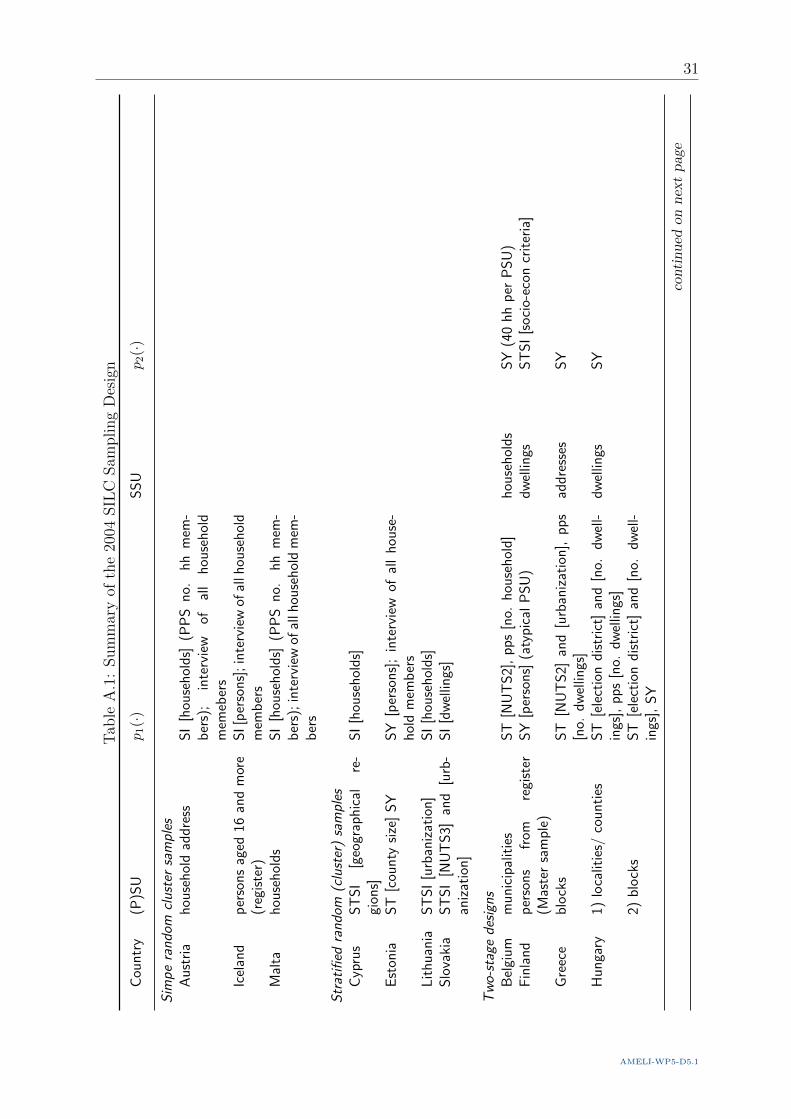
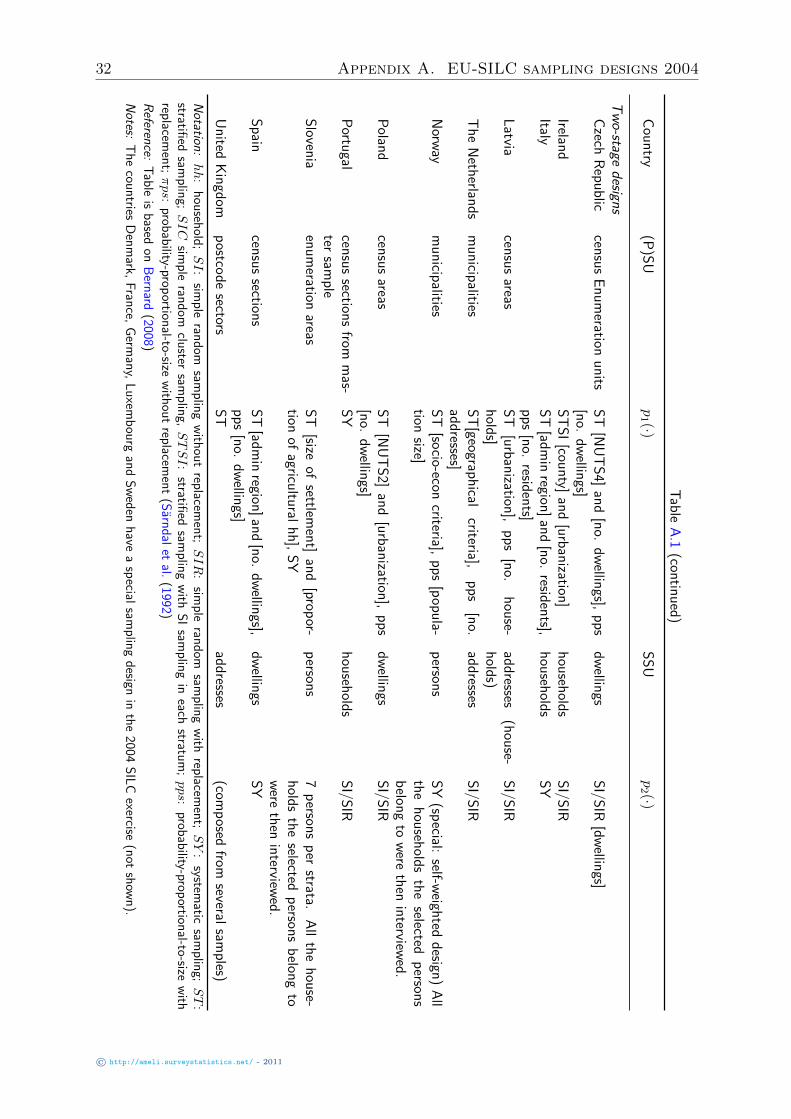
2007 (see Eurostat, 2009d). We can note that, in 2007, we have either sampling ofaddresses, or sampling of households or sampling of individuals. Although, there are stillmany differences between the countries (sampling frame, sampling designs), we can notethat the most used sampling design is the stratified multi-stage sampling design. A sum-mary of all used sampling designs (2004), written by Tobias Schoch (FHNW), is givenin the Appendix. More information can be found in the above cited report. In general,it would be rather restrictive to recommend a single sampling design, as each countryuses specific designs. We are only able to point out the large use of stratified multi-stagesampling.
In Eurostat (2009d), Annex 5, Table 13, we can see whether the EU-SILC countries usethe recommended definition for the household income components, i.e. the gross incomecomponents. For the variable HY 020, which is in the core of the calculation of theequivalised disposable income, see Chapter 2, we can note that the definitions used by allcountries, in 2007, are either fully or largely comparable to the recommended definition.
For the simulations, it is not really possible to use the gross income variables. What wecan recommend is that a sufficient number of the principal income components be usedfor approximately reproducing the empirical gross total equivalised income.
3.3 Acknowledgements
We would like to acknowledge the contributions of Andreas Alfons (TUW), who haswritten the R code for calculating european Laeken indicators, given in a supplement tothis document, and Tobias Schoch (FHNW) who has written a summary on EU-SILC2004 samling designs, given in the Appendix.
© http://ameli.surveystatistics.net/ - 2011
Bibliography
Ardilly, P. and Lavallee, P. (2007): Weighting in rotating samples: The SILC surveyin France. Survey Methodology, Vol. 33 (No. 2), pp. pp. 131–137.URL http://www.statcan.ca/english/freepub/12-001-XIE/2007002/article/
10490-en.pdf
Bernard, B. (2008): EU-SILC User Database Description. Version 2006-1, EuropeanCommission. Directorate F: Social Statistics and Information Society, Luxembourg.
Bernard, B. (2009): EU-SILC User Database Description. Version 2007-2, EuropeanCommission. Directorate F: Social Statistics and Information Society, Luxembourg.
Central Statistical Office of Poland (2007): EU-SILC 2005 Operation. Final QualityReport, Central Statistical Office of Poland, Warsaw.
Central Statistical Office of Poland (2008): EU-SILC 2006 Operation. Final QualityReport, Central Statistical Office of Poland, Warsaw.
Clemenceau, A. and Museux, J.-M. (2007): EU-SILC (Community Statistics on In-come and Instrument). Comparative EU Statistics on Income and Living Conditions :Issues and Challenges. Proceedings of the EU-SILC conference (Helsinki, 6-8 November2006), pp. 11–36.URL http://epp.eurostat.ec.europa.eu/cache/ITY_OFFPUB/KS-RA-07-007/EN/
KS-RA-07-007-EN.PDF
Eurostat (2003a): Commission Regulation (EC) No 1983/2003. Report, EuropeanCommission. Directorate F: Social Statistics and Information Society.URL http://eur-lex.europa.eu/LexUriServ/LexUriServ.do?uri=OJ:L:2003:
298:0034:0085:EN:PDF
Eurostat (2003b): First Ideas on Weighting. Technical report, European Commission.Directorate E: Social statistics. Meeting of the Task Force. Statistics on Income andLiving Conditions.
Eurostat (2003c): First Ideas on Weighting. EU-SILC 123/03 Addendum, EuropeanCommission. Directorate E: Social statistics. Meeting of the Task Force. Statistics onIncome and Living Conditions, Luxembourg.
Eurostat (2004a): Commission Regulation (EC) No 28/2004. Report, EuropeanCommission. Directorate F: Social Statistics and Information Society.URL http://eur-lex.europa.eu/LexUriServ/LexUriServ.do?uri=OJ:L:2004:
005:0042:0056:EN:PDF
AMELI-WP5-D5.1
26 Bibliography
Eurostat (2004b): Cross-Sectional Weighting: First Year of Each Sub-Sample. EU-SILC134/04, European Commission. Directorate D: Single Market, Employment and SocialStatistics. Meeting of the Working Group, Statistics on Income and Living ConditionsStatistics on Income and Living Conditions.
Eurostat (2004c): First Ideas on Weighting for Child Care Data. Technical report,European Commission. Directorate D: Single Market, Employment and Social statistics.Meeting of the Task Force, Statistics on Income and Living Conditions.
Eurostat (2005): Cross-Sectional Weighting: From second year of the survey onwards.Technical report, European Commission. Directorate D: Single Market, Employmentand Social statistics.
Eurostat (2008a): Comparative Final EU Quality Report 2005 (Version 2). Report,European Commission. Directorate F: Social Statistics and Information Society.URL http://circa.europa.eu/Public/irc/dsis/eusilc/library?l=/quality_
assessment/comparative_quality_1/comparative_2005/_EN_1.0_&a=d
Eurostat (2008b): Description of Secondary Target Variables: Module 2007. EU-SILC065/Annex, European Commission. Directorate F: Social statistics and informationsociety.
Eurostat (2008c): Description of SILC User Database Secondary Target Variables, Mod-ule 2005: Inter-generational transmission of poverty. Version 2005.2. Technical report,European Commission. Directorate E: Social and regional statistics and geographicalinformation system.
Eurostat (2008d): Description of SILC User Database Secondary Target Variables:Module 2006: Social Participation. Version 2006.1. Technical report, European Com-mission. Directorate E: Social and regional statistics and geographical information sys-tem.
Eurostat (2008e): Description of SILC User Database Variables: Cross-sectional andLongitudinal. Version 2006.1, European Commission. Directorate F: Social Statisticsand Information Society.URL http://circa.europa.eu/Public/irc/dsis/eusilc/library?l=/data_
dissemination/udb_user_database/variables_descriptiondoc/_EN_1.0_&a=d
Eurostat (2008f): Harmonisation of SILC and EHIS Questions on Health. Guidelinesfor the Health Questions in SILC from 2008 Operation Onwards. Technical report,European Commission. Directorate F: Social statistics and Information Society. UnitF-3: Living conditions and social protection statistics. Unit F-5: Health and food safetystatistics.
Eurostat (2009a): Algorithms to compute Overarching indicators based on EU-SILCand adopted under the Open Method of Coordination (OMC). Technical report,European Commission. Directorate F: Social Statistics and Information Society.URL http://circa.europa.eu/Public/irc/dsis/eusilc/library?l=/data_
dissemination/42_indicators/methodology_040209/_EN_1.0_&a=d
© http://ameli.surveystatistics.net/ - 2011
Bibliography 27
Eurostat (2009b): Algorithms to compute Pensions Indicators based on EU-SILCand adopted under the Open Method of Coordination. Doc LC/18/07/EN, EuropeanCommission. Directorate F: Social statistics and information society.URL http://circa.europa.eu/Public/irc/dsis/eusilc/library?l=/data_
dissemination/42_indicators/pensions_portfolio/_EN_1.0_&a=d
Eurostat (2009c): Comparative Final EU Quality Report 2006 (Version 3). Report,European Commission. Directorate F: Social Statistics and Information Society.URL http://circa.europa.eu/Public/irc/dsis/eusilc/library?l=/quality_
assessment/comparative_quality_1/final_euqr06_version/_EN_1.0_&a=d
Eurostat (2009d): Comparative Intermediate EU Quality Report 2007 (Version 5).Report, European Commission. Directorate F: Social Statistics and InformationSociety.URL http://circa.europa.eu/Public/irc/dsis/eusilc/library?l=/quality_
assessment/comparative_quality_1/intermediate_euqr07/_EN_1.0_&a=d
Eurostat (2009e): Description of SILC User Database Variables: Cross-sectional andLongitudinal. Version 2007.2, European Commission. Directorate F: Social Statisticsand Information Society.
Eurostat (2009f): Description of Target Variables: cross-sectional and longitudinal.EU-SILC 065 (2009 operation), European Commission.URL http://circa.europa.eu/Public/irc/dsis/eusilc/library?
l=/guidelines_questionnaire/operation_guidelines_1/silc065_
highlightedpdf/_EN_1.0_&a=d
Eurostat (2010): Description of Target Variables: cross-sectional and longitudinal.EU-SILC 065 (2008 operation), European Commission.URL http://circa.europa.eu/Public/irc/dsis/eusilc/library?l=
/guidelines_questionnaire/operation_guidelines/silc065_version/_EN_1.
0_&a=d
Federal Statistical Office Germany (2007): Quality Report on EU-SILC 2005. FinalReport, Federal Statistical Office Germany.
Federal Statistical Office Germany (2008): Quality Report on EU-SILC 2006. Inter-mediate Report, Federal Statistical Office Germany.
Figari, F., Levy, H. and Sutherland, H. (2007): Using the EU-SILC for Policy Sim-ulation: Prospects, Some Limitations and some Suggestions Perspective. ComparativeEU Statistics on Income and Living Conditions : Issues and Challenges. Proceedingsof the EU-SILC conference (Helsinki, 6-8 November 2006), pp. 347–368.URL http://epp.eurostat.ec.europa.eu/cache/ITY_OFFPUB/KS-RA-07-007/EN/
KS-RA-07-007-EN.PDF
Graf, E. (2009): Weightings of the Swiss Household Panel SHP I wave 9, SHP II wave4, SHP I and SHP II combined. Methodology Report 338-0058 / ISBN: 978-3-303-00425-8, Swiss Federal Statistical Office.URL http://www.bfs.admin.ch/bfs/portal/en/index/news/publikationen.
Document.126386.pdf
AMELI-WP5-D5.1
28 Bibliography
Kerm, P. V. (2007a): Extreme Incomes and the Estimation of Poverty and InequalityIndicators from EU-SILC. IRISS Working Papers Series, IRISS.URL http://iriss.ceps.lu/documents/irisswp69.pdf
Kerm, P. V. (2007b): Extreme Incomes and the Estimation of Poverty and InequalityIndicators from EU-SILC. Comparative EU Statistics on Income and Living Conditions: Issues and Challenges. Proceedings of the EU-SILC conference (Helsinki, 6-8 Novem-ber 2006), pp. 83–94.URL http://epp.eurostat.ec.europa.eu/cache/ITY_OFFPUB/KS-RA-07-007/EN/
KS-RA-07-007-EN.PDF
Leiten, E. and Traat, I. (2008): Variance of Laeken Indicators in Complex Surveys.Technical report, Statistical Office of Estonia.
Osier, G. and Museux, J.-M. (2006): Variance Estimation for EU-SILC ComplexPoverty Indicators using Linearization Techniques. Technical report, European Confer-ence on Quality in Survey Statistics, Proceedings of Q2006.
Osier, G., Museux, J.-M., Seoane, P. and Verma, V. (2006): Cross-sectional andLongitudinal Weighted for the EU-SILC Rotational Design. Working paper, Universitadegli Studi di Siena.URL http://www.iser.essex.ac.uk/files/survey/ulsc/
methodological-research/mols-2006/scientific-social-programme/papers/
Osier.pdf
Sarndal, C.-E., Swensson, B. and Wretman, J. (1992): Model Assisted SurveySampling. New York: Springer.
Statistical Office of the Republic of Slovenia (2007a): Final Quality Report EU-SILC 2005 (draft). Final Report, Statistical Office of the Republic of Slovenia.
Statistical Office of the Republic of Slovenia (2007b): Intermediate Quality Report:EU-SILC 2006 (draft). Intermediate Report, Statistical Office of the Republic of Slov-enia, rihard Inglic, Marta Arnez, Rudi Seljak, Matija Remec, Stanka Intihar, MartinaStare.
Statistics Austria (2004): Quality Report relating to EU-SILC 2003 Operation. Tech-nical report, Statistics Austria, Vienna.
Statistics Austria (2005): Quality Report relating to EU-SILC 2004 Operation. Tech-nical report, Statistics Austria, Vienna.
Statistics Austria (2007): Final Technical and Financial Implementation Report Re-lating to the EU-SILC 2005 Operation. Final Report, Statistics Austria, Vienna.
Statistics Austria (2008a): Final Quality Report relating to the EU-SILC Operation2004-2006. Final Report, Statistics Austria, Vienna.
Statistics Austria (2008b): Intermediate Quality Report relating to the EU-SILC 2007Operation. Intermediate Report, Statistics Austria.
© http://ameli.surveystatistics.net/ - 2011

Bibliography 29
Statistics Estonia (2006): EU-SILC 2004 in Estonia: Final Quality Report. FinalReport, Statistics Estonia.
Statistics Estonia (2007a): EU-SILC 2005 in Estonia: Final Quality Report. FinalReport, Statistics Estonia, Tallinn.
Statistics Estonia (2007b): EU-SILC 2006 in Estonia: Intermediate Quality Report.Intermediate Report, Statistics Estonia, Tallinn.
Statistics Finland (2005): Intermediate Quality Report of the Finnish EU-SILC 2004.Intermediate Report, Statistics Finland.
Statistics Finland (2007): Intermediate Quality Report relating to the EU-SILC 2006Operation in Finland. Intermediate Report, Statistics Finland, pauli Ollila, Marie Reijo,Hannele Sauli.
Statistics Finland (2008): Final Quality Report relating to the EU-SILC 2005 opera-tion. Final Report, Statistics Finland, pauli Ollila, Marie Reijo, Hannele Sauli.
Verma, V. (2006): Output II.1(b). EU-SILC weighting procedures: an outline. Technicalreport, ISR: International Social Research.
Verma, V. (2007): Issues in Data Quality and Comparability in EU-SILC. ComparativeEU Statistics on Income and Living Conditions : Issues and Challenges. Proceedingsof the EU-SILC conference (Helsinki, 6-8 November 2006), pp. 287–309.
Verma, V., Betti, G. and Ghellini, G. (2007): Cross-Sectional and LongitudinalWeighting in a Rotational Household Panel: Applications to EU-SILC in Statistics.Statistics in Transition-new series, 8 (1), pp. 5–50.
AMELI-WP5-D5.1
Appendix A
EU-SILC sampling designs 2004
© http://ameli.surveystatistics.net/ - 2011
31
Tab
leA
.1:
Sum
mar
yof
the
2004
SIL
CSam
pling
Des
ign
Cou
ntr
y(P
)SU
p1(·)
SS
Up2(·)
Sim
pe
ran
dom
clu
ster
sam
ple
sA
ust
ria
hou
seh
old
add
ress
SI
[hou
seh
old
s](P
PS
no.
hh
mem
-b
ers)
;in
terv
iew
ofal
lh
ouse
hol
dm
emeb
ers
Icel
and
per
son
sag
ed16
and
mor
e(r
egis
ter)
SI
[per
son
s];
inte
rvie
wof
allh
ouse
hol
dm
emb
ers
Mal
tah
ouse
hol
ds
SI
[hou
seh
old
s](P
PS
no.
hh
mem
-b
ers)
;in
terv
iew
ofal
lhou
seh
old
mem
-b
ers
Str
atifi
edra
nd
om(c
lust
er)
sam
ple
sC
ypru
sS
TS
I[g
eogr
aph
ical
re-
gion
s]S
I[h
ouse
hol
ds]
Est
onia
ST
[cou
nty
size
]S
YS
Y[p
erso
ns]
;in
terv
iew
ofal
lh
ouse
-h
old
mem
ber
sL
ith
uan
iaS
TS
I[u
rban
izat
ion
]S
I[h
ouse
hol
ds]
Slo
vaki
aS
TS
I[N
UT
S3]
and
[urb
-an
izat
ion
]S
I[d
wel
lings
]
Tw
o-st
age
des
ign
sB
elgi
um
mu
nic
ipal
itie
sS
T[N
UT
S2]
,p
ps
[no.
hou
seh
old
]h
ouse
hol
ds
SY
(40
hh
per
PS
U)
Fin
lan
dp
erso
ns
from
regi
ster
(Mas
ter
sam
ple
)S
Y[p
erso
ns]
(aty
pic
alP
SU
)d
wel
lings
ST
SI
[so
cio-
econ
crit
eria
]
Gre
ece
blo
cks
ST
[NU
TS
2]an
d[u
rban
izat
ion
],p
ps
[no.
dw
ellin
gs]
add
ress
esS
Y
Hu
nga
ry1)
loca
litie
s/co
un
ties
ST
[ele
ctio
nd
istr
ict]
and
[no.
dw
ell-
ings
],p
ps
[no.
dw
ellin
gs]
dw
ellin
gsS
Y
2)b
lock
sS
T[e
lect
ion
dis
tric
t]an
d[n
o.d
wel
l-in
gs],
SY
continued
onnextpag
e
AMELI-WP5-D5.1
32 Appendix A. EU-SILC sampling designs 2004
Tab
leA
.1(con
tinu
ed)
Cou
ntry
(P)S
Up1 (·)
SS
Up2 (·)
Tw
o-staged
esigns
Czech
Rep
ub
liccen
sus
En
um
erationu
nits
ST
[NU
TS
4]an
d[n
o.d
wellin
gs],p
ps
[no.
dw
ellings]
dw
ellings
SI/S
IR[d
wellin
gs]
Ireland
ST
SI
[coun
ty]an
d[u
rban
ization]
hou
sehold
sS
I/SIR
ItalyS
T[ad
min
region]
and
[no.
residen
ts],p
ps
[no.
residen
ts]h
ouseh
olds
SY
Latvia
censu
sareas
ST
[urb
anization
],p
ps
[no.
hou
se-h
olds]
add
resses(h
ouse-
hold
s)S
I/SIR
Th
eN
etherlan
ds
mu
nicip
alitiesS
T[geograp
hical
criteria],p
ps
[no.
add
resses]ad
dresses
SI/S
IR
Norw
aym
un
icipalities
ST
[socio-econ
criteria],p
ps
[pop
ula-
tionsize]
person
sS
Y(sp
ecial:self-w
eighted
design
)A
llth
eh
ouseh
olds
the
selectedp
ersons
belon
gto
were
then
interview
ed.
Polan
dcen
sus
areasS
T[N
UT
S2]
and
[urb
anization
],p
ps
[no.
dw
ellings]
dw
ellings
SI/S
IR
Portu
galcen
sus
sections
fromm
as-ter
samp
leS
Yh
ouseh
olds
SI/S
IR
Sloven
iaen
um
erationareas
ST
[sizeof
settlemen
t]an
d[prop
or-tion
ofagricu
ltural
hh
],S
Yp
ersons
7p
ersons
per
strata.A
llth
eh
ouse-
hold
sth
eselected
person
sb
elong
tow
ereth
enin
terviewed
.S
pain
censu
ssection
sS
T[ad
min
region]
and
[no.
dw
ellings],
pp
s[n
o.d
wellin
gs]d
wellin
gsS
Y
Un
itedK
ingd
omp
ostcod
esectors
ST
add
resses(com
posed
fromseveral
samp
les)
Notation
:hh
:h
ouseh
old;SI
:sim
ple
rand
omsam
plin
gw
ithou
trep
lacemen
t;SIR
:sim
ple
rand
omsam
plin
gw
ithrep
lacemen
t;SY
:system
aticsam
plin
g;ST
:stratifi
edsam
plin
g;SIC
simp
leran
dom
cluster
samp
ling,STSI
:stratifi
edsam
plin
gw
ithS
Isam
plin
gin
eachstratu
m;pps:
probab
ility-proportion
al-to-sizew
ithrep
lacemen
t;πps:
probab
ility-proportion
al-to-sizew
ithou
trep
lacemen
t(S
arnd
alet
al.(1992)
Referen
ce:T
able
isb
asedon
Bern
ard(2008)
Notes:
Th
ecou
ntries
Den
mark,
Fran
ce,G
erman
y,L
uxem
bou
rgan
dS
wed
enh
avea
special
samp
ling
design
inth
e2004
SIL
Cexercise
(not
show
n).
© http://ameli.surveystatistics.net/ - 2011