Embed Size (px)
Citation preview
Quality of doctor-patient communication in cardiovascular diseases
and secondary preventive adherence
The role of genderBarbara BUCKI, Etienne LE BIHAN, Michèle BAUMANN
Institute Health & Behaviour, Research Unit INSIDE, University of Luxembourg
Cardiovascular diseases and secondary preventive behaviours
Cardiovascular diseases in Luxembourg
The leading cause of mortality
Major reason for hospital admission (2012)
Main risk factors
Diabetes, hypertension, hypercholesterolemia, overweight
Common instructions
Planning follow-up visits
Taking medication
Changing lifestyle – eating habits, physical activity, tobacco cessation...
2
Doctor-patient communication and adherence to preventive behaviours
Results from a study conducted in Luxembourg (Baumann & al., 2016)
Quality of communication was significantly associated with:
Increased consumption of fruit & vegetables
Reduction of salt intake
Reduction or cessation of sugar consumption
No link with declared physical activity, smoking, and fat consumption
3
Are these effects different regarding gender?
Objectives
Identify the relationship between the quality of practitioner-patient communication and patients’ adherence to preventive eatingbehaviours with respect to their:
Cardiovascular risk factors
Gender
4
Background Methods Findings Discussion
Methods
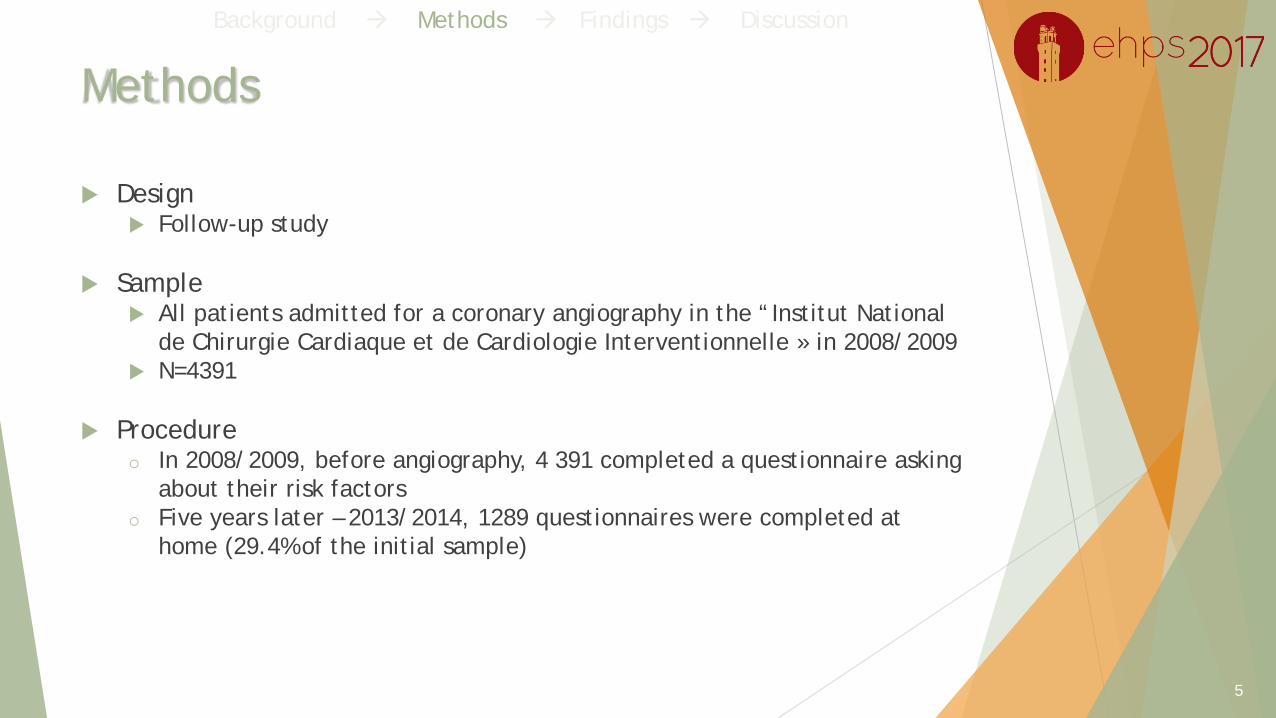
Design Follow-up study
Sample All patients admitted for a coronary angiography in the “Institut National
de Chirurgie Cardiaque et de Cardiologie Interventionnelle » in 2008/2009 N=4391
Procedureo In 2008/2009, before angiography, 4 391 completed a questionnaire asking
about their risk factorso Five years later – 2013/2014, 1289 questionnaires were completed at
home (29.4% of the initial sample)
5
Background Methods Findings Discussion
Variables assessed
6
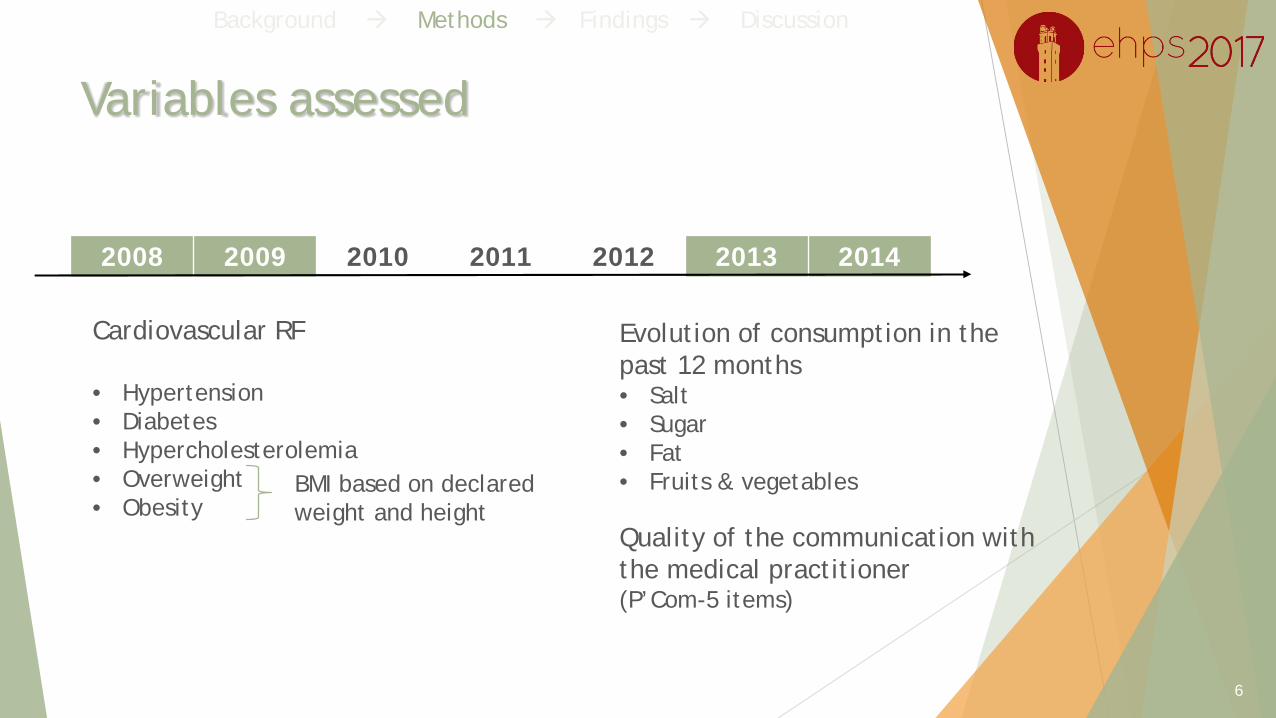
Cardiovascular RF
• Hypertension• Diabetes• Hypercholesterolemia• Overweight• Obesity
Evolution of consumption in the past 12 months• Salt• Sugar• Fat• Fruits & vegetables
Quality of the communication with the medical practitioner(P’Com-5 items)
2008 2009 2010 2011 2012 2013 2014
Background Methods Findings Discussion
BMI based on declaredweight and height
P’Com – 5 items *
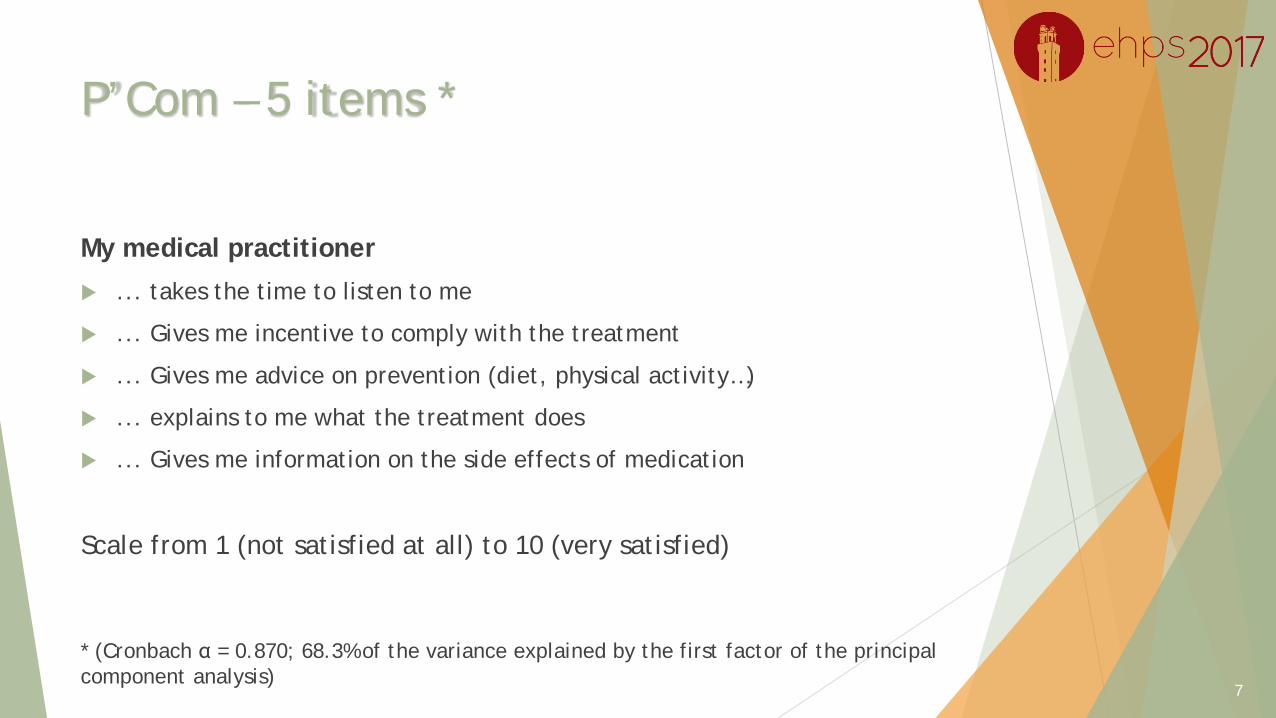
My medical practitioner
... takes the time to listen to me
... Gives me incentive to comply with the treatment
... Gives me advice on prevention (diet, physical activity…)
... explains to me what the treatment does
... Gives me information on the side effects of medication
Scale from 1 (not satisfied at all) to 10 (very satisfied)
7
* (Cronbach α = 0.870; 68.3% of the variance explained by the first factor of the principal component analysis)
Statistical analyses
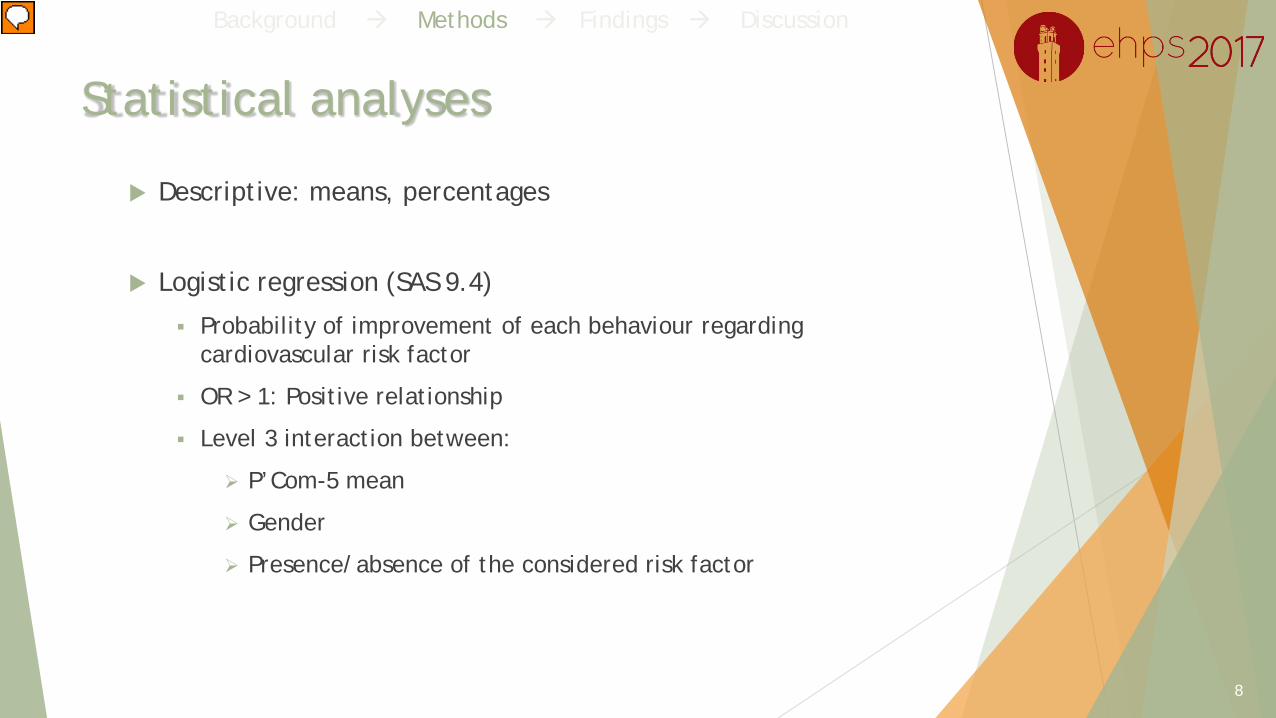
Descriptive: means, percentages
Logistic regression (SAS 9.4)
Probability of improvement of each behaviour regarding cardiovascular risk factor
OR > 1: Positive relationship
Level 3 interaction between:
P’Com-5 mean
Gender
Presence/absence of the considered risk factor
8
Background Methods Findings Discussion

Findings
9
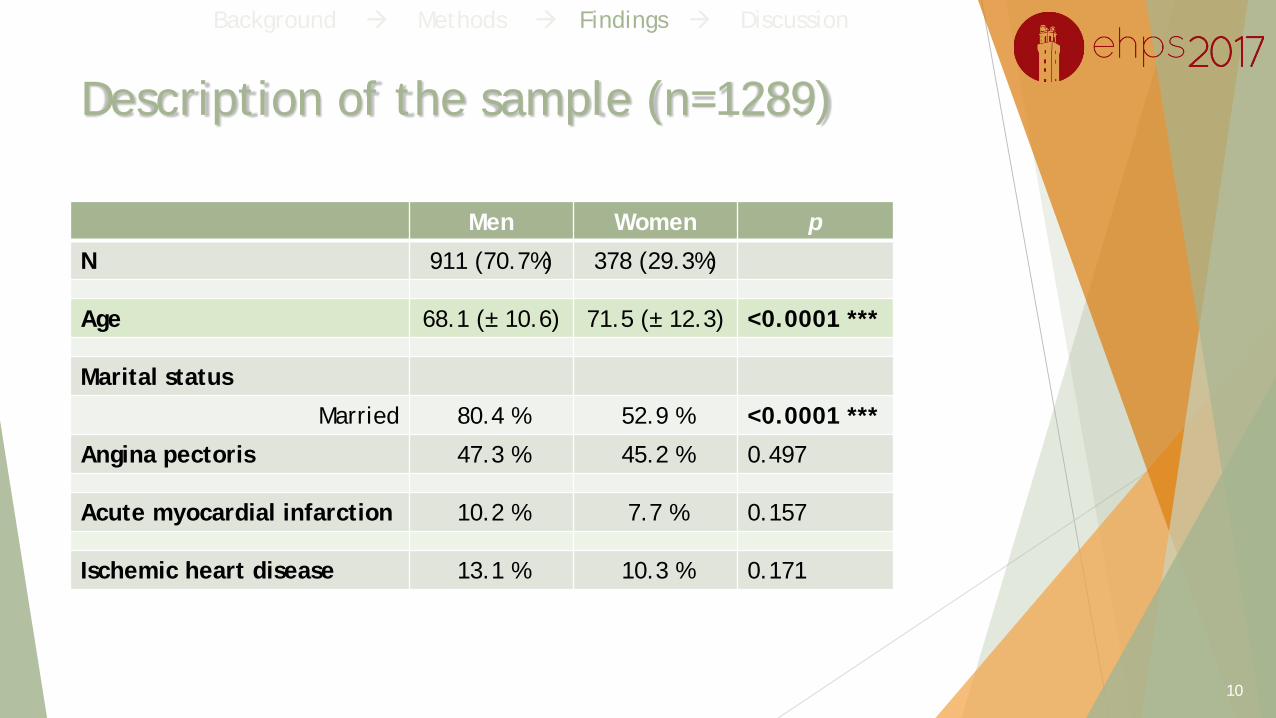
Description of the sample (n=1289)
1 289 participantsMen Women p
N 911 (70.7%) 378 (29.3%)
Age 68.1 (± 10.6) 71.5 (± 12.3) <0.0001 ***
Marital status
Married 80.4 % 52.9 % <0.0001 ***
Angina pectoris 47.3 % 45.2 % 0.497
Acute myocardial infarction 10.2 % 7.7 % 0.157
Ischemic heart disease 13.1 % 10.3 % 0.171
10
Background Methods Findings Discussion
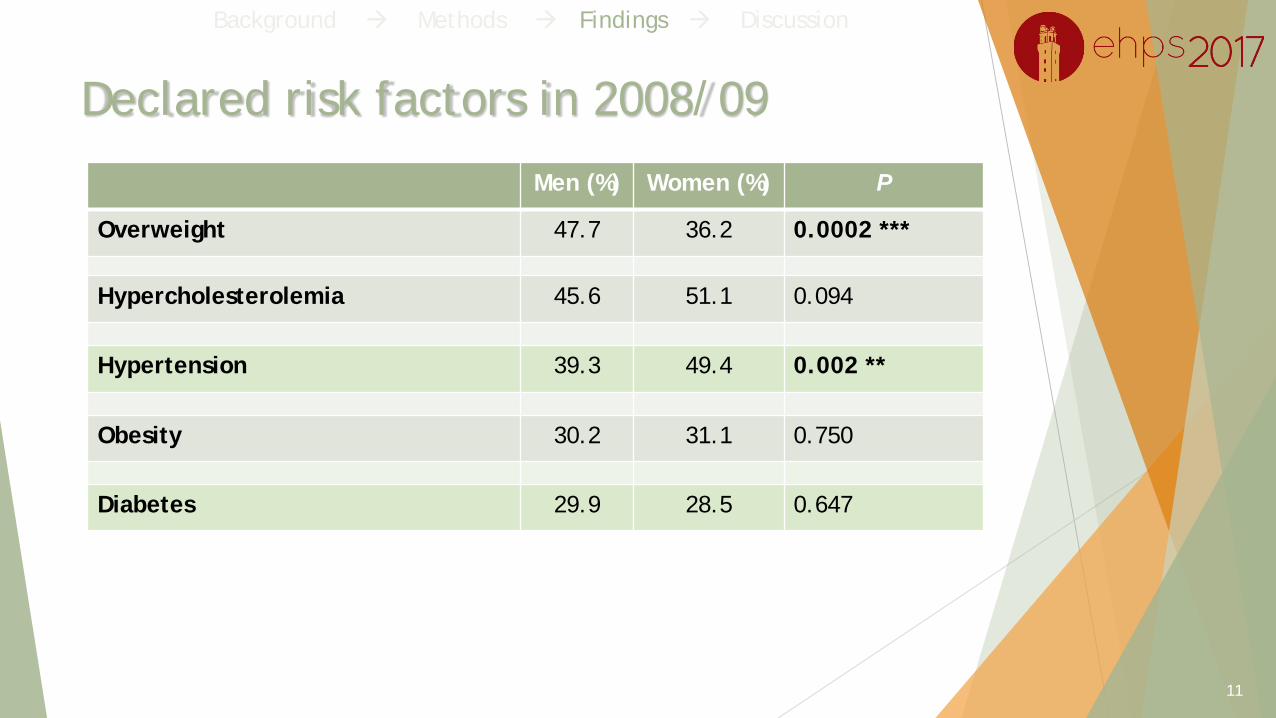
Declared risk factors in 2008/09
11
Background Methods Findings Discussion
Men (%) Women (%) P
Overweight 47.7 36.2 0.0002 ***
Hypercholesterolemia 45.6 51.1 0.094
Hypertension 39.3 49.4 0.002 **
Obesity 30.2 31.1 0.750
Diabetes 29.9 28.5 0.647
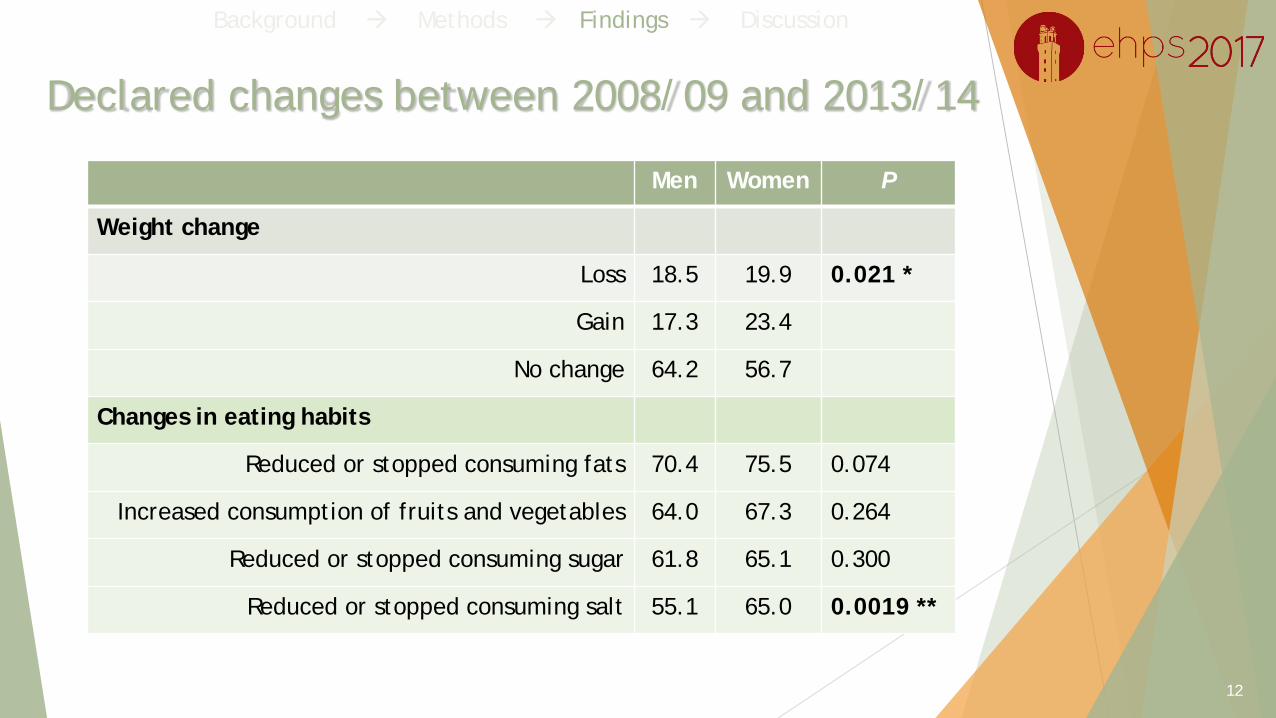
Declared changes between 2008/09 and 2013/14
1 289 participants
Men Women P
Weight change
Loss 18.5 19.9 0.021 *
Gain 17.3 23.4
No change 64.2 56.7
Changes in eating habits
Reduced or stopped consuming fats 70.4 75.5 0.074
Increased consumption of fruits and vegetables 64.0 67.3 0.264
Reduced or stopped consuming sugar 61.8 65.1 0.300
Reduced or stopped consuming salt 55.1 65.0 0.0019 **
12
Background Methods Findings Discussion
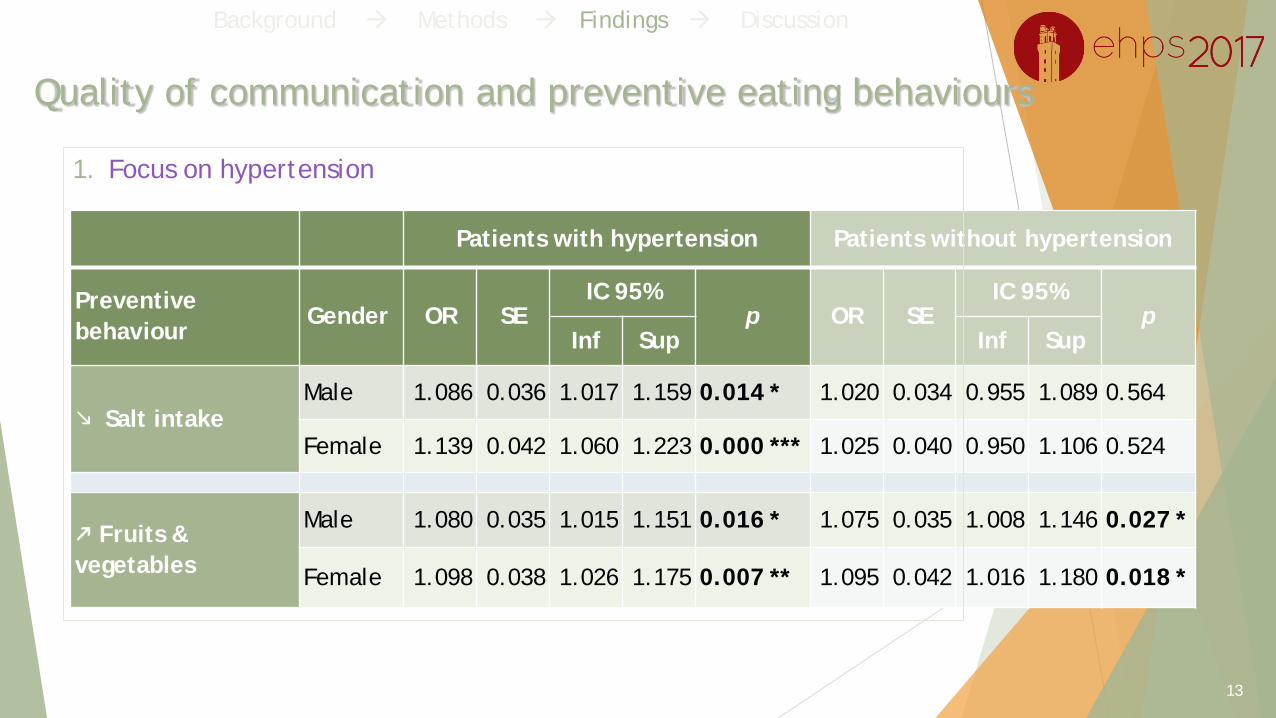
Quality of communication and preventive eating behaviours
Patients with hypertension Patients without hypertension
Preventive behaviour
Gender OR SEIC 95%
p OR SEIC 95%
pInf Sup Inf Sup
Salt intakeMale 1.086 0.036 1.017 1.159 0.014 * 1.020 0.034 0.955 1.089 0.564
Female 1.139 0.042 1.060 1.223 0.000 *** 1.025 0.040 0.950 1.106 0.524
Fruits & vegetables
Male 1.080 0.035 1.015 1.151 0.016 * 1.075 0.035 1.008 1.146 0.027 *
Female 1.098 0.038 1.026 1.175 0.007 ** 1.095 0.042 1.016 1.180 0.018 *
1. Focus on hypertension
13
Background Methods Findings Discussion
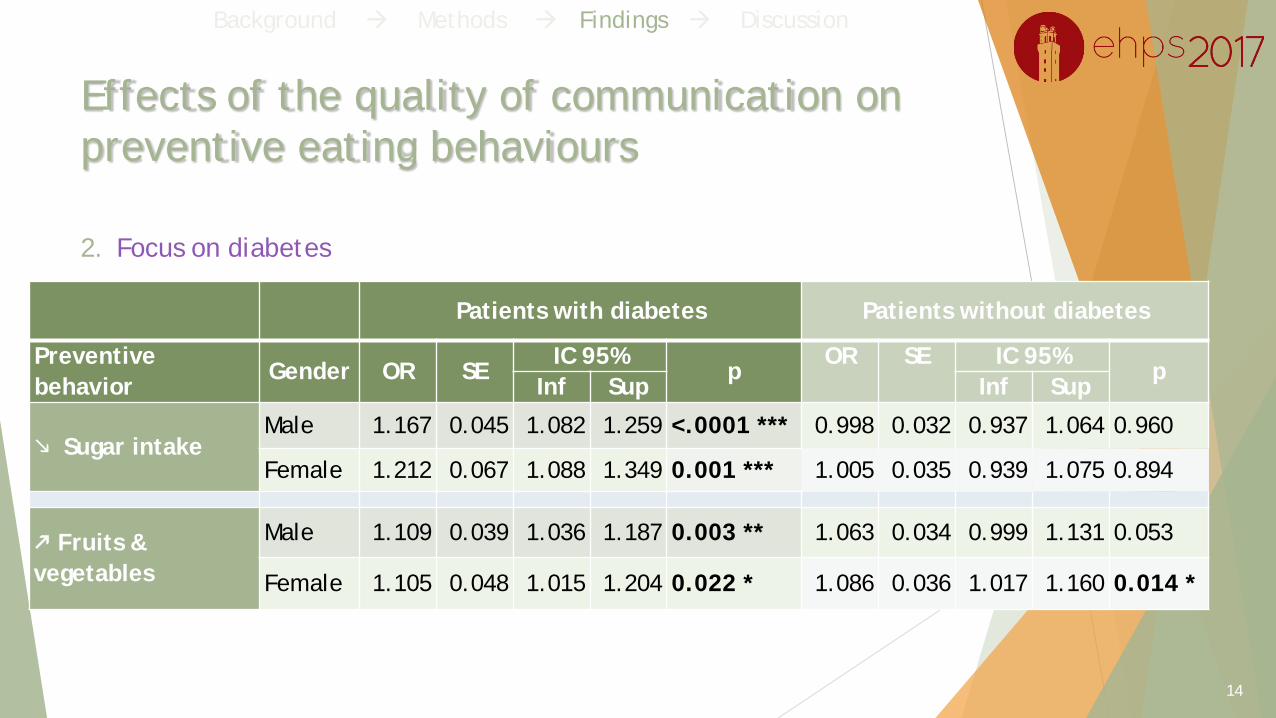
Patients with diabetes Patients without diabetes
Preventive behavior
Gender OR SEIC 95%
pOR SE IC 95%
pInf Sup Inf Sup
Sugar intakeMale 1.167 0.045 1.082 1.259 <.0001 *** 0.998 0.032 0.937 1.064 0.960
Female 1.212 0.067 1.088 1.349 0.001 *** 1.005 0.035 0.939 1.075 0.894
Fruits & vegetables
Male 1.109 0.039 1.036 1.187 0.003 ** 1.063 0.034 0.999 1.131 0.053
Female 1.105 0.048 1.015 1.204 0.022 * 1.086 0.036 1.017 1.160 0.014 *
Effects of the quality of communication on preventive eating behaviours
2. Focus on diabetes
14
Background Methods Findings Discussion
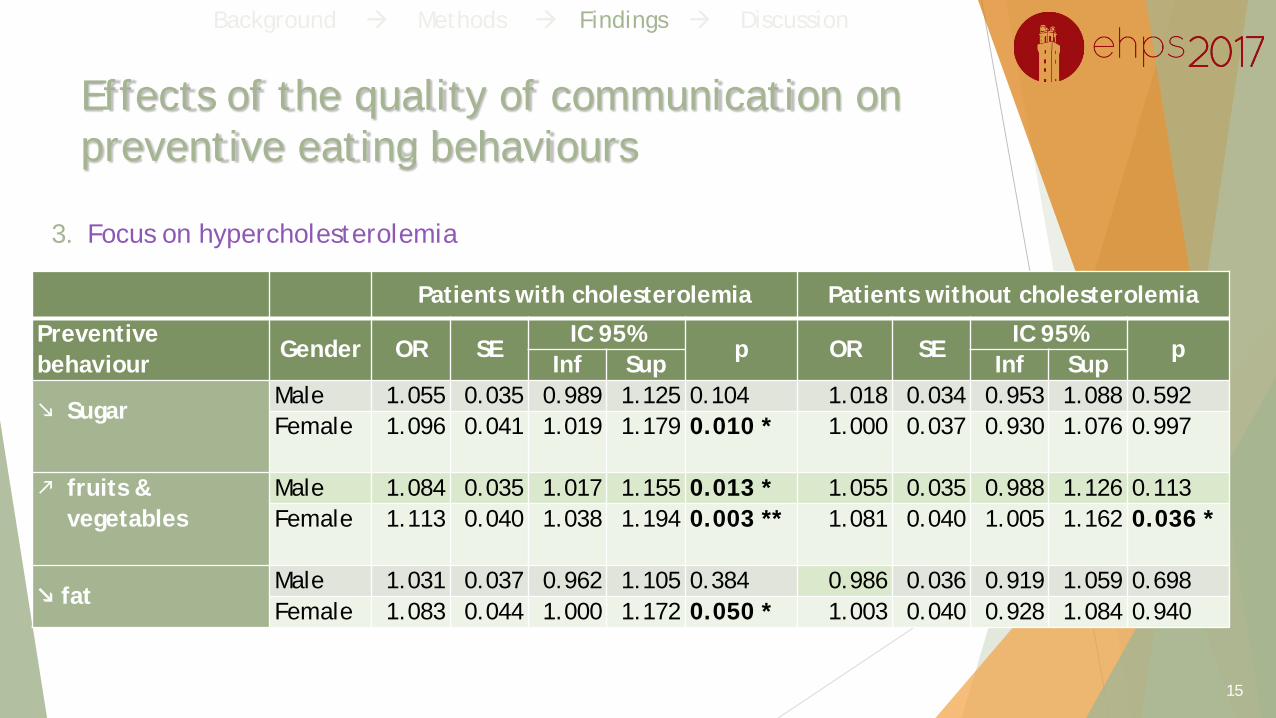
Effects of the quality of communication on preventive eating behaviours
Patients with cholesterolemia Patients without cholesterolemia
Preventive behaviour
Gender OR SEIC 95%
p OR SEIC 95%
pInf Sup Inf Sup
SugarMale 1.055 0.035 0.989 1.125 0.104 1.018 0.034 0.953 1.088 0.592Female 1.096 0.041 1.019 1.179 0.010 * 1.000 0.037 0.930 1.076 0.997
fruits & vegetables
Male 1.084 0.035 1.017 1.155 0.013 * 1.055 0.035 0.988 1.126 0.113Female 1.113 0.040 1.038 1.194 0.003 ** 1.081 0.040 1.005 1.162 0.036 *
fatMale 1.031 0.037 0.962 1.105 0.384 0.986 0.036 0.919 1.059 0.698Female 1.083 0.044 1.000 1.172 0.050 * 1.003 0.040 0.928 1.084 0.940
3. Focus on hypercholesterolemia
15
Background Methods Findings Discussion
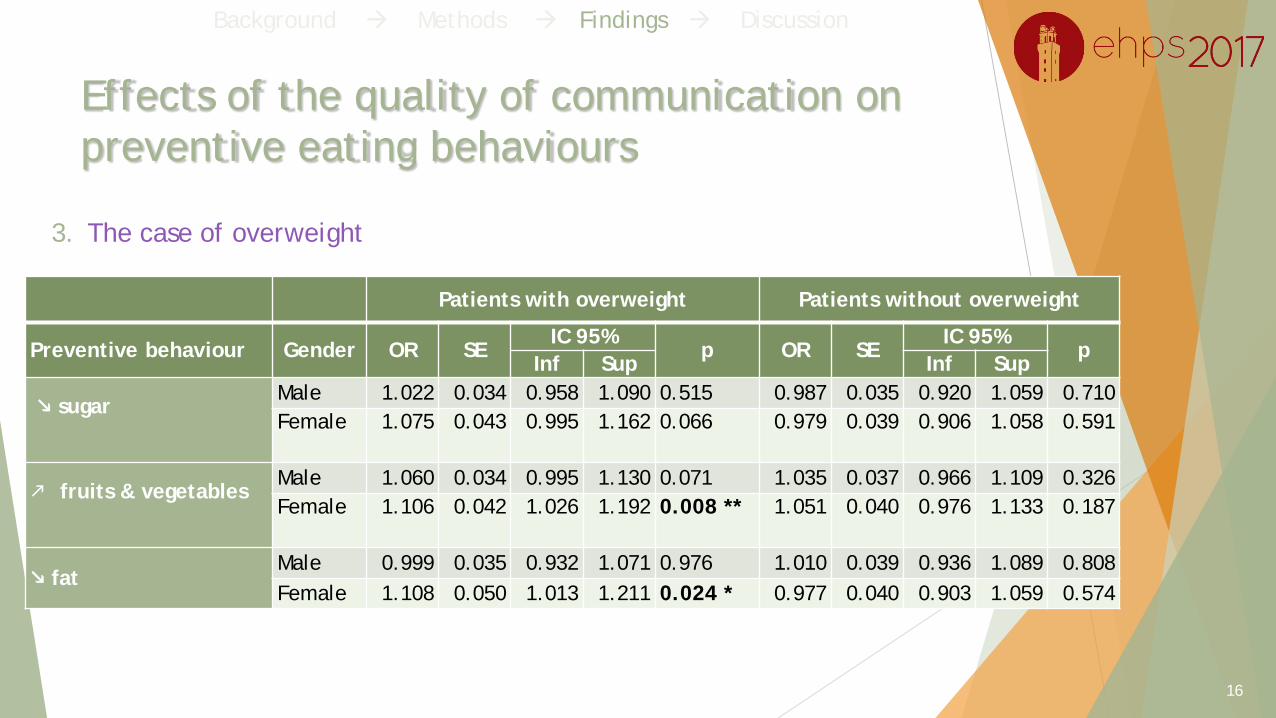
Patients with overweight Patients without overweight
Preventive behaviour Gender OR SEIC 95%
p OR SEIC 95%
pInf Sup Inf Sup
sugarMale 1.022 0.034 0.958 1.090 0.515 0.987 0.035 0.920 1.059 0.710Female 1.075 0.043 0.995 1.162 0.066 0.979 0.039 0.906 1.058 0.591
fruits & vegetablesMale 1.060 0.034 0.995 1.130 0.071 1.035 0.037 0.966 1.109 0.326Female 1.106 0.042 1.026 1.192 0.008 ** 1.051 0.040 0.976 1.133 0.187
fatMale 0.999 0.035 0.932 1.071 0.976 1.010 0.039 0.936 1.089 0.808Female 1.108 0.050 1.013 1.211 0.024 * 0.977 0.040 0.903 1.059 0.574
Effects of the quality of communication on preventive eating behaviours
3. The case of overweight
16
Background Methods Findings Discussion
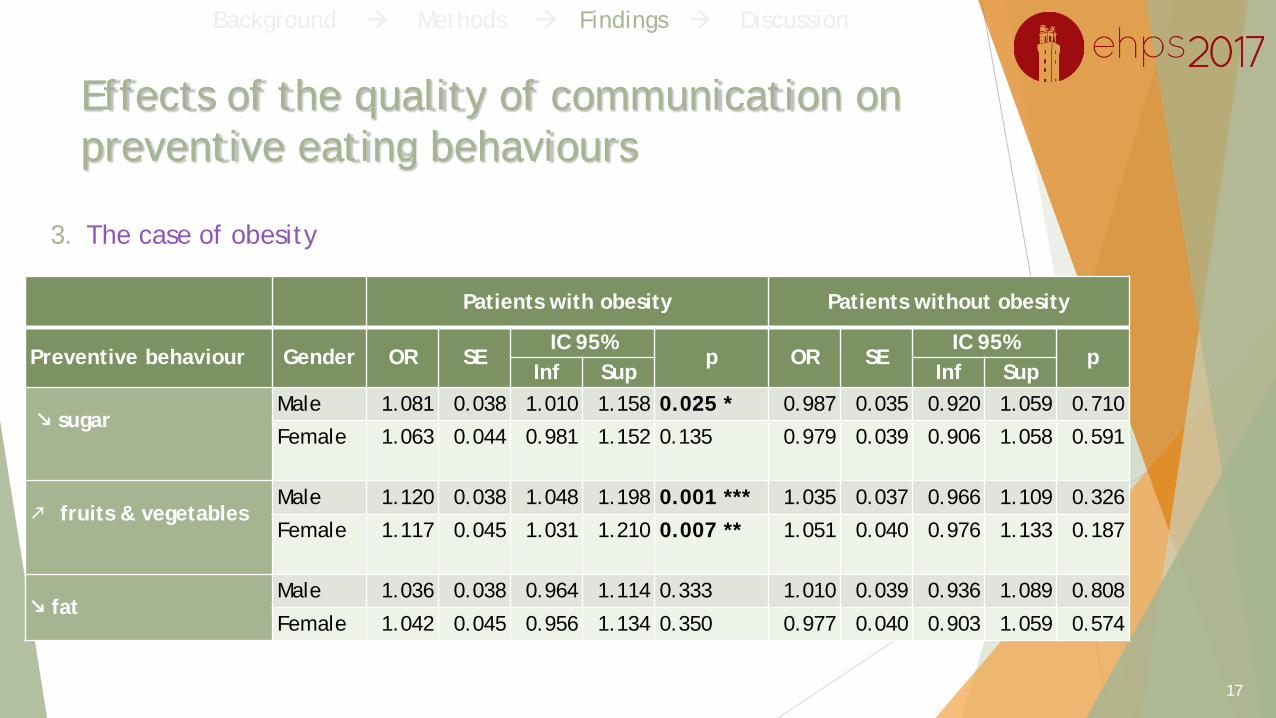
Patients with obesity Patients without obesity
Preventive behaviour Gender OR SEIC 95%
p OR SEIC 95%
pInf Sup Inf Sup
sugarMale 1.081 0.038 1.010 1.158 0.025 * 0.987 0.035 0.920 1.059 0.710
Female 1.063 0.044 0.981 1.152 0.135 0.979 0.039 0.906 1.058 0.591
fruits & vegetablesMale 1.120 0.038 1.048 1.198 0.001 *** 1.035 0.037 0.966 1.109 0.326
Female 1.117 0.045 1.031 1.210 0.007 ** 1.051 0.040 0.976 1.133 0.187
fatMale 1.036 0.038 0.964 1.114 0.333 1.010 0.039 0.936 1.089 0.808
Female 1.042 0.045 0.956 1.134 0.350 0.977 0.040 0.903 1.059 0.574
Effects of the quality of communication on preventive eating behaviours
3. The case of obesity
17
Background Methods Findings Discussion
Discussion
Especially in women, quality of the communication had an overalleffect on the adoption of secondary preventive eating behaviours
Increase of fruits and vegetables consumption was the adoptedpreventive behaviour associated with most risk factors
18
Background Methods Findings Discussion
Implications for practice and policy
Develop ways to rapidly understanding men/women’s visit-related expectations and concerns?
Direct questioning ("Is there anything in particular you were hoping I would do today?")
Polite hypothesis testing ("You look like there's something still on your mind?")
Vigorous exploration of the patient's explanatory model ("What do you think has caused your problem? Why do you think it started when it did?").
20