Embed Size (px)
Citation preview

Raid Al-Aomar, PhD
Professor of IE, Director of (MEM)
College of Engineering
Abu Dhabi University
Quality Methods: Sustainability Application

2
Agenda
� Introduction• Quality Methods
� Sustainability Aspects• Environmental
• Economic
• Social
� QFD Method
• House of Quality
• QFD for Sustainability
• QFD Examples
� Other Methods (Lean & Six Sigma)
� Discussion
3
Quality Engineering/Methods: The Know-How
of Total Quality Management
ISO Standards
PDCA-Kaizen
EFQM
TQM
Q
award
Basic Stat
Q & COPQ
Quality
Tools & Std.
QFD
Q
KH
SPC
6бEx
TQM Organization Quality Engineering

4
Quality Concept
• What is Quality?• Quality is the ability of a product or service to
consistently meet or exceed customer
expectations.
• Quality Pioneers• Quality aspects
• Product• Service
• Cost of Poor Quality: Quality & Cost dilemma, TLF, competitiveness
• Quality Awards & Certifications
Q

Factors to Consider When Quantifying the Costs of Poor Quality

6
Basic Quality Tools
� Quality tools for problem identification, representation, analysis, and solving:
Flow charts/Process Maps to understand the process
Seven Basic Tools
1. Check sheets
2. Histograms
3. Pareto chart
4. Cause-Effect diagram
5. Scatter Diagrams
6. Run/Control Charts
7. Stratification

ISO 9000 – TQM
7

8
I-P-O Measurement (SIPOC chart):
• Inputs Quality: Supplies, raw material, applications, supplies, services
• Process Quality: Operations, procedures, standards, resources, etc.
• Outputs Quality: Products, services, customer relations, etc.
Examples: Cost, Time, Delivery, Rejects, Complaints, Reliability
Process & System Level: QI P O
InputMeasures
ProcessMeasures
OutputMeasures
Suppliers Customers
Quality Metrics Feedback

� The 9 criteria of SKEA Quality award.
Organizational LevelTQM (EFQM-based Excellence models)
9

10
Sustainable & Green Design
Sustainable design is the philosophy of designing physical objects, the built environment, and services to comply with the principles of social, economic, and ecological sustainability.
https://en.wikipedia.org/wiki/Sustainable_design
Green Design and construction practices that significantly reduce, or eliminate the negative impact of buildings on the environment and its occupants.” (US Green Building Council)
Sustainability Approaches: site planning; safeguarding water use and water use efficiency; promoting energy efficiency and renewable energy; conserving materials and resources; and promoting indoor environmental quality

11

Leadership in Energy & Environmental Design®
A leading-edge system for designing, constructing, operating and certifying the world’s greenest buildings.
LEED project certification -provides independent, third-party verification that a building project meets the highest green building and performance measures.
United States Green Building Council (USGBC) issued a set of LEED guidelines in 2000.

Benefits of Green Building
� Environmental benefits:
• Enhance and protect
ecosystems and
biodiversity
• Improve air and water
quality
• Reduce solid waste
• Conserve natural
resources

Benefits of Green Building …
� Economic benefits:
• Reduce operating costs
• Enhance asset value and
profits
• Improve employee
productivity and
satisfaction
• Optimize life-cycle
economic performance

Benefits of Green Building …
� Health and community benefits: • Improve air, thermal, and
acoustic environments
• Enhance occupant comfort and health
• Minimize strain on local infrastructure
• Contribute to overall quality of life
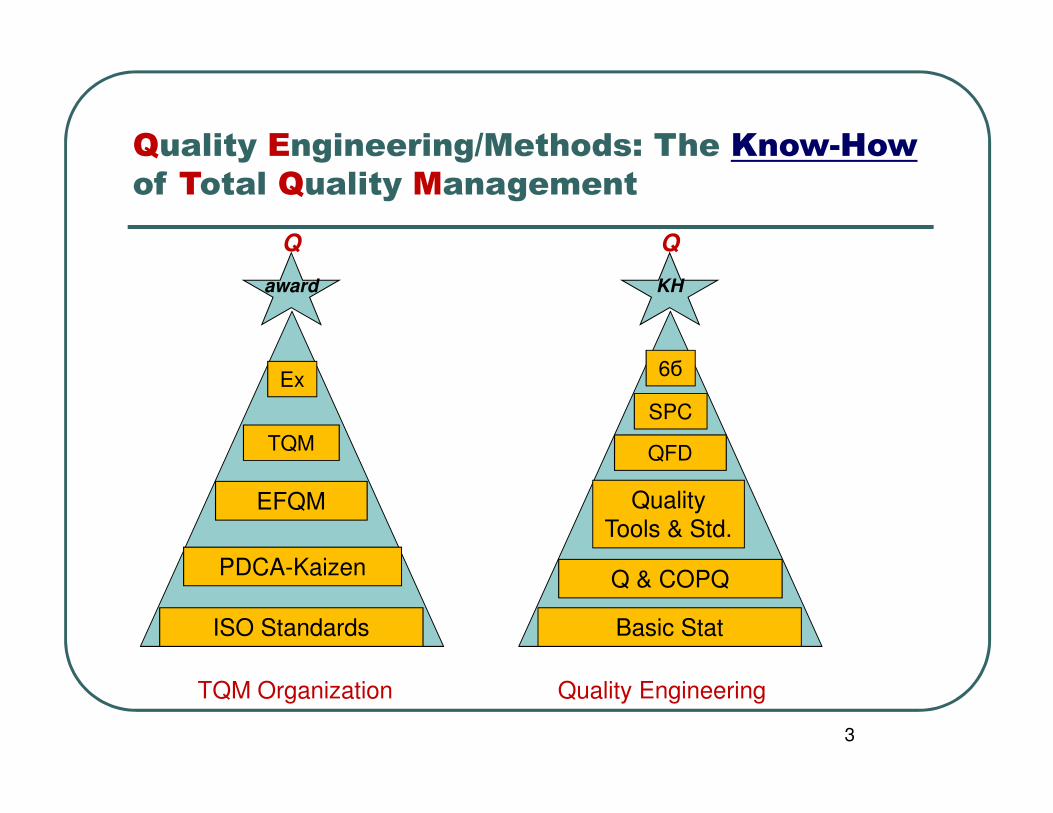
16
Building Ecosystem

� In a total quality setting, customers define quality. Therefore,
customer satisfaction must be the highest priority.
� Customer satisfaction is achieved by producing high-quality
products/services that meet or exceed expectations.
� Customer needs are not static. Therefore, constant contact with
customers is essential in a total quality setting.
� QFD can be used to update customer needs (get feedback
periodically) and enhance products/services accordingly.
QFD for customer satisfaction

Quality Function Deployment(House of Quality)
� The QFD’s House of Quality (HOQ) is the heart of QFD.
� It is the set of interrelated matrices known that take on the appearance of a house.

QFD in Sustainability: SFD
� QFD can be used to consider the sustainability requirements in the design (Sustainability Function Deployment: SFD).
� It makes sustainability requirements a normal part of architectural design, thereby improving the quality of living and the quality of the environment.
� In order to implement SFD, designers must innovate. They need to identify the mechanisms/actions/technical requirements that fulfill the sustainability requirements.
� QFD/SFD is a mechanism for innovation.

� Sustainability requirements
�Interior Air Quality
�Less Energy consumption
�Less Water consumption
�Clean external air
�Natural light
�others
� Each team should come up with a list of WHATs
� Team has to agree on their importance
� Team has to benchmark them with LEED & Estidamah
WHATs in SFD
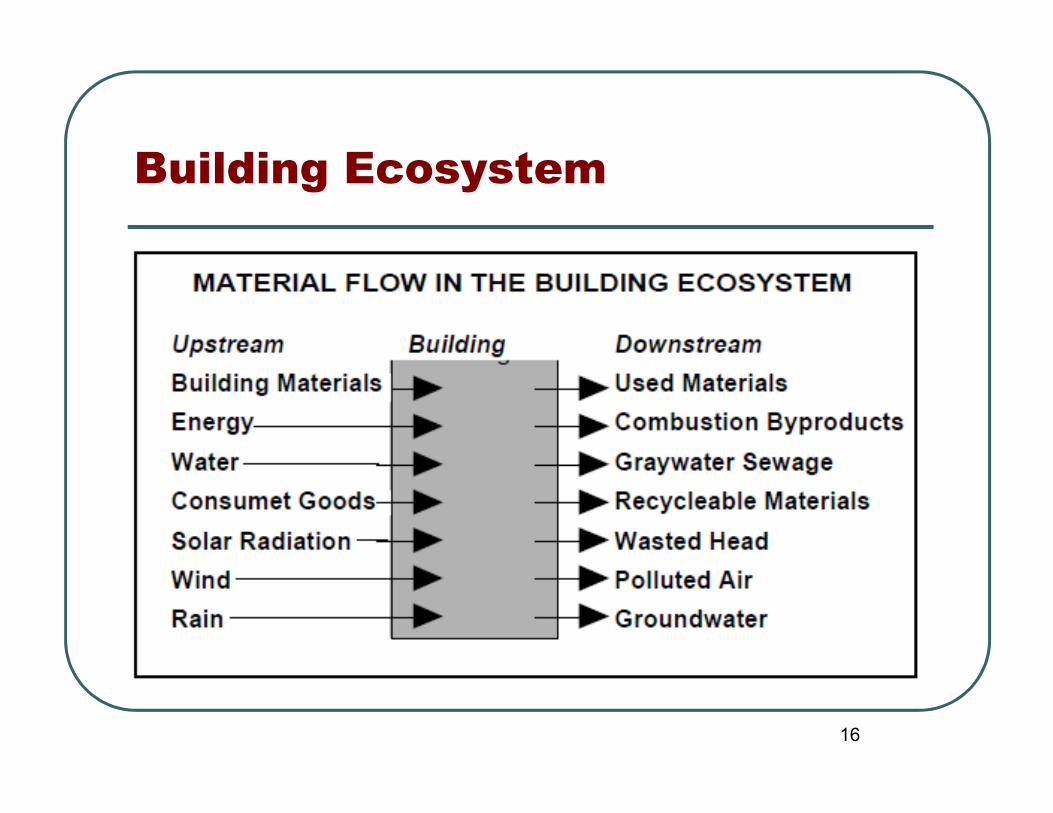
20
� Technical requirements to achieve the WHATs
�Solar
�Cooling
�Recycling
�Design
�Materials
�others
� Each team should come up with a list of HOWs
� Team has to agree on their relationships with WHATs
� Team has to identify correlations within HOWs and suggest how to deal with contradictions
� Team will set design targets for the HOWs
HOWs in SFD
21

DEWA, Dubai Electricity and Water Authority, in AlQuz, Dubai, UAE.
In December 2012, the project was occupied and received the certification with a total LEED score of 98
out of 110 (Platinum).
Example: At the roof, they added a sky garden to further enhance the indoor and outdoor thermal
environment.
Example
22

Customer Needs
( VOC )Imp.
Innovative Design 2
Energy Efficiency 5
Accessibility 4
Sustainable Material 2
Indoor Air Quality 5
Access View & Daylight 4
Natural Ventilation 4
Water Efficiency 3
Matrix #1 : Customer Needs
* Voice of Customers (VOC) its what the
customer needs and wants which is the most
important factor that the customer consider in a
sustainable building
* It was chosen based on the sustainability
factors that the customer would look to in a
sustainable building
* Customer importance is a number from a scale
1 to 5 which is estimated based on the
importance of each element to the customer
* The customers needs chosen for DEWA
building are Innovative Design, Energy
Efficiency, Accessibility, Sustainable Material,
Indoor Air Quality, View and Daylight, Natural
Ventilation and Water Efficiency
* Energy Efficiency, Natural Ventilation and
Indoor Air Quality are the most important VOC
needs
23

Matrix Number #2: Planning the Improvement Strategy
DEWA Estidama LEED I. Planned IF SP. OW %
1 1 1 1 1.0 1.1 2.2 5.2
5 5 5 5 1.2 1.3 7.8 18.4
4 3 4 4 1.4 1.1 6.2 14.6
2 3 3 3 1.2 1.0 2.4 5.7
3 4 3 4 1.2 1.2 7.2 17
3 4 3 4 1.2 1.3 6.2 14.6
3 4 3 4 1.2 1.3 6.2 14.6
3 5 2 5 1.4 1.0 4.2 10
- In this matrix, it provides DEWA assessment compared to the most well known benchmarks within the
region which are Estidama and LEED
- Estidama is the green building rating tool that is used in Abu Dhabi and it consists of 5 pearl according to
each sustainability principles
- LEED is a US benchmark assessment tool used for green sustainable buildings
- With the assessment of the benchmarks and the customer importance, the improvement factor, sales
point, overall weight and total percentage of the overall weight were calculated for DEWA
24
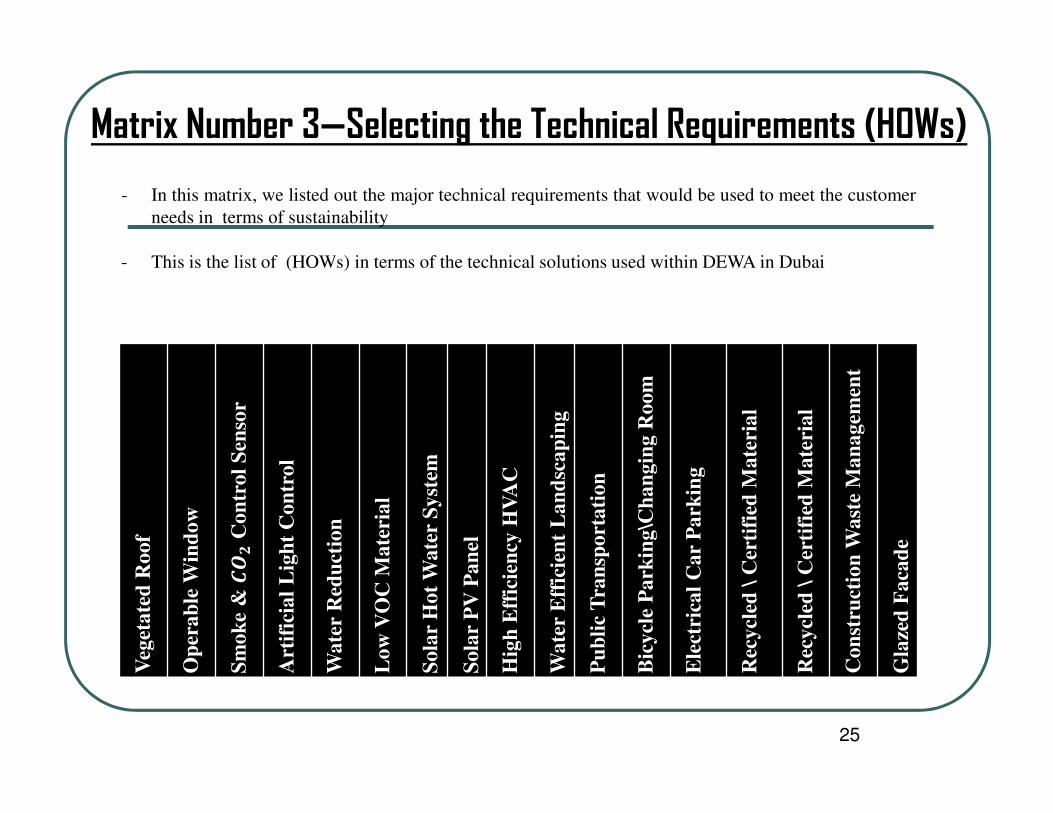
Matrix Number 3—Selecting the Technical Requirements (HOWs)
- In this matrix, we listed out the major technical requirements that would be used to meet the customer
needs in terms of sustainability
- This is the list of (HOWs) in terms of the technical solutions used within DEWA in Dubai
Veg
eta
ted
Ro
of
Op
era
ble
Win
do
w
Sm
ok
e &
C
on
tro
l S
enso
r
Art
ific
ial
Lig
ht
Co
ntr
ol
Wa
ter
Red
uct
ion
Lo
w V
OC
Ma
teri
al
So
lar
Ho
t W
ate
rS
yst
em
So
lar
PV
Pa
nel
Hig
h E
ffic
ien
cy H
VA
C
Wa
ter
Eff
icie
nt
La
nd
sca
pin
g
Pu
bli
c T
ran
spo
rta
tio
n
Bic
ycl
e P
ark
ing
\Ch
an
gin
g R
oo
m
Ele
ctri
cal
Ca
r P
ark
ing
Rec
ycl
ed \
Cer
tifi
ed M
ate
ria
l
Rec
ycl
ed \
Cer
tifi
ed M
ate
ria
l
Co
nst
ruct
ion
Wa
ste
Ma
na
gem
ent
Gla
zed
Fa
cad
e
25

High = 9
Medium = 3
Weak = 1
Matrix Number #4: Evaluating Interrelationships between the WHATs and HOWs.
- In each intersection between the technical requirement and the customer need, an interrelationship was
estimated either strong, medium, weak or none presented in different shapes
- The purpose of this matrix is to show how strong is the relationship between each technical requirement
with the customer need, this will later show which technical requirement is consider as a priority for the
customer and therefore the designer should invest more in it
26

Veg
eta
ted
Ro
of
Op
erab
le W
ind
ow
Sm
ok
e &
C
on
trol
Sen
sor
Art
ific
ial
Lig
ht
Co
ntr
ol
Wa
ter
Red
uct
ion
Lo
w V
OC
Mate
ria
l
So
lar
Hot
Wa
ter
Sy
stem
So
lar
PV
Pan
el
Hig
h E
ffic
ien
cy H
VA
C
Wa
ter
Eff
icie
nt
La
nd
sca
pin
g
Pu
bli
c T
ran
sport
ati
on
Bic
ycl
e P
ark
ing\C
ha
ng
ing R
oo
m
Ele
ctri
cal
Car
Pa
rkin
g
Rec
ycl
ed \
Cer
tifi
ed M
ate
rial
Rec
ycl
ed \
Cer
tifi
ed M
ate
rial
Co
nst
ruct
ion
Wast
e M
an
ag
emen
t
Gla
zed
Fa
cad
e
Customer Needs
( VOC )Imp.
Innovative Design 2
Energy Efficiency 5
Accessibility 4
Sustainable Material 2
Indoor Air Quality 5
Access View & Daylight 4
Natural Ventilation 4
Water Efficiency 3
Matrix Number #4: Evaluating
Interrelationships between the WHATs
and HOWs.
27

Matrix Number #5: Evaluates the Correlation - Within each diagonal intersection in the correlation matrix, a supportive or impeding type of relation
ship is established between the technical requirements
- These correlations exist as the roof of the HOQ ( House of Quality )
- The positive and the negative sign shows if the two technical requirement support each other or which
one of them oppose each other
Supportive
Impending
28
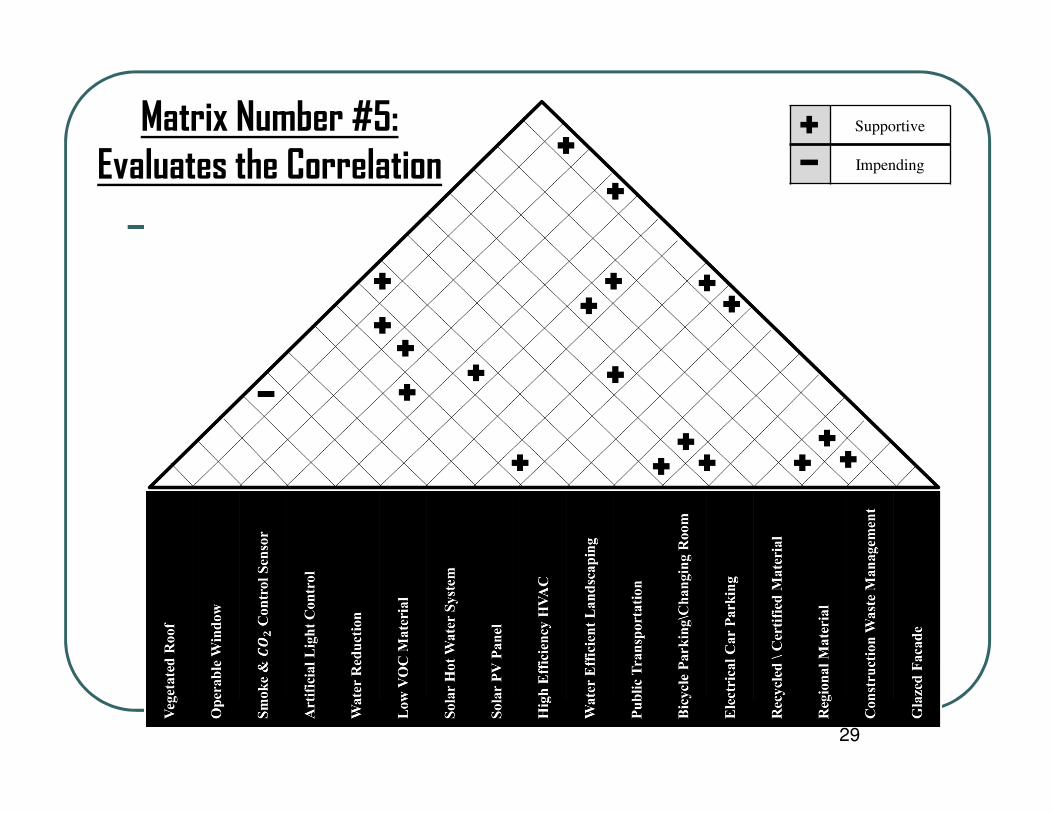
Matrix Number #5: Evaluates the Correlation
Supportive
Impending
29

Matrix Number #6: Selecting Design Targets of the Technical Requirements
- The design target matrix includes calculation of the technical priorities
- The higher the value shows the importance of implementing the technical requirement in the project design
- According to the calculation, the high efficiency HVAC, operable window and artificial light contributes greatly
in the project design
Technical Priorities 47.4 150.2 83.4 144 61.2 92.6 108 70.2 153.6 37.8 55.8 55.8 55.8 21.6 21.6 7.2 72.6
% of Total Priorities 3.8 12.1 6.7 11.6 4.9 7.5 8.72 5.7 12.4 3.1 4.5 4.5 4.5 1.74 1.74 0.6 5.9
Equations Used:
- IF = ( Plan – Current ) x 0.2 + 1.0
- OW = CI x IF x SP
- % Total W = OW / ∑��
- TP = ( Symbol Value x OW) + ( Symbol Value x OW) + ..
- % TP = TP / ∑��
30

QFD For Dubai Electricity & Water Authority “DEWA”:
31

Another Example: Redesign of superblock
There is a need to revitalize the inner part of the city. This is about what is needed for the city. So, Abu Dhabi
2030 Plan proposes “a program of block revitalization, undertaking one or several pilot projects”. The goals
here are the following:
•To analyze the existing situation.
•To identify the issues that may cause the blocks to deteriorate.
•To pinpoint all drawbacks and create proposals concerning the urban morphology, public space, volumes, as
well as social segregation and road/pedestrian networks.
By this, the modern concept Abu Dhabi may redefine its urban fabric in a more socially viable and sustainable way that has the potential of becoming the prime design to be followed.
32

The QFD HoQ
33

QFD for Estidama Requirements
The Sheikh Zayed Desert Learning Centre:
34

35

Example: QFD Outcomes
0
5
10
15
20
25
30
35
High efficiencyfixtures
exterior watermonitoringfeatures
grey waterrecycling
water monitoringleak detecting
facilities
Onsite stormmanagement
Drought tolerantplants
Technical priorities
Technical priorities
36

37
Other Methods for Sustainability
Lean: war on waste
� Inventory
� Transportation (material Handling)
� Delay (Waiting)
� Motions (Effort)
� Over-processing
� Over-production
� Defects
� New: Knowledge: Over-qualifications, underutilization

38
Other Methods for Sustainability
Six Sigma’s Methodologies
Six Sigma
Process Management
Improve EXISTING processes so that
their outputs meet
customer
requirements
Control and manage cross-function
processes to meet business goals
Design NEW products and processes that meet customer needs
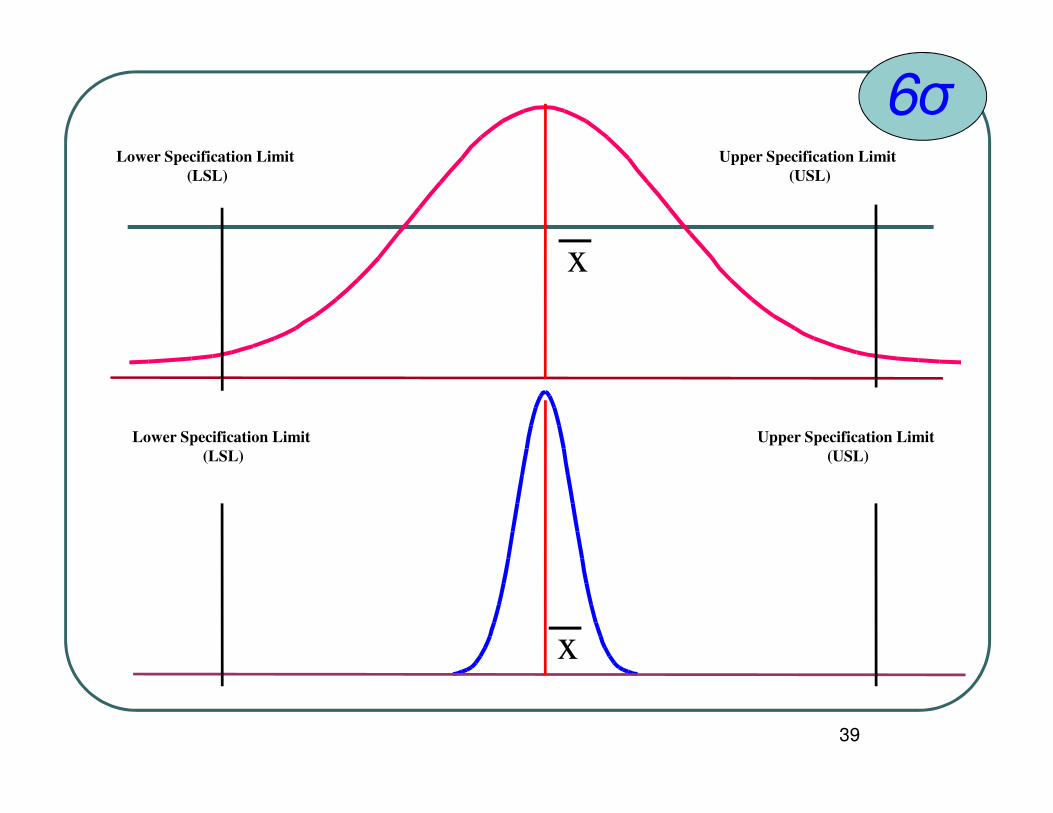
Upper Specification Limit
(USL)
Lower Specification Limit
(LSL)
x
x
Lower Specification Limit
(LSL)
Upper Specification Limit
(USL)
6σ
39

Six Sigma Tools
Many familiar quality tools applied in a structured methodology
DMAIC Stage Tools DeliverablesDefine (D) Project Charter, Process
Map, QFD, benchmarking, KANO, etc.
Project objectives, CTQs, design
variables, resources, project plan, etc.
Measure (M) Data collection, sampling,
work measurements, Sigma calculator
Measured performance, Process
variation (Sigma value), process capability measures
Analyze (A) Statistical analyses, charts,
root-cause analysis, DOE and ANOVA
Defined improvement opportunity, sources of variation, action plan.
Improve (I) Design optimization,
robustness, brainstorming, validation
Select the best solutions, changes
deployment, adjustments to process variables.
Control (C) Error proofing, FMEA, SPC, Standards, PUGH analysis
Monitoring plan, maintained
performance, documentation, transfer of ownership.
40

41
Questions?