Embed Size (px)
Citation preview

Seediscussions,stats,andauthorprofilesforthispublicationat:https://www.researchgate.net/publication/265021031
PotentialofEnergyandWaterEfficiencyImprovementinAbuDhabi'sBuildingSector-AnalysisofEstidama...
ArticleinRenewableEnergy·August2014
DOI:10.1016/j.renene.2014.08.018
CITATIONS
6
READS
204
2authors:
MutasimNour
Heriot-WattUniversity
28PUBLICATIONS127CITATIONS
SEEPROFILE
SameerAssaf
2PUBLICATIONS6CITATIONS
SEEPROFILE
AllcontentfollowingthispagewasuploadedbyMutasimNouron16January2016.
Theuserhasrequestedenhancementofthedownloadedfile.

lable at ScienceDirect
Renewable Energy 82 (2015) 100e107
Contents lists avai
Renewable Energy
journal homepage: www.elsevier .com/locate/renene
Potential of energy and water efficiency improvement in Abu Dhabi'sbuilding sector e Analysis of Estidama pearl rating system
Sameer Assaf a, b, Mutasim Nour b, *
a Department of Energy and Climate Change of UAE's Ministry of Foreign Affairs, Abu Dhabi, United Arab Emiratesb School of Engineering and Physical Sciences, Heriot e Watt University Dubai Campus, Dubai International Academic City, P O Box: 294345, Dubai,United Arab Emirates
a r t i c l e i n f o
Article history:Received 27 May 2014Accepted 7 August 2014Available online 24 August 2014
Keywords:Water energy nexusEnd use energyPower sectorEnergy efficiency
* Corresponding author. Tel.: þ971 44358717; fax:E-mail addresses: [email protected] (S. As
(M. Nour).
http://dx.doi.org/10.1016/j.renene.2014.08.0180960-1481/© 2014 Elsevier Ltd. All rights reserved.
a b s t r a c t
Energy and water infrastructure in Abu Dhabi provides a strong example of the interconnection betweenenergy and water, where the majority of its electricity and water demand is jointly produced fromcogeneration plants. The total cost of fuel used for cogeneration plants are heavily depending on theefficiency level of end-use energy and water consumption. Buildings are the major electricity and waterconsumers with 84.6% and 92.2% respectively from the entire demand. The aim of this study is to analyzethe energy and water consumption reduction by implementing Estidama pearl regulations and compareit with Business as Usual -the normal execution of things as they always do-for three sample buildings(villa, multistory residential and office building). For energy assessment, eQUEST software was used toexamine the energy performance of the chosen buildings and to evaluate the energy saving potentialafter applying Estidama requirements. While for water assessment; Estidama and LEED calculation toolswere used to do the same. The results of energy simulation and water analysis of the chosen buildingsshowed a potential of electricity reduction between 31% and 38% and a potential of water reductionbetween 22% and 36% depending on building type and other parameters. Also, a total monetary savingsof 19 Billion AED can be achieved cumulatively over ten years period (2011e2020) after Estidama reg-ulations have been applied. In addition, a reduction of 31.4 Million ton of CO2eq cumulatively can beachieved.
© 2014 Elsevier Ltd. All rights reserved.
1. Introduction
Water and energy are vital resources that affect all aspects of lifeand support human welfare. They are essential for economicgrowth and sustainable development; and recognized as funda-mental inputs for the modern economies [1]. The rapid globalpopulation growth and fast economic development are key driversfor increasing the global demand on water and energy resources.
The concept of water and energy nexus has been acknowledgedin the United States in mid nineties of the last century, and hasreceived increased attention all over the world during the past fiveyears [2].
Historically, energy and water resources have been treatedindependently, and their policies have been developed in isolationfrom each other. However, due to the recent growing concerns ofthe issues relevant to energy andwater accessibility, environmental
þ971 44477350.saf), [email protected]
impacts and prices instability [3], many countries have startedintegrating both systems to obtain better planning and policydirections.
According to Middle East and North Africa (MENA) Energy In-vestment Outlook [4] titled: Capturing the Full Scope and Scale ofthe Power Sector, the MENA region would need 124 GW incre-mental power capacity over the next five years, with an averagegrowth of 7.8% annually. The growth of electricity consumption isstrongly correlated to economic development, high populationgrowth and harsh climate conditions, which all countries in theregion experience, especially the Gulf Cooperation Council (GCC)states. The share of GCC states alone exceeds 42% (US$105 billion)of the total required expenditure.
In 2011, the total installed power capacity in United ArabEmirates (UAE) was 26132 MW; which has increased significantlyover the past few years due to commissioning of several new plants.As for water capacity, although UAE has relatively large volume ofunderground and surface water reserves, only 3% of the availablewater is fresh according to UAE water conservation strategy [5], theremaining 97% is saline water. Furthermore, desalinated water

S. Assaf, M. Nour / Renewable Energy 82 (2015) 100e107 101
accounts for 92% of the total water used for domestic and industrialactivities [5].
Abu Dhabi is the largest emirate among the seven emirates ofthe UAE, and has one of the highest per capita rates of electricityand water consumption in the world. According to Abu Dhabi En-ergy and Environmental Statistics [6] electricity consumption percapita in Abu Dhabi was 20.39 MWh/year in 2011, almost seventimes the global average (2.89 MWh/year) [7]. The urban water percapita use in Abu Dhabi was 1250 l/day in 2011, 54% of which (i.e675 l/day) are used for domestic activities [6], which is much higherthan the rate of most of the developing countries where their dailyaverage does not exceed half of Abu Dhabi's daily per capita rate.Buildings are the major electricity and water consumer in AbuDhabi with 84.6% and 92.2% respectively of total electricity andwater consumption.
With this regard, the Abu Dhabi government has stressed theimportance of adopting new regulations to increase sustainabilityin the construction sector. The Urban Planning Council (UPC) e
through its Pearl Rating System, that was put in place in 2011 e
commands all new buildings to achieve specific benchmarks inorder to minimize the energy and water use as well as reducingconstruction waste and recycling building materials.
Fig. 2. Water use for electricity production [9].
2. BackgroundEnergy and water are two closely linked and interdependentresources where energy production requires a large amount ofwater. Likewise, a huge amount of energy is needed to extract, treat,desalinate, transport and distribute water. Fig. 1 shows the inter-linkages between the two resources.
2.1. Water requirements for electricity production
In an energy value chain, water is needed for fuel extraction andprocessing as well as for power generation. The water demandvaries depending upon the type of generation and cooling tech-nologies. The ranges of water requirements for various generationand cooling technologies is illustrated in Fig. 2.
This includes water consumption for nuclear, steam turbine, andcombined cycle gas turbine (CCGT) power plants respectively, uti-lizing once-through (OT), closed-loop (CL), and dry cooling tech-nologies. Other technologies included also are integratedgasification combined cycle (IGCC) and pulverized coal (PC). Newadvanced coal facilities may also include carbon-capture andsequestration (CCS) technologies. Water requirements for renew-able energy based generation are also included in the bottom of
Fig. 1. Water energy nexus [8].
Fig. 2, which includes wind, solar photovoltaic (PV), concentratingsolar power (CSP) and geothermal.
In this paper, only the water used for electricity generation,which is mainly used for cooling purposes, is covered. For the caseof Abu Dhabi; three types of generation are largely used in its po-wer plants: steam turbine (ST), diesel engine (DE) and gas turbine(GT). GT comprises three technologies; simple cycle gas turbine(SCGT), combined cycle gas turbine (CCGT) and gas turbine withheat energy recovery (GT þ HER).
For water demand in electricity production, only steam turbinesrequire water for the cooling process whereas gas turbines do not.Most power plants in Abu Dhabi are located along the coastal line,where only seawater is used for cooling due to the limited freshwater resource. The average water usage in energy production forsteam turbine is around 315 gal/MWh [2]. Although seawater isconsidered a stable source compared to fresh water, it continues touse a large amount of seawater e which is eventually dischargedinto the sea at a very high temperature-would cause thermalpollution and affect the local habitat of fish and other marinespecies [10].
2.2. Energy requirements for water production
Energy is required for water lifting, desalination, treatment anddistribution. The required energy for various types of water pro-cesses varies from fractions of KWh to few KWh per cubic meterproduced, depending on the process type as well as severalgeographical, operational and technological factors. This researchwork focuses on energy used for urban water production, thuscovering only water desalination and treatment.
2.2.1. Energy requirements for water desalinationUAE operates 70 desalination plants representing 14% of the
overall worldwide capacity, two thirds of which are located in AbuDhabi [11]. The desalinated water in Abu Dhabi is produced eitherjointly with electricity as per the thermal cogeneration plants, orseparately through independent plants using reverse osmosis (RO)technology. Thermal cogeneration plants represented more than93% of the entire desalinated capacity in Abu Dhabi in 2011.

S. Assaf, M. Nour / Renewable Energy 82 (2015) 100e107102
Thermal desalination is divided into; Multi-Stage Flash (MSF) andMulti-Effect Distillation (MED) with 75% and 18% respectively oftotal desalination capacity. Only 7% of the Abu Dhabi's desalinationcapacity in 2011 came from RO plants [12].
Abu Dhabi is heavily reliant on MSF; it is preferable due to itslarge capacity, high reliability, as well as relatively affordable con-sumption of energy to desalinate the highly concentrated totaldissolved solids (TDS) of the Gulf seawater, and most importantlythe ability to cogenerate with power production. The energy usedfor water desalination varies with the ratio of water to powerproduction. The water demand in Abu Dhabi is almost constantthroughout the year, whereas electricity demand, dominated by airconditioning load, usually increases during summer months, anddrops significantly during winter months. For the case of AbuDhabi, the ratio of water to power varies from 320 to 1170 (m3/d)per MW of cogeneration plant capacity [13]. The CO2 emissionsallocated for electricity and water production in Abu Dhabi variesfrom one season to another, according to EAD GHG report [14] theannual average in 2010 was 13.76 Kg CO2eq/m3 for water produc-tion, and 0.51 Kg CO2eq/kWh for electricity production.
Most of the desalinated plants in Abu Dhabi are located alongthe coastline of the Arabian Gulf, primarily to desalinate theseawater as well as utilizing the seawater for cooling purposes. Thequality of seawater is essential for the effectiveness of the desali-nation process. Any oil spill from oil containers-in an area wit-nessing very active movement of oil containers all over the year,may cause a complete shutdown of the plant if the oil spill reachesthe seawater intake [15]. This would put the water security at stakein an area which has a very limited desalinated water storage ca-pacity, which in the case of Abu Dhabi; the available storage ca-pacity cannot meet the water demand for more than two days [16].
2.2.2. Energy requirements for wastewater treatmentThere is no available data on the level of energy used for
wastewater treatment in Abu Dhabi; the international studies es-timate the energy intensity for primary treatment within the rangeof 0.1e0.3 kWh/m3 and 0.275e0.59 kWh/m3 for secondary treat-ment, which includes sludge [2].
According to Abu Dhabi Environmental Statistics [6]; the totalquantity of wastewater inflow in Abu Dhabi exceeded 259 Millionm3 in 2011; out of which 243 million m3 were treated and133 million m3 were only used mainly for irrigation of the land-scape areas.
2.3. End use energy and water consumption
The electricity demand for the Abu Dhabi Emirate reached thelevel of 43.2 TWh in 2011. As shown in Fig. 3, the domestic sector is
Fig. 3. Electricity consumption by sector in Abu Dhabi [12].
the major electricity consumer which accounted for 31% of the totalelectricity consumed in 2011, followed by commercial andgovernmental sectors with 29% and 25% respectively [12].
In the water side, Abu Dhabi consumed 961.5 Million m3 ofwater in 2011, 54% of which went to domestic, followed bygovernmental and commercial sectors with 22% and 16% respec-tively as shown in Fig. 4.
As it can be noticed from Figs. 3 and 4, buildings' sector -whichconstitutes; residential, commercial and governmental buildings-isthe foremost consumer of the entire electricity and water use with84.6% and 92.2% respectively.
The growth in the building sector was enormous during the pastfew years in Abu Dhabi and will continue with the same pattern forthe upcoming 20 years. According to Abu Dhabi Economic Vision2030 [17], residential units are projected to grow more than 3.5times from 2007 to 2030, while the growth of office space and retailspace is projected to rise 4 and 5 times respectively over the sameperiod. Those planned buildings once occupied will require largeamounts of energy and water and will be responsible for producinga huge amount of GHG emissions as well.
Abu Dhabi and in its efforts to optimize the urban growthchallenges, has developed the Abu Dhabi 2030 urban master planthat addresses sustainability as a core principle. As a result, in 2010the Estidama initiative was launched; the first program of its kindthat is tailored to Abu Dhabi and the Middle East region.
The pearl rating system is a central component of Estidamaprogram; it is a building design methodology for constructing andoperating buildings and communities more sustainably. The mini-mum standard (one Pearl) is the entry level and five Pearls is thehighest level that can be achieved. Starting from 2011, all newcommunity developments, new villas and new private buildingsare required to achieve at least one pearl rating as per Estidamastandards. New governmental projects; including schools, mosquesand governmental buildings, are required to achieve a minimumrating of two Pearls.
In Abu Dhabi as well as for the most of hot climate countries;cooling load is the largest energy element in any building, wheremore than 50% of the entire building's annual electricity con-sumption goes to cover cooling load. Achieving only the minimumthermal insulation requirements of pearl rating system couldreduce the annual cooling load by 37.2% compared to “as built”typical villa building in Abu Dhabi [18]. Thus, significant reductionin the building's electricity bill can be achieved.
3. Methodology
Detailed energy and water analysis on representative buildingsare carried to estimate the potential of energy and water reductionin buildings' sector, mainly to identify the current level of energyand water consumption in typical buildings in Abu Dhabi, and to
Fig. 4. Water consumption by sector in Abu Dhabi [12].

S. Assaf, M. Nour / Renewable Energy 82 (2015) 100e107 103
project how it is going to be in the future if the Business As Usual issustained, as well as after applying the Estidama pearl ratingsystem.
As shown in Fig. 5, the first step for conducting this researchwork is collecting all statistical data relevant to water and energysector in Abu Dhabi for supply and demand side, focusing on thebuilding sector and its related environmental and economic data.The analysis part is commenced by carrying out quantitativeinvestigation on the water requirements for electricity production,and energy needs for water desalination and treatment in AbuDhabi.
A comprehensive assessment of the levels of water and energyconsumption at the end-use segment is followed, through con-ducting energy simulation and water use analysis for selectedrepresentative buildings in Abu Dhabi. The purpose of these ana-lyses is to estimate the current level of consumption in existingbuildings and how it will become after adopting Estidama pearlrating system. Afterward, an evaluation is carried out to project thefuture water and electricity demand in Abu Dhabi and to quantifythe potential water and energy savings from adopting Estidama by2020. Lastly, a detailed environmental and economic benefitsanalysis is performed to reflect the estimated reduction in end-usewater and energy consumption on the primary side and quantifythe potential of cost savings and carbon emissions reduction.
The obtained data has been divided into two main categories;the supply side and the demand side. In the supply side; all datarelevant to electricity and water annual production and consump-tion, generation types, technologies used for water desalination,quantity of treated waste water, fuel and CO2 allocation for waterand electricity production and water to power ratio in cogenerationplants have been obtained. On the demand side, hundreds of datapoints were collected in the fields of; electricity and water use bysector, buildings' types and numbers, energy and water intensitiesfor selected buildings, water and electricity costs, buildings' codesand standards, as well as LEED and Estidama guidelines for thebuilding sector.
Several factors, approaches and assumptions have beenconsidered throughout this research work, which can be summa-rized below:
- Three sample buildings was chosen for the end-use energy andwater analysis, (villa, multistory residential and office building).For energy assessment, eQUEST simulation softwarewas used toexamine the energy performance of the chosen buildings and toevaluate the energy saving potential after applying Estidama
Fig. 5. Steps of conductin
requirements. While for water assessment; Estidama and LEEDcalculation tools were used to do the same
- Year 2011 was selected as base-year for this research work; mostof the used data is actual and solid for this particular year.
- The water consumption in villa segment varies from one type toanother depending upon the availability and size of landscapearea, type of plants and irrigation used. The wide range of waterintensity in villa segment -according to available references-could reach up to six times the minimum value. This makesbaseline water calculation very complicated to be estimated andhas been verified by adjusting the figures used in the calculationto match with the average of the revealed water intensity rangein this segment.
- No building code was applied in Abu Dhabi prior to 2011. Allbuildings had been built in Abu Dhabi before 2011 had no ob-ligations to use insulations or efficient glazing on its buildingenvelope. Furthermore, there were no clear records on the ef-ficiency level of the building envelope of existing building. Forsimulating the energy consumption of existing building (base-line case), we assumed that no insulation was used on thebuilding's envelope, the results of energy simulation werecompared to the revealed energy intensity level for similarbuilding type and size, tomake sure that the set assumptionwasaccurate.
- For estimating the impact of end-use energy and water reduc-tion on the supply side, two scenarios were assessed; thebusiness as usual (BAU) scenario and Estidama scenario. TheBAU scenario assumes that the buildings will be constructedafter 2011 will consume the same level of energy and water ofbuildings that have been constructed before 2011. The Estidamascenario assumes that all buildings that will be constructed after2011 should be built in accordance to Estidama requirementsand thus should achieve the mandatory credits of minimumenergy and water performance.
- The year 2020 was selected as a reference year to estimate thecumulative potential of generated savings after adopting theEstidama pearl rating system compared to BAU, and to reflect itsimpact on the supply side. The projected water and electricityconsumption in Abu Dhabi by 2020 is estimated with a potentialannual growth rate of 8% in electricity and 5% for water con-sumption. These projected figures have been chosen dependingon the historical growth records and the announced futureplans.
- The water to power ratio in the cogeneration plants in AbuDhabi varies during the summer and winter depending on
g this research work.

S. Assaf, M. Nour / Renewable Energy 82 (2015) 100e107104
demand. In summer months both electricity and water demandis high, while in winter months, electricity consumptionreduced significantly with slight change on water demand. Inthe calculations, the annual average water to power ratio wasused.
- The CO2 allocation for water and power production in Abu Dhabivaries during the summer and winter depending on the de-mand, efficiency of cogeneration plants and type of fuel used.The average annual CO2 allocation for electricity and waterproduction was used throughout the calculations.
4. End use energy simulation and water calculation
A detailed water and energy analysis is carried out for repre-sentative buildings in Abu Dhabi; three types of buildings havebeen chosen, namely; villa, multistory residential building, andoffice building.
4.1. Energy analysis
In order to assess the energy performance of the selectedrepresentative buildings, both the baseline case (existing building)and proposed case (new building- Estidama compliance) arevirtually simulated using eQUEST version 3.64 energy modelingsoftware.
Buildings that have been constructed before 2011 are consid-ered as baseline case, where no building code was applied in AbuDhabi. The proposed case is applied to those buildings which arebuilt after 2011; new buildings need to fulfill the Estidama pearlrating system requirements that have been put in place in 2011.
Identifying the design parameters of the existing buildings wasdifficult due to inadequate information of the energy efficiencylevel of various building systems, and the lack of insulation regu-lation in Abu Dhabi before 2011. As a result, the baseline buildingmodel was simulated to reflect the limited available data and using
Table 1Input parameters for baseline case and proposed case [19e21].
Parameter Villa Multistory resi
Baseline case Proposed case Baseline case
External walls 8 inch concrete block Estidama minimumenergy requirements
8 inch concrete
U value-2.63 W/m2/K U value- 0.32 W/m2/K U value- 2.63W/m2/K
Roof 8 inch concrete block Estidama minimumenergy requirements
8 inch concrete
U value-2.63 W/m2/K U value- 0.14 W/m2/K U value- 2.63W/m2/K
Glazing 6 mm singlereflective glass
Estidama minimumenergy requirements
6 mm singlereflective glass
U value-5.57 W/m2/K U value-2.2 W/m2/K U value-5.57W/m2/K
Lighting powerdensity
12 W/m2 6.8 W/m2 7.5 W/m2
Equipment powerdensity
20 W/m2 20 W/m2 12 W/m2
Occupancy 10 m2/person 10 m2/person 10 m2/personHVAC DX air cooled units DX air cooled units ChillersHeating design
temperature20 �C 20 �C 20 �C
Cooling designtemperature
23.8 �C 23.8 �C 23.8 �C
Cooling electricinput ratio (EIR)
0.34 0.28 0.39
Ventilation rate 25.5 m3/hr/person 25.5 m3/hr/person 25.5 m3/hr/perInfiltration rate 0.35 Air changes/Hr 0.35 Air changes/Hr 0.35 Air chang
some assumptions to match with the current level of energy in-tensity of the chosen buildings in Abu Dhabi. Table 1 summarizesthe input parameters that were used for baseline case and proposedcase energy simulation of the three selected buildings.
4.1.1. Case study 1: villa buildingVilla is one of the key building segment in Abu Dhabi; Medium-
size villa with two stories and total built-up area of 465 m2
(5000 ft2) was selected for this analysis as shown in Fig. 6.The results of the two energy simulations of baseline and pro-
posed case showed that a considerable amount of energy can bereduced after achieving the minimum energy performance ofEstidama requirements as shown in Fig. 7.
A potential energy reduction of 31% is likely attainable, mostlyfrom cooling load reduction due efficiency enhancement; throughusing better insulation of the various elements of building envelopeas well as utilizing efficient cooling units. The remaining savingscame from using more efficient lighting system and supply part ofthe hot water demand from renewable energy source.
4.1.2. Case study 2: multistory residential buildingFor simulation purposes, a typical 16 stories residential building
with a total built-up area of 126,33 m2 (135,977 ft2) is used asshown in Fig. 8.
Fig. 9 demonstrates the potential of energy reduction in multi-story residential building after meeting the requirements of mini-mum energy performance of the Estidama pearl building ratingsystem.
4.1.3. Case study 3: office buildingTypical 10 stories office building with a total built-up area of
7820 m2 (84173 ft2) was selected in this simulation analysis. Fig. 10shows the potential of energy reduction in the office building aftermeeting the requirements of minimum energy performance of theEstidama pearl rating system.
dential Office building
Proposed case Baseline case Proposed case
block Ashrae 90.1, 2007requirements
8 inch concrete block Ashrae 90.1, 2007requirements
U value- 0.7 W/m2/K U value-2.63W/m2/K
U value- 0.7 W/m2/K
block Ashrae 90.1, 2007requirements
8 inch concrete block Ashrae 90.1, 2007requirements
U value- 0.36 W/m2/K U value-2.63W/m2/K
U value- 0.36 W/m2/K
Ashrae 90.1, 2007requirements
6 mm singlereflective glass
Ashrae 90.1, 2007requirements
U value- 6.9 W/m2/K U value- 5.57W/m2/K
U value- 6.9 W/m2/K
7.5 W/m2 11 W/m2 11 W/m2
12 W/m2 12 W/m2 12 W/m2
10 m2/person 20 m2/person 20 m2/personChillers Chillers Chillers20 �C 20 �C 20 �C
23.8 �C 23.8 �C 23.8 �C
0.34 0.39 0.34
son 25.5 m3/hr/person 25.5 m3/hr/person 25.5 m3/hr/persones/hr 0.35 Air changes/Hr 0.35 Air changes/Hr 0.35 Air changes/Hr
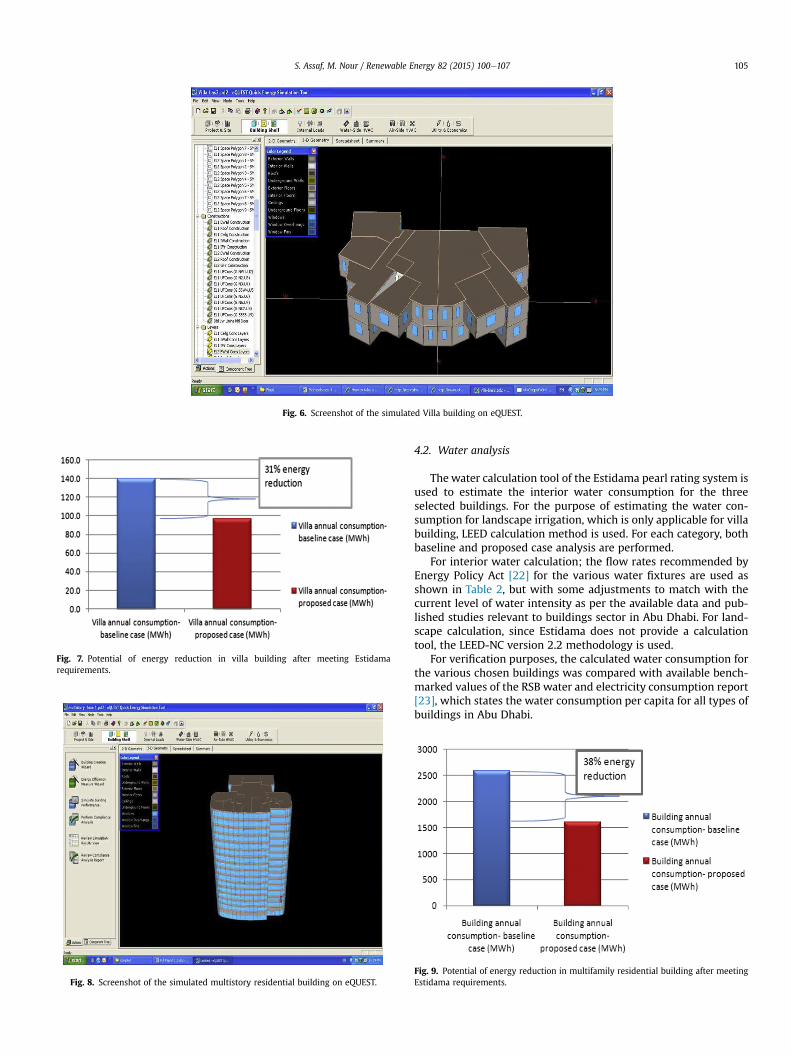
Fig. 6. Screenshot of the simulated Villa building on eQUEST.
Fig. 7. Potential of energy reduction in villa building after meeting Estidamarequirements.
Fig. 8. Screenshot of the simulated multistory residential building on eQUEST.
S. Assaf, M. Nour / Renewable Energy 82 (2015) 100e107 105
4.2. Water analysis
The water calculation tool of the Estidama pearl rating system isused to estimate the interior water consumption for the threeselected buildings. For the purpose of estimating the water con-sumption for landscape irrigation, which is only applicable for villabuilding, LEED calculation method is used. For each category, bothbaseline and proposed case analysis are performed.
For interior water calculation; the flow rates recommended byEnergy Policy Act [22] for the various water fixtures are used asshown in Table 2, but with some adjustments to match with thecurrent level of water intensity as per the available data and pub-lished studies relevant to buildings sector in Abu Dhabi. For land-scape calculation, since Estidama does not provide a calculationtool, the LEED-NC version 2.2 methodology is used.
For verification purposes, the calculated water consumption forthe various chosen buildings was compared with available bench-marked values of the RSB water and electricity consumption report[23], which states the water consumption per capita for all types ofbuildings in Abu Dhabi.
Fig. 9. Potential of energy reduction in multifamily residential building after meetingEstidama requirements.

Fig. 10. Potential of energy reduction in the office building after meeting Estidamarequirements. Fig. 11. Comparison of forecasted electricity demand in Abu Dhabi by 2020 (BAU Vs
Estidama).
S. Assaf, M. Nour / Renewable Energy 82 (2015) 100e107106
The analysis shows a potential reduction of 35.7%, 21.5% and33.8% in water consumption can be achieved in villa, residentialmulti stories and office building respectively after meeting the re-quirements of minimum interior water use of the pearl buildingrating system.
5. Outcomes and discussion
The outcomes of energy simulation showed a potential ofelectricity reduction between 31% and 38%. For the purpose ofquantifying the accumulated energy reduction potential by 2020,we assumed that an annual growth rate of 8% in electricity demandduring the period from 2011 to 2020 and an energy reduction po-tential of 30% on all new buildings in Abu Dhabi.
By reflecting the above assumptions on the forecasted electricitydemand in Abu Dhabi for business as usual (BAU) as well as forEstidama scenario, it can be noticed that starting from 2012 theconsumption of Estidama scenario begins to decline compared toBAU and reaches its maximum reduction by 2020 with 11 TWhbelow the BAU, as shown in Fig. 11.
Whereas the potential of water reduction varies from 22% to 36%depending on building type and other parameters, for the purposeof projection the total water reduction by 2020, we assume that anaverage annual growth rate of 5% in water demand during theperiod from 2011 to 2020 and awater reduction potential of 20% onall new buildings in Abu Dhabi.
As it can be noticed from Fig. 12, starting from 2012 the con-sumption of Estidama scenario begins to decline compared to BAU-following the implementation of Estidama system on all newbuildings- and reaches its maximum annual reduction by 2020with 98 Million m3 below the BAU.
The environmental and economic benefits that the Abu Dhabigovernment can acquire from enhancing buildings performancefollowing the implementation of Estidama pearl building ratingsystem over ten years period (2011e2020) can be summarized asshown in Table 3.
Table 2Fixtures flow requirement.
Fixture Flow requirement (l/use or l/min)
Energy Policy Act Estidama
Water closets 6 6Urinals 3.8 0.5Showerheads 9.5 9.5Faucets 9.5 6Bidet 9.5 6
A significant cumulative amount of electricity reduction totaledof 49.3 TWh can be achieved over ten years period of implementingthe minimum standard of Estidama program (1 pearl category),which exceeds the entire electricity consumed in Abu DhabiEmirate in 2011 i.e. 43.3 TWh by 14%. In the water side; a cumu-lative reduction of 457.1 Million m3 can be achieved in ten yearsperiod, which is equivalent to 48% of the entire water demand ofAbu Dhabi Emirate in 2011, i.e 961.5 Million m3.
The direct monetary savings from adopting Estidama programcould reach up to 19 Billion AED accumulatively over ten yearsperiod, based on the current actual unit production cost of elec-tricity and water in Abu Dhabi. The monetary savings are dividedbetween the government of Abu Dhabi and the end-users; the end-users only pay a small portion of the actual cost while theremaining cost is totally covered by the government through itselectricity and water subsidy program.
On the environmental side, the entire cumulative carbonreduction of the first ten years of putting Estidama into service isestimated to reach 31.4 Million ton of CO2eq, this is higher than theentire amount of CO2 produced by water and electricity generationsector in Abu Dhabi in 2010- i.e. 30.84 Million ton of CO2eq by 2%.
6. Conclusion
The outcomes of energy simulation and water analysis showed apotential of electricity reduction between 31% and 38% and a po-tential of water reduction from 22% to 36% depending on building
Fig. 12. Comparison of forecasted water demand in Abu Dhabi (BAU Vs Estidama).

Table 3Summary of the project outcomes.
Annual demand growth
Electricity Water Total
Cumulative consumption savingsin 10 years- TWh/Mm3
49.3 457.1
Cumulative monetary savingsin 10 years-Billion AED
14.2 4.8 19.0
Cumulative carbon savingsin 10 years-Millions tons of CO2eq
25.1 6.3 31.4
S. Assaf, M. Nour / Renewable Energy 82 (2015) 100e107 107
type and other parameters. Adopting the Estidama pearl ratingsystem for all new constructed buildings in Abu Dhabi wouldreduce water and energy consumption by considerable amounts,thus help preserving its natural resources for the coming genera-tions and enhancing its energy and water security. It will alsoreduce the government expenditures on energy and water sub-sidies, enhance the market and create new job opportunities,protect the environment and reduce carbon emissions. The first tenyears of putting Estidama building program into service couldachieve monetary savings up to 19 Billion AED and abate 31.4Million ton of CO2eq cumulatively. In addition, Abu Dhabi couldadopt the variable tariff scheme used in other emirates; whichcharges lower for less consumption. Pricing, via taxing or partialsubsidy withdrawal, could definitely play a huge role in reducingthe consumption of water and energy.
References
[1] Hussey K, Pittock J. The energyewater nexus: managing the links betweenEnergy and water for a sustainable future. Ecol Soc 2012;17(1):31.
[2] Siddiqi A, Anadon LD. The watereenergy nexus in Middle East and NorthAfrica. Energy Policy 2011;39(8):4529e40.
[3] Bazilian M, Rogner H, Howells M, Hermann S, Arent D, Gielen D, et al.Considering the energy, water and food nexus: towards an integratedmodelling approach. Energy Policy 2011;39:7896e906.
[4] Aissaoui A. MENA energy investment outlook:capturing the full scope andscale of the power sector. No 10. [online], Available at:vol. 7; 2012 [accessedon 21.07.2013] http://www.apic.com/Research/Commentaries/Commentary_V07_N10_Oct2012.pdf.
[5] MOEW (Ministry of Environment and Water). UAE water conservation strat-egy; 2010.
View publication statsView publication stats
[6] Abu Dhabi Statistical Center. Abu Dhabi energy and environmental statistics2011 [online], Available at:; 2012 [accessed on 21.06.2013] http://www.scad.ae/en/statistics/Pages/Statistics.aspx?ThemeID¼6&TopicID¼19&SubTopicID¼137&PublicationID¼309.
[7] IEA. Key world Energy statistics 2012 [online], Available at:; 2012 [accessed21.05.2013] http://www.iea.org/publications/freepublications/publication/kwes.pdf.
[8] Vox Glogabl. The energy-water nexus: an emerging risk [online], Available at:;2011 [accessed 21.05.2013] http://voxglobal.com/2011/03/the-energy-water-nexus-an-emerging-risk/.
[9] Mielke E, Anadon L, Narayanamurti V. Water consumption of energy resourceextraction, processing, and conversion [online], Available at:; 2010 [accessedon 25.07.2013] http://belfercenter.ksg.harvard.edu/files/ETIP-DP-2010-15-final-4.pdf.
[10] Lattemann S, H€opner T. Environmental impact and impact assessment ofseawater desalination. Desalination 2008;220(1e3):1e15.
[11] Mezher T, Fath H, Abbas Z, Khaled A. Techno-economic assessment andenvironmental impacts of desalination technologies. Desalination2011;266(1e3):263e73.
[12] ADWEC. Statistical report 1998-2011 [online], Available at:; 2011 [accessedon 15.06.2013] http://www.adwec.ae/report2011.html.
[13] Darwish MA, Al-Najem NM, Lior N. Towards sustainable seawater desalting inthe Gulf area. Desalination 2009;235(1e3):58e87.
[14] EAD. Greenhouse gas inventory for Abu Dhabi emirate [online], Available at:;2012 [accessed on 25.07.2013] https://www.ead.ae//_data/global/book/ghg-brochureenglish.pdf.
[15] Mohamed KA. Minimize the negative impact of oil contamination on AbuDhabi power and desalination plants. Desalination 2007;204(1e3):113e20.
[16] Ghaffour N, Missimer TM, Amy GL. Combined desalination, water reuse, andaquifer storage and recovery to meet water supply demands in the GCC/MENA region. Desalination Water Treat 2012;51(1e3):38e43.
[17] Abu Dhabi Council for Economic Development. Abu dhabi economic vision2030 [online], Available at:; 2009 [accessed on 1.8.2013] http://www.upc.gov.ae/template/upc/pdf/abu-dhabi-vision-2030-revised.pdf.
[18] AlNaqbi A, AlAwadhi W, Manneh A, Kazim A, Abu-Hijleh B. Survey of theexisting residential buildings stock in the UAE. Int J Environ Sci Dev 2012;3(5).
[19] American Society of Heating and Air-Conditioning Engineers. ANSI/ASHRAEstandard 90.1: ventilation for acceptable indoor air quality; 2004.
[20] Estidama. Pearl building rating system: design & construction, version 1.0[online], Available at:; 2010 [accessed on 6.6.2013] http://estidama.org/template/estidama/docs/PBRS%20Version%201.0.pdf.
[21] Estidama. Pearl villa rating system: design & construction, version 1.0 [on-line], Available at:; 2010 [accessed on 6.6.2013] http://estidama.org/template/estidama/docs/PVRS%20Version%201.0.pdf.
[22] USGBC. LEED for new construction version 2.2 [online], Available at:; 2007[accessed on 9.6.2013] http://www.usgbc.org/Docs/Archive/General/Docs3179.pdf.
[23] RSB. water and electricity consumption report [online], Available at:; 2010[accessed on 21.07.2013] http://www.rsb.gov.ae/uploads/ReportWEConsumption.pdf.