Embed Size (px)
Citation preview

© 2020 All Rights Reserved
Quality During a Pandemic
Virtual Heart Attack and Stroke Free Zone Summit
June 14, 2021
Jerry Penso, M.D., M.B.A.
President and CEO, AMGA

2
Congratulations on 10 Years!
University of Best Practices
• Jerry Penso, MD, MBA
• February 7, 2011
3
Early Days of Be There
Inspiring Vision
Community-Wide Effort
Sharing Best Practices
Data SharingAddressing
Health Equity

4
Todays Agenda
1. AMGA’s Quality Programs
2. What Happened to Medical Groups During the Pandemic
3. How was Quality Affected by Pandemic
4. How Do we move forward with Quality?
5
Where Health Care’s Best Get Better
6
Collaborative Best Practices
OpioidsAdult
ImmunizationObesity
Rheumatoid Arthritis
Chronic Obstructive
Pulmonary DiseaseDiabetes Care Hypertension HPV
MIPSPatients with
Multiple Chronic Conditions
Medicare Advantage
Osteoporosis
7©2021 All Rights Reserved
8©2021 All Rights Reserved
9©2021 All Rights Reserved
10©2021 All Rights Reserved
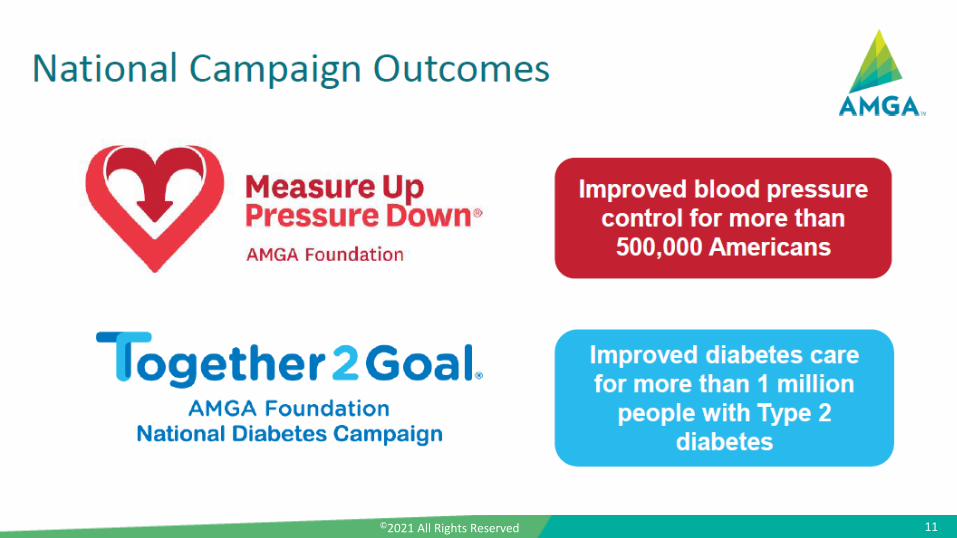
11©2021 All Rights Reserved
12
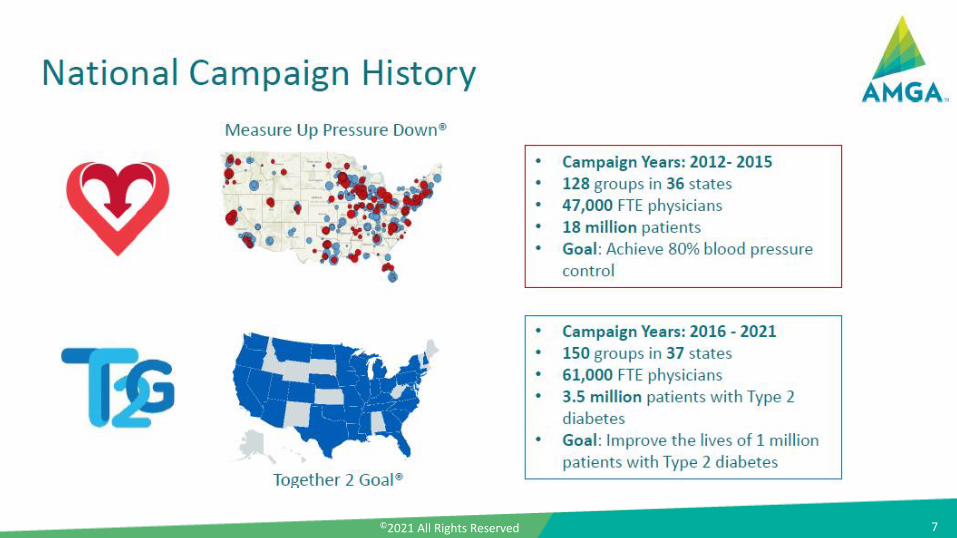
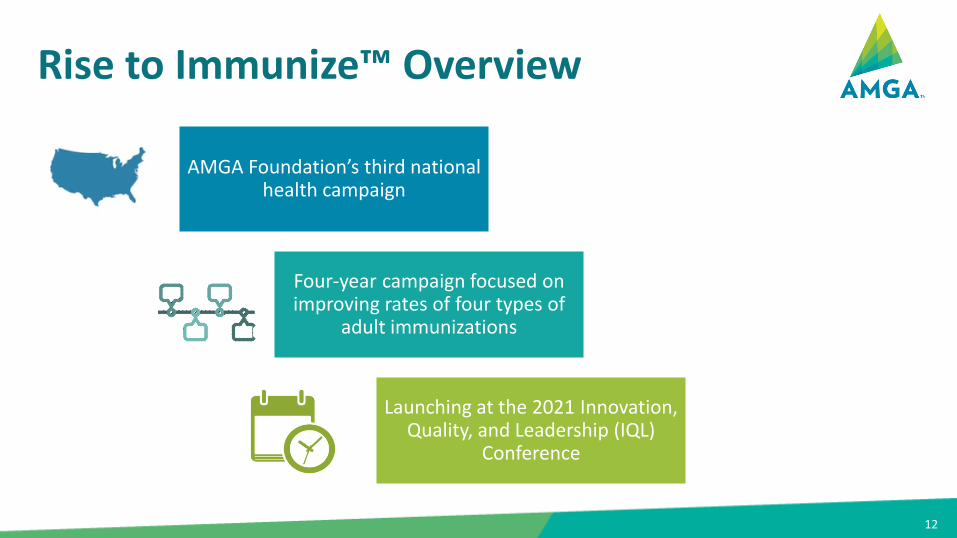
Rise to Immunize™ Overview
AMGA Foundation’s third national health campaign
Four-year campaign focused on improving rates of four types of
adult immunizations
Launching at the 2021 Innovation, Quality, and Leadership (IQL)
Conference

13
Rise to Immunize™ Goal
25 million vaccines documented or
administered by 2025

©2021 All Rights Reserved
What Happened to Medical Groups During Pandemic
14
15©2021 All Rights Reserved
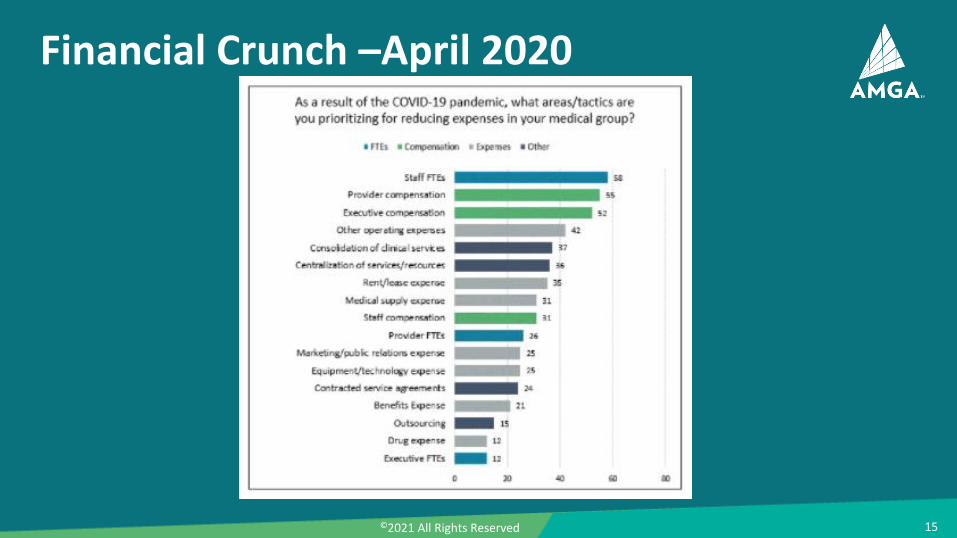
Financial Crunch –April 2020
16©2021 All Rights Reserved
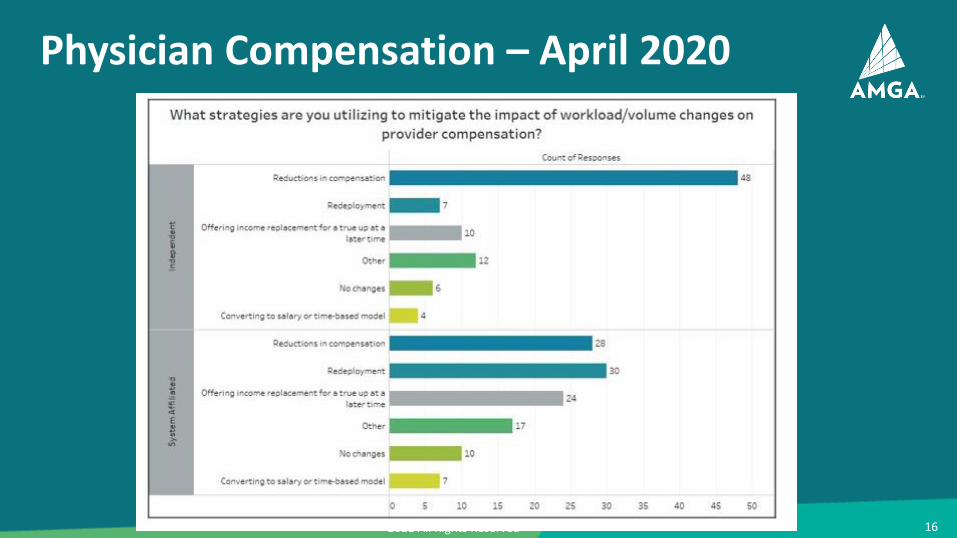
Physician Compensation – April 2020
17©2021 All Rights Reserved
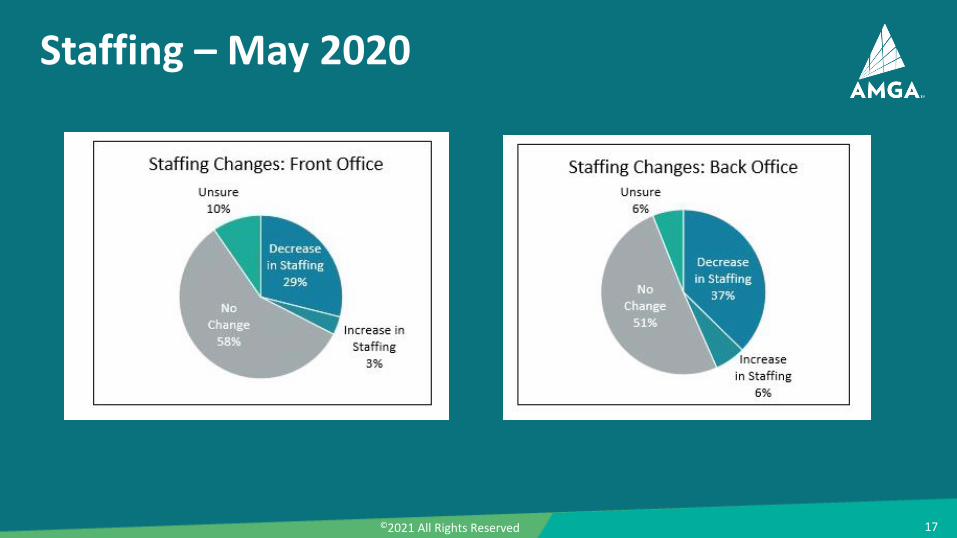
Staffing – May 2020
18©2021 All Rights Reserved
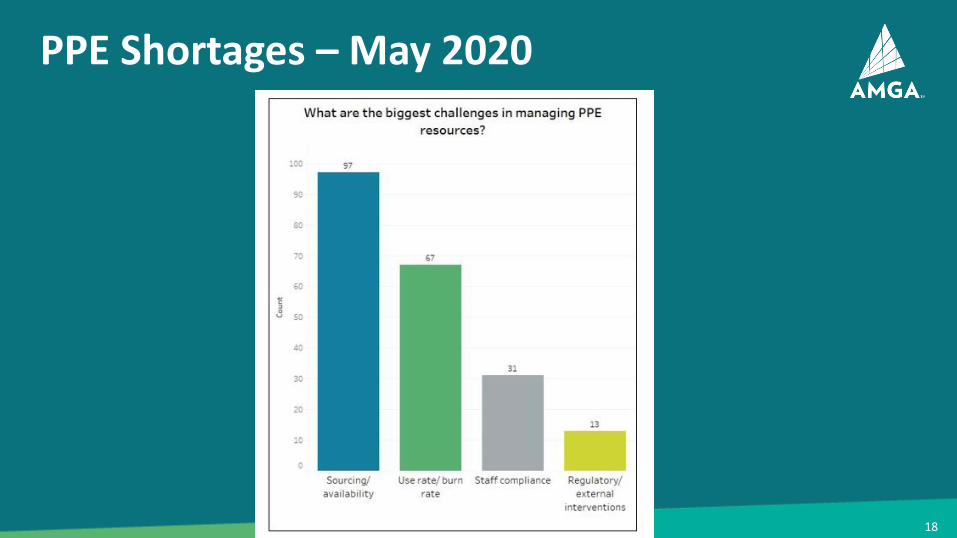
PPE Shortages – May 2020
19©2021 All Rights Reserved
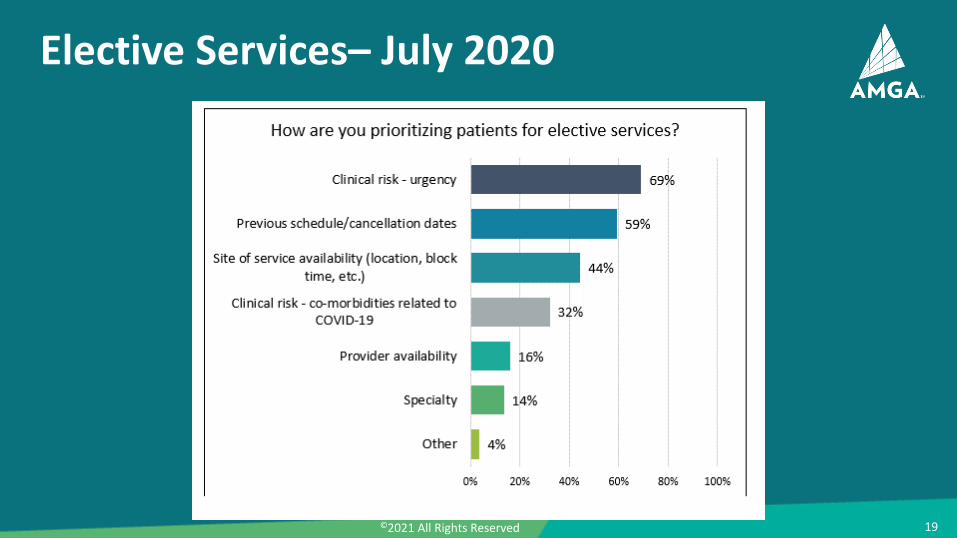
Elective Services– July 2020
20©2021 All Rights Reserved
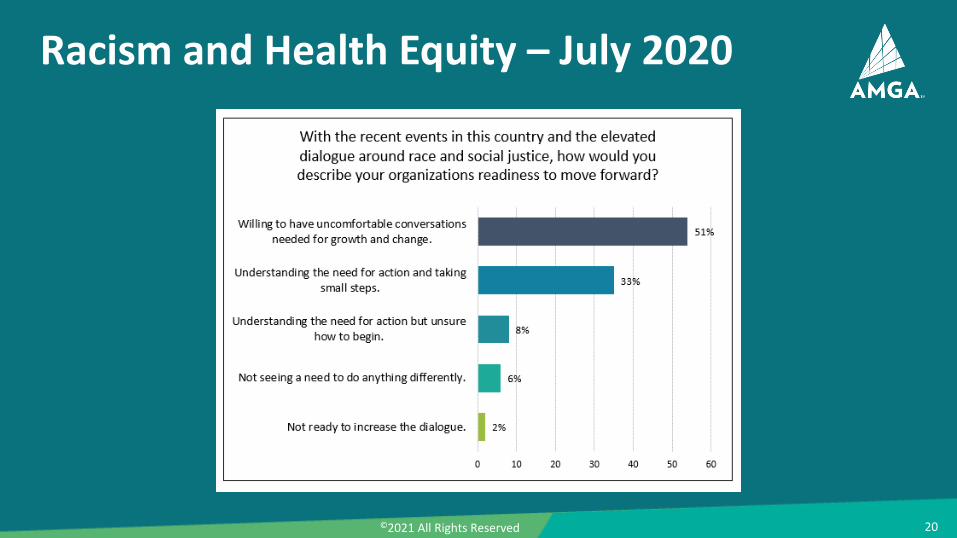
Racism and Health Equity – July 2020
21©2021 All Rights Reserved
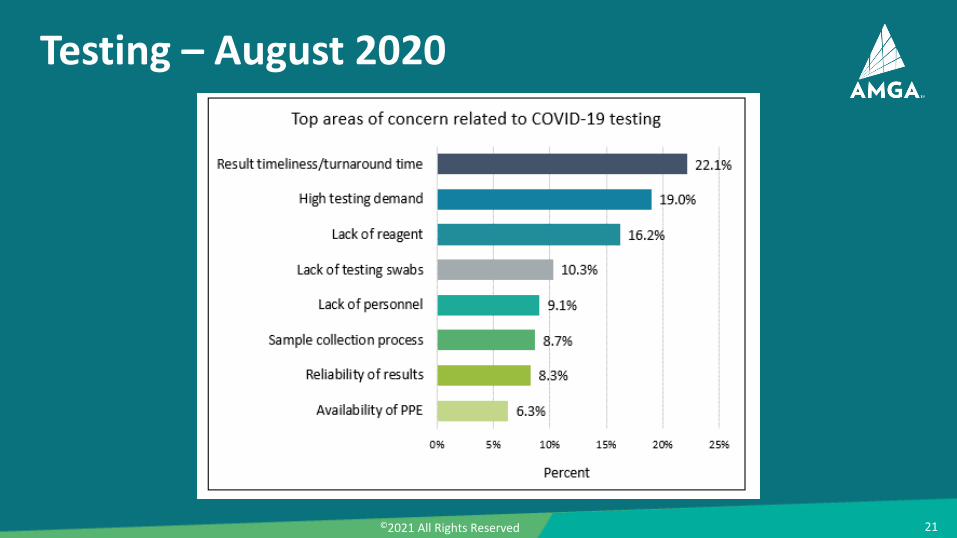
Testing – August 2020
Copyright © 2020 AMGA Analytics LLC and OptumInsight Inc. All rights reserved.22
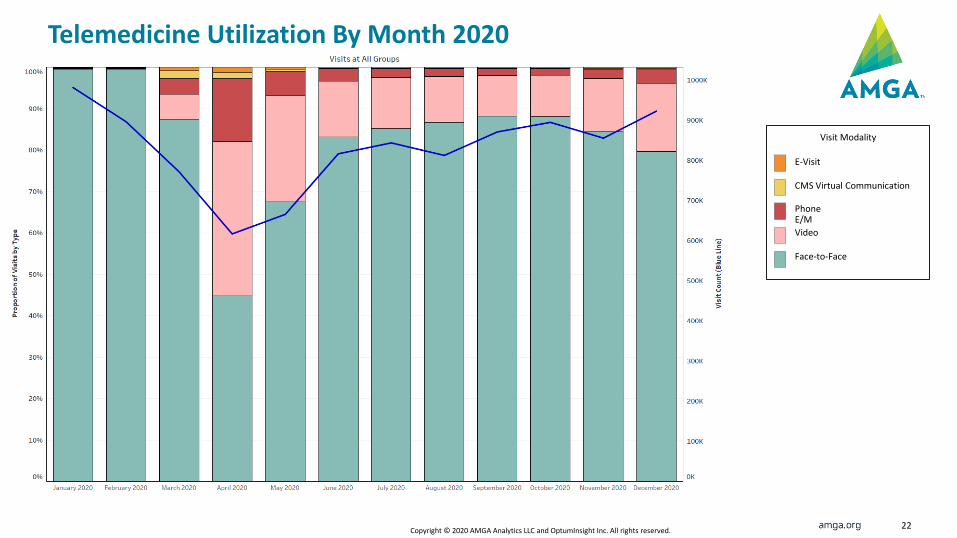
Telemedicine Utilization By Month 2020
E-Visit
CMS Virtual Communication
Phone E/M
Face-to-Face
Video
Visit Modality
Copyright © 2020 AMGA Analytics LLC and OptumInsight Inc. All rights reserved.23
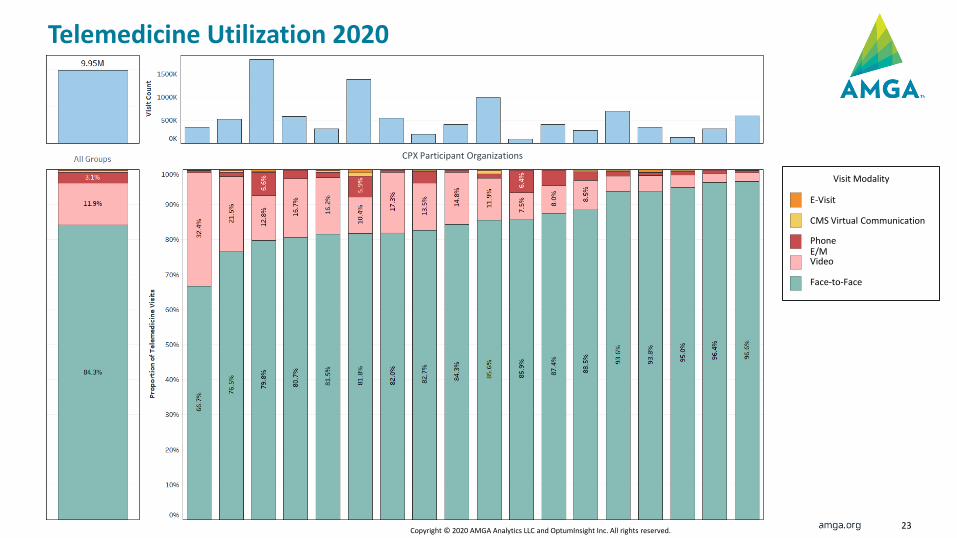
Telemedicine Utilization 2020
CPX Participant Organizations
E-Visit
CMS Virtual Communication
Phone E/M
Face-to-Face
Video
Visit Modality
Copyright © 2020 AMGA Analytics LLC and OptumInsight Inc. All rights reserved.24
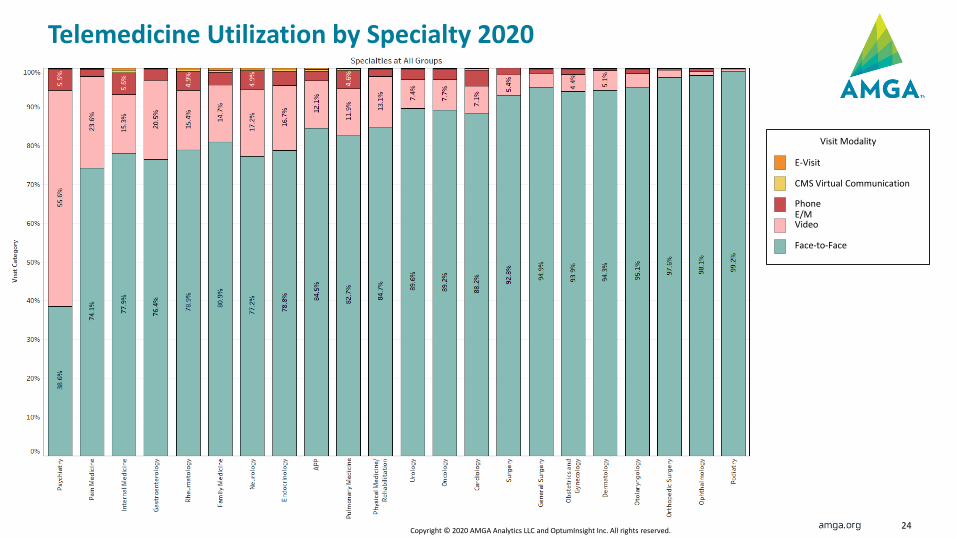
Telemedicine Utilization by Specialty 2020
E-Visit
CMS Virtual Communication
Phone E/M
Face-to-Face
Video
Visit Modality
Copyright © 2020 AMGA Analytics LLC and OptumInsight Inc. All rights reserved.25
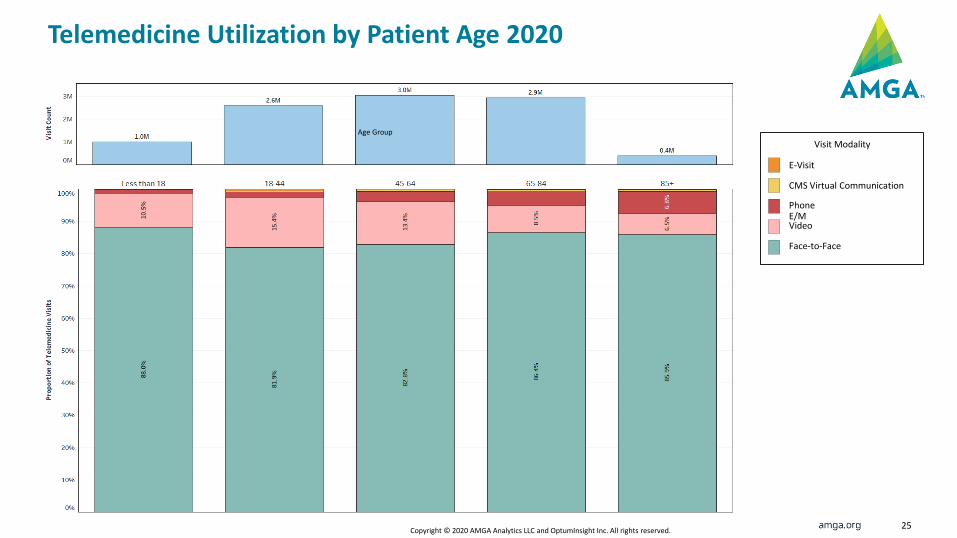
Telemedicine Utilization by Patient Age 2020
E-Visit
CMS Virtual Communication
Phone E/M
Face-to-Face
Video
Visit Modality
Age Group
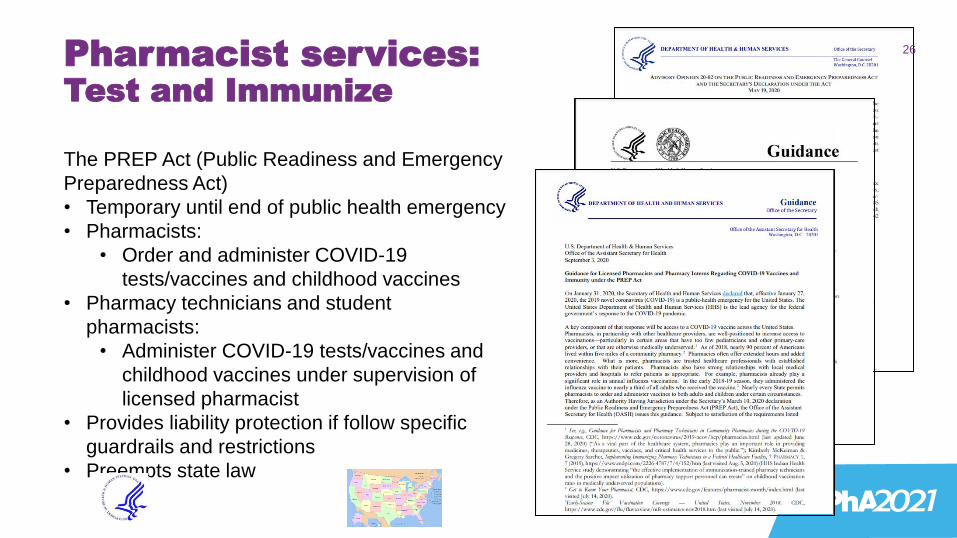
26Pharmacist services:Test and Immunize
The PREP Act (Public Readiness and Emergency
Preparedness Act)
• Temporary until end of public health emergency
• Pharmacists:
• Order and administer COVID-19
tests/vaccines and childhood vaccines
• Pharmacy technicians and student
pharmacists:
• Administer COVID-19 tests/vaccines and
childhood vaccines under supervision of
licensed pharmacist
• Provides liability protection if follow specific
guardrails and restrictions
• Preempts state law
• Direct supervision using real-time audio and video technology for pharmacists providing evaluation and management services via telehealth under incident to arrangements
• DSMT (Diabetes self-management training) – accredited pharmacies enrolled in Medicare can deliver services via telehealth
• Virtual Medicare Diabetes Prevention Program (MDPP) delivery
• Expanded chronic care remote physiologic monitoring services (RPM) under supervision
• Pharmacist provided coordination of care and point of care testing in pharmacies and hospital outpatient clinics to complement telehealth visits
27Pharmacist services:Telehealth
• Refills
• Substitution
• Controlled substances
• Alternative/satellite locations
• Signature logs
• Delivery
• Hours
28Pharmacy operations:Dispensing flexibilities

29
Leadership Council Virtual Discussions
©2021 All Rights Reserved
COVID-19: Impact on Management of Type 2 Diabetes
30
Copyright © 2017 AMGA Analytics LLC and OptumInsight Inc. All rights reserved.Copyright © 2021 AMGA Analytics LLC and OptumInsight Inc. All rights reserved.31
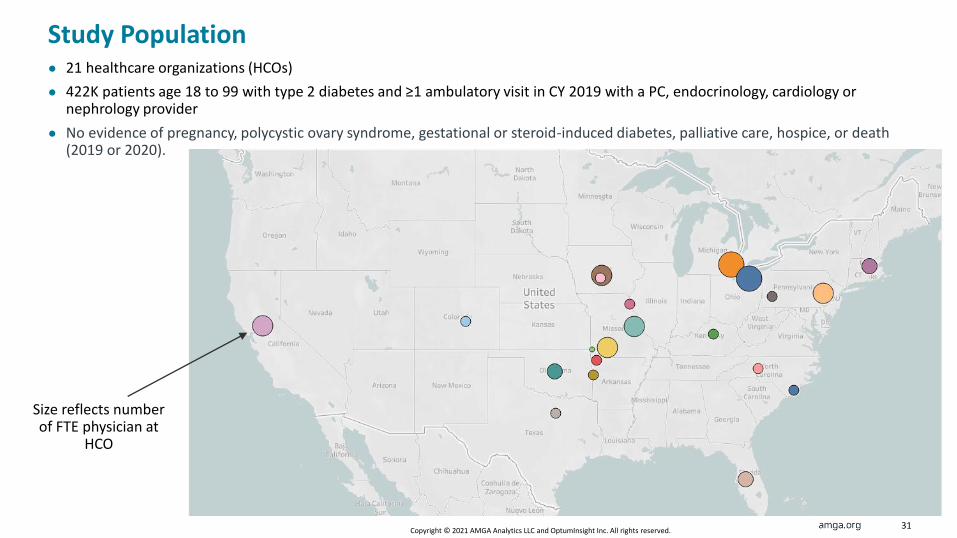
● 21 healthcare organizations (HCOs)
● 422K patients age 18 to 99 with type 2 diabetes and ≥1 ambulatory visit in CY 2019 with a PC, endocrinology, cardiology or nephrology provider
● No evidence of pregnancy, polycystic ovary syndrome, gestational or steroid-induced diabetes, palliative care, hospice, or death(2019 or 2020).
Study Population
Size reflects number of FTE physician at
HCO
Copyright © 2017 AMGA Analytics LLC and OptumInsight Inc. All rights reserved.Copyright © 2021 AMGA Analytics LLC and OptumInsight Inc. All rights reserved.32
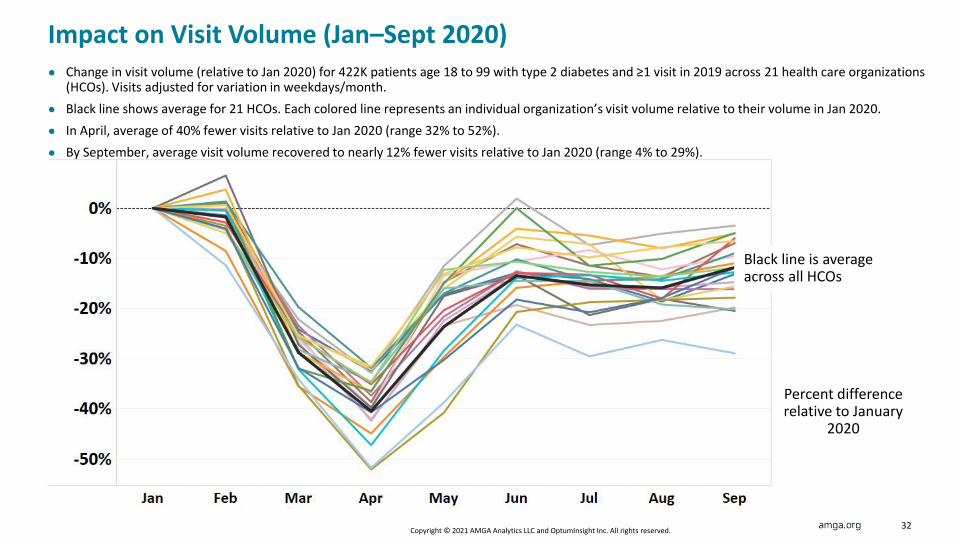
● Change in visit volume (relative to Jan 2020) for 422K patients age 18 to 99 with type 2 diabetes and ≥1 visit in 2019 across 21 health care organizations (HCOs). Visits adjusted for variation in weekdays/month.
● Black line shows average for 21 HCOs. Each colored line represents an individual organization’s visit volume relative to their volume in Jan 2020.
● In April, average of 40% fewer visits relative to Jan 2020 (range 32% to 52%).
● By September, average visit volume recovered to nearly 12% fewer visits relative to Jan 2020 (range 4% to 29%).
Impact on Visit Volume (Jan–Sept 2020)
Percent difference relative to January
2020
Black line is average across all HCOs
Copyright © 2017 AMGA Analytics LLC and OptumInsight Inc. All rights reserved.Copyright © 2021 AMGA Analytics LLC and OptumInsight Inc. All rights reserved.33
Percent difference relative to January
2020
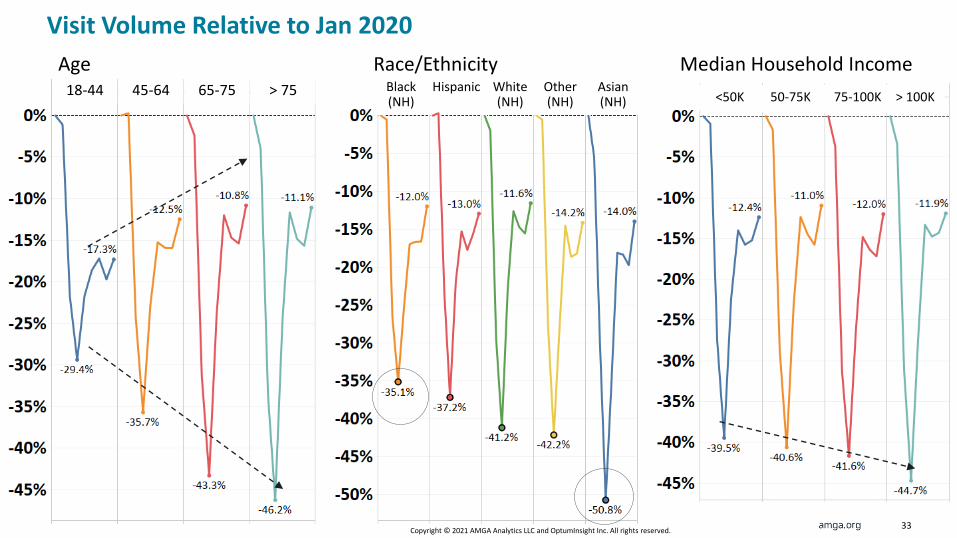
Visit Volume Relative to Jan 2020
Age Race/Ethnicity Median Household Income18-44 45-64 65-75 > 75 Black
(NH)Hispanic Asian
(NH)Other(NH)
White(NH) <50K 50-75K 75-100K > 100K
Copyright © 2017 AMGA Analytics LLC and OptumInsight Inc. All rights reserved.Copyright © 2021 AMGA Analytics LLC and OptumInsight Inc. All rights reserved.34
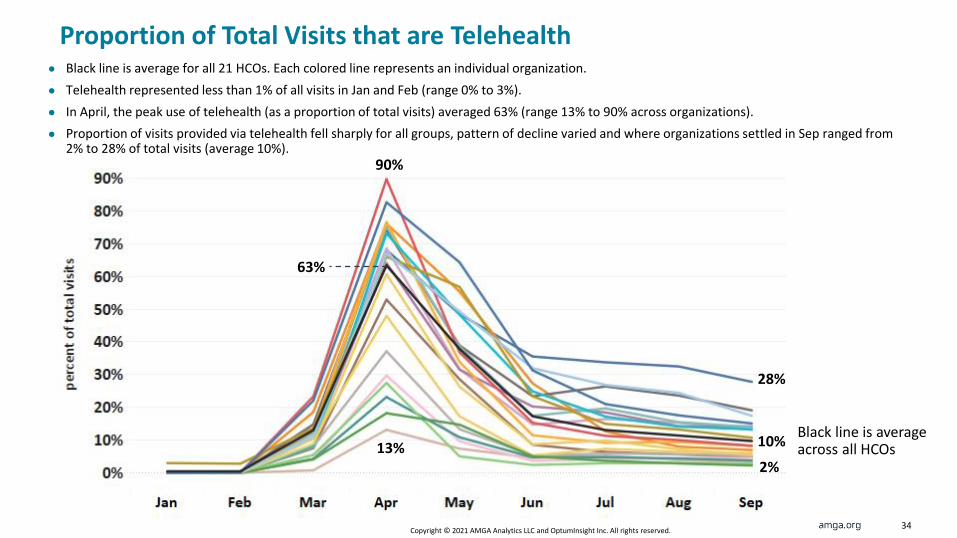
● Black line is average for all 21 HCOs. Each colored line represents an individual organization.
● Telehealth represented less than 1% of all visits in Jan and Feb (range 0% to 3%).
● In April, the peak use of telehealth (as a proportion of total visits) averaged 63% (range 13% to 90% across organizations).
● Proportion of visits provided via telehealth fell sharply for all groups, pattern of decline varied and where organizations settled in Sep ranged from 2% to 28% of total visits (average 10%).
Proportion of Total Visits that are Telehealth
13%
90%
63%
2%
28%
10%Black line is average across all HCOs
Copyright © 2017 AMGA Analytics LLC and OptumInsight Inc. All rights reserved.Copyright © 2021 AMGA Analytics LLC and OptumInsight Inc. All rights reserved.35
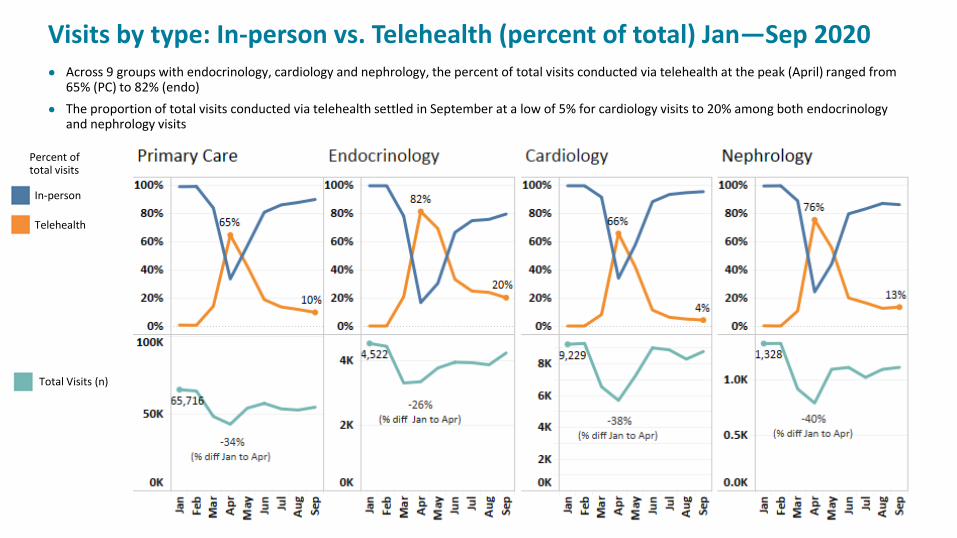
● Across 9 groups with endocrinology, cardiology and nephrology, the percent of total visits conducted via telehealth at the peak (April) ranged from 65% (PC) to 82% (endo)
● The proportion of total visits conducted via telehealth settled in September at a low of 5% for cardiology visits to 20% among both endocrinology and nephrology visits
Visits by type: In-person vs. Telehealth (percent of total) Jan—Sep 2020
Total Visits (n)
In-person
Telehealth
Percent of total visits
Copyright © 2017 AMGA Analytics LLC and OptumInsight Inc. All rights reserved.Copyright © 2021 AMGA Analytics LLC and OptumInsight Inc. All rights reserved.36
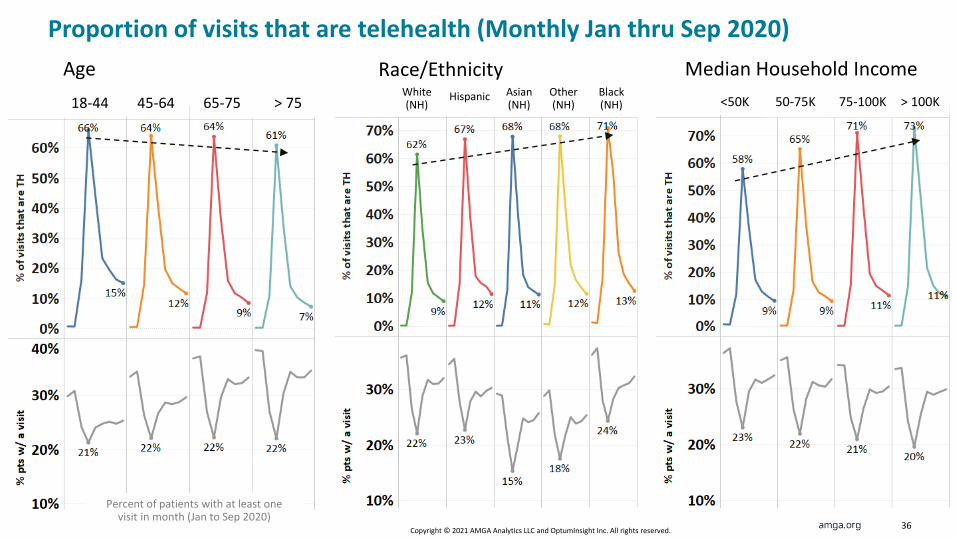
Age Race/Ethnicity Median Household Income
18-44 45-64 65-75 > 75 <50K 50-75K 75-100K > 100KWhite(NH)
Black(NH)
Other(NH)
Asian(NH)
Hispanic
Proportion of visits that are telehealth (Monthly Jan thru Sep 2020)
Percent of patients with at least one visit in month (Jan to Sep 2020)
Copyright © 2017 AMGA Analytics LLC and OptumInsight Inc. All rights reserved.Copyright © 2021 AMGA Analytics LLC and OptumInsight Inc. All rights reserved.37
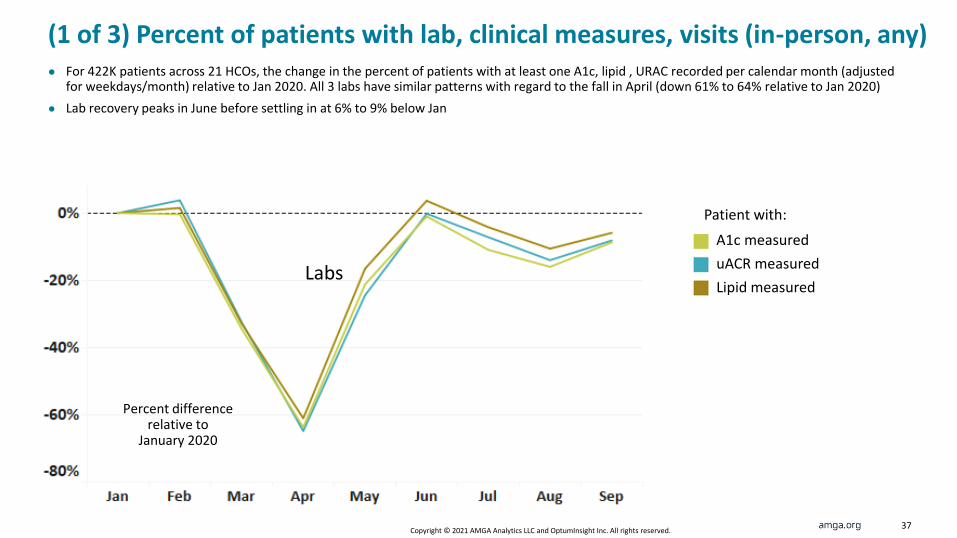
(1 of 3) Percent of patients with lab, clinical measures, visits (in-person, any)● For 422K patients across 21 HCOs, the change in the percent of patients with at least one A1c, lipid , URAC recorded per calendar month (adjusted
for weekdays/month) relative to Jan 2020. All 3 labs have similar patterns with regard to the fall in April (down 61% to 64% relative to Jan 2020)
● Lab recovery peaks in June before settling in at 6% to 9% below Jan
LabsuACR measured
Lipid measured
A1c measured
Patient with:
Percent difference relative to
January 2020
Copyright © 2017 AMGA Analytics LLC and OptumInsight Inc. All rights reserved.Copyright © 2021 AMGA Analytics LLC and OptumInsight Inc. All rights reserved.38
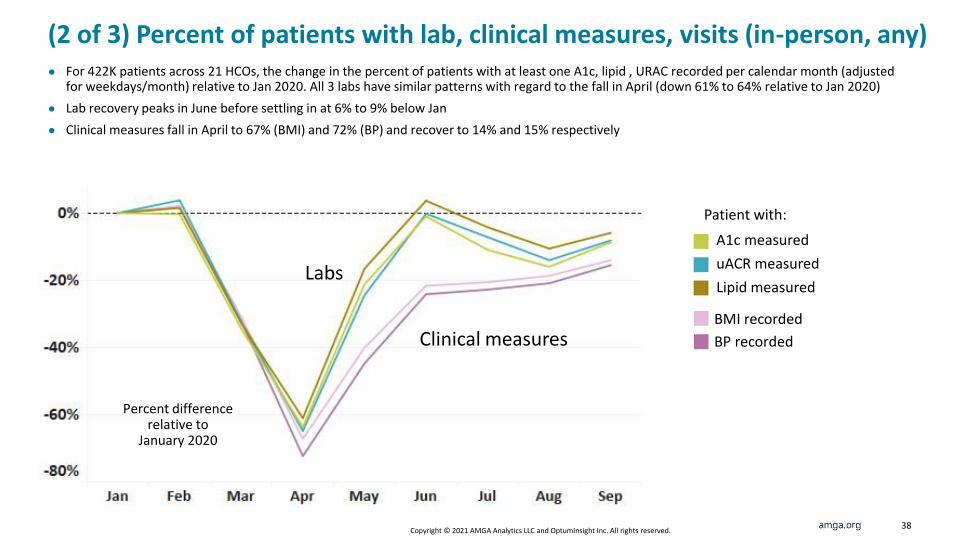
(2 of 3) Percent of patients with lab, clinical measures, visits (in-person, any)● For 422K patients across 21 HCOs, the change in the percent of patients with at least one A1c, lipid , URAC recorded per calendar month (adjusted
for weekdays/month) relative to Jan 2020. All 3 labs have similar patterns with regard to the fall in April (down 61% to 64% relative to Jan 2020)
● Lab recovery peaks in June before settling in at 6% to 9% below Jan
● Clinical measures fall in April to 67% (BMI) and 72% (BP) and recover to 14% and 15% respectively
Labs
Clinical measures
uACR measured
Lipid measured
A1c measured
BMI recorded
BP recorded
Patient with:
Percent difference relative to
January 2020
Copyright © 2017 AMGA Analytics LLC and OptumInsight Inc. All rights reserved.Copyright © 2021 AMGA Analytics LLC and OptumInsight Inc. All rights reserved.39
uACR measured
Lipid measured
A1c measured
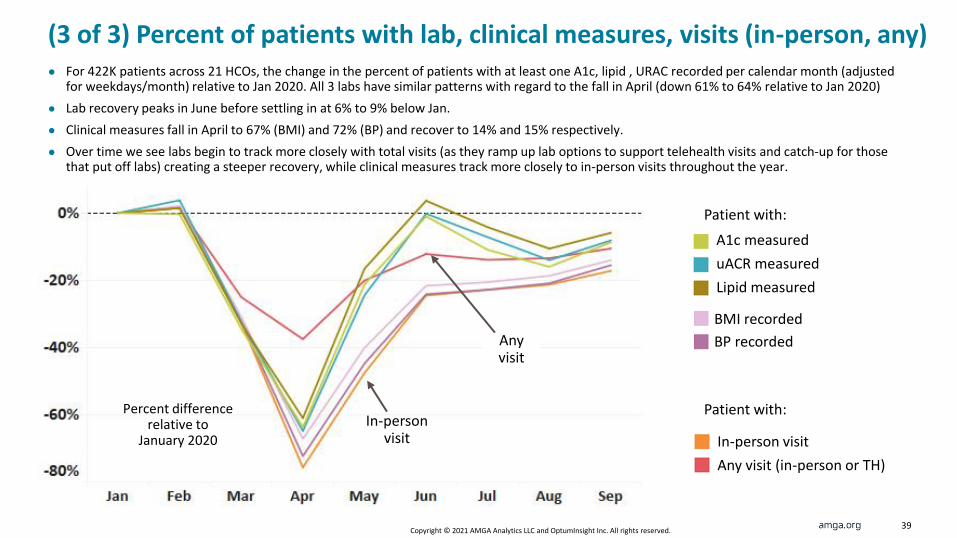
● For 422K patients across 21 HCOs, the change in the percent of patients with at least one A1c, lipid , URAC recorded per calendar month (adjusted for weekdays/month) relative to Jan 2020. All 3 labs have similar patterns with regard to the fall in April (down 61% to 64% relative to Jan 2020)
● Lab recovery peaks in June before settling in at 6% to 9% below Jan.
● Clinical measures fall in April to 67% (BMI) and 72% (BP) and recover to 14% and 15% respectively.
● Over time we see labs begin to track more closely with total visits (as they ramp up lab options to support telehealth visits and catch-up for those that put off labs) creating a steeper recovery, while clinical measures track more closely to in-person visits throughout the year.
In-person visit
Any visit
BMI recorded
BP recorded
In-person visit
Any visit (in-person or TH)
(3 of 3) Percent of patients with lab, clinical measures, visits (in-person, any)
Percent difference relative to
January 2020
Patient with:
Patient with:
40©2021 All Rights Reserved
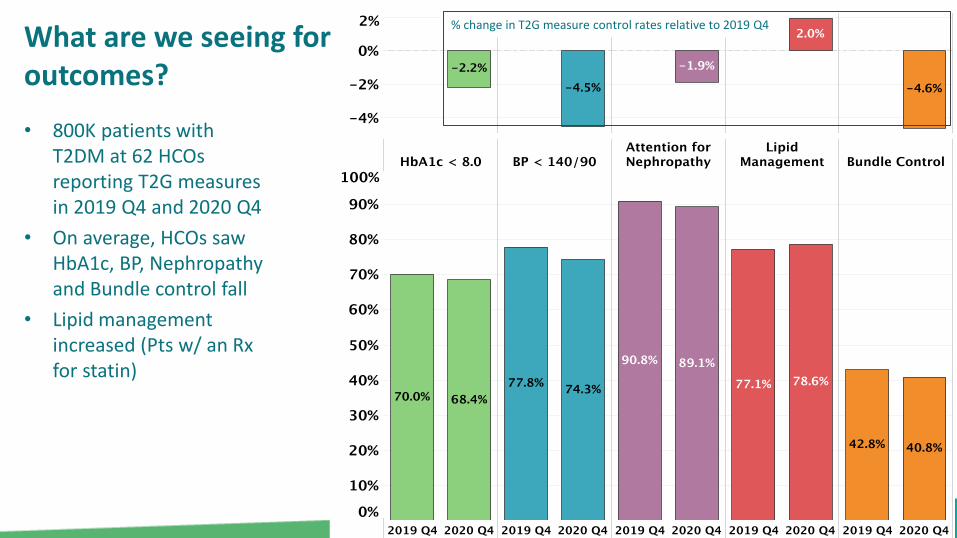
What are we seeing for outcomes?
• 800K patients with T2DM at 62 HCOs reporting T2G measures in 2019 Q4 and 2020 Q4
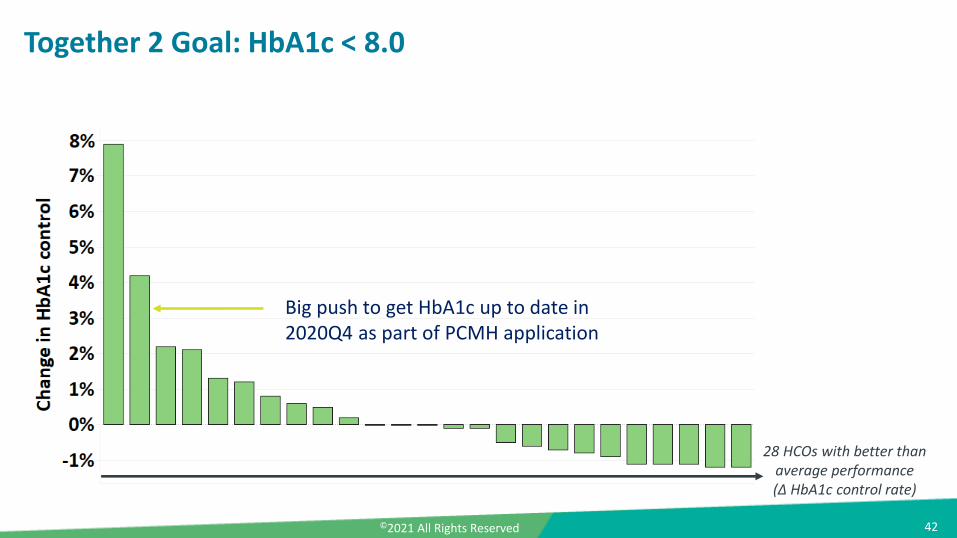
• On average, HCOs saw HbA1c, BP, Nephropathy and Bundle control fall
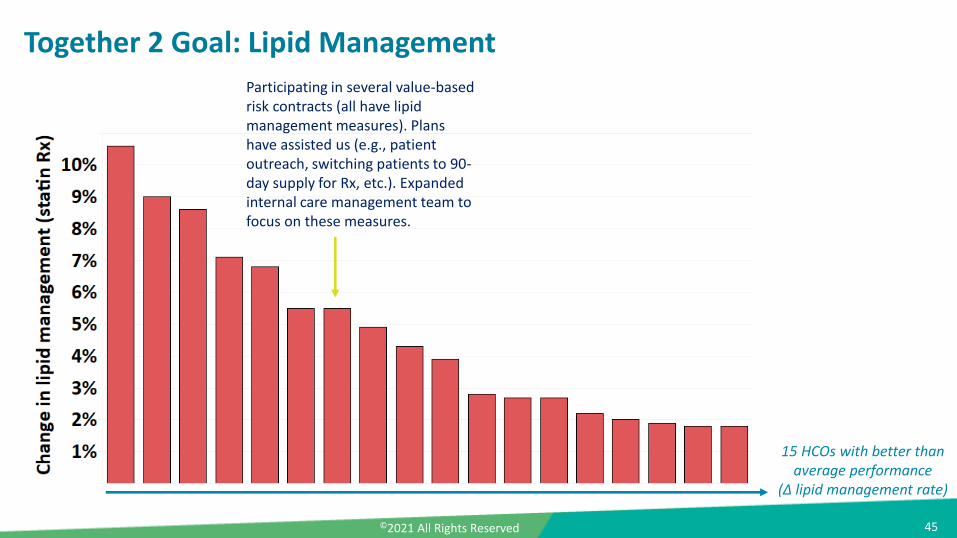
• Lipid management increased (Pts w/ an Rx for statin)
% change in T2G measure control rates relative to 2019 Q4
©2021 All Rights Reserved
Improvements inHealth Care Organizations during COVID-19
41
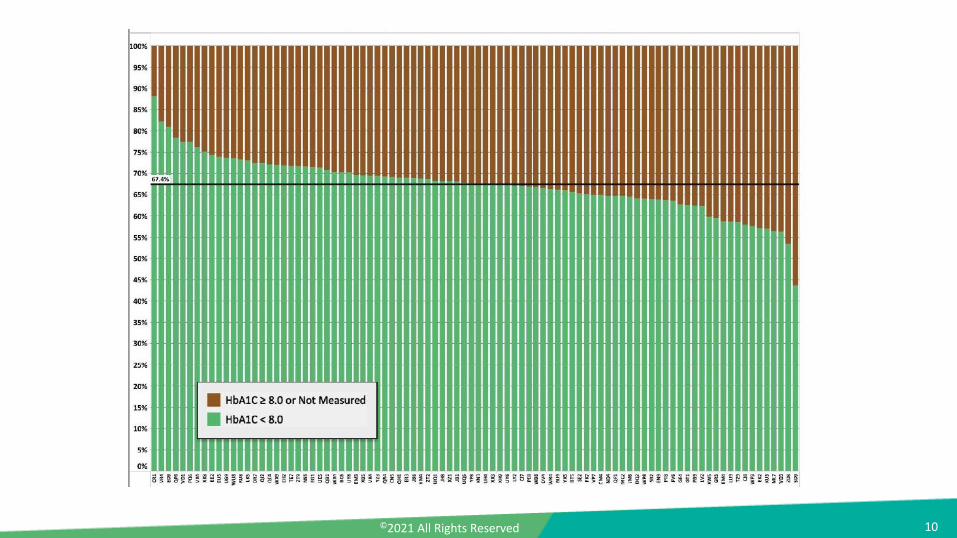
42©2021 All Rights Reserved
Together 2 Goal: HbA1c < 8.0
Big push to get HbA1c up to date in 2020Q4 as part of PCMH application
28 HCOs with better than average performance(Δ HbA1c control rate)
43©2021 All Rights Reserved
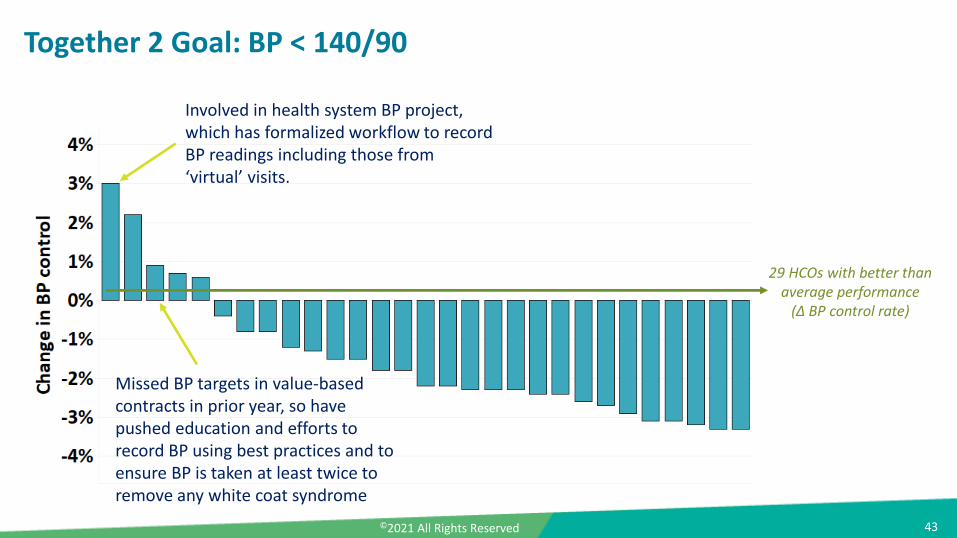
Together 2 Goal: BP < 140/90
Involved in health system BP project, which has formalized workflow to record BP readings including those from ‘virtual’ visits.
Missed BP targets in value-based contracts in prior year, so have pushed education and efforts to record BP using best practices and to ensure BP is taken at least twice to remove any white coat syndrome
29 HCOs with better than average performance
(Δ BP control rate)
44©2021 All Rights Reserved
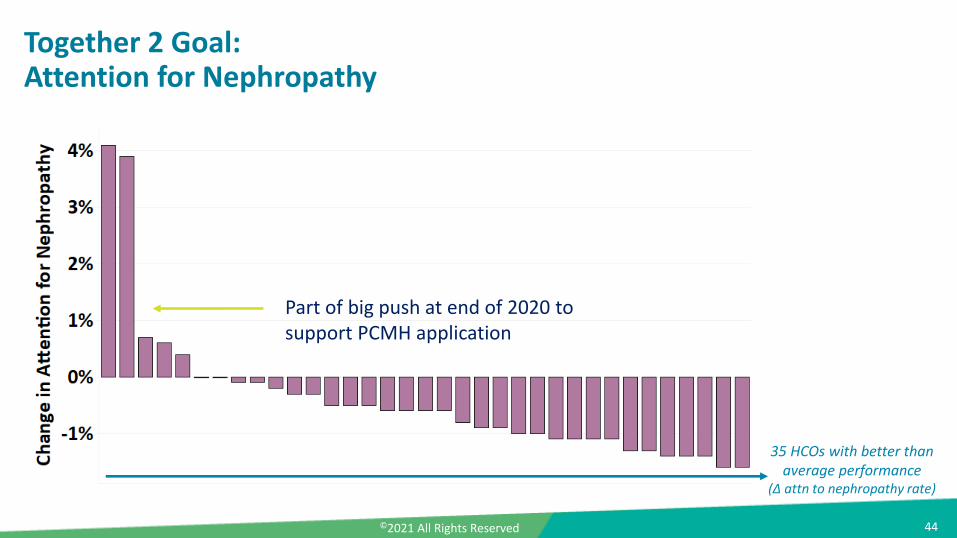
Together 2 Goal: Attention for Nephropathy
Part of big push at end of 2020 to support PCMH application
35 HCOs with better than average performance
(Δ attn to nephropathy rate)
45©2021 All Rights Reserved
Together 2 Goal: Lipid Management
15 HCOs with better than average performance
(Δ lipid management rate)
Participating in several value-based risk contracts (all have lipid management measures). Plans have assisted us (e.g., patient outreach, switching patients to 90-day supply for Rx, etc.). Expanded internal care management team to focus on these measures.
46©2021 All Rights Reserved
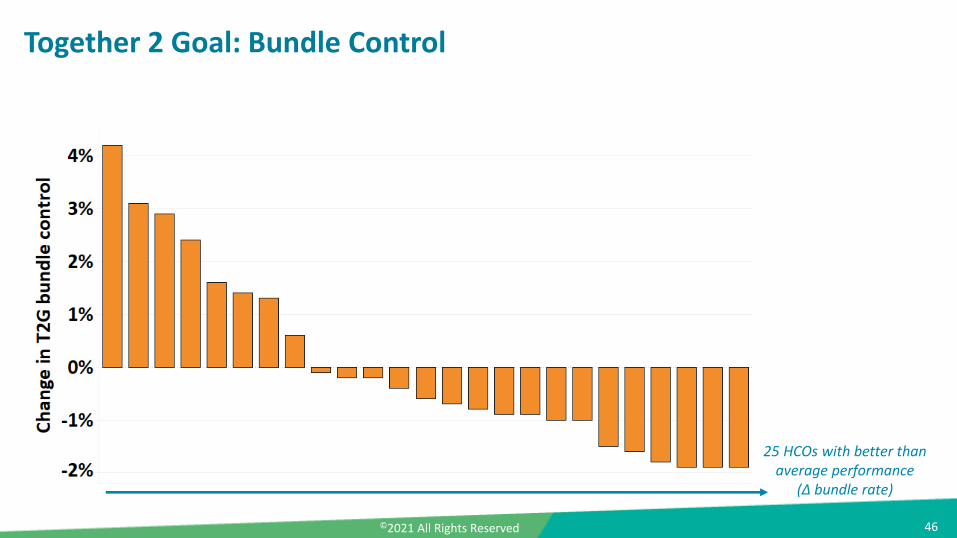
Together 2 Goal: Bundle Control
25 HCOs with better than average performance
(Δ bundle rate)
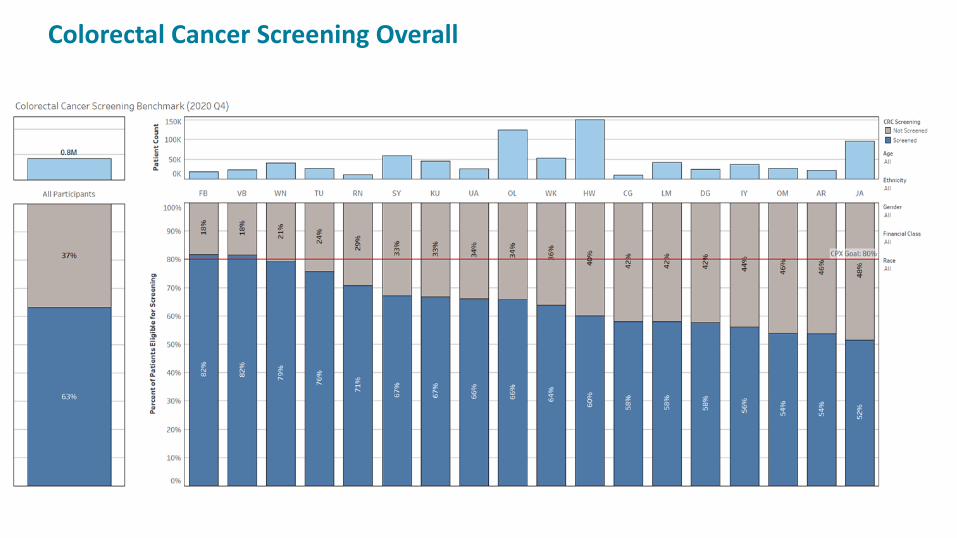
Colorectal Cancer Screening Overall

Copyright © 2017 AMGA Analytics LLC and OptumInsight Inc. All rights reserved.Copyright © 2021 AMGA Analytics LLC and OptumInsight Inc. All rights reserved.48
Colorectal Cancer Screening Improvements: HCO #1
Screened
Not Screened
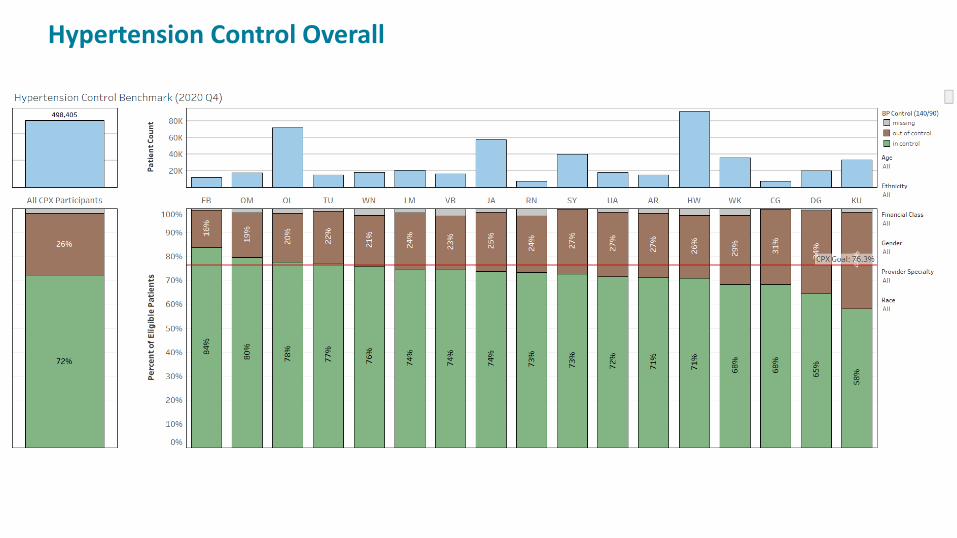
Hypertension Control Overall
Copyright © 2017 AMGA Analytics LLC and OptumInsight Inc. All rights reserved.Copyright © 2021 AMGA Analytics LLC and OptumInsight Inc. All rights reserved.50
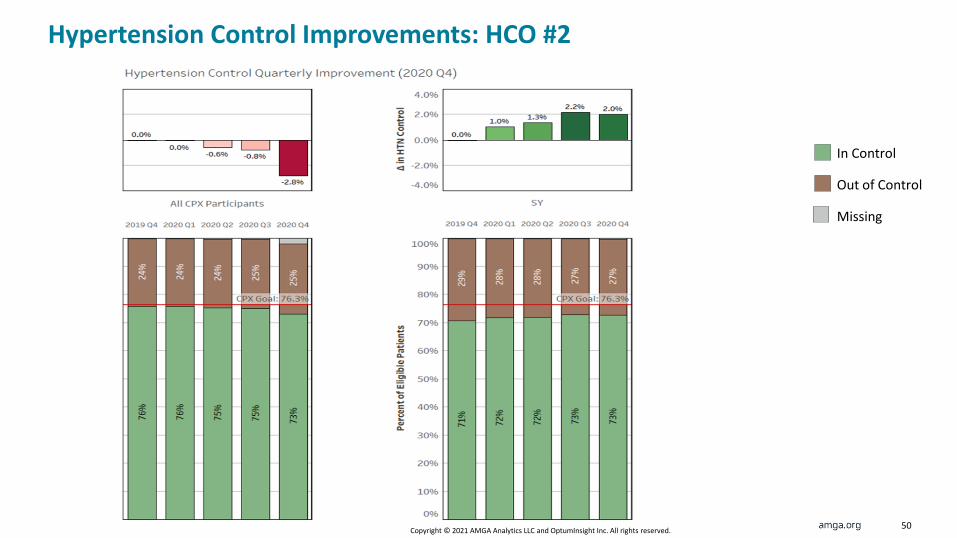
Hypertension Control Improvements: HCO #2
In Control
Out of Control
Missing

©2021 All Rights Reserved
Going Forward
51
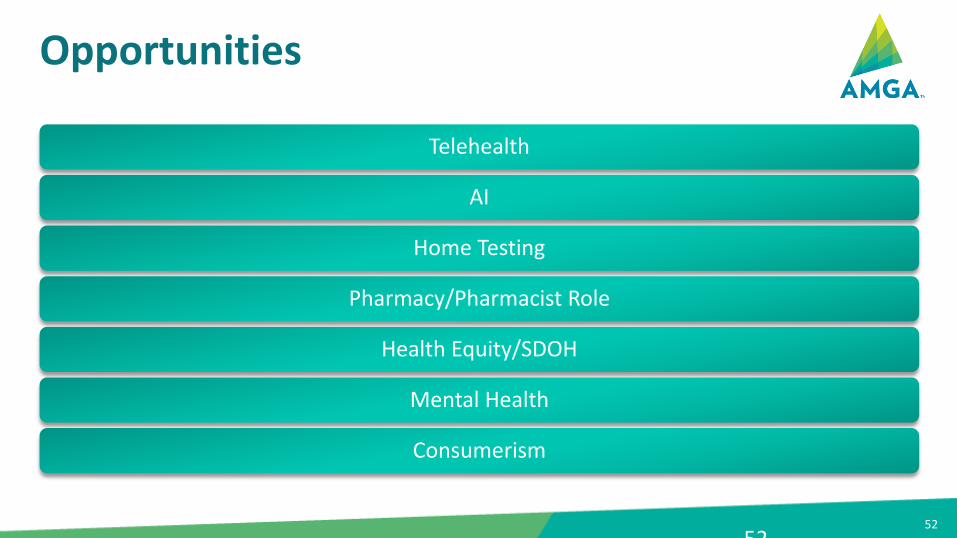
52
Opportunities
Telehealth
AI
Home Testing
Pharmacy/Pharmacist Role
Health Equity/SDOH
Mental Health
Consumerism
52
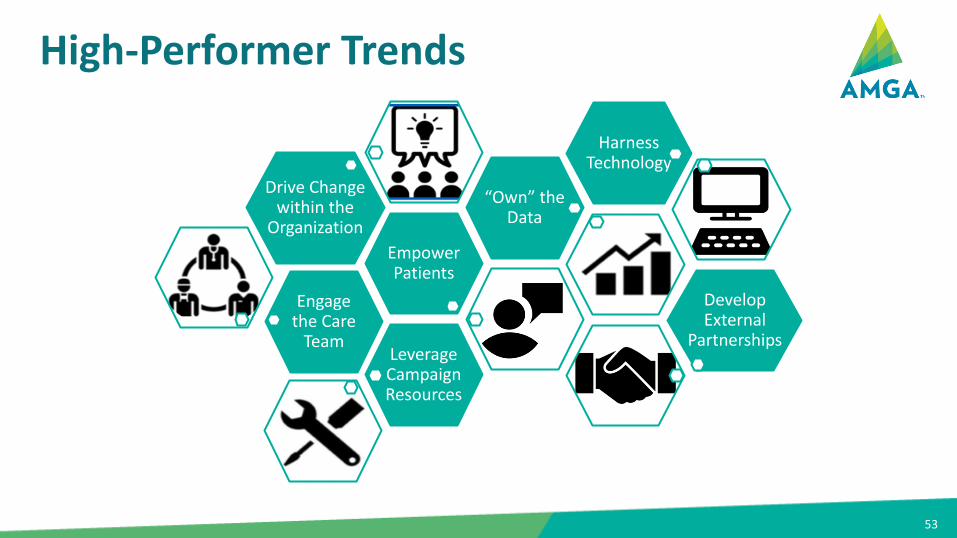
53
Harness Technology
Drive Change within the
Organization
Engage the Care
Team
High-Performer Trends
Empower Patients
“Own” the Data
Develop External
PartnershipsLeverage Campaign Resources
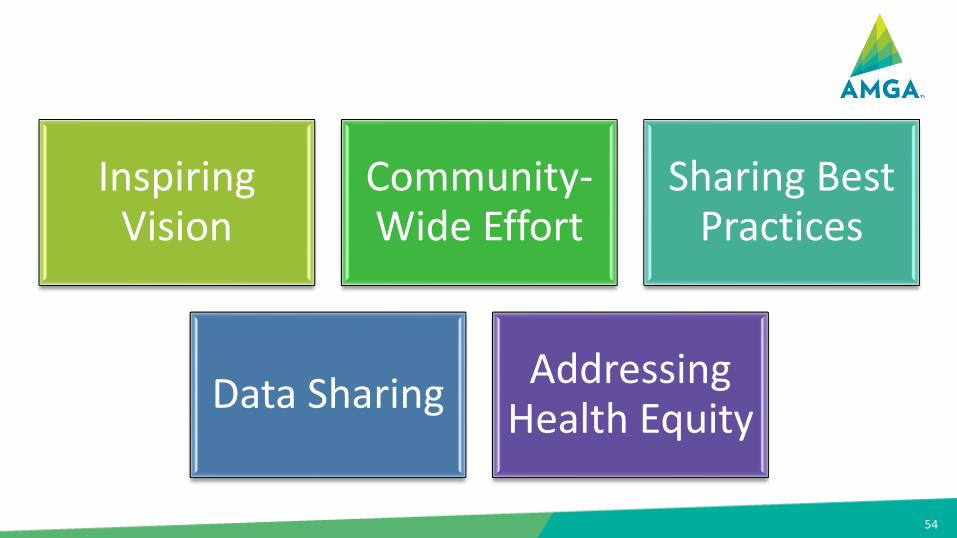
54
Inspiring Vision
Community-Wide Effort
Sharing Best Practices
Data SharingAddressing
Health Equity

© 2020 All Rights Reserved
Quality During a Pandemic
Virtual Heart Attack and Stroke Free Zone Summit
June 14, 2021
Jerry Penso, M.D., M.B.A.
President and CEO, AMGA