Embed Size (px)
Citation preview
Quality Control
Ross L. Fink
Quality Control
Quality control involves controlling the delivery processes to adhere to the specifications (or product design).
Quality Control Approaches
100 % Inspection Acceptance Sampling Statistical Process Control (SPC) or
Control-Chart Method
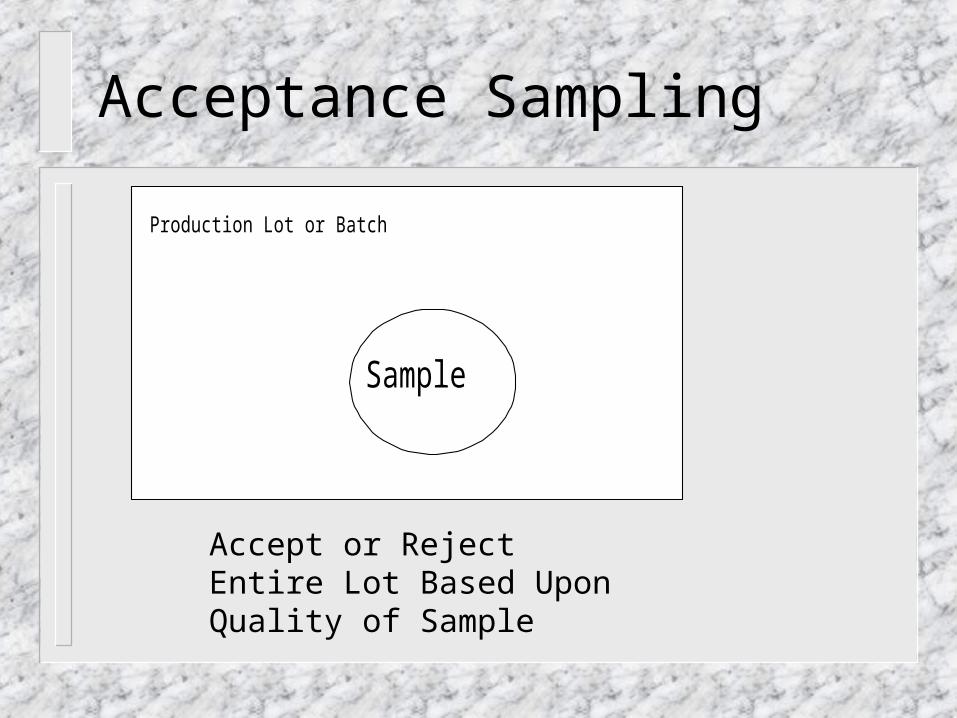
Acceptance Sampling
Production Lot or Batch
Sample
Accept or Reject Entire Lot Based Upon Quality of Sample
Statistical Process Control
Basic Approach– Take one sample of size 5 each hour– Measure quality characteristic– Plot measurement over time (sample number)
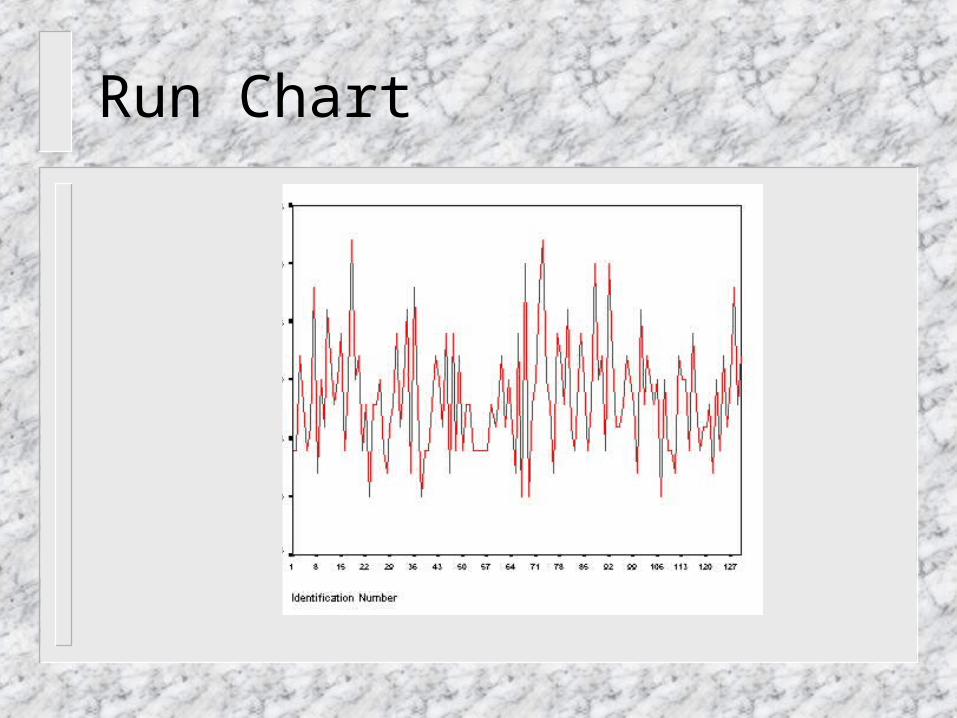
Run Chart
Distribution of Measurement on Control Chart Since we are taking a mean, the Central
Limit Theorem of the Sample Mean applies Therefore, mean follows a normal
distribution. Three Sigma Limits
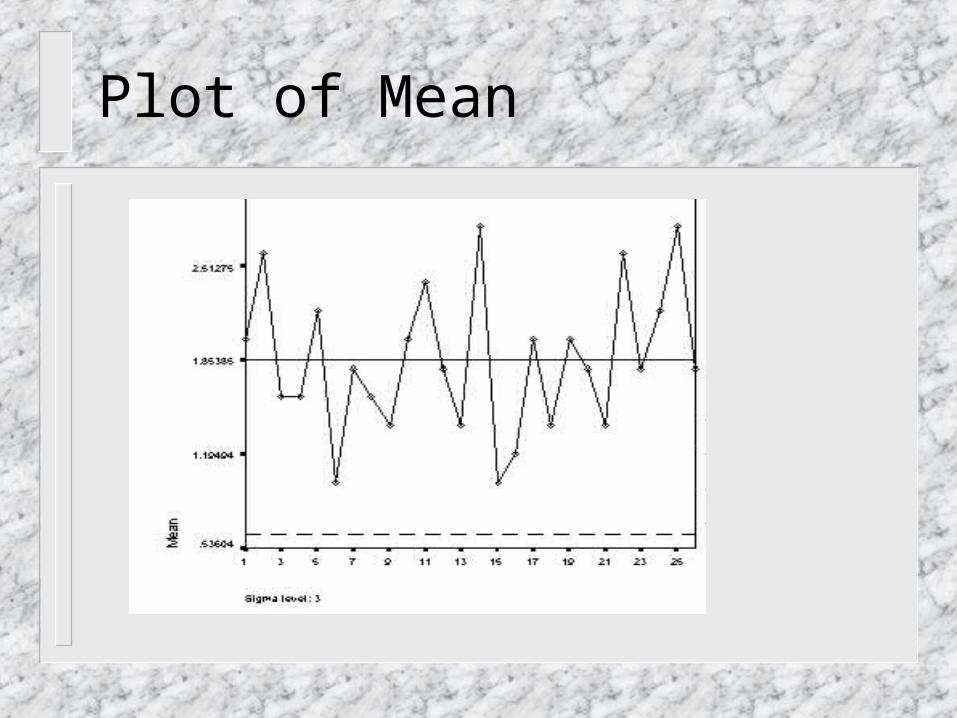
Plot of Mean
Theory of Control Charts
Purpose of control charts is to separate natural variability (common cause) from nonrandom variability (assignable cause).
In-control (common cause) versus out-of-control (assignable cause).
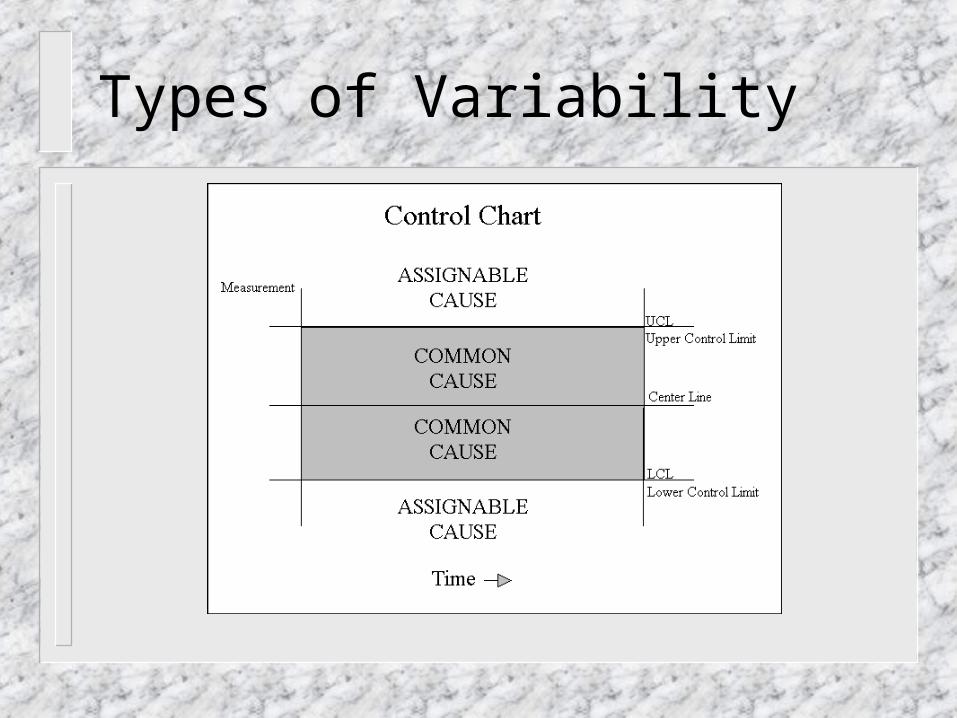
Types of Variability
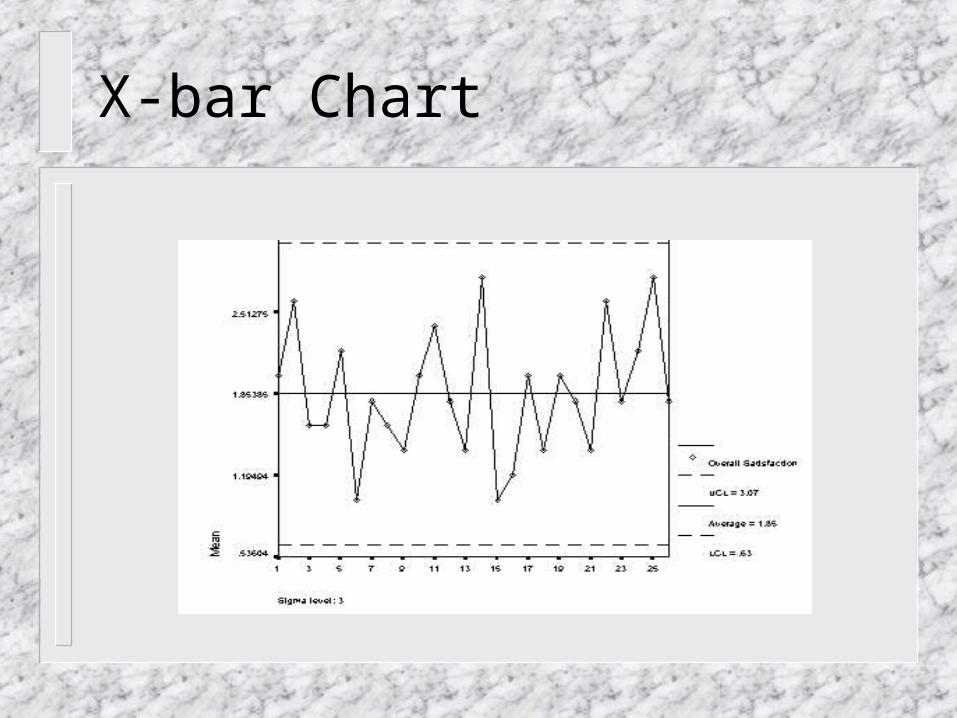
X-bar Chart
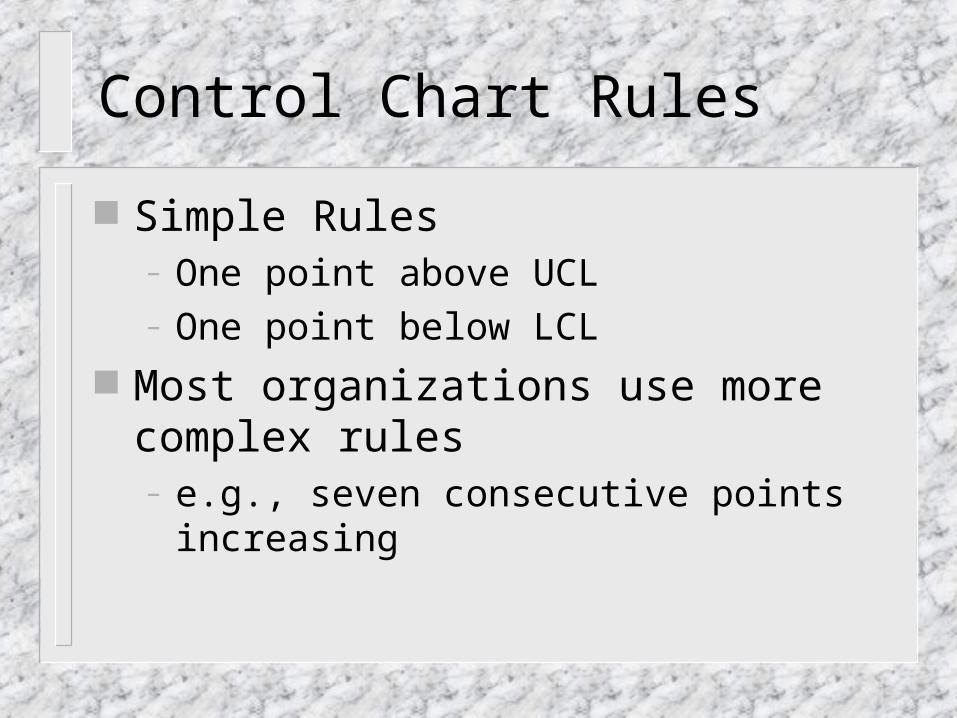
Control Chart Rules
Simple Rules– One point above UCL– One point below LCL
Most organizations use more complex rules– e.g., seven consecutive points increasing
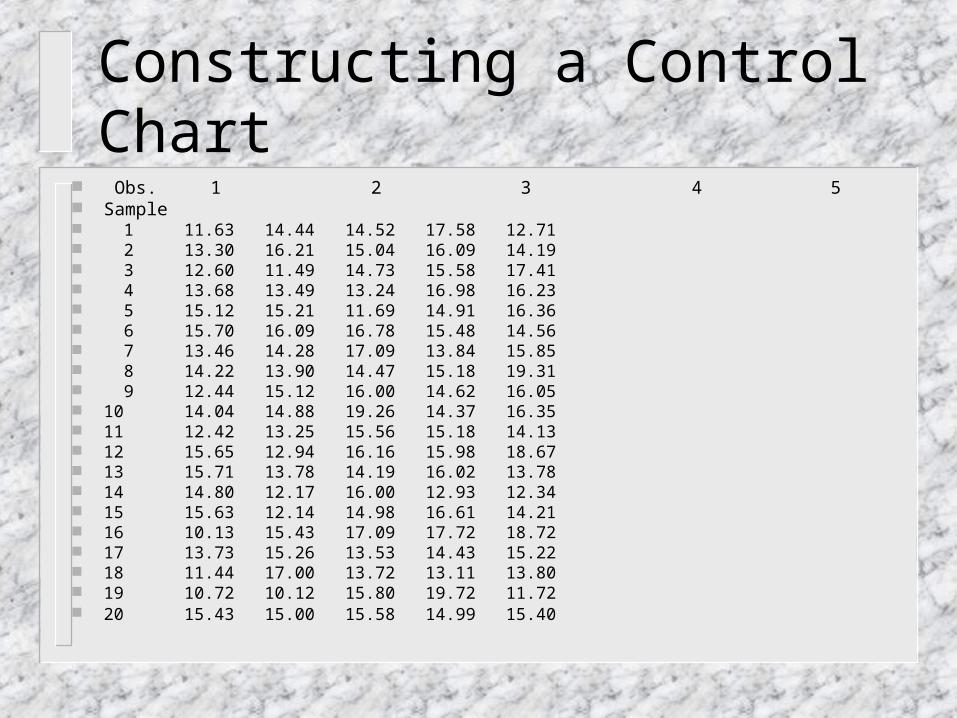
Constructing a Control Chart Obs. 1 2 3 4 5 Sample 1 11.63 14.44 14.52 17.58 12.71 2 13.30 16.21 15.04 16.09 14.19 3 12.60 11.49 14.73 15.58 17.41 4 13.68 13.49 13.24 16.98 16.23 5 15.12 15.21 11.69 14.91 16.36 6 15.70 16.09 16.78 15.48 14.56 7 13.46 14.28 17.09 13.84 15.85 8 14.22 13.90 14.47 15.18 19.31 9 12.44 15.12 16.00 14.62 16.05 10 14.04 14.88 19.26 14.37 16.35 11 12.42 13.25 15.56 15.18 14.13 12 15.65 12.94 16.16 15.98 18.67 13 15.71 13.78 14.19 16.02 13.78 14 14.80 12.17 16.00 12.93 12.34 15 15.63 12.14 14.98 16.61 14.21 16 10.13 15.43 17.09 17.72 18.72 17 13.73 15.26 13.53 14.43 15.22 18 11.44 17.00 13.72 13.11 13.80 19 10.72 10.12 15.80 19.72 11.72 20 15.43 15.00 15.58 14.99 15.40
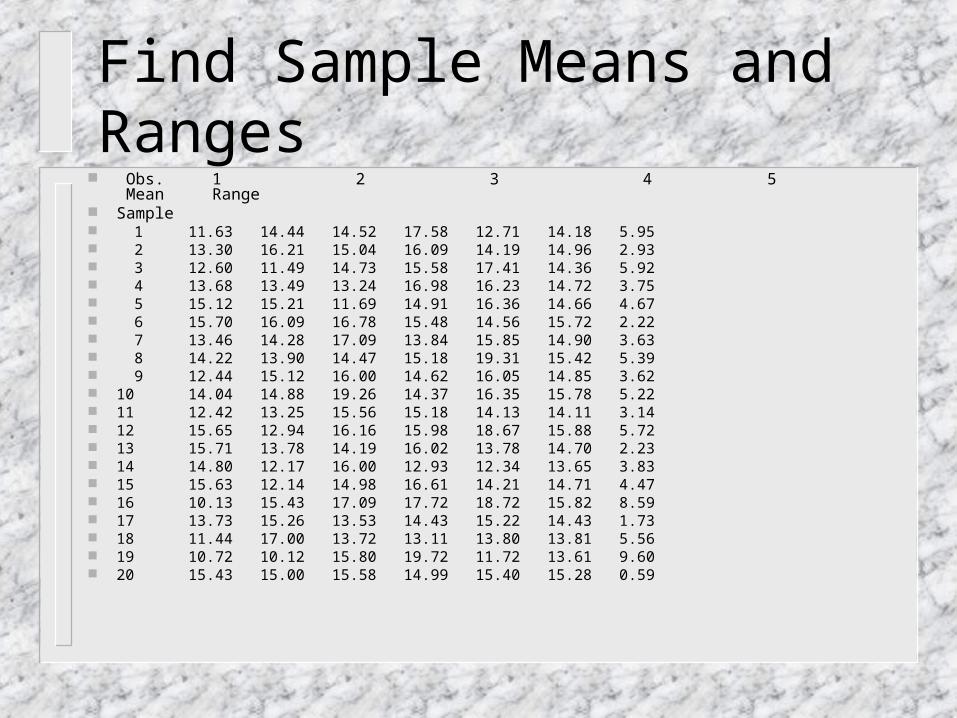
Find Sample Means and Ranges Obs. 1 2 3 4 5 Mean Range Sample 1 11.63 14.44 14.52 17.58 12.71 14.18 5.95 2 13.30 16.21 15.04 16.09 14.19 14.96 2.93 3 12.60 11.49 14.73 15.58 17.41 14.36 5.92 4 13.68 13.49 13.24 16.98 16.23 14.72 3.75 5 15.12 15.21 11.69 14.91 16.36 14.66 4.67 6 15.70 16.09 16.78 15.48 14.56 15.72 2.22 7 13.46 14.28 17.09 13.84 15.85 14.90 3.63 8 14.22 13.90 14.47 15.18 19.31 15.42 5.39 9 12.44 15.12 16.00 14.62 16.05 14.85 3.62 10 14.04 14.88 19.26 14.37 16.35 15.78 5.22 11 12.42 13.25 15.56 15.18 14.13 14.11 3.14 12 15.65 12.94 16.16 15.98 18.67 15.88 5.72 13 15.71 13.78 14.19 16.02 13.78 14.70 2.23 14 14.80 12.17 16.00 12.93 12.34 13.65 3.83 15 15.63 12.14 14.98 16.61 14.21 14.71 4.47 16 10.13 15.43 17.09 17.72 18.72 15.82 8.59 17 13.73 15.26 13.53 14.43 15.22 14.43 1.73 18 11.44 17.00 13.72 13.11 13.80 13.81 5.56 19 10.72 10.12 15.80 19.72 11.72 13.61 9.60 20 15.43 15.00 15.58 14.99 15.40 15.28 0.59
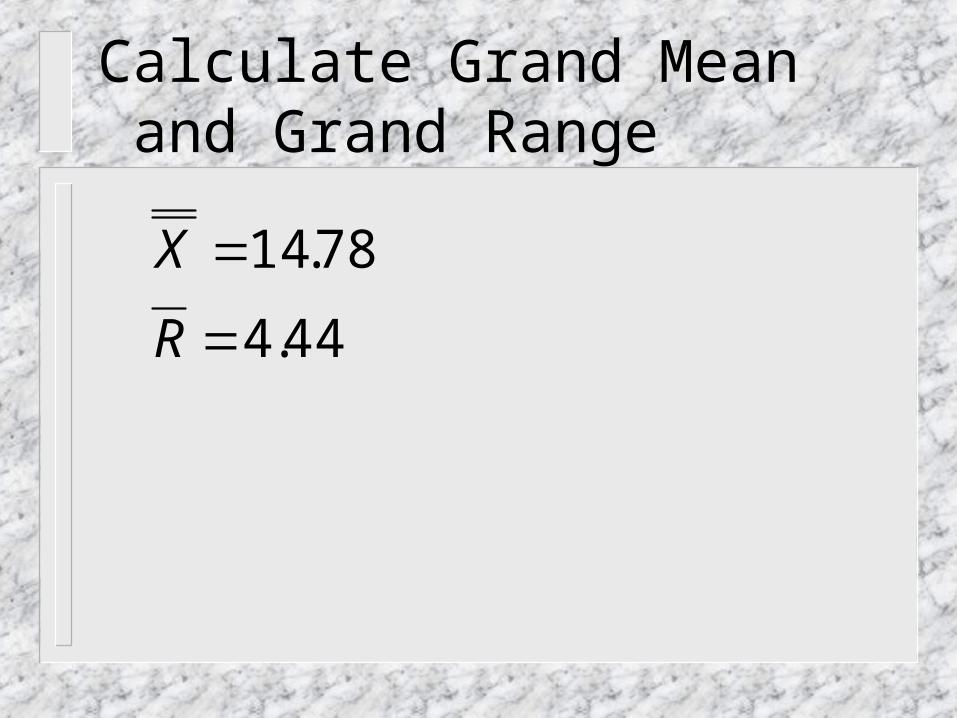
Calculate Grand Mean and Grand Range
44.4
78.14
R
X
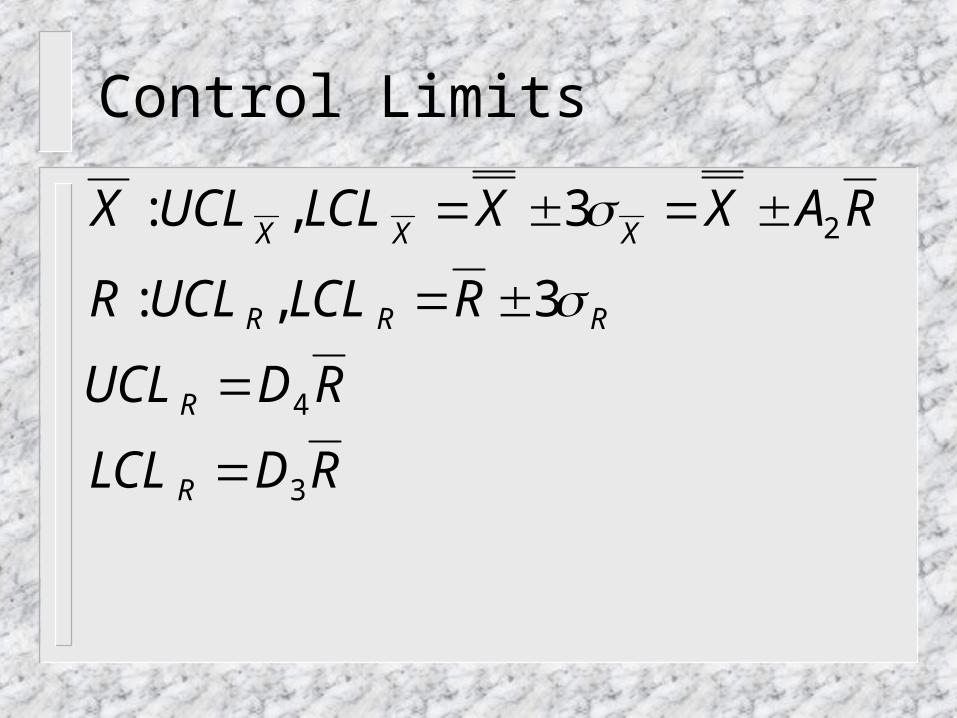
Control Limits
RDLCL
RDUCL
RLCLUCLR
RAXXLCLUCLX
R
R
RRR
XXX
3
4
2
3,:
3,:
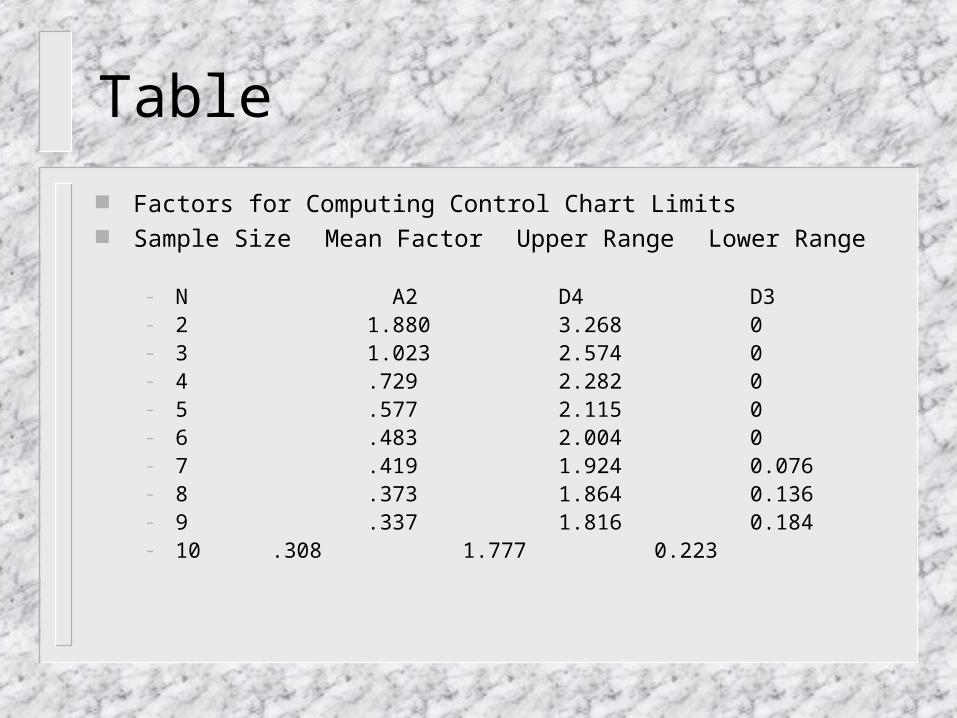
Table
Factors for Computing Control Chart Limits Sample Size Mean Factor Upper Range Lower Range
– N A2 D4 D3– 2 1.880 3.268 0– 3 1.023 2.574 0– 4 .729 2.282 0– 5 .577 2.115 0– 6 .483 2.004 0– 7 .419 1.924 0.076– 8 .373 1.864 0.136– 9 .337 1.816 0.184– 10 .308 1.777 0.223
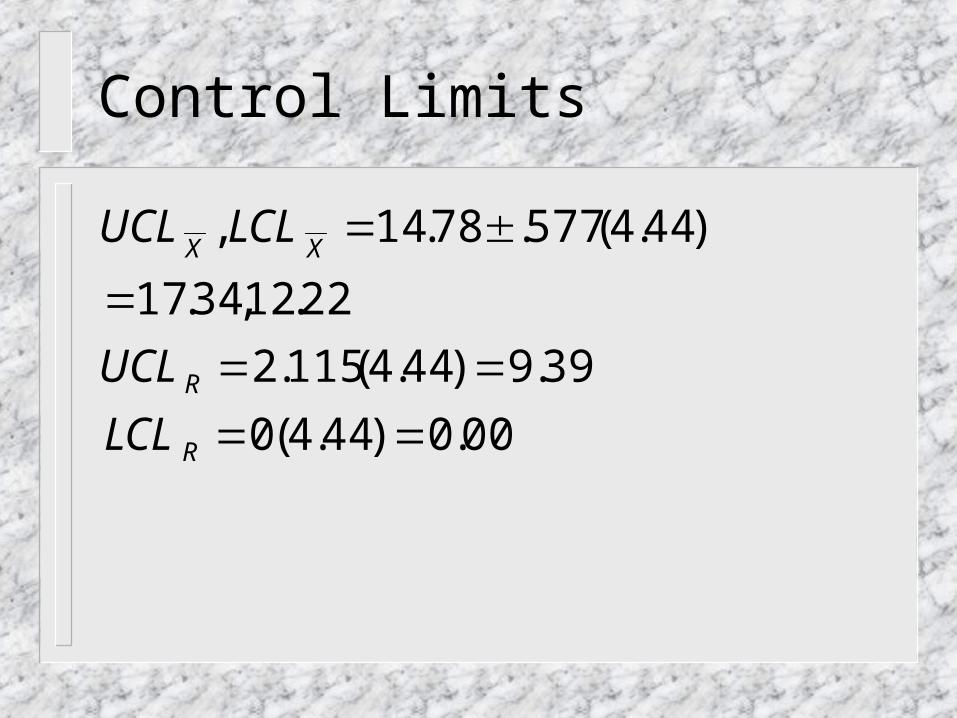
Control Limits
00.0)44.4(0
39.9)44.4(115.2
22.12,34.17
)44.4(577.78.14,
R
R
XX
LCL
UCL
LCLUCL
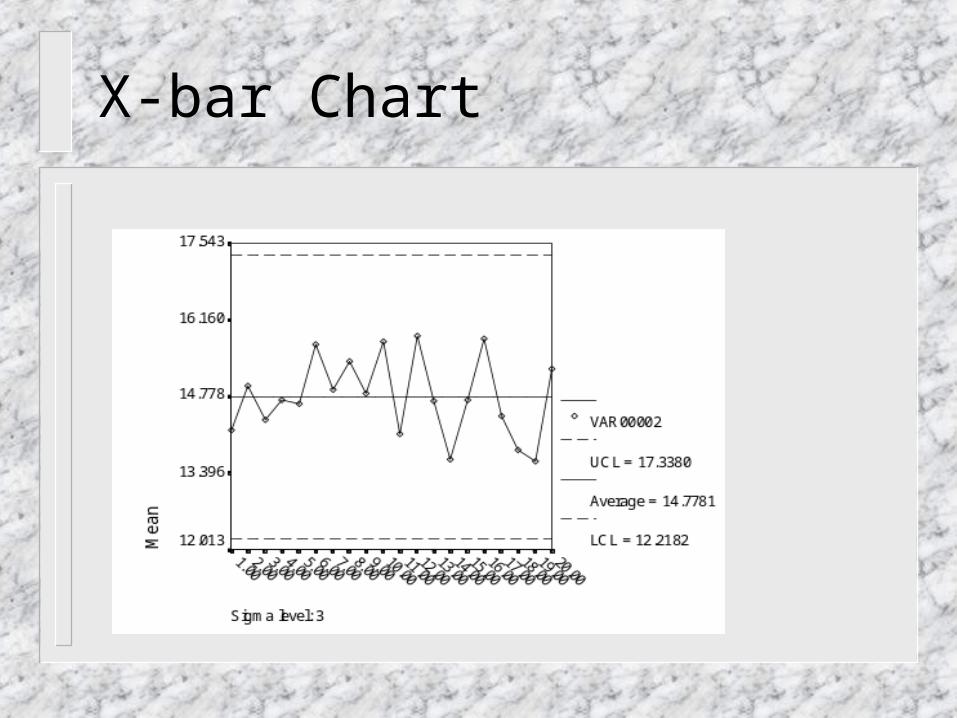
X-bar Chart
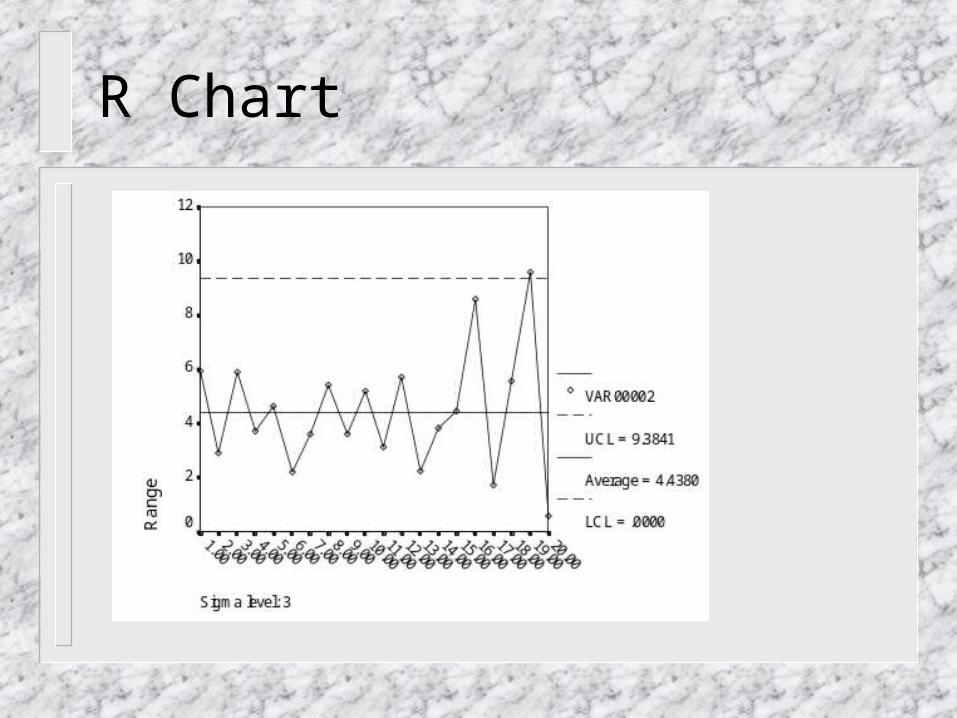
R Chart
In-Control v. Out-Of-Control
What are the implications of being in-control?
What are the implications of being out-of-control?