Embed Size (px)
Citation preview
J B Yadhushree, P B Shiva Kumar, D’ Souza Keerthi, International Journal of Advance Research, Ideas and Innovations in
Technology.
© 2017, www.IJARIIT.com All Rights Reserved Page | 776
ISSN: 2454-132X
Impact factor: 4.295 (Volume3, Issue4)
Available online at www.ijariit.com
Qualitative Risk Assessment and HAZOP Study of a Glass
Manufacturing Industry Yadhushree B. J
Sri Jayachamarajendra College of
Engineering, Karnataka
Environmental Engineering &
Visvesvaraya Technological
University
Shiva Kumar B. P
Sri Jayachamarajendra College of
Engineering, Karnataka
Environmental Engineering &
Visvesvaraya Technological
University
Keerthi D’ Souza
Sri Jayachamarajendra College of
Engineering, Karnataka
Environmental Engineering &
Visvesvaraya Technological
University
Abstract: In the recent years, many industries have realized that maintaining good occupational health and safety is as equally
important in accordance with production requirement. Hence there has been much scope for the risk assessment in order to
protect the workers’ health and safety at workplace. Risk assessment is a process where the Identified hazards are evaluated to
determine the potential cause of an accident and further to reduce to the lowest reasonable risk level to protect worker’s health
and safety. It is a part of risk management. Risk assessment can be categorized into Qualitative and Quantitative risk assessment
which is being carried out using different techniques. In this paper, an attempt has been made to carry a Qualitative risk
assessment i.e. Hazard Identification and Risk Assessment and HAZOP study for the identified critical areas of a glass
manufacturing industry. From the results obtained from this study, Physical Hazard is 47%, Ergonomic Hazard is 10%,
Chemical Hazard is 9%, Electrical Hazard 2%, Biological Hazard 3%, Thermal Hazard is 29% etc. Risks are also categorized
into Low, Medium and High risks which 12.09%, 45.05% and 42.06% respectively. Hazard analysis from the design intent for
Silane and ethylene gas station is also studied using a HAZOP technique. Some of the control valves are suggested to install
before the gas filter. ALOHA is also used to simulate the model to analyse the impact due to leakage from the various potential
whole area in the natural gas pipeline. Leakage from the larger hole of about 324.51 sq.cm has shown the high hazardous zone
- death to human beings i.e.12m down the line in the wind direction. However, periodical maintenance and monitoring of the
Natural gas distribution pipelines along with Gas detection system and fire hydrant system with sprinklers can prevent the
disaster.
Keywords: Risk Assessment, HAZOP, HIRA, ALOHA, Threat Zone, and Thermal Radiation
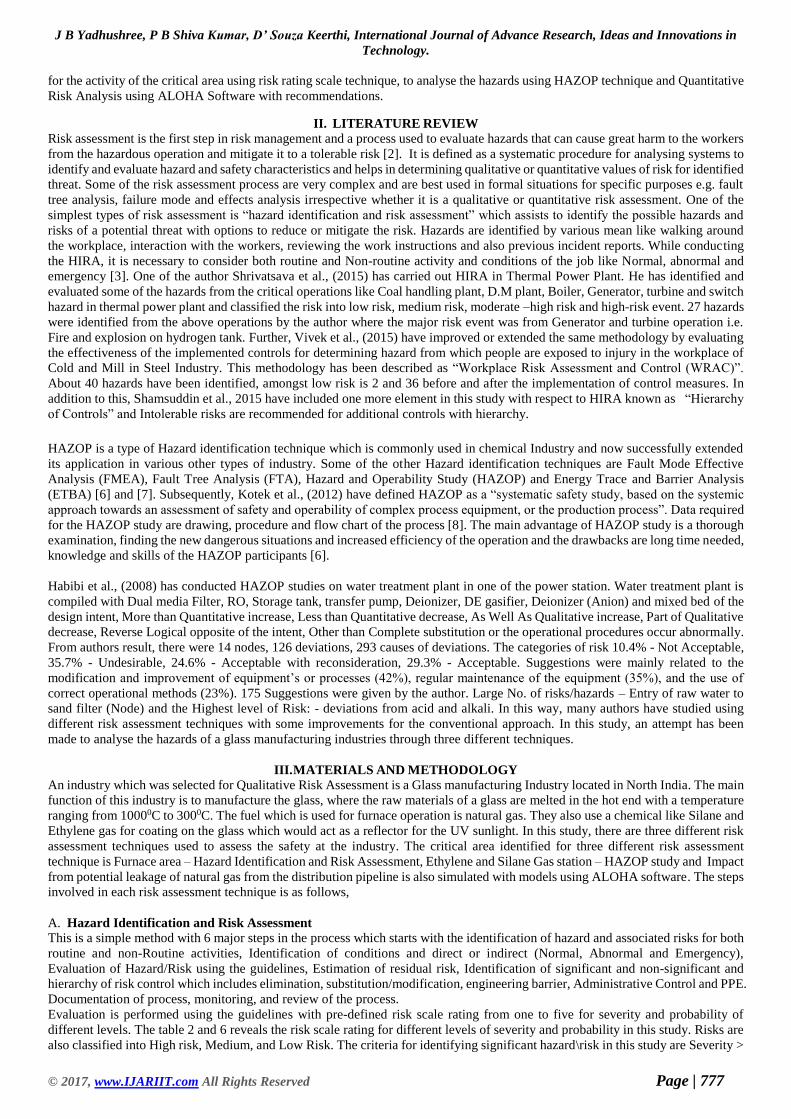
I. INTRODUCTION
Emerging new technology and social development in the industrial sector has led to increase in the size and complexity of industrial
operations especially at Pharmaceutical and Chemical manufacturing industries including automotive sectors. Industries has gained
a substantial attention in the recent years because of significant benefits to the society, such as extensive use of raw materials for
fertilizer, shelter and clothing. Although there are many benefits from the industries, any mislead in the critical operation can also
lead to the tragic event like Bhopal Gas tragedy (1984), Jaipur oil depot fire (2009), Chasnal Mining Disaster (1975) and Bombay
Docks Explosion (1944) etc. According to the “International Labour Organization” for every 15 seconds, nearly 153 worker dies
from a work related accident or diseases. One of the report published in the year 2015 from International Labour Office say that,
the incident rate of injury/ illness per 10,000 full time workers in glass manufactures is high (118.9) compared to all other private
manufacturers (102.6) for the year 2012 in United State. To avoid these accidents in an industry and for it to be successful, there is
a need for identifying Hazard/Risk associated with their complexity of the operation and brings back the risk to the tolerable risk
level. This approach is termed as Risk Assessment where hazard can be defined as “Source or the Situation, or act with a potential
for harm in terms of human injury or ill-health, or combination of these” and Risk is defined as a combination of the likelihood of
an occurrence of a hazardous event or exposure and severity of injury or ill health that can be caused by the event or exposure [1].
The main objective of this study is to evaluate safety through Risk Assessment and Hazard Analysis using HAZOP technique of the
critical areas at the workplace of Glass Manufacturing Industry. The specific objectives are, to carry out Qualitative Risk Assessment
J B Yadhushree, P B Shiva Kumar, D’ Souza Keerthi, International Journal of Advance Research, Ideas and Innovations in
Technology.
© 2017, www.IJARIIT.com All Rights Reserved Page | 777
for the activity of the critical area using risk rating scale technique, to analyse the hazards using HAZOP technique and Quantitative
Risk Analysis using ALOHA Software with recommendations.
II. LITERATURE REVIEW
Risk assessment is the first step in risk management and a process used to evaluate hazards that can cause great harm to the workers
from the hazardous operation and mitigate it to a tolerable risk [2]. It is defined as a systematic procedure for analysing systems to
identify and evaluate hazard and safety characteristics and helps in determining qualitative or quantitative values of risk for identified
threat. Some of the risk assessment process are very complex and are best used in formal situations for specific purposes e.g. fault
tree analysis, failure mode and effects analysis irrespective whether it is a qualitative or quantitative risk assessment. One of the
simplest types of risk assessment is “hazard identification and risk assessment” which assists to identify the possible hazards and
risks of a potential threat with options to reduce or mitigate the risk. Hazards are identified by various mean like walking around
the workplace, interaction with the workers, reviewing the work instructions and also previous incident reports. While conducting
the HIRA, it is necessary to consider both routine and Non-routine activity and conditions of the job like Normal, abnormal and
emergency [3]. One of the author Shrivatsava et al., (2015) has carried out HIRA in Thermal Power Plant. He has identified and
evaluated some of the hazards from the critical operations like Coal handling plant, D.M plant, Boiler, Generator, turbine and switch
hazard in thermal power plant and classified the risk into low risk, medium risk, moderate –high risk and high-risk event. 27 hazards
were identified from the above operations by the author where the major risk event was from Generator and turbine operation i.e.
Fire and explosion on hydrogen tank. Further, Vivek et al., (2015) have improved or extended the same methodology by evaluating
the effectiveness of the implemented controls for determining hazard from which people are exposed to injury in the workplace of
Cold and Mill in Steel Industry. This methodology has been described as “Workplace Risk Assessment and Control (WRAC)”.
About 40 hazards have been identified, amongst low risk is 2 and 36 before and after the implementation of control measures. In
addition to this, Shamsuddin et al., 2015 have included one more element in this study with respect to HIRA known as “Hierarchy
of Controls” and Intolerable risks are recommended for additional controls with hierarchy.
HAZOP is a type of Hazard identification technique which is commonly used in chemical Industry and now successfully extended
its application in various other types of industry. Some of the other Hazard identification techniques are Fault Mode Effective
Analysis (FMEA), Fault Tree Analysis (FTA), Hazard and Operability Study (HAZOP) and Energy Trace and Barrier Analysis
(ETBA) [6] and [7]. Subsequently, Kotek et al., (2012) have defined HAZOP as a “systematic safety study, based on the systemic
approach towards an assessment of safety and operability of complex process equipment, or the production process”. Data required
for the HAZOP study are drawing, procedure and flow chart of the process [8]. The main advantage of HAZOP study is a thorough
examination, finding the new dangerous situations and increased efficiency of the operation and the drawbacks are long time needed,
knowledge and skills of the HAZOP participants [6].
Habibi et al., (2008) has conducted HAZOP studies on water treatment plant in one of the power station. Water treatment plant is
compiled with Dual media Filter, RO, Storage tank, transfer pump, Deionizer, DE gasifier, Deionizer (Anion) and mixed bed of the
design intent, More than Quantitative increase, Less than Quantitative decrease, As Well As Qualitative increase, Part of Qualitative
decrease, Reverse Logical opposite of the intent, Other than Complete substitution or the operational procedures occur abnormally.
From authors result, there were 14 nodes, 126 deviations, 293 causes of deviations. The categories of risk 10.4% - Not Acceptable,
35.7% - Undesirable, 24.6% - Acceptable with reconsideration, 29.3% - Acceptable. Suggestions were mainly related to the
modification and improvement of equipment’s or processes (42%), regular maintenance of the equipment (35%), and the use of
correct operational methods (23%). 175 Suggestions were given by the author. Large No. of risks/hazards – Entry of raw water to
sand filter (Node) and the Highest level of Risk: - deviations from acid and alkali. In this way, many authors have studied using
different risk assessment techniques with some improvements for the conventional approach. In this study, an attempt has been
made to analyse the hazards of a glass manufacturing industries through three different techniques.
III. MATERIALS AND METHODOLOGY
An industry which was selected for Qualitative Risk Assessment is a Glass manufacturing Industry located in North India. The main
function of this industry is to manufacture the glass, where the raw materials of a glass are melted in the hot end with a temperature
ranging from 10000C to 3000C. The fuel which is used for furnace operation is natural gas. They also use a chemical like Silane and
Ethylene gas for coating on the glass which would act as a reflector for the UV sunlight. In this study, there are three different risk
assessment techniques used to assess the safety at the industry. The critical area identified for three different risk assessment
technique is Furnace area – Hazard Identification and Risk Assessment, Ethylene and Silane Gas station – HAZOP study and Impact
from potential leakage of natural gas from the distribution pipeline is also simulated with models using ALOHA software. The steps
involved in each risk assessment technique is as follows,
A. Hazard Identification and Risk Assessment
This is a simple method with 6 major steps in the process which starts with the identification of hazard and associated risks for both
routine and non-Routine activities, Identification of conditions and direct or indirect (Normal, Abnormal and Emergency),
Evaluation of Hazard/Risk using the guidelines, Estimation of residual risk, Identification of significant and non-significant and
hierarchy of risk control which includes elimination, substitution/modification, engineering barrier, Administrative Control and PPE.
Documentation of process, monitoring, and review of the process.
Evaluation is performed using the guidelines with pre-defined risk scale rating from one to five for severity and probability of
different levels. The table 2 and 6 reveals the risk scale rating for different levels of severity and probability in this study. Risks are
also classified into High risk, Medium, and Low Risk. The criteria for identifying significant hazard\risk in this study are Severity >
J B Yadhushree, P B Shiva Kumar, D’ Souza Keerthi, International Journal of Advance Research, Ideas and Innovations in
Technology.
© 2017, www.IJARIIT.com All Rights Reserved Page | 778
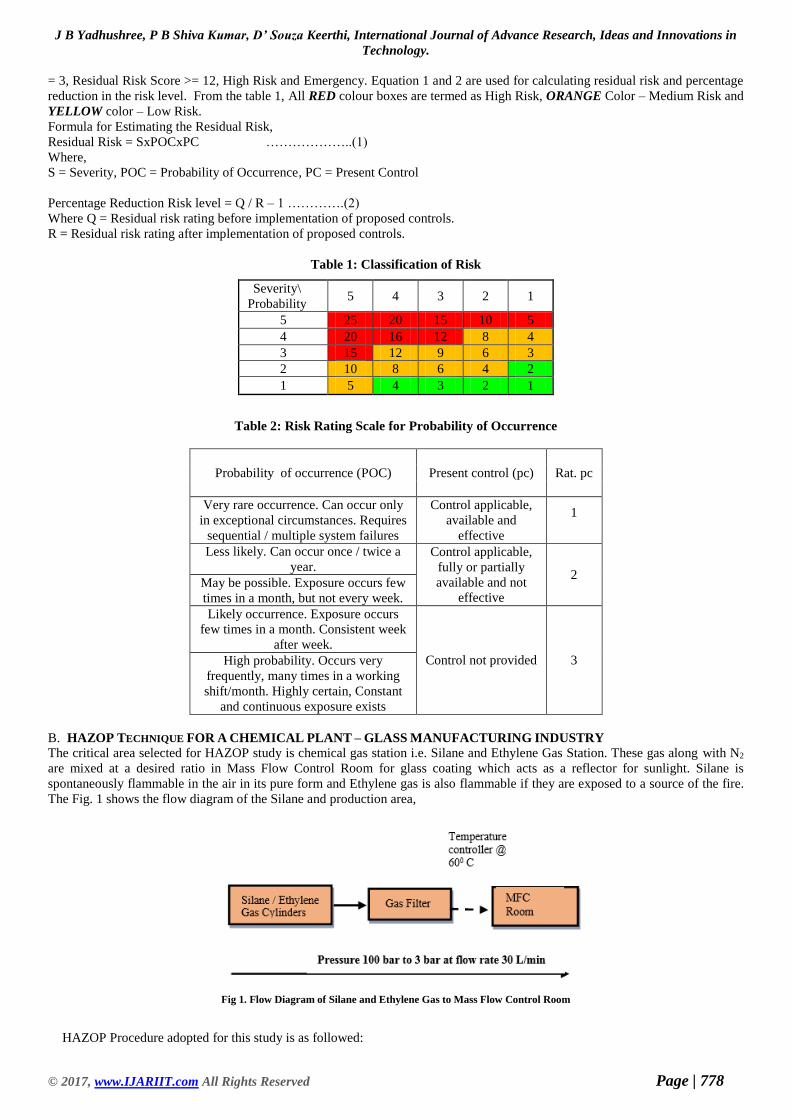
= 3, Residual Risk Score >= 12, High Risk and Emergency. Equation 1 and 2 are used for calculating residual risk and percentage
reduction in the risk level. From the table 1, All RED colour boxes are termed as High Risk, ORANGE Color – Medium Risk and
YELLOW color – Low Risk.
Formula for Estimating the Residual Risk,
Residual Risk = SxPOCxPC ………………..(1)
Where,
S = Severity, POC = Probability of Occurrence, PC = Present Control
Percentage Reduction Risk level = Q / R – 1 ………….(2)
Where Q = Residual risk rating before implementation of proposed controls.
R = Residual risk rating after implementation of proposed controls.
Table 1: Classification of Risk
Severity\
Probability 5 4 3 2 1
5 25 20 15 10 5
4 20 16 12 8 4
3 15 12 9 6 3
2 10 8 6 4 2
1 5 4 3 2 1
Table 2: Risk Rating Scale for Probability of Occurrence
Probability of occurrence (POC) Present control (pc) Rat. pc
Very rare occurrence. Can occur only
in exceptional circumstances. Requires
sequential / multiple system failures
Control applicable,
available and
effective
1
Less likely. Can occur once / twice a
year. Control applicable,
fully or partially
available and not
effective
2 May be possible. Exposure occurs few
times in a month, but not every week.
Likely occurrence. Exposure occurs
few times in a month. Consistent week
after week.
Control not provided 3 High probability. Occurs very
frequently, many times in a working
shift/month. Highly certain, Constant
and continuous exposure exists
B. HAZOP TECHNIQUE FOR A CHEMICAL PLANT – GLASS MANUFACTURING INDUSTRY
The critical area selected for HAZOP study is chemical gas station i.e. Silane and Ethylene Gas Station. These gas along with N2
are mixed at a desired ratio in Mass Flow Control Room for glass coating which acts as a reflector for sunlight. Silane is
spontaneously flammable in the air in its pure form and Ethylene gas is also flammable if they are exposed to a source of the fire.
The Fig. 1 shows the flow diagram of the Silane and production area,
Fig 1. Flow Diagram of Silane and Ethylene Gas to Mass Flow Control Room
HAZOP Procedure adopted for this study is as followed:
J B Yadhushree, P B Shiva Kumar, D’ Souza Keerthi, International Journal of Advance Research, Ideas and Innovations in
Technology.
© 2017, www.IJARIIT.com All Rights Reserved Page | 779
1. Divide the system into sections
2. Choose a study node
3. Describe the design intent
4. Select a process parameter
5. Apply Guide-word
6. Determine the cause, consequences and safe guard
7. Evaluate the consequences/problem
8. Provide risk rating in terms of S & L and calculate S x L = RR
9. Recommend action and Record Information Including Action by
10. Repeat procedure (from step 2).
Guide words used for this study is shown in the table. 3. Deviations for the parameter identified are derived. Causes and
consequences are identified for respective deviations with safeguards.
Table 3: GUIDEWORDS USED FOR THIS STUDY
SI. No Guide Word Meaning
1. No or Not Complete negation of the design Intent
2. More/High Quantitative Increase
3. Less/More Quantitative decrease
4. Reverse Logical Opposite of the design Intent
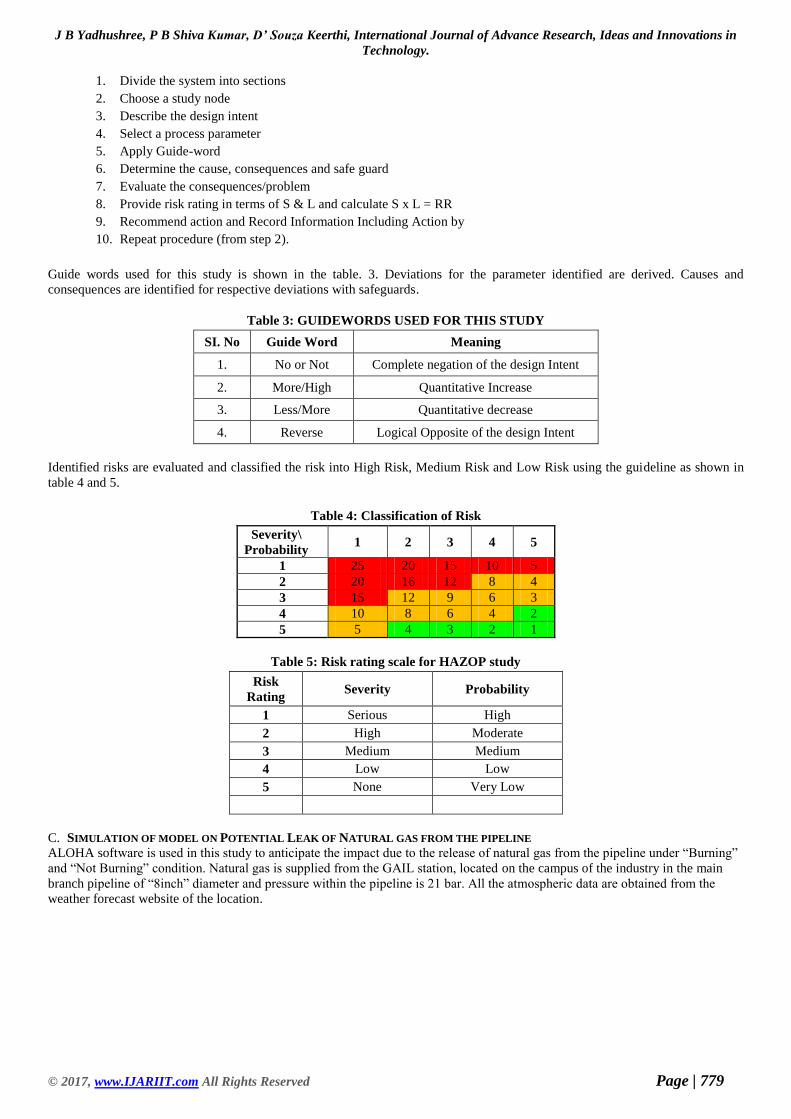
Identified risks are evaluated and classified the risk into High Risk, Medium Risk and Low Risk using the guideline as shown in
table 4 and 5.
Table 4: Classification of Risk
Severity\
Probability 1 2 3 4 5
1 25 20 15 10 5
2 20 16 12 8 4
3 15 12 9 6 3
4 10 8 6 4 2
5 5 4 3 2 1
Table 5: Risk rating scale for HAZOP study
Risk
Rating Severity Probability
1 Serious High
2 High Moderate
3 Medium Medium
4 Low Low
5 None Very Low
C. SIMULATION OF MODEL ON POTENTIAL LEAK OF NATURAL GAS FROM THE PIPELINE
ALOHA software is used in this study to anticipate the impact due to the release of natural gas from the pipeline under “Burning”
and “Not Burning” condition. Natural gas is supplied from the GAIL station, located on the campus of the industry in the main
branch pipeline of “8inch” diameter and pressure within the pipeline is 21 bar. All the atmospheric data are obtained from the
weather forecast website of the location.
J B Yadhushree, P B Shiva Kumar, D’ Souza Keerthi, International Journal of Advance Research, Ideas and Innovations in
Technology.
© 2017, www.IJARIIT.com All Rights Reserved Page | 780
RESULTS AND DISCUSSION
This results obtained from the study with respect to each risk assessment technique used for the selected critical areas are as follows,
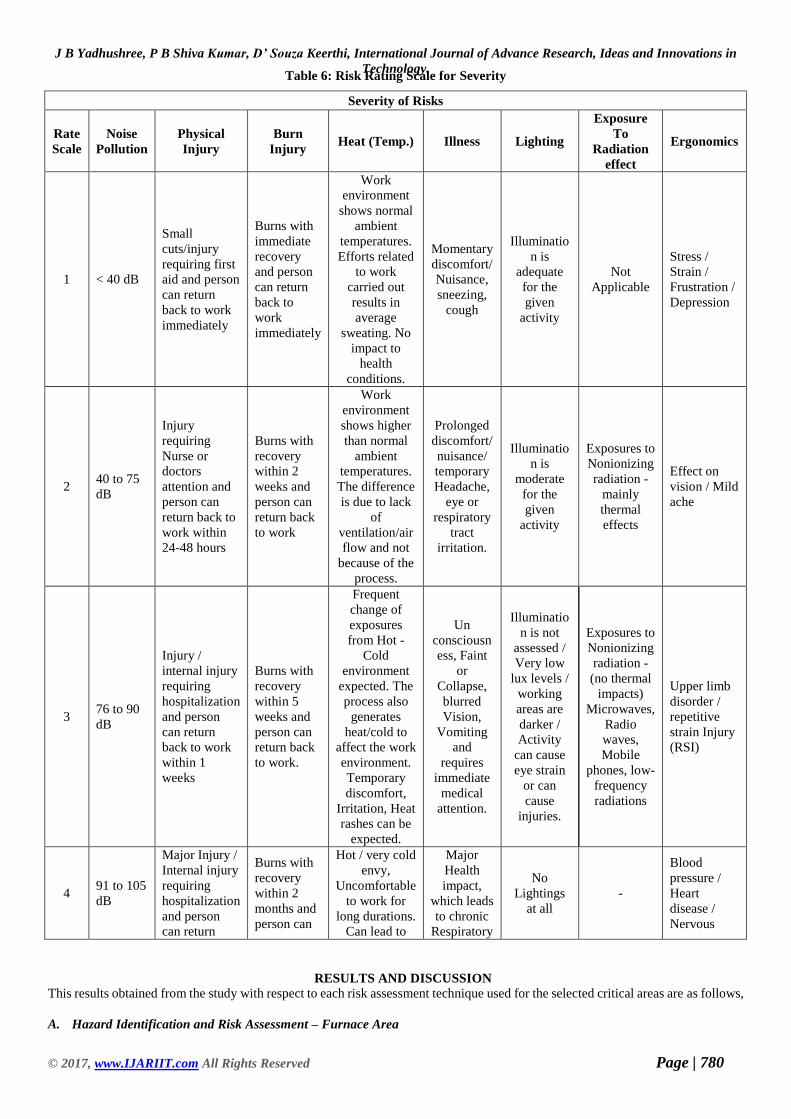
A. Hazard Identification and Risk Assessment – Furnace Area
Table 6: Risk Rating Scale for Severity
Severity of Risks
Rate
Scale
Noise
Pollution
Physical
Injury
Burn
Injury Heat (Temp.) Illness Lighting
Exposure
To
Radiation
effect
Ergonomics
1 < 40 dB
Small
cuts/injury
requiring first
aid and person
can return
back to work
immediately
Burns with
immediate
recovery
and person
can return
back to
work
immediately
Work
environment
shows normal
ambient
temperatures.
Efforts related
to work
carried out
results in
average
sweating. No
impact to
health
conditions.
Momentary
discomfort/
Nuisance,
sneezing,
cough
Illuminatio
n is
adequate
for the
given
activity
Not
Applicable
Stress /
Strain /
Frustration /
Depression
2 40 to 75
dB
Injury
requiring
Nurse or
doctors
attention and
person can
return back to
work within
24-48 hours
Burns with
recovery
within 2
weeks and
person can
return back
to work
Work
environment
shows higher
than normal
ambient
temperatures.
The difference
is due to lack
of
ventilation/air
flow and not
because of the
process.
Prolonged
discomfort/
nuisance/
temporary
Headache,
eye or
respiratory
tract
irritation.
Illuminatio
n is
moderate
for the
given
activity
Exposures to
Nonionizing
radiation -
mainly
thermal
effects
Effect on
vision / Mild
ache
3 76 to 90
dB
Injury /
internal injury
requiring
hospitalization
and person
can return
back to work
within 1
weeks
Burns with
recovery
within 5
weeks and
person can
return back
to work.
Frequent
change of
exposures
from Hot -
Cold
environment
expected. The
process also
generates
heat/cold to
affect the work
environment.
Temporary
discomfort,
Irritation, Heat
rashes can be
expected.
Un
consciousn
ess, Faint
or
Collapse,
blurred
Vision,
Vomiting
and
requires
immediate
medical
attention.
Illuminatio
n is not
assessed /
Very low
lux levels /
working
areas are
darker /
Activity
can cause
eye strain
or can
cause
injuries.
Exposures to
Nonionizing
radiation -
(no thermal
impacts)
Microwaves,
Radio
waves,
Mobile
phones, low-
frequency
radiations
Upper limb
disorder /
repetitive
strain Injury
(RSI)
4 91 to 105
dB
Major Injury /
Internal injury
requiring
hospitalization
and person
can return
Burns with
recovery
within 2
months and
person can
Hot / very cold
envy,
Uncomfortable
to work for
long durations.
Can lead to
Major
Health
impact,
which leads
to chronic
Respiratory
No
Lightings
at all
-
Blood
pressure /
Heart
disease /
Nervous
J B Yadhushree, P B Shiva Kumar, D’ Souza Keerthi, International Journal of Advance Research, Ideas and Innovations in
Technology.
© 2017, www.IJARIIT.com All Rights Reserved Page | 781
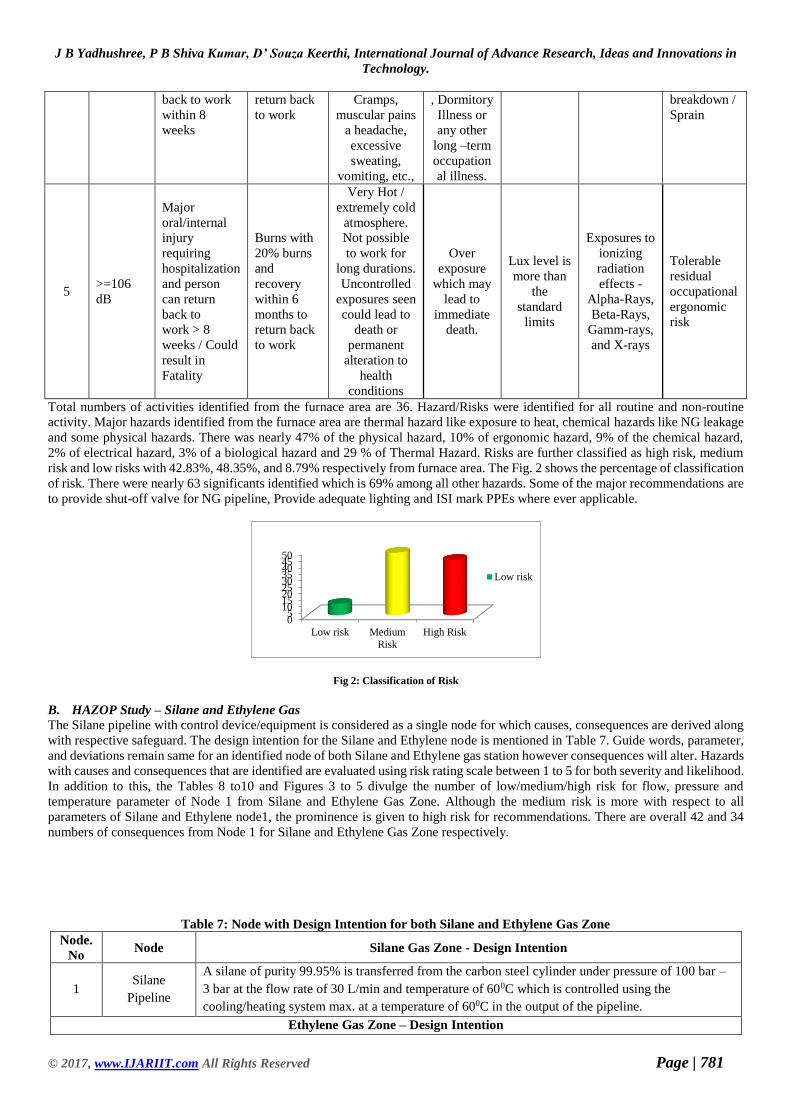
Total numbers of activities identified from the furnace area are 36. Hazard/Risks were identified for all routine and non-routine
activity. Major hazards identified from the furnace area are thermal hazard like exposure to heat, chemical hazards like NG leakage
and some physical hazards. There was nearly 47% of the physical hazard, 10% of ergonomic hazard, 9% of the chemical hazard,
2% of electrical hazard, 3% of a biological hazard and 29 % of Thermal Hazard. Risks are further classified as high risk, medium
risk and low risks with 42.83%, 48.35%, and 8.79% respectively from furnace area. The Fig. 2 shows the percentage of classification
of risk. There were nearly 63 significants identified which is 69% among all other hazards. Some of the major recommendations are
to provide shut-off valve for NG pipeline, Provide adequate lighting and ISI mark PPEs where ever applicable.
Fig 2: Classification of Risk
B. HAZOP Study – Silane and Ethylene Gas
The Silane pipeline with control device/equipment is considered as a single node for which causes, consequences are derived along
with respective safeguard. The design intention for the Silane and Ethylene node is mentioned in Table 7. Guide words, parameter,
and deviations remain same for an identified node of both Silane and Ethylene gas station however consequences will alter. Hazards
with causes and consequences that are identified are evaluated using risk rating scale between 1 to 5 for both severity and likelihood.
In addition to this, the Tables 8 to10 and Figures 3 to 5 divulge the number of low/medium/high risk for flow, pressure and
temperature parameter of Node 1 from Silane and Ethylene Gas Zone. Although the medium risk is more with respect to all
parameters of Silane and Ethylene node1, the prominence is given to high risk for recommendations. There are overall 42 and 34
numbers of consequences from Node 1 for Silane and Ethylene Gas Zone respectively.
Table 7: Node with Design Intention for both Silane and Ethylene Gas Zone
Node.
No Node Silane Gas Zone - Design Intention
1 Silane
Pipeline
A silane of purity 99.95% is transferred from the carbon steel cylinder under pressure of 100 bar –
3 bar at the flow rate of 30 L/min and temperature of 600C which is controlled using the
cooling/heating system max. at a temperature of 600C in the output of the pipeline.
Ethylene Gas Zone – Design Intention
05
101520253035404550
Low risk Medium
Risk
High Risk
Low risk
back to work
within 8
weeks
return back
to work
Cramps,
muscular pains
a headache,
excessive
sweating,
vomiting, etc.,
, Dormitory
Illness or
any other
long –term
occupation
al illness.
breakdown /
Sprain
5 >=106
dB
Major
oral/internal
injury
requiring
hospitalization
and person
can return
back to
work > 8
weeks / Could
result in
Fatality
Burns with
20% burns
and
recovery
within 6
months to
return back
to work
Very Hot /
extremely cold
atmosphere.
Not possible
to work for
long durations.
Uncontrolled
exposures seen
could lead to
death or
permanent
alteration to
health
conditions
Over
exposure
which may
lead to
immediate
death.
Lux level is
more than
the
standard
limits
Exposures to
ionizing
radiation
effects -
Alpha-Rays,
Beta-Rays,
Gamm-rays,
and X-rays
Tolerable
residual
occupational
ergonomic
risk

J B Yadhushree, P B Shiva Kumar, D’ Souza Keerthi, International Journal of Advance Research, Ideas and Innovations in
Technology.
© 2017, www.IJARIIT.com All Rights Reserved Page | 782
1 Ethylene
Pipeline
Ethylene gas of purity 99.95% is transferred from the carbon steel cylinder under pressure of starting
from 100 bar to 3 bar at the flow rate of 30 L/min which is controlled using the cooling/heating
system max. at a temperature of 600C in the output of the pipeline.
The Table 4.4 and Fig. 4.4 shows that there is more number of high and medium risk for Silane gas zone compared to Ethylene gas
zone because of its high hazardous nature than ethylene gas. Some of the recommendations are, Installation of pressure relieve valve
along with the air vent system before the Gas filter for both Ethylene and Silane Gas pipeline, Provide cooling system for filled
Silane and Ethylene cylinders under storage condition, Installation of ambient temperature measuring
Table 8:-Flow - Node 1 (Silane & Ethylene Gas Cylinders)
Gas Zone High Medium Low
Ethylene 4 11 2
Silane 6 13 2
Fig 3: Flow parameter of silane
Table 9: TEMPERATURE OF NODE 1 - SILANE & ETHYLENE GAS ZONE
Gas Zone High Medium Low
Ethylene 3 6 1
Silane 4 5 2
Fig 4: Temperature of Node 1 - Silane & Ethylene Gas Zone
Table 10: PRESSURE OF NODE 1 - SILANE & ETHYLENE GAS ZONE
0
2
4
6
8
10
12
14
High Medium Low
Ethylene Silane
0
1
2
3
4
5
6
7
High Medium Low
Ethylene Silane
J B Yadhushree, P B Shiva Kumar, D’ Souza Keerthi, International Journal of Advance Research, Ideas and Innovations in
Technology.
© 2017, www.IJARIIT.com All Rights Reserved Page | 783
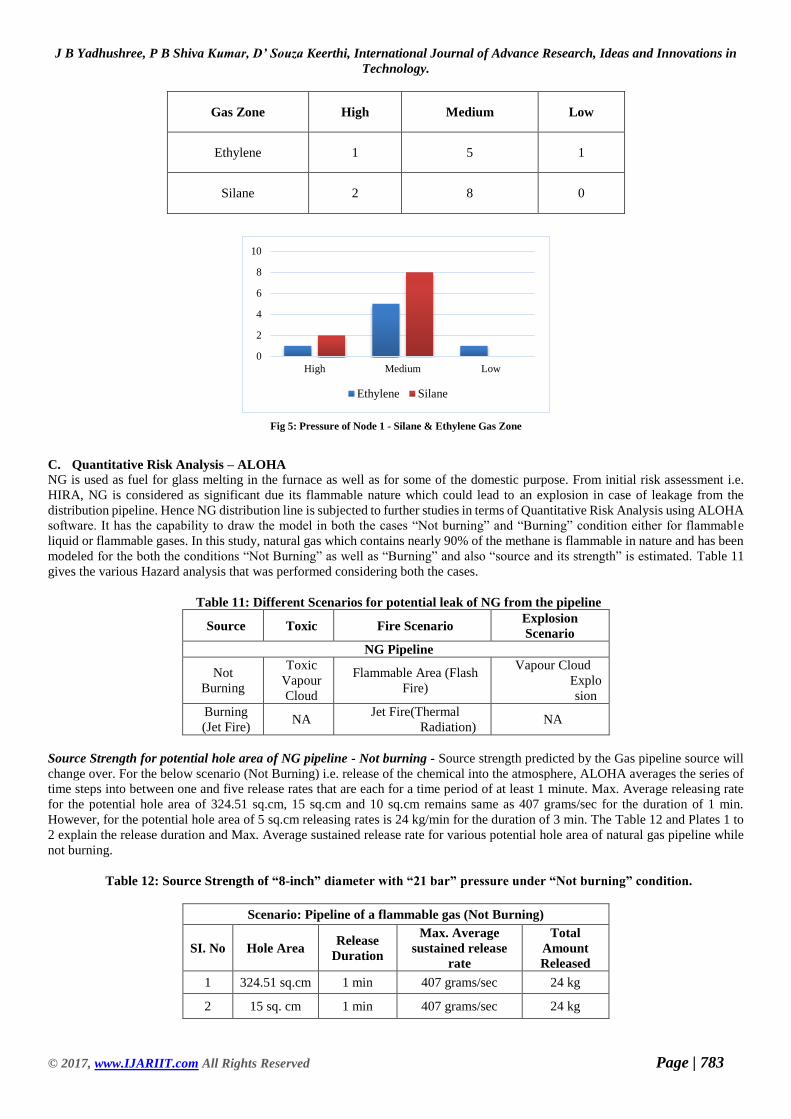
Gas Zone High Medium Low
Ethylene 1 5 1
Silane 2 8 0
Fig 5: Pressure of Node 1 - Silane & Ethylene Gas Zone
C. Quantitative Risk Analysis – ALOHA
NG is used as fuel for glass melting in the furnace as well as for some of the domestic purpose. From initial risk assessment i.e.
HIRA, NG is considered as significant due its flammable nature which could lead to an explosion in case of leakage from the
distribution pipeline. Hence NG distribution line is subjected to further studies in terms of Quantitative Risk Analysis using ALOHA
software. It has the capability to draw the model in both the cases “Not burning” and “Burning” condition either for flammable
liquid or flammable gases. In this study, natural gas which contains nearly 90% of the methane is flammable in nature and has been
modeled for the both the conditions “Not Burning” as well as “Burning” and also “source and its strength” is estimated. Table 11
gives the various Hazard analysis that was performed considering both the cases.
Table 11: Different Scenarios for potential leak of NG from the pipeline
Source Toxic Fire Scenario Explosion
Scenario
NG Pipeline
Not
Burning
Toxic
Vapour
Cloud
Flammable Area (Flash
Fire)
Vapour Cloud
Explo
sion
Burning
(Jet Fire) NA
Jet Fire(Thermal
Radiation) NA
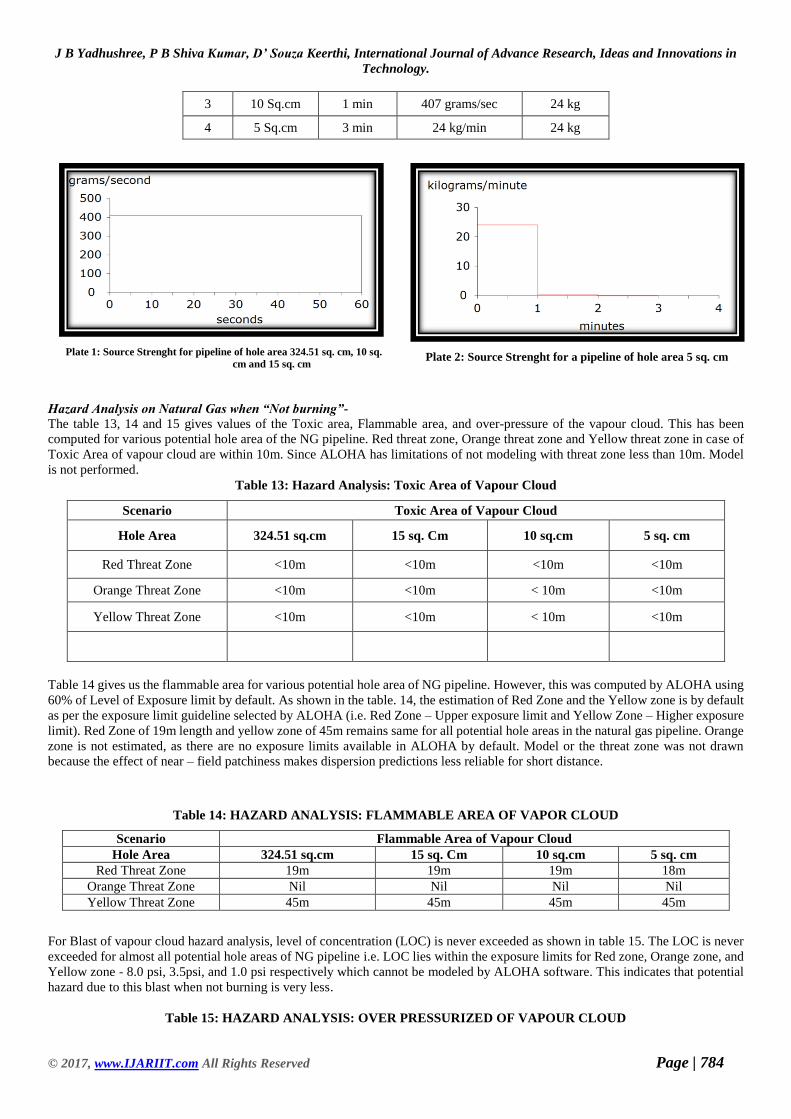
Source Strength for potential hole area of NG pipeline - Not burning - Source strength predicted by the Gas pipeline source will
change over. For the below scenario (Not Burning) i.e. release of the chemical into the atmosphere, ALOHA averages the series of
time steps into between one and five release rates that are each for a time period of at least 1 minute. Max. Average releasing rate
for the potential hole area of 324.51 sq.cm, 15 sq.cm and 10 sq.cm remains same as 407 grams/sec for the duration of 1 min.
However, for the potential hole area of 5 sq.cm releasing rates is 24 kg/min for the duration of 3 min. The Table 12 and Plates 1 to
2 explain the release duration and Max. Average sustained release rate for various potential hole area of natural gas pipeline while
not burning.
Table 12: Source Strength of “8-inch” diameter with “21 bar” pressure under “Not burning” condition.
Scenario: Pipeline of a flammable gas (Not Burning)
SI. No Hole Area Release
Duration
Max. Average
sustained release
rate
Total
Amount
Released
1 324.51 sq.cm 1 min 407 grams/sec 24 kg
2 15 sq. cm 1 min 407 grams/sec 24 kg
0
2
4
6
8
10
High Medium Low
Ethylene Silane
J B Yadhushree, P B Shiva Kumar, D’ Souza Keerthi, International Journal of Advance Research, Ideas and Innovations in
Technology.
© 2017, www.IJARIIT.com All Rights Reserved Page | 784
3 10 Sq.cm 1 min 407 grams/sec 24 kg
4 5 Sq.cm 3 min 24 kg/min 24 kg
Plate 1: Source Strenght for pipeline of hole area 324.51 sq. cm, 10 sq.
cm and 15 sq. cm
Plate 2: Source Strenght for a pipeline of hole area 5 sq. cm
Hazard Analysis on Natural Gas when “Not burning”-
The table 13, 14 and 15 gives values of the Toxic area, Flammable area, and over-pressure of the vapour cloud. This has been
computed for various potential hole area of the NG pipeline. Red threat zone, Orange threat zone and Yellow threat zone in case of
Toxic Area of vapour cloud are within 10m. Since ALOHA has limitations of not modeling with threat zone less than 10m. Model
is not performed.
Table 13: Hazard Analysis: Toxic Area of Vapour Cloud
Scenario Toxic Area of Vapour Cloud
Hole Area 324.51 sq.cm 15 sq. Cm 10 sq.cm 5 sq. cm
Red Threat Zone <10m <10m <10m <10m
Orange Threat Zone <10m <10m < 10m <10m
Yellow Threat Zone <10m <10m < 10m <10m
Table 14 gives us the flammable area for various potential hole area of NG pipeline. However, this was computed by ALOHA using
60% of Level of Exposure limit by default. As shown in the table. 14, the estimation of Red Zone and the Yellow zone is by default
as per the exposure limit guideline selected by ALOHA (i.e. Red Zone – Upper exposure limit and Yellow Zone – Higher exposure
limit). Red Zone of 19m length and yellow zone of 45m remains same for all potential hole areas in the natural gas pipeline. Orange
zone is not estimated, as there are no exposure limits available in ALOHA by default. Model or the threat zone was not drawn
because the effect of near – field patchiness makes dispersion predictions less reliable for short distance.
Table 14: HAZARD ANALYSIS: FLAMMABLE AREA OF VAPOR CLOUD
Scenario Flammable Area of Vapour Cloud
Hole Area 324.51 sq.cm 15 sq. Cm 10 sq.cm 5 sq. cm
Red Threat Zone 19m 19m 19m 18m
Orange Threat Zone Nil Nil Nil Nil
Yellow Threat Zone 45m 45m 45m 45m
For Blast of vapour cloud hazard analysis, level of concentration (LOC) is never exceeded as shown in table 15. The LOC is never
exceeded for almost all potential hole areas of NG pipeline i.e. LOC lies within the exposure limits for Red zone, Orange zone, and
Yellow zone - 8.0 psi, 3.5psi, and 1.0 psi respectively which cannot be modeled by ALOHA software. This indicates that potential
hazard due to this blast when not burning is very less.
Table 15: HAZARD ANALYSIS: OVER PRESSURIZED OF VAPOUR CLOUD
J B Yadhushree, P B Shiva Kumar, D’ Souza Keerthi, International Journal of Advance Research, Ideas and Innovations in
Technology.
© 2017, www.IJARIIT.com All Rights Reserved Page | 785
Scenario Over pressurized of Vapour Cloud
Hole Area 324.51 sq.cm 15 sq. Cm 10 sq.cm 5 sq. cm
Red Threat
Zone
LOC Never
Exceeded
LOC Never
Exceeded
LOC Never
Exceeded
LOC Never
Exceeded
Orange
Threat Zone
LOC Never
Exceeded
LOC Never
Exceeded
LOC Never
Exceeded
LOC Never
Exceeded
Yellow
Threat Zone
LOC Never
Exceeded
LOC Never
Exceeded
LOC Never
Exceeded
LOC Never
Exceeded
Further to this, ALOHA has been considered for modeling thermal radiation due to the burning of Natural Gas (Jet Fire).
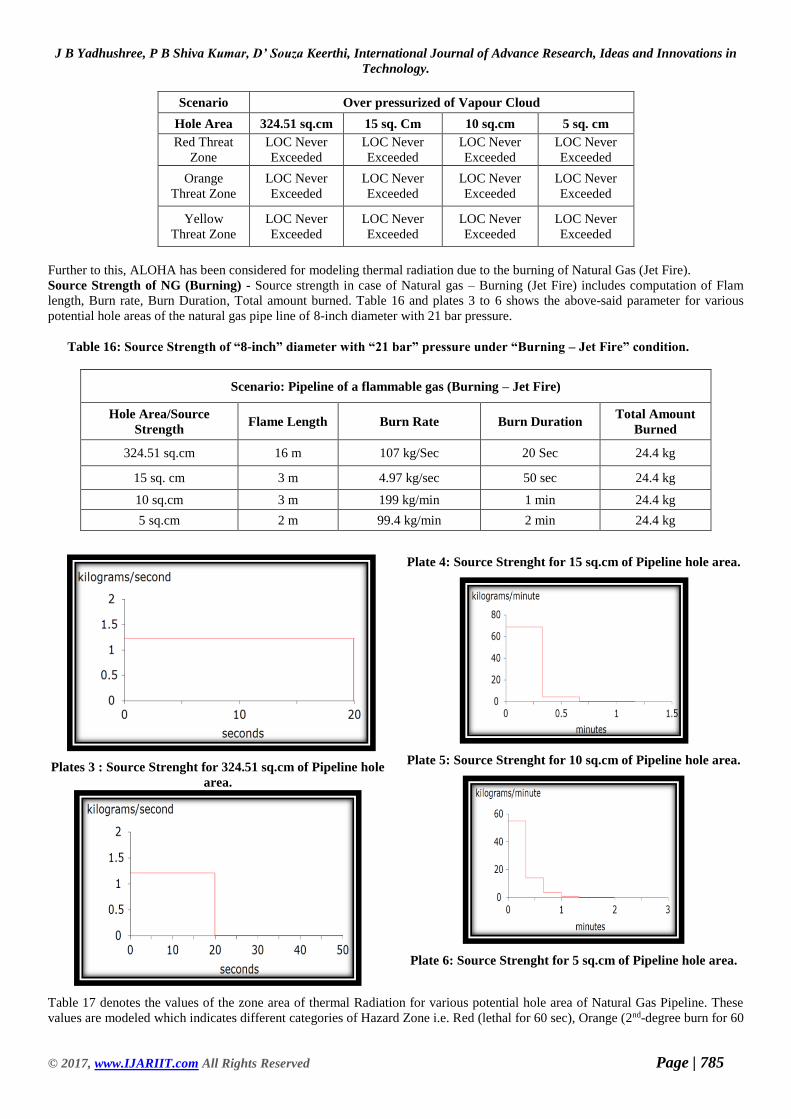
Source Strength of NG (Burning) - Source strength in case of Natural gas – Burning (Jet Fire) includes computation of Flam
length, Burn rate, Burn Duration, Total amount burned. Table 16 and plates 3 to 6 shows the above-said parameter for various
potential hole areas of the natural gas pipe line of 8-inch diameter with 21 bar pressure.
Table 16: Source Strength of “8-inch” diameter with “21 bar” pressure under “Burning – Jet Fire” condition.
Scenario: Pipeline of a flammable gas (Burning – Jet Fire)
Hole Area/Source
Strength Flame Length Burn Rate Burn Duration
Total Amount
Burned
324.51 sq.cm 16 m 107 kg/Sec 20 Sec 24.4 kg
15 sq. cm 3 m 4.97 kg/sec 50 sec 24.4 kg
10 sq.cm 3 m 199 kg/min 1 min 24.4 kg
5 sq.cm 2 m 99.4 kg/min 2 min 24.4 kg
Plates 3 : Source Strenght for 324.51 sq.cm of Pipeline hole
area.
Plate 4: Source Strenght for 15 sq.cm of Pipeline hole area.
Plate 5: Source Strenght for 10 sq.cm of Pipeline hole area.
Plate 6: Source Strenght for 5 sq.cm of Pipeline hole area.
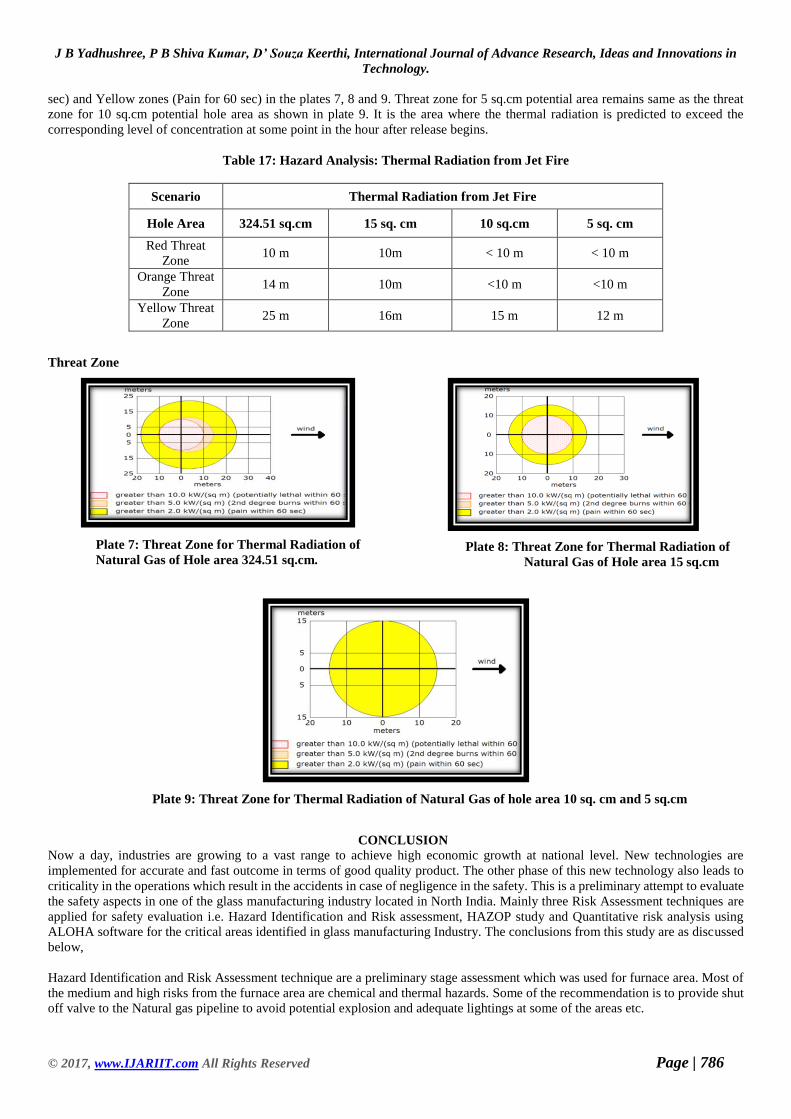
Table 17 denotes the values of the zone area of thermal Radiation for various potential hole area of Natural Gas Pipeline. These
values are modeled which indicates different categories of Hazard Zone i.e. Red (lethal for 60 sec), Orange (2nd-degree burn for 60
J B Yadhushree, P B Shiva Kumar, D’ Souza Keerthi, International Journal of Advance Research, Ideas and Innovations in
Technology.
© 2017, www.IJARIIT.com All Rights Reserved Page | 786
sec) and Yellow zones (Pain for 60 sec) in the plates 7, 8 and 9. Threat zone for 5 sq.cm potential area remains same as the threat
zone for 10 sq.cm potential hole area as shown in plate 9. It is the area where the thermal radiation is predicted to exceed the
corresponding level of concentration at some point in the hour after release begins.
Table 17: Hazard Analysis: Thermal Radiation from Jet Fire
Scenario Thermal Radiation from Jet Fire
Hole Area 324.51 sq.cm 15 sq. cm 10 sq.cm 5 sq. cm
Red Threat
Zone 10 m 10m < 10 m < 10 m
Orange Threat
Zone 14 m 10m <10 m <10 m
Yellow Threat
Zone 25 m 16m 15 m 12 m
Threat Zone
Plate 7: Threat Zone for Thermal Radiation of
Natural Gas of Hole area 324.51 sq.cm.
Plate 8: Threat Zone for Thermal Radiation of
Natural Gas of Hole area 15 sq.cm
Plate 9: Threat Zone for Thermal Radiation of Natural Gas of hole area 10 sq. cm and 5 sq.cm
CONCLUSION
Now a day, industries are growing to a vast range to achieve high economic growth at national level. New technologies are
implemented for accurate and fast outcome in terms of good quality product. The other phase of this new technology also leads to
criticality in the operations which result in the accidents in case of negligence in the safety. This is a preliminary attempt to evaluate
the safety aspects in one of the glass manufacturing industry located in North India. Mainly three Risk Assessment techniques are
applied for safety evaluation i.e. Hazard Identification and Risk assessment, HAZOP study and Quantitative risk analysis using
ALOHA software for the critical areas identified in glass manufacturing Industry. The conclusions from this study are as discussed
below,
Hazard Identification and Risk Assessment technique are a preliminary stage assessment which was used for furnace area. Most of
the medium and high risks from the furnace area are chemical and thermal hazards. Some of the recommendation is to provide shut
off valve to the Natural gas pipeline to avoid potential explosion and adequate lightings at some of the areas etc.
J B Yadhushree, P B Shiva Kumar, D’ Souza Keerthi, International Journal of Advance Research, Ideas and Innovations in
Technology.
© 2017, www.IJARIIT.com All Rights Reserved Page | 787
Hazard and Operability Study is a specialized technique which highlights the causes and consequences for the deviations from
process perspective i.e. deviation from the standard operating procedure. This technique is usually applied for highly hazardous
operations. In this study, this technique was applied for a chemical plant i.e. Silane and Ethylene gas plant where most of the risk
are medium risk, however, prominence is given to high risk with recommendations as suggested to install pressure relieve valve
before the filter and cooling system for the cylinders on storage condition etc. Maximum numbers of high risks are found from
Silane gas zone compared to Ethylene gas zone because of high reactive nature of the Silane with air under high pressure.
Although the studied techniques are qualitative which is only subjective, this study was further extended to quantitative risk analysis
(QRA) using ALOHA software which helps us to analyse the catastrophic event from Natural gas leakage and its impact on the
human being and environment. This software was applied for various potential hole area in the distribution pipeline of Natural gas
as shown and concluded as comparing the various models of potential hole areas in the natural gas pipeline (Refer Plates 7 to 10),
324.51 sq.cm which is the rupture of whole diameter of the pipeline exhibits high hazardous zone which can also lead to death of
human beings i.e. more than 12m from the point source down the line in the wind direction. The Hence larger diameter of rupture
in the pipeline, more severe will be a loss in terms of the environment, society, workers, residents etc. depending on nature and
operating conditions of the chemicals. However, frequent maintenance and monitoring of the Natural gas distribution pipelines
along with Gas detection System and Fire Hydrant System can prevent the disaster.
REFERENCES
[1] OHSAS 18001:2007
[2] R.P. Choudhary (2015), “Risk Assessment and its Management in Mining Industry”, International Journal of Geology, Earth,
and Environmental Science, Vol. 5 (5), pp. 112-118.
[3] M. Saravana Kumar and Dr. P. Senthil Kumar, (2015), “Hazard Identification and Risk Control in Foundry”, IOSR Journal of
Mechanical and Civil Engineering (SSRG-IJIE), pp. 33-37.
[4] S. Vivek, Karthikeyan, N and Balan, A.V. (2015), “Risk Assessment and Control Measures for Cold Rolling Mill in Steel
Industry”, International Journal of Mechanical Engineering and Research, Vol.5 No. 1, pp. 63 -71.
[5] Khairul Akmal Shamsuddin and Cheani Mohd Norzaimi (2015), “ Investigation the effective of the Hazard Identification, Risk
Assessment and Determining Control” International Journal of Innovative Research in Advanced Engineering (IJIRAE), Vol.
2, Issue 8 . pp 80-84.
[6] L. Koteka and M. Tabas (2012), “HAZOP study with qualitative risk analysis for prioritization of corrective and preventive
actions”, International Congress of Chemical and Process Engineering, pp. 808-815.
[7] Habibi .E, Zare M , Barkhordari A, Mirmohammadi S. J and HalvaniGhH (2008), “Application of a Hazard and Operability
Study Method to Hazard Evaluation of a Chemical Unit of the Power Station”, Journal of Research Health and Science, Vol.
8, No. 2, pp. 13-20.
[8] Reetamalviya and Prof. Praveen Patel, (2014), “Hazard Identification and Quantitative Risk Assessment in Propane Tank”,
International Journal of Computer Architecture and Mobility, Volume 2, Issue 6.
[9] Habibi .E, Zare M, Barkhordari A, Mirmohammadi SJ and HalvaniGhH (2008), “Application of a Hazard and Operability
Study Method to Hazard Evaluation of a Chemical Unit of the Power Station”, Journal of Research Health and Science, Vol. 8,
No. 2, pp. 13-20.