Embed Size (px)
Citation preview
Final Draft Report
Qualitative Framework
and Assessment of Fixed
and Variable Cost Drivers
Prepared for:
Queensland Competition Authority
V1122
October 2011
Queensland Competition Authority DOCUMENT CONTROL SHEET Indec Consulting
416370_2.DOCX October 2011
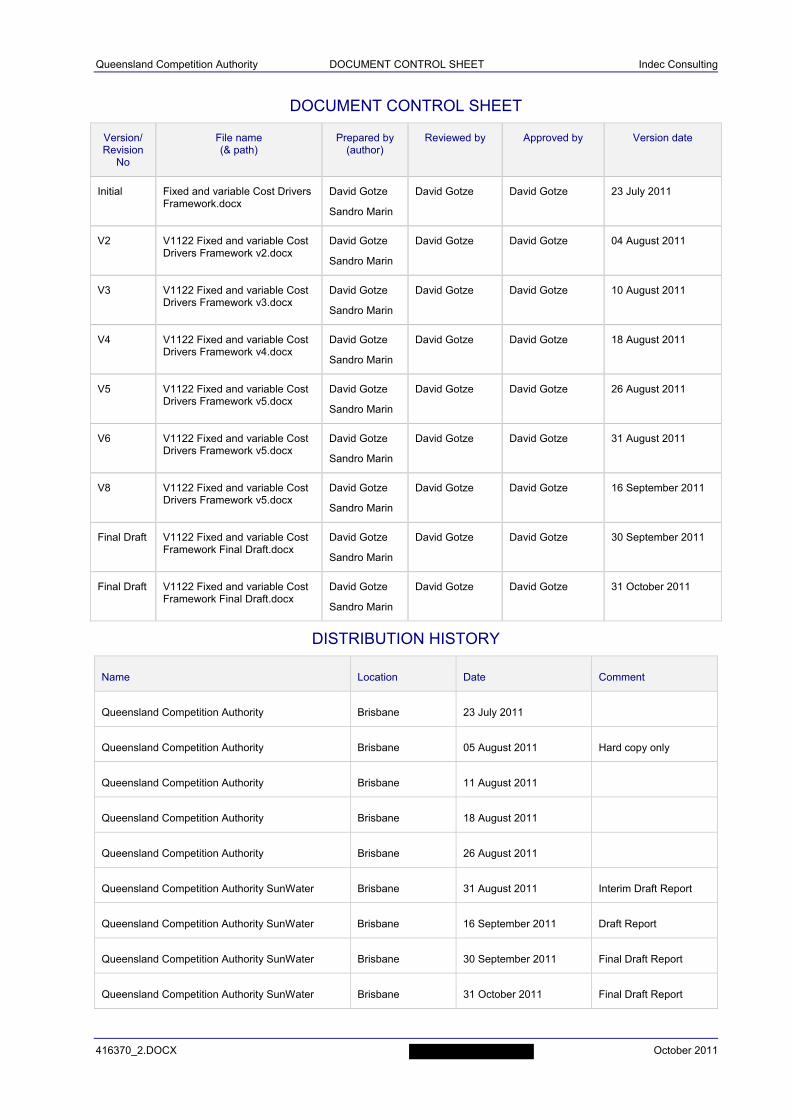
DOCUMENT CONTROL SHEET
Version/ Revision
No
File name (& path)
Prepared by (author)
Reviewed by Approved by Version date
Initial Fixed and variable Cost Drivers Framework.docx
David Gotze
Sandro Marin
David Gotze
David Gotze
23 July 2011
V2 V1122 Fixed and variable Cost Drivers Framework v2.docx
David Gotze
Sandro Marin
David Gotze
David Gotze
04 August 2011
V3 V1122 Fixed and variable Cost Drivers Framework v3.docx
David Gotze
Sandro Marin
David Gotze
David Gotze
10 August 2011
V4 V1122 Fixed and variable Cost Drivers Framework v4.docx
David Gotze
Sandro Marin
David Gotze
David Gotze
18 August 2011
V5 V1122 Fixed and variable Cost Drivers Framework v5.docx
David Gotze
Sandro Marin
David Gotze
David Gotze
26 August 2011
V6 V1122 Fixed and variable Cost Drivers Framework v5.docx
David Gotze
Sandro Marin
David Gotze
David Gotze
31 August 2011
V8 V1122 Fixed and variable Cost Drivers Framework v5.docx
David Gotze
Sandro Marin
David Gotze
David Gotze
16 September 2011
Final Draft V1122 Fixed and variable Cost Framework Final Draft.docx
David Gotze
Sandro Marin
David Gotze
David Gotze
30 September 2011
Final Draft V1122 Fixed and variable Cost Framework Final Draft.docx
David Gotze
Sandro Marin
David Gotze
David Gotze
31 October 2011
DISTRIBUTION HISTORY
Name Location Date Comment
Queensland Competition Authority Brisbane 23 July 2011
Queensland Competition Authority Brisbane 05 August 2011 Hard copy only
Queensland Competition Authority Brisbane 11 August 2011
Queensland Competition Authority Brisbane 18 August 2011
Queensland Competition Authority Brisbane 26 August 2011
Queensland Competition Authority SunWater Brisbane 31 August 2011 Interim Draft Report
Queensland Competition Authority SunWater Brisbane 16 September 2011 Draft Report
Queensland Competition Authority SunWater Brisbane 30 September 2011 Final Draft Report
Queensland Competition Authority SunWater Brisbane 31 October 2011 Final Draft Report
Queensland Competition Authority i Indec Consulting
416370_2.DOCX October 2011
CONTENTS
1. INTRODUCTION ........................................................................................................................... 1
2. METHODOLOGY .......................................................................................................................... 2
3. STAGE ONE - QUALITATIVE ASSESSMENT ............................................................................. 4
3.1. Bulk Water Harvesting and Storage ................................................................................. 6
3.1.1. Large Dams ...................................................................................................................... 7
3.1.2. Weirs and other Storage Facilities .................................................................................... 9
3.2. Water Distribution ........................................................................................................... 11
3.2.1. Channels ........................................................................................................................ 13
3.2.2. Pump Stations and Pipelines.......................................................................................... 14
3.3. Water Accounting ........................................................................................................... 16
3.4. Administration ................................................................................................................ 18
4. STAGE TWO - ANALYSIS OF HISTORICAL COSTS ................................................................ 20
4.1. Regression Analysis of Historical Costs and Water Use ................................................. 20
4.1.1. Outputs .......................................................................................................................... 20
4.1.2. Decision Rule ................................................................................................................. 22
4.1.3. Regression Analysis Results .......................................................................................... 23
4.1.4. Conclusion ..................................................................................................................... 24
4.2. Analysis of Historical costs by Activities ......................................................................... 24
4.2.1. Operations...................................................................................................................... 27
4.2.2. Maintenance ................................................................................................................... 28
4.2.3. Renewals and Enhancements ........................................................................................ 31
4.3. Analysis of Historical costs by Expenditure Type ........................................................... 33
4.3.1. Electricity ........................................................................................................................ 34
4.3.2. Labour ............................................................................................................................ 35
4.3.3. Materials ........................................................................................................................ 44
4.3.4. Contractors ..................................................................................................................... 45
4.3.5. Other .............................................................................................................................. 46
4.3.6. Overheads and Indirects ................................................................................................ 47
4.4. Summary ........................................................................................................................ 48
5. STAGE THREE – ASSESSMENT OF OPTIMAL APPROACH .................................................. 50
5.1. Methodology ................................................................................................................... 50
5.2. Operations...................................................................................................................... 51
5.3. Maintenance ................................................................................................................... 52
5.4. Renewals and Enhancements ........................................................................................ 52
5.5. Distribution ..................................................................................................................... 52
5.6. Bulk Water...................................................................................................................... 54
Queensland Competition Authority ii Indec Consulting
416370_2.DOCX October 2011
APPENDICES
A Terms of Reference
B Fixed and Variable Cost Frameworks
C Regression Analysis Results
D Qualitative Analysis SunWater's Cost Structures (forecast data only)
E Qualitative Analysis SunWater's Cost Structures (historical actual data only)
F Historical Analysis – Regions and Depots
G Historical Analysis – Water Distribution Systems
H Historical Analysis – Bulk Water Supply Systems
I Fixed/Variable Assessment – Water Distribution Systems
J Fixed/Variable Assessment – Bulk Water Supply Systems
Queensland Competition Authority i Indec Consulting
416370_2.DOCX October 2011
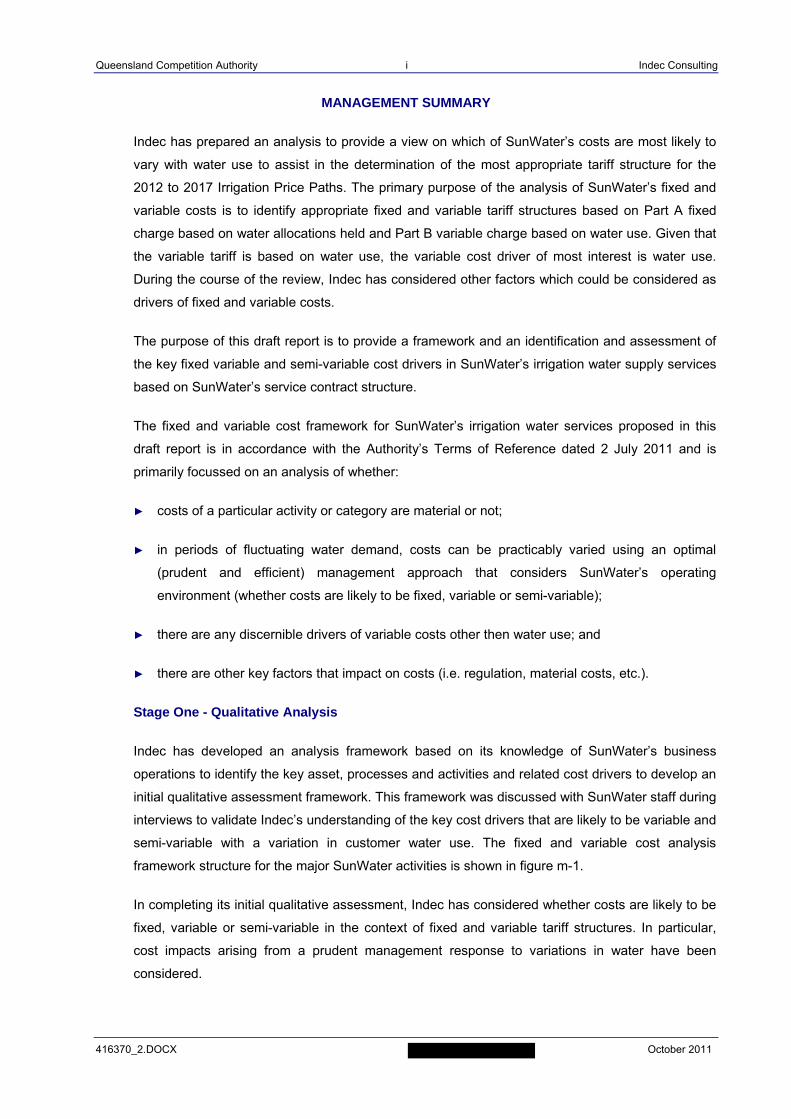
MANAGEMENT SUMMARY
Indec has prepared an analysis to provide a view on which of SunWater’s costs are most likely to
vary with water use to assist in the determination of the most appropriate tariff structure for the
2012 to 2017 Irrigation Price Paths. The primary purpose of the analysis of SunWater’s fixed and
variable costs is to identify appropriate fixed and variable tariff structures based on Part A fixed
charge based on water allocations held and Part B variable charge based on water use. Given that
the variable tariff is based on water use, the variable cost driver of most interest is water use.
During the course of the review, Indec has considered other factors which could be considered as
drivers of fixed and variable costs.
The purpose of this draft report is to provide a framework and an identification and assessment of
the key fixed variable and semi-variable cost drivers in SunWater’s irrigation water supply services
based on SunWater’s service contract structure.
The fixed and variable cost framework for SunWater’s irrigation water services proposed in this
draft report is in accordance with the Authority’s Terms of Reference dated 2 July 2011 and is
primarily focussed on an analysis of whether:
► costs of a particular activity or category are material or not;
► in periods of fluctuating water demand, costs can be practicably varied using an optimal
(prudent and efficient) management approach that considers SunWater’s operating
environment (whether costs are likely to be fixed, variable or semi-variable);
► there are any discernible drivers of variable costs other then water use; and
► there are other key factors that impact on costs (i.e. regulation, material costs, etc.).
Stage One - Qualitative Analysis
Indec has developed an analysis framework based on its knowledge of SunWater’s business
operations to identify the key asset, processes and activities and related cost drivers to develop an
initial qualitative assessment framework. This framework was discussed with SunWater staff during
interviews to validate Indec’s understanding of the key cost drivers that are likely to be variable and
semi-variable with a variation in customer water use. The fixed and variable cost analysis
framework structure for the major SunWater activities is shown in figure m-1.
In completing its initial qualitative assessment, Indec has considered whether costs are likely to be
fixed, variable or semi-variable in the context of fixed and variable tariff structures. In particular,
cost impacts arising from a prudent management response to variations in water have been
considered.
Queensland Competition Authority ii Indec Consulting
416370_2.DOCX October 2011
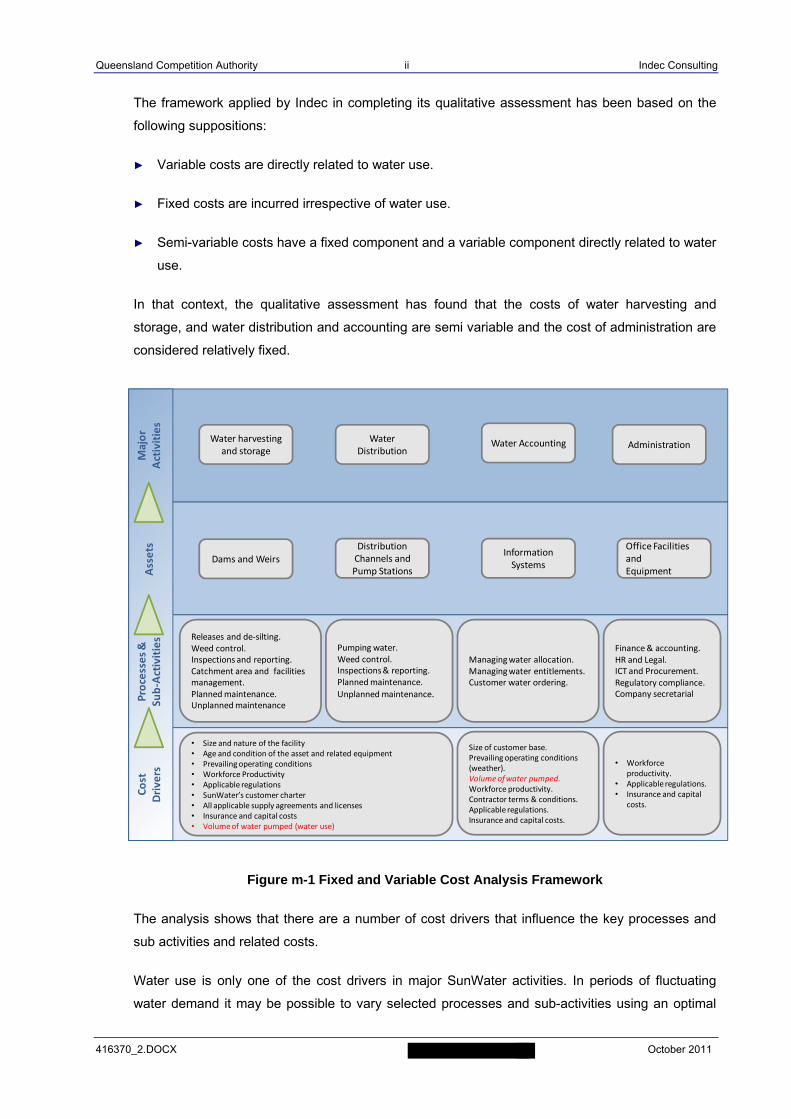
The framework applied by Indec in completing its qualitative assessment has been based on the
following suppositions:
► Variable costs are directly related to water use.
► Fixed costs are incurred irrespective of water use.
► Semi-variable costs have a fixed component and a variable component directly related to water
use.
In that context, the qualitative assessment has found that the costs of water harvesting and
storage, and water distribution and accounting are semi variable and the cost of administration are
considered relatively fixed.
Figure m-1 Fixed and Variable Cost Analysis Framework
The analysis shows that there are a number of cost drivers that influence the key processes and
sub activities and related costs.
Water use is only one of the cost drivers in major SunWater activities. In periods of fluctuating
water demand it may be possible to vary selected processes and sub-activities using an optimal
Major
Activities
Assets
Processes &
Sub‐Activities
Cost
Drivers
Water Accounting
• Size and nature of the facility• Age and condition of the asset and related equipment• Prevailing operating conditions• Workforce Productivity• Applicable regulations• SunWater’s customer charter• All applicable supply agreements and licenses• Insurance and capital costs• Volume of water pumped (water use)
Dams and Weirs
Distribution Channels and Pump Stations
Information Systems
Office Facilities andEquipment
AdministrationWater
DistributionWater harvesting
and storage
Releases and de‐silting.Weed control.Inspections and reporting.Catchment area and facilities management.Planned maintenance.Unplanned maintenance.
Pumping water.Weed control.Inspections & reporting.Planned maintenance.
Unplanned maintenance.
Managing water allocation.Managing water entitlements.Customer water ordering.
Finance & accounting.HR and Legal.ICT and Procurement.Regulatory compliance.Company secretarial
• Workforce productivity.
• Applicable regulations.• Insurance and capital
costs.
Size of customer base.Prevailing operating conditions (weather).Volume of water pumped.Workforce productivity.Contractor terms & conditions.Applicable regulations.Insurance and capital costs.
Queensland Competition Authority iii Indec Consulting
416370_2.DOCX October 2011
(prudent and efficient) management approach that considers SunWater’s operating environment.
The impact of varying processes and sub-activities is likely to be more material in water distribution
than in other major SunWater activities.
Examples of water distribution processes and sub-activities and related costs that could be varied
with water use include scheduling and delivering water (semi variable), electricity costs (variable),
corrective maintenance (semi variable) and weed control management (semi variable).
Stage Two – Analysis of Historical Costs
Indec performed an extensive econometric analysis on SunWater’s (available) quarterly historical
cost data for 2007-11 to establish whether historical costs were fixed, variable or semi-variable with
a variation in customer water use.
Indec carried out regression analysis of historical costs for the period July 2007 to June 2011
against water usage. The agreed scope specified that regression analysis be conducted on
regression analysis of annual historical costs for the period 2002/2003 to 2004/05 and forecast
costs 2005/06 to 2010/11 (8 observations) against water usage. However, data limitations and
inconclusive results led to the need to progressively expand the scope during the course of the
analysis. Specifically, additional analysis scope included a regression analysis of quarterly
historical costs for the period 2006/07 to 2010/11 versus water usage (20 observations) and
regression analysis of historical expense versus a number of other potential variable cost drivers.
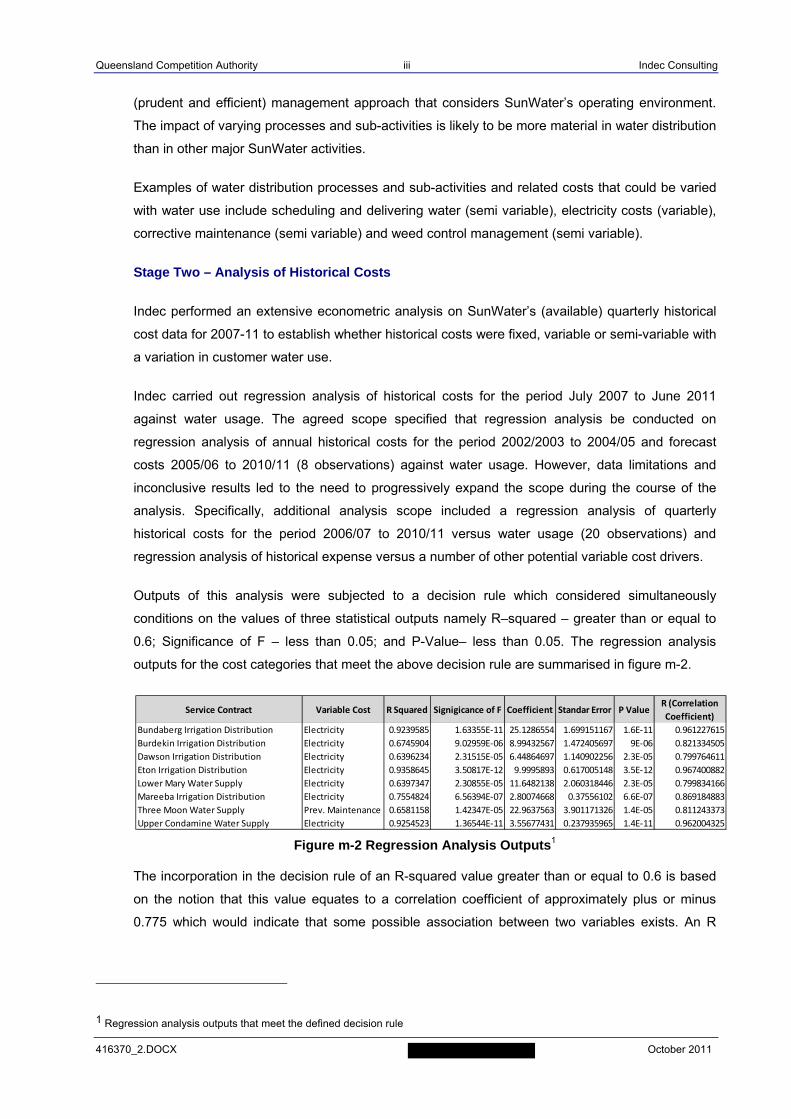
Outputs of this analysis were subjected to a decision rule which considered simultaneously
conditions on the values of three statistical outputs namely R–squared – greater than or equal to
0.6; Significance of F – less than 0.05; and P-Value– less than 0.05. The regression analysis
outputs for the cost categories that meet the above decision rule are summarised in figure m-2.
Figure m-2 Regression Analysis Outputs1
The incorporation in the decision rule of an R-squared value greater than or equal to 0.6 is based
on the notion that this value equates to a correlation coefficient of approximately plus or minus
0.775 which would indicate that some possible association between two variables exists. An R
1 Regression analysis outputs that meet the defined decision rule
Service Contract Variable Cost R Squared Signigicance of F Coefficient Standar Error P ValueR (Correlation
Coefficient)
Bundaberg Irrigation Distribution Electricity 0.9239585 1.63355E‐11 25.1286554 1.699151167 1.6E‐11 0.961227615
Burdekin Irrigation Distribution Electricity 0.6745904 9.02959E‐06 8.99432567 1.472405697 9E‐06 0.821334505
Dawson Irrigation Distribution Electricity 0.6396234 2.31515E‐05 6.44864697 1.140902256 2.3E‐05 0.799764611
Eton Irrigation Distribution Electricity 0.9358645 3.50817E‐12 9.9995893 0.617005148 3.5E‐12 0.967400882
Lower Mary Water Supply Electricity 0.6397347 2.30855E‐05 11.6482138 2.060318446 2.3E‐05 0.799834166
Mareeba Irrigation Distribution Electricity 0.7554824 6.56394E‐07 2.80074668 0.37556102 6.6E‐07 0.869184883
Three Moon Water Supply Prev. Maintenance 0.6581158 1.42347E‐05 22.9637563 3.901171326 1.4E‐05 0.811243373
Upper Condamine Water Supply Electricity 0.9254523 1.36544E‐11 3.55677431 0.237935965 1.4E‐11 0.962004325
Queensland Competition Authority iv Indec Consulting
416370_2.DOCX October 2011
squared of 0.6 indicates that 60% of the change in one variable (i.e. water use) is explained by a
change in the related variable (i.e. labour hours)
It should be noted that in the context of pure applied statistics, a caution applies to R-squared
statistical measures. Correlation does not necessarily imply causation. While correlations may
provide valuable clues regarding causal relationships among variables, a high correlation between
two variables does not necessarily represent adequate evidence that changing one variable has
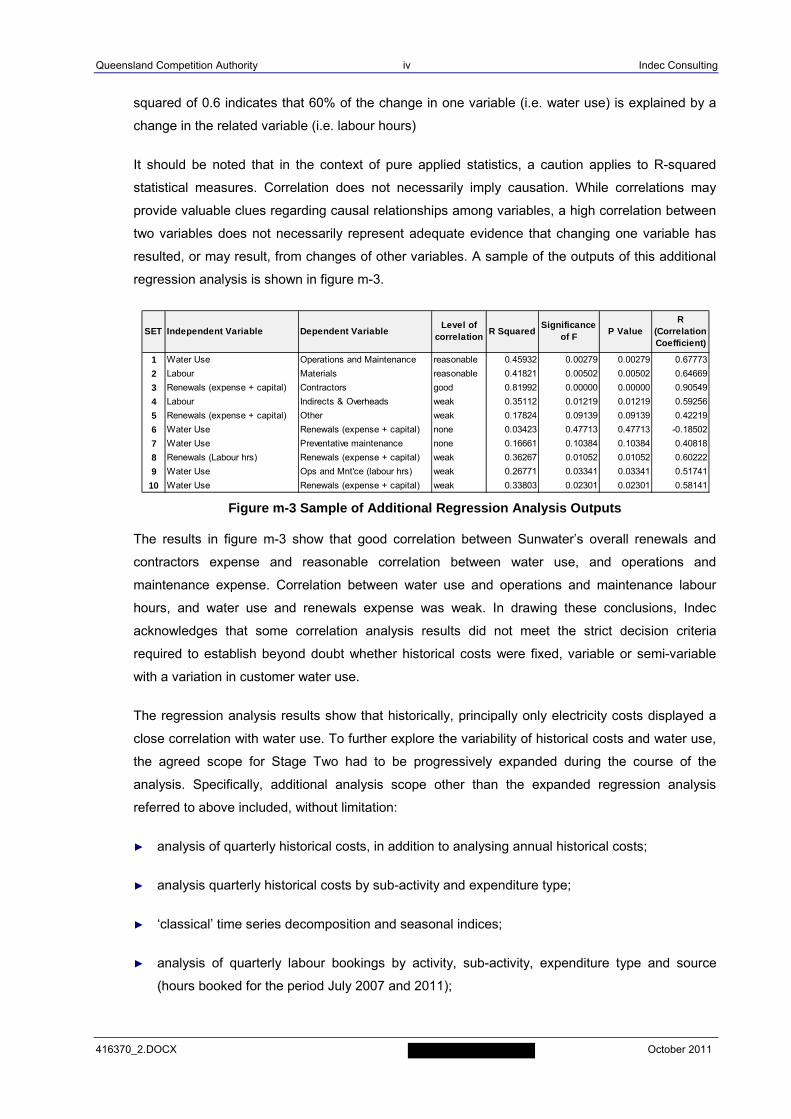
resulted, or may result, from changes of other variables. A sample of the outputs of this additional
regression analysis is shown in figure m-3.
Figure m-3 Sample of Additional Regression Analysis Outputs
The results in figure m-3 show that good correlation between Sunwater’s overall renewals and
contractors expense and reasonable correlation between water use, and operations and
maintenance expense. Correlation between water use and operations and maintenance labour
hours, and water use and renewals expense was weak. In drawing these conclusions, Indec
acknowledges that some correlation analysis results did not meet the strict decision criteria
required to establish beyond doubt whether historical costs were fixed, variable or semi-variable
with a variation in customer water use.
The regression analysis results show that historically, principally only electricity costs displayed a
close correlation with water use. To further explore the variability of historical costs and water use,
the agreed scope for Stage Two had to be progressively expanded during the course of the
analysis. Specifically, additional analysis scope other than the expanded regression analysis
referred to above included, without limitation:
► analysis of quarterly historical costs, in addition to analysing annual historical costs;
► analysis quarterly historical costs by sub-activity and expenditure type;
► ‘classical’ time series decomposition and seasonal indices;
► analysis of quarterly labour bookings by activity, sub-activity, expenditure type and source
(hours booked for the period July 2007 and 2011);
1 Water Use Operations and Maintenance reasonable 0.45932 0.00279 0.00279 0.67773
2 Labour Materials reasonable 0.41821 0.00502 0.00502 0.64669
3 Renewals (expense + capital) Contractors good 0.81992 0.00000 0.00000 0.90549
4 Labour Indirects & Overheads weak 0.35112 0.01219 0.01219 0.59256
5 Renewals (expense + capital) Other weak 0.17824 0.09139 0.09139 0.42219
6 Water Use Renewals (expense + capital) none 0.03423 0.47713 0.47713 -0.18502
7 Water Use Preventative maintenance none 0.16661 0.10384 0.10384 0.40818
8 Renewals (Labour hrs) Renewals (expense + capital) weak 0.36267 0.01052 0.01052 0.60222
9 Water Use Ops and Mnt'ce (labour hrs) weak 0.26771 0.03341 0.03341 0.51741
10 Water Use Renewals (expense + capital) weak 0.33803 0.02301 0.02301 0.58141
R (Correlation Coefficient)
Significance of F
P ValueSET Independent Variable Dependent VariableLevel of
correlationR Squared
Queensland Competition Authority v Indec Consulting
416370_2.DOCX October 2011
► analysis of historical costs and labour hours by region and depot;
► moving averages and other smoothing techniques; and
► construction of two models, to enable the extended historical analysis of expense and labour
hours to the level of detail outlined above. The models incorporate approximately one hundred
graphs to assist in the visual interpretation of SunWater’s historical data. The models also
incorporate some high level correlation analysis of historical base data. At the request of the
Queensland Competition Authority, the models have been extended to also incorporate high
level correlation analysis of four period moving averages for selected expense and labour
hours data (smoothed historical data).
Indec considered that historical expense by activity including operations, preventative and
corrective maintenance expense varied with water use, albeit weakly. Indec’s conclusion is based
on the assumption that operations expense is managed within the overall operations and
maintenance expense which varies moderately with water use over the period June 2007 to
September 2010. Indec also concluded that historical renewals and enhancements expense varied
with water use, albeit weakly.
Electricity is a cost by expense type. Indec considered electricity expense a fully variable costs in
contract areas where a significant proportion of water supply is pumped (refer figure m-2).
Indec concluded that other historical costs by expense type including labour, materials, contractors
and ‘other’ did vary with water use to varying degrees. In drawing this conclusion, Indec
acknowledges that some correlation analysis results did not meet the strict decision criteria
required to establish beyond doubt whether historical costs were fixed, variable or semi-variable
with a variation in customer water use.
Indec has used an indirect inference on the variability of some expenses by type to that of water
use, through the variability of other expense types in regards to that of water use. It should be
noted that correlation does not necessarily imply causation.
In summary, the stage 2 analysis of historical costs does demonstrate that SunWater has to some
extent varied costs other than electricity expense with water use. However, the results of the
historical cost analysis are somewhat inconsistent and tenuous and are based on past cost
behaviour which Indec does not consider to have been the optimum approach to variations in
water use. The results of the historical cost analysis have therefore only been indirectly applied to
the Stage Three assessment of an optimum approach to varying costs with variations in water use.
However, the fact that SunWater already varies certain activities and expenses with varying water
use in a number of depots and service contracts has been considered in assessing appropriate
fixed/variable expense ratios.
Queensland Competition Authority vi Indec Consulting
416370_2.DOCX October 2011
Stage Three - Assessment of Optimal Approach
As part of the terms of reference, Indec was required to take into account an optimal management
approach to varying water use which considers SunWater’s operating environment.
The framework applied by Indec in determining an optimal management approach involved the
objective of delivering services in a prudent and efficient manner whilst at the same time
acknowledging some of the operating and other restraints which SunWater may face.
SunWater must manage its operations taking into account all relevant risks and opportunities whilst
not compromising on the delivery of services to customers as outlined in SunWater’s Standard of
Service.
Certain operating and regulatory constraints were identified which restrict SunWater’s ability to
reduce workload during periods of low water demand, as staffing levels are largely driven by:
► the need to maintain a minimum critical mass on site to respond to operational events to meet
customer service standards;
► occupational health and safety requirements which preclude staff working by themselves in
prescribed circumstances;
► distances between depots which range from 125 to 520 kilometres. One way travel times
range from 2-5 hours and 5 - 7 hours. Travel times in conjunction with the need to provide
overnight accommodation limits cost efficient resource sharing between some depots; and
► the need to have available personnel with the right skills and safety certificates for work in
certain environments (confined spaces, low voltage, etc).
Indec has applied its judgement to determine what it considers an optimal management approach
based on its experience of reviewing and benchmarking utility industries and its knowledge of the
SunWater business operations gained during the previous irrigation price path review in 2005/06
and more recently from reviewing actual and forecast cost and labour data, documents outlining
operating and asset management practices and interviews with senior SunWater staff.
Indec’s view is that in times of low water demand, operations and maintenance activities can be
reduced. The reduction may be the result of:
► deferment of non-essential planned and unplanned maintenance activities;
► selective delegation of certain operational activities to water users (subject to further
investigation);
► re-allocation of operations and maintenance personnel to other service contracts; and
Queensland Competition Authority vii Indec Consulting
416370_2.DOCX October 2011
► re-allocation of operations and maintenance personnel to O&M or R&E activities that would
otherwise carried out by contractors (temporarily reduce the use of contractors and casual
labour);
The extent to which the above measures are practicable is likely to vary for each area and service
contract. Indec acknowledges that such a measure may lead to a reduced ‘core’ establishment of
operations and maintenance staff.
Indec’s view is that in times of low water demand, renewals and enhancements expense can be
reduced. The reduction may be the result of:
► deferment of some priority 2 refurbishment and enhancements activities;
► re-allocation of operations and maintenance personnel to O&M or R&E activities that would
otherwise carried out by contractors (temporarily reduce the use of contractors and casual
labour);
► review of planned scope of refurbishments and enhancements in that budget year; and
► phasing of renewals and enhancements works over a longer period.
Other strategies have been considered in order to reduce staffing levels below the minimum critical
mass otherwise required. For example, the use of ‘flying’ gangs, ‘mothballing’ of schemes or
restricting maintenance activity to ‘stand-by’ maintenance on equipment and assets. All of these
measures, however, would require customers to agree to a reduction in customer service levels to
provide for example, a start-up period before water can be delivered after water becomes
available.
Indec has identified for each category of expenditure, as outlined in SunWater’s NSPs, the low and
high range of fixed costs based on water volumes delivered to customers. The difference between
the high and low ranges is deemed to be a variable cost based on water volumes. The range
provides for some discretion with respect to tolerances typically applicable to these type of
assessments and any transition period which may be required to achieve the optimal approach to
varying water use.
Indec has completed this analysis for each of the thirty service contracts relevant for the setting of
the irrigation price paths. By way of example, the extent of automation and labour required to
operate each service contract was one consideration in assessing the mix of fixed and variable
operating costs. This consideration assumes that a higher degree of automation generally results
in a higher proportion of fixed operating costs. Conversely, it has been assumed that a more
manual or labour intensive system results in a relatively lower proportion of fixed costs.
A summary of the quantitative assessment of fixed versus variable costs for water distribution
systems is summarised in figure m-3 and for bulk water supply systems in figure m-3. Indec
Queensland Competition Authority viii Indec Consulting
416370_2.DOCX October 2011
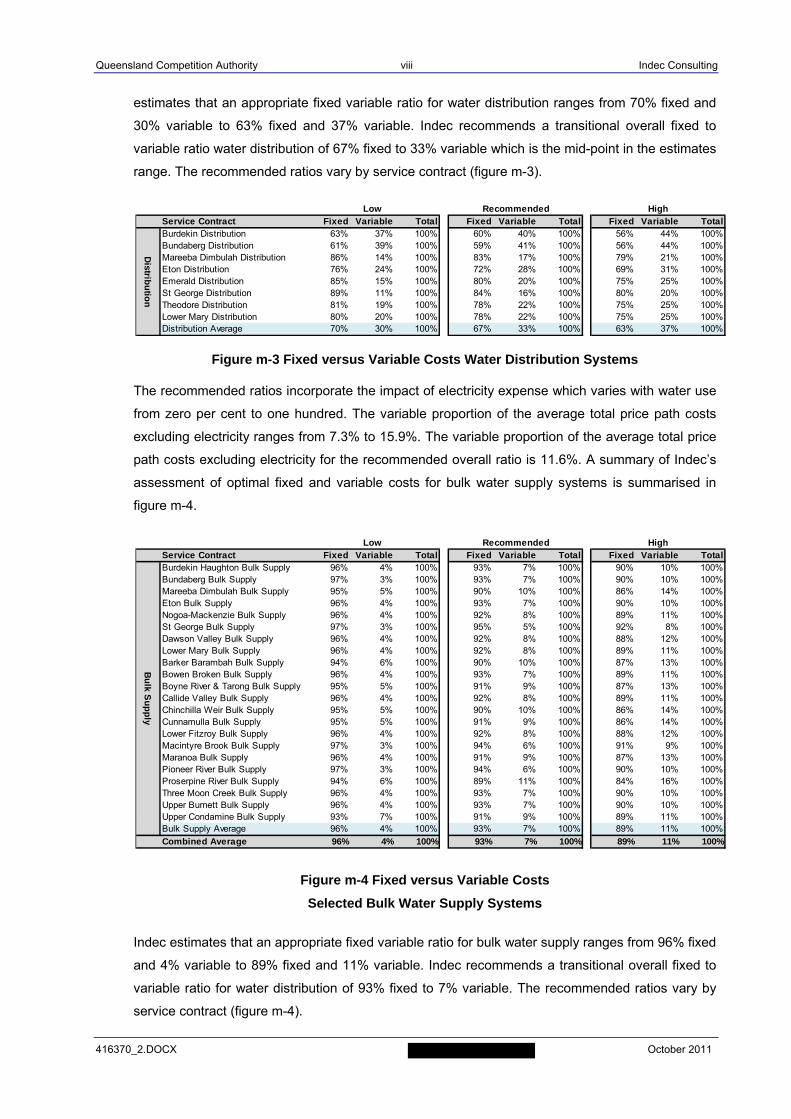
estimates that an appropriate fixed variable ratio for water distribution ranges from 70% fixed and
30% variable to 63% fixed and 37% variable. Indec recommends a transitional overall fixed to
variable ratio water distribution of 67% fixed to 33% variable which is the mid-point in the estimates
range. The recommended ratios vary by service contract (figure m-3).
Figure m-3 Fixed versus Variable Costs Water Distribution Systems
The recommended ratios incorporate the impact of electricity expense which varies with water use
from zero per cent to one hundred. The variable proportion of the average total price path costs
excluding electricity ranges from 7.3% to 15.9%. The variable proportion of the average total price
path costs excluding electricity for the recommended overall ratio is 11.6%. A summary of Indec’s
assessment of optimal fixed and variable costs for bulk water supply systems is summarised in
figure m-4.
Figure m-4 Fixed versus Variable Costs
Selected Bulk Water Supply Systems
Indec estimates that an appropriate fixed variable ratio for bulk water supply ranges from 96% fixed
and 4% variable to 89% fixed and 11% variable. Indec recommends a transitional overall fixed to
variable ratio for water distribution of 93% fixed to 7% variable. The recommended ratios vary by
service contract (figure m-4).
Service Contract Fixed Variable Total Fixed Variable Total Fixed Variable TotalBurdekin Distribution 63% 37% 100% 60% 40% 100% 56% 44% 100%Bundaberg Distribution 61% 39% 100% 59% 41% 100% 56% 44% 100%Mareeba Dimbulah Distribution 86% 14% 100% 83% 17% 100% 79% 21% 100%Eton Distribution 76% 24% 100% 72% 28% 100% 69% 31% 100%Emerald Distribution 85% 15% 100% 80% 20% 100% 75% 25% 100%St George Distribution 89% 11% 100% 84% 16% 100% 80% 20% 100%Theodore Distribution 81% 19% 100% 78% 22% 100% 75% 25% 100%Lower Mary Distribution 80% 20% 100% 78% 22% 100% 75% 25% 100%Distribution Average 70% 30% 100% 67% 33% 100% 63% 37% 100%
Distrib
utio
n
Low Recommended High
Service Contract Fixed Variable Total Fixed Variable Total Fixed Variable TotalBurdekin Haughton Bulk Supply 96% 4% 100% 93% 7% 100% 90% 10% 100%Bundaberg Bulk Supply 97% 3% 100% 93% 7% 100% 90% 10% 100%Mareeba Dimbulah Bulk Supply 95% 5% 100% 90% 10% 100% 86% 14% 100%Eton Bulk Supply 96% 4% 100% 93% 7% 100% 90% 10% 100%Nogoa-Mackenzie Bulk Supply 96% 4% 100% 92% 8% 100% 89% 11% 100%St George Bulk Supply 97% 3% 100% 95% 5% 100% 92% 8% 100%Dawson Valley Bulk Supply 96% 4% 100% 92% 8% 100% 88% 12% 100%Lower Mary Bulk Supply 96% 4% 100% 92% 8% 100% 89% 11% 100%Barker Barambah Bulk Supply 94% 6% 100% 90% 10% 100% 87% 13% 100%Bowen Broken Bulk Supply 96% 4% 100% 93% 7% 100% 89% 11% 100%Boyne River & Tarong Bulk Supply 95% 5% 100% 91% 9% 100% 87% 13% 100%Callide Valley Bulk Supply 96% 4% 100% 92% 8% 100% 89% 11% 100%Chinchilla Weir Bulk Supply 95% 5% 100% 90% 10% 100% 86% 14% 100%Cunnamulla Bulk Supply 95% 5% 100% 91% 9% 100% 86% 14% 100%Lower Fitzroy Bulk Supply 96% 4% 100% 92% 8% 100% 88% 12% 100%Macintyre Brook Bulk Supply 97% 3% 100% 94% 6% 100% 91% 9% 100%Maranoa Bulk Supply 96% 4% 100% 91% 9% 100% 87% 13% 100%Pioneer River Bulk Supply 97% 3% 100% 94% 6% 100% 90% 10% 100%Proserpine River Bulk Supply 94% 6% 100% 89% 11% 100% 84% 16% 100%Three Moon Creek Bulk Supply 96% 4% 100% 93% 7% 100% 90% 10% 100%Upper Burnett Bulk Supply 96% 4% 100% 93% 7% 100% 90% 10% 100%Upper Condamine Bulk Supply 93% 7% 100% 91% 9% 100% 89% 11% 100%Bulk Supply Average 96% 4% 100% 93% 7% 100% 89% 11% 100%
Combined Average 96% 4% 100% 93% 7% 100% 89% 11% 100%
Bu
lk Su
pp
ly
Low Recommended High
Queensland Competition Authority Page 1 Indec Consulting
416370_2.DOCX October 2011
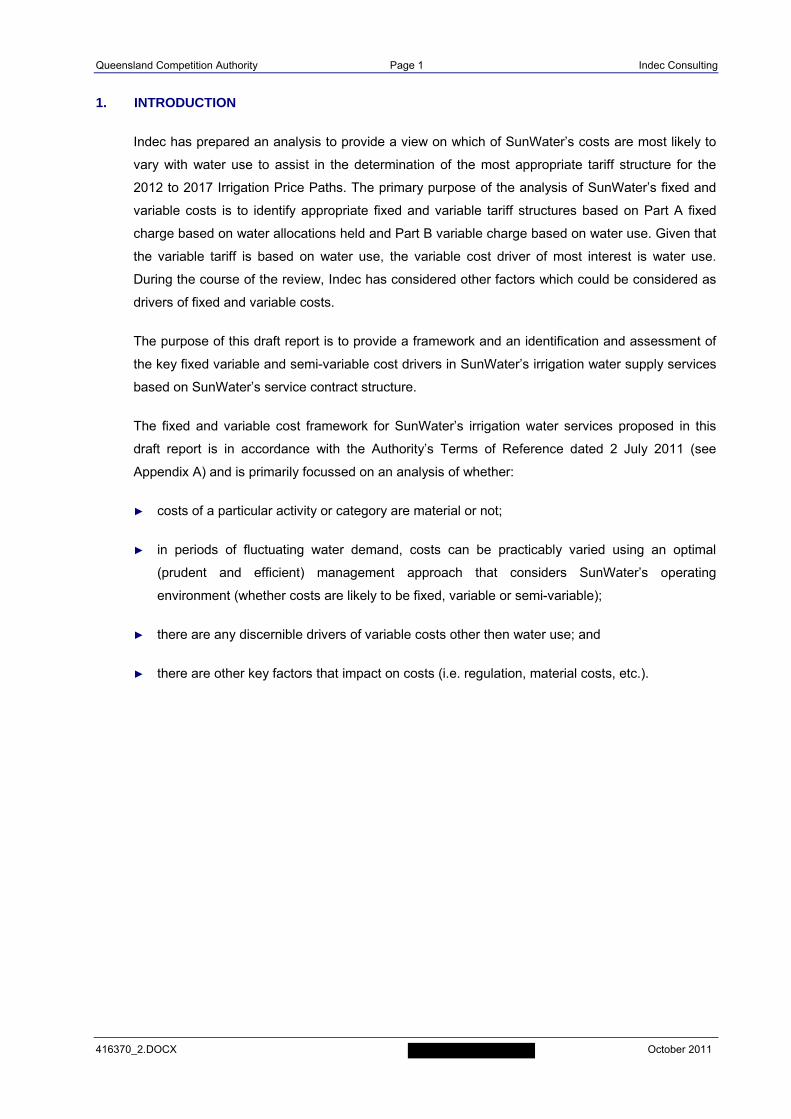
1. INTRODUCTION
Indec has prepared an analysis to provide a view on which of SunWater’s costs are most likely to
vary with water use to assist in the determination of the most appropriate tariff structure for the
2012 to 2017 Irrigation Price Paths. The primary purpose of the analysis of SunWater’s fixed and
variable costs is to identify appropriate fixed and variable tariff structures based on Part A fixed
charge based on water allocations held and Part B variable charge based on water use. Given that
the variable tariff is based on water use, the variable cost driver of most interest is water use.
During the course of the review, Indec has considered other factors which could be considered as
drivers of fixed and variable costs.
The purpose of this draft report is to provide a framework and an identification and assessment of
the key fixed variable and semi-variable cost drivers in SunWater’s irrigation water supply services
based on SunWater’s service contract structure.
The fixed and variable cost framework for SunWater’s irrigation water services proposed in this
draft report is in accordance with the Authority’s Terms of Reference dated 2 July 2011 (see
Appendix A) and is primarily focussed on an analysis of whether:
► costs of a particular activity or category are material or not;
► in periods of fluctuating water demand, costs can be practicably varied using an optimal
(prudent and efficient) management approach that considers SunWater’s operating
environment (whether costs are likely to be fixed, variable or semi-variable);
► there are any discernible drivers of variable costs other then water use; and
► there are other key factors that impact on costs (i.e. regulation, material costs, etc.).
Queensland Competition Authority Page 2 Indec Consulting
416370_2.DOCX October 2011
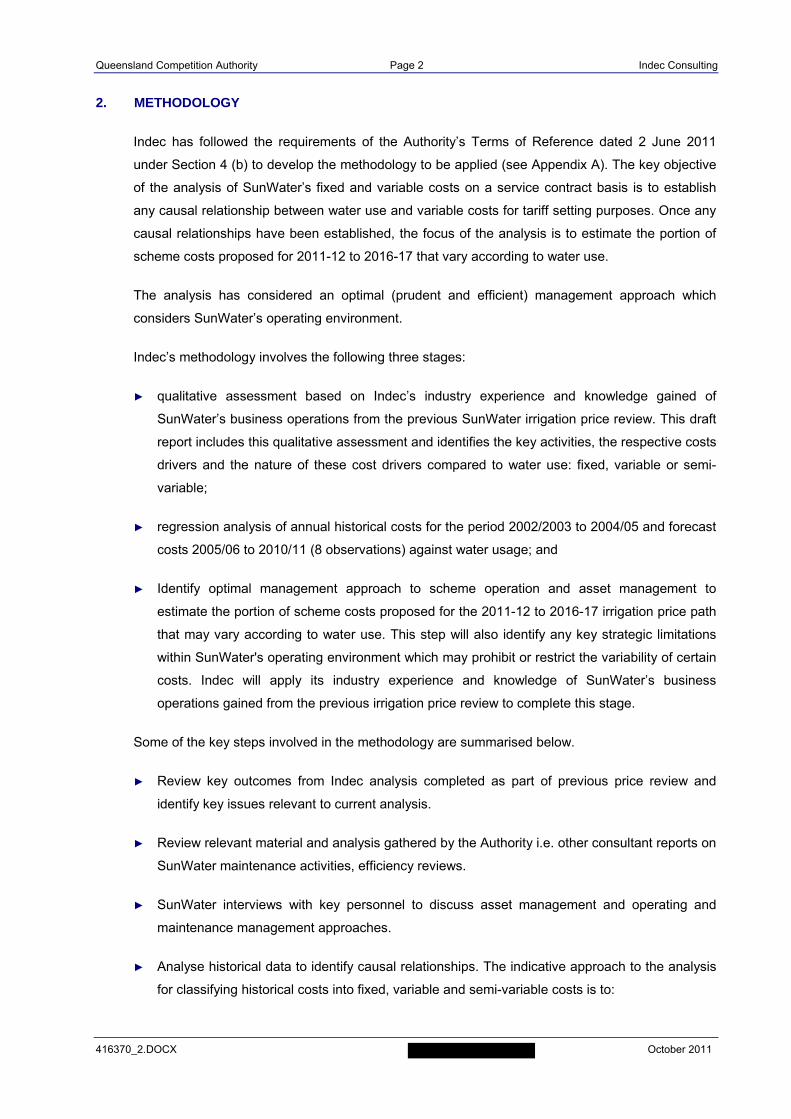
2. METHODOLOGY
Indec has followed the requirements of the Authority’s Terms of Reference dated 2 June 2011
under Section 4 (b) to develop the methodology to be applied (see Appendix A). The key objective
of the analysis of SunWater’s fixed and variable costs on a service contract basis is to establish
any causal relationship between water use and variable costs for tariff setting purposes. Once any
causal relationships have been established, the focus of the analysis is to estimate the portion of
scheme costs proposed for 2011-12 to 2016-17 that vary according to water use.
The analysis has considered an optimal (prudent and efficient) management approach which
considers SunWater’s operating environment.
Indec’s methodology involves the following three stages:
► qualitative assessment based on Indec’s industry experience and knowledge gained of
SunWater’s business operations from the previous SunWater irrigation price review. This draft
report includes this qualitative assessment and identifies the key activities, the respective costs
drivers and the nature of these cost drivers compared to water use: fixed, variable or semi-
variable;
► regression analysis of annual historical costs for the period 2002/2003 to 2004/05 and forecast
costs 2005/06 to 2010/11 (8 observations) against water usage; and
► Identify optimal management approach to scheme operation and asset management to
estimate the portion of scheme costs proposed for the 2011-12 to 2016-17 irrigation price path
that may vary according to water use. This step will also identify any key strategic limitations
within SunWater's operating environment which may prohibit or restrict the variability of certain
costs. Indec will apply its industry experience and knowledge of SunWater’s business
operations gained from the previous irrigation price review to complete this stage.
Some of the key steps involved in the methodology are summarised below.
► Review key outcomes from Indec analysis completed as part of previous price review and
identify key issues relevant to current analysis.
► Review relevant material and analysis gathered by the Authority i.e. other consultant reports on
SunWater maintenance activities, efficiency reviews.
► SunWater interviews with key personnel to discuss asset management and operating and
maintenance management approaches.
► Analyse historical data to identify causal relationships. The indicative approach to the analysis
for classifying historical costs into fixed, variable and semi-variable costs is to:
Queensland Competition Authority Page 3 Indec Consulting
416370_2.DOCX October 2011
► analyse historical trends, cyclical and seasonal variation of water usage (ML) or any
other discernible drivers of variable costs using regression analysis and
seasonal/cyclical index analysis;
► identify candidate costs and inputs (i.e. electricity - $ and KWh, and direct labour hours -
$ and hrs) that may vary with water usage or any other discernible drivers of variable
costs;
► conduct simple regression and correlation analysis for each identified candidate variable
cost and input to establish the relationship between candidate variable costs and inputs,
and water usage or any other discernible drivers of variable costs (if any);
► check if each variable input and related costs display similar correlation with water
usage or any other discernible drivers of variable costs and if differences can be
explained (i.e. impact of electricity tariff structures on costs vs. electricity usage in KWh,
and differential labour rates for normal time and penalty rates on costs vs. labour usage
in hours);
► add candidate inputs/costs to variable the cost pool if a relationship can be established
and if appropriate, conduct multiple regression analysis on the identified variable inputs
and costs (multivariate regression modelling);
► check if any trends in historical expenditure types can be observed such as the inter-
relationship between corrective and preventative maintenance and the influence of
water usage and other discernable drivers on the expenditure levels across corrective
and preventative maintenance; and
► forecast possible cost variations over the five year price path based on historical
practices and costs.
► The analysis of historical costs will be useful to establish impacts on cost and inputs of
historical management approaches to variations in water usage and other discernible drivers of
variable costs and inputs (if any).
► In its analysis, Indec has considered an optimal (prudent and efficient) management approach
to variations in water usage and other discernible drivers of variable costs that considers
SunWater’s operating environment.
► Prepare analysis for each service contract to estimate proportion of proposed scheme costs for
2011/12 to 2016/17 which can vary according to water use and other discernable drivers, as
agreed with the Authority.
Queensland Competition Authority Page 4 Indec Consulting
416370_2.DOCX October 2011
3. STAGE ONE - QUALITATIVE ASSESSMENT
In delivering irrigation water supply services SunWater carries out four key activities:
► water harvesting and storage;
► water distribution;
► water accounting; and
► administration.
In carrying out these activities, SunWater must adhere to strict regulatory compliance covering
such areas as dam safety, environmental, water accounting, occupational, and health and safety
regulation. Regulations covering SunWater’s irrigation water storage and distribution assets and
services are an external factor impacting on its fixed and variable operating costs. SunWater
deploys a number of key assets in its provision of irrigation water supply services:
► major dams, weirs and other bulk water harvesting and storage facilities, and related assets
and equipment;
► distribution channels, drains, pump stations and related pipe lines, water metering and other
distribution related equipment;
► information systems and equipment; and
► office facilities and equipment.
The fixed and variable cost framework for SunWater’s irrigation water services proposed in this
final draft report in accordance with the project brief is primarily focussed on an analysis of
whether:
► costs of a particular activity or category are material or not;
► in periods of fluctuating water demand, costs can be practicably varied using an optimal
(prudent and efficient) management approach that considers SunWater’s operating
environment (whether costs are likely to be fixed, variable or semi-variable);
► there are any discernible drivers of variable costs other then water use; and
► there are other key factors that impact on costs (i.e. regulation, material costs, etc.).
Indec has developed a fixed and variable cost analysis framework for the major SunWater
irrigation supply activities is shown in figure 3.1.
Queensland Competition Authority Page 5 Indec Consulting
416370_2.DOCX October 2011
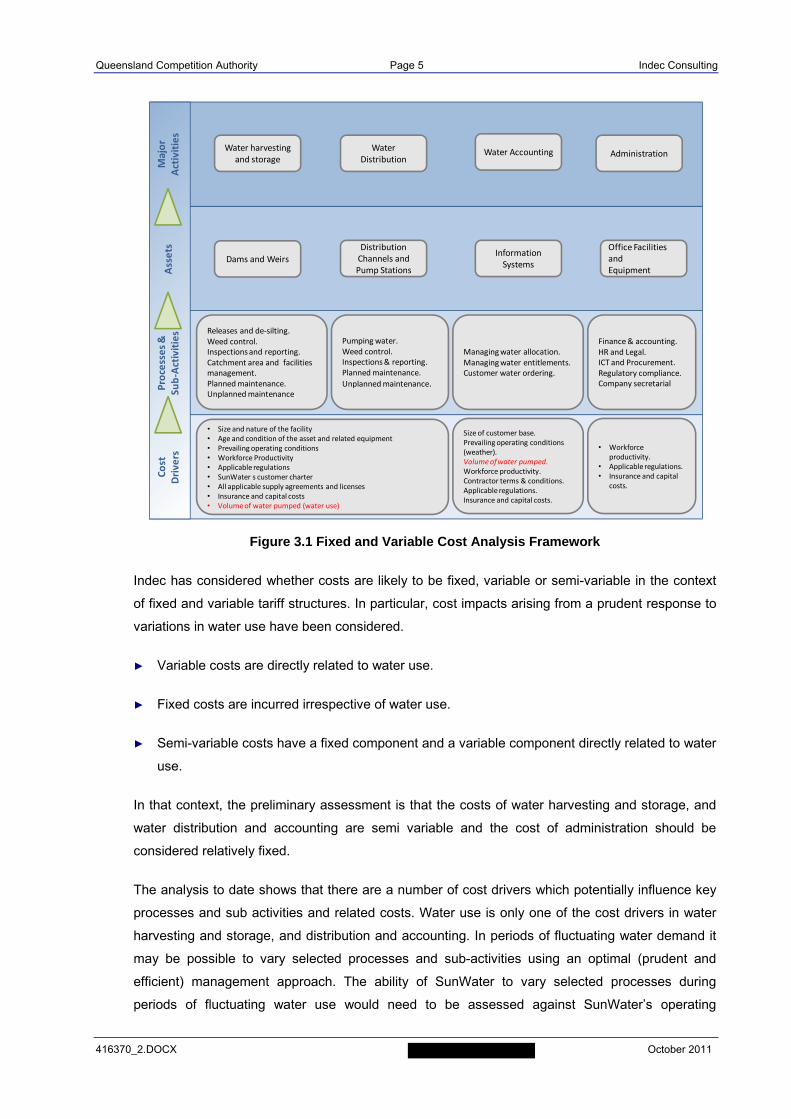
Figure 3.1 Fixed and Variable Cost Analysis Framework
Indec has considered whether costs are likely to be fixed, variable or semi-variable in the context
of fixed and variable tariff structures. In particular, cost impacts arising from a prudent response to
variations in water use have been considered.
► Variable costs are directly related to water use.
► Fixed costs are incurred irrespective of water use.
► Semi-variable costs have a fixed component and a variable component directly related to water
use.
In that context, the preliminary assessment is that the costs of water harvesting and storage, and
water distribution and accounting are semi variable and the cost of administration should be
considered relatively fixed.
The analysis to date shows that there are a number of cost drivers which potentially influence key
processes and sub activities and related costs. Water use is only one of the cost drivers in water
harvesting and storage, and distribution and accounting. In periods of fluctuating water demand it
may be possible to vary selected processes and sub-activities using an optimal (prudent and
efficient) management approach. The ability of SunWater to vary selected processes during
periods of fluctuating water use would need to be assessed against SunWater’s operating
Major
Activities
Assets
Processes &
Sub‐Activities
Cost
Drivers
Water Accounting
• Size and nature of the facility• Age and condition of the asset and related equipment• Prevailing operating conditions• Workforce Productivity• Applicable regulations• SunWater s customer charter• All applicable supply agreements and licenses• Insurance and capital costs• Volume of water pumped (water use)
Dams and Weirs
Distribution Channels and Pump Stations
Information Systems
Office Facilities andEquipment
AdministrationWater
DistributionWater harvesting
and storage
Releases and de‐silting.Weed control.Inspections and reporting.Catchment area and facilities management.Planned maintenance.Unplanned maintenance.
Pumping water.Weed control.Inspections & reporting.Planned maintenance.
Unplanned maintenance.
Managing water allocation.Managing water entitlements.Customer water ordering.
Finance & accounting.HR and Legal.ICT and Procurement.Regulatory compliance.Company secretarial
• Workforce productivity.
• Applicable regulations.• Insurance and capital
costs.
Size of customer base.Prevailing operating conditions (weather).Volume of water pumped.Workforce productivity.Contractor terms & conditions.Applicable regulations.Insurance and capital costs.
Queensland Competition Authority Page 6 Indec Consulting
416370_2.DOCX October 2011
environment to determine if the variations are possible. The impact of varying processes and sub-
activities is likely to be more material in water distribution than in other major SunWater activities.
Examples of SunWater’s key processes, sub-activities and related costs that could be varied with
water use include scheduling and delivering water (semi variable), electricity costs (variable),
corrective maintenance (semi variable) and weed control management (semi- variable). Sections 3
and 4 of this report outline in more detail the reasoning for these findings.
A complete indicative qualitative assessment of SunWater’s cost structures in terms of fixed,
variable and semi-variable cost classifications is attached as Appendix D.
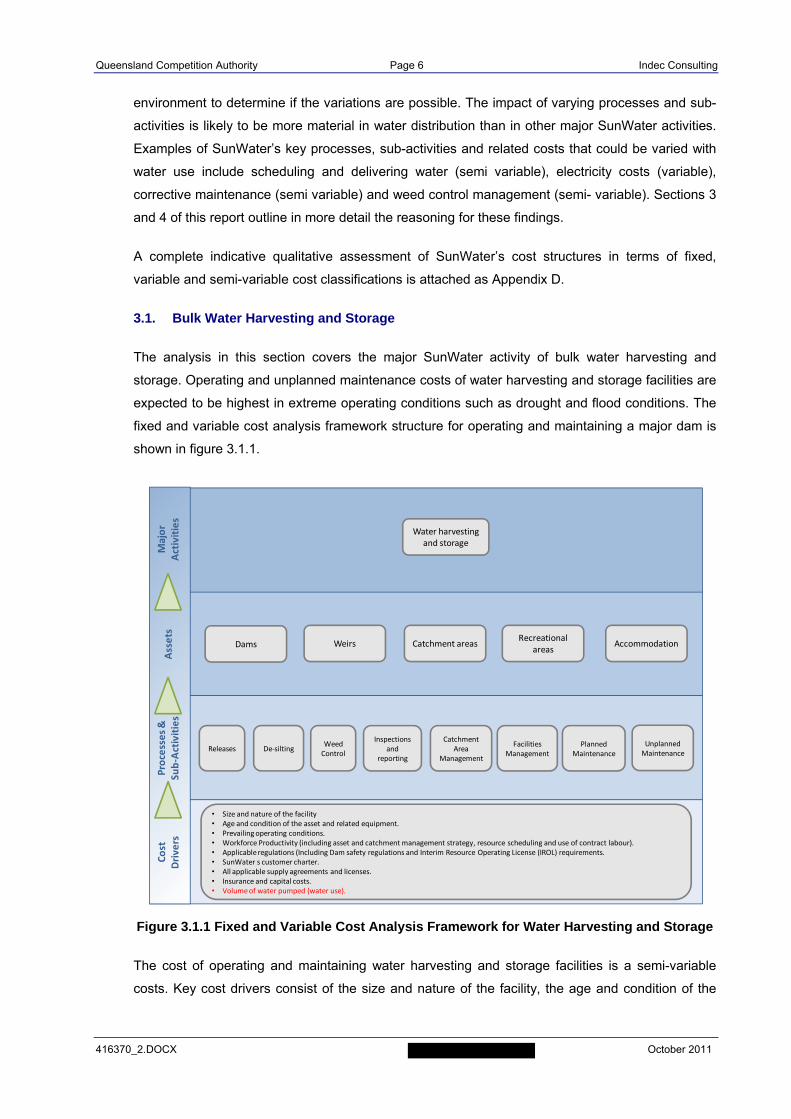
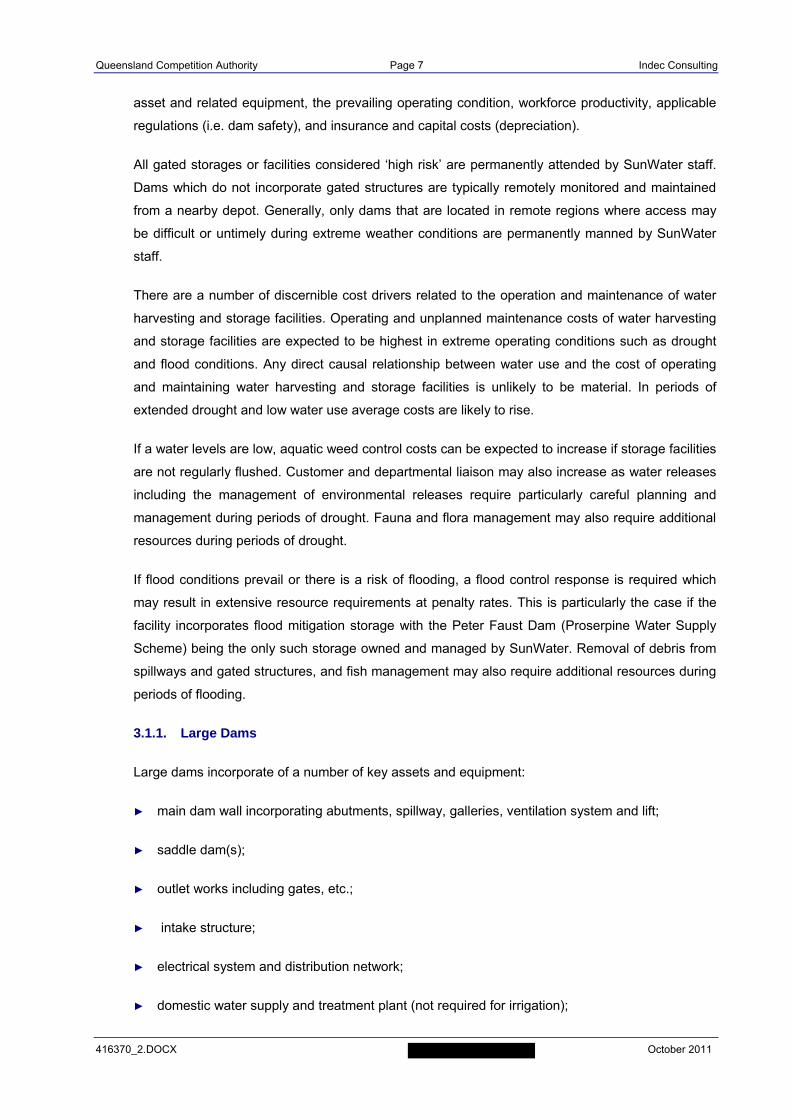
3.1. Bulk Water Harvesting and Storage
The analysis in this section covers the major SunWater activity of bulk water harvesting and
storage. Operating and unplanned maintenance costs of water harvesting and storage facilities are
expected to be highest in extreme operating conditions such as drought and flood conditions. The
fixed and variable cost analysis framework structure for operating and maintaining a major dam is
shown in figure 3.1.1.
Figure 3.1.1 Fixed and Variable Cost Analysis Framework for Water Harvesting and Storage
The cost of operating and maintaining water harvesting and storage facilities is a semi-variable
costs. Key cost drivers consist of the size and nature of the facility, the age and condition of the
Major
Activities
Assets
Processes &
Sub‐Activities
Cost
Drivers
Water harvesting and storage
Releases De‐siltingWeed Control
Inspections and
reporting
Catchment Area
Management
• Size and nature of the facility• Age and condition of the asset and related equipment.• Prevailing operating conditions.• Workforce Productivity (including asset and catchment management strategy, resource scheduling and use of contract labour).• Applicable regulations (Including Dam safety regulations and Interim Resource Operating License (IROL) requirements.• SunWater s customer charter.• All applicable supply agreements and licenses.• Insurance and capital costs.• Volume of water pumped (water use).
Facilities Management
Planned Maintenance
Dams Weirs Catchment areasRecreational
areasAccommodation
Unplanned Maintenance
Queensland Competition Authority Page 7 Indec Consulting
416370_2.DOCX October 2011
asset and related equipment, the prevailing operating condition, workforce productivity, applicable
regulations (i.e. dam safety), and insurance and capital costs (depreciation).
All gated storages or facilities considered ‘high risk’ are permanently attended by SunWater staff.
Dams which do not incorporate gated structures are typically remotely monitored and maintained
from a nearby depot. Generally, only dams that are located in remote regions where access may
be difficult or untimely during extreme weather conditions are permanently manned by SunWater
staff.
There are a number of discernible cost drivers related to the operation and maintenance of water
harvesting and storage facilities. Operating and unplanned maintenance costs of water harvesting
and storage facilities are expected to be highest in extreme operating conditions such as drought
and flood conditions. Any direct causal relationship between water use and the cost of operating
and maintaining water harvesting and storage facilities is unlikely to be material. In periods of
extended drought and low water use average costs are likely to rise.
If a water levels are low, aquatic weed control costs can be expected to increase if storage facilities
are not regularly flushed. Customer and departmental liaison may also increase as water releases
including the management of environmental releases require particularly careful planning and
management during periods of drought. Fauna and flora management may also require additional
resources during periods of drought.
If flood conditions prevail or there is a risk of flooding, a flood control response is required which
may result in extensive resource requirements at penalty rates. This is particularly the case if the
facility incorporates flood mitigation storage with the Peter Faust Dam (Proserpine Water Supply
Scheme) being the only such storage owned and managed by SunWater. Removal of debris from
spillways and gated structures, and fish management may also require additional resources during
periods of flooding.
3.1.1. Large Dams
Large dams incorporate of a number of key assets and equipment:
► main dam wall incorporating abutments, spillway, galleries, ventilation system and lift;
► saddle dam(s);
► outlet works including gates, etc.;
► intake structure;
► electrical system and distribution network;
► domestic water supply and treatment plant (not required for irrigation);
Queensland Competition Authority Page 8 Indec Consulting
416370_2.DOCX October 2011
► fixed or mobile instrumentation to measure dam conditions;
► catchment area including access roads, fences and gates; and
► recreational facilities.
Key large dam operating activities include:
► operating the outlet works (water releases must be complying with the Resource Operating
License (IROL), SunWater’s customer charter and all applicable supply agreements and
licenses. For dams no analysis included on fixed, variable or semi-variable conducting routine
inspections of the galleries and lift;
► conducting routine inspections of the galleries and lift;
► monitoring the dam including inspection of the embankments, keeping the dam logbook,
reporting observations and measurements, storage and flow data;
► using instruments to measure dam conditions;
► operating the intake structure;
► operating the standby diesel generator and backup electrical system in case of failure;
► managing the storage including monitoring data quality, blue algae levels, storage inspection
and control of noxious weeds;
► operating the domestic water supply and water treatment plant (not required for irrigation);
► monitoring on-site security fencing and buildings;
► monitoring signs and erecting temporary signs where necessary;
► inducting visitors; and
► for certain facilities collecting rubbish and cleaning of recreational facilities.
Other activities include planned and unplanned maintenance of all dam equipment and facilities
and any augmentation or renewals work.
The analysis to date shows that there are a number of cost drivers that influence processes and
sub activities and related costs relating to operating and maintaining a large dam:
► Size and nature of the facility;
► Age and condition of the asset and related equipment;
Queensland Competition Authority Page 9 Indec Consulting
416370_2.DOCX October 2011
► Prevailing operating conditions;
► Workforce Productivity (including asset and catchment management strategy, resource
scheduling and use of contract labour);
► Applicable regulations (Including Dam safety regulations and Resource Operating Plans (ROP)
requirements;
► SunWater’s customer charter;
► All applicable supply agreements and licenses;
► Insurance and capital costs; and
► Volume of water pumped (water use).
Water use is only one of the cost drivers in major SunWater activities. In periods of fluctuating
water demand it may be possible to vary selected processes and sub-activities using an optimal
(prudent and efficient) management approach that considers SunWater’s operating environment.
The impact of varying processes and sub-activities is likely to be more material in water distribution
than in other major SunWater activities. Examples of processes, sub-activities and related costs for
large dams that could be varied with water use include scheduling and delivering water (semi
variable), corrective maintenance (semi variable) and weed control management (semi variable).
Sections 4 and 5 of this report outline in more detail the reasoning for these findings.
3.1.2. Weirs and other Storage Facilities
Weirs and other storage facilities incorporate of a number of key assets and equipment:
► site facilities incorporating roads, recreation facilities, water and waste water, weather station,
HV electrical system, signs and marker posts, buildings, houses, fencing, gates and marker
buoys;
► protection works;
► weir structure;
► hydraulic system and electrical system;
► control system;
► instrumentation; and
► cathodic protection.
Queensland Competition Authority Page 10 Indec Consulting
416370_2.DOCX October 2011
Key weir and other storage facilities operating activities are similar to the operating activities
carried out for large dams and include:
► Operating the outlet works (water releases) - (semi-variable). For dams in 2.1 above no
analysis included on fixed, variable or semi-variable.
► Conducting routine inspections of the galleries and lift (fixed).
► Monitoring the dam including inspection of the embankments, keeping the dam logbook,
reporting observations and measurements, storage and flow data (fixed).
► Using instruments to measure dam conditions (fixed).
► Operating the intake structure (semi-variable).
► Operating the standby diesel generator and backup electrical system in case of failure (semi-
variable).
► Managing the storage including monitoring data quality, blue algae levels, storage inspection
and control of vegetation and noxious weeds (semi-variable).
► Operating the domestic water supply and water treatment plant (not required for irrigation) –
(semi-variable).
► De-silting (semi-variable).
► Other inspections and reporting (semi-variable).
► Planned maintenance (semi-variable).
► Unplanned maintenance (semi-variable).
► Catchment area management (semi-variable).
► Weed control (semi-variable).
► Inspections and reporting (semi-variable).
► Planned maintenance (semi-variable).
► Unplanned maintenance (semi-variable).
► Monitoring signs and on-site security fencing (fixed).
► Erecting temporary signs where necessary (semi-variable).
► Inducting visitors (semi-variable).
Queensland Competition Authority Page 11 Indec Consulting
416370_2.DOCX October 2011
► Collecting rubbish (semi-variable).
► Cleaning of recreational facilities (semi-variable).
► Monitoring buildings (semi-variable).
The analysis to date shows that there are a number of cost drivers that influence processes and
sub activities and related costs relating to operating and maintaining a weir.
► Size and nature of the facility;
► Age and condition of the asset and related equipment;
► Prevailing operating conditions;
► Workforce Productivity (including asset and catchment management strategy, resource
scheduling and use of contract labour);
► Applicable SunWater’s customer charter;
► All applicable supply agreements and licenses;
► Insurance and capital costs; and
► Volume of water pumped (water use).
Water use is only one of the cost drivers in operating and maintaining a weir. In periods of
fluctuating water demand it may be possible to vary selected processes and sub-activities using an
optimal (prudent and efficient) management approach that considers SunWater’s operating
environment.
The impact of varying processes and sub-activities is not likely to be material in the costs
associated with operating and maintaining a weir. Examples of water distribution processes and
sub-activities, and related costs for weirs and other storage facilities that may be able to be varied
with water use include scheduling and delivering water (semi-variable), corrective maintenance
(semi variable) and weed control management (semi-variable). Sections 4 and 5 of this report
outline in more detail the reasoning for these findings.
3.2. Water Distribution
The analysis in this section covers the major SunWater activity of water distribution. Key assets
deployed include open and piped channels, pump stations and pipelines. Water distribution
services are delivered in the field by operational staff supported by four area operations centres
and nine depots. The fixed and variable cost analysis framework structure for water distribution is
shown in figure 3.2.1.
Queensland Competition Authority Page 12 Indec Consulting
416370_2.DOCX October 2011
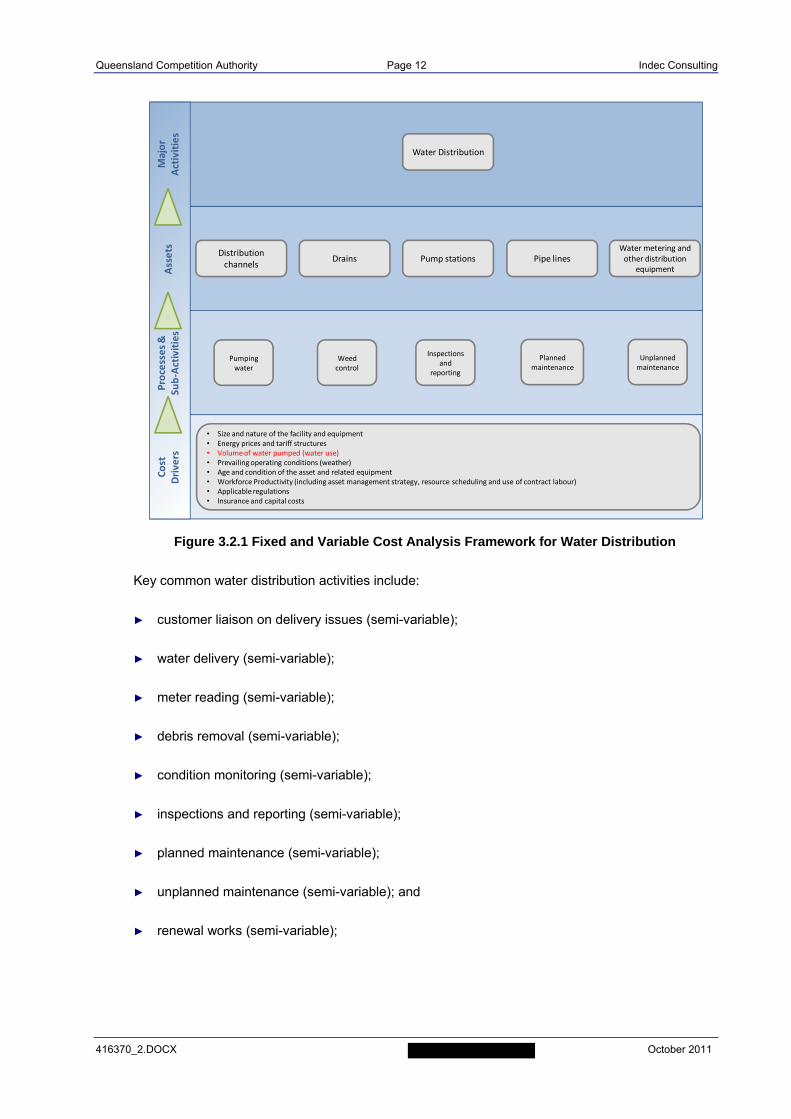
Figure 3.2.1 Fixed and Variable Cost Analysis Framework for Water Distribution
Key common water distribution activities include:
► customer liaison on delivery issues (semi-variable);
► water delivery (semi-variable);
► meter reading (semi-variable);
► debris removal (semi-variable);
► condition monitoring (semi-variable);
► inspections and reporting (semi-variable);
► planned maintenance (semi-variable);
► unplanned maintenance (semi-variable); and
► renewal works (semi-variable);
Major
Activities
Assets
Processes &
Sub‐Activities
Cost
Drivers
Water Distribution
Pumping water
Weed control
Inspections and
reporting
Planned maintenance
Unplanned maintenance
• Size and nature of the facility and equipment• Energy prices and tariff structures• Volume of water pumped (water use)• Prevailing operating conditions (weather)• Age and condition of the asset and related equipment• Workforce Productivity (including asset management strategy, resource scheduling and use of contract labour)• Applicable regulations• Insurance and capital costs
Distribution channels
Drains Pump stations Pipe linesWater metering and other distribution
equipment
Queensland Competition Authority Page 13 Indec Consulting
416370_2.DOCX October 2011
3.2.1. Channels
Channels can be open or piped. Open channels incorporate the following key assets and
equipment:
► channel flow meter(s);
► channel meter outlet(s);
► regulating gate(s);
► siphon(s);
► rock drop(s);
► crossing(s);
► drain(s);
► fencing;
► access road(s);
► sign(s); and
► marker buoy(s).
Key water delivery activities were summarised in section 3. Principle activities for open channels
also include vegetation and weed control, and silt removal. Piped channels typically incorporate the
following key assets and equipment:
► air vent(s);
► flow meter(s);
► off-take(s);
► pipe(s); and
► valve(s).
The analysis to date shows that there are a number of cost drivers that influence processes and
sub activities and related costs relating to operating and maintaining channels.
► Size and nature of the facility;
► Age and condition of the asset and related equipment;
Queensland Competition Authority Page 14 Indec Consulting
416370_2.DOCX October 2011
► Prevailing operating conditions;
► Workforce Productivity (including asset management strategy, resource scheduling and use of
contract labour);
► Applicable SunWater’s customer charter;
► All applicable supply agreements and licenses;
► Insurance and capital costs; and
► Volume of water pumped (water use).
Water use is only one of the cost drivers in operating and maintaining a channels. In periods of
fluctuating water demand it may be possible to vary selected processes and sub-activities using an
optimal (prudent and efficient) management approach that considers SunWater’s operating
environment. The impact of varying processes and sub-activities is likely to be more material in
water distribution than in other major SunWater activities.
SunWater has advised that concrete channel linings primary course of failure is due to ground
movement. HDP (high density polyethylene) channel linings are said to primarily fail due to the
impact of exposure to ultra-violet sunlight and damage caused from debris and foreign matter.
SunWater further advised that unlined earth channels are more susceptible to weed outbreaks.
SunWater also advised that a key maintenance/renewals cost driver for piped channels is failures
due to ground movement and corrosion, and installation and maintenance of cathodic protection.
SunWater’s Standard of Service and stock and domestic customers drives whether in periods of
low water demand, channels remain charged or not. For example, water demand from one user
may lead to a requirement to keep charged a channel designed for multiple water users even if the
other users do not require supply or the channel system is required to provide continuous supply to
stock and domestic customers. In such circumstances a charged channel may be more susceptible
to weed outbreaks due to relatively stagnant water (minimal flow).
Examples of water distribution processes and sub-activities and related costs for channels that
could be varied with water use include scheduling and delivering water (semi-variable), corrective
maintenance (semi-variable) and weed control management (semi-variable). Sections 4 and 5 of
this report outline in more detail the reasoning for these findings.
3.2.2. Pump Stations and Pipelines
Pump stations incorporate the following key assets and equipment:
► site facilities (incl. control building);
Queensland Competition Authority Page 15 Indec Consulting
416370_2.DOCX October 2011
► inlet works;
► pump well;
► pump unit;
► compressed air system;
► vacuum priming system;
► electrical systems (HV, LV and ELV);
► control equipment;
► flow meter; and
► rising main.
Pipelines incorporate the following key assets and equipment:
► air valves;
► scour outlets;
► meter outlets;
► fish screen;
► flow meter;
► valve pit;
► manholes;
► swab pit or station;
► surge tank;
► balancing storage; and
► cathodic protection.
Key common activities relating to pump station and pipelines are similar to the common water
delivery activities summarised in section 3.2. The fixed and variable cost analysis framework
structure for pump stations and pipelines is further detailed in appendix B. The analysis to date
shows that there are a number of cost drivers that influence processes and sub activities and
related costs relating to operating and maintaining pump stations and pipelines;
Queensland Competition Authority Page 16 Indec Consulting
416370_2.DOCX October 2011
► Size and nature of the facility;
► Electricity tariffs (pump stations only);
► Age and condition of the asset and related equipment;
► Prevailing operating conditions;
► Workforce Productivity (including asset management strategy, resource scheduling and use of
contract labour);
► Applicable SunWater’s customer charter;
► All applicable supply agreements and licenses;
► Insurance and capital costs; and
► Volume of water pumped (water use).
Water use is only one of the cost drivers in operating and maintaining pump stations and pipe
lines.
In periods of fluctuating water demand it may be possible to vary selected processes and sub-
activities using an optimal (prudent and efficient) management approach that considers
SunWater’s operating environment. The impact of varying processes and sub-activities is likely to
be more material in water distribution than in other major SunWater activities.
SunWater has advised that key maintenance cost drivers for pumps consist of corrosion and
breakdown of seals due to age and climate related deterioration. These failure modes are said to
occur irrespective of whether pumps are in use or not.
Examples of water distribution processes and sub-activities and related costs for pump stations
and pipelines that could be varied with water use include scheduling and delivering water (semi-
variable), electricity costs (variable) and corrective maintenance (semi-variable). Sections 4 and 5
of this report outline in more detail the reasoning for these findings.
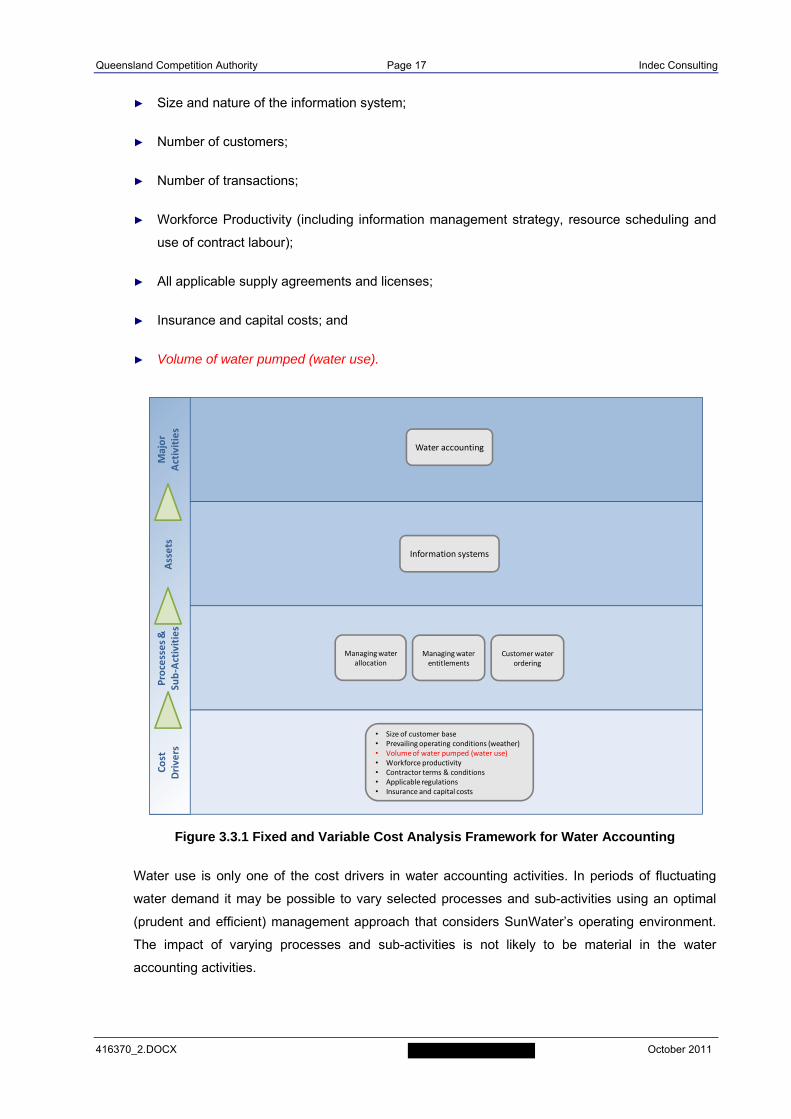
3.3. Water Accounting
The analysis in this section covers the major SunWater activity of water accounting. The fixed and
variable cost analysis framework structure for water accounting is shown in figure 3.3.1.
The analysis to date shows that there are a number of cost drivers that influence processes and
sub activities and related costs relating to water accounting:
► Regulatory and statutory obligations;
Queensland Competition Authority Page 17 Indec Consulting
416370_2.DOCX October 2011
► Size and nature of the information system;
► Number of customers;
► Number of transactions;
► Workforce Productivity (including information management strategy, resource scheduling and
use of contract labour);
► All applicable supply agreements and licenses;
► Insurance and capital costs; and
► Volume of water pumped (water use).
Figure 3.3.1 Fixed and Variable Cost Analysis Framework for Water Accounting
Water use is only one of the cost drivers in water accounting activities. In periods of fluctuating
water demand it may be possible to vary selected processes and sub-activities using an optimal
(prudent and efficient) management approach that considers SunWater’s operating environment.
The impact of varying processes and sub-activities is not likely to be material in the water
accounting activities.
Major
Activities
Assets
Processes &
Sub‐Activities
Cost
Drivers
Water accounting
Managing water allocation
Managing water entitlements
Customer water ordering
• Size of customer base• Prevailing operating conditions (weather)• Volume of water pumped (water use)• Workforce productivity• Contractor terms & conditions• Applicable regulations• Insurance and capital costs
Information systems
Queensland Competition Authority Page 18 Indec Consulting
416370_2.DOCX October 2011
Examples of water accounting processes and sub-activities and related costs that could be varied
with water use include processing customer orders (semi variable), and allocation management
(semi variable).
Water use is unlikely to be a material cost drivers of water accounting cost. In periods of fluctuating
water demand it may not be possible to vary the processes and sub-activities of highest cost
materiality using an optimal (prudent and efficient) management approach that considers
SunWater’s operating environment. Water accounting costs are therefore considered to be
relatively fixed.
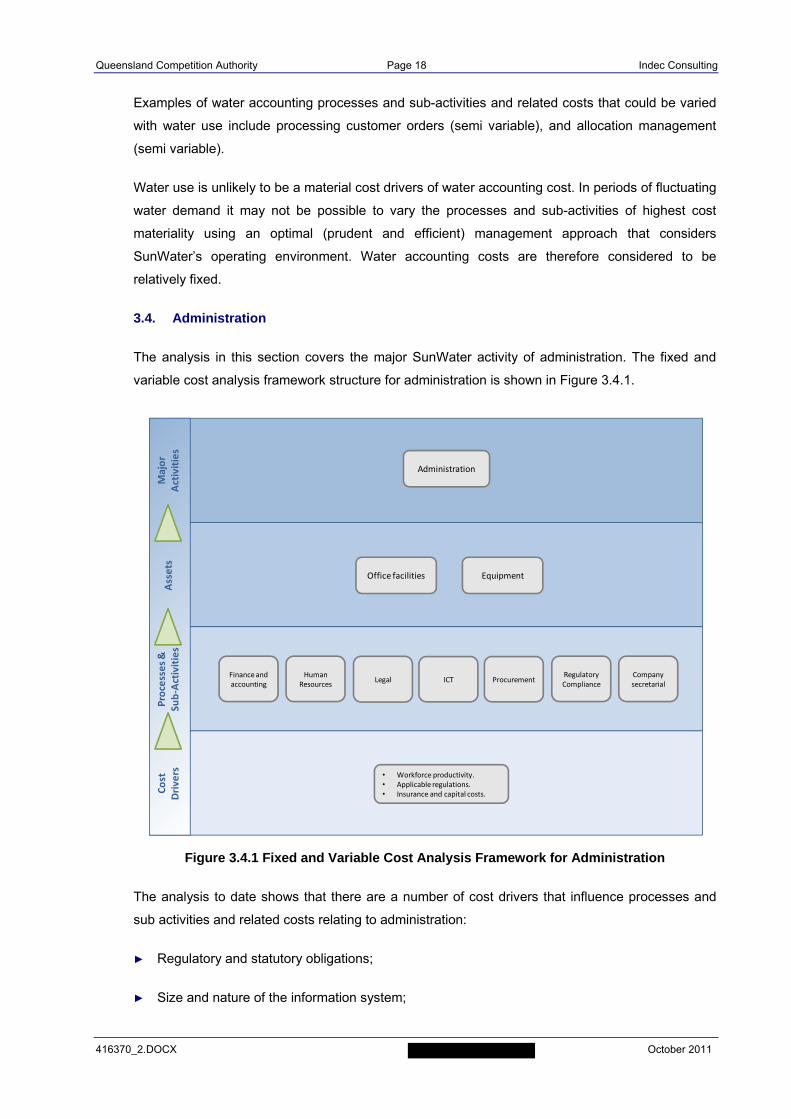
3.4. Administration
The analysis in this section covers the major SunWater activity of administration. The fixed and
variable cost analysis framework structure for administration is shown in Figure 3.4.1.
Figure 3.4.1 Fixed and Variable Cost Analysis Framework for Administration
The analysis to date shows that there are a number of cost drivers that influence processes and
sub activities and related costs relating to administration:
► Regulatory and statutory obligations;
► Size and nature of the information system;
Major
Activities
Assets
Processes &
Sub‐Activities
Cost
Drivers
Administration
• Workforce productivity.• Applicable regulations.• Insurance and capital costs.
Office facilities Equipment
LegalRegulatory Compliance
Company secretarial
Human Resources
Finance and accounting
ICT Procurement
Queensland Competition Authority Page 19 Indec Consulting
416370_2.DOCX October 2011
► Size of business and staff numbers;
► Number of financial and non-financial transactions;
► Workforce Productivity (including information management strategy, resource scheduling and
use of contract labour);
► All applicable supply agreements and licenses; and
► Insurance and capital costs.
Water use is unlikely to be one of the cost drivers of administration cost. In periods of fluctuating
water demand it may not be possible to vary selected processes and sub-activities using an
optimal (prudent and efficient) management approach that considers SunWater’s operating
environment. Administration costs are therefore considered to be relatively fixed.
Queensland Competition Authority Page 20 Indec Consulting
416370_2.DOCX October 2011
4. STAGE TWO - ANALYSIS OF HISTORICAL COSTS
Indec performed an econometric analysis on SunWater’s (available) quarterly historical cost data
for 2007-11 to establish whether historical costs were fixed, variable or semi-variable with a
variation in customer water use. The analysis in the following sections 4.1 to 4.4 focuses on
SunWater overall. Indec has conducted the same analysis by region, depot and service contract.
Sample results of the analysis are contained in Appendices F to H.
4.1. Regression Analysis of Historical Costs and Water Use
The agreed scope specified that regression analysis be conducted on regression analysis of
annual historical costs for the period 2002/2003 to 2004/05 and forecast costs 2005/06 to 2010/11
(8 observations) against water usage. However, data limitations and inconclusive results led to the
need to progressively expand the scope during the course of the analysis. Specifically, additional
analysis scope included a regression analysis of quarterly historical costs versus water usage for
the period 2006/07 to 2010/11 (20 observations).
► operations;
► electricity;
► preventative maintenance;
► corrective maintenance; and
► renewals expenditure and capital.
4.1.1. Outputs
The outputs of the regression analysis include:
► R-squared;
► Significance of F;
► R (Correlation Coefficient);
► P Value;
► Coefficient;
► Standard Error;
► Intercept Coefficient;
► Intercept Std Error; and
Queensland Competition Authority Page 21 Indec Consulting
416370_2.DOCX October 2011
► Intercept t-stat.
Of these, the key statistical outputs that Indec has used to analyse the relationships between
activity costs and water use are:
► R-squared;
► Significance of F;
► P Value;
► Coefficient;
► Standard Error; and
► R (Correlation Coefficient).
These statistical outputs are discussed below.
► Null Hypothesis - In this context, it is important to note that in regression analysis, the null
hypothesis is that there is no relationship between the independent variable (X)2 and the
dependent variable (Y)3 which infers that Y is independent of X. In other words, for the
Regression Line Y = AX +B, the coefficient (A) of the independent variable X is zero.
► R Squared (R2) - R-squared demonstrates how well the regression line approximates the real
data. The maximum value for R-squared is one (1), and indicates a perfect fit for the
regression line. In other words the regression line passes through all real data points when R-
squared equals 1. R-squared values close to one (1) infer a better regression line fit. For the
purpose of this report, a value of R-squared greater than or equal to 0.6 is considered
statistically significant. R-squared is a guide to the ‘goodness of the fit’ and does not provide
information on the statistical significance. P-value and Significance of F indicate the statistical
significance of the regression testing
► P-Value - P-Value is a measure of how much evidence there is against the null hypothesis. In
statistical significance testing, the p-value is the probability of obtaining a test result ‘at least as
extreme’ as the real data. If the p-value is smaller than an accepted level of significance
(alpha), the null hypothesis can be rejected. For a confidence level of 95% for the regression
testing, the accepted level of significance (alpha) is 0.05. Mathematically, therefore, if P < 0.05,
2 In this instance water use 3 In this instance is an expense
Queensland Competition Authority Page 22 Indec Consulting
416370_2.DOCX October 2011
the null hypothesis can be rejected4. Conversely, if P > 0.05, the null hypothesis can be
accepted (i.e. that there is no relationship between X and Y).
► Significance of F - This is another measure of the statistical significance of the relationship
between the variables being tested. Essentially, Significance of F is the probability value of
obtaining a test result at least as extreme as the real data. If the Significance of F is less than
the accepted significance level (alpha, in this case 0.05), the null hypothesis can be rejected.
In this case, a statistically significant association between X and Y can be inferred. A
Significance of F value greater than 0.05 infers that there is no relationship between X and Y.
► Coefficient – This determines size of the effect the water usage has on a particular cost
category cost. The sign of coefficient gives direction of the effect (negative or positive).
► Standard Error – This is an estimate of the standard deviation of the coefficient.
► Correlation Coefficient – This measures the strength and direction of a linear relationship
between two variables. Its value is always between minus one (-1) and one (+1) and a value
close to either limit indicates a strong linear relationship (positive or negative).
4.1.2. Decision Rule
From a statistical point of view, Indec has considered simultaneously the values of R-squared, p-
value and significance of F to determine the nature of the relationship between the costs and the
water usage for the service contracts. In discussion with the Authority, Indec defined a “decision
rule” which considers simultaneously the conditions on the values of these three statistical outputs.
These conditions are an R–squared value of greater than or equal to 0.6; a Significance of F value
of less than 0.05; and a P-Value of less than 0.05.
The incorporation in the decision rule of an R-squared value greater than or equal to 0.6 is based
on the notion that this value equates to a correlation coefficient of approximately plus or minus
0.775 which would indicate that some possible association between two variables exists. An R
squared of 0.6 indicates that 60% of the change in one variable (i.e. water use) is explained by a
change in the related variable (i.e. labour hours)
It should be noted that in the context of pure applied statistics, a caution applies to R-squared
statistical measures. Correlation does not necessarily imply causation. While correlations may
provide valuable clues regarding causal relationships among variables, a high correlation between
two variables does not necessarily represent adequate evidence that changing one variable has
resulted, or may result, from changes of other variables.
4 i.e. reject that A = 0 and accept that a statistically significant association between X and Y exists.
Queensland Competition Authority Page 23 Indec Consulting
416370_2.DOCX October 2011
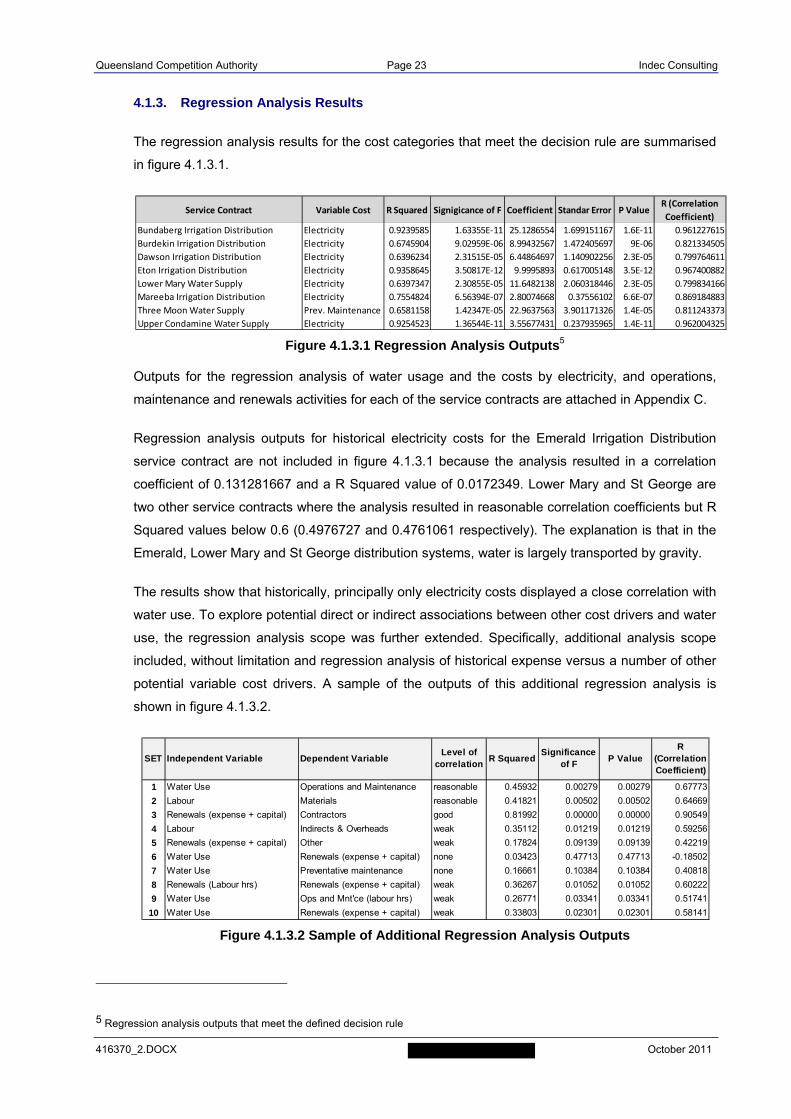
4.1.3. Regression Analysis Results
The regression analysis results for the cost categories that meet the decision rule are summarised
in figure 4.1.3.1.
Figure 4.1.3.1 Regression Analysis Outputs5
Outputs for the regression analysis of water usage and the costs by electricity, and operations,
maintenance and renewals activities for each of the service contracts are attached in Appendix C.
Regression analysis outputs for historical electricity costs for the Emerald Irrigation Distribution
service contract are not included in figure 4.1.3.1 because the analysis resulted in a correlation
coefficient of 0.131281667 and a R Squared value of 0.0172349. Lower Mary and St George are
two other service contracts where the analysis resulted in reasonable correlation coefficients but R
Squared values below 0.6 (0.4976727 and 0.4761061 respectively). The explanation is that in the
Emerald, Lower Mary and St George distribution systems, water is largely transported by gravity.
The results show that historically, principally only electricity costs displayed a close correlation with
water use. To explore potential direct or indirect associations between other cost drivers and water
use, the regression analysis scope was further extended. Specifically, additional analysis scope
included, without limitation and regression analysis of historical expense versus a number of other
potential variable cost drivers. A sample of the outputs of this additional regression analysis is
shown in figure 4.1.3.2.
Figure 4.1.3.2 Sample of Additional Regression Analysis Outputs
5 Regression analysis outputs that meet the defined decision rule
Service Contract Variable Cost R Squared Signigicance of F Coefficient Standar Error P ValueR (Correlation
Coefficient)
Bundaberg Irrigation Distribution Electricity 0.9239585 1.63355E‐11 25.1286554 1.699151167 1.6E‐11 0.961227615
Burdekin Irrigation Distribution Electricity 0.6745904 9.02959E‐06 8.99432567 1.472405697 9E‐06 0.821334505
Dawson Irrigation Distribution Electricity 0.6396234 2.31515E‐05 6.44864697 1.140902256 2.3E‐05 0.799764611
Eton Irrigation Distribution Electricity 0.9358645 3.50817E‐12 9.9995893 0.617005148 3.5E‐12 0.967400882
Lower Mary Water Supply Electricity 0.6397347 2.30855E‐05 11.6482138 2.060318446 2.3E‐05 0.799834166
Mareeba Irrigation Distribution Electricity 0.7554824 6.56394E‐07 2.80074668 0.37556102 6.6E‐07 0.869184883
Three Moon Water Supply Prev. Maintenance 0.6581158 1.42347E‐05 22.9637563 3.901171326 1.4E‐05 0.811243373
Upper Condamine Water Supply Electricity 0.9254523 1.36544E‐11 3.55677431 0.237935965 1.4E‐11 0.962004325
1 Water Use Operations and Maintenance reasonable 0.45932 0.00279 0.00279 0.67773
2 Labour Materials reasonable 0.41821 0.00502 0.00502 0.64669
3 Renewals (expense + capital) Contractors good 0.81992 0.00000 0.00000 0.90549
4 Labour Indirects & Overheads weak 0.35112 0.01219 0.01219 0.59256
5 Renewals (expense + capital) Other weak 0.17824 0.09139 0.09139 0.42219
6 Water Use Renewals (expense + capital) none 0.03423 0.47713 0.47713 -0.18502
7 Water Use Preventative maintenance none 0.16661 0.10384 0.10384 0.40818
8 Renewals (Labour hrs) Renewals (expense + capital) weak 0.36267 0.01052 0.01052 0.60222
9 Water Use Ops and Mnt'ce (labour hrs) weak 0.26771 0.03341 0.03341 0.51741
10 Water Use Renewals (expense + capital) weak 0.33803 0.02301 0.02301 0.58141
R (Correlation Coefficient)
Significance of F
P ValueSET Independent Variable Dependent VariableLevel of
correlationR Squared
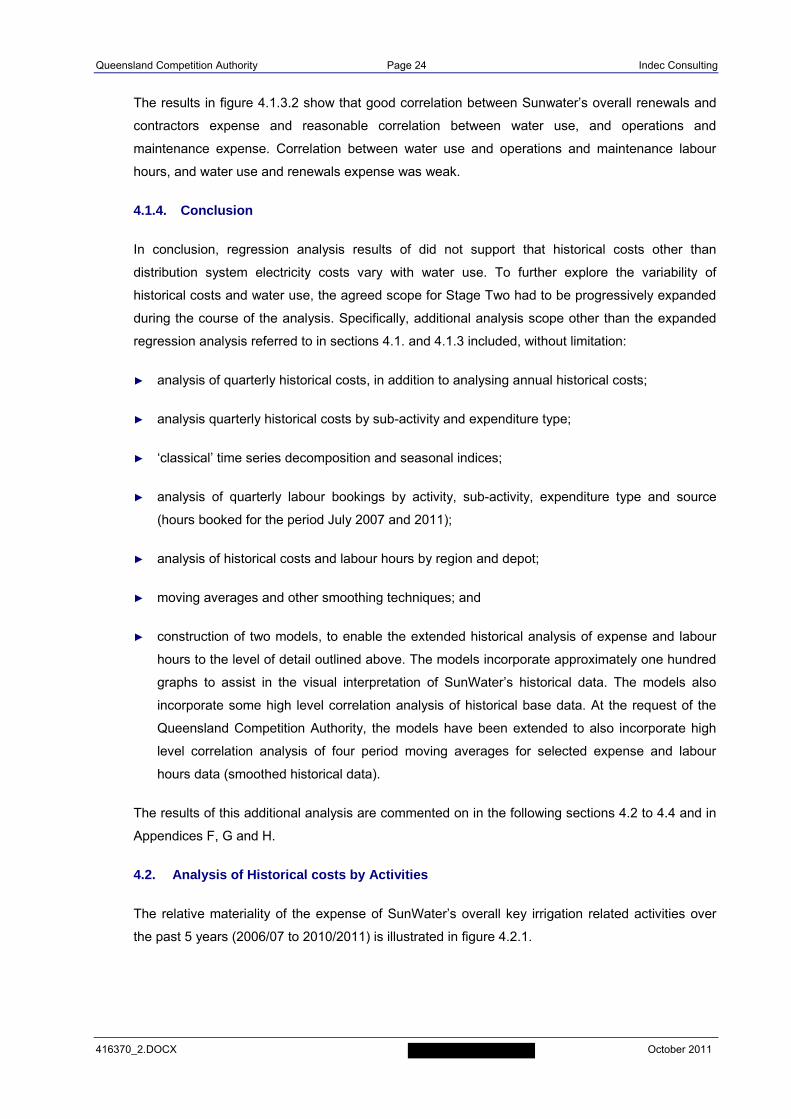
Queensland Competition Authority Page 24 Indec Consulting
416370_2.DOCX October 2011
The results in figure 4.1.3.2 show that good correlation between Sunwater’s overall renewals and
contractors expense and reasonable correlation between water use, and operations and
maintenance expense. Correlation between water use and operations and maintenance labour
hours, and water use and renewals expense was weak.
4.1.4. Conclusion
In conclusion, regression analysis results of did not support that historical costs other than
distribution system electricity costs vary with water use. To further explore the variability of
historical costs and water use, the agreed scope for Stage Two had to be progressively expanded
during the course of the analysis. Specifically, additional analysis scope other than the expanded
regression analysis referred to in sections 4.1. and 4.1.3 included, without limitation:
► analysis of quarterly historical costs, in addition to analysing annual historical costs;
► analysis quarterly historical costs by sub-activity and expenditure type;
► ‘classical’ time series decomposition and seasonal indices;
► analysis of quarterly labour bookings by activity, sub-activity, expenditure type and source
(hours booked for the period July 2007 and 2011);
► analysis of historical costs and labour hours by region and depot;
► moving averages and other smoothing techniques; and
► construction of two models, to enable the extended historical analysis of expense and labour
hours to the level of detail outlined above. The models incorporate approximately one hundred
graphs to assist in the visual interpretation of SunWater’s historical data. The models also
incorporate some high level correlation analysis of historical base data. At the request of the
Queensland Competition Authority, the models have been extended to also incorporate high
level correlation analysis of four period moving averages for selected expense and labour
hours data (smoothed historical data).
The results of this additional analysis are commented on in the following sections 4.2 to 4.4 and in
Appendices F, G and H.
4.2. Analysis of Historical costs by Activities
The relative materiality of the expense of SunWater’s overall key irrigation related activities over
the past 5 years (2006/07 to 2010/2011) is illustrated in figure 4.2.1.
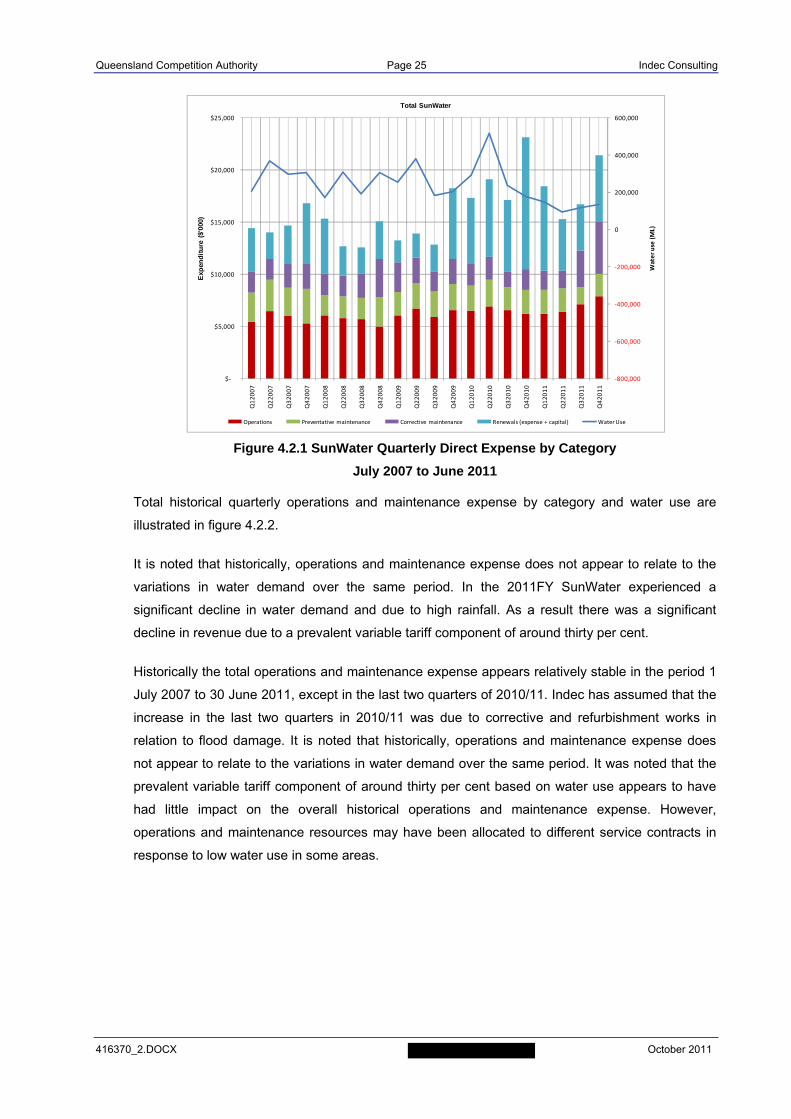
Queensland Competition Authority Page 25 Indec Consulting
416370_2.DOCX October 2011
Figure 4.2.1 SunWater Quarterly Direct Expense by Category
July 2007 to June 2011
Total historical quarterly operations and maintenance expense by category and water use are
illustrated in figure 4.2.2.
It is noted that historically, operations and maintenance expense does not appear to relate to the
variations in water demand over the same period. In the 2011FY SunWater experienced a
significant decline in water demand and due to high rainfall. As a result there was a significant
decline in revenue due to a prevalent variable tariff component of around thirty per cent.
Historically the total operations and maintenance expense appears relatively stable in the period 1
July 2007 to 30 June 2011, except in the last two quarters of 2010/11. Indec has assumed that the
increase in the last two quarters in 2010/11 was due to corrective and refurbishment works in
relation to flood damage. It is noted that historically, operations and maintenance expense does
not appear to relate to the variations in water demand over the same period. It was noted that the
prevalent variable tariff component of around thirty per cent based on water use appears to have
had little impact on the overall historical operations and maintenance expense. However,
operations and maintenance resources may have been allocated to different service contracts in
response to low water use in some areas.
‐800,000
‐600,000
‐400,000
‐200,000
0
200,000
400,000
600,000
$‐
$5,000
$10,000
$15,000
$20,000
$25,000
Q12007
Q22007
Q32007
Q42007
Q12008
Q22008
Q32008
Q42008
Q12009
Q22009
Q32009
Q42009
Q12010
Q22010
Q32010
Q42010
Q12011
Q22011
Q32011
Q42011
Water use (ML)
Exp
end
itu
re (
$'00
0)
Total SunWater
Operations Preventative maintenance Corrective maintenance Renewals (expense + capital) Water Use
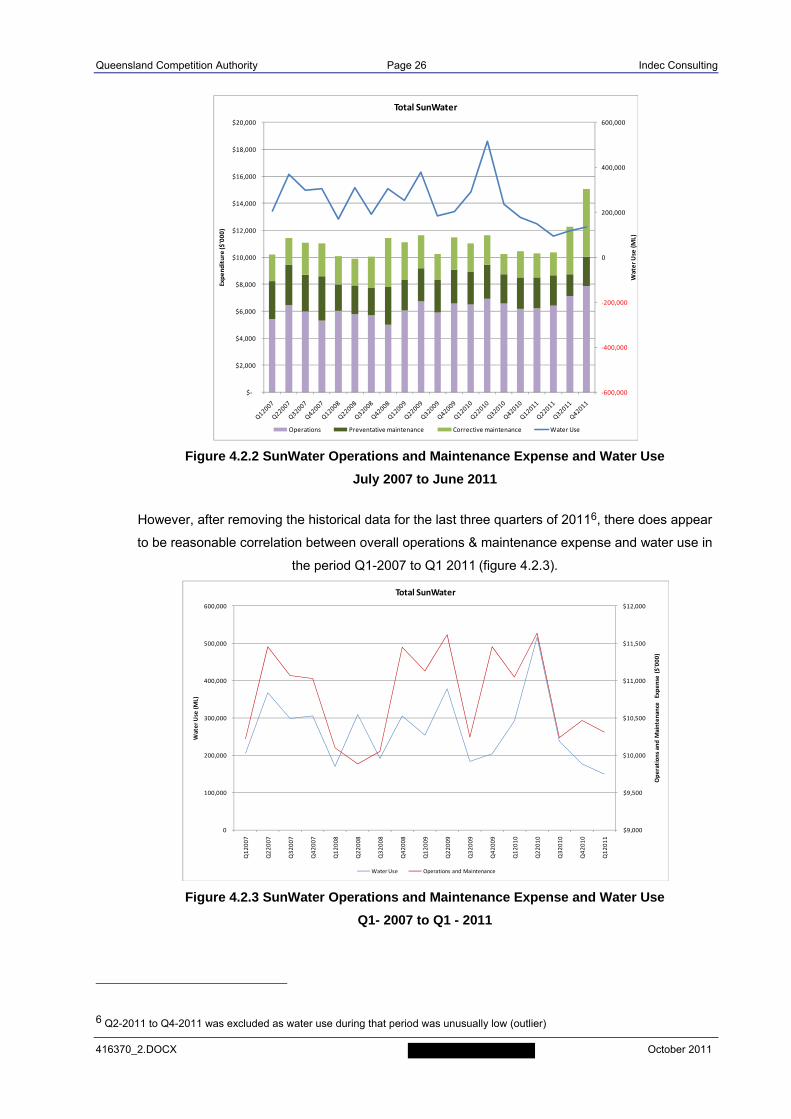
Queensland Competition Authority Page 26 Indec Consulting
416370_2.DOCX October 2011
Figure 4.2.2 SunWater Operations and Maintenance Expense and Water Use
July 2007 to June 2011
However, after removing the historical data for the last three quarters of 20116, there does appear
to be reasonable correlation between overall operations & maintenance expense and water use in
the period Q1-2007 to Q1 2011 (figure 4.2.3).
Figure 4.2.3 SunWater Operations and Maintenance Expense and Water Use
Q1- 2007 to Q1 - 2011
6 Q2-2011 to Q4-2011 was excluded as water use during that period was unusually low (outlier)
‐600,000
‐400,000
‐200,000
0
200,000
400,000
600,000
$‐
$2,000
$4,000
$6,000
$8,000
$10,000
$12,000
$14,000
$16,000
$18,000
$20,000
Water Use (ML)
Expenditure ($'000)
Total SunWater
Operations Preventative maintenance Corrective maintenance Water Use
$9,000
$9,500
$10,000
$10,500
$11,000
$11,500
$12,000
0
100,000
200,000
300,000
400,000
500,000
600,000
Q12007
Q22007
Q32007
Q42007
Q12008
Q22008
Q32008
Q42008
Q12009
Q22009
Q32009
Q42009
Q12010
Q22010
Q32010
Q42010
Q12011
Operations and M
aintenance Expense ($'000)
Water Use (ML)
Total SunWater
Water Use Operations and Maintenance
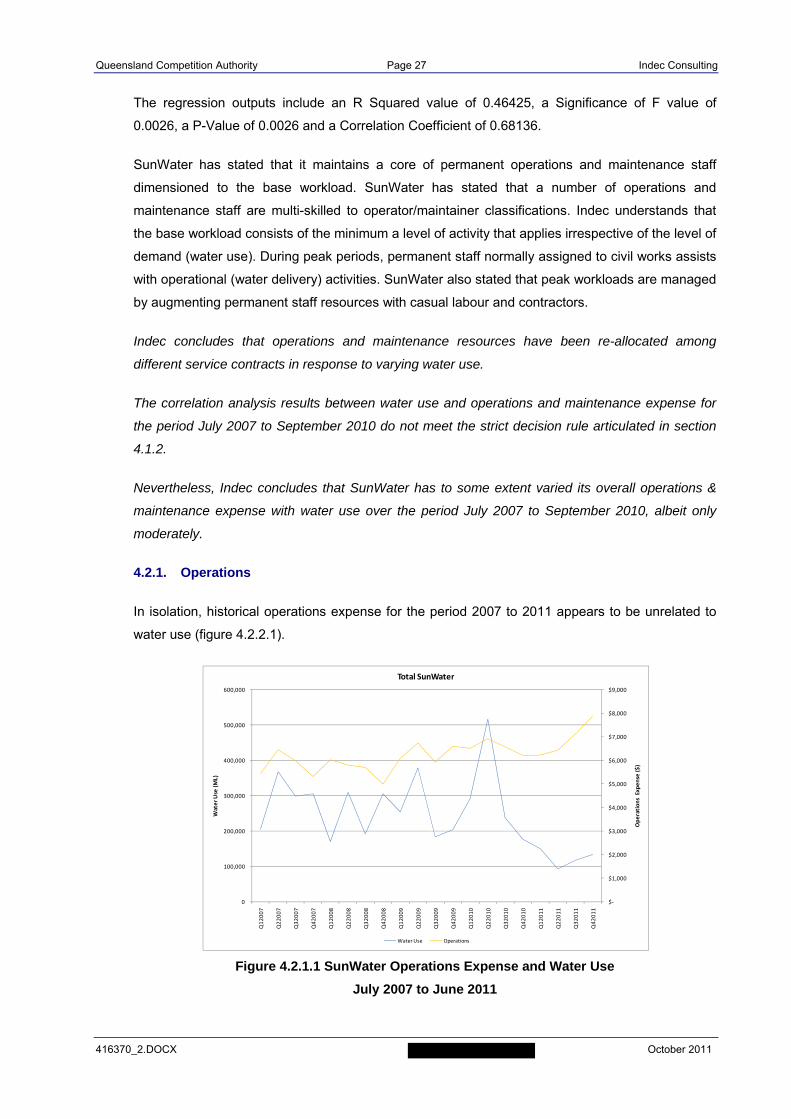
Queensland Competition Authority Page 27 Indec Consulting
416370_2.DOCX October 2011
The regression outputs include an R Squared value of 0.46425, a Significance of F value of
0.0026, a P-Value of 0.0026 and a Correlation Coefficient of 0.68136.
SunWater has stated that it maintains a core of permanent operations and maintenance staff
dimensioned to the base workload. SunWater has stated that a number of operations and
maintenance staff are multi-skilled to operator/maintainer classifications. Indec understands that
the base workload consists of the minimum a level of activity that applies irrespective of the level of
demand (water use). During peak periods, permanent staff normally assigned to civil works assists
with operational (water delivery) activities. SunWater also stated that peak workloads are managed
by augmenting permanent staff resources with casual labour and contractors.
Indec concludes that operations and maintenance resources have been re-allocated among
different service contracts in response to varying water use.
The correlation analysis results between water use and operations and maintenance expense for
the period July 2007 to September 2010 do not meet the strict decision rule articulated in section
4.1.2.
Nevertheless, Indec concludes that SunWater has to some extent varied its overall operations &
maintenance expense with water use over the period July 2007 to September 2010, albeit only
moderately.
4.2.1. Operations
In isolation, historical operations expense for the period 2007 to 2011 appears to be unrelated to
water use (figure 4.2.2.1).
Figure 4.2.1.1 SunWater Operations Expense and Water Use
July 2007 to June 2011
$‐
$1,000
$2,000
$3,000
$4,000
$5,000
$6,000
$7,000
$8,000
$9,000
0
100,000
200,000
300,000
400,000
500,000
600,000
Q12007
Q22007
Q32007
Q42007
Q12008
Q22008
Q32008
Q42008
Q12009
Q22009
Q32009
Q42009
Q12010
Q22010
Q32010
Q42010
Q12011
Q22011
Q32011
Q42011
Operations Expense ($)
Water Use (ML)
Total SunWater
Water Use Operations
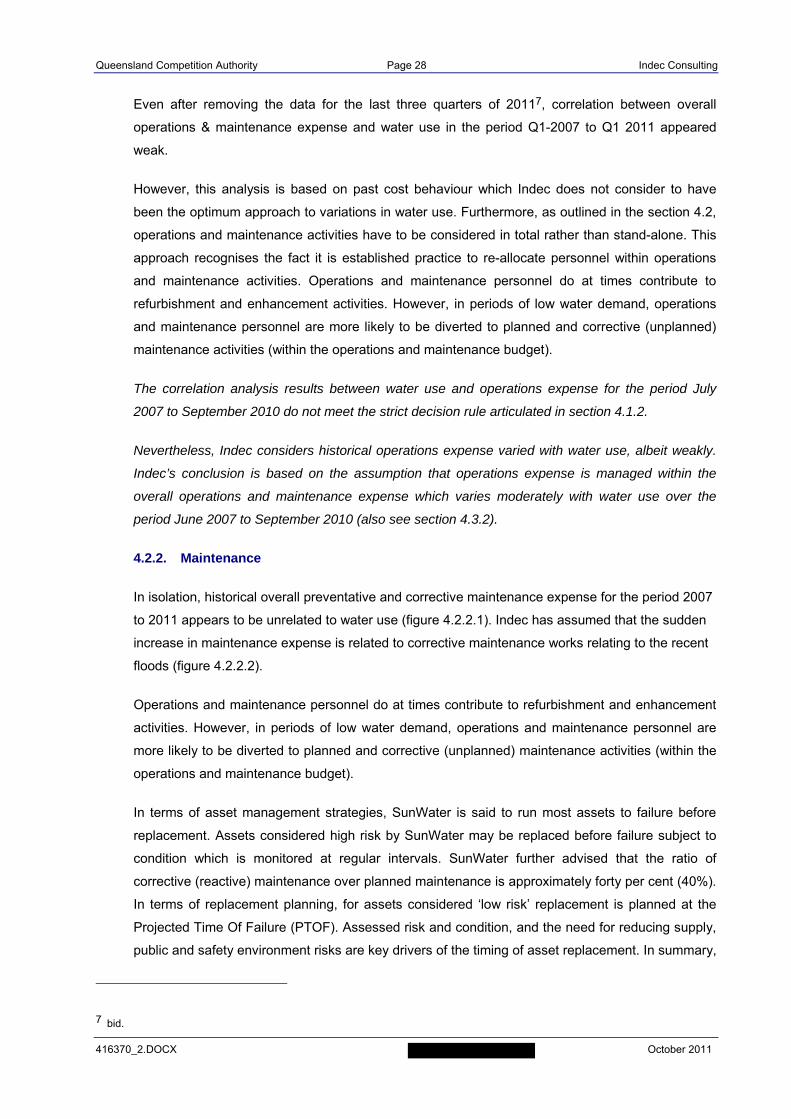
Queensland Competition Authority Page 28 Indec Consulting
416370_2.DOCX October 2011
Even after removing the data for the last three quarters of 20117, correlation between overall
operations & maintenance expense and water use in the period Q1-2007 to Q1 2011 appeared
weak.
However, this analysis is based on past cost behaviour which Indec does not consider to have
been the optimum approach to variations in water use. Furthermore, as outlined in the section 4.2,
operations and maintenance activities have to be considered in total rather than stand-alone. This
approach recognises the fact it is established practice to re-allocate personnel within operations
and maintenance activities. Operations and maintenance personnel do at times contribute to
refurbishment and enhancement activities. However, in periods of low water demand, operations
and maintenance personnel are more likely to be diverted to planned and corrective (unplanned)
maintenance activities (within the operations and maintenance budget).
The correlation analysis results between water use and operations expense for the period July
2007 to September 2010 do not meet the strict decision rule articulated in section 4.1.2.
Nevertheless, Indec considers historical operations expense varied with water use, albeit weakly.
Indec’s conclusion is based on the assumption that operations expense is managed within the
overall operations and maintenance expense which varies moderately with water use over the
period June 2007 to September 2010 (also see section 4.3.2).
4.2.2. Maintenance
In isolation, historical overall preventative and corrective maintenance expense for the period 2007
to 2011 appears to be unrelated to water use (figure 4.2.2.1). Indec has assumed that the sudden
increase in maintenance expense is related to corrective maintenance works relating to the recent
floods (figure 4.2.2.2).
Operations and maintenance personnel do at times contribute to refurbishment and enhancement
activities. However, in periods of low water demand, operations and maintenance personnel are
more likely to be diverted to planned and corrective (unplanned) maintenance activities (within the
operations and maintenance budget).
In terms of asset management strategies, SunWater is said to run most assets to failure before
replacement. Assets considered high risk by SunWater may be replaced before failure subject to
condition which is monitored at regular intervals. SunWater further advised that the ratio of
corrective (reactive) maintenance over planned maintenance is approximately forty per cent (40%).
In terms of replacement planning, for assets considered ‘low risk’ replacement is planned at the
Projected Time Of Failure (PTOF). Assessed risk and condition, and the need for reducing supply,
public and safety environment risks are key drivers of the timing of asset replacement. In summary,
7 bid.
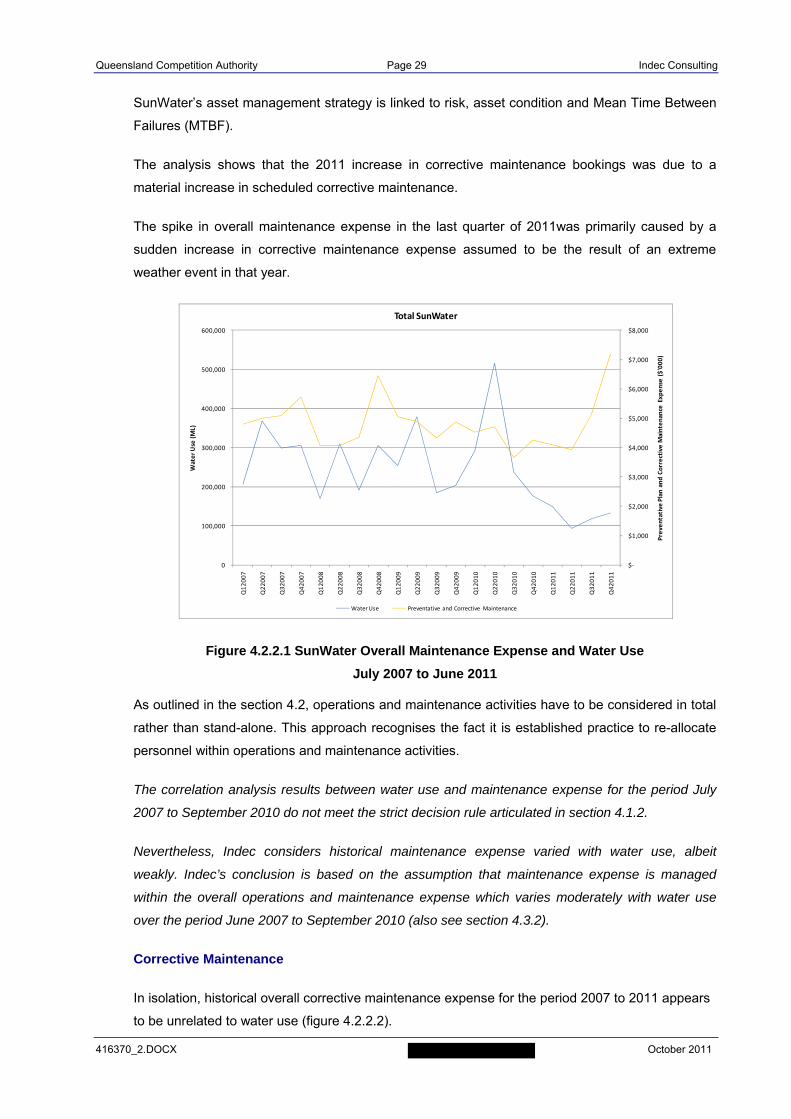
Queensland Competition Authority Page 29 Indec Consulting
416370_2.DOCX October 2011
SunWater’s asset management strategy is linked to risk, asset condition and Mean Time Between
Failures (MTBF).
The analysis shows that the 2011 increase in corrective maintenance bookings was due to a
material increase in scheduled corrective maintenance.
The spike in overall maintenance expense in the last quarter of 2011was primarily caused by a
sudden increase in corrective maintenance expense assumed to be the result of an extreme
weather event in that year.
Figure 4.2.2.1 SunWater Overall Maintenance Expense and Water Use
July 2007 to June 2011
As outlined in the section 4.2, operations and maintenance activities have to be considered in total
rather than stand-alone. This approach recognises the fact it is established practice to re-allocate
personnel within operations and maintenance activities.
The correlation analysis results between water use and maintenance expense for the period July
2007 to September 2010 do not meet the strict decision rule articulated in section 4.1.2.
Nevertheless, Indec considers historical maintenance expense varied with water use, albeit
weakly. Indec’s conclusion is based on the assumption that maintenance expense is managed
within the overall operations and maintenance expense which varies moderately with water use
over the period June 2007 to September 2010 (also see section 4.3.2).
Corrective Maintenance
In isolation, historical overall corrective maintenance expense for the period 2007 to 2011 appears
to be unrelated to water use (figure 4.2.2.2).
$‐
$1,000
$2,000
$3,000
$4,000
$5,000
$6,000
$7,000
$8,000
0
100,000
200,000
300,000
400,000
500,000
600,000
Q12007
Q22007
Q32007
Q42007
Q12008
Q22008
Q32008
Q42008
Q12009
Q22009
Q32009
Q42009
Q12010
Q22010
Q32010
Q42010
Q12011
Q22011
Q32011
Q42011
Preventative
Plan and Corrective M
aintenance Expense ($'000)
Water Use (ML)
Total SunWater
Water Use Preventative and Corrective Maintenance
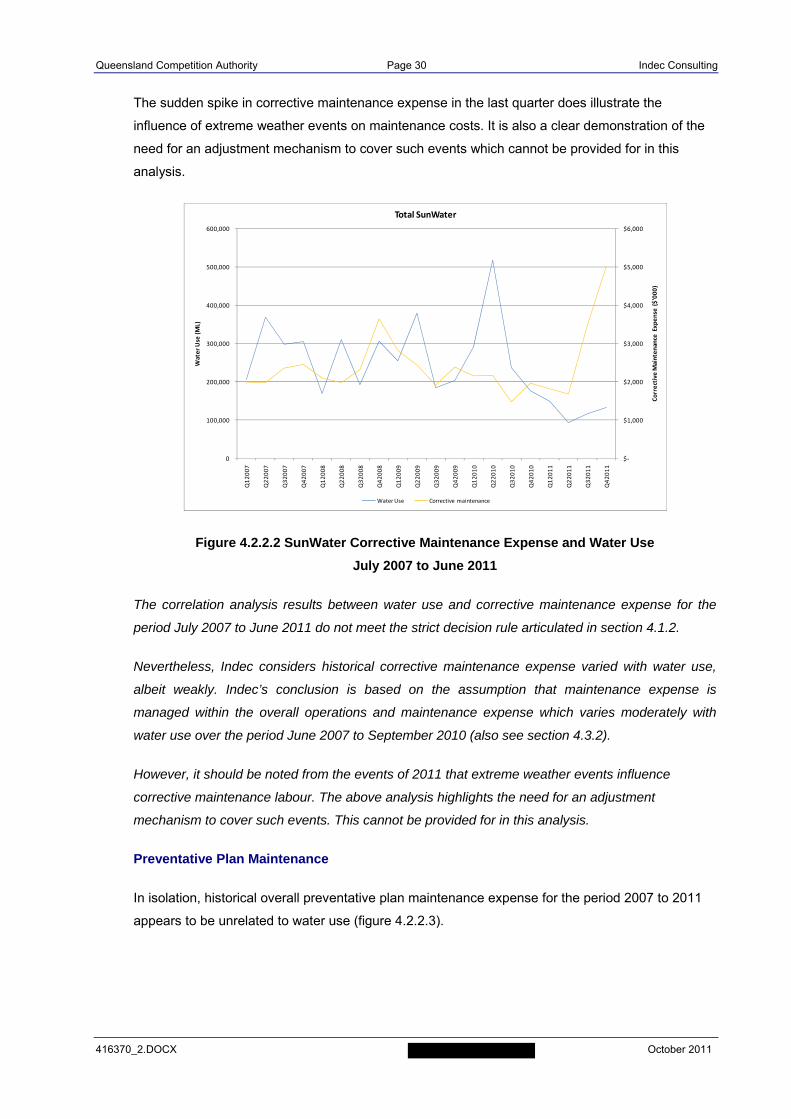
Queensland Competition Authority Page 30 Indec Consulting
416370_2.DOCX October 2011
The sudden spike in corrective maintenance expense in the last quarter does illustrate the
influence of extreme weather events on maintenance costs. It is also a clear demonstration of the
need for an adjustment mechanism to cover such events which cannot be provided for in this
analysis.
Figure 4.2.2.2 SunWater Corrective Maintenance Expense and Water Use
July 2007 to June 2011
The correlation analysis results between water use and corrective maintenance expense for the
period July 2007 to June 2011 do not meet the strict decision rule articulated in section 4.1.2.
Nevertheless, Indec considers historical corrective maintenance expense varied with water use,
albeit weakly. Indec’s conclusion is based on the assumption that maintenance expense is
managed within the overall operations and maintenance expense which varies moderately with
water use over the period June 2007 to September 2010 (also see section 4.3.2).
However, it should be noted from the events of 2011 that extreme weather events influence
corrective maintenance labour. The above analysis highlights the need for an adjustment
mechanism to cover such events. This cannot be provided for in this analysis.
Preventative Plan Maintenance
In isolation, historical overall preventative plan maintenance expense for the period 2007 to 2011
appears to be unrelated to water use (figure 4.2.2.3).
$‐
$1,000
$2,000
$3,000
$4,000
$5,000
$6,000
0
100,000
200,000
300,000
400,000
500,000
600,000
Q12007
Q22007
Q32007
Q42007
Q12008
Q22008
Q32008
Q42008
Q12009
Q22009
Q32009
Q42009
Q12010
Q22010
Q32010
Q42010
Q12011
Q22011
Q32011
Q42011
Corrective Maintenance Expense ($'000)
Water Use (ML)
Total SunWater
Water Use Corrective maintenance
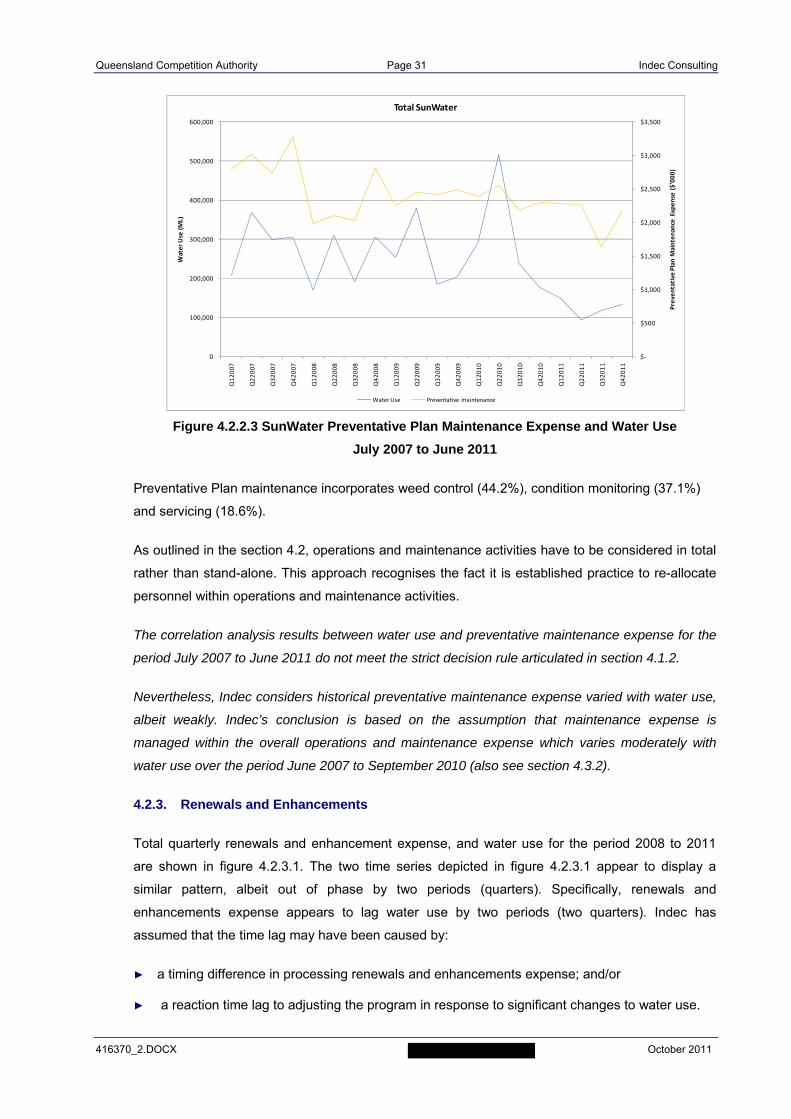
Queensland Competition Authority Page 31 Indec Consulting
416370_2.DOCX October 2011
Figure 4.2.2.3 SunWater Preventative Plan Maintenance Expense and Water Use
July 2007 to June 2011
Preventative Plan maintenance incorporates weed control (44.2%), condition monitoring (37.1%)
and servicing (18.6%).
As outlined in the section 4.2, operations and maintenance activities have to be considered in total
rather than stand-alone. This approach recognises the fact it is established practice to re-allocate
personnel within operations and maintenance activities.
The correlation analysis results between water use and preventative maintenance expense for the
period July 2007 to June 2011 do not meet the strict decision rule articulated in section 4.1.2.
Nevertheless, Indec considers historical preventative maintenance expense varied with water use,
albeit weakly. Indec’s conclusion is based on the assumption that maintenance expense is
managed within the overall operations and maintenance expense which varies moderately with
water use over the period June 2007 to September 2010 (also see section 4.3.2).
4.2.3. Renewals and Enhancements
Total quarterly renewals and enhancement expense, and water use for the period 2008 to 2011
are shown in figure 4.2.3.1. The two time series depicted in figure 4.2.3.1 appear to display a
similar pattern, albeit out of phase by two periods (quarters). Specifically, renewals and
enhancements expense appears to lag water use by two periods (two quarters). Indec has
assumed that the time lag may have been caused by:
► a timing difference in processing renewals and enhancements expense; and/or
► a reaction time lag to adjusting the program in response to significant changes to water use.
$‐
$500
$1,000
$1,500
$2,000
$2,500
$3,000
$3,500
0
100,000
200,000
300,000
400,000
500,000
600,000
Q12007
Q22007
Q32007
Q42007
Q12008
Q22008
Q32008
Q42008
Q12009
Q22009
Q32009
Q42009
Q12010
Q22010
Q32010
Q42010
Q12011
Q22011
Q32011
Q42011
Preventative
Plan M
aintenance Expense ($'000)
Water Use (ML)
Total SunWater
Water Use Preventative maintenance

Queensland Competition Authority Page 32 Indec Consulting
416370_2.DOCX October 2011
Figure 4.2.3.1 SunWater Renewals an Enhancements Expense and Water Use
July 2007 to June 2011
However, after removing the historical data for the last three quarters of 20118 and advancing the
water use time series by two periods (quarters) there does appear to have been some correlation
between renewals and enhancements expense and water use in the period Q3 - 2007 to Q1 - 2011
(figure 4.2.3.2).
The regression analysis outputs include an R Squared value of 0.32941, a Significance of F value
of 0.02527, a P-Value of 0.02527 and a Correlation Coefficient of 0.57394. The results suggest
that historically some relationship existed at times between renewals and enhancements expense,
and water use, albeit a weak one.
R&E activities are subject to a priority ranking. Priority 1 refurbishment and enhancement projects
must typically be completed within a budget year. Priority 2 refurbishment and enhancement
projects are preferably completed within a budget year but may be deferred or substituted by
alternative projects. In periods of low water demand, operations and maintenance personnel is
more likely to be diverted to planned and corrective (unplanned) maintenance activities than to
refurbishment and enhancement activities.
SunWater advised that Renewals and Enhancement (R&E) expenditure in the 2010/11 year was in
line with budget expectations even though flood damage rectification work had to be absorbed. As
a result, some budgeted R&E works had to be deferred.
8 Q2-2011 to Q4-2011 was excluded as water use during that period was unusually low (outlier)
$‐
$2,000
$4,000
$6,000
$8,000
$10,000
$12,000
$14,000
0
100,000
200,000
300,000
400,000
500,000
600,000
Q12007
Q22007
Q32007
Q42007
Q12008
Q22008
Q32008
Q42008
Q12009
Q22009
Q32009
Q42009
Q12010
Q22010
Q32010
Q42010
Q12011
Q22011
Q32011
Q42011
Renewals Expense ($'000)
Water Use (ML)
Total SunWater
Water Use Renewals (expense + capital)
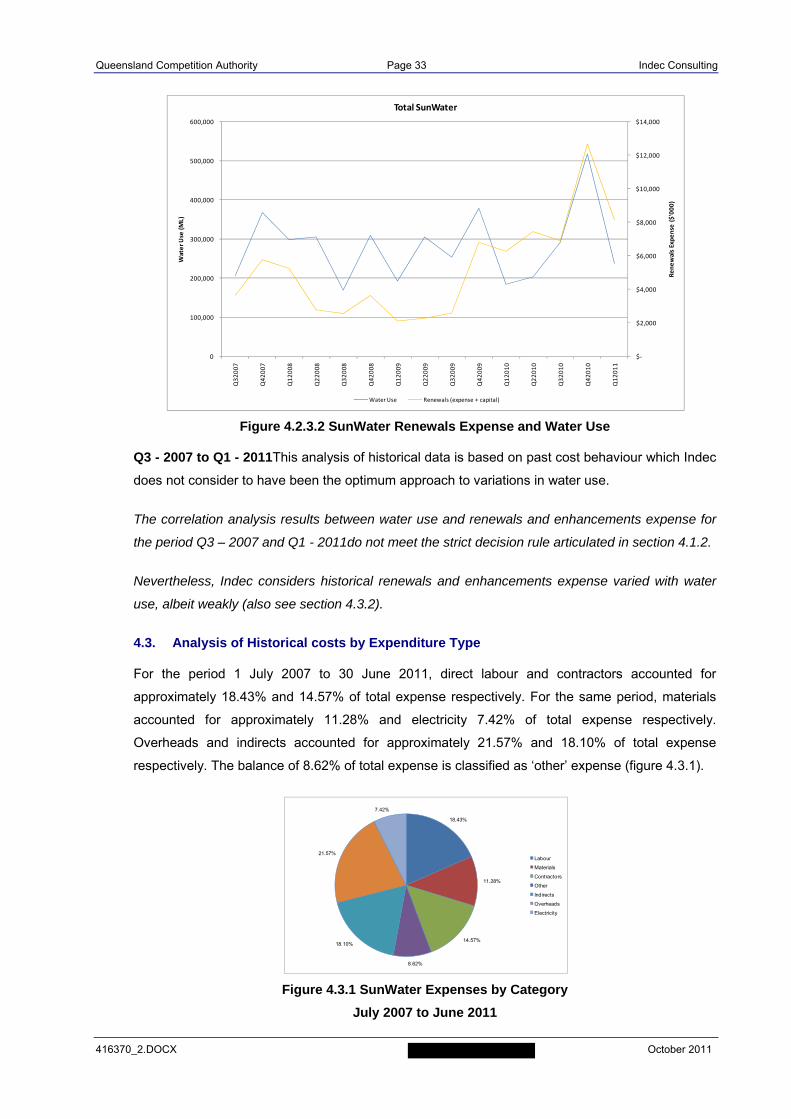
Queensland Competition Authority Page 33 Indec Consulting
416370_2.DOCX October 2011
Figure 4.2.3.2 SunWater Renewals Expense and Water Use
Q3 - 2007 to Q1 - 2011This analysis of historical data is based on past cost behaviour which Indec
does not consider to have been the optimum approach to variations in water use.
The correlation analysis results between water use and renewals and enhancements expense for
the period Q3 – 2007 and Q1 - 2011do not meet the strict decision rule articulated in section 4.1.2.
Nevertheless, Indec considers historical renewals and enhancements expense varied with water
use, albeit weakly (also see section 4.3.2).
4.3. Analysis of Historical costs by Expenditure Type
For the period 1 July 2007 to 30 June 2011, direct labour and contractors accounted for
approximately 18.43% and 14.57% of total expense respectively. For the same period, materials
accounted for approximately 11.28% and electricity 7.42% of total expense respectively.
Overheads and indirects accounted for approximately 21.57% and 18.10% of total expense
respectively. The balance of 8.62% of total expense is classified as ‘other’ expense (figure 4.3.1).
Figure 4.3.1 SunWater Expenses by Category
July 2007 to June 2011
$‐
$2,000
$4,000
$6,000
$8,000
$10,000
$12,000
$14,000
0
100,000
200,000
300,000
400,000
500,000
600,000
Q32007
Q42007
Q12008
Q22008
Q32008
Q42008
Q12009
Q22009
Q32009
Q42009
Q12010
Q22010
Q32010
Q42010
Q12011
Renewals Expense ($'000)
Water Use (ML)
Total SunWater
Water Use Renewals (expense + capital)
18.43%
11.28%
14.57%
8.62%
18.10%
21.57%
7.42%
Labour
Materials
Contractors
Other
Indirects
Overheads
Electricity
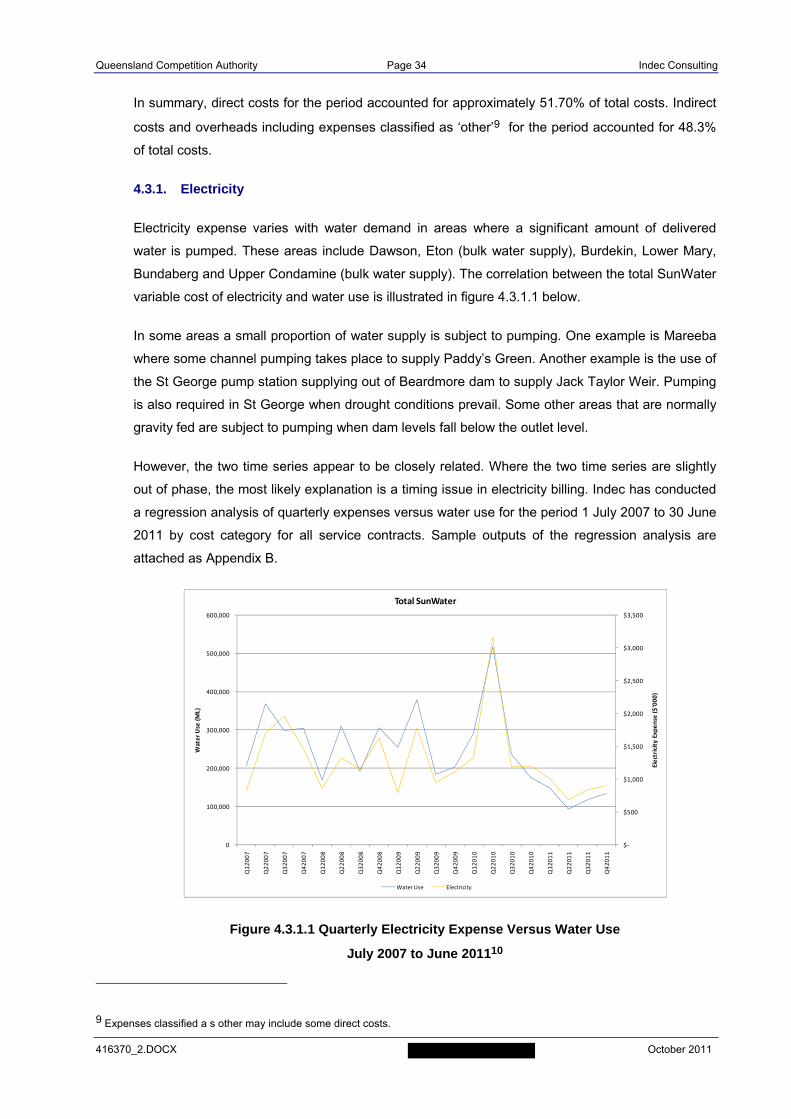
Queensland Competition Authority Page 34 Indec Consulting
416370_2.DOCX October 2011
In summary, direct costs for the period accounted for approximately 51.70% of total costs. Indirect
costs and overheads including expenses classified as ‘other’9 for the period accounted for 48.3%
of total costs.
4.3.1. Electricity
Electricity expense varies with water demand in areas where a significant amount of delivered
water is pumped. These areas include Dawson, Eton (bulk water supply), Burdekin, Lower Mary,
Bundaberg and Upper Condamine (bulk water supply). The correlation between the total SunWater
variable cost of electricity and water use is illustrated in figure 4.3.1.1 below.
In some areas a small proportion of water supply is subject to pumping. One example is Mareeba
where some channel pumping takes place to supply Paddy’s Green. Another example is the use of
the St George pump station supplying out of Beardmore dam to supply Jack Taylor Weir. Pumping
is also required in St George when drought conditions prevail. Some other areas that are normally
gravity fed are subject to pumping when dam levels fall below the outlet level.
However, the two time series appear to be closely related. Where the two time series are slightly
out of phase, the most likely explanation is a timing issue in electricity billing. Indec has conducted
a regression analysis of quarterly expenses versus water use for the period 1 July 2007 to 30 June
2011 by cost category for all service contracts. Sample outputs of the regression analysis are
attached as Appendix B.
Figure 4.3.1.1 Quarterly Electricity Expense Versus Water Use
July 2007 to June 201110
9 Expenses classified a s other may include some direct costs.
$‐
$500
$1,000
$1,500
$2,000
$2,500
$3,000
$3,500
0
100,000
200,000
300,000
400,000
500,000
600,000
Q12007
Q22007
Q32007
Q42007
Q12008
Q22008
Q32008
Q42008
Q12009
Q22009
Q32009
Q42009
Q12010
Q22010
Q32010
Q42010
Q12011
Q22011
Q32011
Q42011
Electricity Expense ($'000)
Water Use (ML)
Total SunWater
Water Use Electricity
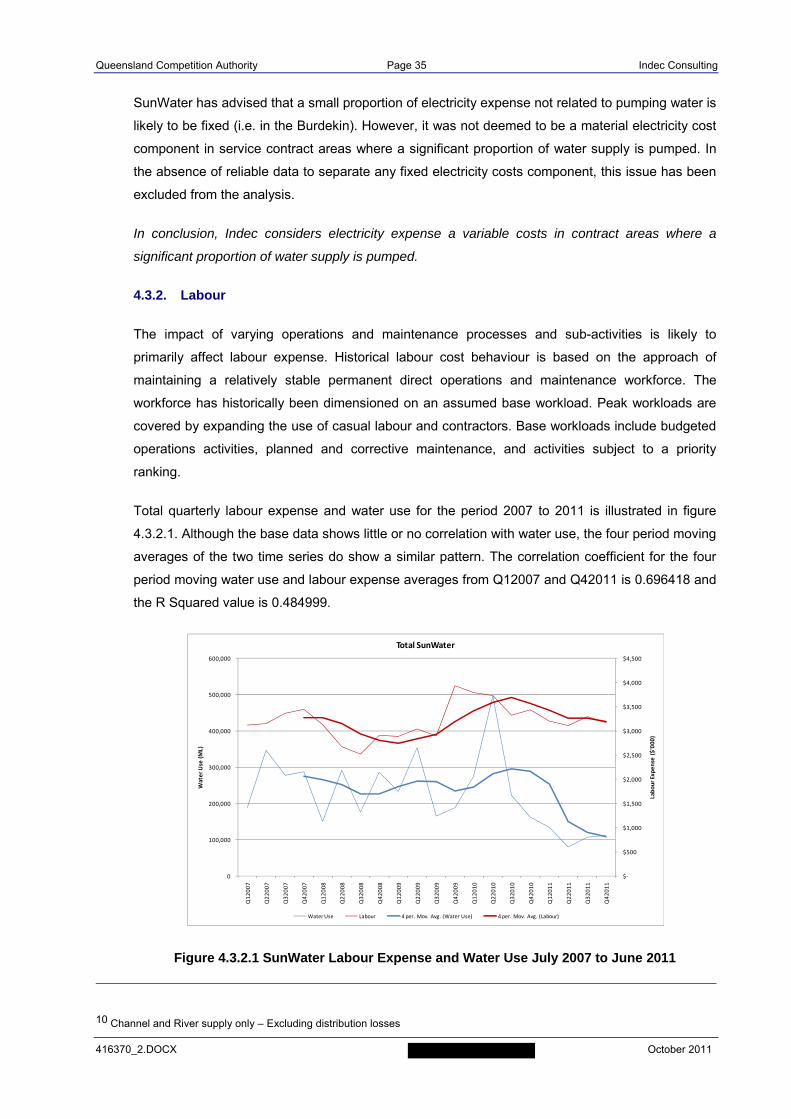
Queensland Competition Authority Page 35 Indec Consulting
416370_2.DOCX October 2011
SunWater has advised that a small proportion of electricity expense not related to pumping water is
likely to be fixed (i.e. in the Burdekin). However, it was not deemed to be a material electricity cost
component in service contract areas where a significant proportion of water supply is pumped. In
the absence of reliable data to separate any fixed electricity costs component, this issue has been
excluded from the analysis.
In conclusion, Indec considers electricity expense a variable costs in contract areas where a
significant proportion of water supply is pumped.
4.3.2. Labour
The impact of varying operations and maintenance processes and sub-activities is likely to
primarily affect labour expense. Historical labour cost behaviour is based on the approach of
maintaining a relatively stable permanent direct operations and maintenance workforce. The
workforce has historically been dimensioned on an assumed base workload. Peak workloads are
covered by expanding the use of casual labour and contractors. Base workloads include budgeted
operations activities, planned and corrective maintenance, and activities subject to a priority
ranking.
Total quarterly labour expense and water use for the period 2007 to 2011 is illustrated in figure
4.3.2.1. Although the base data shows little or no correlation with water use, the four period moving
averages of the two time series do show a similar pattern. The correlation coefficient for the four
period moving water use and labour expense averages from Q12007 and Q42011 is 0.696418 and
the R Squared value is 0.484999.
Figure 4.3.2.1 SunWater Labour Expense and Water Use July 2007 to June 2011
10 Channel and River supply only – Excluding distribution losses
$‐
$500
$1,000
$1,500
$2,000
$2,500
$3,000
$3,500
$4,000
$4,500
0
100,000
200,000
300,000
400,000
500,000
600,000
Q12007
Q22007
Q32007
Q42007
Q12008
Q22008
Q32008
Q42008
Q12009
Q22009
Q32009
Q42009
Q12010
Q22010
Q32010
Q42010
Q12011
Q22011
Q32011
Q42011
Labour Expense ($'000)
Water Use (ML)
Total SunWater
Water Use Labour 4 per. Mov. Avg. (Water Use) 4 per. Mov. Avg. (Labour)
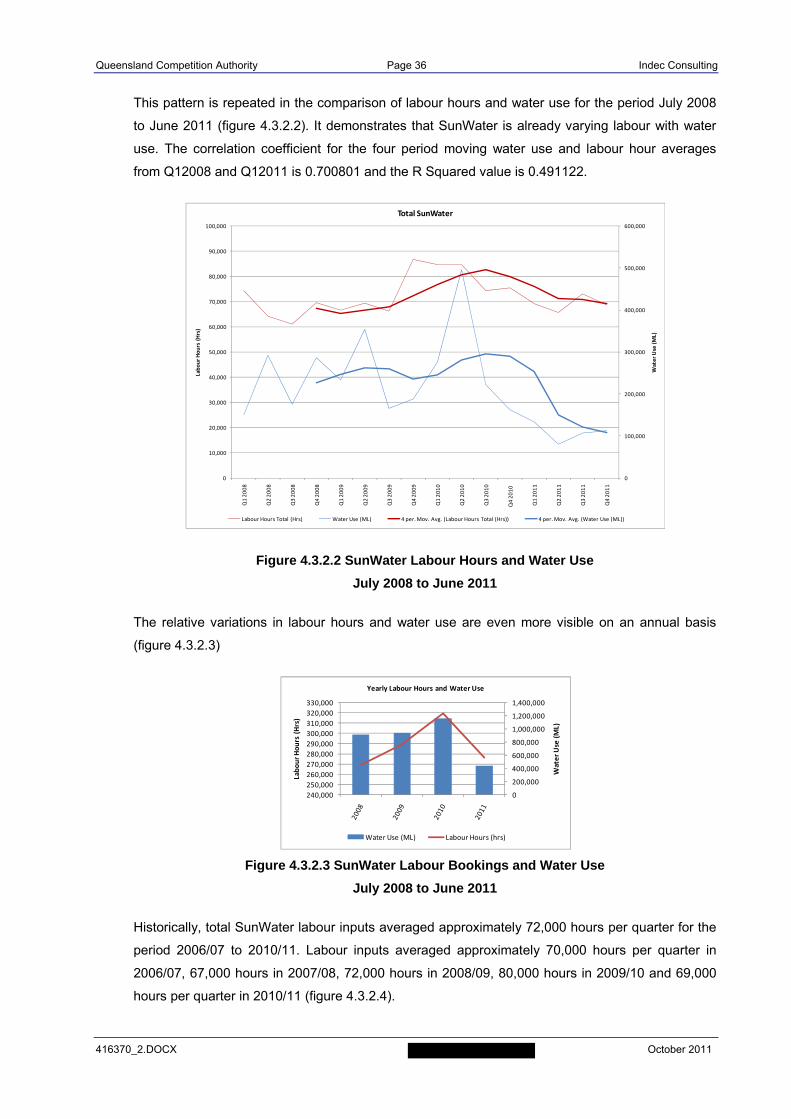
Queensland Competition Authority Page 36 Indec Consulting
416370_2.DOCX October 2011
This pattern is repeated in the comparison of labour hours and water use for the period July 2008
to June 2011 (figure 4.3.2.2). It demonstrates that SunWater is already varying labour with water
use. The correlation coefficient for the four period moving water use and labour hour averages
from Q12008 and Q12011 is 0.700801 and the R Squared value is 0.491122.
Figure 4.3.2.2 SunWater Labour Hours and Water Use
July 2008 to June 2011
The relative variations in labour hours and water use are even more visible on an annual basis
(figure 4.3.2.3)
Figure 4.3.2.3 SunWater Labour Bookings and Water Use
July 2008 to June 2011
Historically, total SunWater labour inputs averaged approximately 72,000 hours per quarter for the
period 2006/07 to 2010/11. Labour inputs averaged approximately 70,000 hours per quarter in
2006/07, 67,000 hours in 2007/08, 72,000 hours in 2008/09, 80,000 hours in 2009/10 and 69,000
hours per quarter in 2010/11 (figure 4.3.2.4).
0
100,000
200,000
300,000
400,000
500,000
600,000
0
10,000
20,000
30,000
40,000
50,000
60,000
70,000
80,000
90,000
100,000
Q1 2008
Q2 2008
Q3 2008
Q4 2008
Q1 2009
Q2 2009
Q3 2009
Q4 2009
Q1 2010
Q2 2010
Q3 2010
Q4 2010
Q1 2011
Q2 2011
Q3 2011
Q4 2011
Water Use (ML)
Labour Hours (Hrs)
Total SunWater
Labour Hours Total (Hrs) Water Use (ML) 4 per. Mov. Avg. (Labour Hours Total (Hrs)) 4 per. Mov. Avg. (Water Use (ML))
0
200,000
400,000
600,000
800,000
1,000,000
1,200,000
1,400,000
240,000
250,000
260,000
270,000
280,000
290,000
300,000
310,000
320,000
330,000
Water Use (ML)
Labour Hours (Hrs)
Yearly Labour Hours and Water Use
Water Use (ML) Labour Hours (hrs)

Queensland Competition Authority Page 37 Indec Consulting
416370_2.DOCX October 2011
Figure 4.3.2.4 SunWater Direct Labour Hours
July 2008 to June 2011
In terms of seasonality, Labour inputs averaged approximately 73,000 hours in the first quarter,
70,000 hours in the second, 69,000 hours in the third and 74,000 hours in the fourth quarter. The
apparent seasonality appears to be related to the fact that the first quarter (July to September) has
more working days and that the traditional holiday periods fall in the second and third quarter.
Water use averaged approximately 294,000 ML per quarter in 2006/07, 244,000 ML in 2007/08,
255,000 ML in 2008/09, and 306,000 ML in 2009/10 but only 123,000 ML per quarter in 2010/11
Water usage in 2010/11 was less than fifty per cent of the average annual usage for the period
2006/07 to 2009/10. (figure 4.3.2.5). In terms of seasonality, water use was highest in the second
quarter except in the 2010/11 year where water use in the first and fourth quarter was higher than
in the second and third quarter.
Figure 4.3.2.5 Water Use July 2008 to June 2011
In periods of low water demand, operations and maintenance personnel is more likely to be
diverted to planned and corrective (unplanned) maintenance activities than to refurbishment and
enhancement activities.
‐
10,000
20,000
30,000
40,000
50,000
60,000
70,000
80,000
90,000
100,000
Q1 Q2 Q3 Q4
Labour Hours
Quarter
Total SunWater Labour Hours
2006/07
2007/08
2008/09
2009/10
2010/11
0
100,000
200,000
300,000
400,000
500,000
600,000
Q1 Q2 Q3 Q4
Water Use (ML)
Total SunWater
2007 2008 2009 2010 2011
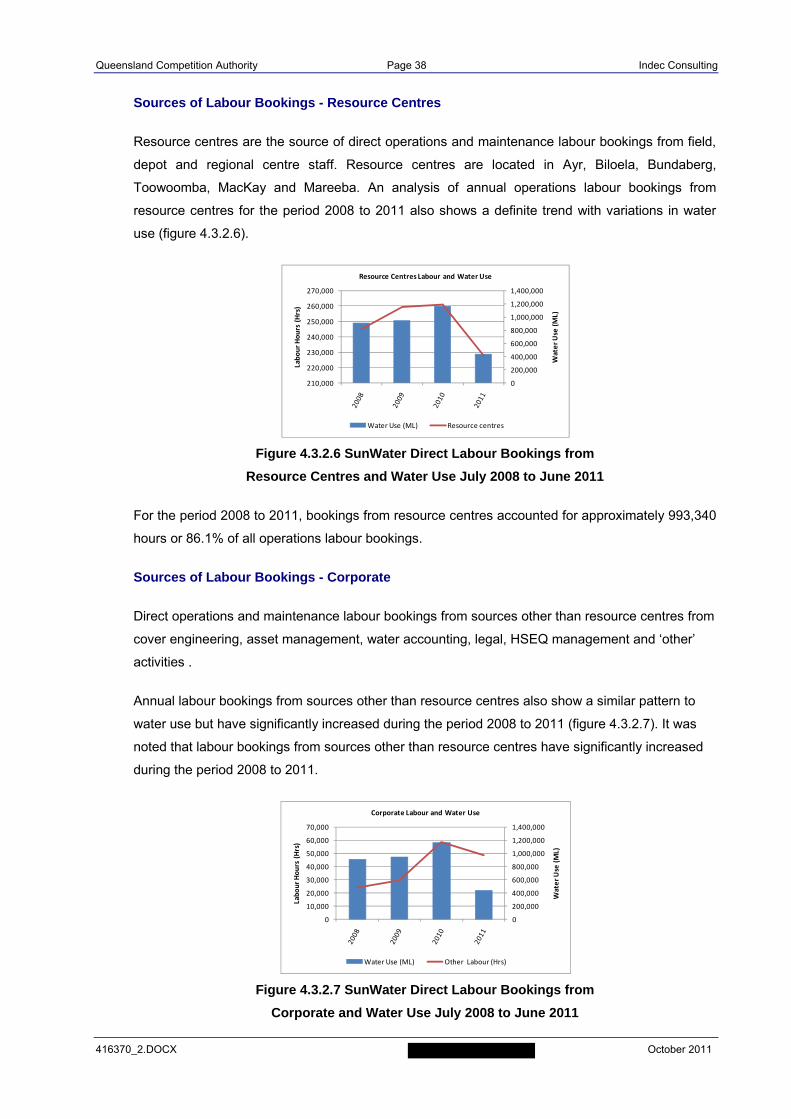
Queensland Competition Authority Page 38 Indec Consulting
416370_2.DOCX October 2011
Sources of Labour Bookings - Resource Centres
Resource centres are the source of direct operations and maintenance labour bookings from field,
depot and regional centre staff. Resource centres are located in Ayr, Biloela, Bundaberg,
Toowoomba, MacKay and Mareeba. An analysis of annual operations labour bookings from
resource centres for the period 2008 to 2011 also shows a definite trend with variations in water
use (figure 4.3.2.6).
Figure 4.3.2.6 SunWater Direct Labour Bookings from
Resource Centres and Water Use July 2008 to June 2011
For the period 2008 to 2011, bookings from resource centres accounted for approximately 993,340
hours or 86.1% of all operations labour bookings.
Sources of Labour Bookings - Corporate
Direct operations and maintenance labour bookings from sources other than resource centres from
cover engineering, asset management, water accounting, legal, HSEQ management and ‘other’
activities .
Annual labour bookings from sources other than resource centres also show a similar pattern to
water use but have significantly increased during the period 2008 to 2011 (figure 4.3.2.7). It was
noted that labour bookings from sources other than resource centres have significantly increased
during the period 2008 to 2011.
Figure 4.3.2.7 SunWater Direct Labour Bookings from
Corporate and Water Use July 2008 to June 2011
0
200,000
400,000
600,000
800,000
1,000,000
1,200,000
1,400,000
210,000
220,000
230,000
240,000
250,000
260,000
270,000
Water Use (ML)
Labour Hours (Hrs)
Resource Centres Labour and Water Use
Water Use (ML) Resource centres
0
200,000
400,000
600,000
800,000
1,000,000
1,200,000
1,400,000
0
10,000
20,000
30,000
40,000
50,000
60,000
70,000
Water Use (ML)
Labour Hours (Hrs)
Corporate Labour and Water Use
Water Use (ML) Other Labour (Hrs)

Queensland Competition Authority Page 39 Indec Consulting
416370_2.DOCX October 2011
For the period 2008 to 2011 these ‘direct’ labour bookings come from corporate support activities
accounted for 160,594 hours or 13.9% of all labour bookings. Engineering accounted for 93,307
hours or 8.1% of total labour hours, asset management for 29,875 hours or 2.6%, project
management for 1.6%, water accounting for 8,148 hours or 0.7%, legal for 4,993 hours or 0.4%
and the balance of 0.5% was divided between HSEQ management and ‘other’.
Operations
An analysis of annual operations labour bookings for the period 2008 to 2011 also shows a trend
with variations in water use, albeit less pronounced than in overall labour bookings, particularly in
the 2011 year which was subject to an extreme weather event. (figure 4.3.2.8). Operations sub-
activities include water management, scheme management, scheduling and delivering water,
customer management, workplace OH&S, environmental management, dam safety, and metering
and facility management.
The key structural changes to operations labour bookings in the period 2008 to 2011 include a
steady decline in hours booked on scheduling and delivering water, a steady increase in
operations bookings, an increase in scheme management bookings and a significant increase in
hours booked on dam safety activities in 2011.
Figure 4.3.2.8 SunWater Operations Labour Bookings and Water Use
July 2008 to June 2011
Operations labour hours cover a number of activities summarised in figure 4.3.2.9.
The analysis of operations labour bookings from resource centres also showed that there has
been a steady increase of total labour bookings to scheduling and delivering water, and scheme
management combined. The increase totalled 33.9% over the period 2008 to 2011.
The correlation analysis results between labour hours and water use for the period July 2008 to
June 2011 do not meet the strict decision rule articulated in section 4.1.2.
0
200,000
400,000
600,000
800,000
1,000,000
1,200,000
1,400,000
0
20,000
40,000
60,000
80,000
100,000
120,000
140,000
160,000
Water Use (ML)
Labour Hours (Hrs)
Yearly Ops and Water Use
Water Use (ML) Operations
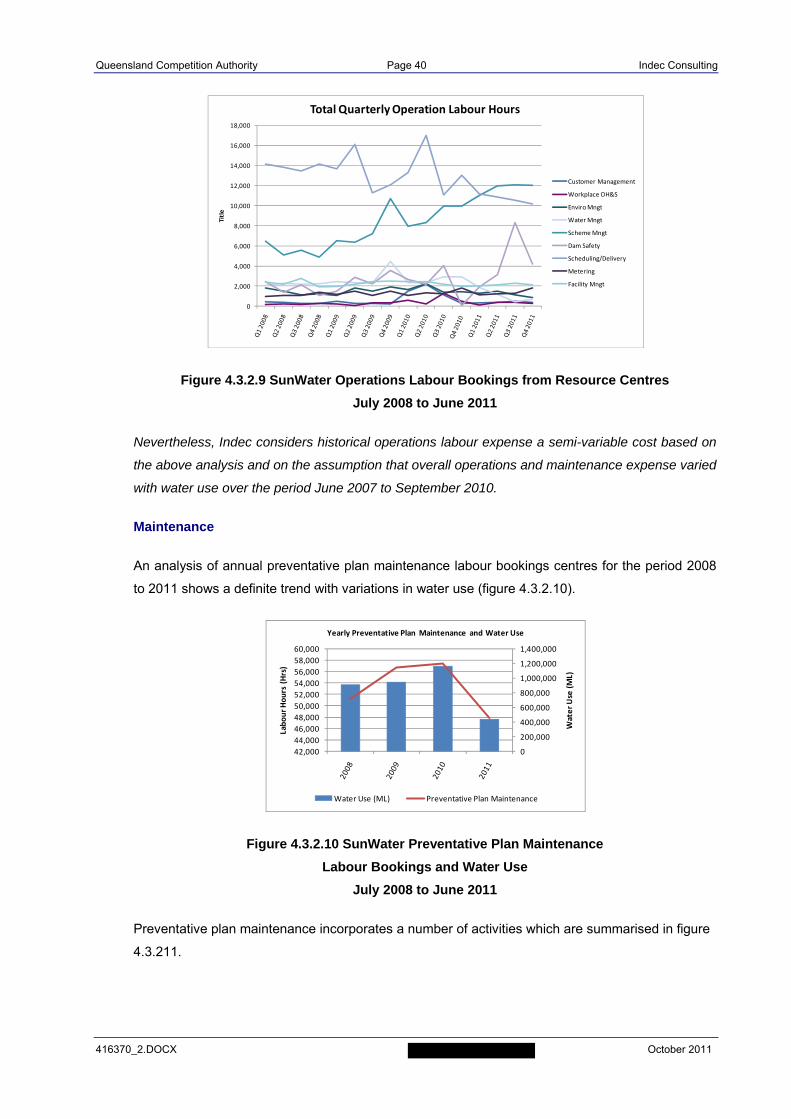
Queensland Competition Authority Page 40 Indec Consulting
416370_2.DOCX October 2011
Figure 4.3.2.9 SunWater Operations Labour Bookings from Resource Centres
July 2008 to June 2011
Nevertheless, Indec considers historical operations labour expense a semi-variable cost based on
the above analysis and on the assumption that overall operations and maintenance expense varied
with water use over the period June 2007 to September 2010.
Maintenance
An analysis of annual preventative plan maintenance labour bookings centres for the period 2008
to 2011 shows a definite trend with variations in water use (figure 4.3.2.10).
Figure 4.3.2.10 SunWater Preventative Plan Maintenance
Labour Bookings and Water Use
July 2008 to June 2011
Preventative plan maintenance incorporates a number of activities which are summarised in figure
4.3.211.
0
2,000
4,000
6,000
8,000
10,000
12,000
14,000
16,000
18,000
Title
Total Quarterly Operation Labour Hours
Customer Management
Workplace OH&S
Enviro Mngt
Water Mngt
Scheme Mngt
Dam Safety
Scheduling/Delivery
Metering
Facility Mngt
0
200,000
400,000
600,000
800,000
1,000,000
1,200,000
1,400,000
42,000
44,000
46,000
48,000
50,000
52,000
54,000
56,000
58,000
60,000
Water Use (ML)
Labour Hours (Hrs)
Yearly Preventative Plan Maintenance and Water Use
Water Use (ML) Preventative Plan Maintenance
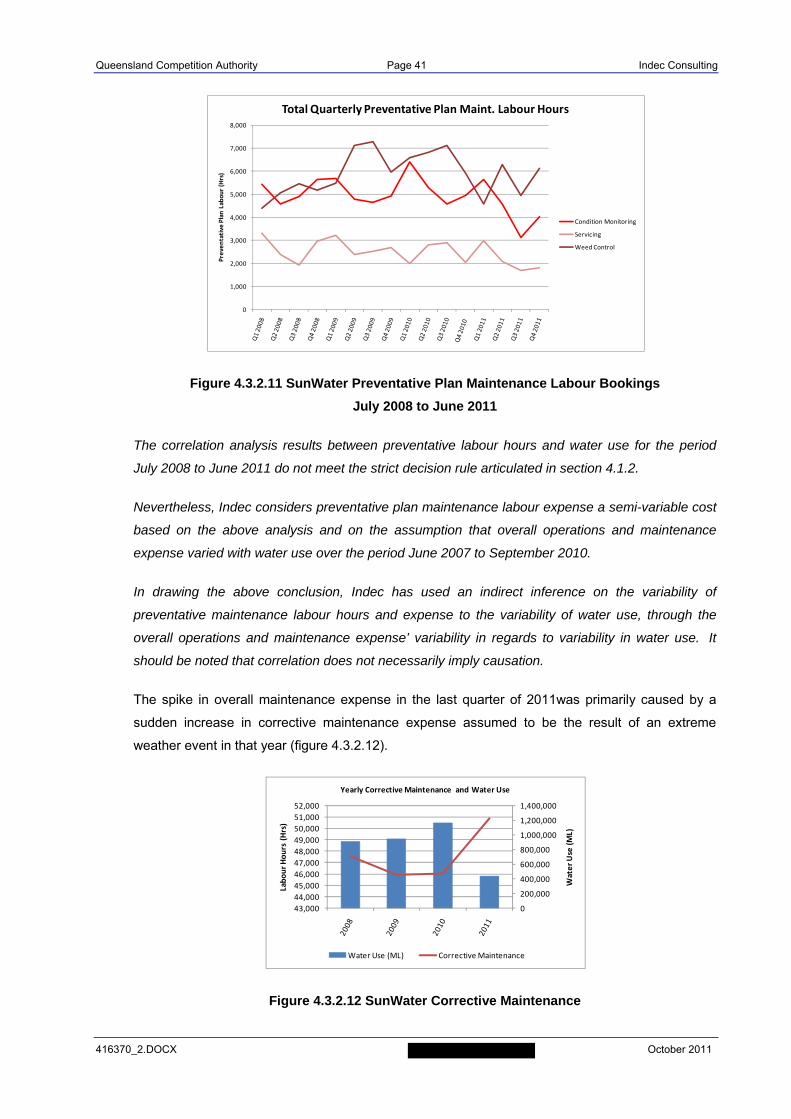
Queensland Competition Authority Page 41 Indec Consulting
416370_2.DOCX October 2011
Figure 4.3.2.11 SunWater Preventative Plan Maintenance Labour Bookings
July 2008 to June 2011
The correlation analysis results between preventative labour hours and water use for the period
July 2008 to June 2011 do not meet the strict decision rule articulated in section 4.1.2.
Nevertheless, Indec considers preventative plan maintenance labour expense a semi-variable cost
based on the above analysis and on the assumption that overall operations and maintenance
expense varied with water use over the period June 2007 to September 2010.
In drawing the above conclusion, Indec has used an indirect inference on the variability of
preventative maintenance labour hours and expense to the variability of water use, through the
overall operations and maintenance expense’ variability in regards to variability in water use. It
should be noted that correlation does not necessarily imply causation.
The spike in overall maintenance expense in the last quarter of 2011was primarily caused by a
sudden increase in corrective maintenance expense assumed to be the result of an extreme
weather event in that year (figure 4.3.2.12).
Figure 4.3.2.12 SunWater Corrective Maintenance
0
1,000
2,000
3,000
4,000
5,000
6,000
7,000
8,000
Preventative
Plan Labour (Hrs)
Total Quarterly Preventative Plan Maint. Labour Hours
Condition Monitoring
Servicing
Weed Control
0
200,000
400,000
600,000
800,000
1,000,000
1,200,000
1,400,000
43,000
44,000
45,000
46,000
47,000
48,000
49,000
50,000
51,000
52,000
Water Use (ML)
Labour Hours (Hrs)
Yearly Corrective Maintenance and Water Use
Water Use (ML) Corrective Maintenance
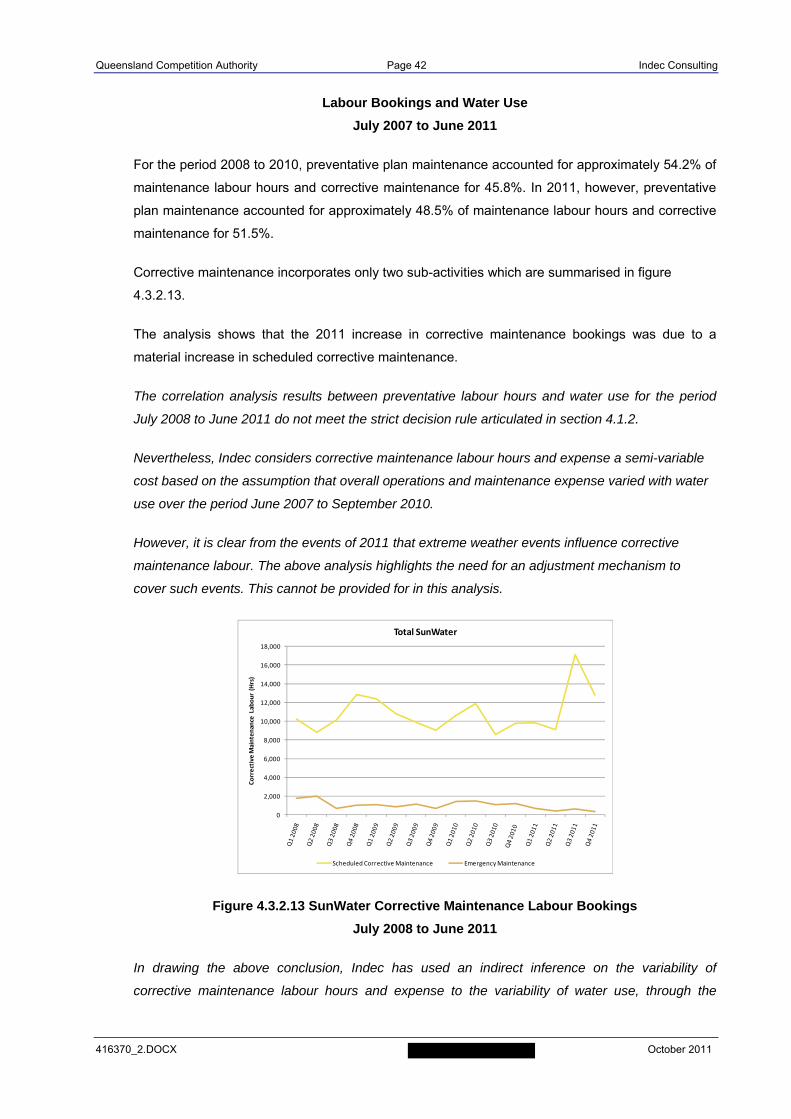
Queensland Competition Authority Page 42 Indec Consulting
416370_2.DOCX October 2011
Labour Bookings and Water Use
July 2007 to June 2011
For the period 2008 to 2010, preventative plan maintenance accounted for approximately 54.2% of
maintenance labour hours and corrective maintenance for 45.8%. In 2011, however, preventative
plan maintenance accounted for approximately 48.5% of maintenance labour hours and corrective
maintenance for 51.5%.
Corrective maintenance incorporates only two sub-activities which are summarised in figure
4.3.2.13.
The analysis shows that the 2011 increase in corrective maintenance bookings was due to a
material increase in scheduled corrective maintenance.
The correlation analysis results between preventative labour hours and water use for the period
July 2008 to June 2011 do not meet the strict decision rule articulated in section 4.1.2.
Nevertheless, Indec considers corrective maintenance labour hours and expense a semi-variable
cost based on the assumption that overall operations and maintenance expense varied with water
use over the period June 2007 to September 2010.
However, it is clear from the events of 2011 that extreme weather events influence corrective
maintenance labour. The above analysis highlights the need for an adjustment mechanism to
cover such events. This cannot be provided for in this analysis.
Figure 4.3.2.13 SunWater Corrective Maintenance Labour Bookings
July 2008 to June 2011
In drawing the above conclusion, Indec has used an indirect inference on the variability of
corrective maintenance labour hours and expense to the variability of water use, through the
0
2,000
4,000
6,000
8,000
10,000
12,000
14,000
16,000
18,000
Corrective Maintenance Labour (Hrs)
Total SunWater
Scheduled Corrective Maintenance Emergency Maintenance
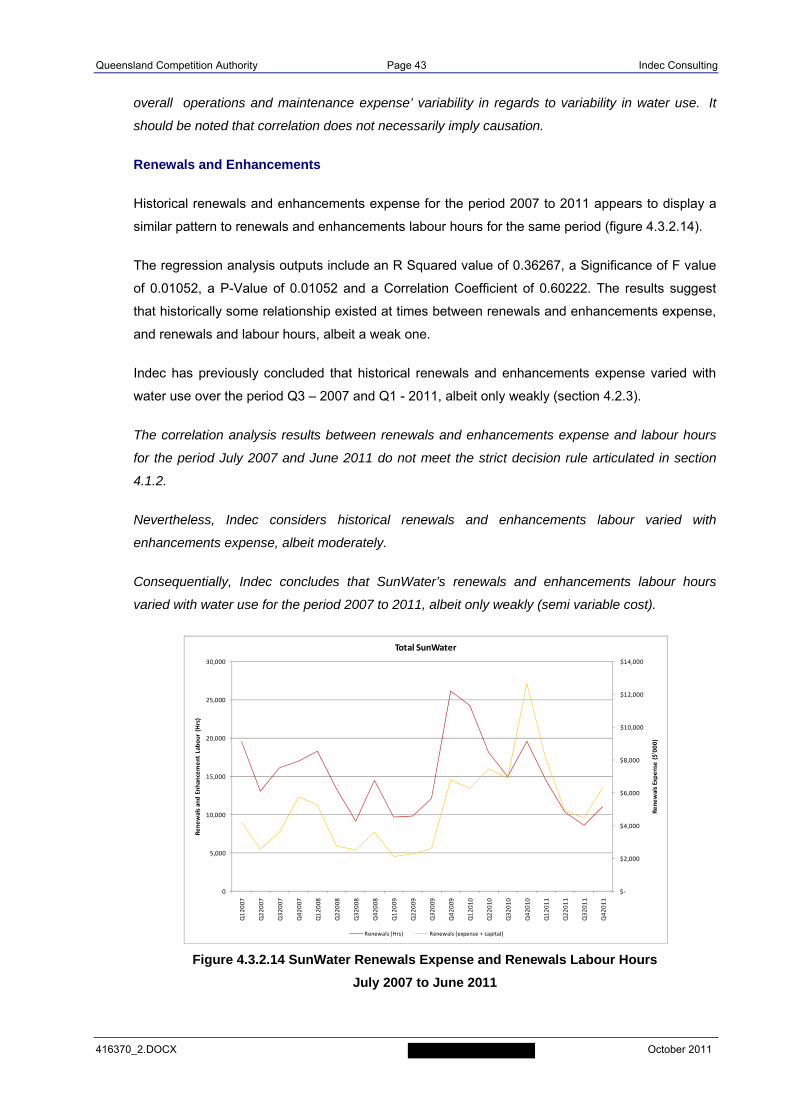
Queensland Competition Authority Page 43 Indec Consulting
416370_2.DOCX October 2011
overall operations and maintenance expense’ variability in regards to variability in water use. It
should be noted that correlation does not necessarily imply causation.
Renewals and Enhancements
Historical renewals and enhancements expense for the period 2007 to 2011 appears to display a
similar pattern to renewals and enhancements labour hours for the same period (figure 4.3.2.14).
The regression analysis outputs include an R Squared value of 0.36267, a Significance of F value
of 0.01052, a P-Value of 0.01052 and a Correlation Coefficient of 0.60222. The results suggest
that historically some relationship existed at times between renewals and enhancements expense,
and renewals and labour hours, albeit a weak one.
Indec has previously concluded that historical renewals and enhancements expense varied with
water use over the period Q3 – 2007 and Q1 - 2011, albeit only weakly (section 4.2.3).
The correlation analysis results between renewals and enhancements expense and labour hours
for the period July 2007 and June 2011 do not meet the strict decision rule articulated in section
4.1.2.
Nevertheless, Indec considers historical renewals and enhancements labour varied with
enhancements expense, albeit moderately.
Consequentially, Indec concludes that SunWater’s renewals and enhancements labour hours
varied with water use for the period 2007 to 2011, albeit only weakly (semi variable cost).
Figure 4.3.2.14 SunWater Renewals Expense and Renewals Labour Hours
July 2007 to June 2011
$‐
$2,000
$4,000
$6,000
$8,000
$10,000
$12,000
$14,000
0
5,000
10,000
15,000
20,000
25,000
30,000
Q12007
Q22007
Q32007
Q42007
Q12008
Q22008
Q32008
Q42008
Q12009
Q22009
Q32009
Q42009
Q12010
Q22010
Q32010
Q42010
Q12011
Q22011
Q32011
Q42011
Renewals Expense ($'000)
Renewals and Enhancement Labour (Hrs)
Total SunWater
Renewals (Hrs) Renewals (expense + capital)

Queensland Competition Authority Page 44 Indec Consulting
416370_2.DOCX October 2011
In drawing the above conclusion, Indec has used an indirect inference on the variability of renewals
labour hours to the variability of water use, through the renewals and enhancements expense’
variability in regards to variability in water use. It should be noted that correlation does not
necessarily imply causation.
4.3.3. Materials
Historical materials expense for the period 2007 to 2011 appears to display a similar pattern to
total labour hours for the same period (figure 4.3.3.1). The similarity of pattern between the two
variables is particularly visible when examining the four period moving average of each time series.
The regression analysis outputs include an R Squared value of 0.41821, a Significance of F value
of 0.00502, a P-Value of 0.00502 and a Correlation Coefficient of 0.64669. The results suggest
that historically, reasonable correlation existed between materials and labour expense for the
period Q1 - 2007 to Q1 - 2011.
The correlation coefficient for the four period moving indirects and overheads expense and labour
expense averages from Q12008 and Q12011 is 0.646694 and the R Squared value is 0.418214.
The results suggest that historically, reasonable correlation existed between materials and labour
expense for the period Q1 - 2007 to Q1 - 2011.
In terms of materiality, for the period 1 July 2007 to 30 June 2011 materials accounted for
approximately 11.28% of total expense.
Figure 4.3.3.1 SunWater Material and Labour Expense
1 July 2007 to 30 June 2011
$‐
$500
$1,000
$1,500
$2,000
$2,500
$3,000
$3,500
$‐
$500
$1,000
$1,500
$2,000
$2,500
$3,000
$3,500
$4,000
$4,500
Q12007
Q22007
Q32007
Q42007
Q12008
Q22008
Q32008
Q42008
Q12009
Q22009
Q32009
Q42009
Q12010
Q22010
Q32010
Q42010
Q12011
Q22011
Q32011
Q42011
Materials Expense ($'000)
Total Labour Expense ($'000)
Total SunWater
Labour Materials 4 per. Mov. Avg. (Labour) 4 per. Mov. Avg. (Materials)
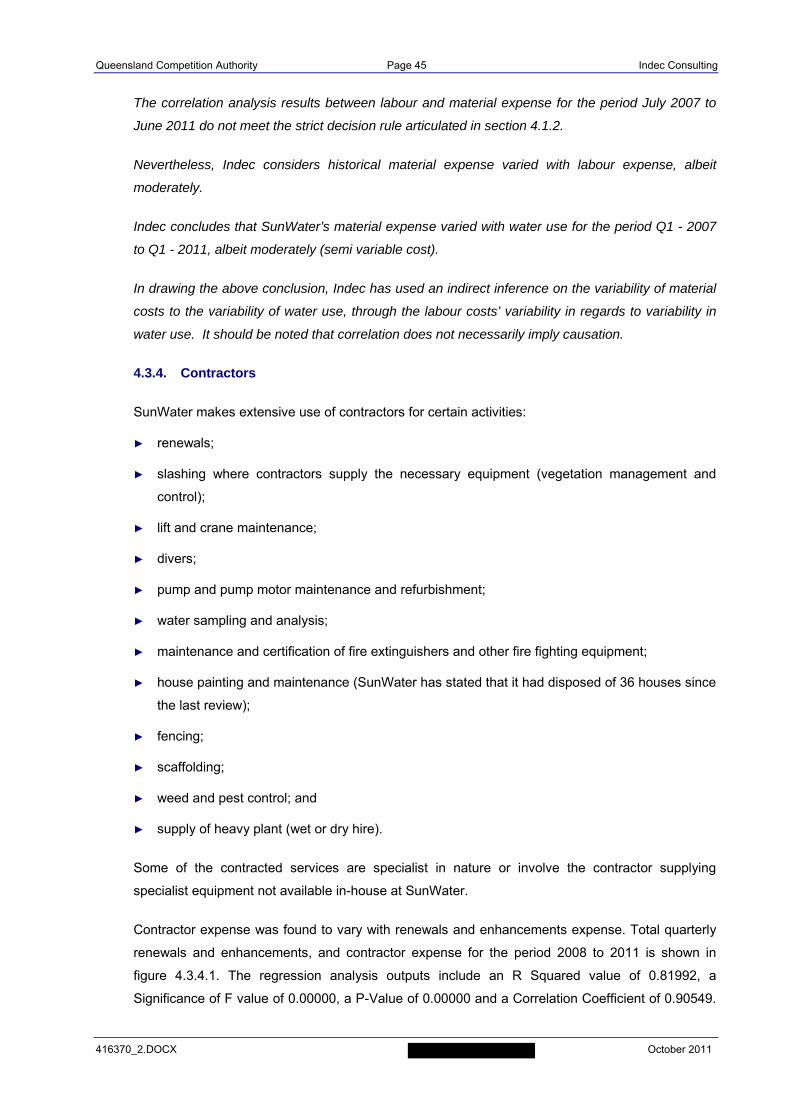
Queensland Competition Authority Page 45 Indec Consulting
416370_2.DOCX October 2011
The correlation analysis results between labour and material expense for the period July 2007 to
June 2011 do not meet the strict decision rule articulated in section 4.1.2.
Nevertheless, Indec considers historical material expense varied with labour expense, albeit
moderately.
Indec concludes that SunWater’s material expense varied with water use for the period Q1 - 2007
to Q1 - 2011, albeit moderately (semi variable cost).
In drawing the above conclusion, Indec has used an indirect inference on the variability of material
costs to the variability of water use, through the labour costs’ variability in regards to variability in
water use. It should be noted that correlation does not necessarily imply causation.
4.3.4. Contractors
SunWater makes extensive use of contractors for certain activities:
► renewals;
► slashing where contractors supply the necessary equipment (vegetation management and
control);
► lift and crane maintenance;
► divers;
► pump and pump motor maintenance and refurbishment;
► water sampling and analysis;
► maintenance and certification of fire extinguishers and other fire fighting equipment;
► house painting and maintenance (SunWater has stated that it had disposed of 36 houses since
the last review);
► fencing;
► scaffolding;
► weed and pest control; and
► supply of heavy plant (wet or dry hire).
Some of the contracted services are specialist in nature or involve the contractor supplying
specialist equipment not available in-house at SunWater.
Contractor expense was found to vary with renewals and enhancements expense. Total quarterly
renewals and enhancements, and contractor expense for the period 2008 to 2011 is shown in
figure 4.3.4.1. The regression analysis outputs include an R Squared value of 0.81992, a
Significance of F value of 0.00000, a P-Value of 0.00000 and a Correlation Coefficient of 0.90549.
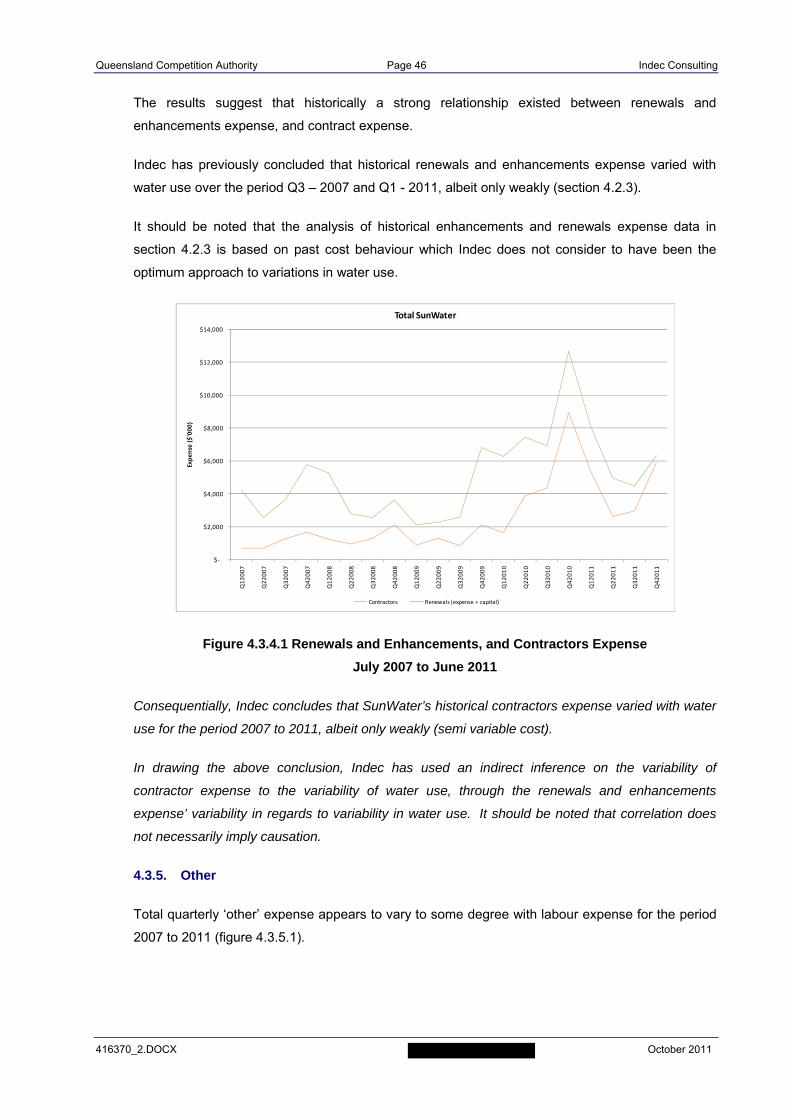
Queensland Competition Authority Page 46 Indec Consulting
416370_2.DOCX October 2011
The results suggest that historically a strong relationship existed between renewals and
enhancements expense, and contract expense.
Indec has previously concluded that historical renewals and enhancements expense varied with
water use over the period Q3 – 2007 and Q1 - 2011, albeit only weakly (section 4.2.3).
It should be noted that the analysis of historical enhancements and renewals expense data in
section 4.2.3 is based on past cost behaviour which Indec does not consider to have been the
optimum approach to variations in water use.
Figure 4.3.4.1 Renewals and Enhancements, and Contractors Expense
July 2007 to June 2011
Consequentially, Indec concludes that SunWater’s historical contractors expense varied with water
use for the period 2007 to 2011, albeit only weakly (semi variable cost).
In drawing the above conclusion, Indec has used an indirect inference on the variability of
contractor expense to the variability of water use, through the renewals and enhancements
expense’ variability in regards to variability in water use. It should be noted that correlation does
not necessarily imply causation.
4.3.5. Other
Total quarterly ‘other’ expense appears to vary to some degree with labour expense for the period
2007 to 2011 (figure 4.3.5.1).
$‐
$2,000
$4,000
$6,000
$8,000
$10,000
$12,000
$14,000
Q12007
Q22007
Q32007
Q42007
Q12008
Q22008
Q32008
Q42008
Q12009
Q22009
Q32009
Q42009
Q12010
Q22010
Q32010
Q42010
Q12011
Q22011
Q32011
Q42011
Expense ($'000)
Total SunWater
Contractors Renewals (expense + capital)
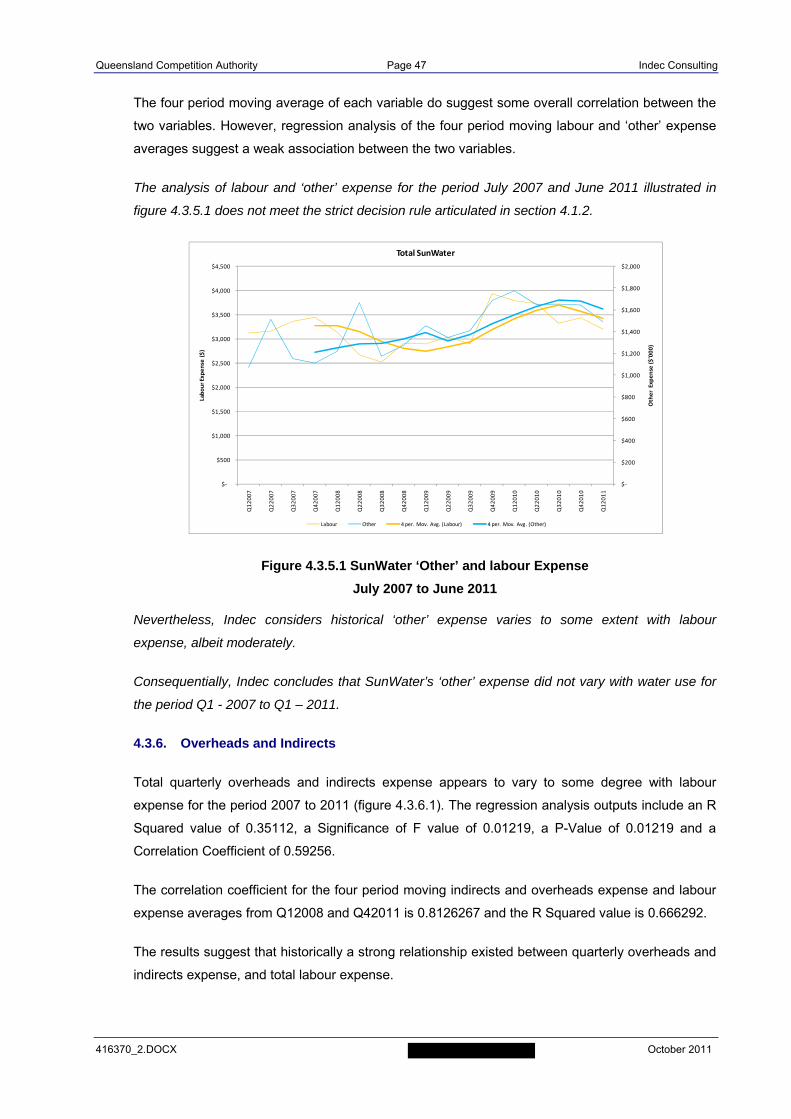
Queensland Competition Authority Page 47 Indec Consulting
416370_2.DOCX October 2011
The four period moving average of each variable do suggest some overall correlation between the
two variables. However, regression analysis of the four period moving labour and ‘other’ expense
averages suggest a weak association between the two variables.
The analysis of labour and ‘other’ expense for the period July 2007 and June 2011 illustrated in
figure 4.3.5.1 does not meet the strict decision rule articulated in section 4.1.2.
Figure 4.3.5.1 SunWater ‘Other’ and labour Expense
July 2007 to June 2011
Nevertheless, Indec considers historical ‘other’ expense varies to some extent with labour
expense, albeit moderately.
Consequentially, Indec concludes that SunWater’s ‘other’ expense did not vary with water use for
the period Q1 - 2007 to Q1 – 2011.
4.3.6. Overheads and Indirects
Total quarterly overheads and indirects expense appears to vary to some degree with labour
expense for the period 2007 to 2011 (figure 4.3.6.1). The regression analysis outputs include an R
Squared value of 0.35112, a Significance of F value of 0.01219, a P-Value of 0.01219 and a
Correlation Coefficient of 0.59256.
The correlation coefficient for the four period moving indirects and overheads expense and labour
expense averages from Q12008 and Q42011 is 0.8126267 and the R Squared value is 0.666292.
The results suggest that historically a strong relationship existed between quarterly overheads and
indirects expense, and total labour expense.
$‐
$200
$400
$600
$800
$1,000
$1,200
$1,400
$1,600
$1,800
$2,000
$‐
$500
$1,000
$1,500
$2,000
$2,500
$3,000
$3,500
$4,000
$4,500
Q12007
Q22007
Q32007
Q42007
Q12008
Q22008
Q32008
Q42008
Q12009
Q22009
Q32009
Q42009
Q12010
Q22010
Q32010
Q42010
Q12011
Other Expense ($'000)
Labour Expense ($)
Total SunWater
Labour Other 4 per. Mov. Avg. (Labour) 4 per. Mov. Avg. (Other)
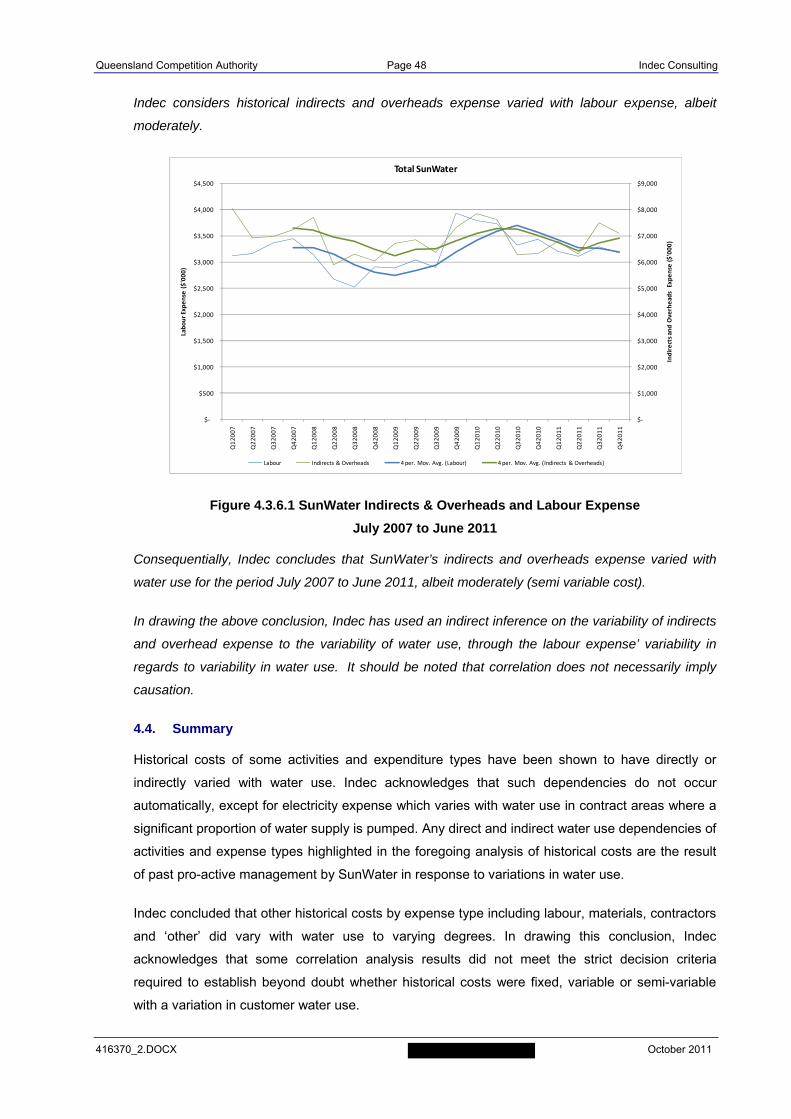
Queensland Competition Authority Page 48 Indec Consulting
416370_2.DOCX October 2011
Indec considers historical indirects and overheads expense varied with labour expense, albeit
moderately.
Figure 4.3.6.1 SunWater Indirects & Overheads and Labour Expense
July 2007 to June 2011
Consequentially, Indec concludes that SunWater’s indirects and overheads expense varied with
water use for the period July 2007 to June 2011, albeit moderately (semi variable cost).
In drawing the above conclusion, Indec has used an indirect inference on the variability of indirects
and overhead expense to the variability of water use, through the labour expense’ variability in
regards to variability in water use. It should be noted that correlation does not necessarily imply
causation.
4.4. Summary
Historical costs of some activities and expenditure types have been shown to have directly or
indirectly varied with water use. Indec acknowledges that such dependencies do not occur
automatically, except for electricity expense which varies with water use in contract areas where a
significant proportion of water supply is pumped. Any direct and indirect water use dependencies of
activities and expense types highlighted in the foregoing analysis of historical costs are the result
of past pro-active management by SunWater in response to variations in water use.
Indec concluded that other historical costs by expense type including labour, materials, contractors
and ‘other’ did vary with water use to varying degrees. In drawing this conclusion, Indec
acknowledges that some correlation analysis results did not meet the strict decision criteria
required to establish beyond doubt whether historical costs were fixed, variable or semi-variable
with a variation in customer water use.
$‐
$1,000
$2,000
$3,000
$4,000
$5,000
$6,000
$7,000
$8,000
$9,000
$‐
$500
$1,000
$1,500
$2,000
$2,500
$3,000
$3,500
$4,000
$4,500
Q12007
Q22007
Q32007
Q42007
Q12008
Q22008
Q32008
Q42008
Q12009
Q22009
Q32009
Q42009
Q12010
Q22010
Q32010
Q42010
Q12011
Q22011
Q32011
Q42011
Indirects and Overheads Expense ($'000)
Labour Expense ($'000)
Total SunWater
Labour Indirects & Overheads 4 per. Mov. Avg. (Labour) 4 per. Mov. Avg. (Indirects & Overheads)
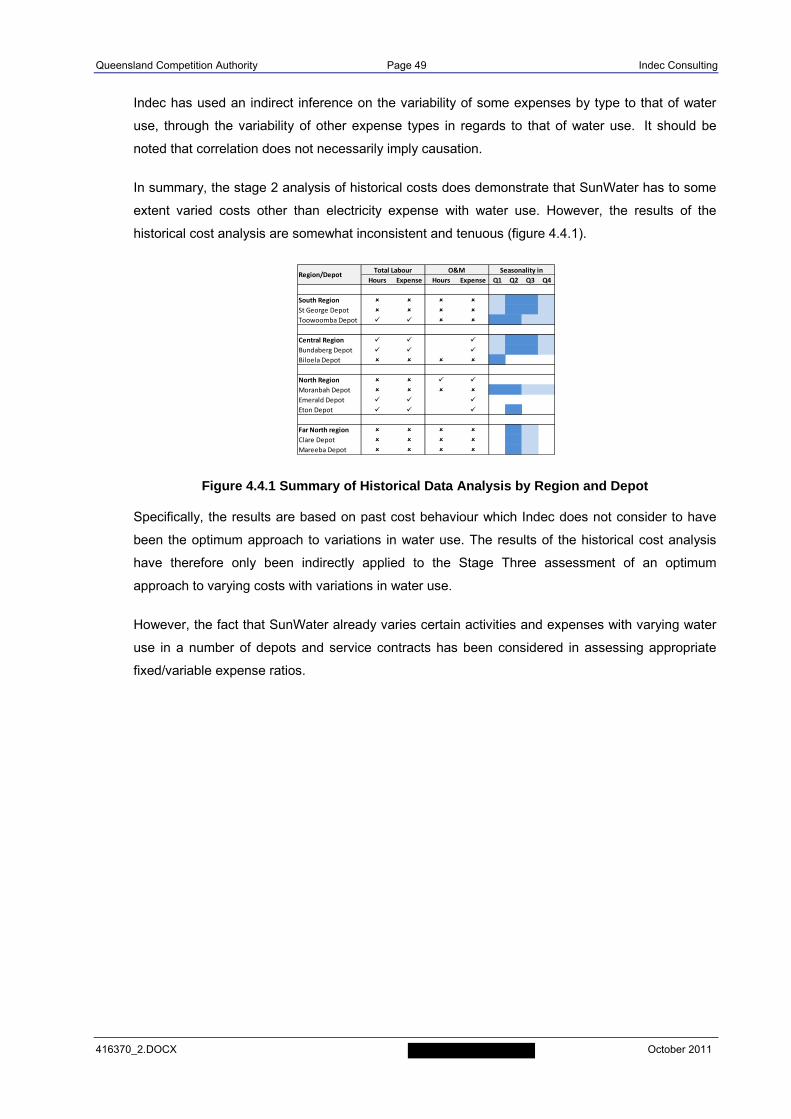
Queensland Competition Authority Page 49 Indec Consulting
416370_2.DOCX October 2011
Indec has used an indirect inference on the variability of some expenses by type to that of water
use, through the variability of other expense types in regards to that of water use. It should be
noted that correlation does not necessarily imply causation.
In summary, the stage 2 analysis of historical costs does demonstrate that SunWater has to some
extent varied costs other than electricity expense with water use. However, the results of the
historical cost analysis are somewhat inconsistent and tenuous (figure 4.4.1).
Figure 4.4.1 Summary of Historical Data Analysis by Region and Depot
Specifically, the results are based on past cost behaviour which Indec does not consider to have
been the optimum approach to variations in water use. The results of the historical cost analysis
have therefore only been indirectly applied to the Stage Three assessment of an optimum
approach to varying costs with variations in water use.
However, the fact that SunWater already varies certain activities and expenses with varying water
use in a number of depots and service contracts has been considered in assessing appropriate
fixed/variable expense ratios.
Hours Expense Hours Expense Q1 Q2 Q3 Q4
South Region St George Depot Toowoomba Depot
Central Region Bundaberg Depot Biloela Depot
North Region Moranbah Depot Emerald Depot Eton Depot
Far North region Clare Depot Mareeba Depot
Total Labour Seasonality in Region/Depot
O&M
Queensland Competition Authority Page 50 Indec Consulting
416370_2.DOCX October 2011
5. STAGE THREE – ASSESSMENT OF OPTIMAL APPROACH
The approach applied by Indec in determining fixed and variable costs with respect to water use for
this report is outlined below. As part of the terms of reference, Indec was required to take into
account an optimal management approach which considers SunWater’s operating environment.
5.1. Methodology
The framework applied by Indec in determining an optimal management approach involved the
objective of delivering services in a prudent and efficient manner whilst at the same time
acknowledging some of the operating and other restraints which SunWater may face. SunWater
must manage its operations taking into account all relevant risks and opportunities whilst not
compromising on the delivery of services to customers as outlined in SunWater’s Standard of
Service.
As part of determining the optimal management approach, Indec developed a range of operating
scenarios. The range provides for some discretion with respect to tolerances typically applicable to
these types of assessments and any transition period which may be required to achieve optimal
approach to varying water use. Indec has defined the upper bound as high; the lower bound as low
and its recommended scenario is defined as optimal.
The high range may either represent that SunWater has the operational ability to quickly respond
to varying level of water use or alternatively SunWater can vary service standards so that staffing
levels can be reduced below the minimum otherwise required. For example, the use of ‘flying’
gangs, ‘mothballing’ of schemes or restricting maintenance activity to ‘stand-by’ maintenance on
equipment and assets is an option under the high scenario. All of these measures, however, would
require customers to agree to a reduction in customer service levels to provide for example, a
delayed start-up period before water can be delivered after water becomes available.
The low range represent that SunWater has limited operational ability to quickly respond to varying
levels of water use and/or cannot vary service standards so that staffing levels can be reduced
below the minimum otherwise required.
The optimal approach is Indec’s recommended outcome applying its judgement of SunWater’s
capabilities to respond to varying levels of water use based on Indec’s understanding of
SunWater’s operational activities, the risks involved and the analysis of historical data which
represents current management practices. The optimal approach recommended by Indec does not
involve any changes to existing levels of customer service standards.
As part of developing the recommended optimal scenario, certain operating and regulatory
constraints were identified which restrict SunWater’s ability to reduce workload during periods of
low water use or demand, as staffing levels are largely driven by:
Queensland Competition Authority Page 51 Indec Consulting
416370_2.DOCX October 2011
► the need to maintain a minimum critical mass on site to respond to operational events to meet
customer service standards;
► occupational health and safety requirements which preclude staff working by themselves in
prescribed circumstances;
► the need to have available personnel with the right skills and safety certificates for work in
certain environments (confined spaces, low voltage, etc); and
► distances between depots which range from 125 to 520 kilometres. One way travel times
range from 2-5 hours (i.e. Emerald –Eton depots and Emerald Moranbah depots in North
Region) and 5 - 7 hours (i.e. Toowoomba – St George depots in South Region, Emerald– Eton
depots in North Region, and Clare – Mareeba depots in Far North Region). Travel times in
conjunction with the need to provide overnight accommodation limits cost efficient resource
sharing between some depots.
Indec has applied its judgement to determine what it considers an optimal management approach
based on its experience of reviewing and benchmarking utility industries and its knowledge of the
SunWater business operations gained during the previous irrigation price path review in 2005/06
and more recently from reviewing actual and forecast cost and labour data, documents outlining
operating and asset management practices, and interviews with senior SunWater staff.
For each of the three selected scenarios (low, optimal and high), Indec has identified for each
category of expenditure as outlined in SunWater’s NSPs, the low and high range of fixed costs with
respect to water volumes delivered to customers. The difference between the high and low ranges
of fixed costs is deemed to be a variable cost with respect to water volumes. Indec has completed
this analysis for each of the 30 service contracts relevant for the setting of the irrigation price paths.
Many factors have been considered by Indec, some which are unique to each service contract due
to differing operating characteristics and/or operating assets. The factors considered are explained
in more detail below and by way of example the extent of automation and labour required to
operate each service contract was a key consideration.
5.2. Operations
Indec’s view is that in times of low water demand, operations activities can be reduced. The
reduction may be the result of:
► selective delegation of certain operational activities to water users;
► re-allocation of operations personnel to other service contracts; and
► re-allocation of operations personnel to O&M or R&E activities that would otherwise carried out
by contractors (temporarily reduce the use of contractors and casual labour);
Queensland Competition Authority Page 52 Indec Consulting
416370_2.DOCX October 2011
► reduction of direct bookings by corporate staff during period of low demand; and
► reduction in overtime and TOIL (Time Off In Lieu) during period of low demand.
The extent to which the above measures are practicable is likely to vary for each area and service
contract. Indec acknowledges that such a measure may impact on the ‘core’ establishment of
operations staff.
5.3. Maintenance
Indec’s view is that in times of low water demand, maintenance activities can be reduced. The
reduction may be the result of:
► deferment of non-essential planned and unplanned maintenance activities;
► re-allocation of maintenance personnel to other service contracts;
► re-allocation of maintenance personnel to O&M or R&E activities that would otherwise carried
out by contractors (temporarily reduce the use of contractors and casual labour); and
► reduction in overtime and TOIL (Time Off In Lieu) during period of low demand.
5.4. Renewals and Enhancements
Indec’s view is that in times of low water demand, renewals and enhancements expense can be
reduced. The reduction may be the result of:
► deferment of some priority 2 refurbishment and enhancements activities;
► re-allocation of operations and maintenance personnel to O&M or R&E activities that would
otherwise carried out by contractors (temporarily reduce the use of contractors and casual
labour);
► review of planned scope of refurbishments and enhancements in that budget year; and
► phasing of renewals and enhancements works over a longer period.
5.5. Distribution
A summary of the preliminary quantitative assessment of fixed versus variable costs for selected
water distribution systems is summarised in figure 5.5.1.
The Indec assessment indicates a range of fixed to variable cost ratios for each water distribution
system. The range provides for some discretion with respect to tolerances typically applicable to
these type of assessments and any transition period which may be required to achieve optimal
approach to varying water use.
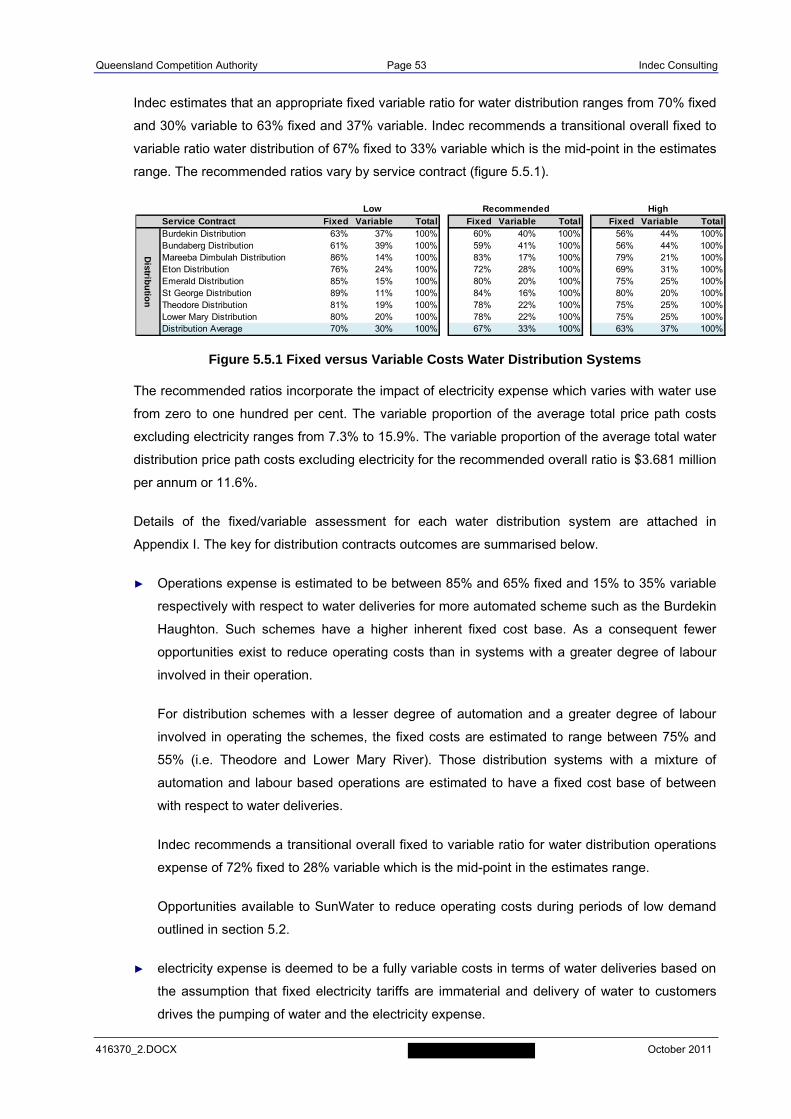
Queensland Competition Authority Page 53 Indec Consulting
416370_2.DOCX October 2011
Indec estimates that an appropriate fixed variable ratio for water distribution ranges from 70% fixed
and 30% variable to 63% fixed and 37% variable. Indec recommends a transitional overall fixed to
variable ratio water distribution of 67% fixed to 33% variable which is the mid-point in the estimates
range. The recommended ratios vary by service contract (figure 5.5.1).
Figure 5.5.1 Fixed versus Variable Costs Water Distribution Systems
The recommended ratios incorporate the impact of electricity expense which varies with water use
from zero to one hundred per cent. The variable proportion of the average total price path costs
excluding electricity ranges from 7.3% to 15.9%. The variable proportion of the average total water
distribution price path costs excluding electricity for the recommended overall ratio is $3.681 million
per annum or 11.6%.
Details of the fixed/variable assessment for each water distribution system are attached in
Appendix I. The key for distribution contracts outcomes are summarised below.
► Operations expense is estimated to be between 85% and 65% fixed and 15% to 35% variable
respectively with respect to water deliveries for more automated scheme such as the Burdekin
Haughton. Such schemes have a higher inherent fixed cost base. As a consequent fewer
opportunities exist to reduce operating costs than in systems with a greater degree of labour
involved in their operation.
For distribution schemes with a lesser degree of automation and a greater degree of labour
involved in operating the schemes, the fixed costs are estimated to range between 75% and
55% (i.e. Theodore and Lower Mary River). Those distribution systems with a mixture of
automation and labour based operations are estimated to have a fixed cost base of between
with respect to water deliveries.
Indec recommends a transitional overall fixed to variable ratio for water distribution operations
expense of 72% fixed to 28% variable which is the mid-point in the estimates range.
Opportunities available to SunWater to reduce operating costs during periods of low demand
outlined in section 5.2.
► electricity expense is deemed to be a fully variable costs in terms of water deliveries based on
the assumption that fixed electricity tariffs are immaterial and delivery of water to customers
drives the pumping of water and the electricity expense.
Service Contract Fixed Variable Total Fixed Variable Total Fixed Variable TotalBurdekin Distribution 63% 37% 100% 60% 40% 100% 56% 44% 100%Bundaberg Distribution 61% 39% 100% 59% 41% 100% 56% 44% 100%Mareeba Dimbulah Distribution 86% 14% 100% 83% 17% 100% 79% 21% 100%Eton Distribution 76% 24% 100% 72% 28% 100% 69% 31% 100%Emerald Distribution 85% 15% 100% 80% 20% 100% 75% 25% 100%St George Distribution 89% 11% 100% 84% 16% 100% 80% 20% 100%Theodore Distribution 81% 19% 100% 78% 22% 100% 75% 25% 100%Lower Mary Distribution 80% 20% 100% 78% 22% 100% 75% 25% 100%Distribution Average 70% 30% 100% 67% 33% 100% 63% 37% 100%
Distrib
utio
n
Low Recommended High
Queensland Competition Authority Page 54 Indec Consulting
416370_2.DOCX October 2011
► preventative maintenance in distribution systems is estimated to range between 65% and 80%
fixed with respect to water use based on the particular characteristics of each distribution
system. Specifically, in schemes that incorporate more rotating equipment such as pumping
stations, greater potential exists to reduce preventative maintenance costs during periods of
low water use.
Indec has estimated that more automated distribution schemes such as the Burdekin
Haughton have a higher percentage of fixed preventative maintenance costs (recommended
75% fixed) than manual operated distribution schemes such as Theodore (70% fixed).
Indec recommends a transitional overall fixed to variable ratio for water distribution
preventative maintenance expense of 76% fixed to 24% variable which is the mid-point in the
estimates range.
Opportunities available to SunWater to reduce preventative maintenance costs during periods
of low demand were outlined in the section 5.3.
► corrective maintenance is estimated to range between 90% to 70% fixed and 10% to 30%
variable respectively based on water deliveries.
Indec recommends a transitional overall fixed to variable ratio for water distribution corrective
maintenance expense of 75% fixed to 25% variable which is the mid-point in the estimates
range.
Opportunities available to SunWater to reduce corrective maintenance costs during periods of
low demand were outlined in the section 5.3.
► revenue offsets are not related to water use and deemed to be 100% fixed.
► indirects and overheads expense is deemed to be 100% fixed.
► renewal annuity spend are deemed to be 75% fixed based on water volumes delivered with
25% of the spend subject to review to either reduce the scope of the works or defer the works
for an assumed 2 year period. For the purposes of this draft report, the impact on the annuity
has been estimated to average a 1% reduction over the 5 year price path period.
Indec recommends a transitional overall fixed to variable ratio for water distribution renewals
and enhancements expense of 99% fixed to 1% variable.
Opportunities available to SunWater to reduce renewals and enhancements expense during
periods of low demand were outlined in the section 5.4.
5.6. Bulk Water
A summary of Indec’s assessment of optimal fixed and variable costs for bulk water supply
systems is summarised in figure 5.6.1.
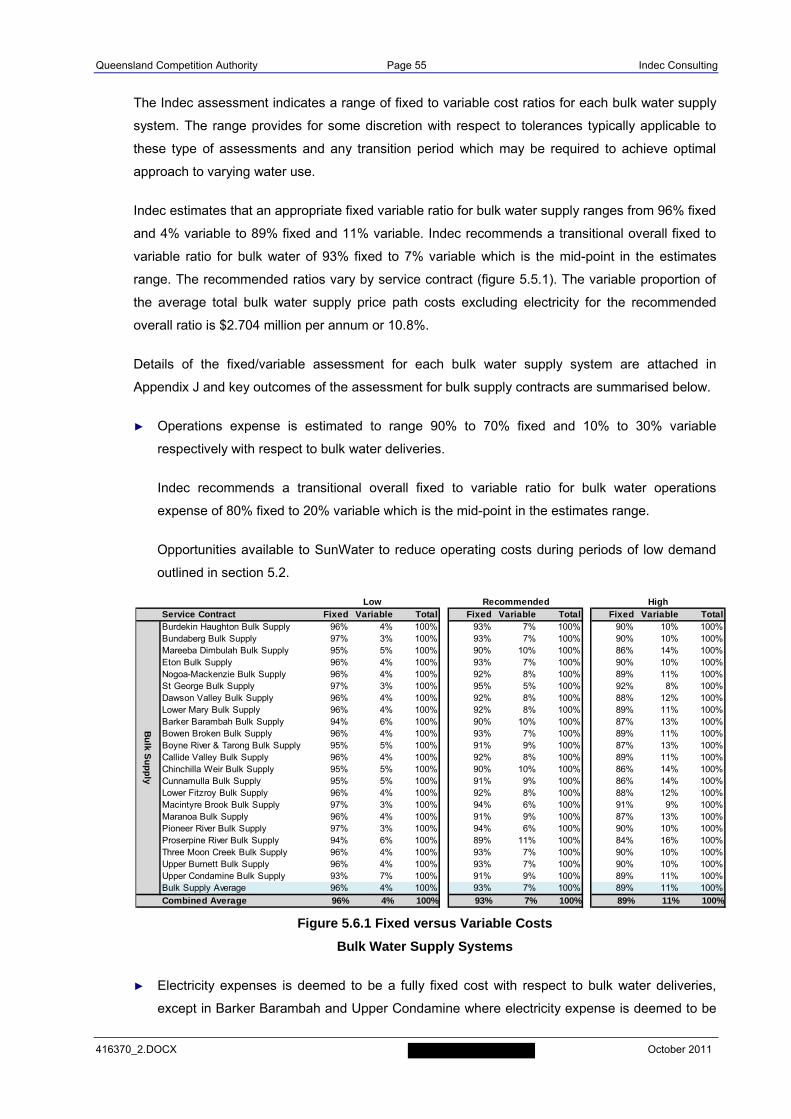
Queensland Competition Authority Page 55 Indec Consulting
416370_2.DOCX October 2011
The Indec assessment indicates a range of fixed to variable cost ratios for each bulk water supply
system. The range provides for some discretion with respect to tolerances typically applicable to
these type of assessments and any transition period which may be required to achieve optimal
approach to varying water use.
Indec estimates that an appropriate fixed variable ratio for bulk water supply ranges from 96% fixed
and 4% variable to 89% fixed and 11% variable. Indec recommends a transitional overall fixed to
variable ratio for bulk water of 93% fixed to 7% variable which is the mid-point in the estimates
range. The recommended ratios vary by service contract (figure 5.5.1). The variable proportion of
the average total bulk water supply price path costs excluding electricity for the recommended
overall ratio is $2.704 million per annum or 10.8%.
Details of the fixed/variable assessment for each bulk water supply system are attached in
Appendix J and key outcomes of the assessment for bulk supply contracts are summarised below.
► Operations expense is estimated to range 90% to 70% fixed and 10% to 30% variable
respectively with respect to bulk water deliveries.
Indec recommends a transitional overall fixed to variable ratio for bulk water operations
expense of 80% fixed to 20% variable which is the mid-point in the estimates range.
Opportunities available to SunWater to reduce operating costs during periods of low demand
outlined in section 5.2.
Figure 5.6.1 Fixed versus Variable Costs
Bulk Water Supply Systems
► Electricity expenses is deemed to be a fully fixed cost with respect to bulk water deliveries,
except in Barker Barambah and Upper Condamine where electricity expense is deemed to be
Service Contract Fixed Variable Total Fixed Variable Total Fixed Variable TotalBurdekin Haughton Bulk Supply 96% 4% 100% 93% 7% 100% 90% 10% 100%Bundaberg Bulk Supply 97% 3% 100% 93% 7% 100% 90% 10% 100%Mareeba Dimbulah Bulk Supply 95% 5% 100% 90% 10% 100% 86% 14% 100%Eton Bulk Supply 96% 4% 100% 93% 7% 100% 90% 10% 100%Nogoa-Mackenzie Bulk Supply 96% 4% 100% 92% 8% 100% 89% 11% 100%St George Bulk Supply 97% 3% 100% 95% 5% 100% 92% 8% 100%Dawson Valley Bulk Supply 96% 4% 100% 92% 8% 100% 88% 12% 100%Lower Mary Bulk Supply 96% 4% 100% 92% 8% 100% 89% 11% 100%Barker Barambah Bulk Supply 94% 6% 100% 90% 10% 100% 87% 13% 100%Bowen Broken Bulk Supply 96% 4% 100% 93% 7% 100% 89% 11% 100%Boyne River & Tarong Bulk Supply 95% 5% 100% 91% 9% 100% 87% 13% 100%Callide Valley Bulk Supply 96% 4% 100% 92% 8% 100% 89% 11% 100%Chinchilla Weir Bulk Supply 95% 5% 100% 90% 10% 100% 86% 14% 100%Cunnamulla Bulk Supply 95% 5% 100% 91% 9% 100% 86% 14% 100%Lower Fitzroy Bulk Supply 96% 4% 100% 92% 8% 100% 88% 12% 100%Macintyre Brook Bulk Supply 97% 3% 100% 94% 6% 100% 91% 9% 100%Maranoa Bulk Supply 96% 4% 100% 91% 9% 100% 87% 13% 100%Pioneer River Bulk Supply 97% 3% 100% 94% 6% 100% 90% 10% 100%Proserpine River Bulk Supply 94% 6% 100% 89% 11% 100% 84% 16% 100%Three Moon Creek Bulk Supply 96% 4% 100% 93% 7% 100% 90% 10% 100%Upper Burnett Bulk Supply 96% 4% 100% 93% 7% 100% 90% 10% 100%Upper Condamine Bulk Supply 93% 7% 100% 91% 9% 100% 89% 11% 100%Bulk Supply Average 96% 4% 100% 93% 7% 100% 89% 11% 100%
Combined Average 96% 4% 100% 93% 7% 100% 89% 11% 100%
Bu
lk Su
pp
ly
Low Recommended High
Queensland Competition Authority Page 56 Indec Consulting
416370_2.DOCX October 2011
a fully variable costs. Indec’s assessment of full electricity cost variability for Barker Barambah
and Upper Condamine is based on the assumption that fixed electricity tariffs are immaterial.
► Preventative maintenance is estimated to range between 90% to 70% fixed and 10% to 30%
variable respectively based on bulk water deliveries.
Indec recommends a transitional overall fixed to variable ratio for bulk water preventative
maintenance expense of 80% fixed to 20% variable which is the mid-point in the estimates
range.
Opportunities available to SunWater to reduce preventative maintenance costs during periods
of low demand were outlined in the section 5.3.
► Corrective maintenance is estimated to range between 90% to 70% fixed and 10% to 30%
variable respectively based on bulk water deliveries.
Indec recommends a transitional overall fixed to variable ratio for bulk water corrective
maintenance expense of 80% fixed to 20% variable which is the mid-point in the estimates
range.
Opportunities available to SunWater to reduce corrective maintenance costs during periods of
low demand were outlined in the section 5.3.
► Revenue offsets are not related to water use and deemed to be 100% fixed.
► indirects and overheads expense is deemed to be 100% fixed.
► renewal annuity spend are deemed to be 75% fixed based on water volumes delivered with
25% of the spend subject to review to either reduce the scope of the works or defer the works
for an assumed 2 year period. For the purposes of this draft report, the impact on the annuity
has been estimated to average a 1% reduction over the 5 year price path period.
Indec recommends a transitional overall fixed to variable ratio for bulk water renewals and
enhancements expense of 99% fixed to 1% variable which is the mid-point in the estimates
range.
Opportunities available to SunWater to reduce renewals and enhancements expense during
periods of low demand were outlined in the section 5.4.
► Dam safety upgrades are deemed to be 100% fixed and not related to water volumes delivered
nor do any opportunities exist to defer these upgrades due to the significant risks involved.
Queensland Competition Authority Appendices Indec Consulting
416370_2.DOCX October 2011
APPENDIX A
Terms of Reference
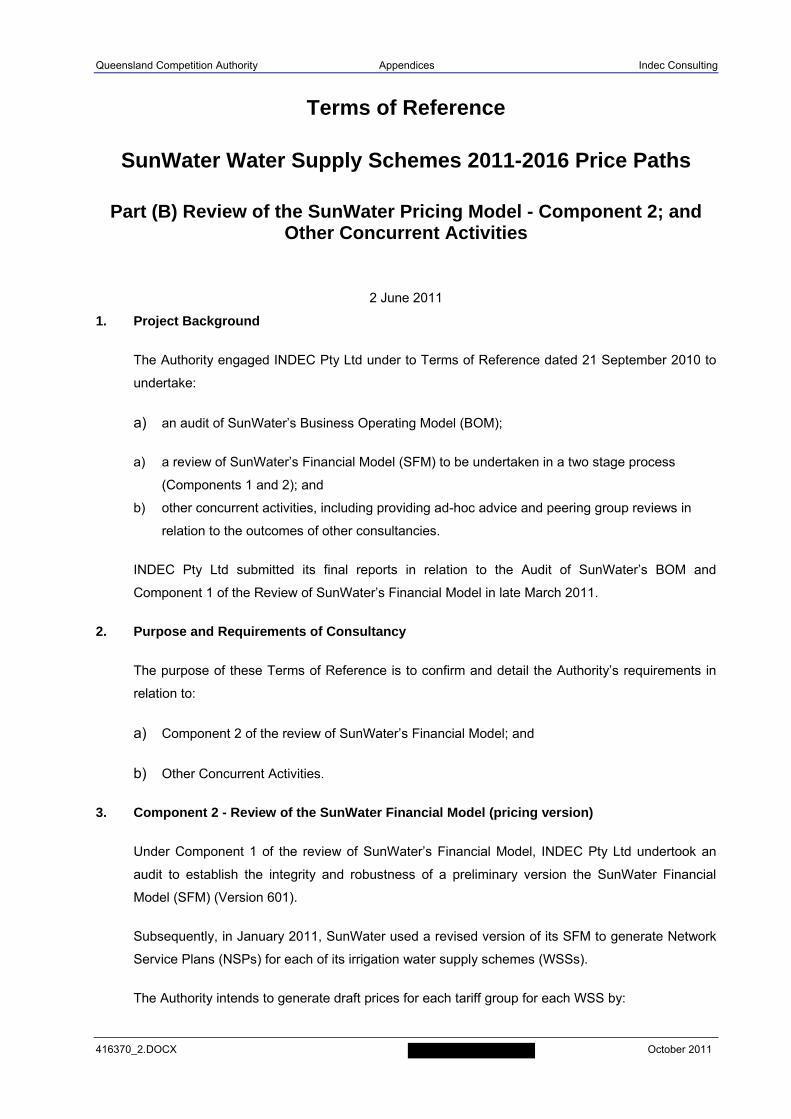
Queensland Competition Authority Appendices Indec Consulting
416370_2.DOCX October 2011
Terms of Reference
SunWater Water Supply Schemes 2011-2016 Price Paths
Part (B) Review of the SunWater Pricing Model - Component 2; and Other Concurrent Activities
2 June 2011
1. Project Background
The Authority engaged INDEC Pty Ltd under to Terms of Reference dated 21 September 2010 to
undertake:
a) an audit of SunWater’s Business Operating Model (BOM);
a) a review of SunWater’s Financial Model (SFM) to be undertaken in a two stage process
(Components 1 and 2); and
b) other concurrent activities, including providing ad-hoc advice and peering group reviews in
relation to the outcomes of other consultancies.
INDEC Pty Ltd submitted its final reports in relation to the Audit of SunWater’s BOM and
Component 1 of the Review of SunWater’s Financial Model in late March 2011.
2. Purpose and Requirements of Consultancy
The purpose of these Terms of Reference is to confirm and detail the Authority’s requirements in
relation to:
a) Component 2 of the review of SunWater’s Financial Model; and
b) Other Concurrent Activities.
3. Component 2 - Review of the SunWater Financial Model (pricing version)
Under Component 1 of the review of SunWater’s Financial Model, INDEC Pty Ltd undertook an
audit to establish the integrity and robustness of a preliminary version the SunWater Financial
Model (SFM) (Version 601).
Subsequently, in January 2011, SunWater used a revised version of its SFM to generate Network
Service Plans (NSPs) for each of its irrigation water supply schemes (WSSs).
The Authority intends to generate draft prices for each tariff group for each WSS by:
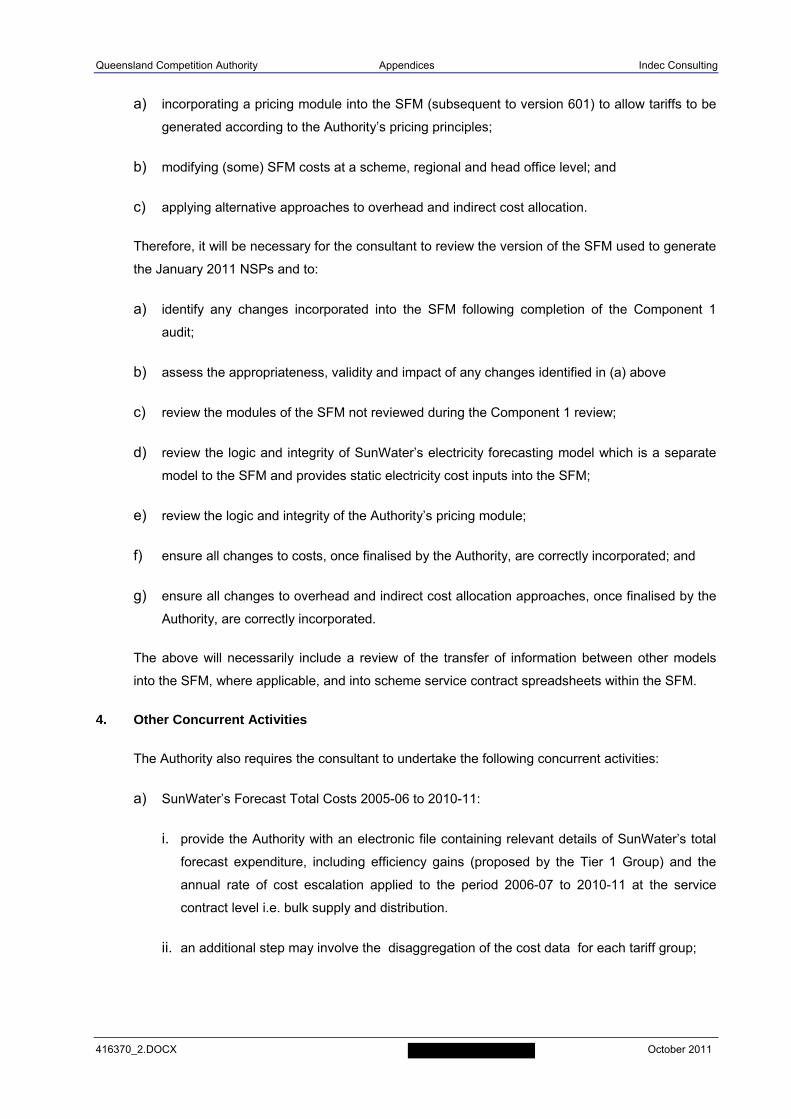
Queensland Competition Authority Appendices Indec Consulting
416370_2.DOCX October 2011
a) incorporating a pricing module into the SFM (subsequent to version 601) to allow tariffs to be
generated according to the Authority’s pricing principles;
b) modifying (some) SFM costs at a scheme, regional and head office level; and
c) applying alternative approaches to overhead and indirect cost allocation.
Therefore, it will be necessary for the consultant to review the version of the SFM used to generate
the January 2011 NSPs and to:
a) identify any changes incorporated into the SFM following completion of the Component 1
audit;
b) assess the appropriateness, validity and impact of any changes identified in (a) above
c) review the modules of the SFM not reviewed during the Component 1 review;
d) review the logic and integrity of SunWater’s electricity forecasting model which is a separate
model to the SFM and provides static electricity cost inputs into the SFM;
e) review the logic and integrity of the Authority’s pricing module;
f) ensure all changes to costs, once finalised by the Authority, are correctly incorporated; and
g) ensure all changes to overhead and indirect cost allocation approaches, once finalised by the
Authority, are correctly incorporated.
The above will necessarily include a review of the transfer of information between other models
into the SFM, where applicable, and into scheme service contract spreadsheets within the SFM.
4. Other Concurrent Activities
The Authority also requires the consultant to undertake the following concurrent activities:
a) SunWater’s Forecast Total Costs 2005-06 to 2010-11:
i. provide the Authority with an electronic file containing relevant details of SunWater’s total
forecast expenditure, including efficiency gains (proposed by the Tier 1 Group) and the
annual rate of cost escalation applied to the period 2006-07 to 2010-11 at the service
contract level i.e. bulk supply and distribution.
ii. an additional step may involve the disaggregation of the cost data for each tariff group;
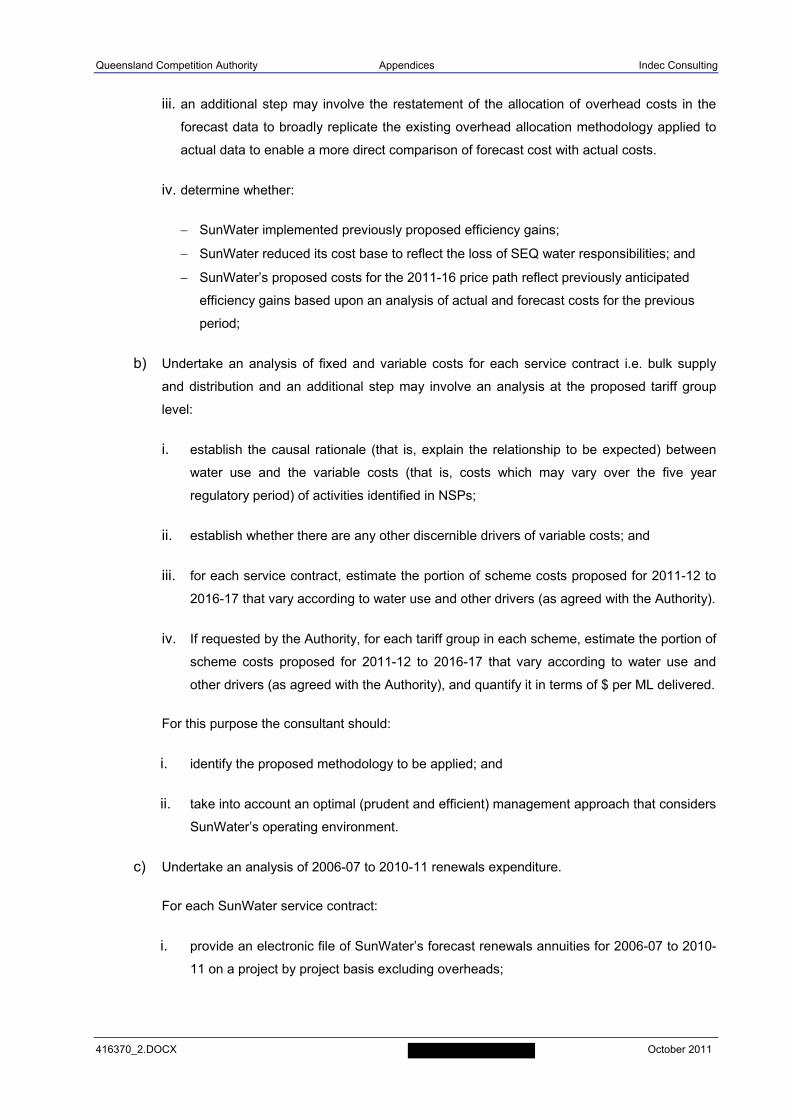
Queensland Competition Authority Appendices Indec Consulting
416370_2.DOCX October 2011
iii. an additional step may involve the restatement of the allocation of overhead costs in the
forecast data to broadly replicate the existing overhead allocation methodology applied to
actual data to enable a more direct comparison of forecast cost with actual costs.
iv. determine whether:
SunWater implemented previously proposed efficiency gains;
SunWater reduced its cost base to reflect the loss of SEQ water responsibilities; and
SunWater’s proposed costs for the 2011-16 price path reflect previously anticipated
efficiency gains based upon an analysis of actual and forecast costs for the previous
period;
b) Undertake an analysis of fixed and variable costs for each service contract i.e. bulk supply
and distribution and an additional step may involve an analysis at the proposed tariff group
level:
i. establish the causal rationale (that is, explain the relationship to be expected) between
water use and the variable costs (that is, costs which may vary over the five year
regulatory period) of activities identified in NSPs;
ii. establish whether there are any other discernible drivers of variable costs; and
iii. for each service contract, estimate the portion of scheme costs proposed for 2011-12 to
2016-17 that vary according to water use and other drivers (as agreed with the Authority).
iv. If requested by the Authority, for each tariff group in each scheme, estimate the portion of
scheme costs proposed for 2011-12 to 2016-17 that vary according to water use and
other drivers (as agreed with the Authority), and quantify it in terms of $ per ML delivered.
For this purpose the consultant should:
i. identify the proposed methodology to be applied; and
ii. take into account an optimal (prudent and efficient) management approach that considers
SunWater’s operating environment.
c) Undertake an analysis of 2006-07 to 2010-11 renewals expenditure.
For each SunWater service contract:
i. provide an electronic file of SunWater’s forecast renewals annuities for 2006-07 to 2010-
11 on a project by project basis excluding overheads;
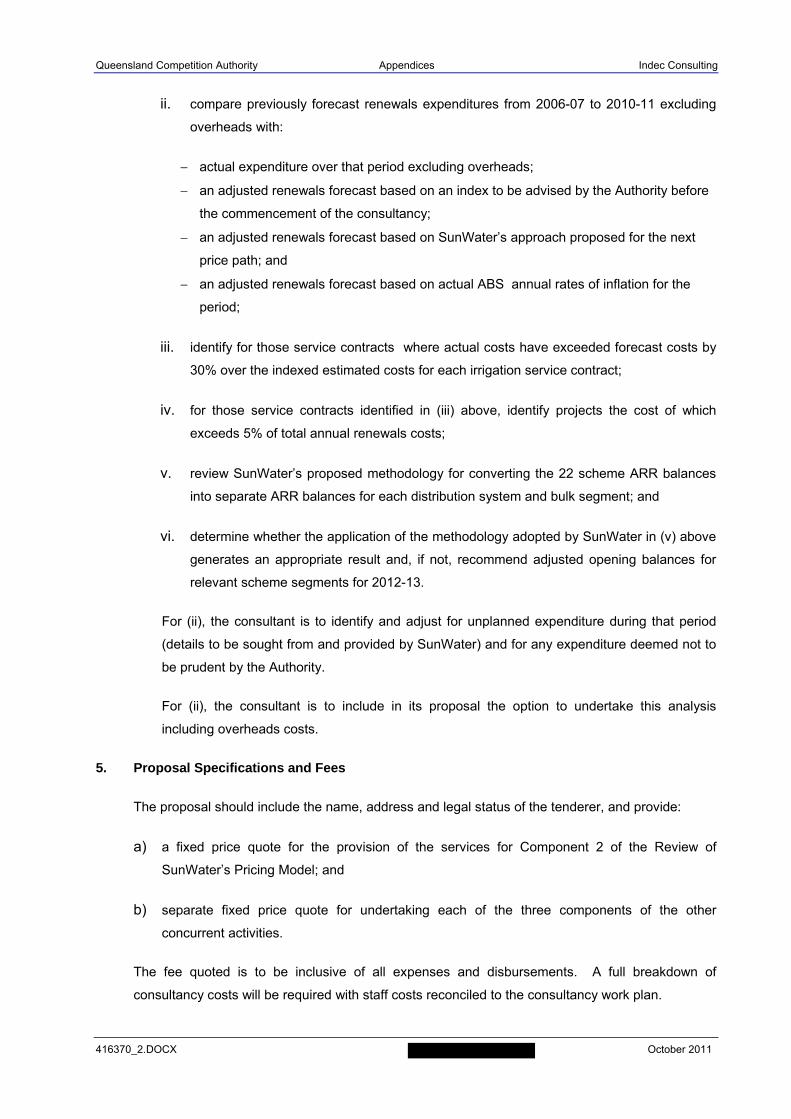
Queensland Competition Authority Appendices Indec Consulting
416370_2.DOCX October 2011
ii. compare previously forecast renewals expenditures from 2006-07 to 2010-11 excluding
overheads with:
actual expenditure over that period excluding overheads;
an adjusted renewals forecast based on an index to be advised by the Authority before
the commencement of the consultancy;
an adjusted renewals forecast based on SunWater’s approach proposed for the next
price path; and
an adjusted renewals forecast based on actual ABS annual rates of inflation for the
period;
iii. identify for those service contracts where actual costs have exceeded forecast costs by
30% over the indexed estimated costs for each irrigation service contract;
iv. for those service contracts identified in (iii) above, identify projects the cost of which
exceeds 5% of total annual renewals costs;
v. review SunWater’s proposed methodology for converting the 22 scheme ARR balances
into separate ARR balances for each distribution system and bulk segment; and
vi. determine whether the application of the methodology adopted by SunWater in (v) above
generates an appropriate result and, if not, recommend adjusted opening balances for
relevant scheme segments for 2012-13.
For (ii), the consultant is to identify and adjust for unplanned expenditure during that period
(details to be sought from and provided by SunWater) and for any expenditure deemed not to
be prudent by the Authority.
For (ii), the consultant is to include in its proposal the option to undertake this analysis
including overheads costs.
5. Proposal Specifications and Fees
The proposal should include the name, address and legal status of the tenderer, and provide:
a) a fixed price quote for the provision of the services for Component 2 of the Review of
SunWater’s Pricing Model; and
b) separate fixed price quote for undertaking each of the three components of the other
concurrent activities.
The fee quoted is to be inclusive of all expenses and disbursements. A full breakdown of
consultancy costs will be required with staff costs reconciled to the consultancy work plan.
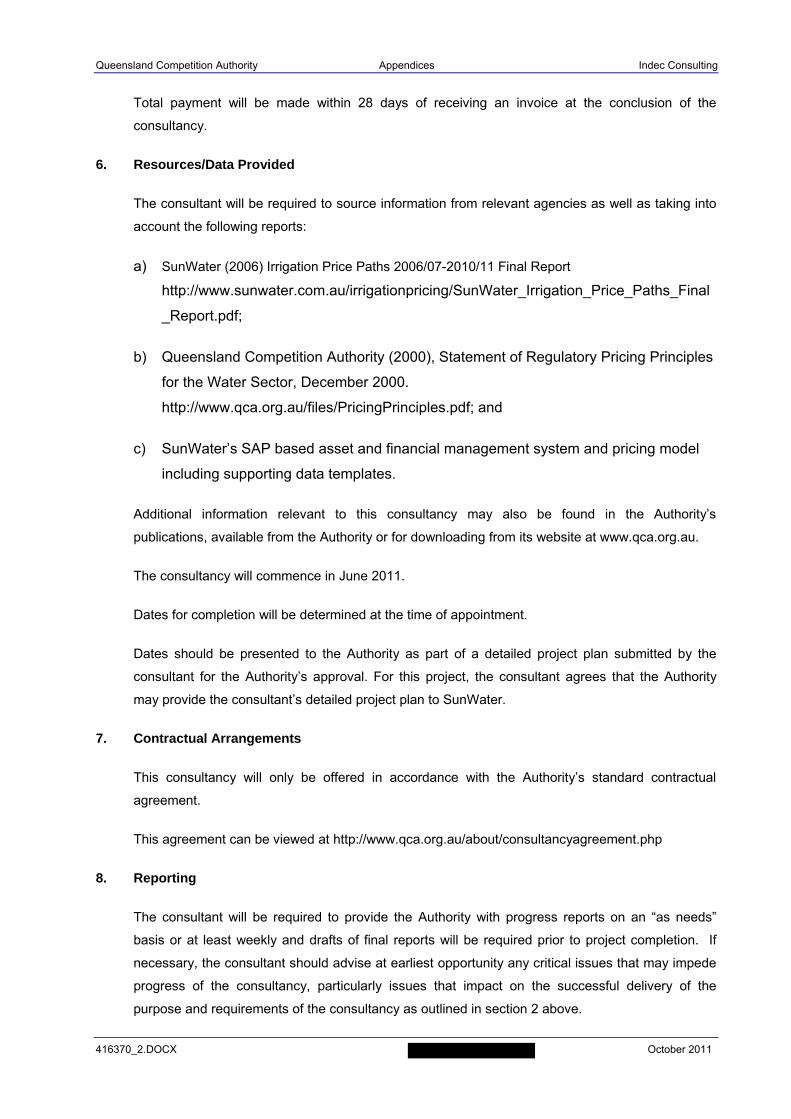
Queensland Competition Authority Appendices Indec Consulting
416370_2.DOCX October 2011
Total payment will be made within 28 days of receiving an invoice at the conclusion of the
consultancy.
6. Resources/Data Provided
The consultant will be required to source information from relevant agencies as well as taking into
account the following reports:
a) SunWater (2006) Irrigation Price Paths 2006/07-2010/11 Final Report
http://www.sunwater.com.au/irrigationpricing/SunWater_Irrigation_Price_Paths_Final
_Report.pdf;
b) Queensland Competition Authority (2000), Statement of Regulatory Pricing Principles
for the Water Sector, December 2000.
http://www.qca.org.au/files/PricingPrinciples.pdf; and
c) SunWater’s SAP based asset and financial management system and pricing model
including supporting data templates.
Additional information relevant to this consultancy may also be found in the Authority’s
publications, available from the Authority or for downloading from its website at www.qca.org.au.
The consultancy will commence in June 2011.
Dates for completion will be determined at the time of appointment.
Dates should be presented to the Authority as part of a detailed project plan submitted by the
consultant for the Authority’s approval. For this project, the consultant agrees that the Authority
may provide the consultant’s detailed project plan to SunWater.
7. Contractual Arrangements
This consultancy will only be offered in accordance with the Authority’s standard contractual
agreement.
This agreement can be viewed at http://www.qca.org.au/about/consultancyagreement.php
8. Reporting
The consultant will be required to provide the Authority with progress reports on an “as needs”
basis or at least weekly and drafts of final reports will be required prior to project completion. If
necessary, the consultant should advise at earliest opportunity any critical issues that may impede
progress of the consultancy, particularly issues that impact on the successful delivery of the
purpose and requirements of the consultancy as outlined in section 2 above.
Queensland Competition Authority Appendices Indec Consulting
416370_2.DOCX October 2011
At the conclusion of the consultancy, the consultant will be required to provide the Authority with a
personal presentation on the findings of the analysis in addition to presenting three (3) copies of a
written report. An electronic version of the final report is also required, saved in Microsoft© Word
with any numeric data in Microsoft© Excel.
9. Confidentiality
Under no circumstances is the selected consultant to divulge any information obtained from the
Authority for the purposes of this consultancy to any party other than with the express permission
of the Authority.
10. Conflicts of Interest
For the purpose of this consultancy, the consultant is required to affirm that there is no, and will not
be any, conflict of interest as a result of this consultancy.
11. Insurance
The consultant must hold all necessary work cover and professional indemnity insurance.
12. Quality Assurance
The consultant is required to include details of quality assurance procedures to be applied to all
information and outputs provided to the Authority.
Queensland Competition Authority Appendices Indec Consulting
416370_2.DOCX October 2011
APPENDIX B
Fixed and Variable Cost Frameworks
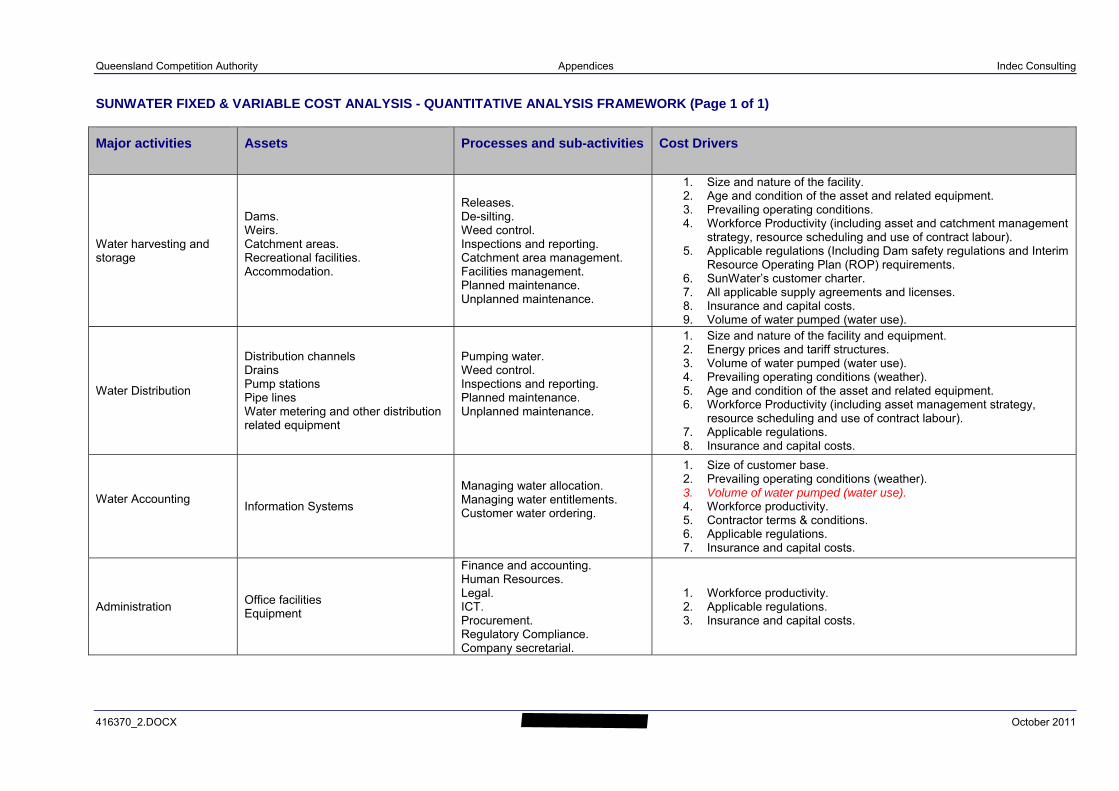
Queensland Competition Authority Appendices Indec Consulting
416370_2.DOCX October 2011
SUNWATER FIXED & VARIABLE COST ANALYSIS - QUANTITATIVE ANALYSIS FRAMEWORK (Page 1 of 1)
Major activities Assets Processes and sub-activities Cost Drivers
Water harvesting and storage
Dams. Weirs. Catchment areas. Recreational facilities. Accommodation.
Releases. De-silting. Weed control. Inspections and reporting. Catchment area management. Facilities management. Planned maintenance. Unplanned maintenance.
1. Size and nature of the facility. 2. Age and condition of the asset and related equipment. 3. Prevailing operating conditions. 4. Workforce Productivity (including asset and catchment management
strategy, resource scheduling and use of contract labour). 5. Applicable regulations (Including Dam safety regulations and Interim
Resource Operating Plan (ROP) requirements. 6. SunWater’s customer charter. 7. All applicable supply agreements and licenses. 8. Insurance and capital costs. 9. Volume of water pumped (water use).
Water Distribution
Distribution channels Drains Pump stations Pipe lines Water metering and other distribution related equipment
Pumping water. Weed control. Inspections and reporting. Planned maintenance. Unplanned maintenance.
1. Size and nature of the facility and equipment. 2. Energy prices and tariff structures. 3. Volume of water pumped (water use). 4. Prevailing operating conditions (weather). 5. Age and condition of the asset and related equipment. 6. Workforce Productivity (including asset management strategy,
resource scheduling and use of contract labour). 7. Applicable regulations. 8. Insurance and capital costs.
Water Accounting Information Systems
Managing water allocation. Managing water entitlements. Customer water ordering.
1. Size of customer base. 2. Prevailing operating conditions (weather). 3. Volume of water pumped (water use). 4. Workforce productivity. 5. Contractor terms & conditions. 6. Applicable regulations. 7. Insurance and capital costs.
Administration Office facilities Equipment
Finance and accounting. Human Resources. Legal. ICT. Procurement. Regulatory Compliance. Company secretarial.
1. Workforce productivity. 2. Applicable regulations. 3. Insurance and capital costs.
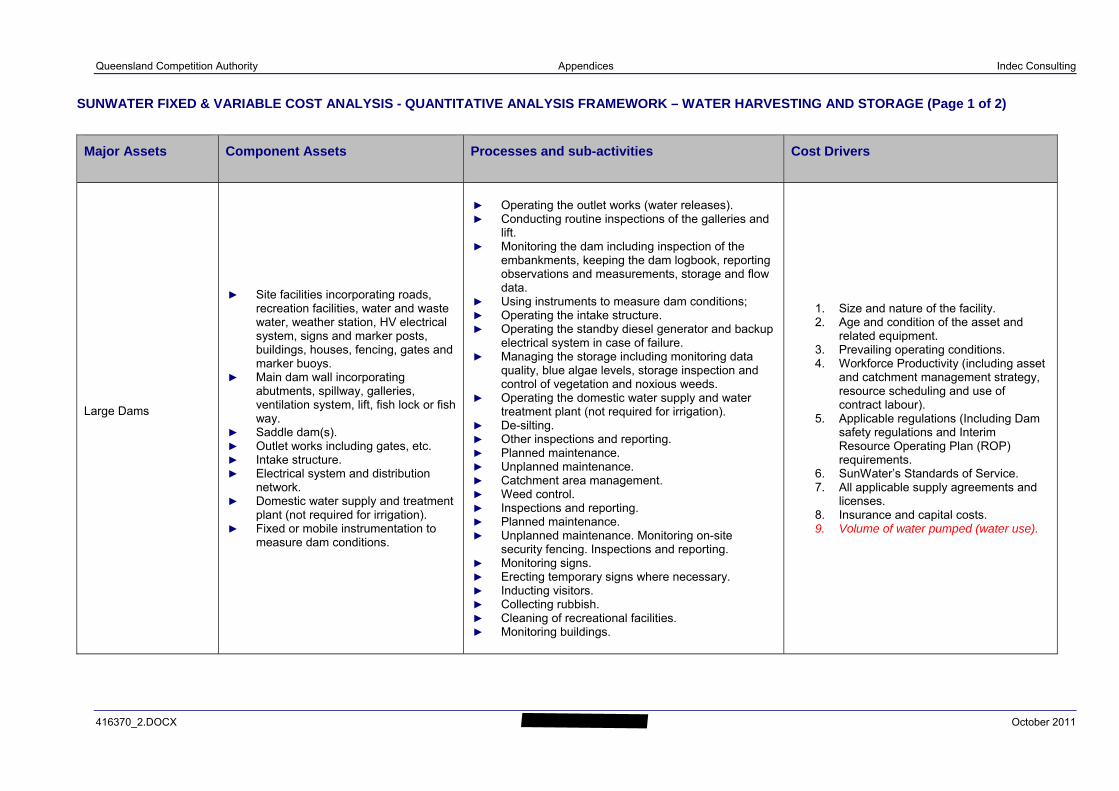
Queensland Competition Authority Appendices Indec Consulting
416370_2.DOCX October 2011
SUNWATER FIXED & VARIABLE COST ANALYSIS - QUANTITATIVE ANALYSIS FRAMEWORK – WATER HARVESTING AND STORAGE (Page 1 of 2)
Major Assets Component Assets Processes and sub-activities Cost Drivers
Large Dams
► Site facilities incorporating roads, recreation facilities, water and waste water, weather station, HV electrical system, signs and marker posts, buildings, houses, fencing, gates and marker buoys.
► Main dam wall incorporating abutments, spillway, galleries, ventilation system, lift, fish lock or fish way.
► Saddle dam(s). ► Outlet works including gates, etc. ► Intake structure. ► Electrical system and distribution
network. ► Domestic water supply and treatment
plant (not required for irrigation). ► Fixed or mobile instrumentation to
measure dam conditions.
► Operating the outlet works (water releases). ► Conducting routine inspections of the galleries and
lift. ► Monitoring the dam including inspection of the
embankments, keeping the dam logbook, reporting observations and measurements, storage and flow data.
► Using instruments to measure dam conditions; ► Operating the intake structure. ► Operating the standby diesel generator and backup
electrical system in case of failure. ► Managing the storage including monitoring data
quality, blue algae levels, storage inspection and control of vegetation and noxious weeds.
► Operating the domestic water supply and water treatment plant (not required for irrigation).
► De-silting. ► Other inspections and reporting. ► Planned maintenance. ► Unplanned maintenance. ► Catchment area management. ► Weed control. ► Inspections and reporting. ► Planned maintenance. ► Unplanned maintenance. Monitoring on-site
security fencing. Inspections and reporting. ► Monitoring signs. ► Erecting temporary signs where necessary. ► Inducting visitors. ► Collecting rubbish. ► Cleaning of recreational facilities. ► Monitoring buildings.
1. Size and nature of the facility. 2. Age and condition of the asset and
related equipment. 3. Prevailing operating conditions. 4. Workforce Productivity (including asset
and catchment management strategy, resource scheduling and use of contract labour).
5. Applicable regulations (Including Dam safety regulations and Interim Resource Operating Plan (ROP) requirements.
6. SunWater’s Standards of Service. 7. All applicable supply agreements and
licenses. 8. Insurance and capital costs. 9. Volume of water pumped (water use).
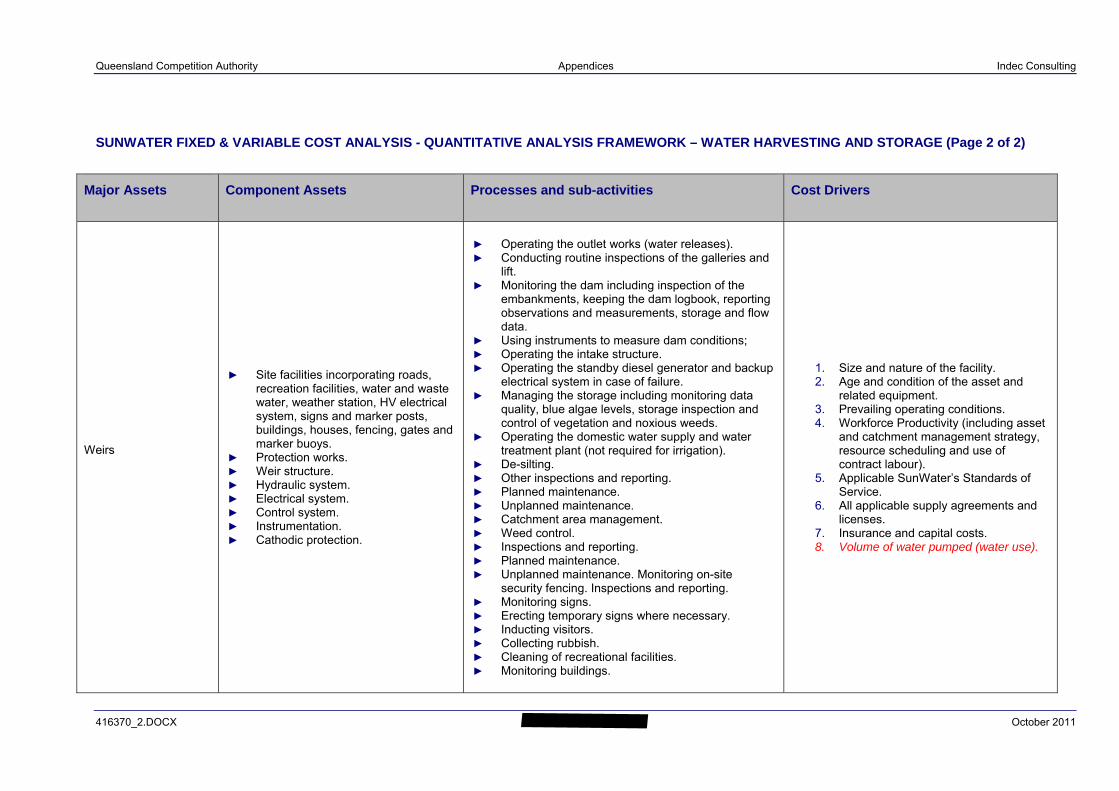
Queensland Competition Authority Appendices Indec Consulting
416370_2.DOCX October 2011
SUNWATER FIXED & VARIABLE COST ANALYSIS - QUANTITATIVE ANALYSIS FRAMEWORK – WATER HARVESTING AND STORAGE (Page 2 of 2)
Major Assets Component Assets Processes and sub-activities Cost Drivers
Weirs
► Site facilities incorporating roads, recreation facilities, water and waste water, weather station, HV electrical system, signs and marker posts, buildings, houses, fencing, gates and marker buoys.
► Protection works. ► Weir structure. ► Hydraulic system. ► Electrical system. ► Control system. ► Instrumentation. ► Cathodic protection.
► Operating the outlet works (water releases). ► Conducting routine inspections of the galleries and
lift. ► Monitoring the dam including inspection of the
embankments, keeping the dam logbook, reporting observations and measurements, storage and flow data.
► Using instruments to measure dam conditions; ► Operating the intake structure. ► Operating the standby diesel generator and backup
electrical system in case of failure. ► Managing the storage including monitoring data
quality, blue algae levels, storage inspection and control of vegetation and noxious weeds.
► Operating the domestic water supply and water treatment plant (not required for irrigation).
► De-silting. ► Other inspections and reporting. ► Planned maintenance. ► Unplanned maintenance. ► Catchment area management. ► Weed control. ► Inspections and reporting. ► Planned maintenance. ► Unplanned maintenance. Monitoring on-site
security fencing. Inspections and reporting. ► Monitoring signs. ► Erecting temporary signs where necessary. ► Inducting visitors. ► Collecting rubbish. ► Cleaning of recreational facilities. ► Monitoring buildings.
1. Size and nature of the facility. 2. Age and condition of the asset and
related equipment. 3. Prevailing operating conditions. 4. Workforce Productivity (including asset
and catchment management strategy, resource scheduling and use of contract labour).
5. Applicable SunWater’s Standards of Service.
6. All applicable supply agreements and licenses.
7. Insurance and capital costs. 8. Volume of water pumped (water use).
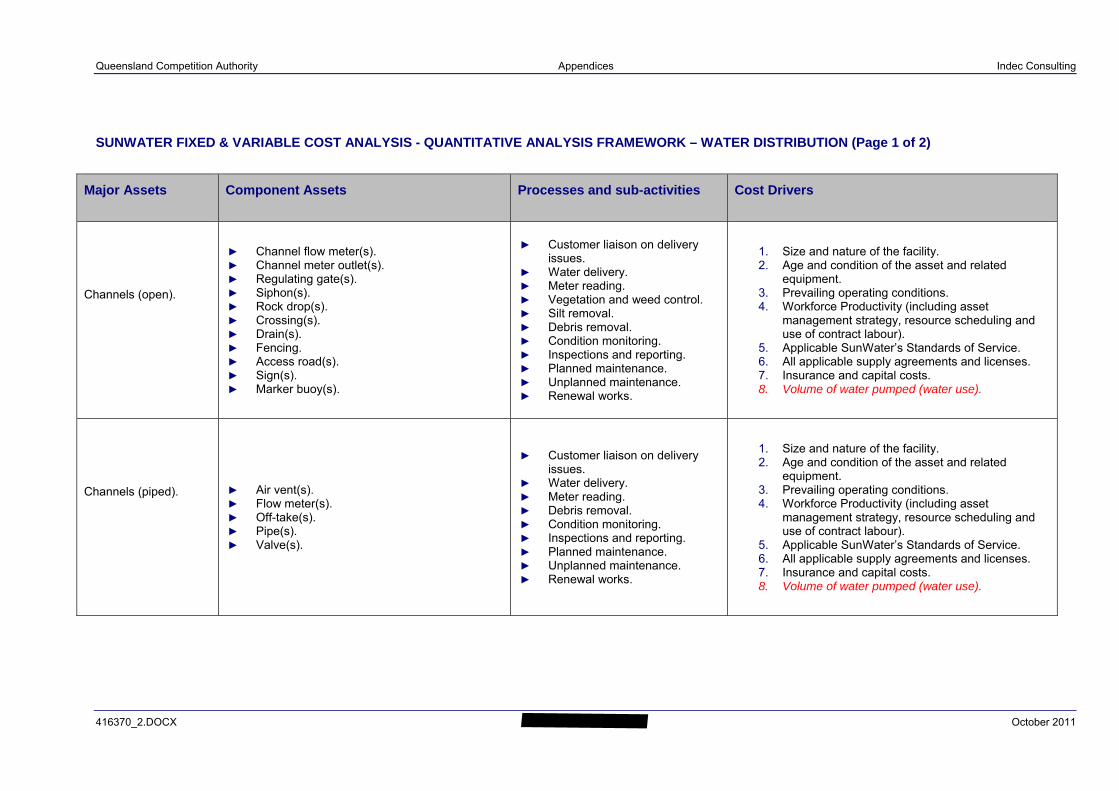
Queensland Competition Authority Appendices Indec Consulting
416370_2.DOCX October 2011
SUNWATER FIXED & VARIABLE COST ANALYSIS - QUANTITATIVE ANALYSIS FRAMEWORK – WATER DISTRIBUTION (Page 1 of 2)
Major Assets Component Assets Processes and sub-activities Cost Drivers
Channels (open).
► Channel flow meter(s). ► Channel meter outlet(s). ► Regulating gate(s). ► Siphon(s). ► Rock drop(s). ► Crossing(s). ► Drain(s). ► Fencing. ► Access road(s). ► Sign(s). ► Marker buoy(s).
► Customer liaison on delivery issues.
► Water delivery. ► Meter reading. ► Vegetation and weed control. ► Silt removal. ► Debris removal. ► Condition monitoring. ► Inspections and reporting. ► Planned maintenance. ► Unplanned maintenance. ► Renewal works.
1. Size and nature of the facility. 2. Age and condition of the asset and related
equipment. 3. Prevailing operating conditions. 4. Workforce Productivity (including asset
management strategy, resource scheduling and use of contract labour).
5. Applicable SunWater’s Standards of Service. 6. All applicable supply agreements and licenses. 7. Insurance and capital costs. 8. Volume of water pumped (water use).
Channels (piped).
► Air vent(s). ► Flow meter(s). ► Off-take(s). ► Pipe(s). ► Valve(s).
► Customer liaison on delivery issues.
► Water delivery. ► Meter reading. ► Debris removal. ► Condition monitoring. ► Inspections and reporting. ► Planned maintenance. ► Unplanned maintenance. ► Renewal works.
1. Size and nature of the facility. 2. Age and condition of the asset and related
equipment. 3. Prevailing operating conditions. 4. Workforce Productivity (including asset
management strategy, resource scheduling and use of contract labour).
5. Applicable SunWater’s Standards of Service. 6. All applicable supply agreements and licenses. 7. Insurance and capital costs. 8. Volume of water pumped (water use).
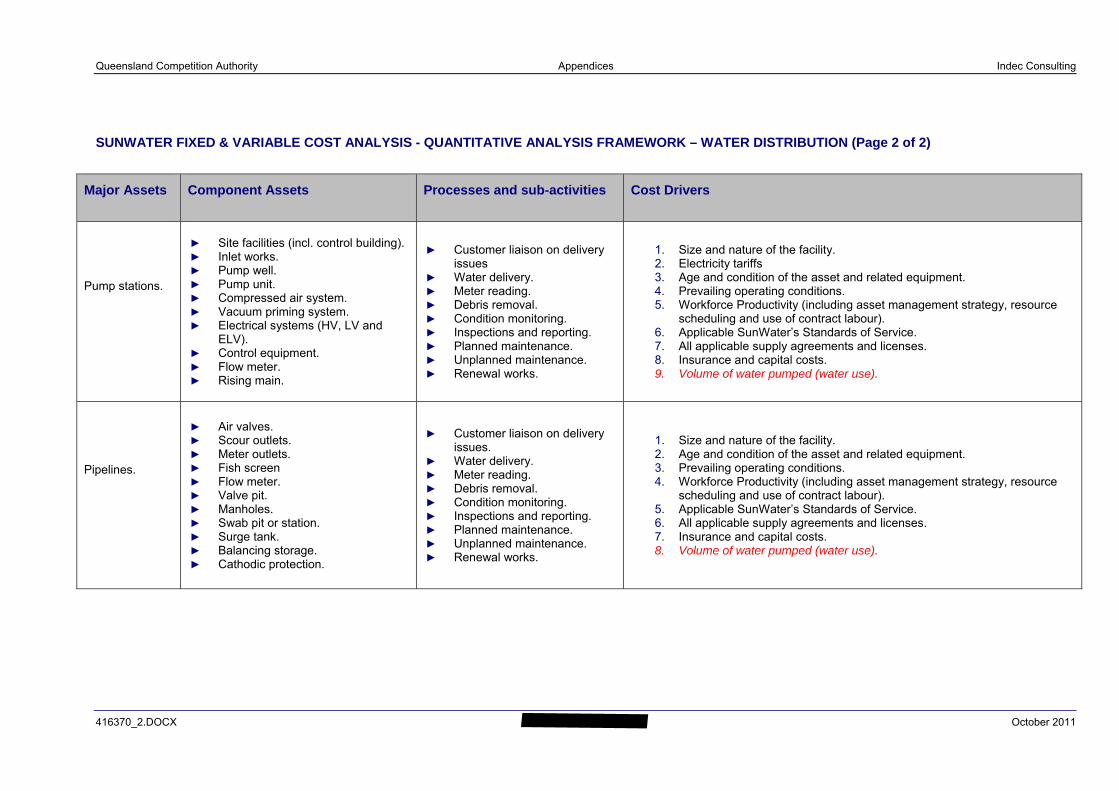
Queensland Competition Authority Appendices Indec Consulting
416370_2.DOCX October 2011
SUNWATER FIXED & VARIABLE COST ANALYSIS - QUANTITATIVE ANALYSIS FRAMEWORK – WATER DISTRIBUTION (Page 2 of 2)
Major Assets Component Assets Processes and sub-activities Cost Drivers
Pump stations.
► Site facilities (incl. control building). ► Inlet works. ► Pump well. ► Pump unit. ► Compressed air system. ► Vacuum priming system. ► Electrical systems (HV, LV and
ELV). ► Control equipment. ► Flow meter. ► Rising main.
► Customer liaison on delivery issues
► Water delivery. ► Meter reading. ► Debris removal. ► Condition monitoring. ► Inspections and reporting. ► Planned maintenance. ► Unplanned maintenance. ► Renewal works.
1. Size and nature of the facility. 2. Electricity tariffs 3. Age and condition of the asset and related equipment. 4. Prevailing operating conditions. 5. Workforce Productivity (including asset management strategy, resource
scheduling and use of contract labour). 6. Applicable SunWater’s Standards of Service. 7. All applicable supply agreements and licenses. 8. Insurance and capital costs. 9. Volume of water pumped (water use).
Pipelines.
► Air valves. ► Scour outlets. ► Meter outlets. ► Fish screen ► Flow meter. ► Valve pit. ► Manholes. ► Swab pit or station. ► Surge tank. ► Balancing storage. ► Cathodic protection.
► Customer liaison on delivery issues.
► Water delivery. ► Meter reading. ► Debris removal. ► Condition monitoring. ► Inspections and reporting. ► Planned maintenance. ► Unplanned maintenance. ► Renewal works.
1. Size and nature of the facility. 2. Age and condition of the asset and related equipment. 3. Prevailing operating conditions. 4. Workforce Productivity (including asset management strategy, resource
scheduling and use of contract labour). 5. Applicable SunWater’s Standards of Service. 6. All applicable supply agreements and licenses. 7. Insurance and capital costs. 8. Volume of water pumped (water use).
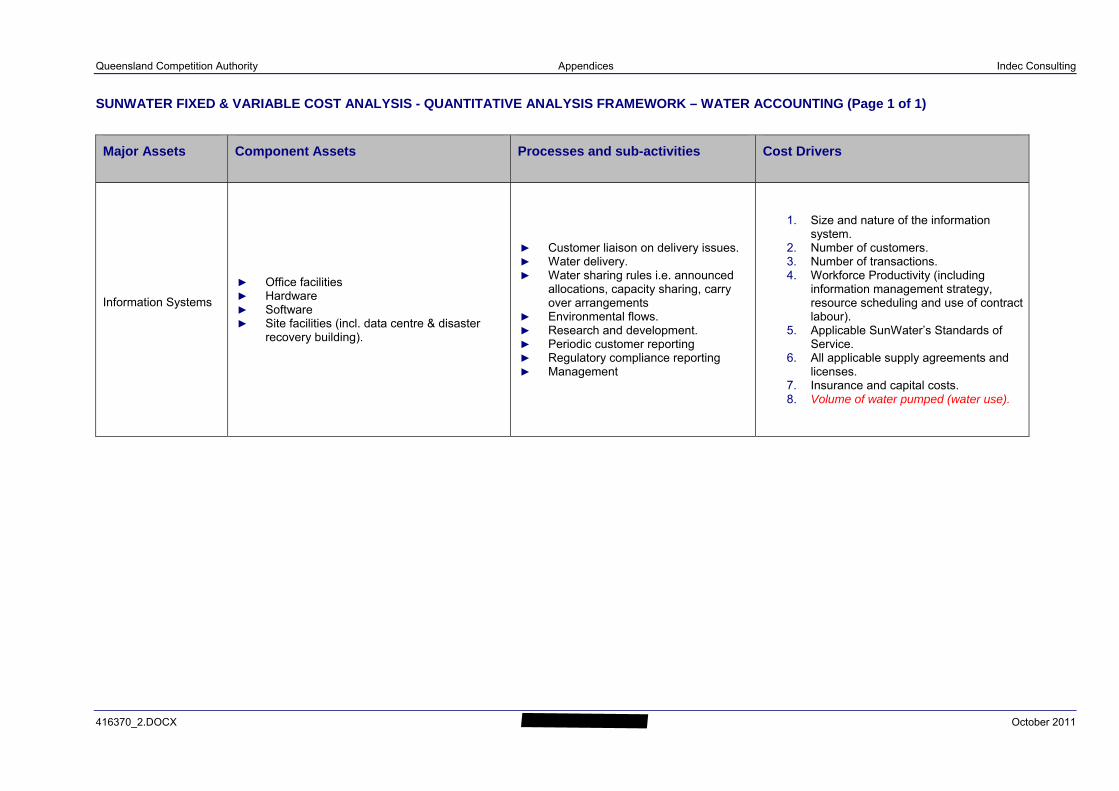
Queensland Competition Authority Appendices Indec Consulting
416370_2.DOCX October 2011
SUNWATER FIXED & VARIABLE COST ANALYSIS - QUANTITATIVE ANALYSIS FRAMEWORK – WATER ACCOUNTING (Page 1 of 1)
Major Assets Component Assets Processes and sub-activities Cost Drivers
Information Systems
► Office facilities ► Hardware ► Software ► Site facilities (incl. data centre & disaster
recovery building).
► Customer liaison on delivery issues. ► Water delivery. ► Water sharing rules i.e. announced
allocations, capacity sharing, carry over arrangements
► Environmental flows. ► Research and development. ► Periodic customer reporting ► Regulatory compliance reporting ► Management
1. Size and nature of the information system.
2. Number of customers. 3. Number of transactions. 4. Workforce Productivity (including
information management strategy, resource scheduling and use of contract labour).
5. Applicable SunWater’s Standards of Service.
6. All applicable supply agreements and licenses.
7. Insurance and capital costs. 8. Volume of water pumped (water use).
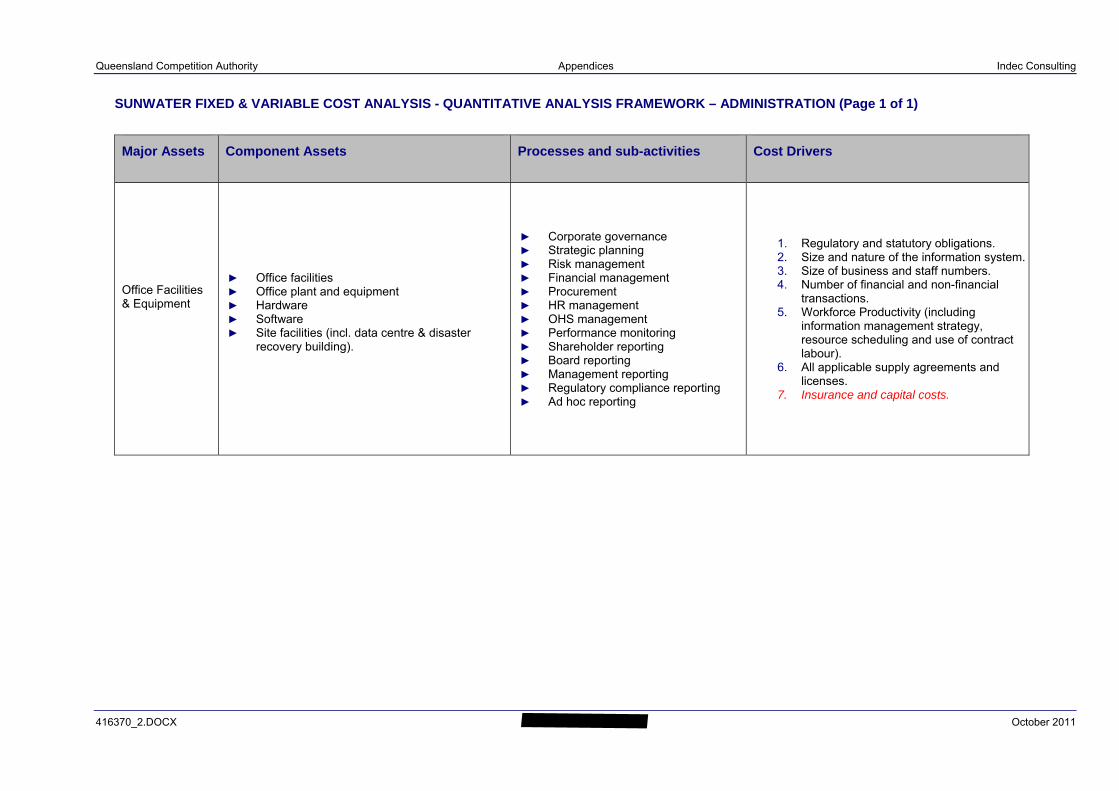
Queensland Competition Authority Appendices Indec Consulting
416370_2.DOCX October 2011
SUNWATER FIXED & VARIABLE COST ANALYSIS - QUANTITATIVE ANALYSIS FRAMEWORK – ADMINISTRATION (Page 1 of 1)
Major Assets Component Assets Processes and sub-activities Cost Drivers
Office Facilities & Equipment
► Office facilities ► Office plant and equipment ► Hardware ► Software ► Site facilities (incl. data centre & disaster
recovery building).
► Corporate governance ► Strategic planning ► Risk management ► Financial management ► Procurement ► HR management ► OHS management ► Performance monitoring ► Shareholder reporting ► Board reporting ► Management reporting ► Regulatory compliance reporting ► Ad hoc reporting
1. Regulatory and statutory obligations. 2. Size and nature of the information system. 3. Size of business and staff numbers. 4. Number of financial and non-financial
transactions. 5. Workforce Productivity (including
information management strategy, resource scheduling and use of contract labour).
6. All applicable supply agreements and licenses.
7. Insurance and capital costs.
Queensland Competition Authority Appendices Indec Consulting
416370_2.DOCX October 2011
APPENDIX C
Regression Analysis Results
Selected Expenses versus Water Use
July 2007 to June 2011
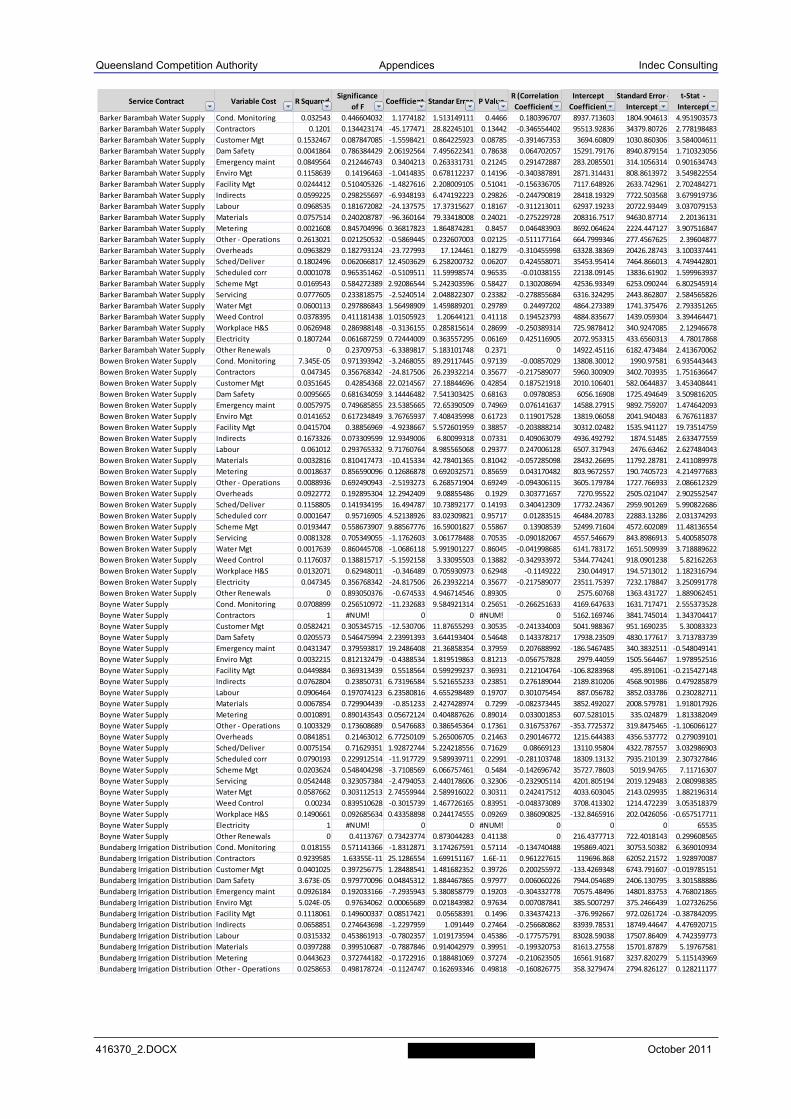
Queensland Competition Authority Appendices Indec Consulting
416370_2.DOCX October 2011
Service Contract Variable Cost R SquaredSignificance
of FCoefficient Standar Error P Value
R (Correlation
Coefficient
Intercept
Coefficient
Standard Error ‐
Intercept
t‐Stat ‐
Intercept
Barker Barambah Water Supply Cond. Monitoring 0.032543 0.446604032 1.1774182 1.513149111 0.4466 0.180396707 8937.713603 1804.904613 4.951903573
Barker Barambah Water Supply Contractors 0.1201 0.134423174 ‐45.177471 28.82245101 0.13442 ‐0.346554402 95513.92836 34379.80726 2.778198483
Barker Barambah Water Supply Customer Mgt 0.1532467 0.087847085 ‐1.5598421 0.864225923 0.08785 ‐0.391467353 3694.60809 1030.860306 3.584004611
Barker Barambah Water Supply Dam Safety 0.0041864 0.786384429 2.06192564 7.495622341 0.78638 0.064702057 15291.79176 8940.879154 1.710323056
Barker Barambah Water Supply Emergency maint 0.0849564 0.212446743 0.3404213 0.263331731 0.21245 0.291472887 283.2085501 314.1056314 0.901634743
Barker Barambah Water Supply Enviro Mgt 0.1158639 0.14196463 ‐1.0414835 0.678112237 0.14196 ‐0.340387891 2871.314431 808.8613972 3.549822554
Barker Barambah Water Supply Facility Mgt 0.0244412 0.510405326 ‐1.4827616 2.208009105 0.51041 ‐0.156336705 7117.648926 2633.742961 2.702484271
Barker Barambah Water Supply Indirects 0.0599225 0.298255697 ‐6.9348193 6.474192223 0.29826 ‐0.244790819 28418.19329 7722.503568 3.679919736
Barker Barambah Water Supply Labour 0.0968535 0.181672082 ‐24.137575 17.37315627 0.18167 ‐0.311213011 62937.19233 20722.93449 3.037079153
Barker Barambah Water Supply Materials 0.0757514 0.240208787 ‐96.360164 79.33418008 0.24021 ‐0.275229728 208316.7517 94630.87714 2.20136131
Barker Barambah Water Supply Metering 0.0021608 0.845704996 0.36817823 1.864874281 0.8457 0.046483903 8692.064624 2224.447127 3.907516847
Barker Barambah Water Supply Other ‐ Operations 0.2613021 0.021250532 ‐0.5869445 0.232607003 0.02125 ‐0.511177164 664.7999346 277.4567625 2.39604877
Barker Barambah Water Supply Overheads 0.0963829 0.182793124 ‐23.727993 17.124461 0.18279 ‐0.310455998 63328.38369 20426.28743 3.100337441
Barker Barambah Water Supply Sched/Deliver 0.1802496 0.062066817 12.4503629 6.258200732 0.06207 0.424558071 35453.95414 7464.866013 4.749442801
Barker Barambah Water Supply Scheduled corr 0.0001078 0.965351462 ‐0.5109511 11.59998574 0.96535 ‐0.01038155 22138.09145 13836.61902 1.599963937
Barker Barambah Water Supply Scheme Mgt 0.0169543 0.584272389 2.92086544 5.242303596 0.58427 0.130208694 42536.93349 6253.090244 6.802545914
Barker Barambah Water Supply Servicing 0.0777605 0.233818575 ‐2.5240514 2.048822307 0.23382 ‐0.278855684 6316.324295 2443.862807 2.584565826
Barker Barambah Water Supply Water Mgt 0.0600113 0.297886843 1.56498909 1.459889201 0.29789 0.24497202 4864.273389 1741.375476 2.793351265
Barker Barambah Water Supply Weed Control 0.0378395 0.411181438 1.01505923 1.20644121 0.41118 0.194523793 4884.835677 1439.059304 3.394464471
Barker Barambah Water Supply Workplace H&S 0.0626948 0.286988148 ‐0.3136155 0.285815614 0.28699 ‐0.250389314 725.9878412 340.9247085 2.12946678
Barker Barambah Water Supply Electricity 0.1807244 0.061687259 0.72444009 0.363557295 0.06169 0.425116905 2072.953315 433.6560313 4.78017868
Barker Barambah Water Supply Other Renewals 0 0.23709753 ‐6.3389817 5.183101748 0.2371 0 14922.45116 6182.473484 2.413670062
Bowen Broken Water Supply Cond. Monitoring 7.345E‐05 0.971393942 ‐3.2468055 89.29117445 0.97139 ‐0.00857029 13808.30012 1990.97581 6.935443443
Bowen Broken Water Supply Contractors 0.047345 0.356768342 ‐24.817506 26.23932214 0.35677 ‐0.217589077 5960.300909 3402.703935 1.751636647
Bowen Broken Water Supply Customer Mgt 0.0351645 0.42854368 22.0214567 27.18844696 0.42854 0.187521918 2010.106401 582.0644837 3.453408441
Bowen Broken Water Supply Dam Safety 0.0095665 0.681634059 3.14446482 7.541303425 0.68163 0.09780853 6056.16908 1725.494649 3.509816205
Bowen Broken Water Supply Emergency maint 0.0057975 0.749685855 23.5385665 72.65390509 0.74969 0.076141637 14588.27915 9892.759207 1.474642093
Bowen Broken Water Supply Enviro Mgt 0.0141652 0.617234849 3.76765937 7.408435998 0.61723 0.119017528 13819.06058 2041.940483 6.767611837
Bowen Broken Water Supply Facility Mgt 0.0415704 0.38856969 ‐4.9238667 5.572601959 0.38857 ‐0.203888214 30312.02482 1535.941127 19.73514759
Bowen Broken Water Supply Indirects 0.1673326 0.073309599 12.9349006 6.80099318 0.07331 0.409063079 4936.492792 1874.51485 2.633477559
Bowen Broken Water Supply Labour 0.061012 0.293765332 9.71760764 8.985565068 0.29377 0.247006128 6507.317943 2476.63462 2.627484043
Bowen Broken Water Supply Materials 0.0032816 0.810417473 ‐10.415334 42.78401365 0.81042 ‐0.057285098 28432.26695 11792.28781 2.411089978
Bowen Broken Water Supply Metering 0.0018637 0.856590096 0.12686878 0.692032571 0.85659 0.043170482 803.9672557 190.7405723 4.214977683
Bowen Broken Water Supply Other ‐ Operations 0.0088936 0.692490943 ‐2.5193273 6.268571904 0.69249 ‐0.094306115 3605.179784 1727.766933 2.086612329
Bowen Broken Water Supply Overheads 0.0922772 0.192895304 12.2942409 9.08855486 0.1929 0.303771657 7270.95522 2505.021047 2.902552547
Bowen Broken Water Supply Sched/Deliver 0.1158805 0.141934195 16.494787 10.73892177 0.14193 0.340412309 17732.24367 2959.901269 5.990822686
Bowen Broken Water Supply Scheduled corr 0.0001647 0.95716905 4.52138926 83.02309821 0.95717 0.01283515 46484.20783 22883.13286 2.031374293
Bowen Broken Water Supply Scheme Mgt 0.0193447 0.558673907 9.88567776 16.59001827 0.55867 0.13908539 52499.71604 4572.602089 11.48136554
Bowen Broken Water Supply Servicing 0.0081328 0.705349055 ‐1.1762603 3.061778488 0.70535 ‐0.090182067 4557.546679 843.8986913 5.400585078
Bowen Broken Water Supply Water Mgt 0.0017639 0.860445708 ‐1.0686118 5.991901227 0.86045 ‐0.041998685 6141.783172 1651.509939 3.718889622
Bowen Broken Water Supply Weed Control 0.1176037 0.138815717 ‐5.1592158 3.33095503 0.13882 ‐0.342933972 5344.774241 918.0901238 5.82162263
Bowen Broken Water Supply Workplace H&S 0.0132071 0.62948011 ‐0.346489 0.705930973 0.62948 ‐0.1149222 230.044917 194.5713012 1.182316794
Bowen Broken Water Supply Electricity 0.047345 0.356768342 ‐24.817506 26.23932214 0.35677 ‐0.217589077 23511.75397 7232.178847 3.250991778
Bowen Broken Water Supply Other Renewals 0 0.893050376 ‐0.674533 4.946714546 0.89305 0 2575.60768 1363.431727 1.889062451
Boyne Water Supply Cond. Monitoring 0.0708899 0.256510972 ‐11.232683 9.584921314 0.25651 ‐0.266251633 4169.647633 1631.717471 2.555373528
Boyne Water Supply Contractors 1 #NUM! 0 0 #NUM! 0 5162.169746 3841.745014 1.343704417
Boyne Water Supply Customer Mgt 0.0582421 0.305345715 ‐12.530706 11.87655293 0.30535 ‐0.241334003 5041.988367 951.1690235 5.30083323
Boyne Water Supply Dam Safety 0.0205573 0.546475994 2.23991393 3.644193404 0.54648 0.143378217 17938.23509 4830.177617 3.713783739
Boyne Water Supply Emergency maint 0.0431347 0.379593817 19.2486408 21.36858354 0.37959 0.207688992 ‐186.5467485 340.3832511 ‐0.548049141
Boyne Water Supply Enviro Mgt 0.0032215 0.812132479 ‐0.4388534 1.819519863 0.81213 ‐0.056757828 2979.44059 1505.564467 1.978952516
Boyne Water Supply Facility Mgt 0.0449884 0.369313439 0.5518564 0.599299237 0.36931 0.212104764 ‐106.8283968 495.891061 ‐0.215427148
Boyne Water Supply Indirects 0.0762804 0.23850731 6.73196584 5.521655233 0.23851 0.276189044 2189.810206 4568.901986 0.479285879
Boyne Water Supply Labour 0.0906464 0.197074123 6.23580816 4.655298489 0.19707 0.301075454 887.056782 3852.033786 0.230282711
Boyne Water Supply Materials 0.0067854 0.729904439 ‐0.851233 2.427428974 0.7299 ‐0.082373445 3852.492027 2008.579781 1.918017926
Boyne Water Supply Metering 0.0010891 0.890143543 0.05672124 0.404887626 0.89014 0.033001853 607.5281015 335.024879 1.813382049
Boyne Water Supply Other ‐ Operations 0.1003329 0.173608689 0.5476683 0.386545364 0.17361 0.316753767 ‐353.7725372 319.8475465 ‐1.106066127
Boyne Water Supply Overheads 0.0841851 0.21463012 6.77250109 5.265006705 0.21463 0.290146772 1215.644383 4356.537772 0.279039101
Boyne Water Supply Sched/Deliver 0.0075154 0.71629351 1.92872744 5.224218556 0.71629 0.08669123 13110.95804 4322.787557 3.032986903
Boyne Water Supply Scheduled corr 0.0790193 0.229912514 ‐11.917729 9.589939711 0.22991 ‐0.281103748 18309.13132 7935.210139 2.307327846
Boyne Water Supply Scheme Mgt 0.0203624 0.548404298 ‐3.7108569 6.066757461 0.5484 ‐0.142696742 35727.78603 5019.94765 7.11716307
Boyne Water Supply Servicing 0.0542448 0.323057384 ‐2.4794053 2.440178606 0.32306 ‐0.232905114 4201.805194 2019.129483 2.080998385
Boyne Water Supply Water Mgt 0.0587662 0.303112513 2.74559944 2.589916022 0.30311 0.242417512 4033.603045 2143.029935 1.882196314
Boyne Water Supply Weed Control 0.00234 0.839510628 ‐0.3015739 1.467726165 0.83951 ‐0.048373089 3708.413302 1214.472239 3.053518379
Boyne Water Supply Workplace H&S 0.1490661 0.092685634 0.43358898 0.244174555 0.09269 0.386090825 ‐132.8465916 202.0426056 ‐0.657517711
Boyne Water Supply Electricity 1 #NUM! 0 0 #NUM! 0 0 0 65535
Boyne Water Supply Other Renewals 0 0.4113767 0.73423774 0.873044283 0.41138 0 216.4377713 722.4018143 0.299608565
Bundaberg Irrigation Distribution Cond. Monitoring 0.018155 0.571141366 ‐1.8312871 3.174267591 0.57114 ‐0.134740488 195869.4021 30753.50382 6.369010934
Bundaberg Irrigation Distribution Contractors 0.9239585 1.63355E‐11 25.1286554 1.699151167 1.6E‐11 0.961227615 119696.868 62052.21572 1.928970087
Bundaberg Irrigation Distribution Customer Mgt 0.0401025 0.397256775 1.28488541 1.481682352 0.39726 0.200255972 ‐133.4269348 6743.791607 ‐0.019785151
Bundaberg Irrigation Distribution Dam Safety 3.673E‐05 0.979770096 0.04845312 1.884467865 0.97977 0.006060226 7944.054689 2406.130795 3.301588886
Bundaberg Irrigation Distribution Emergency maint 0.0926184 0.192033166 ‐7.2935943 5.380858779 0.19203 ‐0.304332778 70575.48496 14801.83753 4.768021865
Bundaberg Irrigation Distribution Enviro Mgt 5.024E‐05 0.97634062 0.00065689 0.021843982 0.97634 0.007087841 385.5007297 375.2466439 1.027326256
Bundaberg Irrigation Distribution Facility Mgt 0.1118061 0.149600337 0.08517421 0.05658391 0.1496 0.334374213 ‐376.992667 972.0261724 ‐0.387842095
Bundaberg Irrigation Distribution Indirects 0.0658851 0.274643698 ‐1.2297959 1.091449 0.27464 ‐0.256680862 83939.78531 18749.44647 4.476920715
Bundaberg Irrigation Distribution Labour 0.0315332 0.453861913 ‐0.7802357 1.019173594 0.45386 ‐0.177575791 83028.59038 17507.86409 4.742359773
Bundaberg Irrigation Distribution Materials 0.0397288 0.399510687 ‐0.7887846 0.914042979 0.39951 ‐0.199320753 81613.27558 15701.87879 5.19767581
Bundaberg Irrigation Distribution Metering 0.0443623 0.372744182 ‐0.1722916 0.188481069 0.37274 ‐0.210623505 16561.91687 3237.820279 5.115143969
Bundaberg Irrigation Distribution Other ‐ Operations 0.0258653 0.498178724 ‐0.1124747 0.162693346 0.49818 ‐0.160826775 358.3279474 2794.826127 0.128211177
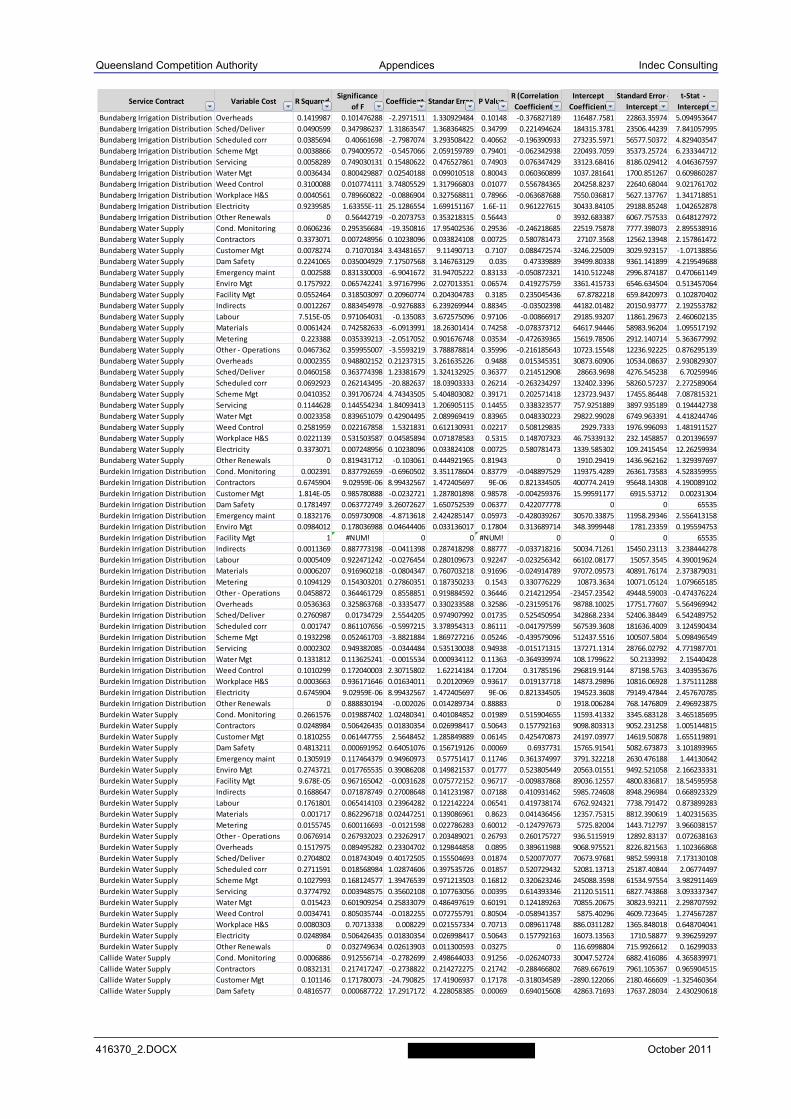
Queensland Competition Authority Appendices Indec Consulting
416370_2.DOCX October 2011
Service Contract Variable Cost R SquaredSignificance
of FCoefficient Standar Error P Value
R (Correlation
Coefficient
Intercept
Coefficient
Standard Error ‐
Intercept
t‐Stat ‐
Intercept
Bundaberg Irrigation Distribution Overheads 0.1419987 0.101476288 ‐2.2971511 1.330929484 0.10148 ‐0.376827189 116487.7581 22863.35974 5.094953647
Bundaberg Irrigation Distribution Sched/Deliver 0.0490599 0.347986237 1.31863547 1.368364825 0.34799 0.221494624 184315.3781 23506.44239 7.841057995
Bundaberg Irrigation Distribution Scheduled corr 0.0385694 0.40661698 ‐2.7987074 3.293508422 0.40662 ‐0.196390933 273235.5971 56577.50372 4.829403547
Bundaberg Irrigation Distribution Scheme Mgt 0.0038866 0.794009572 ‐0.5457066 2.059159789 0.79401 ‐0.062342938 220493.7059 35373.25724 6.233344712
Bundaberg Irrigation Distribution Servicing 0.0058289 0.749030131 0.15480622 0.476527861 0.74903 0.076347429 33123.68416 8186.029412 4.046367597
Bundaberg Irrigation Distribution Water Mgt 0.0036434 0.800429887 0.02540188 0.099010518 0.80043 0.060360899 1037.281641 1700.851267 0.609860287
Bundaberg Irrigation Distribution Weed Control 0.3100088 0.010774111 3.74805529 1.317966803 0.01077 0.556784365 204258.8237 22640.68044 9.021761702
Bundaberg Irrigation Distribution Workplace H&S 0.0040561 0.789660822 ‐0.0886904 0.327568811 0.78966 ‐0.063687688 7550.036817 5627.137767 1.341718851
Bundaberg Irrigation Distribution Electricity 0.9239585 1.63355E‐11 25.1286554 1.699151167 1.6E‐11 0.961227615 30433.84105 29188.85248 1.042652878
Bundaberg Irrigation Distribution Other Renewals 0 0.56442719 ‐0.2073753 0.353218315 0.56443 0 3932.683387 6067.757533 0.648127972
Bundaberg Water Supply Cond. Monitoring 0.0606236 0.295356684 ‐19.350816 17.95402536 0.29536 ‐0.246218685 22519.75878 7777.398073 2.895538916
Bundaberg Water Supply Contractors 0.3373071 0.007248956 0.10238096 0.033824108 0.00725 0.580781473 27107.3568 12562.13948 2.157861472
Bundaberg Water Supply Customer Mgt 0.0078274 0.71070184 3.43481657 9.11490713 0.7107 0.088472574 ‐3246.225009 3029.923157 ‐1.07138856
Bundaberg Water Supply Dam Safety 0.2241065 0.035004929 7.17507568 3.146763129 0.035 0.47339889 39499.80338 9361.141899 4.219549688
Bundaberg Water Supply Emergency maint 0.002588 0.831330003 ‐6.9041672 31.94705222 0.83133 ‐0.050872321 1410.512248 2996.874187 0.470661149
Bundaberg Water Supply Enviro Mgt 0.1757922 0.065742241 3.97167996 2.027013351 0.06574 0.419275759 3361.415733 6546.634504 0.513457064
Bundaberg Water Supply Facility Mgt 0.0552464 0.318503097 0.20960774 0.204304783 0.3185 0.235045436 67.8782218 659.8420973 0.102870402
Bundaberg Water Supply Indirects 0.0012267 0.883454978 ‐0.9276883 6.239269944 0.88345 ‐0.03502398 44182.01482 20150.93777 2.192553782
Bundaberg Water Supply Labour 7.515E‐05 0.971064031 ‐0.135083 3.672575096 0.97106 ‐0.00866917 29185.93207 11861.29673 2.460602135
Bundaberg Water Supply Materials 0.0061424 0.742582633 ‐6.0913991 18.26301414 0.74258 ‐0.078373712 64617.94446 58983.96204 1.095517192
Bundaberg Water Supply Metering 0.223388 0.035339213 ‐2.0517052 0.901676748 0.03534 ‐0.472639365 15619.78506 2912.140714 5.363677992
Bundaberg Water Supply Other ‐ Operations 0.0467362 0.359955007 ‐3.5593219 3.788878814 0.35996 ‐0.216185643 10723.15548 12236.92225 0.876295139
Bundaberg Water Supply Overheads 0.0002355 0.948802152 0.21237315 3.261635226 0.9488 0.015345351 30873.60906 10534.08637 2.930829307
Bundaberg Water Supply Sched/Deliver 0.0460158 0.363774398 1.23381679 1.324132925 0.36377 0.214512908 28663.9698 4276.545238 6.70259946
Bundaberg Water Supply Scheduled corr 0.0692923 0.262143495 ‐20.882637 18.03903333 0.26214 ‐0.263234297 132402.3396 58260.57237 2.272589064
Bundaberg Water Supply Scheme Mgt 0.0410352 0.391706724 4.74343505 5.404803082 0.39171 0.202571418 123723.9437 17455.86448 7.087815321
Bundaberg Water Supply Servicing 0.1144628 0.144554234 1.84093413 1.206905115 0.14455 0.338323577 757.9251889 3897.935189 0.194442738
Bundaberg Water Supply Water Mgt 0.0023358 0.839651079 0.42904495 2.089969419 0.83965 0.048330223 29822.99028 6749.963391 4.418244746
Bundaberg Water Supply Weed Control 0.2581959 0.022167858 1.5321831 0.612130931 0.02217 0.508129835 2929.7333 1976.996093 1.481911527
Bundaberg Water Supply Workplace H&S 0.0221139 0.531503587 0.04585894 0.071878583 0.5315 0.148707323 46.75339132 232.1458857 0.201396597
Bundaberg Water Supply Electricity 0.3373071 0.007248956 0.10238096 0.033824108 0.00725 0.580781473 1339.585302 109.2415454 12.26259934
Bundaberg Water Supply Other Renewals 0 0.819431712 ‐0.103061 0.444921965 0.81943 0 1910.29419 1436.962162 1.329397697
Burdekin Irrigation Distribution Cond. Monitoring 0.002391 0.837792659 ‐0.6960502 3.351178604 0.83779 ‐0.048897529 119375.4289 26361.73583 4.528359955
Burdekin Irrigation Distribution Contractors 0.6745904 9.02959E‐06 8.99432567 1.472405697 9E‐06 0.821334505 400774.2419 95648.14308 4.190089102
Burdekin Irrigation Distribution Customer Mgt 1.814E‐05 0.985780888 ‐0.0232721 1.287801898 0.98578 ‐0.004259376 15.99591177 6915.53712 0.00231304
Burdekin Irrigation Distribution Dam Safety 0.1781497 0.063772749 3.26072627 1.650752539 0.06377 0.422077778 0 0 65535
Burdekin Irrigation Distribution Emergency maint 0.1832176 0.059730908 ‐4.8713618 2.424285147 0.05973 ‐0.428039267 30570.33875 11958.29346 2.556413158
Burdekin Irrigation Distribution Enviro Mgt 0.0984012 0.178036988 0.04644406 0.033136017 0.17804 0.313689714 348.3999448 1781.23359 0.195594753
Burdekin Irrigation Distribution Facility Mgt 1 #NUM! 0 0 #NUM! 0 0 0 65535
Burdekin Irrigation Distribution Indirects 0.0011369 0.887773198 ‐0.0411398 0.287418298 0.88777 ‐0.033718216 50034.71261 15450.23113 3.238444278
Burdekin Irrigation Distribution Labour 0.0005409 0.922471242 ‐0.0276454 0.280109673 0.92247 ‐0.023256342 66102.08177 15057.3545 4.390019624
Burdekin Irrigation Distribution Materials 0.0006207 0.916960218 ‐0.0804347 0.760703218 0.91696 ‐0.024914789 97072.09573 40891.76174 2.373879031
Burdekin Irrigation Distribution Metering 0.1094129 0.154303201 0.27860351 0.187350233 0.1543 0.330776229 10873.3634 10071.05124 1.079665185
Burdekin Irrigation Distribution Other ‐ Operations 0.0458872 0.364461729 0.8558851 0.919884592 0.36446 0.214212954 ‐23457.23542 49448.59003 ‐0.474376224
Burdekin Irrigation Distribution Overheads 0.0536363 0.325863768 ‐0.3335477 0.330233588 0.32586 ‐0.231595176 98788.10025 17751.77607 5.564969942
Burdekin Irrigation Distribution Sched/Deliver 0.2760987 0.01734729 2.5544205 0.974907992 0.01735 0.525450954 342868.2334 52406.38449 6.542489752
Burdekin Irrigation Distribution Scheduled corr 0.001747 0.861107656 ‐0.5997215 3.378954313 0.86111 ‐0.041797599 567539.3608 181636.4009 3.124590434
Burdekin Irrigation Distribution Scheme Mgt 0.1932298 0.052461703 ‐3.8821884 1.869727216 0.05246 ‐0.439579096 512437.5516 100507.5804 5.098496549
Burdekin Irrigation Distribution Servicing 0.0002302 0.949382085 ‐0.0344484 0.535130038 0.94938 ‐0.015171315 137271.1314 28766.02792 4.771987701
Burdekin Irrigation Distribution Water Mgt 0.1331812 0.113625241 ‐0.0015534 0.000934112 0.11363 ‐0.364939974 108.1799622 50.2133992 2.15440428
Burdekin Irrigation Distribution Weed Control 0.1010299 0.172040003 2.30715802 1.62214184 0.17204 0.31785196 296819.9144 87198.5763 3.403953676
Burdekin Irrigation Distribution Workplace H&S 0.0003663 0.936171646 0.01634011 0.20120969 0.93617 0.019137718 14873.29896 10816.06928 1.375111288
Burdekin Irrigation Distribution Electricity 0.6745904 9.02959E‐06 8.99432567 1.472405697 9E‐06 0.821334505 194523.3608 79149.47844 2.457670785
Burdekin Irrigation Distribution Other Renewals 0 0.888830194 ‐0.002026 0.014289734 0.88883 0 1918.006284 768.1476809 2.496923875
Burdekin Water Supply Cond. Monitoring 0.2661576 0.019887402 1.02480341 0.401084852 0.01989 0.515904655 11593.41332 3345.683128 3.465185695
Burdekin Water Supply Contractors 0.0248984 0.506426435 0.01830354 0.026998417 0.50643 0.157792163 9098.803313 9052.231258 1.005144815
Burdekin Water Supply Customer Mgt 0.1810255 0.061447755 2.5648452 1.285849889 0.06145 0.425470873 24197.03977 14619.50878 1.655119891
Burdekin Water Supply Dam Safety 0.4813211 0.000691952 0.64051076 0.156719126 0.00069 0.6937731 15765.91541 5082.673873 3.101893965
Burdekin Water Supply Emergency maint 0.1305919 0.117464379 0.94960973 0.57751417 0.11746 0.361374997 3791.322218 2630.476188 1.44130642
Burdekin Water Supply Enviro Mgt 0.2743721 0.017765535 0.39086208 0.149821537 0.01777 0.523805449 20563.01551 9492.521058 2.166233331
Burdekin Water Supply Facility Mgt 9.678E‐05 0.967165042 ‐0.0031628 0.075772152 0.96717 ‐0.009837868 89036.12557 4800.836817 18.54595958
Burdekin Water Supply Indirects 0.1688647 0.071878749 0.27008648 0.141231987 0.07188 0.410931462 5985.724608 8948.296984 0.668923329
Burdekin Water Supply Labour 0.1761801 0.065414103 0.23964282 0.122142224 0.06541 0.419738174 6762.924321 7738.791472 0.873899283
Burdekin Water Supply Materials 0.001717 0.862296718 0.02447251 0.139086961 0.8623 0.041436456 12357.75315 8812.390619 1.402315635
Burdekin Water Supply Metering 0.0155745 0.600116693 ‐0.0121598 0.022786283 0.60012 ‐0.124797673 5725.82004 1443.712797 3.966038157
Burdekin Water Supply Other ‐ Operations 0.0676914 0.267932023 0.23262917 0.203489021 0.26793 0.260175727 936.5115919 12892.83137 0.072638163
Burdekin Water Supply Overheads 0.1517975 0.089495282 0.23304702 0.129844858 0.0895 0.389611988 9068.975521 8226.821563 1.102366868
Burdekin Water Supply Sched/Deliver 0.2704802 0.018743049 0.40172505 0.155504693 0.01874 0.520077077 70673.97681 9852.599318 7.173130108
Burdekin Water Supply Scheduled corr 0.2711591 0.018568984 1.02874606 0.397535726 0.01857 0.520729432 52081.13713 25187.40844 2.06774497
Burdekin Water Supply Scheme Mgt 0.1027993 0.168124577 1.39476539 0.971213503 0.16812 0.320623246 245088.3598 61534.97554 3.982911469
Burdekin Water Supply Servicing 0.3774792 0.003948575 0.35602108 0.107763056 0.00395 0.614393346 21120.51511 6827.743868 3.093337347
Burdekin Water Supply Water Mgt 0.015423 0.601909254 0.25833079 0.486497619 0.60191 0.124189263 70855.20675 30823.93211 2.298707592
Burdekin Water Supply Weed Control 0.0034741 0.805035744 ‐0.0182255 0.072755791 0.80504 ‐0.058941357 5875.40296 4609.723645 1.274567287
Burdekin Water Supply Workplace H&S 0.0080303 0.70713338 0.008229 0.021557334 0.70713 0.089611748 886.0311282 1365.848018 0.648704041
Burdekin Water Supply Electricity 0.0248984 0.506426435 0.01830354 0.026998417 0.50643 0.157792163 16073.13563 1710.58877 9.396259297
Burdekin Water Supply Other Renewals 0 0.032749634 0.02613903 0.011300593 0.03275 0 116.6998804 715.9926612 0.16299033
Callide Water Supply Cond. Monitoring 0.0006886 0.912556714 ‐0.2782699 2.498644033 0.91256 ‐0.026240733 30047.52724 6882.416086 4.365839971
Callide Water Supply Contractors 0.0832131 0.217417247 ‐0.2738822 0.214272275 0.21742 ‐0.288466802 7689.667619 7961.105367 0.965904515
Callide Water Supply Customer Mgt 0.101146 0.171780073 ‐24.790825 17.41906937 0.17178 ‐0.318034589 ‐2890.122066 2180.466609 ‐1.325460364
Callide Water Supply Dam Safety 0.4816577 0.000687722 17.2917172 4.228058385 0.00069 0.694015608 42863.71693 17637.28034 2.430290618
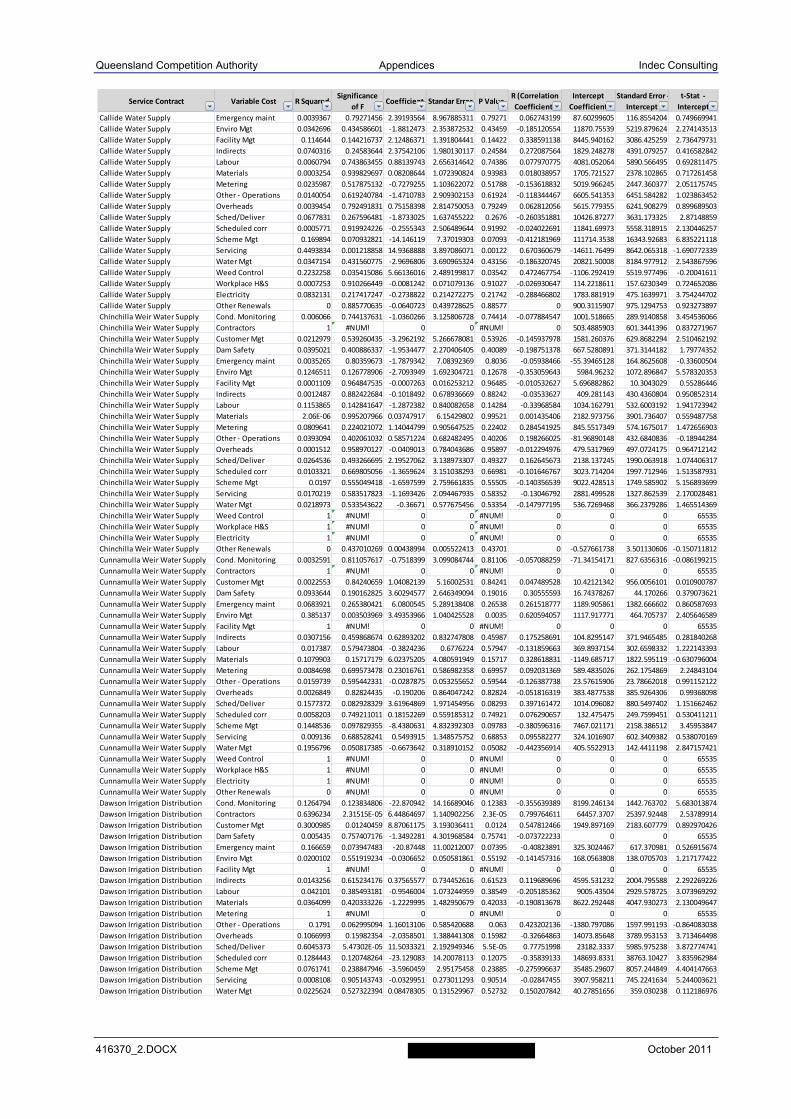
Queensland Competition Authority Appendices Indec Consulting
416370_2.DOCX October 2011
Service Contract Variable Cost R SquaredSignificance
of FCoefficient Standar Error P Value
R (Correlation
Coefficient
Intercept
Coefficient
Standard Error ‐
Intercept
t‐Stat ‐
Intercept
Callide Water Supply Emergency maint 0.0039367 0.79271456 2.39193564 8.967885311 0.79271 0.062743199 87.60299605 116.8554204 0.749669941
Callide Water Supply Enviro Mgt 0.0342696 0.434586601 ‐1.8812473 2.353872532 0.43459 ‐0.185120554 11870.75539 5219.879624 2.274143513
Callide Water Supply Facility Mgt 0.114644 0.144216737 2.12486371 1.391804441 0.14422 0.338591138 8445.940162 3086.425259 2.736479731
Callide Water Supply Indirects 0.0740316 0.24583644 2.37542106 1.980130117 0.24584 0.272087564 1829.248278 4391.079257 0.416582842
Callide Water Supply Labour 0.0060794 0.743863455 0.88139743 2.656314642 0.74386 0.077970775 4081.052064 5890.566495 0.692811475
Callide Water Supply Materials 0.0003254 0.939829697 0.08208644 1.072390824 0.93983 0.018038957 1705.721527 2378.102865 0.717261458
Callide Water Supply Metering 0.0235987 0.517875132 ‐0.7279255 1.103622072 0.51788 ‐0.153618832 5019.966245 2447.360377 2.051175745
Callide Water Supply Other ‐ Operations 0.0140054 0.619240784 ‐1.4710783 2.909302153 0.61924 ‐0.118344467 6605.541353 6451.584282 1.023863452
Callide Water Supply Overheads 0.0039454 0.792491831 0.75158398 2.814750053 0.79249 0.062812056 5615.779355 6241.908279 0.899689503
Callide Water Supply Sched/Deliver 0.0677831 0.267596481 ‐1.8733025 1.637455222 0.2676 ‐0.260351881 10426.87277 3631.173325 2.87148859
Callide Water Supply Scheduled corr 0.0005771 0.919924226 ‐0.2555343 2.506489644 0.91992 ‐0.024022691 11841.69973 5558.318915 2.130446257
Callide Water Supply Scheme Mgt 0.169894 0.070932821 ‐14.146119 7.37019303 0.07093 ‐0.412181969 111714.3538 16343.92683 6.835221118
Callide Water Supply Servicing 0.4493834 0.001218858 14.9368888 3.897086071 0.00122 0.670360679 ‐14611.76499 8642.065318 ‐1.690772339
Callide Water Supply Water Mgt 0.0347154 0.431560775 ‐2.9696806 3.690965324 0.43156 ‐0.186320745 20821.50008 8184.977912 2.543867596
Callide Water Supply Weed Control 0.2232258 0.035415086 5.66136016 2.489199817 0.03542 0.472467754 ‐1106.292419 5519.977496 ‐0.20041611
Callide Water Supply Workplace H&S 0.0007253 0.910266449 ‐0.0081242 0.071079136 0.91027 ‐0.026930647 114.2218611 157.6230349 0.724652086
Callide Water Supply Electricity 0.0832131 0.217417247 ‐0.2738822 0.214272275 0.21742 ‐0.288466802 1783.881919 475.1639971 3.754244702
Callide Water Supply Other Renewals 0 0.885770635 ‐0.0640723 0.439728625 0.88577 0 900.3115907 975.1294753 0.923273897
Chinchilla Weir Water Supply Cond. Monitoring 0.006066 0.744137631 ‐1.0360266 3.125806728 0.74414 ‐0.077884547 1001.518665 289.9140858 3.454536066
Chinchilla Weir Water Supply Contractors 1 #NUM! 0 0 #NUM! 0 503.4885903 601.3441396 0.837271967
Chinchilla Weir Water Supply Customer Mgt 0.0212979 0.539260435 ‐3.2962192 5.266678081 0.53926 ‐0.145937978 1581.260376 629.8682294 2.510462192
Chinchilla Weir Water Supply Dam Safety 0.0395021 0.400886337 ‐1.9534477 2.270406405 0.40089 ‐0.198751378 667.5280891 371.3144182 1.79774352
Chinchilla Weir Water Supply Emergency maint 0.0035265 0.80359673 ‐1.7879342 7.08392369 0.8036 ‐0.05938466 ‐55.39465128 164.8625608 ‐0.33600504
Chinchilla Weir Water Supply Enviro Mgt 0.1246511 0.126778906 ‐2.7093949 1.692304721 0.12678 ‐0.353059643 5984.96232 1072.896847 5.578320353
Chinchilla Weir Water Supply Facility Mgt 0.0001109 0.964847535 ‐0.0007263 0.016253212 0.96485 ‐0.010532627 5.696882862 10.3043029 0.55286446
Chinchilla Weir Water Supply Indirects 0.0012487 0.882422684 ‐0.1018492 0.678936669 0.88242 ‐0.03533627 409.281143 430.4360804 0.950852314
Chinchilla Weir Water Supply Labour 0.1153865 0.142841647 ‐1.2872382 0.840082658 0.14284 ‐0.33968584 1034.162791 532.6003192 1.941723942
Chinchilla Weir Water Supply Materials 2.06E‐06 0.995207966 0.03747917 6.15429802 0.99521 0.001435406 2182.973756 3901.736407 0.559487758
Chinchilla Weir Water Supply Metering 0.0809641 0.224021072 1.14044799 0.905647525 0.22402 0.284541925 845.5517349 574.1675017 1.472656903
Chinchilla Weir Water Supply Other ‐ Operations 0.0393094 0.402061032 0.58571224 0.682482495 0.40206 0.198266025 ‐81.96890148 432.6840836 ‐0.18944284
Chinchilla Weir Water Supply Overheads 0.0001512 0.958970127 ‐0.0409013 0.784043686 0.95897 ‐0.012294976 479.5317969 497.0724175 0.964712142
Chinchilla Weir Water Supply Sched/Deliver 0.0264536 0.493266695 2.19527062 3.138973307 0.49327 0.162645673 2138.137245 1990.063918 1.074406317
Chinchilla Weir Water Supply Scheduled corr 0.0103321 0.669805056 ‐1.3659624 3.151038293 0.66981 ‐0.101646767 3023.714204 1997.712946 1.513587931
Chinchilla Weir Water Supply Scheme Mgt 0.0197 0.555049418 ‐1.6597599 2.759661835 0.55505 ‐0.140356539 9022.428513 1749.585902 5.156893699
Chinchilla Weir Water Supply Servicing 0.0170219 0.583517823 ‐1.1693426 2.094467935 0.58352 ‐0.13046792 2881.499528 1327.862539 2.170028481
Chinchilla Weir Water Supply Water Mgt 0.0218973 0.533543622 ‐0.36671 0.577675456 0.53354 ‐0.147977195 536.7269468 366.2379286 1.465514369
Chinchilla Weir Water Supply Weed Control 1 #NUM! 0 0 #NUM! 0 0 0 65535
Chinchilla Weir Water Supply Workplace H&S 1 #NUM! 0 0 #NUM! 0 0 0 65535
Chinchilla Weir Water Supply Electricity 1 #NUM! 0 0 #NUM! 0 0 0 65535
Chinchilla Weir Water Supply Other Renewals 0 0.437010269 0.00438994 0.005522413 0.43701 0 ‐0.527661738 3.501130606 ‐0.150711812
Cunnamulla Weir Water Supply Cond. Monitoring 0.0032591 0.811057617 ‐0.7518399 3.099084744 0.81106 ‐0.057088259 ‐71.34154171 827.6356316 ‐0.086199215
Cunnamulla Weir Water Supply Contractors 1 #NUM! 0 0 #NUM! 0 0 0 65535
Cunnamulla Weir Water Supply Customer Mgt 0.0022553 0.84240659 1.04082139 5.16002531 0.84241 0.047489528 10.42121342 956.0056101 0.010900787
Cunnamulla Weir Water Supply Dam Safety 0.0933644 0.190162825 3.60294577 2.646349094 0.19016 0.30555593 16.74378267 44.170266 0.379073621
Cunnamulla Weir Water Supply Emergency maint 0.0683921 0.265380421 6.0800545 5.289138408 0.26538 0.261518777 1189.905861 1382.666602 0.860587693
Cunnamulla Weir Water Supply Enviro Mgt 0.385137 0.003503969 3.49353966 1.040425528 0.0035 0.620594057 1117.917771 464.705737 2.405646589
Cunnamulla Weir Water Supply Facility Mgt 1 #NUM! 0 0 #NUM! 0 0 0 65535
Cunnamulla Weir Water Supply Indirects 0.0307156 0.459868674 0.62893202 0.832747808 0.45987 0.175258691 104.8295147 371.9465485 0.281840268
Cunnamulla Weir Water Supply Labour 0.017387 0.579473804 ‐0.3824236 0.6776224 0.57947 ‐0.131859663 369.8937154 302.6598332 1.222143393
Cunnamulla Weir Water Supply Materials 0.1079903 0.15717179 6.02375205 4.080591949 0.15717 0.328618831 ‐1149.685717 1822.595119 ‐0.630796004
Cunnamulla Weir Water Supply Metering 0.0084698 0.699573478 0.23016761 0.586982358 0.69957 0.092031369 589.4835026 262.1754869 2.24843104
Cunnamulla Weir Water Supply Other ‐ Operations 0.0159739 0.595442331 ‐0.0287875 0.053255652 0.59544 ‐0.126387738 23.57615906 23.78662018 0.991152122
Cunnamulla Weir Water Supply Overheads 0.0026849 0.82824435 ‐0.190206 0.864047242 0.82824 ‐0.051816319 383.4877538 385.9264306 0.99368098
Cunnamulla Weir Water Supply Sched/Deliver 0.1577372 0.082928329 3.61964869 1.971454956 0.08293 0.397161472 1014.096082 880.5497402 1.151662462
Cunnamulla Weir Water Supply Scheduled corr 0.0058203 0.749211011 0.18152269 0.559185312 0.74921 0.076290657 132.475475 249.7599451 0.530411211
Cunnamulla Weir Water Supply Scheme Mgt 0.1448536 0.097829355 ‐8.4380631 4.832392303 0.09783 ‐0.380596316 7467.021171 2158.386512 3.45953847
Cunnamulla Weir Water Supply Servicing 0.009136 0.688528241 0.5493915 1.348575752 0.68853 0.095582277 324.1016907 602.3409382 0.538070169
Cunnamulla Weir Water Supply Water Mgt 0.1956796 0.050817385 ‐0.6673642 0.318910152 0.05082 ‐0.442356914 405.5522913 142.4411198 2.847157421
Cunnamulla Weir Water Supply Weed Control 1 #NUM! 0 0 #NUM! 0 0 0 65535
Cunnamulla Weir Water Supply Workplace H&S 1 #NUM! 0 0 #NUM! 0 0 0 65535
Cunnamulla Weir Water Supply Electricity 1 #NUM! 0 0 #NUM! 0 0 0 65535
Cunnamulla Weir Water Supply Other Renewals 0 #NUM! 0 0 #NUM! 0 0 0 65535
Dawson Irrigation Distribution Cond. Monitoring 0.1264794 0.123834806 ‐22.870942 14.16689046 0.12383 ‐0.355639389 8199.246134 1442.763702 5.683013874
Dawson Irrigation Distribution Contractors 0.6396234 2.31515E‐05 6.44864697 1.140902256 2.3E‐05 0.799764611 64457.3707 25397.92448 2.53789914
Dawson Irrigation Distribution Customer Mgt 0.3000985 0.01240459 8.87061175 3.193036411 0.0124 0.547812466 1949.897169 2183.607779 0.892970426
Dawson Irrigation Distribution Dam Safety 0.005435 0.757407176 ‐1.3492281 4.301968584 0.75741 ‐0.073722233 0 0 65535
Dawson Irrigation Distribution Emergency maint 0.166659 0.073947483 ‐20.87448 11.00212007 0.07395 ‐0.40823891 325.3024467 617.370981 0.526915674
Dawson Irrigation Distribution Enviro Mgt 0.0200102 0.551919234 ‐0.0306652 0.050581861 0.55192 ‐0.141457316 168.0563808 138.0705703 1.217177422
Dawson Irrigation Distribution Facility Mgt 1 #NUM! 0 0 #NUM! 0 0 0 65535
Dawson Irrigation Distribution Indirects 0.0143256 0.615234176 0.37565577 0.734452616 0.61523 0.119689696 4595.531232 2004.795588 2.292269226
Dawson Irrigation Distribution Labour 0.042101 0.385493181 ‐0.9546004 1.073244959 0.38549 ‐0.205185362 9005.43504 2929.578725 3.073969292
Dawson Irrigation Distribution Materials 0.0364099 0.420333226 ‐1.2229995 1.482950679 0.42033 ‐0.190813678 8622.292448 4047.930273 2.130049647
Dawson Irrigation Distribution Metering 1 #NUM! 0 0 #NUM! 0 0 0 65535
Dawson Irrigation Distribution Other ‐ Operations 0.1791 0.062995094 1.16013106 0.585420688 0.063 0.423202136 ‐1380.797086 1597.991193 ‐0.864083038
Dawson Irrigation Distribution Overheads 0.1066993 0.15982354 ‐2.0358501 1.388441308 0.15982 ‐0.32664863 14073.85648 3789.953153 3.713464498
Dawson Irrigation Distribution Sched/Deliver 0.6045373 5.47302E‐05 11.5033321 2.192949346 5.5E‐05 0.77751998 23182.3337 5985.975238 3.872774741
Dawson Irrigation Distribution Scheduled corr 0.1284443 0.120748264 ‐23.129083 14.20078113 0.12075 ‐0.35839133 148693.8331 38763.10427 3.835962984
Dawson Irrigation Distribution Scheme Mgt 0.0761741 0.238847946 ‐3.5960459 2.95175458 0.23885 ‐0.275996637 35485.29607 8057.244849 4.404147663
Dawson Irrigation Distribution Servicing 0.0008108 0.905143743 ‐0.0329951 0.273011293 0.90514 ‐0.02847455 3907.958211 745.2241634 5.244003621
Dawson Irrigation Distribution Water Mgt 0.0225624 0.527322394 0.08478305 0.131529967 0.52732 0.150207842 40.27851656 359.030238 0.112186976
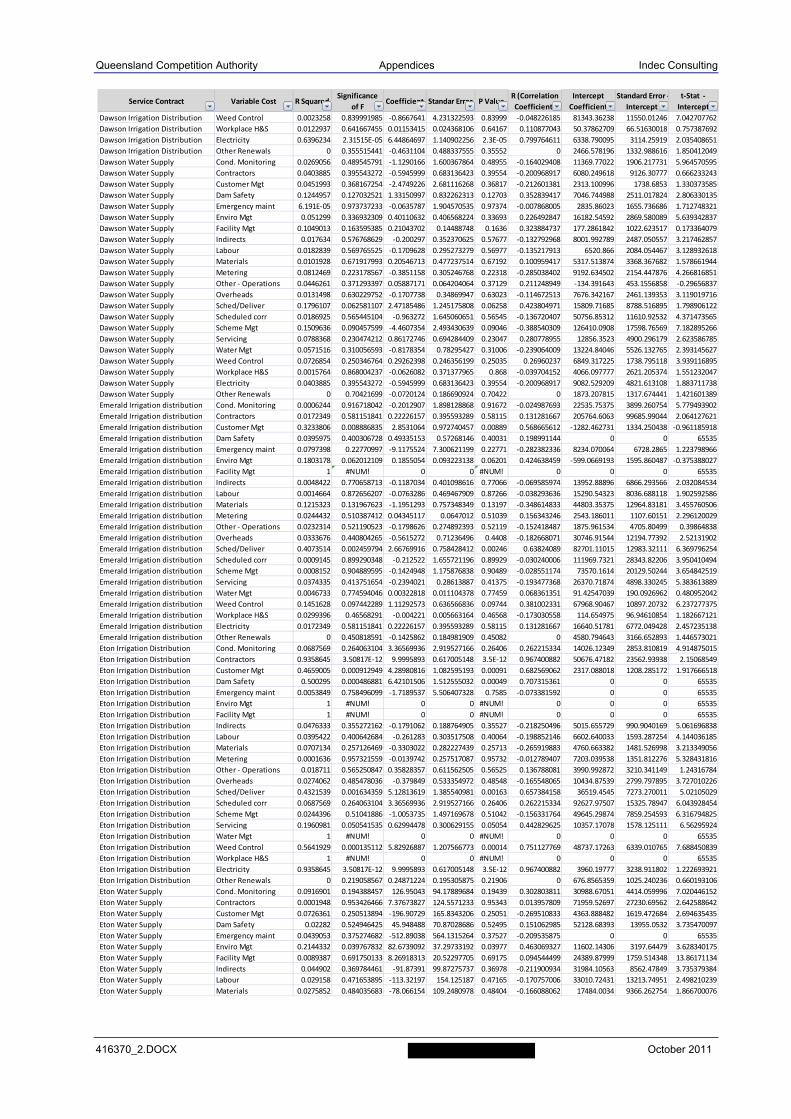
Queensland Competition Authority Appendices Indec Consulting
416370_2.DOCX October 2011
Service Contract Variable Cost R SquaredSignificance
of FCoefficient Standar Error P Value
R (Correlation
Coefficient
Intercept
Coefficient
Standard Error ‐
Intercept
t‐Stat ‐
Intercept
Dawson Irrigation Distribution Weed Control 0.0023258 0.839991985 ‐0.8667641 4.231322593 0.83999 ‐0.048226185 81343.36238 11550.01246 7.042707762
Dawson Irrigation Distribution Workplace H&S 0.0122937 0.641667455 0.01153415 0.024368106 0.64167 0.110877043 50.37862709 66.51630018 0.757387692
Dawson Irrigation Distribution Electricity 0.6396234 2.31515E‐05 6.44864697 1.140902256 2.3E‐05 0.799764611 6338.790095 3114.25919 2.035408651
Dawson Irrigation Distribution Other Renewals 0 0.355515441 ‐0.4631104 0.488337555 0.35552 0 2466.578196 1332.988616 1.850412049
Dawson Water Supply Cond. Monitoring 0.0269056 0.489545791 ‐1.1290166 1.600367864 0.48955 ‐0.164029408 11369.77022 1906.217731 5.964570595
Dawson Water Supply Contractors 0.0403885 0.395543272 ‐0.5945999 0.683136423 0.39554 ‐0.200968917 6080.249618 9126.30777 0.666233243
Dawson Water Supply Customer Mgt 0.0451993 0.368167254 ‐2.4749226 2.681116268 0.36817 ‐0.212601381 2313.100996 1738.6853 1.330373585
Dawson Water Supply Dam Safety 0.1244957 0.127032521 1.33150997 0.832262313 0.12703 0.352839417 7046.744988 2511.017824 2.806330135
Dawson Water Supply Emergency maint 6.191E‐05 0.973737233 ‐0.0635787 1.904570535 0.97374 ‐0.007868005 2835.86023 1655.736686 1.712748321
Dawson Water Supply Enviro Mgt 0.051299 0.336932309 0.40110632 0.406568224 0.33693 0.226492847 16182.54592 2869.580089 5.639342837
Dawson Water Supply Facility Mgt 0.1049013 0.163595385 0.21043702 0.14488748 0.1636 0.323884737 177.2861842 1022.623517 0.173364079
Dawson Water Supply Indirects 0.017634 0.576768629 ‐0.200297 0.352370625 0.57677 ‐0.132792968 8001.992789 2487.050557 3.217462857
Dawson Water Supply Labour 0.0182839 0.569765525 ‐0.1709628 0.295273279 0.56977 ‐0.135217913 6520.866 2084.054467 3.128932618
Dawson Water Supply Materials 0.0101928 0.671917993 0.20546713 0.477237514 0.67192 0.100959417 5317.513874 3368.367682 1.578661944
Dawson Water Supply Metering 0.0812469 0.223178567 ‐0.3851158 0.305246768 0.22318 ‐0.285038402 9192.634502 2154.447876 4.266816851
Dawson Water Supply Other ‐ Operations 0.0446261 0.371293397 0.05887171 0.064204064 0.37129 0.211248949 ‐134.391643 453.1556858 ‐0.29656837
Dawson Water Supply Overheads 0.0131498 0.630229752 ‐0.1707738 0.34869947 0.63023 ‐0.114672513 7676.342167 2461.139353 3.119019716
Dawson Water Supply Sched/Deliver 0.1796107 0.062581107 2.47185486 1.245175808 0.06258 0.423804971 15809.71685 8788.516895 1.798906122
Dawson Water Supply Scheduled corr 0.0186925 0.565445104 ‐0.963272 1.645060651 0.56545 ‐0.136720407 50756.85312 11610.92532 4.371473565
Dawson Water Supply Scheme Mgt 0.1509636 0.090457599 ‐4.4607354 2.493430639 0.09046 ‐0.388540309 126410.0908 17598.76569 7.182895266
Dawson Water Supply Servicing 0.0788368 0.230474212 0.86172746 0.694284409 0.23047 0.280778955 12856.3523 4900.296179 2.623586785
Dawson Water Supply Water Mgt 0.0571516 0.310056593 ‐0.8178354 0.78295427 0.31006 ‐0.239064009 13224.84046 5526.132765 2.393145627
Dawson Water Supply Weed Control 0.0726854 0.250346764 0.29262398 0.246356199 0.25035 0.26960237 6849.317225 1738.795118 3.939116895
Dawson Water Supply Workplace H&S 0.0015764 0.868004237 ‐0.0626082 0.371377965 0.868 ‐0.039704152 4066.097777 2621.205374 1.551232047
Dawson Water Supply Electricity 0.0403885 0.395543272 ‐0.5945999 0.683136423 0.39554 ‐0.200968917 9082.529209 4821.613108 1.883711738
Dawson Water Supply Other Renewals 0 0.70421699 ‐0.0720124 0.186690924 0.70422 0 1873.207815 1317.674441 1.421601389
Emerald Irrigation distribution Cond. Monitoring 0.0006244 0.916718042 ‐0.2012907 1.898128868 0.91672 ‐0.024987693 22535.75375 3899.260754 5.779493902
Emerald Irrigation distribution Contractors 0.0172349 0.581151841 0.22226157 0.395593289 0.58115 0.131281667 205764.6063 99685.99044 2.064127621
Emerald Irrigation distribution Customer Mgt 0.3233806 0.008886835 2.8531064 0.972740457 0.00889 0.568665612 ‐1282.462731 1334.250438 ‐0.961185918
Emerald Irrigation distribution Dam Safety 0.0395975 0.400306728 0.49335153 0.57268146 0.40031 0.198991144 0 0 65535
Emerald Irrigation distribution Emergency maint 0.0797398 0.22770997 ‐9.1175524 7.300621199 0.22771 ‐0.282382336 8234.070064 6728.2865 1.223798966
Emerald Irrigation distribution Enviro Mgt 0.1803178 0.062012109 0.1855054 0.093223138 0.06201 0.424638459 ‐599.0669193 1595.860487 ‐0.375388027
Emerald Irrigation distribution Facility Mgt 1 #NUM! 0 0 #NUM! 0 0 0 65535
Emerald Irrigation distribution Indirects 0.0048422 0.770658713 ‐0.1187034 0.401098616 0.77066 ‐0.069585974 13952.88896 6866.293566 2.032084534
Emerald Irrigation distribution Labour 0.0014664 0.872656207 ‐0.0763286 0.469467909 0.87266 ‐0.038293636 15290.54323 8036.688118 1.902592586
Emerald Irrigation distribution Materials 0.1215323 0.131967623 ‐1.1951293 0.757348349 0.13197 ‐0.348614833 44803.35375 12964.83181 3.455760506
Emerald Irrigation distribution Metering 0.0244432 0.510387412 0.04345117 0.0647012 0.51039 0.156343246 2543.186011 1107.60151 2.296120029
Emerald Irrigation distribution Other ‐ Operations 0.0232314 0.521190523 ‐0.1798626 0.274892393 0.52119 ‐0.152418487 1875.961534 4705.80499 0.39864838
Emerald Irrigation distribution Overheads 0.0333676 0.440804265 ‐0.5615272 0.71236496 0.4408 ‐0.182668071 30746.91544 12194.77392 2.52131902
Emerald Irrigation distribution Sched/Deliver 0.4073514 0.002459794 2.66769916 0.758428412 0.00246 0.63824089 82701.11015 12983.32111 6.369796254
Emerald Irrigation distribution Scheduled corr 0.0009145 0.899290348 ‐0.212522 1.655721196 0.89929 ‐0.030240006 111969.7321 28343.82206 3.950410494
Emerald Irrigation distribution Scheme Mgt 0.0008152 0.904889595 ‐0.1424948 1.175876838 0.90489 ‐0.028551174 73570.1614 20129.50244 3.654842519
Emerald Irrigation distribution Servicing 0.0374335 0.413751654 ‐0.2394021 0.28613887 0.41375 ‐0.193477368 26370.71874 4898.330245 5.383613889
Emerald Irrigation distribution Water Mgt 0.0046733 0.774594046 0.00322818 0.011104378 0.77459 0.068361351 91.42547039 190.0926962 0.480952042
Emerald Irrigation distribution Weed Control 0.1451628 0.097442289 1.11292573 0.636566836 0.09744 0.381002331 67968.90467 10897.20732 6.237277375
Emerald Irrigation distribution Workplace H&S 0.0299396 0.46568291 ‐0.004221 0.005663164 0.46568 ‐0.173030558 114.654975 96.94610854 1.182667121
Emerald Irrigation distribution Electricity 0.0172349 0.581151841 0.22226157 0.395593289 0.58115 0.131281667 16640.51781 6772.049428 2.457235138
Emerald Irrigation distribution Other Renewals 0 0.450818591 ‐0.1425862 0.184981909 0.45082 0 4580.794643 3166.652893 1.446573021
Eton Irrigation Distribution Cond. Monitoring 0.0687569 0.264063104 3.36569936 2.919527166 0.26406 0.262215334 14026.12349 2853.810819 4.914875015
Eton Irrigation Distribution Contractors 0.9358645 3.50817E‐12 9.9995893 0.617005148 3.5E‐12 0.967400882 50676.47182 23562.93938 2.15068549
Eton Irrigation Distribution Customer Mgt 0.4659005 0.000912949 4.28980816 1.082595193 0.00091 0.682569062 2317.088018 1208.285172 1.917666518
Eton Irrigation Distribution Dam Safety 0.500295 0.000486881 6.42101506 1.512555032 0.00049 0.707315361 0 0 65535
Eton Irrigation Distribution Emergency maint 0.0053849 0.758496099 ‐1.7189537 5.506407328 0.7585 ‐0.073381592 0 0 65535
Eton Irrigation Distribution Enviro Mgt 1 #NUM! 0 0 #NUM! 0 0 0 65535
Eton Irrigation Distribution Facility Mgt 1 #NUM! 0 0 #NUM! 0 0 0 65535
Eton Irrigation Distribution Indirects 0.0476333 0.355272162 ‐0.1791062 0.188764905 0.35527 ‐0.218250496 5015.655729 990.9040169 5.061696838
Eton Irrigation Distribution Labour 0.0395422 0.400642684 ‐0.261283 0.303517508 0.40064 ‐0.198852146 6602.640033 1593.287254 4.144036185
Eton Irrigation Distribution Materials 0.0707134 0.257126469 ‐0.3303022 0.282227439 0.25713 ‐0.265919883 4760.663382 1481.526998 3.213349056
Eton Irrigation Distribution Metering 0.0001636 0.957321559 ‐0.0139742 0.257517087 0.95732 ‐0.012789407 7203.039538 1351.812276 5.328431816
Eton Irrigation Distribution Other ‐ Operations 0.018711 0.565250847 0.35828357 0.611562505 0.56525 0.136788081 3990.992872 3210.341149 1.24316784
Eton Irrigation Distribution Overheads 0.0274062 0.485478036 ‐0.379849 0.533354972 0.48548 ‐0.165548065 10434.87539 2799.797895 3.727010226
Eton Irrigation Distribution Sched/Deliver 0.4321539 0.001634359 5.12813619 1.385540981 0.00163 0.657384158 36519.4545 7273.270011 5.02105029
Eton Irrigation Distribution Scheduled corr 0.0687569 0.264063104 3.36569936 2.919527166 0.26406 0.262215334 92627.97507 15325.78947 6.043928454
Eton Irrigation Distribution Scheme Mgt 0.0244396 0.51041886 ‐1.0053735 1.497169678 0.51042 ‐0.156331764 49645.29874 7859.254593 6.316794825
Eton Irrigation Distribution Servicing 0.1960981 0.050541535 0.62994478 0.300629155 0.05054 0.442829625 10357.17078 1578.125111 6.56295924
Eton Irrigation Distribution Water Mgt 1 #NUM! 0 0 #NUM! 0 0 0 65535
Eton Irrigation Distribution Weed Control 0.5641929 0.000135112 5.82926887 1.207566773 0.00014 0.751127769 48737.17263 6339.010765 7.688450839
Eton Irrigation Distribution Workplace H&S 1 #NUM! 0 0 #NUM! 0 0 0 65535
Eton Irrigation Distribution Electricity 0.9358645 3.50817E‐12 9.9995893 0.617005148 3.5E‐12 0.967400882 3960.19777 3238.911802 1.222693921
Eton Irrigation Distribution Other Renewals 0 0.219058567 0.24871224 0.195305875 0.21906 0 676.8565359 1025.240236 0.660193106
Eton Water Supply Cond. Monitoring 0.0916901 0.194388457 126.95043 94.17889684 0.19439 0.302803811 30988.67051 4414.059996 7.020446152
Eton Water Supply Contractors 0.0001948 0.953426466 7.37673827 124.5571233 0.95343 0.013957809 71959.52697 27230.69562 2.642588642
Eton Water Supply Customer Mgt 0.0726361 0.250513894 ‐196.90729 165.8343206 0.25051 ‐0.269510833 4363.888482 1619.472684 2.694635435
Eton Water Supply Dam Safety 0.02282 0.524946425 45.948488 70.87028686 0.52495 0.151062985 52128.68393 13955.0532 3.735470097
Eton Water Supply Emergency maint 0.0439053 0.375274682 ‐512.89038 564.1315264 0.37527 ‐0.209535875 0 0 65535
Eton Water Supply Enviro Mgt 0.2144332 0.039767832 82.6739092 37.29733192 0.03977 0.463069327 11602.14306 3197.64479 3.628340175
Eton Water Supply Facility Mgt 0.0089387 0.691750133 8.26918313 20.52297705 0.69175 0.094544499 24389.87999 1759.514348 13.86171134
Eton Water Supply Indirects 0.044902 0.369784461 ‐91.87391 99.87275737 0.36978 ‐0.211900934 31984.10563 8562.47849 3.735379384
Eton Water Supply Labour 0.029158 0.471653895 ‐113.32197 154.125187 0.47165 ‐0.170757006 33010.72431 13213.74951 2.498210239
Eton Water Supply Materials 0.0275852 0.484035683 ‐78.066154 109.2480978 0.48404 ‐0.166088062 17484.0034 9366.262754 1.866700076
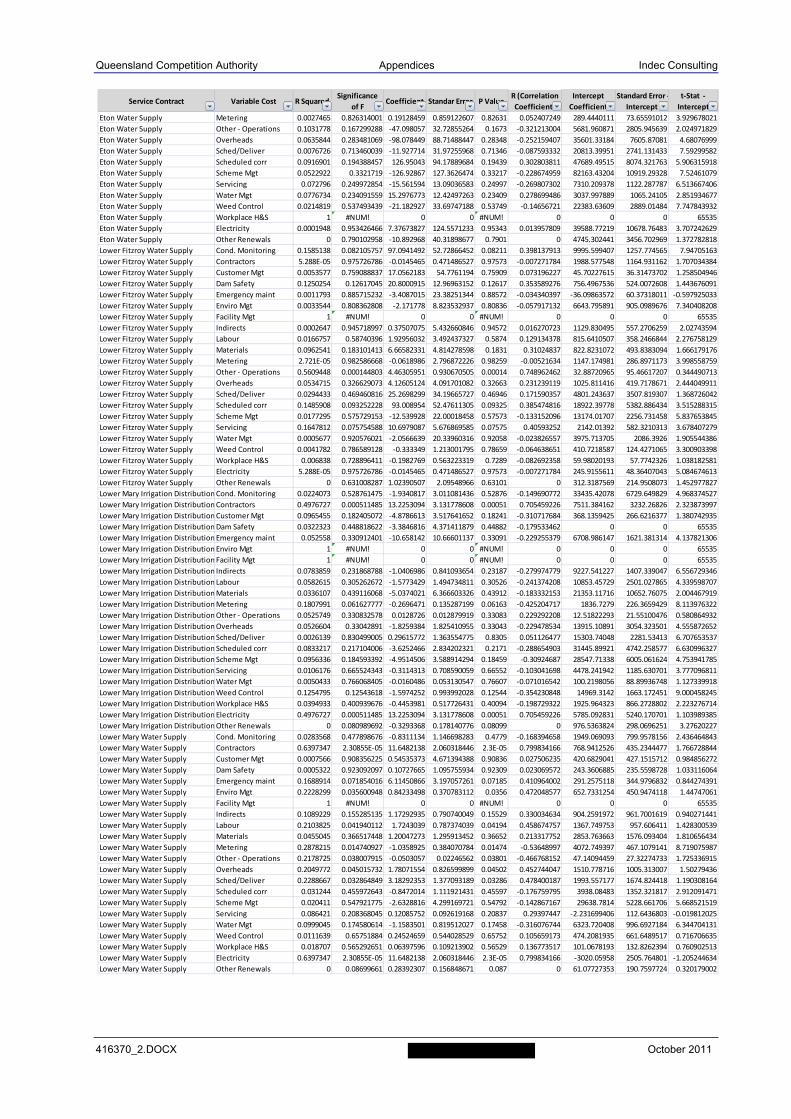
Queensland Competition Authority Appendices Indec Consulting
416370_2.DOCX October 2011
Service Contract Variable Cost R SquaredSignificance
of FCoefficient Standar Error P Value
R (Correlation
Coefficient
Intercept
Coefficient
Standard Error ‐
Intercept
t‐Stat ‐
Intercept
Eton Water Supply Metering 0.0027465 0.826314001 0.19128459 0.859122607 0.82631 0.052407249 289.4440111 73.65591012 3.929678021
Eton Water Supply Other ‐ Operations 0.1031778 0.167299288 ‐47.098057 32.72855264 0.1673 ‐0.321213004 5681.960871 2805.945639 2.024971829
Eton Water Supply Overheads 0.0635844 0.283481069 ‐98.078449 88.71488447 0.28348 ‐0.252159407 35601.33184 7605.87081 4.68076999
Eton Water Supply Sched/Deliver 0.0076726 0.713460039 ‐11.927714 31.97255968 0.71346 ‐0.087593332 20813.39951 2741.131433 7.59299582
Eton Water Supply Scheduled corr 0.0916901 0.194388457 126.95043 94.17889684 0.19439 0.302803811 47689.49515 8074.321763 5.906315918
Eton Water Supply Scheme Mgt 0.0522922 0.3321719 ‐126.92867 127.3626474 0.33217 ‐0.228674959 82163.43204 10919.29328 7.52461079
Eton Water Supply Servicing 0.072796 0.249972854 ‐15.561594 13.09036583 0.24997 ‐0.269807302 7310.209378 1122.287787 6.513667406
Eton Water Supply Water Mgt 0.0776734 0.234091559 15.2976773 12.42497263 0.23409 0.278699486 3037.997889 1065.24105 2.851934677
Eton Water Supply Weed Control 0.0214819 0.537493439 ‐21.182927 33.69747188 0.53749 ‐0.14656721 22383.63609 2889.01484 7.747843932
Eton Water Supply Workplace H&S 1 #NUM! 0 0 #NUM! 0 0 0 65535
Eton Water Supply Electricity 0.0001948 0.953426466 7.37673827 124.5571233 0.95343 0.013957809 39588.77219 10678.76483 3.707242629
Eton Water Supply Other Renewals 0 0.790102958 ‐10.892968 40.31898677 0.7901 0 4745.302441 3456.702969 1.372782818
Lower Fitzroy Water Supply Cond. Monitoring 0.1585138 0.082105757 97.0941492 52.72866452 0.08211 0.398137913 9995.599407 1257.774565 7.94705163
Lower Fitzroy Water Supply Contractors 5.288E‐05 0.975726786 ‐0.0145465 0.471486527 0.97573 ‐0.007271784 1988.577548 1164.931162 1.707034384
Lower Fitzroy Water Supply Customer Mgt 0.0053577 0.759088837 17.0562183 54.7761194 0.75909 0.073196227 45.70227615 36.31473702 1.258504946
Lower Fitzroy Water Supply Dam Safety 0.1250254 0.12617045 20.8000915 12.96963152 0.12617 0.353589276 756.4967536 524.0072608 1.443676091
Lower Fitzroy Water Supply Emergency maint 0.0011793 0.885715232 ‐3.4087015 23.38251344 0.88572 ‐0.034340397 ‐36.09863572 60.37318011 ‐0.597925033
Lower Fitzroy Water Supply Enviro Mgt 0.0033544 0.808362808 ‐2.171778 8.823532937 0.80836 ‐0.057917132 6643.795891 905.0989676 7.340408208
Lower Fitzroy Water Supply Facility Mgt 1 #NUM! 0 0 #NUM! 0 0 0 65535
Lower Fitzroy Water Supply Indirects 0.0002647 0.945718997 0.37507075 5.432660846 0.94572 0.016270723 1129.830495 557.2706259 2.02743594
Lower Fitzroy Water Supply Labour 0.0166757 0.58740396 1.92956032 3.492437327 0.5874 0.129134378 815.6410507 358.2466844 2.276758129
Lower Fitzroy Water Supply Materials 0.0962541 0.183101413 6.66582331 4.814278598 0.1831 0.31024837 822.8231072 493.8383094 1.666179176
Lower Fitzroy Water Supply Metering 2.721E‐05 0.982586668 ‐0.0618986 2.796872226 0.98259 ‐0.00521634 1147.174981 286.8971173 3.998558759
Lower Fitzroy Water Supply Other ‐ Operations 0.5609448 0.000144803 4.46305951 0.930670505 0.00014 0.748962462 32.88720965 95.46617207 0.344490713
Lower Fitzroy Water Supply Overheads 0.0534715 0.326629073 4.12605124 4.091701082 0.32663 0.231239119 1025.811416 419.7178671 2.444049911
Lower Fitzroy Water Supply Sched/Deliver 0.0294433 0.469460816 25.2698299 34.19665727 0.46946 0.171590357 4801.243637 3507.819307 1.368726042
Lower Fitzroy Water Supply Scheduled corr 0.1485908 0.093252228 93.008954 52.47611305 0.09325 0.385474816 18922.39778 5382.886434 3.515288315
Lower Fitzroy Water Supply Scheme Mgt 0.0177295 0.575729153 ‐12.539928 22.00018458 0.57573 ‐0.133152096 13174.01707 2256.731458 5.837653845
Lower Fitzroy Water Supply Servicing 0.1647812 0.075754588 10.6979087 5.676869585 0.07575 0.40593252 2142.01392 582.3210313 3.678407279
Lower Fitzroy Water Supply Water Mgt 0.0005677 0.920576021 ‐2.0566639 20.33960316 0.92058 ‐0.023826557 3975.713705 2086.3926 1.905544386
Lower Fitzroy Water Supply Weed Control 0.0041782 0.786589128 ‐0.333349 1.213001795 0.78659 ‐0.064638651 410.7218587 124.4271065 3.300903398
Lower Fitzroy Water Supply Workplace H&S 0.006838 0.728896411 ‐0.1982769 0.563223319 0.7289 ‐0.082692358 59.98020193 57.7742326 1.038182581
Lower Fitzroy Water Supply Electricity 5.288E‐05 0.975726786 ‐0.0145465 0.471486527 0.97573 ‐0.007271784 245.9155611 48.36407043 5.084674613
Lower Fitzroy Water Supply Other Renewals 0 0.631008287 1.02390507 2.09548966 0.63101 0 312.3187569 214.9508073 1.452977827
Lower Mary Irrigation DistributionCond. Monitoring 0.0224073 0.528761475 ‐1.9340817 3.011081436 0.52876 ‐0.149690772 33435.42078 6729.649829 4.968374527
Lower Mary Irrigation DistributionContractors 0.4976727 0.000511485 13.2253094 3.131778608 0.00051 0.705459226 7511.384162 3232.26826 2.323873997
Lower Mary Irrigation DistributionCustomer Mgt 0.0965455 0.182405072 ‐4.8786613 3.517641652 0.18241 ‐0.310717684 368.1359425 266.6216377 1.380742935
Lower Mary Irrigation DistributionDam Safety 0.0322323 0.448818622 ‐3.3846816 4.371411879 0.44882 ‐0.179533462 0 0 65535
Lower Mary Irrigation DistributionEmergency maint 0.052558 0.330912401 ‐10.658142 10.66601137 0.33091 ‐0.229255379 6708.986147 1621.381314 4.137821306
Lower Mary Irrigation DistributionEnviro Mgt 1 #NUM! 0 0 #NUM! 0 0 0 65535
Lower Mary Irrigation DistributionFacility Mgt 1 #NUM! 0 0 #NUM! 0 0 0 65535
Lower Mary Irrigation Distribution Indirects 0.0783859 0.231868788 ‐1.0406986 0.841093654 0.23187 ‐0.279974779 9227.541227 1407.339047 6.556729346
Lower Mary Irrigation Distribution Labour 0.0582615 0.305262672 ‐1.5773429 1.494734811 0.30526 ‐0.241374208 10853.45729 2501.027865 4.339598707
Lower Mary Irrigation DistributionMaterials 0.0336107 0.439116068 ‐5.0374021 6.366603326 0.43912 ‐0.183332153 21353.11716 10652.76075 2.004467919
Lower Mary Irrigation DistributionMetering 0.1807991 0.061627777 ‐0.2696471 0.135287199 0.06163 ‐0.425204717 1836.7279 226.3659429 8.113976322
Lower Mary Irrigation DistributionOther ‐ Operations 0.0525749 0.330832578 0.0128726 0.012879919 0.33083 0.229292208 12.51822293 21.55100476 0.580864932
Lower Mary Irrigation DistributionOverheads 0.0526604 0.33042891 ‐1.8259384 1.825410955 0.33043 ‐0.229478534 13915.10891 3054.323501 4.555872652
Lower Mary Irrigation DistributionSched/Deliver 0.0026139 0.830499005 0.29615772 1.363554775 0.8305 0.051126477 15303.74048 2281.53413 6.707653537
Lower Mary Irrigation DistributionScheduled corr 0.0833217 0.217104006 ‐3.6252466 2.834202321 0.2171 ‐0.288654903 31445.89921 4742.258577 6.630996327
Lower Mary Irrigation DistributionScheme Mgt 0.0956336 0.184593392 ‐4.9514506 3.588914294 0.18459 ‐0.30924687 28547.71338 6005.061624 4.753941785
Lower Mary Irrigation DistributionServicing 0.0106176 0.665524343 ‐0.3114313 0.708590059 0.66552 ‐0.103041698 4478.241942 1185.630701 3.777096811
Lower Mary Irrigation DistributionWater Mgt 0.0050433 0.766068405 ‐0.0160486 0.053130547 0.76607 ‐0.071016542 100.2198056 88.89936748 1.127339918
Lower Mary Irrigation DistributionWeed Control 0.1254795 0.12543618 ‐1.5974252 0.993992028 0.12544 ‐0.354230848 14969.3142 1663.172451 9.000458245
Lower Mary Irrigation DistributionWorkplace H&S 0.0394933 0.400939676 ‐0.4453981 0.517726431 0.40094 ‐0.198729322 1925.964323 866.2728802 2.223276714
Lower Mary Irrigation DistributionElectricity 0.4976727 0.000511485 13.2253094 3.131778608 0.00051 0.705459226 5785.092831 5240.170701 1.103989385
Lower Mary Irrigation DistributionOther Renewals 0 0.080989692 ‐0.3293368 0.178140776 0.08099 0 976.5363824 298.0696251 3.27620227
Lower Mary Water Supply Cond. Monitoring 0.0283568 0.477898676 ‐0.8311134 1.146698283 0.4779 ‐0.168394658 1949.069093 799.9578156 2.436464843
Lower Mary Water Supply Contractors 0.6397347 2.30855E‐05 11.6482138 2.060318446 2.3E‐05 0.799834166 768.9412526 435.2344477 1.766728844
Lower Mary Water Supply Customer Mgt 0.0007566 0.908356225 0.54535373 4.671394388 0.90836 0.027506235 420.6829041 427.1515712 0.984856272
Lower Mary Water Supply Dam Safety 0.0005322 0.923092097 0.10727665 1.095755934 0.92309 0.023069572 243.3606885 235.5598728 1.033116064
Lower Mary Water Supply Emergency maint 0.1688914 0.071854016 6.11450866 3.197057261 0.07185 0.410964002 291.2575118 344.9796832 0.844274391
Lower Mary Water Supply Enviro Mgt 0.2228299 0.035600948 0.84233498 0.370783112 0.0356 0.472048577 652.7331254 450.9474118 1.44747061
Lower Mary Water Supply Facility Mgt 1 #NUM! 0 0 #NUM! 0 0 0 65535
Lower Mary Water Supply Indirects 0.1089229 0.155285135 1.17292935 0.790740049 0.15529 0.330034634 904.2591972 961.7001619 0.940271441
Lower Mary Water Supply Labour 0.2103825 0.041940112 1.7243039 0.787374039 0.04194 0.458674757 1367.749753 957.606411 1.428300539
Lower Mary Water Supply Materials 0.0455045 0.366517448 1.20047273 1.295913452 0.36652 0.213317752 2853.763663 1576.093404 1.810656434
Lower Mary Water Supply Metering 0.2878215 0.014740927 ‐1.0358925 0.384070784 0.01474 ‐0.53648997 4072.749397 467.1079141 8.719075987
Lower Mary Water Supply Other ‐ Operations 0.2178725 0.038007915 ‐0.0503057 0.02246562 0.03801 ‐0.466768152 47.14094459 27.32274733 1.725336915
Lower Mary Water Supply Overheads 0.2049772 0.045015732 1.78071554 0.826599899 0.04502 0.452744047 1510.778716 1005.313007 1.50279436
Lower Mary Water Supply Sched/Deliver 0.2288667 0.032864849 3.18292353 1.377093189 0.03286 0.478400187 1993.557177 1674.824418 1.190308164
Lower Mary Water Supply Scheduled corr 0.031244 0.455972643 ‐0.8472014 1.111921431 0.45597 ‐0.176759795 3938.08483 1352.321817 2.912091471
Lower Mary Water Supply Scheme Mgt 0.020411 0.547921775 ‐2.6328816 4.299169721 0.54792 ‐0.142867167 29638.7814 5228.661706 5.668521519
Lower Mary Water Supply Servicing 0.086421 0.208368045 0.12085752 0.092619168 0.20837 0.29397447 ‐2.231699406 112.6436803 ‐0.019812025
Lower Mary Water Supply Water Mgt 0.0999045 0.174580614 ‐1.1583501 0.819512027 0.17458 ‐0.316076744 6323.720408 996.6927184 6.344704131
Lower Mary Water Supply Weed Control 0.0111639 0.65751884 0.24524659 0.544028529 0.65752 0.105659173 474.2081935 661.6489517 0.716706635
Lower Mary Water Supply Workplace H&S 0.018707 0.565292651 0.06397596 0.109213902 0.56529 0.136773517 101.0678193 132.8262394 0.760902513
Lower Mary Water Supply Electricity 0.6397347 2.30855E‐05 11.6482138 2.060318446 2.3E‐05 0.799834166 ‐3020.05958 2505.764801 ‐1.205244634
Lower Mary Water Supply Other Renewals 0 0.08699661 0.28392307 0.156848671 0.087 0 61.07727353 190.7597724 0.320179002
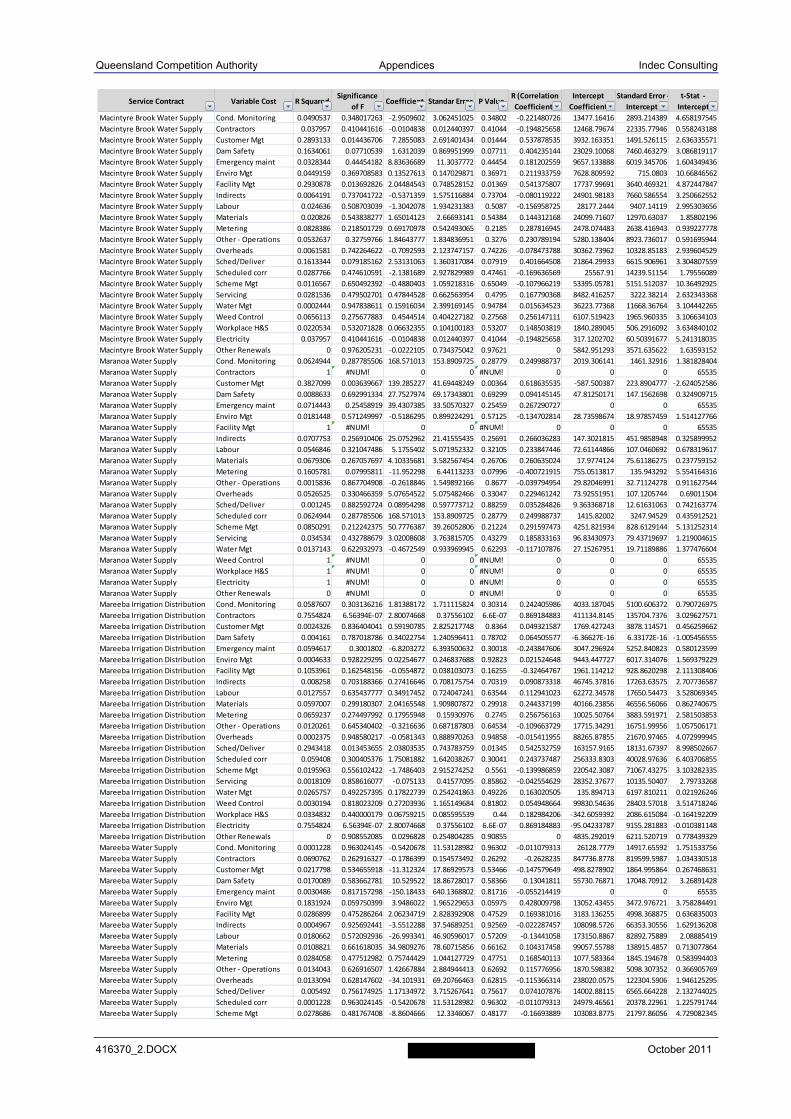
Queensland Competition Authority Appendices Indec Consulting
416370_2.DOCX October 2011
Service Contract Variable Cost R SquaredSignificance
of FCoefficient Standar Error P Value
R (Correlation
Coefficient
Intercept
Coefficient
Standard Error ‐
Intercept
t‐Stat ‐
Intercept
Macintyre Brook Water Supply Cond. Monitoring 0.0490537 0.348017263 ‐2.9509602 3.062451025 0.34802 ‐0.221480726 13477.16416 2893.214389 4.658197545
Macintyre Brook Water Supply Contractors 0.037957 0.410441616 ‐0.0104838 0.012440397 0.41044 ‐0.194825658 12468.79674 22335.77946 0.558243188
Macintyre Brook Water Supply Customer Mgt 0.2893133 0.014436706 7.2855083 2.691401434 0.01444 0.537878535 3932.163351 1491.526115 2.636335571
Macintyre Brook Water Supply Dam Safety 0.1634061 0.07710539 1.6312039 0.869951999 0.07711 0.404235144 23029.10068 7460.463279 3.086819117
Macintyre Brook Water Supply Emergency maint 0.0328344 0.44454182 8.83636689 11.3037772 0.44454 0.181202559 9657.133888 6019.345706 1.604349436
Macintyre Brook Water Supply Enviro Mgt 0.0449159 0.369708583 0.13527613 0.147029871 0.36971 0.211933759 7628.809592 715.0803 10.66846562
Macintyre Brook Water Supply Facility Mgt 0.2930878 0.013692826 2.04484543 0.748528152 0.01369 0.541375807 17737.99691 3640.469321 4.872447847
Macintyre Brook Water Supply Indirects 0.0064191 0.737041722 ‐0.5371359 1.575116884 0.73704 ‐0.080119222 24901.98183 7660.586554 3.250662552
Macintyre Brook Water Supply Labour 0.024636 0.508703039 ‐1.3042078 1.934231383 0.5087 ‐0.156958725 28177.2444 9407.14119 2.995303656
Macintyre Brook Water Supply Materials 0.020826 0.543838277 1.65014123 2.66693141 0.54384 0.144312168 24099.71607 12970.63037 1.85802196
Macintyre Brook Water Supply Metering 0.0828386 0.218501729 0.69170978 0.542493065 0.2185 0.287816945 2478.074483 2638.416943 0.939227778
Macintyre Brook Water Supply Other ‐ Operations 0.0532637 0.32759766 1.84643777 1.834836951 0.3276 0.230789194 5280.138404 8923.736017 0.591695944
Macintyre Brook Water Supply Overheads 0.0061581 0.742264622 ‐0.7092593 2.123747157 0.74226 ‐0.078473788 30362.73962 10328.85183 2.939604529
Macintyre Brook Water Supply Sched/Deliver 0.1613344 0.079185162 2.53131063 1.360317084 0.07919 0.401664508 21864.29933 6615.906961 3.304807559
Macintyre Brook Water Supply Scheduled corr 0.0287766 0.474610591 ‐2.1381689 2.927829989 0.47461 ‐0.169636569 25567.91 14239.51154 1.79556089
Macintyre Brook Water Supply Scheme Mgt 0.0116567 0.650492392 ‐0.4880403 1.059218316 0.65049 ‐0.107966219 53395.05781 5151.512037 10.36492925
Macintyre Brook Water Supply Servicing 0.0281536 0.479502701 0.47844528 0.662563954 0.4795 0.167790368 8482.416257 3222.38214 2.632343368
Macintyre Brook Water Supply Water Mgt 0.0002444 0.947838611 0.15916034 2.399169145 0.94784 0.015634523 36223.77368 11668.36764 3.104442265
Macintyre Brook Water Supply Weed Control 0.0656113 0.275677883 0.4544514 0.404227182 0.27568 0.256147111 6107.519423 1965.960335 3.106634103
Macintyre Brook Water Supply Workplace H&S 0.0220534 0.532071828 0.06632355 0.104100183 0.53207 0.148503819 1840.289045 506.2916092 3.634840102
Macintyre Brook Water Supply Electricity 0.037957 0.410441616 ‐0.0104838 0.012440397 0.41044 ‐0.194825658 317.1202702 60.50391677 5.241318035
Macintyre Brook Water Supply Other Renewals 0 0.976205231 ‐0.0222105 0.734375042 0.97621 0 5842.951293 3571.635622 1.63593152
Maranoa Water Supply Cond. Monitoring 0.0624944 0.287785506 168.571013 153.8909725 0.28779 0.249988737 2019.306141 1461.32916 1.381828404
Maranoa Water Supply Contractors 1 #NUM! 0 0 #NUM! 0 0 0 65535
Maranoa Water Supply Customer Mgt 0.3827099 0.003639667 139.285227 41.69448249 0.00364 0.618635535 ‐587.500387 223.8904777 ‐2.624052586
Maranoa Water Supply Dam Safety 0.0088633 0.692991334 27.7527974 69.17343801 0.69299 0.094145145 47.81250171 147.1562698 0.324909715
Maranoa Water Supply Emergency maint 0.0714443 0.25458919 39.4307385 33.50570327 0.25459 0.267290727 0 0 65535
Maranoa Water Supply Enviro Mgt 0.0181448 0.571249997 ‐0.5186295 0.899224291 0.57125 ‐0.134702814 28.73598674 18.97857459 1.514127766
Maranoa Water Supply Facility Mgt 1 #NUM! 0 0 #NUM! 0 0 0 65535
Maranoa Water Supply Indirects 0.0707753 0.256910406 25.0752962 21.41555435 0.25691 0.266036283 147.3021815 451.9858948 0.325899952
Maranoa Water Supply Labour 0.0546846 0.321047486 5.1755402 5.071952332 0.32105 0.233847446 72.61144866 107.0460692 0.678319617
Maranoa Water Supply Materials 0.0679306 0.267057697 4.10335681 3.582567454 0.26706 0.260635024 17.9774124 75.61186275 0.237759152
Maranoa Water Supply Metering 0.1605781 0.07995811 ‐11.952298 6.44113233 0.07996 ‐0.400721915 755.0513817 135.943292 5.554164316
Maranoa Water Supply Other ‐ Operations 0.0015836 0.867704908 ‐0.2618846 1.549892166 0.8677 ‐0.039794954 29.82046991 32.71124278 0.911627544
Maranoa Water Supply Overheads 0.0526525 0.330466359 5.07654522 5.075482466 0.33047 0.229461242 73.92551951 107.1205744 0.69011504
Maranoa Water Supply Sched/Deliver 0.001245 0.882592724 0.08954298 0.597773712 0.88259 0.035284826 9.363368718 12.61631063 0.742163774
Maranoa Water Supply Scheduled corr 0.0624944 0.287785506 168.571013 153.8909725 0.28779 0.249988737 1415.82002 3247.94529 0.435912521
Maranoa Water Supply Scheme Mgt 0.0850291 0.212242375 50.7776387 39.26052806 0.21224 0.291597473 4251.821934 828.6129144 5.131252314
Maranoa Water Supply Servicing 0.034534 0.432788679 3.02008608 3.763815705 0.43279 0.185833163 96.83430973 79.43719697 1.219004615
Maranoa Water Supply Water Mgt 0.0137143 0.622932973 ‐0.4672549 0.933969945 0.62293 ‐0.117107876 27.15267951 19.71189886 1.377476604
Maranoa Water Supply Weed Control 1 #NUM! 0 0 #NUM! 0 0 0 65535
Maranoa Water Supply Workplace H&S 1 #NUM! 0 0 #NUM! 0 0 0 65535
Maranoa Water Supply Electricity 1 #NUM! 0 0 #NUM! 0 0 0 65535
Maranoa Water Supply Other Renewals 0 #NUM! 0 0 #NUM! 0 0 0 65535
Mareeba Irrigation Distribution Cond. Monitoring 0.0587607 0.303136216 1.81388172 1.711115824 0.30314 0.242405986 4033.187045 5100.606372 0.790726975
Mareeba Irrigation Distribution Contractors 0.7554824 6.56394E‐07 2.80074668 0.37556102 6.6E‐07 0.869184883 411134.8145 135704.7376 3.029627571
Mareeba Irrigation Distribution Customer Mgt 0.0024326 0.836404041 0.59190785 2.825217748 0.8364 0.049321587 1769.427243 3878.114571 0.456259662
Mareeba Irrigation Distribution Dam Safety 0.004161 0.787018786 0.34022754 1.240596411 0.78702 0.064505577 ‐6.36627E‐16 6.33172E‐16 ‐1.005456555
Mareeba Irrigation Distribution Emergency maint 0.0594617 0.3001802 ‐6.8203272 6.393500632 0.30018 ‐0.243847606 3047.296924 5252.840823 0.580123599
Mareeba Irrigation Distribution Enviro Mgt 0.0004633 0.928229295 0.02254677 0.246837688 0.92823 0.021524648 9443.447727 6017.314076 1.569379229
Mareeba Irrigation Distribution Facility Mgt 0.1053961 0.162548156 ‐0.0554872 0.038103073 0.16255 ‐0.32464767 1961.114212 928.8620298 2.111308406
Mareeba Irrigation Distribution Indirects 0.008258 0.703188366 0.27416646 0.708175754 0.70319 0.090873318 46745.37816 17263.63575 2.707736587
Mareeba Irrigation Distribution Labour 0.0127557 0.635437777 0.34917452 0.724047241 0.63544 0.112941023 62272.34578 17650.54473 3.528069345
Mareeba Irrigation Distribution Materials 0.0597007 0.299180307 2.04165548 1.909807872 0.29918 0.244337199 40166.23856 46556.56066 0.862740675
Mareeba Irrigation Distribution Metering 0.0659237 0.274497992 0.17955948 0.15930976 0.2745 0.256756163 10025.50764 3883.591971 2.581503853
Mareeba Irrigation Distribution Other ‐ Operations 0.0120261 0.645340402 ‐0.3216636 0.687187803 0.64534 ‐0.109663729 17715.34291 16751.99956 1.057506171
Mareeba Irrigation Distribution Overheads 0.0002375 0.948580217 ‐0.0581343 0.888970263 0.94858 ‐0.015411955 88265.87855 21670.97465 4.072999945
Mareeba Irrigation Distribution Sched/Deliver 0.2943418 0.013453655 2.03803535 0.743783759 0.01345 0.542532759 163157.9165 18131.67397 8.998502667
Mareeba Irrigation Distribution Scheduled corr 0.059408 0.300405376 1.75081882 1.642038267 0.30041 0.243737487 256333.8303 40028.97636 6.403706855
Mareeba Irrigation Distribution Scheme Mgt 0.0195963 0.556102422 ‐1.7486403 2.915274252 0.5561 ‐0.139986859 220542.3087 71067.43275 3.103282335
Mareeba Irrigation Distribution Servicing 0.0018109 0.858616077 ‐0.075133 0.41577095 0.85862 ‐0.042554629 28352.37677 10135.50407 2.79733268
Mareeba Irrigation Distribution Water Mgt 0.0265757 0.492257395 0.17822739 0.254241863 0.49226 0.163020505 135.894713 6197.810211 0.021926246
Mareeba Irrigation Distribution Weed Control 0.0030194 0.818023209 0.27203936 1.165149684 0.81802 0.054948664 99830.54636 28403.57018 3.514718246
Mareeba Irrigation Distribution Workplace H&S 0.0334832 0.440000179 0.06759215 0.085595539 0.44 0.182984206 ‐342.6059392 2086.615084 ‐0.164192209
Mareeba Irrigation Distribution Electricity 0.7554824 6.56394E‐07 2.80074668 0.37556102 6.6E‐07 0.869184883 ‐95.04233787 9155.281883 ‐0.010381148
Mareeba Irrigation Distribution Other Renewals 0 0.908552085 0.0296828 0.254804285 0.90855 0 4835.292019 6211.520719 0.778439329
Mareeba Water Supply Cond. Monitoring 0.0001228 0.963024145 ‐0.5420678 11.53128982 0.96302 ‐0.011079313 26128.7779 14917.65592 1.751533756
Mareeba Water Supply Contractors 0.0690762 0.262916327 ‐0.1786399 0.154573492 0.26292 ‐0.2628235 847736.8778 819599.5987 1.034330518
Mareeba Water Supply Customer Mgt 0.0217798 0.534655918 ‐11.312324 17.86929573 0.53466 ‐0.147579649 498.8278902 1864.995864 0.267468631
Mareeba Water Supply Dam Safety 0.0170089 0.583662781 10.529522 18.86728017 0.58366 0.13041811 55730.76871 17048.70912 3.26891428
Mareeba Water Supply Emergency maint 0.0030486 0.817157298 ‐150.18433 640.1368802 0.81716 ‐0.055214419 0 0 65535
Mareeba Water Supply Enviro Mgt 0.1831924 0.059750399 3.9486022 1.965229653 0.05975 0.428009798 13052.43455 3472.976721 3.758284491
Mareeba Water Supply Facility Mgt 0.0286899 0.475286264 2.06234719 2.828392908 0.47529 0.169381016 3183.136255 4998.368875 0.636835003
Mareeba Water Supply Indirects 0.0004967 0.925692441 ‐3.5512288 37.54689251 0.92569 ‐0.022287457 108098.5726 66353.30556 1.629136208
Mareeba Water Supply Labour 0.0180662 0.572092936 ‐26.993341 46.90596017 0.57209 ‐0.13441058 173150.8867 82892.75889 2.08885419
Mareeba Water Supply Materials 0.0108821 0.661618035 34.9809276 78.60715856 0.66162 0.104317458 99057.55788 138915.4857 0.713077864
Mareeba Water Supply Metering 0.0284058 0.477512982 0.75744429 1.044127729 0.47751 0.168540113 1077.583364 1845.194678 0.583994403
Mareeba Water Supply Other ‐ Operations 0.0134043 0.626916507 1.42667884 2.884944413 0.62692 0.115776956 1870.598382 5098.307352 0.366905769
Mareeba Water Supply Overheads 0.0133094 0.628147602 ‐34.101931 69.20766463 0.62815 ‐0.115366314 238020.0575 122304.5906 1.946125295
Mareeba Water Supply Sched/Deliver 0.005492 0.756174925 1.17134972 3.715267641 0.75617 0.074107876 14002.88115 6565.664228 2.132744025
Mareeba Water Supply Scheduled corr 0.0001228 0.963024145 ‐0.5420678 11.53128982 0.96302 ‐0.011079313 24979.46561 20378.22961 1.225791744
Mareeba Water Supply Scheme Mgt 0.0278686 0.481767408 ‐8.8604666 12.3346067 0.48177 ‐0.16693889 103083.8775 21797.86056 4.729082345
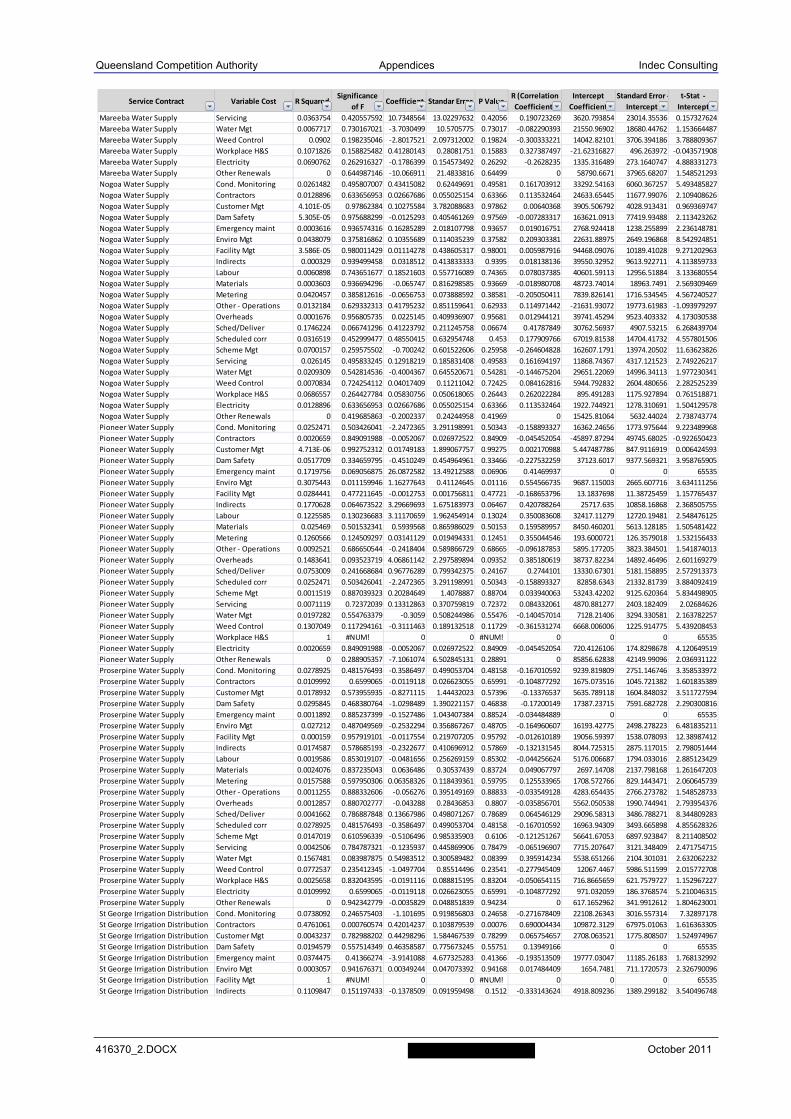
Queensland Competition Authority Appendices Indec Consulting
416370_2.DOCX October 2011
Service Contract Variable Cost R SquaredSignificance
of FCoefficient Standar Error P Value
R (Correlation
Coefficient
Intercept
Coefficient
Standard Error ‐
Intercept
t‐Stat ‐
Intercept
Mareeba Water Supply Servicing 0.0363754 0.420557592 10.7348564 13.02297632 0.42056 0.190723269 3620.793854 23014.35536 0.157327624
Mareeba Water Supply Water Mgt 0.0067717 0.730167021 ‐3.7030499 10.5705775 0.73017 ‐0.082290393 21550.96902 18680.44762 1.153664487
Mareeba Water Supply Weed Control 0.0902 0.198235046 ‐2.8017521 2.097312002 0.19824 ‐0.300333221 14042.82101 3706.394186 3.788809367
Mareeba Water Supply Workplace H&S 0.1071826 0.158825482 0.41280143 0.28081751 0.15883 0.327387497 ‐21.62316827 496.263972 ‐0.043571908
Mareeba Water Supply Electricity 0.0690762 0.262916327 ‐0.1786399 0.154573492 0.26292 ‐0.2628235 1335.316489 273.1640747 4.888331273
Mareeba Water Supply Other Renewals 0 0.644987146 ‐10.066911 21.4833816 0.64499 0 58790.6671 37965.68207 1.548521293
Nogoa Water Supply Cond. Monitoring 0.0261482 0.495807007 0.43415082 0.62449691 0.49581 0.161703912 33292.54163 6060.367257 5.493485827
Nogoa Water Supply Contractors 0.0128896 0.633656953 0.02667686 0.055025154 0.63366 0.113532464 24633.65445 11677.99076 2.109408626
Nogoa Water Supply Customer Mgt 4.101E‐05 0.97862384 0.10275584 3.782088683 0.97862 0.00640368 3905.506792 4028.913431 0.969369747
Nogoa Water Supply Dam Safety 5.305E‐05 0.975688299 ‐0.0125293 0.405461269 0.97569 ‐0.007283317 163621.0913 77419.93488 2.113423262
Nogoa Water Supply Emergency maint 0.0003616 0.936574316 0.16285289 2.018107798 0.93657 0.019016751 2768.924418 1238.255899 2.236148781
Nogoa Water Supply Enviro Mgt 0.0438079 0.375816862 0.10355689 0.114035239 0.37582 0.209303381 22631.88975 2649.196868 8.542924851
Nogoa Water Supply Facility Mgt 3.586E‐05 0.980011429 0.01114278 0.438605317 0.98001 0.005987916 94468.09076 10189.41028 9.271202963
Nogoa Water Supply Indirects 0.000329 0.939499458 0.0318512 0.413833333 0.9395 0.018138136 39550.32952 9613.922711 4.113859733
Nogoa Water Supply Labour 0.0060898 0.743651677 0.18521603 0.557716089 0.74365 0.078037385 40601.59113 12956.51884 3.133680554
Nogoa Water Supply Materials 0.0003603 0.936694296 ‐0.065747 0.816298585 0.93669 ‐0.018980708 48723.74014 18963.7491 2.569309469
Nogoa Water Supply Metering 0.0420457 0.385812616 ‐0.0656753 0.073888592 0.38581 ‐0.205050411 7839.826141 1716.534545 4.567240527
Nogoa Water Supply Other ‐ Operations 0.0132184 0.629332313 0.41795232 0.851159641 0.62933 0.114971442 ‐21631.93072 19773.61983 ‐1.093979297
Nogoa Water Supply Overheads 0.0001676 0.956805735 0.0225145 0.409936907 0.95681 0.012944121 39741.45294 9523.403332 4.173030538
Nogoa Water Supply Sched/Deliver 0.1746224 0.066741296 0.41223792 0.211245758 0.06674 0.41787849 30762.56937 4907.53215 6.268439704
Nogoa Water Supply Scheduled corr 0.0316519 0.452999477 0.48550415 0.632954748 0.453 0.177909766 67019.81538 14704.41732 4.557801506
Nogoa Water Supply Scheme Mgt 0.0700157 0.259575502 ‐0.700242 0.601522606 0.25958 ‐0.264604828 162607.1791 13974.20502 11.63623826
Nogoa Water Supply Servicing 0.026145 0.495833245 0.12918219 0.185831408 0.49583 0.161694197 11868.74367 4317.121523 2.749226217
Nogoa Water Supply Water Mgt 0.0209309 0.542814536 ‐0.4004367 0.645520671 0.54281 ‐0.144675204 29651.22069 14996.34113 1.977230341
Nogoa Water Supply Weed Control 0.0070834 0.724254112 0.04017409 0.11211042 0.72425 0.084162816 5944.792832 2604.480656 2.282525239
Nogoa Water Supply Workplace H&S 0.0686557 0.264427784 0.05830756 0.050618065 0.26443 0.262022284 895.491283 1175.927894 0.761518871
Nogoa Water Supply Electricity 0.0128896 0.633656953 0.02667686 0.055025154 0.63366 0.113532464 1922.744921 1278.310691 1.504129578
Nogoa Water Supply Other Renewals 0 0.419685863 ‐0.2002337 0.24244958 0.41969 0 15425.81064 5632.44024 2.738743774
Pioneer Water Supply Cond. Monitoring 0.0252471 0.503426041 ‐2.2472365 3.291198991 0.50343 ‐0.158893327 16362.24656 1773.975644 9.223489968
Pioneer Water Supply Contractors 0.0020659 0.849091988 ‐0.0052067 0.026972522 0.84909 ‐0.045452054 ‐45897.87294 49745.68025 ‐0.922650423
Pioneer Water Supply Customer Mgt 4.713E‐06 0.992752312 0.01749183 1.899067757 0.99275 0.002170988 5.447487786 847.9116919 0.006424593
Pioneer Water Supply Dam Safety 0.0517709 0.334659795 ‐0.4510249 0.454964961 0.33466 ‐0.227532259 37123.6017 9377.569321 3.958765905
Pioneer Water Supply Emergency maint 0.1719756 0.069056875 26.0872582 13.49212588 0.06906 0.41469937 0 0 65535
Pioneer Water Supply Enviro Mgt 0.3075443 0.011159946 1.16277643 0.41124645 0.01116 0.554566735 9687.115003 2665.607716 3.634111256
Pioneer Water Supply Facility Mgt 0.0284441 0.477211645 ‐0.0012753 0.001756811 0.47721 ‐0.168653796 13.1837698 11.38725459 1.157765437
Pioneer Water Supply Indirects 0.1770628 0.064673522 3.29669693 1.675183973 0.06467 0.420788264 25717.635 10858.16868 2.368505755
Pioneer Water Supply Labour 0.1225585 0.130236683 3.11170659 1.962454914 0.13024 0.350083608 32417.11279 12720.19481 2.548476125
Pioneer Water Supply Materials 0.025469 0.501532341 0.5939568 0.865986029 0.50153 0.159589957 8450.460201 5613.128185 1.505481422
Pioneer Water Supply Metering 0.1260566 0.124509297 0.03141129 0.019494331 0.12451 0.355044546 193.6000721 126.3579018 1.532156433
Pioneer Water Supply Other ‐ Operations 0.0092521 0.686650544 ‐0.2418404 0.589866729 0.68665 ‐0.096187853 5895.177205 3823.384501 1.541874013
Pioneer Water Supply Overheads 0.1483641 0.093523719 4.06861142 2.297589894 0.09352 0.385180619 38737.82234 14892.46496 2.601169279
Pioneer Water Supply Sched/Deliver 0.0753009 0.241668684 0.96776289 0.799342375 0.24167 0.2744101 13330.67301 5181.158895 2.572913373
Pioneer Water Supply Scheduled corr 0.0252471 0.503426041 ‐2.2472365 3.291198991 0.50343 ‐0.158893327 82858.6343 21332.81739 3.884092419
Pioneer Water Supply Scheme Mgt 0.0011519 0.887039323 0.20284649 1.4078887 0.88704 0.033940063 53243.42202 9125.620364 5.834498905
Pioneer Water Supply Servicing 0.0071119 0.72372039 0.13312863 0.370759819 0.72372 0.084332061 4870.881277 2403.182409 2.02684626
Pioneer Water Supply Water Mgt 0.0197282 0.554763379 ‐0.3059 0.508244986 0.55476 ‐0.140457014 7128.21406 3294.330581 2.163782257
Pioneer Water Supply Weed Control 0.1307049 0.117294161 ‐0.3111463 0.189132518 0.11729 ‐0.361531274 6668.006006 1225.914775 5.439208453
Pioneer Water Supply Workplace H&S 1 #NUM! 0 0 #NUM! 0 0 0 65535
Pioneer Water Supply Electricity 0.0020659 0.849091988 ‐0.0052067 0.026972522 0.84909 ‐0.045452054 720.4126106 174.8298678 4.120649519
Pioneer Water Supply Other Renewals 0 0.288905357 ‐7.1061074 6.502845131 0.28891 0 85856.62838 42149.99096 2.036931122
Proserpine Water Supply Cond. Monitoring 0.0278925 0.481576493 ‐0.3586497 0.499053704 0.48158 ‐0.167010592 9239.819809 2751.146746 3.358533972
Proserpine Water Supply Contractors 0.0109992 0.6599065 ‐0.0119118 0.026623055 0.65991 ‐0.104877292 1675.073516 1045.721382 1.601835389
Proserpine Water Supply Customer Mgt 0.0178932 0.573955935 ‐0.8271115 1.44432023 0.57396 ‐0.13376537 5635.789118 1604.848032 3.511727594
Proserpine Water Supply Dam Safety 0.0295845 0.468380764 ‐1.0298489 1.390221157 0.46838 ‐0.17200149 17387.23715 7591.682728 2.290300816
Proserpine Water Supply Emergency maint 0.0011892 0.885237399 ‐0.1527486 1.043407384 0.88524 ‐0.034484889 0 0 65535
Proserpine Water Supply Enviro Mgt 0.027212 0.487049569 ‐0.2532294 0.356867267 0.48705 ‐0.164960607 16193.42775 2498.278223 6.481835211
Proserpine Water Supply Facility Mgt 0.000159 0.957919101 ‐0.0117554 0.219707205 0.95792 ‐0.012610189 19056.59397 1538.078093 12.38987412
Proserpine Water Supply Indirects 0.0174587 0.578685193 ‐0.2322677 0.410696912 0.57869 ‐0.132131545 8044.725315 2875.117015 2.798051444
Proserpine Water Supply Labour 0.0019586 0.853019107 ‐0.0481656 0.256269159 0.85302 ‐0.044256624 5176.006687 1794.033016 2.885123429
Proserpine Water Supply Materials 0.0024076 0.837235043 0.0636486 0.30537439 0.83724 0.049067797 2697.14708 2137.798168 1.261647203
Proserpine Water Supply Metering 0.0157588 0.597950306 0.06358326 0.118439361 0.59795 0.125533965 1708.572766 829.1443471 2.060645739
Proserpine Water Supply Other ‐ Operations 0.0011255 0.888332606 ‐0.056276 0.395149169 0.88833 ‐0.033549128 4283.654435 2766.273782 1.548528733
Proserpine Water Supply Overheads 0.0012857 0.880702777 ‐0.043288 0.28436853 0.8807 ‐0.035856701 5562.050538 1990.744941 2.793954376
Proserpine Water Supply Sched/Deliver 0.0041662 0.786887848 0.13667986 0.498071267 0.78689 0.064546129 29096.58313 3486.788271 8.344809283
Proserpine Water Supply Scheduled corr 0.0278925 0.481576493 ‐0.3586497 0.499053704 0.48158 ‐0.167010592 16963.94309 3493.665898 4.855628326
Proserpine Water Supply Scheme Mgt 0.0147019 0.610596339 ‐0.5106496 0.985335903 0.6106 ‐0.121251267 56641.67053 6897.923847 8.211408502
Proserpine Water Supply Servicing 0.0042506 0.784787321 ‐0.1235937 0.445869906 0.78479 ‐0.065196907 7715.207647 3121.348409 2.471754715
Proserpine Water Supply Water Mgt 0.1567481 0.083987875 0.54983512 0.300589482 0.08399 0.395914234 5538.651266 2104.301031 2.632062232
Proserpine Water Supply Weed Control 0.0772537 0.235412345 ‐1.0497704 0.85514496 0.23541 ‐0.277945409 12067.4467 5986.511599 2.015772708
Proserpine Water Supply Workplace H&S 0.0025658 0.832043595 ‐0.0191116 0.088815195 0.83204 ‐0.050654115 716.8665659 621.7579727 1.152967227
Proserpine Water Supply Electricity 0.0109992 0.6599065 ‐0.0119118 0.026623055 0.65991 ‐0.104877292 971.032059 186.3768574 5.210046315
Proserpine Water Supply Other Renewals 0 0.942342779 ‐0.0035829 0.048851839 0.94234 0 617.1652962 341.9912612 1.804623001
St George Irrigation Distribution Cond. Monitoring 0.0738092 0.246575403 ‐1.101695 0.919856803 0.24658 ‐0.271678409 22108.26343 3016.557314 7.32897178
St George Irrigation Distribution Contractors 0.4761061 0.000760574 0.42014237 0.103879539 0.00076 0.690004434 109872.3129 67975.01063 1.616363305
St George Irrigation Distribution Customer Mgt 0.0043237 0.782988202 0.44298296 1.584467539 0.78299 0.065754657 2708.063521 1775.808507 1.524974967
St George Irrigation Distribution Dam Safety 0.0194579 0.557514349 0.46358587 0.775673245 0.55751 0.13949166 0 0 65535
St George Irrigation Distribution Emergency maint 0.0374475 0.41366274 ‐3.9141088 4.677325283 0.41366 ‐0.193513509 19777.03047 11185.26183 1.768132992
St George Irrigation Distribution Enviro Mgt 0.0003057 0.941676371 0.00349244 0.047073392 0.94168 0.017484409 1654.7481 711.1720573 2.326790096
St George Irrigation Distribution Facility Mgt 1 #NUM! 0 0 #NUM! 0 0 0 65535
St George Irrigation Distribution Indirects 0.1109847 0.151197433 ‐0.1378509 0.091959498 0.1512 ‐0.333143624 4918.809236 1389.299182 3.540496748
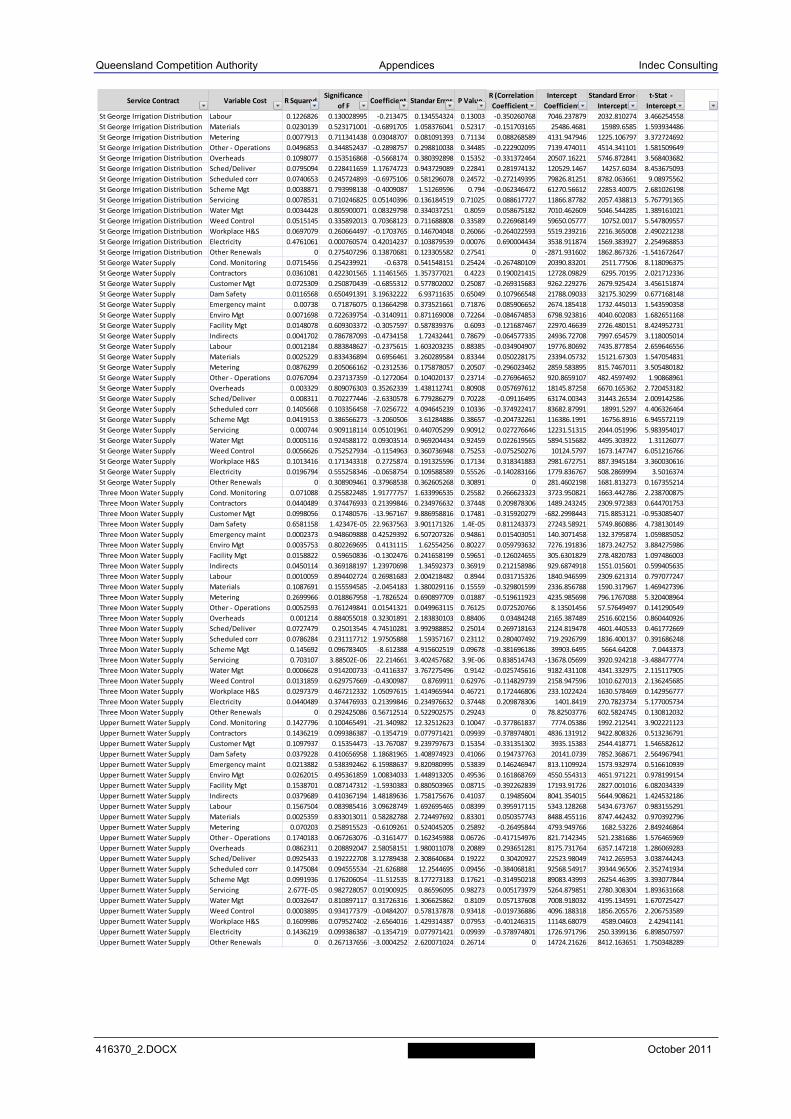
Queensland Competition Authority Appendices Indec Consulting
416370_2.DOCX October 2011
Service Contract Variable Cost R SquaredSignificance
of FCoefficient Standar Error P Value
R (Correlation
Coefficient
Intercept
Coefficient
Standard Error ‐
Intercept
t‐Stat ‐
Intercept
St George Irrigation Distribution Labour 0.1226826 0.130028995 ‐0.213475 0.134554324 0.13003 ‐0.350260768 7046.237879 2032.810274 3.466254558
St George Irrigation Distribution Materials 0.0230139 0.523171001 ‐0.6891705 1.058376041 0.52317 ‐0.151703165 25486.4681 15989.6585 1.593934486
St George Irrigation Distribution Metering 0.0077913 0.711341438 0.03048707 0.081091393 0.71134 0.088268589 4131.947946 1225.106797 3.372724692
St George Irrigation Distribution Other ‐ Operations 0.0496853 0.344852437 ‐0.2898757 0.298810038 0.34485 ‐0.222902095 7139.474011 4514.341101 1.581509649
St George Irrigation Distribution Overheads 0.1098077 0.153516868 ‐0.5668174 0.380392898 0.15352 ‐0.331372464 20507.16221 5746.872841 3.568403682
St George Irrigation Distribution Sched/Deliver 0.0795094 0.228411659 1.17674723 0.943729089 0.22841 0.281974132 120529.1467 14257.6034 8.453675093
St George Irrigation Distribution Scheduled corr 0.0740653 0.245724893 ‐0.6975106 0.581296078 0.24572 ‐0.272149395 79826.81251 8782.063661 9.08975562
St George Irrigation Distribution Scheme Mgt 0.0038871 0.793998138 ‐0.4009087 1.51269596 0.794 ‐0.062346472 61270.56612 22853.40075 2.681026198
St George Irrigation Distribution Servicing 0.0078531 0.710246825 0.05140396 0.136184519 0.71025 0.088617727 11866.87782 2057.438813 5.767791365
St George Irrigation Distribution Water Mgt 0.0034428 0.805900071 0.08329798 0.334037251 0.8059 0.058675182 7010.462609 5046.544285 1.389161021
St George Irrigation Distribution Weed Control 0.0515145 0.335892013 0.70368123 0.711688808 0.33589 0.226968149 59650.05777 10752.0017 5.547809557
St George Irrigation Distribution Workplace H&S 0.0697079 0.260664497 ‐0.1703765 0.146704048 0.26066 ‐0.264022593 5519.239216 2216.365008 2.490221238
St George Irrigation Distribution Electricity 0.4761061 0.000760574 0.42014237 0.103879539 0.00076 0.690004434 3538.911874 1569.383927 2.254968853
St George Irrigation Distribution Other Renewals 0 0.275407296 0.13870681 0.123305582 0.27541 0 ‐2871.931602 1862.867326 ‐1.541672647
St George Water Supply Cond. Monitoring 0.0715456 0.254239921 ‐0.6378 0.541548151 0.25424 ‐0.267480109 20390.83201 2511.77506 8.118096375
St George Water Supply Contractors 0.0361081 0.422301565 1.11461565 1.357377021 0.4223 0.190021415 12728.09829 6295.70195 2.021712336
St George Water Supply Customer Mgt 0.0725309 0.250870439 ‐0.6855312 0.577802002 0.25087 ‐0.269315683 9262.229276 2679.925424 3.456151874
St George Water Supply Dam Safety 0.0116568 0.650491391 3.19632222 6.93711635 0.65049 0.107966548 21788.09033 32175.30299 0.677168148
St George Water Supply Emergency maint 0.00738 0.71876075 0.13664298 0.373521661 0.71876 0.085906652 2674.185418 1732.445013 1.543590358
St George Water Supply Enviro Mgt 0.0071698 0.722639754 ‐0.3140911 0.871169008 0.72264 ‐0.084674853 6798.923816 4040.602083 1.682651168
St George Water Supply Facility Mgt 0.0148078 0.609303372 ‐0.3057597 0.587839376 0.6093 ‐0.121687467 22970.46639 2726.480151 8.424952731
St George Water Supply Indirects 0.0041702 0.786787093 ‐0.4734158 1.72432441 0.78679 ‐0.064577335 24936.72708 7997.654579 3.118005014
St George Water Supply Labour 0.0012184 0.883848627 ‐0.2375615 1.603203235 0.88385 ‐0.034904907 19776.80692 7435.877854 2.659646556
St George Water Supply Materials 0.0025229 0.833436894 0.6956461 3.260289584 0.83344 0.050228175 23394.05732 15121.67303 1.547054831
St George Water Supply Metering 0.0876299 0.205066162 ‐0.2312536 0.175878057 0.20507 ‐0.296023462 2859.583895 815.7467011 3.505480182
St George Water Supply Other ‐ Operations 0.0767094 0.237137359 ‐0.1272064 0.104020137 0.23714 ‐0.276964652 920.8659107 482.4597492 1.90868961
St George Water Supply Overheads 0.003329 0.809076303 0.35262339 1.438112741 0.80908 0.057697612 18145.87258 6670.165362 2.720453182
St George Water Supply Sched/Deliver 0.008311 0.702277446 ‐2.6330578 6.779286279 0.70228 ‐0.09116495 63174.00343 31443.26534 2.009142586
St George Water Supply Scheduled corr 0.1405668 0.103356458 ‐7.0256722 4.094645239 0.10336 ‐0.374922417 83682.87991 18991.5297 4.406326464
St George Water Supply Scheme Mgt 0.0419153 0.386566273 ‐3.2060506 3.61284886 0.38657 ‐0.204732261 116386.1991 16756.8916 6.945572119
St George Water Supply Servicing 0.000744 0.909118114 0.05101961 0.440705299 0.90912 0.027276646 12231.51315 2044.051996 5.983954017
St George Water Supply Water Mgt 0.0005116 0.924588172 0.09303514 0.969204434 0.92459 0.022619565 5894.515682 4495.303922 1.31126077
St George Water Supply Weed Control 0.0056626 0.752527934 ‐0.1154963 0.360736948 0.75253 ‐0.075250276 10124.5797 1673.147747 6.051216766
St George Water Supply Workplace H&S 0.1013416 0.171343318 0.2725874 0.191325596 0.17134 0.318341883 2981.672751 887.3945184 3.360030616
St George Water Supply Electricity 0.0196794 0.555258346 ‐0.0658754 0.109588589 0.55526 ‐0.140283166 1779.836767 508.2869994 3.5016374
St George Water Supply Other Renewals 0 0.308909461 0.37968538 0.362605268 0.30891 0 281.4602198 1681.813273 0.167355214
Three Moon Water Supply Cond. Monitoring 0.071088 0.255822485 1.91777757 1.633996535 0.25582 0.266623323 3723.950821 1663.442786 2.238700875
Three Moon Water Supply Contractors 0.0440489 0.374476933 0.21399846 0.234976632 0.37448 0.209878306 1489.243245 2309.972383 0.644701753
Three Moon Water Supply Customer Mgt 0.0998056 0.17480576 ‐13.967167 9.886958816 0.17481 ‐0.315920279 ‐682.2998443 715.8853121 ‐0.953085407
Three Moon Water Supply Dam Safety 0.6581158 1.42347E‐05 22.9637563 3.901171326 1.4E‐05 0.811243373 27243.58921 5749.860886 4.738130149
Three Moon Water Supply Emergency maint 0.0002373 0.948609888 0.42529392 6.507207326 0.94861 0.015403051 140.3071458 132.3795874 1.059885052
Three Moon Water Supply Enviro Mgt 0.0035753 0.802269695 0.4131115 1.62554256 0.80227 0.059793632 7276.191836 1873.242752 3.884275986
Three Moon Water Supply Facility Mgt 0.0158822 0.59650836 ‐0.1302476 0.241658199 0.59651 ‐0.126024655 305.6301829 278.4820783 1.097486003
Three Moon Water Supply Indirects 0.0450114 0.369188197 1.23970698 1.34592373 0.36919 0.212158986 929.6874918 1551.015601 0.599405635
Three Moon Water Supply Labour 0.0010059 0.894402724 0.26981683 2.004218482 0.8944 0.031715326 1840.946599 2309.621314 0.797077247
Three Moon Water Supply Materials 0.1087691 0.155594585 ‐2.0454183 1.380029116 0.15559 ‐0.329801599 2336.856788 1590.317967 1.469427396
Three Moon Water Supply Metering 0.2699966 0.018867958 ‐1.7826524 0.690897709 0.01887 ‐0.519611923 4235.985698 796.1767088 5.320408964
Three Moon Water Supply Other ‐ Operations 0.0052593 0.761249841 0.01541321 0.049963115 0.76125 0.072520766 8.13501456 57.57649497 0.141290549
Three Moon Water Supply Overheads 0.001214 0.884055018 0.32301891 2.183830103 0.88406 0.03484248 2165.387489 2516.602156 0.860440926
Three Moon Water Supply Sched/Deliver 0.0727479 0.25013545 4.74510281 3.992988852 0.25014 0.269718163 2124.819478 4601.440533 0.461772669
Three Moon Water Supply Scheduled corr 0.0786284 0.231117712 1.97505888 1.59357167 0.23112 0.280407492 719.2926799 1836.400137 0.391686248
Three Moon Water Supply Scheme Mgt 0.145692 0.096783405 ‐8.612388 4.915602519 0.09678 ‐0.381696186 39903.6495 5664.64208 7.0443373
Three Moon Water Supply Servicing 0.703107 3.88502E‐06 22.214661 3.402457682 3.9E‐06 0.838514743 ‐13678.05699 3920.924218 ‐3.488477774
Three Moon Water Supply Water Mgt 0.0006628 0.914200733 ‐0.4116337 3.767275496 0.9142 ‐0.025745616 9182.431108 4341.332975 2.115117905
Three Moon Water Supply Weed Control 0.0131859 0.629757669 ‐0.4300987 0.8769911 0.62976 ‐0.114829739 2158.947596 1010.627013 2.136245685
Three Moon Water Supply Workplace H&S 0.0297379 0.467212332 1.05097615 1.414965944 0.46721 0.172446806 233.1022424 1630.578469 0.142956777
Three Moon Water Supply Electricity 0.0440489 0.374476933 0.21399846 0.234976632 0.37448 0.209878306 1401.8419 270.7823734 5.177005734
Three Moon Water Supply Other Renewals 0 0.292425086 0.56712514 0.522902575 0.29243 0 78.82503776 602.5824745 0.130812032
Upper Burnett Water Supply Cond. Monitoring 0.1427796 0.100465491 ‐21.340982 12.32512623 0.10047 ‐0.377861837 7774.05386 1992.212541 3.902221123
Upper Burnett Water Supply Contractors 0.1436219 0.099386387 ‐0.1354719 0.077971421 0.09939 ‐0.378974801 4836.131912 9422.808326 0.513236791
Upper Burnett Water Supply Customer Mgt 0.1097937 0.15354473 ‐13.767087 9.239797673 0.15354 ‐0.331351302 3935.15383 2544.418771 1.546582612
Upper Burnett Water Supply Dam Safety 0.0379228 0.410656958 1.18681965 1.408974923 0.41066 0.194737763 20141.0739 7852.368671 2.564967941
Upper Burnett Water Supply Emergency maint 0.0213882 0.538392462 6.15988637 9.820980995 0.53839 0.146246947 813.1109924 1573.932974 0.516610939
Upper Burnett Water Supply Enviro Mgt 0.0262015 0.495361859 1.00834033 1.448913205 0.49536 0.161868769 4550.554313 4651.971221 0.978199154
Upper Burnett Water Supply Facility Mgt 0.1538701 0.087147312 ‐1.5930383 0.880503965 0.08715 ‐0.392262839 17193.91726 2827.001016 6.082034339
Upper Burnett Water Supply Indirects 0.0379689 0.410367194 1.48189636 1.758175676 0.41037 0.19485604 8041.354015 5644.908621 1.424532186
Upper Burnett Water Supply Labour 0.1567504 0.083985416 3.09628749 1.692695465 0.08399 0.395917115 5343.128268 5434.673767 0.983155291
Upper Burnett Water Supply Materials 0.0025359 0.833013011 0.58282788 2.724497692 0.83301 0.050357743 8488.455116 8747.442432 0.970392796
Upper Burnett Water Supply Metering 0.070203 0.258915523 ‐0.6109261 0.524045205 0.25892 ‐0.26495844 4793.949766 1682.53226 2.849246864
Upper Burnett Water Supply Other ‐ Operations 0.1740183 0.067263076 ‐0.3161477 0.162345988 0.06726 ‐0.417154976 821.7142345 521.2381686 1.576465969
Upper Burnett Water Supply Overheads 0.0862311 0.208892047 2.58058151 1.980011078 0.20889 0.293651281 8175.731764 6357.147218 1.286069283
Upper Burnett Water Supply Sched/Deliver 0.0925433 0.192222708 3.12789438 2.308640684 0.19222 0.30420927 22523.98049 7412.265953 3.038744243
Upper Burnett Water Supply Scheduled corr 0.1475084 0.094555534 ‐21.626888 12.2544695 0.09456 ‐0.384068181 92568.54917 39344.96506 2.352741934
Upper Burnett Water Supply Scheme Mgt 0.0991936 0.176206054 ‐11.512535 8.177273183 0.17621 ‐0.314950218 89083.43993 26254.46395 3.393077844
Upper Burnett Water Supply Servicing 2.677E‐05 0.982728057 0.01900925 0.86596095 0.98273 0.005173979 5264.879851 2780.308304 1.893631668
Upper Burnett Water Supply Water Mgt 0.0032647 0.810897117 0.31726316 1.306625862 0.8109 0.057137608 7008.918032 4195.134591 1.670725427
Upper Burnett Water Supply Weed Control 0.0003895 0.934177379 ‐0.0484207 0.578137878 0.93418 ‐0.019736886 4096.188318 1856.205576 2.206753589
Upper Burnett Water Supply Workplace H&S 0.1609986 0.079527402 ‐2.6564016 1.429314387 0.07953 ‐0.401246315 11148.68079 4589.04603 2.42941141
Upper Burnett Water Supply Electricity 0.1436219 0.099386387 ‐0.1354719 0.077971421 0.09939 ‐0.378974801 1726.971796 250.3399136 6.898507597
Upper Burnett Water Supply Other Renewals 0 0.267137656 ‐3.0004252 2.620071024 0.26714 0 14724.21626 8412.163651 1.750348289
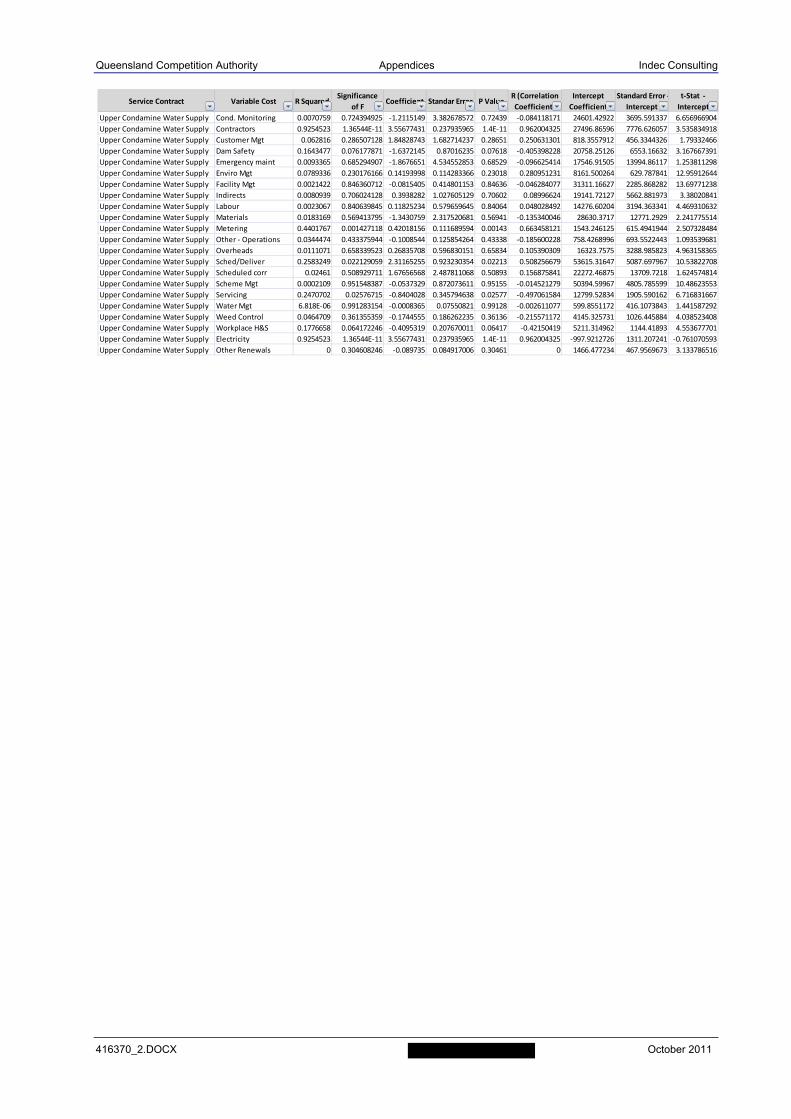
Queensland Competition Authority Appendices Indec Consulting
416370_2.DOCX October 2011
Service Contract Variable Cost R SquaredSignificance
of FCoefficient Standar Error P Value
R (Correlation
Coefficient
Intercept
Coefficient
Standard Error ‐
Intercept
t‐Stat ‐
Intercept
Upper Condamine Water Supply Cond. Monitoring 0.0070759 0.724394925 ‐1.2115149 3.382678572 0.72439 ‐0.084118171 24601.42922 3695.591337 6.656966904
Upper Condamine Water Supply Contractors 0.9254523 1.36544E‐11 3.55677431 0.237935965 1.4E‐11 0.962004325 27496.86596 7776.626057 3.535834918
Upper Condamine Water Supply Customer Mgt 0.062816 0.286507128 1.84828743 1.682714237 0.28651 0.250631301 818.3557912 456.3344326 1.79332466
Upper Condamine Water Supply Dam Safety 0.1643477 0.076177871 ‐1.6372145 0.87016235 0.07618 ‐0.405398228 20758.25126 6553.16632 3.167667391
Upper Condamine Water Supply Emergency maint 0.0093365 0.685294907 ‐1.8676651 4.534552853 0.68529 ‐0.096625414 17546.91505 13994.86117 1.253811298
Upper Condamine Water Supply Enviro Mgt 0.0789336 0.230176166 0.14193998 0.114283366 0.23018 0.280951231 8161.500264 629.787841 12.95912644
Upper Condamine Water Supply Facility Mgt 0.0021422 0.846360712 ‐0.0815405 0.414801153 0.84636 ‐0.046284077 31311.16627 2285.868282 13.69771238
Upper Condamine Water Supply Indirects 0.0080939 0.706024128 0.3938282 1.027605129 0.70602 0.08996624 19141.72127 5662.881973 3.38020841
Upper Condamine Water Supply Labour 0.0023067 0.840639845 0.11825234 0.579659645 0.84064 0.048028492 14276.60204 3194.363341 4.469310632
Upper Condamine Water Supply Materials 0.0183169 0.569413795 ‐1.3430759 2.317520681 0.56941 ‐0.135340046 28630.3717 12771.2929 2.241775514
Upper Condamine Water Supply Metering 0.4401767 0.001427118 0.42018156 0.111689594 0.00143 0.663458121 1543.246125 615.4941944 2.507328484
Upper Condamine Water Supply Other ‐ Operations 0.0344474 0.433375944 ‐0.1008544 0.125854264 0.43338 ‐0.185600228 758.4268996 693.5522443 1.093539681
Upper Condamine Water Supply Overheads 0.0111071 0.658339523 0.26835708 0.596830151 0.65834 0.105390309 16323.7575 3288.985823 4.963158365
Upper Condamine Water Supply Sched/Deliver 0.2583249 0.022129059 2.31165255 0.923230354 0.02213 0.508256679 53615.31647 5087.697967 10.53822708
Upper Condamine Water Supply Scheduled corr 0.02461 0.508929711 1.67656568 2.487811068 0.50893 0.156875841 22272.46875 13709.7218 1.624574814
Upper Condamine Water Supply Scheme Mgt 0.0002109 0.951548387 ‐0.0537329 0.872073611 0.95155 ‐0.014521279 50394.59967 4805.785599 10.48623553
Upper Condamine Water Supply Servicing 0.2470702 0.02576715 ‐0.8404028 0.345794638 0.02577 ‐0.497061584 12799.52834 1905.590162 6.716831667
Upper Condamine Water Supply Water Mgt 6.818E‐06 0.991283154 ‐0.0008365 0.07550821 0.99128 ‐0.002611077 599.8551172 416.1073843 1.441587292
Upper Condamine Water Supply Weed Control 0.0464709 0.361355359 ‐0.1744555 0.186262235 0.36136 ‐0.215571172 4145.325731 1026.445884 4.038523408
Upper Condamine Water Supply Workplace H&S 0.1776658 0.064172246 ‐0.4095319 0.207670011 0.06417 ‐0.42150419 5211.314962 1144.41893 4.553677701
Upper Condamine Water Supply Electricity 0.9254523 1.36544E‐11 3.55677431 0.237935965 1.4E‐11 0.962004325 ‐997.9212726 1311.207241 ‐0.761070593
Upper Condamine Water Supply Other Renewals 0 0.304608246 ‐0.089735 0.084917006 0.30461 0 1466.477234 467.9569673 3.133786516
Queensland Competition Authority Appendices Indec Consulting
416370_2.DOCX October 2011
APPENDIX D
Indicative Qualitative Analysis
SunWater's Cost Structures
(forecast data only)
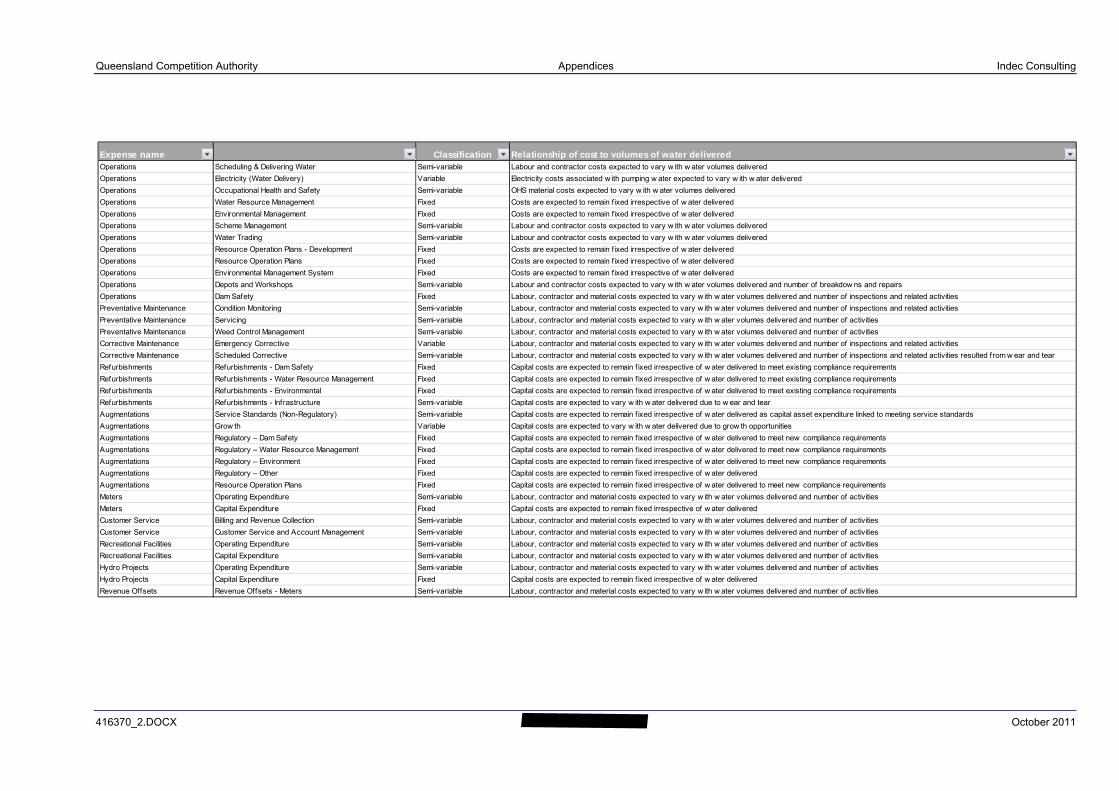
Queensland Competition Authority Appendices Indec Consulting
416370_2.DOCX October 2011
Expense name Classification Relationship of cost to volumes of water deliveredOperations Scheduling & Delivering Water Semi-variable Labour and contractor costs expected to vary w ith w ater volumes delivered
Operations Electricity (Water Delivery) Variable Electricity costs associated w ith pumping w ater expected to vary w ith w ater delivered
Operations Occupational Health and Safety Semi-variable OHS material costs expected to vary w ith w ater volumes delivered
Operations Water Resource Management Fixed Costs are expected to remain fixed irrespective of w ater delivered
Operations Environmental Management Fixed Costs are expected to remain fixed irrespective of w ater delivered
Operations Scheme Management Semi-variable Labour and contractor costs expected to vary w ith w ater volumes delivered
Operations Water Trading Semi-variable Labour and contractor costs expected to vary w ith w ater volumes delivered
Operations Resource Operation Plans - Development Fixed Costs are expected to remain fixed irrespective of w ater delivered
Operations Resource Operation Plans Fixed Costs are expected to remain fixed irrespective of w ater delivered
Operations Environmental Management System Fixed Costs are expected to remain fixed irrespective of w ater delivered
Operations Depots and Workshops Semi-variable Labour and contractor costs expected to vary w ith w ater volumes delivered and number of breakdow ns and repairs
Operations Dam Safety Fixed Labour, contractor and material costs expected to vary w ith w ater volumes delivered and number of inspections and related activities
Preventative Maintenance Condition Monitoring Semi-variable Labour, contractor and material costs expected to vary w ith w ater volumes delivered and number of inspections and related activities
Preventative Maintenance Servicing Semi-variable Labour, contractor and material costs expected to vary w ith w ater volumes delivered and number of activities
Preventative Maintenance Weed Control Management Semi-variable Labour, contractor and material costs expected to vary w ith w ater volumes delivered and number of activities
Corrective Maintenance Emergency Corrective Variable Labour, contractor and material costs expected to vary w ith w ater volumes delivered and number of inspections and related activities
Corrective Maintenance Scheduled Corrective Semi-variable Labour, contractor and material costs expected to vary w ith w ater volumes delivered and number of inspections and related activities resulted from w ear and tear
Refurbishments Refurbishments - Dam Safety Fixed Capital costs are expected to remain f ixed irrespective of w ater delivered to meet existing compliance requirements
Refurbishments Refurbishments - Water Resource Management Fixed Capital costs are expected to remain f ixed irrespective of w ater delivered to meet existing compliance requirements
Refurbishments Refurbishments - Environmental Fixed Capital costs are expected to remain f ixed irrespective of w ater delivered to meet existing compliance requirements
Refurbishments Refurbishments - Infrastructure Semi-variable Capital costs are expected to vary w ith w ater delivered due to w ear and tear
Augmentations Service Standards (Non-Regulatory) Semi-variable Capital costs are expected to remain f ixed irrespective of w ater delivered as capital asset expenditure linked to meeting service standards
Augmentations Grow th Variable Capital costs are expected to vary w ith w ater delivered due to grow th opportunities
Augmentations Regulatory – Dam Safety Fixed Capital costs are expected to remain f ixed irrespective of w ater delivered to meet new compliance requirements
Augmentations Regulatory – Water Resource Management Fixed Capital costs are expected to remain f ixed irrespective of w ater delivered to meet new compliance requirements
Augmentations Regulatory – Environment Fixed Capital costs are expected to remain f ixed irrespective of w ater delivered to meet new compliance requirements
Augmentations Regulatory – Other Fixed Capital costs are expected to remain f ixed irrespective of w ater delivered
Augmentations Resource Operation Plans Fixed Capital costs are expected to remain f ixed irrespective of w ater delivered to meet new compliance requirements
Meters Operating Expenditure Semi-variable Labour, contractor and material costs expected to vary w ith w ater volumes delivered and number of activities
Meters Capital Expenditure Fixed Capital costs are expected to remain f ixed irrespective of w ater delivered
Customer Service Billing and Revenue Collection Semi-variable Labour, contractor and material costs expected to vary w ith w ater volumes delivered and number of activities
Customer Service Customer Service and Account Management Semi-variable Labour, contractor and material costs expected to vary w ith w ater volumes delivered and number of activities
Recreational Facilities Operating Expenditure Semi-variable Labour, contractor and material costs expected to vary w ith w ater volumes delivered and number of activities
Recreational Facilities Capital Expenditure Semi-variable Labour, contractor and material costs expected to vary w ith w ater volumes delivered and number of activities
Hydro Projects Operating Expenditure Semi-variable Labour, contractor and material costs expected to vary w ith w ater volumes delivered and number of activities
Hydro Projects Capital Expenditure Fixed Capital costs are expected to remain f ixed irrespective of w ater delivered
Revenue Offsets Revenue Offsets - Meters Semi-variable Labour, contractor and material costs expected to vary w ith w ater volumes delivered and number of activities
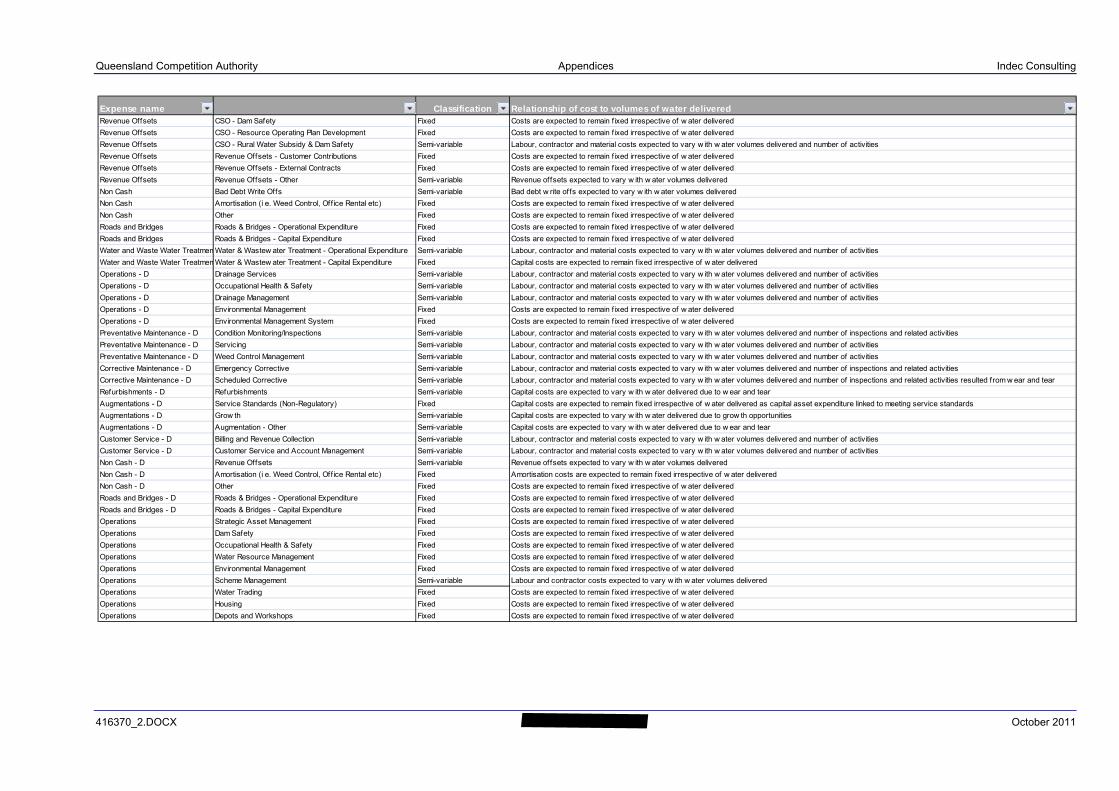
Queensland Competition Authority Appendices Indec Consulting
416370_2.DOCX October 2011
Expense name Classification Relationship of cost to volumes of water deliveredRevenue Offsets CSO - Dam Safety Fixed Costs are expected to remain fixed irrespective of w ater delivered
Revenue Offsets CSO - Resource Operating Plan Development Fixed Costs are expected to remain fixed irrespective of w ater delivered
Revenue Offsets CSO - Rural Water Subsidy & Dam Safety Semi-variable Labour, contractor and material costs expected to vary w ith w ater volumes delivered and number of activities
Revenue Offsets Revenue Offsets - Customer Contributions Fixed Costs are expected to remain fixed irrespective of w ater delivered
Revenue Offsets Revenue Offsets - External Contracts Fixed Costs are expected to remain fixed irrespective of w ater delivered
Revenue Offsets Revenue Offsets - Other Semi-variable Revenue offsets expected to vary w ith w ater volumes delivered
Non Cash Bad Debt Write Offs Semi-variable Bad debt w rite offs expected to vary w ith w ater volumes delivered
Non Cash Amortisation (i e. Weed Control, Off ice Rental etc) Fixed Costs are expected to remain fixed irrespective of w ater delivered
Non Cash Other Fixed Costs are expected to remain fixed irrespective of w ater delivered
Roads and Bridges Roads & Bridges - Operational Expenditure Fixed Costs are expected to remain fixed irrespective of w ater delivered
Roads and Bridges Roads & Bridges - Capital Expenditure Fixed Costs are expected to remain fixed irrespective of w ater delivered
Water and Waste Water Treatmen Water & Wastew ater Treatment - Operational Expenditure Semi-variable Labour, contractor and material costs expected to vary w ith w ater volumes delivered and number of activities
Water and Waste Water Treatmen Water & Wastew ater Treatment - Capital Expenditure Fixed Capital costs are expected to remain f ixed irrespective of w ater delivered
Operations - D Drainage Services Semi-variable Labour, contractor and material costs expected to vary w ith w ater volumes delivered and number of activities
Operations - D Occupational Health & Safety Semi-variable Labour, contractor and material costs expected to vary w ith w ater volumes delivered and number of activities
Operations - D Drainage Management Semi-variable Labour, contractor and material costs expected to vary w ith w ater volumes delivered and number of activities
Operations - D Environmental Management Fixed Costs are expected to remain fixed irrespective of w ater delivered
Operations - D Environmental Management System Fixed Costs are expected to remain fixed irrespective of w ater delivered
Preventative Maintenance - D Condition Monitoring/Inspections Semi-variable Labour, contractor and material costs expected to vary w ith w ater volumes delivered and number of inspections and related activities
Preventative Maintenance - D Servicing Semi-variable Labour, contractor and material costs expected to vary w ith w ater volumes delivered and number of activities
Preventative Maintenance - D Weed Control Management Semi-variable Labour, contractor and material costs expected to vary w ith w ater volumes delivered and number of activities
Corrective Maintenance - D Emergency Corrective Semi-variable Labour, contractor and material costs expected to vary w ith w ater volumes delivered and number of inspections and related activities
Corrective Maintenance - D Scheduled Corrective Semi-variable Labour, contractor and material costs expected to vary w ith w ater volumes delivered and number of inspections and related activities resulted from w ear and tear
Refurbishments - D Refurbishments Semi-variable Capital costs are expected to vary w ith w ater delivered due to w ear and tear
Augmentations - D Service Standards (Non-Regulatory) Fixed Capital costs are expected to remain f ixed irrespective of w ater delivered as capital asset expenditure linked to meeting service standards
Augmentations - D Grow th Semi-variable Capital costs are expected to vary w ith w ater delivered due to grow th opportunities
Augmentations - D Augmentation - Other Semi-variable Capital costs are expected to vary w ith w ater delivered due to w ear and tear
Customer Service - D Billing and Revenue Collection Semi-variable Labour, contractor and material costs expected to vary w ith w ater volumes delivered and number of activities
Customer Service - D Customer Service and Account Management Semi-variable Labour, contractor and material costs expected to vary w ith w ater volumes delivered and number of activities
Non Cash - D Revenue Offsets Semi-variable Revenue offsets expected to vary w ith w ater volumes delivered
Non Cash - D Amortisation (i e. Weed Control, Off ice Rental etc) Fixed Amortisation costs are expected to remain fixed irrespective of w ater delivered
Non Cash - D Other Fixed Costs are expected to remain fixed irrespective of w ater delivered
Roads and Bridges - D Roads & Bridges - Operational Expenditure Fixed Costs are expected to remain fixed irrespective of w ater delivered
Roads and Bridges - D Roads & Bridges - Capital Expenditure Fixed Costs are expected to remain fixed irrespective of w ater delivered
Operations Strategic Asset Management Fixed Costs are expected to remain fixed irrespective of w ater delivered
Operations Dam Safety Fixed Costs are expected to remain fixed irrespective of w ater delivered
Operations Occupational Health & Safety Fixed Costs are expected to remain fixed irrespective of w ater delivered
Operations Water Resource Management Fixed Costs are expected to remain fixed irrespective of w ater delivered
Operations Environmental Management Fixed Costs are expected to remain fixed irrespective of w ater delivered
Operations Scheme Management Semi-variable Labour and contractor costs expected to vary w ith w ater volumes delivered
Operations Water Trading Fixed Costs are expected to remain fixed irrespective of w ater delivered
Operations Housing Fixed Costs are expected to remain fixed irrespective of w ater delivered
Operations Depots and Workshops Fixed Costs are expected to remain fixed irrespective of w ater delivered
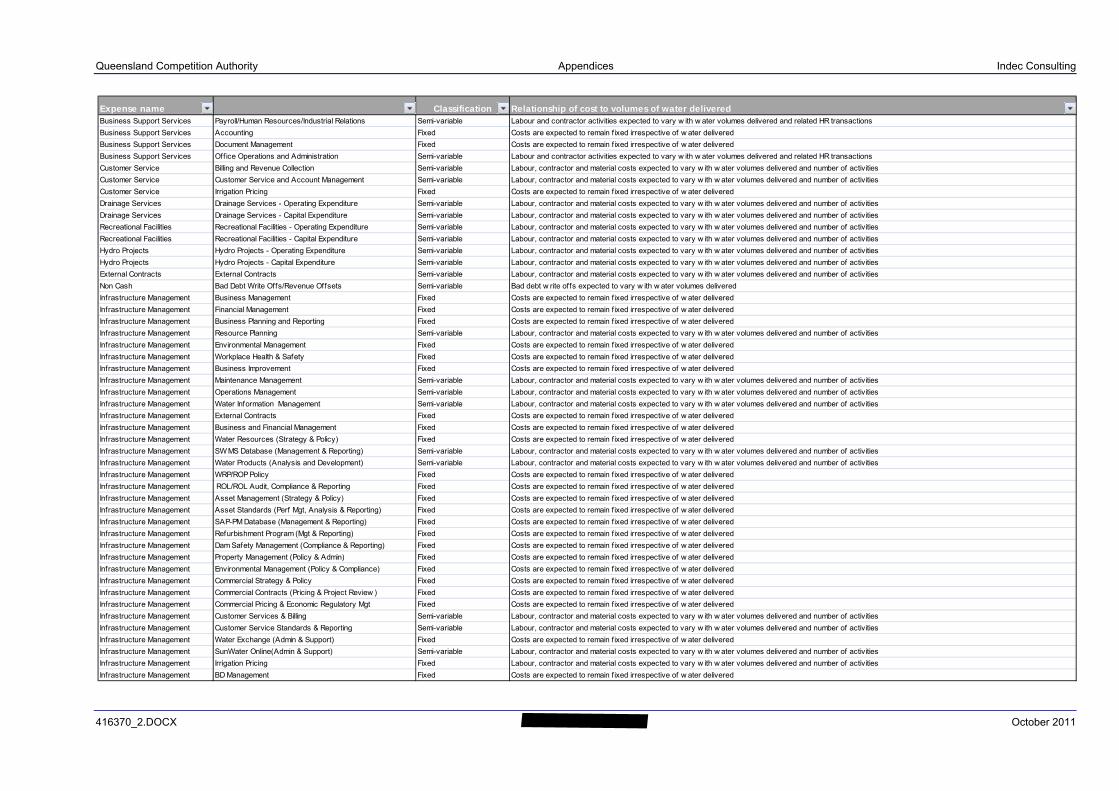
Queensland Competition Authority Appendices Indec Consulting
416370_2.DOCX October 2011
Expense name Classification Relationship of cost to volumes of water deliveredBusiness Support Services Payroll/Human Resources/Industrial Relations Semi-variable Labour and contractor activities expected to vary w ith w ater volumes delivered and related HR transactions
Business Support Services Accounting Fixed Costs are expected to remain fixed irrespective of w ater delivered
Business Support Services Document Management Fixed Costs are expected to remain fixed irrespective of w ater delivered
Business Support Services Office Operations and Administration Semi-variable Labour and contractor activities expected to vary w ith w ater volumes delivered and related HR transactions
Customer Service Billing and Revenue Collection Semi-variable Labour, contractor and material costs expected to vary w ith w ater volumes delivered and number of activities
Customer Service Customer Service and Account Management Semi-variable Labour, contractor and material costs expected to vary w ith w ater volumes delivered and number of activities
Customer Service Irrigation Pricing Fixed Costs are expected to remain fixed irrespective of w ater delivered
Drainage Services Drainage Services - Operating Expenditure Semi-variable Labour, contractor and material costs expected to vary w ith w ater volumes delivered and number of activities
Drainage Services Drainage Services - Capital Expenditure Semi-variable Labour, contractor and material costs expected to vary w ith w ater volumes delivered and number of activities
Recreational Facilities Recreational Facilities - Operating Expenditure Semi-variable Labour, contractor and material costs expected to vary w ith w ater volumes delivered and number of activities
Recreational Facilities Recreational Facilities - Capital Expenditure Semi-variable Labour, contractor and material costs expected to vary w ith w ater volumes delivered and number of activities
Hydro Projects Hydro Projects - Operating Expenditure Semi-variable Labour, contractor and material costs expected to vary w ith w ater volumes delivered and number of activities
Hydro Projects Hydro Projects - Capital Expenditure Semi-variable Labour, contractor and material costs expected to vary w ith w ater volumes delivered and number of activities
External Contracts External Contracts Semi-variable Labour, contractor and material costs expected to vary w ith w ater volumes delivered and number of activities
Non Cash Bad Debt Write Offs/Revenue Offsets Semi-variable Bad debt w rite offs expected to vary w ith w ater volumes delivered
Infrastructure Management Business Management Fixed Costs are expected to remain fixed irrespective of w ater delivered
Infrastructure Management Financial Management Fixed Costs are expected to remain fixed irrespective of w ater delivered
Infrastructure Management Business Planning and Reporting Fixed Costs are expected to remain fixed irrespective of w ater delivered
Infrastructure Management Resource Planning Semi-variable Labour, contractor and material costs expected to vary w ith w ater volumes delivered and number of activities
Infrastructure Management Environmental Management Fixed Costs are expected to remain fixed irrespective of w ater delivered
Infrastructure Management Workplace Health & Safety Fixed Costs are expected to remain fixed irrespective of w ater delivered
Infrastructure Management Business Improvement Fixed Costs are expected to remain fixed irrespective of w ater delivered
Infrastructure Management Maintenance Management Semi-variable Labour, contractor and material costs expected to vary w ith w ater volumes delivered and number of activities
Infrastructure Management Operations Management Semi-variable Labour, contractor and material costs expected to vary w ith w ater volumes delivered and number of activities
Infrastructure Management Water Information Management Semi-variable Labour, contractor and material costs expected to vary w ith w ater volumes delivered and number of activities
Infrastructure Management External Contracts Fixed Costs are expected to remain fixed irrespective of w ater delivered
Infrastructure Management Business and Financial Management Fixed Costs are expected to remain fixed irrespective of w ater delivered
Infrastructure Management Water Resources (Strategy & Policy) Fixed Costs are expected to remain fixed irrespective of w ater delivered
Infrastructure Management SW MS Database (Management & Reporting) Semi-variable Labour, contractor and material costs expected to vary w ith w ater volumes delivered and number of activities
Infrastructure Management Water Products (Analysis and Development) Semi-variable Labour, contractor and material costs expected to vary w ith w ater volumes delivered and number of activities
Infrastructure Management WRP/ROP Policy Fixed Costs are expected to remain fixed irrespective of w ater delivered
Infrastructure Management ROL/ROL Audit, Compliance & Reporting Fixed Costs are expected to remain fixed irrespective of w ater delivered
Infrastructure Management Asset Management (Strategy & Policy) Fixed Costs are expected to remain fixed irrespective of w ater delivered
Infrastructure Management Asset Standards (Perf Mgt, Analysis & Reporting) Fixed Costs are expected to remain fixed irrespective of w ater delivered
Infrastructure Management SAP-PM Database (Management & Reporting) Fixed Costs are expected to remain fixed irrespective of w ater delivered
Infrastructure Management Refurbishment Program (Mgt & Reporting) Fixed Costs are expected to remain fixed irrespective of w ater delivered
Infrastructure Management Dam Safety Management (Compliance & Reporting) Fixed Costs are expected to remain fixed irrespective of w ater delivered
Infrastructure Management Property Management (Policy & Admin) Fixed Costs are expected to remain fixed irrespective of w ater delivered
Infrastructure Management Environmental Management (Policy & Compliance) Fixed Costs are expected to remain fixed irrespective of w ater delivered
Infrastructure Management Commercial Strategy & Policy Fixed Costs are expected to remain fixed irrespective of w ater delivered
Infrastructure Management Commercial Contracts (Pricing & Project Review ) Fixed Costs are expected to remain fixed irrespective of w ater delivered
Infrastructure Management Commercial Pricing & Economic Regulatory Mgt Fixed Costs are expected to remain fixed irrespective of w ater delivered
Infrastructure Management Customer Services & Billing Semi-variable Labour, contractor and material costs expected to vary w ith w ater volumes delivered and number of activities
Infrastructure Management Customer Service Standards & Reporting Semi-variable Labour, contractor and material costs expected to vary w ith w ater volumes delivered and number of activities
Infrastructure Management Water Exchange (Admin & Support) Fixed Costs are expected to remain fixed irrespective of w ater delivered
Infrastructure Management SunWater Online(Admin & Support) Semi-variable Labour, contractor and material costs expected to vary w ith w ater volumes delivered and number of activities
Infrastructure Management Irrigation Pricing Fixed Labour, contractor and material costs expected to vary w ith w ater volumes delivered and number of activities
Infrastructure Management BD Management Fixed Costs are expected to remain fixed irrespective of w ater delivered
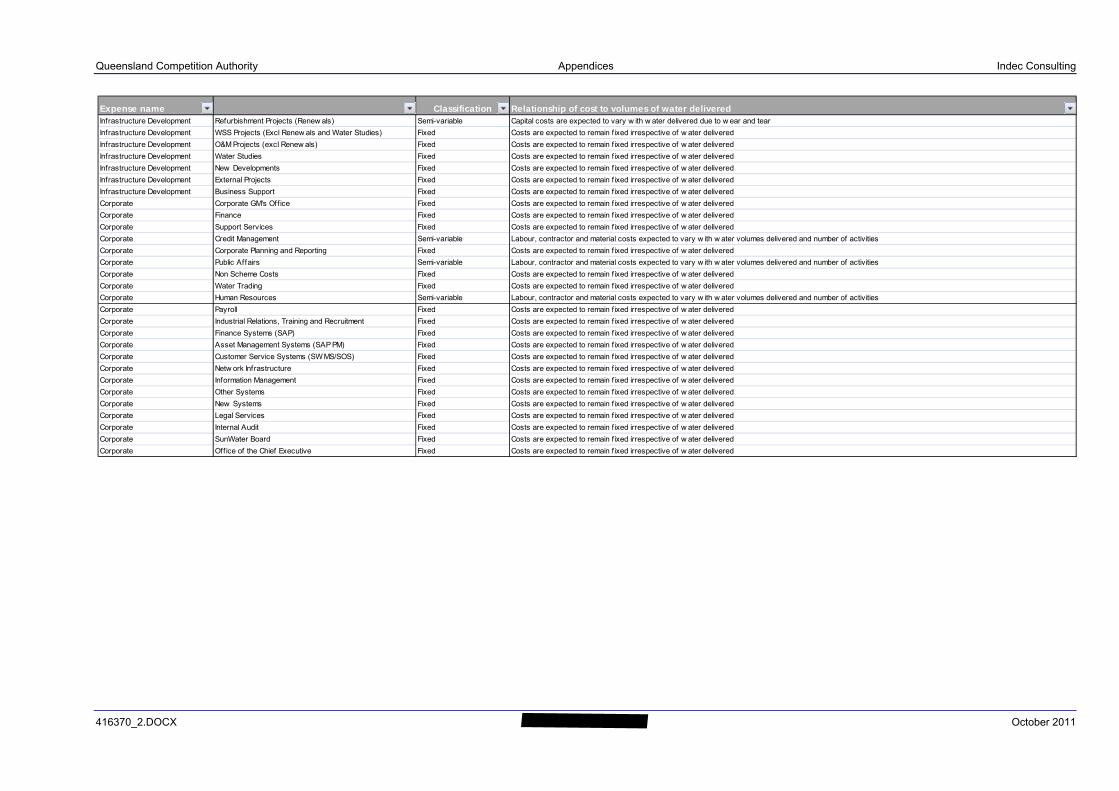
Queensland Competition Authority Appendices Indec Consulting
416370_2.DOCX October 2011
Expense name Classification Relationship of cost to volumes of water deliveredInfrastructure Development Refurbishment Projects (Renew als) Semi-variable Capital costs are expected to vary w ith w ater delivered due to w ear and tear
Infrastructure Development WSS Projects (Excl Renew als and Water Studies) Fixed Costs are expected to remain fixed irrespective of w ater delivered
Infrastructure Development O&M Projects (excl Renew als) Fixed Costs are expected to remain fixed irrespective of w ater delivered
Infrastructure Development Water Studies Fixed Costs are expected to remain fixed irrespective of w ater delivered
Infrastructure Development New Developments Fixed Costs are expected to remain fixed irrespective of w ater delivered
Infrastructure Development External Projects Fixed Costs are expected to remain fixed irrespective of w ater delivered
Infrastructure Development Business Support Fixed Costs are expected to remain fixed irrespective of w ater delivered
Corporate Corporate GM's Office Fixed Costs are expected to remain fixed irrespective of w ater delivered
Corporate Finance Fixed Costs are expected to remain fixed irrespective of w ater delivered
Corporate Support Services Fixed Costs are expected to remain fixed irrespective of w ater delivered
Corporate Credit Management Semi-variable Labour, contractor and material costs expected to vary w ith w ater volumes delivered and number of activities
Corporate Corporate Planning and Reporting Fixed Costs are expected to remain fixed irrespective of w ater delivered
Corporate Public Affairs Semi-variable Labour, contractor and material costs expected to vary w ith w ater volumes delivered and number of activities
Corporate Non Scheme Costs Fixed Costs are expected to remain fixed irrespective of w ater delivered
Corporate Water Trading Fixed Costs are expected to remain fixed irrespective of w ater delivered
Corporate Human Resources Semi-variable Labour, contractor and material costs expected to vary w ith w ater volumes delivered and number of activities
Corporate Payroll Fixed Costs are expected to remain fixed irrespective of w ater delivered
Corporate Industrial Relations, Training and Recruitment Fixed Costs are expected to remain fixed irrespective of w ater delivered
Corporate Finance Systems (SAP) Fixed Costs are expected to remain fixed irrespective of w ater delivered
Corporate Asset Management Systems (SAP PM) Fixed Costs are expected to remain fixed irrespective of w ater delivered
Corporate Customer Service Systems (SW MS/SOS) Fixed Costs are expected to remain fixed irrespective of w ater delivered
Corporate Netw ork Infrastructure Fixed Costs are expected to remain fixed irrespective of w ater delivered
Corporate Information Management Fixed Costs are expected to remain fixed irrespective of w ater delivered
Corporate Other Systems Fixed Costs are expected to remain fixed irrespective of w ater delivered
Corporate New Systems Fixed Costs are expected to remain fixed irrespective of w ater delivered
Corporate Legal Services Fixed Costs are expected to remain fixed irrespective of w ater delivered
Corporate Internal Audit Fixed Costs are expected to remain fixed irrespective of w ater delivered
Corporate SunWater Board Fixed Costs are expected to remain fixed irrespective of w ater delivered
Corporate Off ice of the Chief Executive Fixed Costs are expected to remain fixed irrespective of w ater delivered
Queensland Competition Authority Appendices Indec Consulting
416370_2.DOCX October 2011
APPENDIX E
Qualitative Analysis
SunWater's Cost Structures
(historical actual data only)
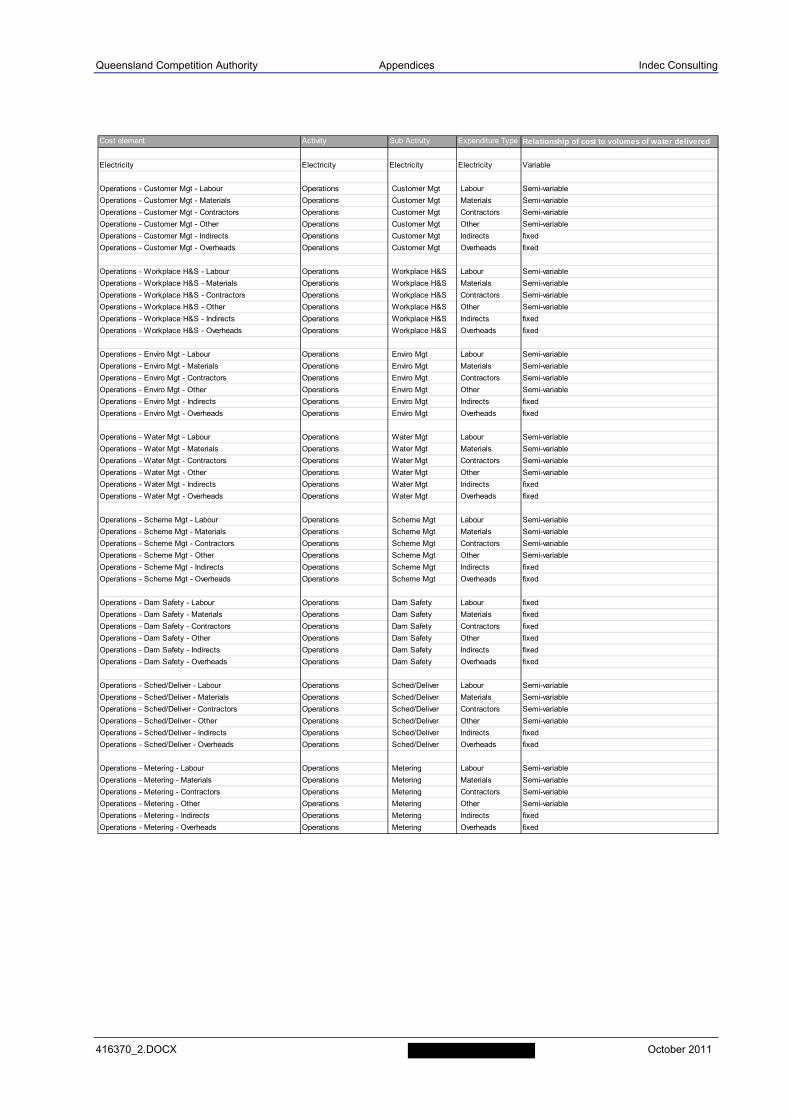
Queensland Competition Authority Appendices Indec Consulting
416370_2.DOCX October 2011
Cost element Activity Sub Activity Expenditure Type Relationship of cost to volumes of water delivered
Electricity Electricity Electricity Electricity Variable
Operations - Customer Mgt - Labour Operations Customer Mgt Labour Semi-variable
Operations - Customer Mgt - Materials Operations Customer Mgt Materials Semi-variable
Operations - Customer Mgt - Contractors Operations Customer Mgt Contractors Semi-variable
Operations - Customer Mgt - Other Operations Customer Mgt Other Semi-variable
Operations - Customer Mgt - Indirects Operations Customer Mgt Indirects fixed
Operations - Customer Mgt - Overheads Operations Customer Mgt Overheads fixed
Operations - Workplace H&S - Labour Operations Workplace H&S Labour Semi-variable
Operations - Workplace H&S - Materials Operations Workplace H&S Materials Semi-variable
Operations - Workplace H&S - Contractors Operations Workplace H&S Contractors Semi-variable
Operations - Workplace H&S - Other Operations Workplace H&S Other Semi-variable
Operations - Workplace H&S - Indirects Operations Workplace H&S Indirects fixed
Operations - Workplace H&S - Overheads Operations Workplace H&S Overheads fixed
Operations - Enviro Mgt - Labour Operations Enviro Mgt Labour Semi-variable
Operations - Enviro Mgt - Materials Operations Enviro Mgt Materials Semi-variable
Operations - Enviro Mgt - Contractors Operations Enviro Mgt Contractors Semi-variable
Operations - Enviro Mgt - Other Operations Enviro Mgt Other Semi-variable
Operations - Enviro Mgt - Indirects Operations Enviro Mgt Indirects fixed
Operations - Enviro Mgt - Overheads Operations Enviro Mgt Overheads fixed
Operations - Water Mgt - Labour Operations Water Mgt Labour Semi-variable
Operations - Water Mgt - Materials Operations Water Mgt Materials Semi-variable
Operations - Water Mgt - Contractors Operations Water Mgt Contractors Semi-variable
Operations - Water Mgt - Other Operations Water Mgt Other Semi-variable
Operations - Water Mgt - Indirects Operations Water Mgt Indirects fixed
Operations - Water Mgt - Overheads Operations Water Mgt Overheads fixed
Operations - Scheme Mgt - Labour Operations Scheme Mgt Labour Semi-variable
Operations - Scheme Mgt - Materials Operations Scheme Mgt Materials Semi-variable
Operations - Scheme Mgt - Contractors Operations Scheme Mgt Contractors Semi-variable
Operations - Scheme Mgt - Other Operations Scheme Mgt Other Semi-variable
Operations - Scheme Mgt - Indirects Operations Scheme Mgt Indirects fixed
Operations - Scheme Mgt - Overheads Operations Scheme Mgt Overheads fixed
Operations - Dam Safety - Labour Operations Dam Safety Labour fixed
Operations - Dam Safety - Materials Operations Dam Safety Materials fixed
Operations - Dam Safety - Contractors Operations Dam Safety Contractors fixed
Operations - Dam Safety - Other Operations Dam Safety Other fixed
Operations - Dam Safety - Indirects Operations Dam Safety Indirects fixed
Operations - Dam Safety - Overheads Operations Dam Safety Overheads fixed
Operations - Sched/Deliver - Labour Operations Sched/Deliver Labour Semi-variable
Operations - Sched/Deliver - Materials Operations Sched/Deliver Materials Semi-variable
Operations - Sched/Deliver - Contractors Operations Sched/Deliver Contractors Semi-variable
Operations - Sched/Deliver - Other Operations Sched/Deliver Other Semi-variable
Operations - Sched/Deliver - Indirects Operations Sched/Deliver Indirects fixed
Operations - Sched/Deliver - Overheads Operations Sched/Deliver Overheads fixed
Operations - Metering - Labour Operations Metering Labour Semi-variable
Operations - Metering - Materials Operations Metering Materials Semi-variable
Operations - Metering - Contractors Operations Metering Contractors Semi-variable
Operations - Metering - Other Operations Metering Other Semi-variable
Operations - Metering - Indirects Operations Metering Indirects fixed
Operations - Metering - Overheads Operations Metering Overheads fixed
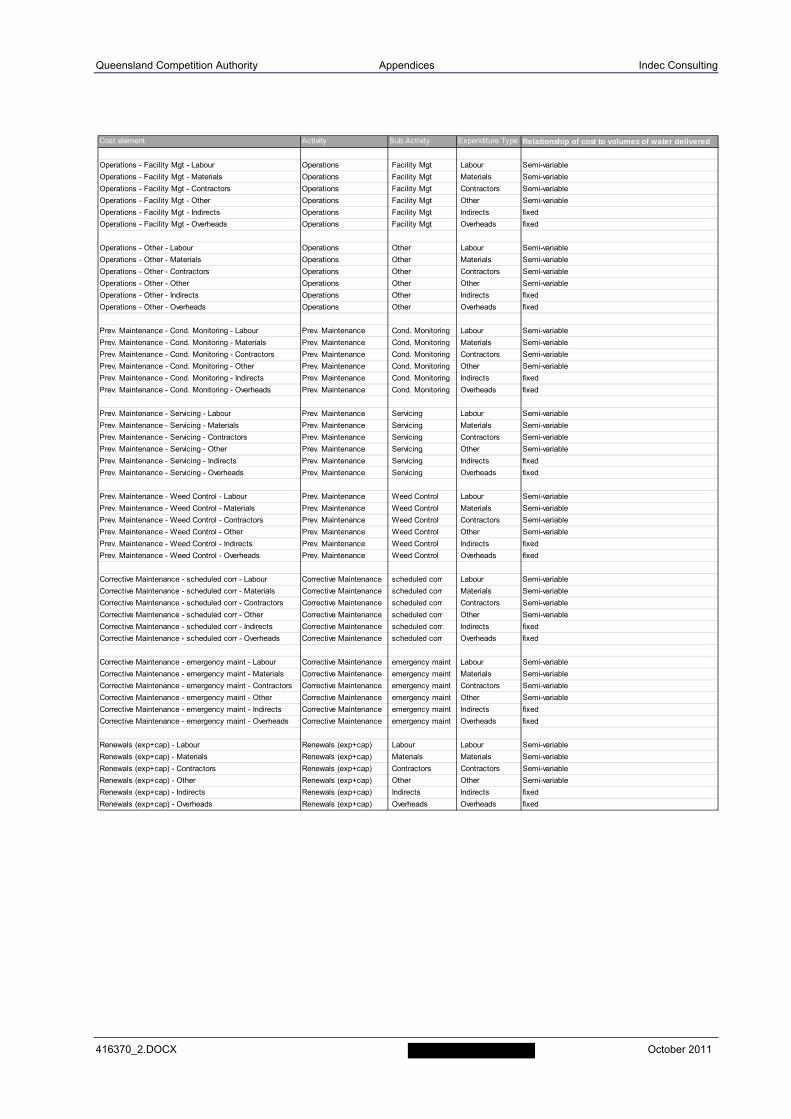
Queensland Competition Authority Appendices Indec Consulting
416370_2.DOCX October 2011
Cost element Activity Sub Activity Expenditure Type Relationship of cost to volumes of water delivered
Operations - Facility Mgt - Labour Operations Facility Mgt Labour Semi-variable
Operations - Facility Mgt - Materials Operations Facility Mgt Materials Semi-variable
Operations - Facility Mgt - Contractors Operations Facility Mgt Contractors Semi-variable
Operations - Facility Mgt - Other Operations Facility Mgt Other Semi-variable
Operations - Facility Mgt - Indirects Operations Facility Mgt Indirects fixed
Operations - Facility Mgt - Overheads Operations Facility Mgt Overheads fixed
Operations - Other - Labour Operations Other Labour Semi-variable
Operations - Other - Materials Operations Other Materials Semi-variable
Operations - Other - Contractors Operations Other Contractors Semi-variable
Operations - Other - Other Operations Other Other Semi-variable
Operations - Other - Indirects Operations Other Indirects fixed
Operations - Other - Overheads Operations Other Overheads fixed
Prev. Maintenance - Cond. Monitoring - Labour Prev. Maintenance Cond. Monitoring Labour Semi-variable
Prev. Maintenance - Cond. Monitoring - Materials Prev. Maintenance Cond. Monitoring Materials Semi-variable
Prev. Maintenance - Cond. Monitoring - Contractors Prev. Maintenance Cond. Monitoring Contractors Semi-variable
Prev. Maintenance - Cond. Monitoring - Other Prev. Maintenance Cond. Monitoring Other Semi-variable
Prev. Maintenance - Cond. Monitoring - Indirects Prev. Maintenance Cond. Monitoring Indirects fixed
Prev. Maintenance - Cond. Monitoring - Overheads Prev. Maintenance Cond. Monitoring Overheads fixed
Prev. Maintenance - Servicing - Labour Prev. Maintenance Servicing Labour Semi-variable
Prev. Maintenance - Servicing - Materials Prev. Maintenance Servicing Materials Semi-variable
Prev. Maintenance - Servicing - Contractors Prev. Maintenance Servicing Contractors Semi-variable
Prev. Maintenance - Servicing - Other Prev. Maintenance Servicing Other Semi-variable
Prev. Maintenance - Servicing - Indirects Prev. Maintenance Servicing Indirects fixed
Prev. Maintenance - Servicing - Overheads Prev. Maintenance Servicing Overheads fixed
Prev. Maintenance - Weed Control - Labour Prev. Maintenance Weed Control Labour Semi-variable
Prev. Maintenance - Weed Control - Materials Prev. Maintenance Weed Control Materials Semi-variable
Prev. Maintenance - Weed Control - Contractors Prev. Maintenance Weed Control Contractors Semi-variable
Prev. Maintenance - Weed Control - Other Prev. Maintenance Weed Control Other Semi-variable
Prev. Maintenance - Weed Control - Indirects Prev. Maintenance Weed Control Indirects fixed
Prev. Maintenance - Weed Control - Overheads Prev. Maintenance Weed Control Overheads fixed
Corrective Maintenance - scheduled corr - Labour Corrective Maintenance scheduled corr Labour Semi-variable
Corrective Maintenance - scheduled corr - Materials Corrective Maintenance scheduled corr Materials Semi-variable
Corrective Maintenance - scheduled corr - Contractors Corrective Maintenance scheduled corr Contractors Semi-variable
Corrective Maintenance - scheduled corr - Other Corrective Maintenance scheduled corr Other Semi-variable
Corrective Maintenance - scheduled corr - Indirects Corrective Maintenance scheduled corr Indirects fixed
Corrective Maintenance - scheduled corr - Overheads Corrective Maintenance scheduled corr Overheads fixed
Corrective Maintenance - emergency maint - Labour Corrective Maintenance emergency maint Labour Semi-variable
Corrective Maintenance - emergency maint - Materials Corrective Maintenance emergency maint Materials Semi-variable
Corrective Maintenance - emergency maint - Contractors Corrective Maintenance emergency maint Contractors Semi-variable
Corrective Maintenance - emergency maint - Other Corrective Maintenance emergency maint Other Semi-variable
Corrective Maintenance - emergency maint - Indirects Corrective Maintenance emergency maint Indirects fixed
Corrective Maintenance - emergency maint - Overheads Corrective Maintenance emergency maint Overheads fixed
Renewals (exp+cap) - Labour Renewals (exp+cap) Labour Labour Semi-variable
Renewals (exp+cap) - Materials Renewals (exp+cap) Materials Materials Semi-variable
Renewals (exp+cap) - Contractors Renewals (exp+cap) Contractors Contractors Semi-variable
Renewals (exp+cap) - Other Renewals (exp+cap) Other Other Semi-variable
Renewals (exp+cap) - Indirects Renewals (exp+cap) Indirects Indirects fixed
Renewals (exp+cap) - Overheads Renewals (exp+cap) Overheads Overheads fixed
Queensland Competition Authority Appendices Indec Consulting
416370_2.DOCX October 2011
APPENDIX F
Historical Cost Analysis
Regions and Depots
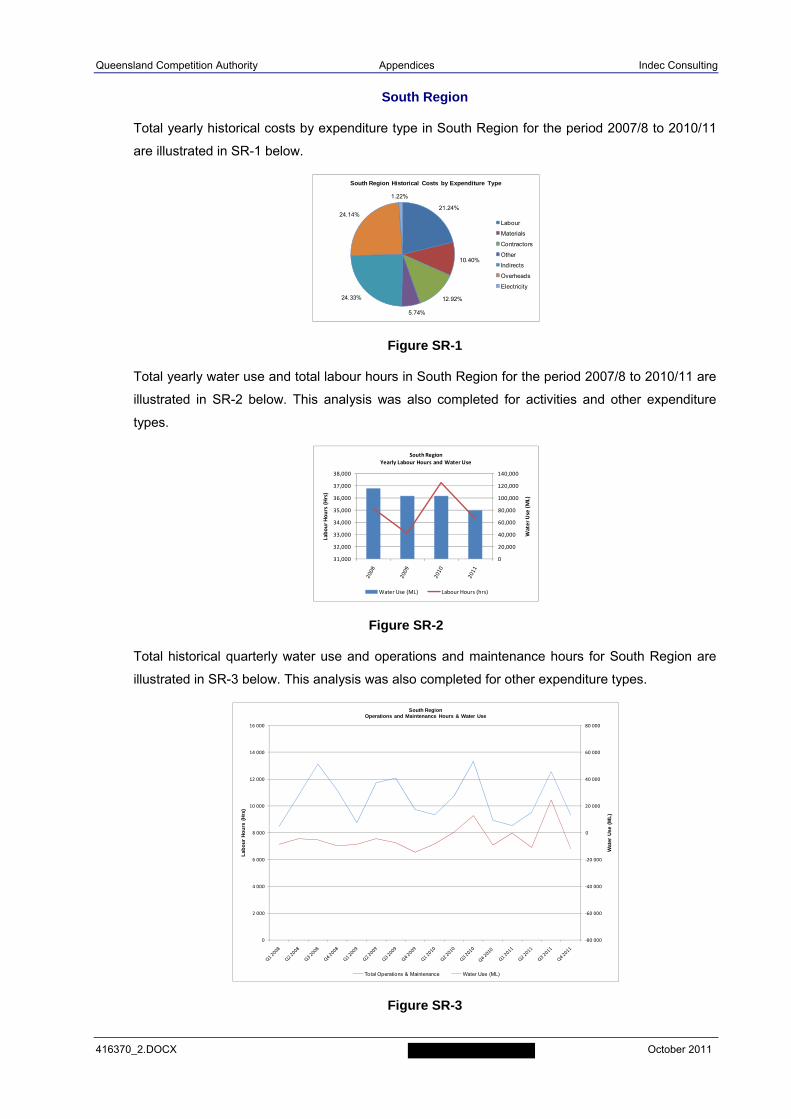
Queensland Competition Authority Appendices Indec Consulting
416370_2.DOCX October 2011
South Region
Total yearly historical costs by expenditure type in South Region for the period 2007/8 to 2010/11
are illustrated in SR-1 below.
Figure SR-1
Total yearly water use and total labour hours in South Region for the period 2007/8 to 2010/11 are
illustrated in SR-2 below. This analysis was also completed for activities and other expenditure
types.
Figure SR-2
Total historical quarterly water use and operations and maintenance hours for South Region are
illustrated in SR-3 below. This analysis was also completed for other expenditure types.
Figure SR-3
21.24%
10.40%
12.92%
5.74%
24.33%
24.14%
1.22%
South Region Historical Costs by Expenditure Type
Labour
Materials
Contractors
Other
Indirects
Overheads
Electricity
0
20,000
40,000
60,000
80,000
100,000
120,000
140,000
31,000
32,000
33,000
34,000
35,000
36,000
37,000
38,000
Water Use (ML)
Labour Hours (Hrs)
South RegionYearly Labour Hours and Water Use
Water Use (ML) Labour Hours (hrs)
‐80 000
‐60 000
‐40 000
‐20 000
0
20 000
40 000
60 000
80 000
0
2 000
4 000
6 000
8 000
10 000
12 000
14 000
16 000
Wat
er U
se (
ML
)
Lab
ou
r H
ou
rs (
Hrs
)
South RegionOperations and Maintenance Hours & Water Use
Total Operations & Maintenance Water Use (ML)
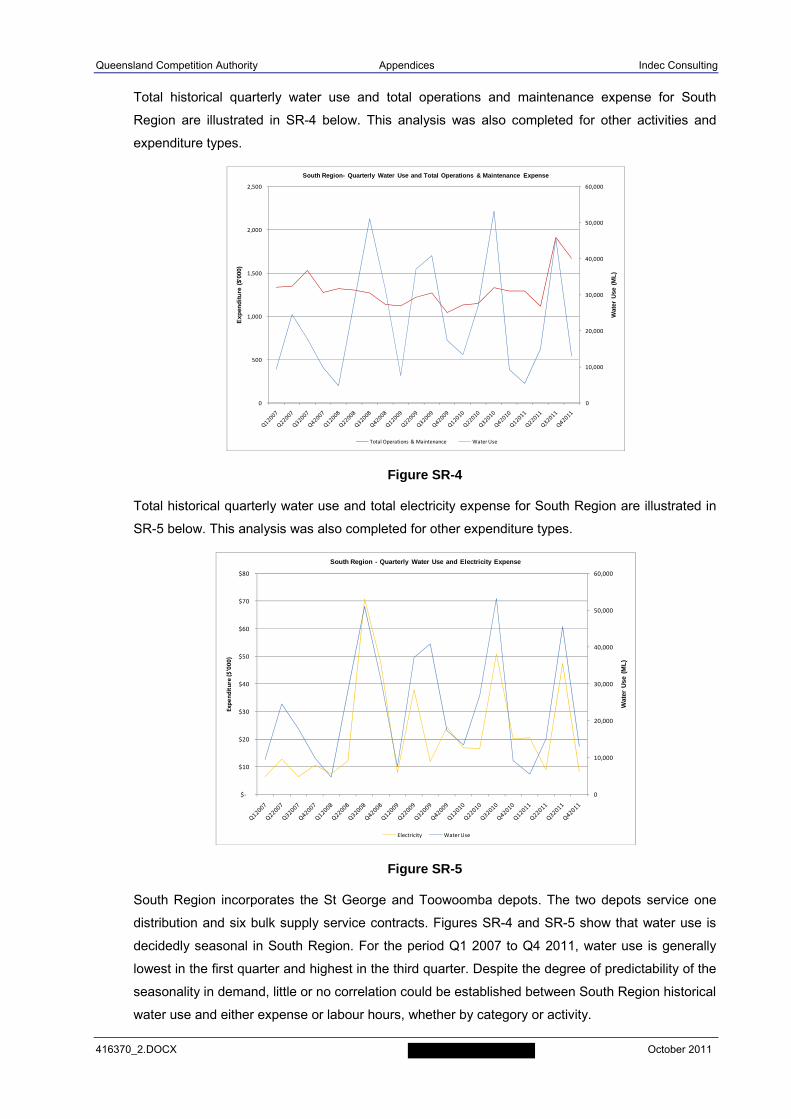
Queensland Competition Authority Appendices Indec Consulting
416370_2.DOCX October 2011
Total historical quarterly water use and total operations and maintenance expense for South
Region are illustrated in SR-4 below. This analysis was also completed for other activities and
expenditure types.
Figure SR-4
Total historical quarterly water use and total electricity expense for South Region are illustrated in
SR-5 below. This analysis was also completed for other expenditure types.
Figure SR-5
South Region incorporates the St George and Toowoomba depots. The two depots service one
distribution and six bulk supply service contracts. Figures SR-4 and SR-5 show that water use is
decidedly seasonal in South Region. For the period Q1 2007 to Q4 2011, water use is generally
lowest in the first quarter and highest in the third quarter. Despite the degree of predictability of the
seasonality in demand, little or no correlation could be established between South Region historical
water use and either expense or labour hours, whether by category or activity.
0
10,000
20,000
30,000
40,000
50,000
60,000
0
500
1,000
1,500
2,000
2,500
Wat
er U
se (
ML
)
Exp
end
itu
re (
$'00
0)
South Region- Quarterly Water Use and Total Operations & Maintenance Expense
Total Operations & Maintenance Water Use
0
10,000
20,000
30,000
40,000
50,000
60,000
$‐
$10
$20
$30
$40
$50
$60
$70
$80
Wat
er U
se (
ML
)
Expenditure ($'000)
South Region - Quarterly Water Use and Electricity Expense
Electricity Water Use
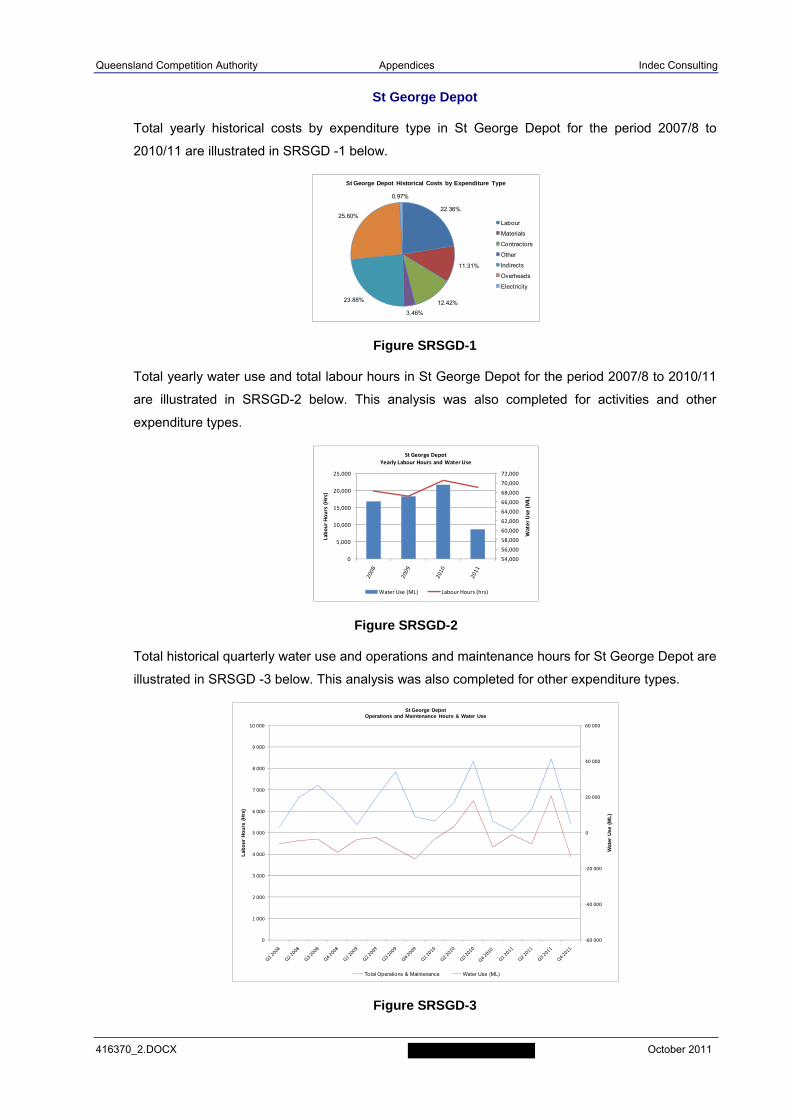
Queensland Competition Authority Appendices Indec Consulting
416370_2.DOCX October 2011
St George Depot
Total yearly historical costs by expenditure type in St George Depot for the period 2007/8 to
2010/11 are illustrated in SRSGD -1 below.
Figure SRSGD-1
Total yearly water use and total labour hours in St George Depot for the period 2007/8 to 2010/11
are illustrated in SRSGD-2 below. This analysis was also completed for activities and other
expenditure types.
Figure SRSGD-2
Total historical quarterly water use and operations and maintenance hours for St George Depot are
illustrated in SRSGD -3 below. This analysis was also completed for other expenditure types.
Figure SRSGD-3
22.36%
11.31%
12.42%
3.46%
23.88%
25.60%
0.97%
St George Depot Historical Costs by Expenditure Type
Labour
Materials
Contractors
Other
Indirects
Overheads
Electricity
54,000
56,000
58,000
60,000
62,000
64,000
66,000
68,000
70,000
72,000
0
5,000
10,000
15,000
20,000
25,000
Water Use (ML)
Labour Hours (Hrs)
St George DepotYearly Labour Hours and Water Use
Water Use (ML) Labour Hours (hrs)
‐60 000
‐40 000
‐20 000
0
20 000
40 000
60 000
0
1 000
2 000
3 000
4 000
5 000
6 000
7 000
8 000
9 000
10 000
Wat
er U
se (
ML
)
Lab
ou
r H
ou
rs (
Hrs
)
St George DepotOperations and Maintenance Hours & Water Use
Total Operations & Maintenance Water Use (ML)
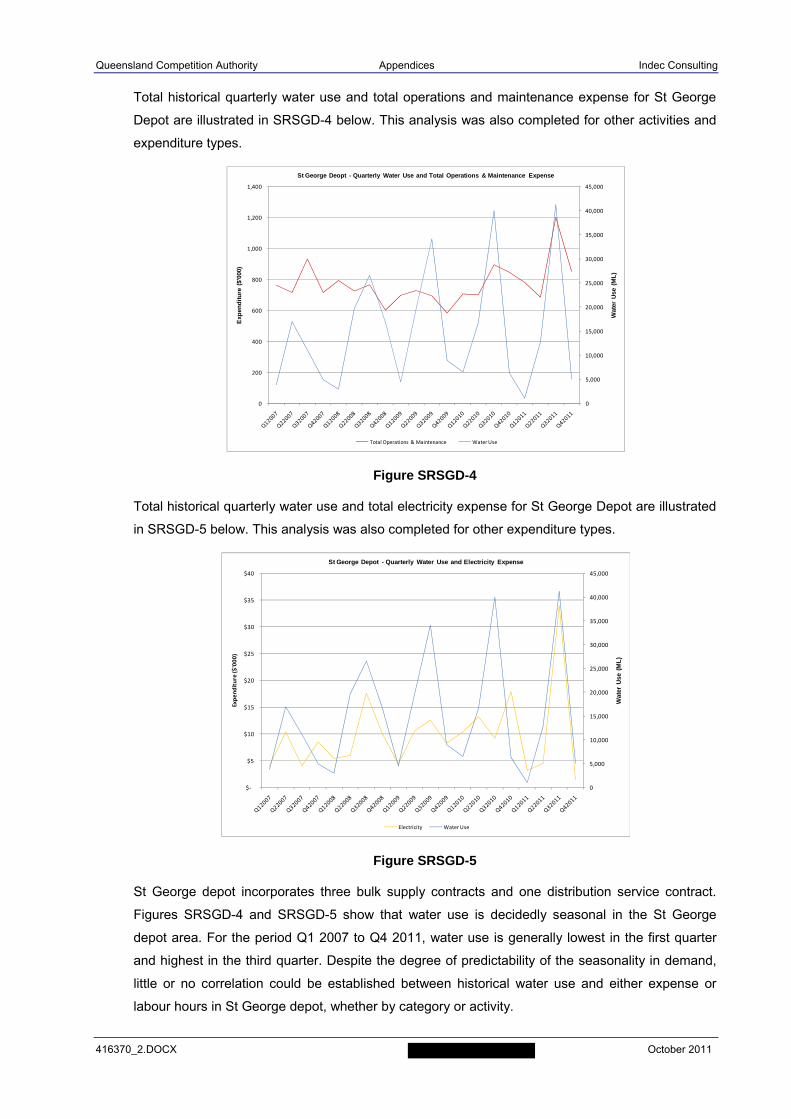
Queensland Competition Authority Appendices Indec Consulting
416370_2.DOCX October 2011
Total historical quarterly water use and total operations and maintenance expense for St George
Depot are illustrated in SRSGD-4 below. This analysis was also completed for other activities and
expenditure types.
Figure SRSGD-4
Total historical quarterly water use and total electricity expense for St George Depot are illustrated
in SRSGD-5 below. This analysis was also completed for other expenditure types.
Figure SRSGD-5
St George depot incorporates three bulk supply contracts and one distribution service contract.
Figures SRSGD-4 and SRSGD-5 show that water use is decidedly seasonal in the St George
depot area. For the period Q1 2007 to Q4 2011, water use is generally lowest in the first quarter
and highest in the third quarter. Despite the degree of predictability of the seasonality in demand,
little or no correlation could be established between historical water use and either expense or
labour hours in St George depot, whether by category or activity.
0
5,000
10,000
15,000
20,000
25,000
30,000
35,000
40,000
45,000
0
200
400
600
800
1,000
1,200
1,400
Wat
er U
se (
ML
)
Exp
end
itu
re (
$'00
0)
St George Deopt - Quarterly Water Use and Total Operations & Maintenance Expense
Total Operations & Maintenance Water Use
0
5,000
10,000
15,000
20,000
25,000
30,000
35,000
40,000
45,000
$‐
$5
$10
$15
$20
$25
$30
$35
$40
Wat
er U
se (
ML
)
Expenditure ($'000)
St George Depot - Quarterly Water Use and Electricity Expense
Electricity Water Use
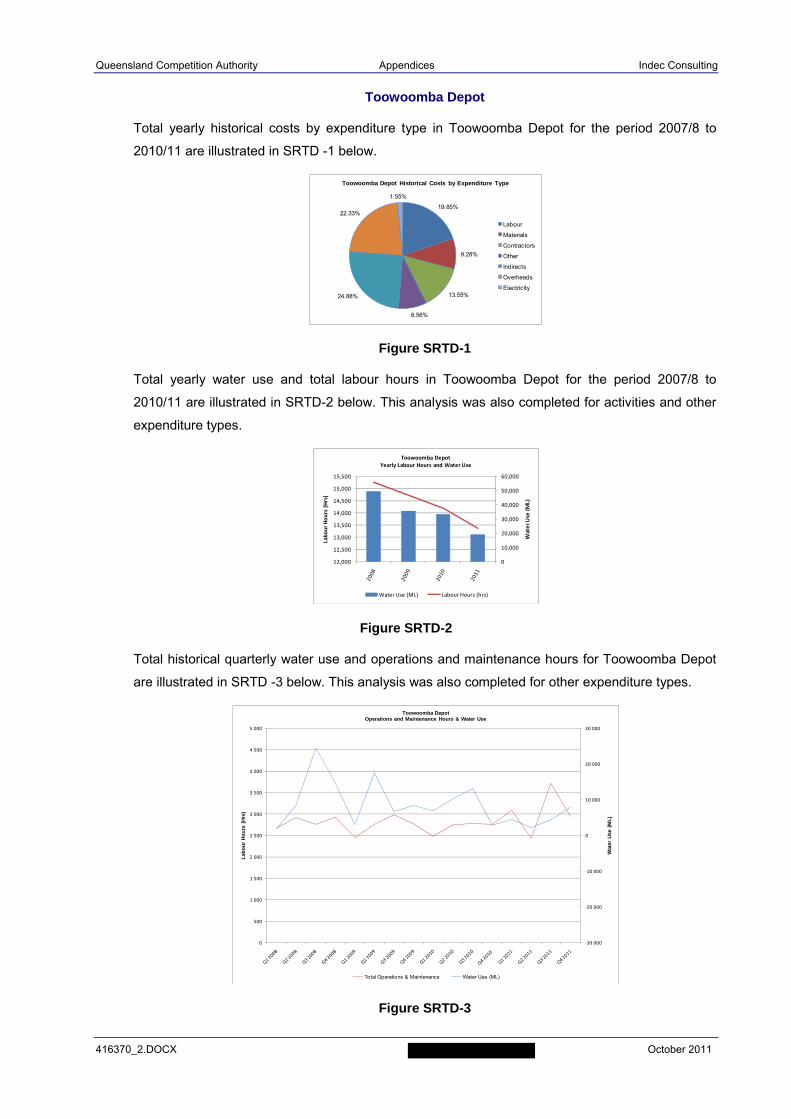
Queensland Competition Authority Appendices Indec Consulting
416370_2.DOCX October 2011
Toowoomba Depot
Total yearly historical costs by expenditure type in Toowoomba Depot for the period 2007/8 to
2010/11 are illustrated in SRTD -1 below.
Figure SRTD-1
Total yearly water use and total labour hours in Toowoomba Depot for the period 2007/8 to
2010/11 are illustrated in SRTD-2 below. This analysis was also completed for activities and other
expenditure types.
Figure SRTD-2
Total historical quarterly water use and operations and maintenance hours for Toowoomba Depot
are illustrated in SRTD -3 below. This analysis was also completed for other expenditure types.
Figure SRTD-3
19.85%
9.28%
13.55%
8.56%
24.88%
22.33%
1.55%
Toowoomba Depot Historical Costs by Expenditure Type
Labour
Materials
Contractors
Other
Indirects
Overheads
Electricity
0
10,000
20,000
30,000
40,000
50,000
60,000
12,000
12,500
13,000
13,500
14,000
14,500
15,000
15,500
Water Use (ML)
Labour Hours (Hrs)
Toowoomba DepotYearly Labour Hours and Water Use
Water Use (ML) Labour Hours (hrs)
‐30 000
‐20 000
‐10 000
0
10 000
20 000
30 000
0
500
1 000
1 500
2 000
2 500
3 000
3 500
4 000
4 500
5 000
Wat
er U
se (
ML
)
Lab
ou
r H
ou
rs (
Hrs
)
Toowoomba DepotOperations and Maintenance Hours & Water Use
Total Operations & Maintenance Water Use (ML)
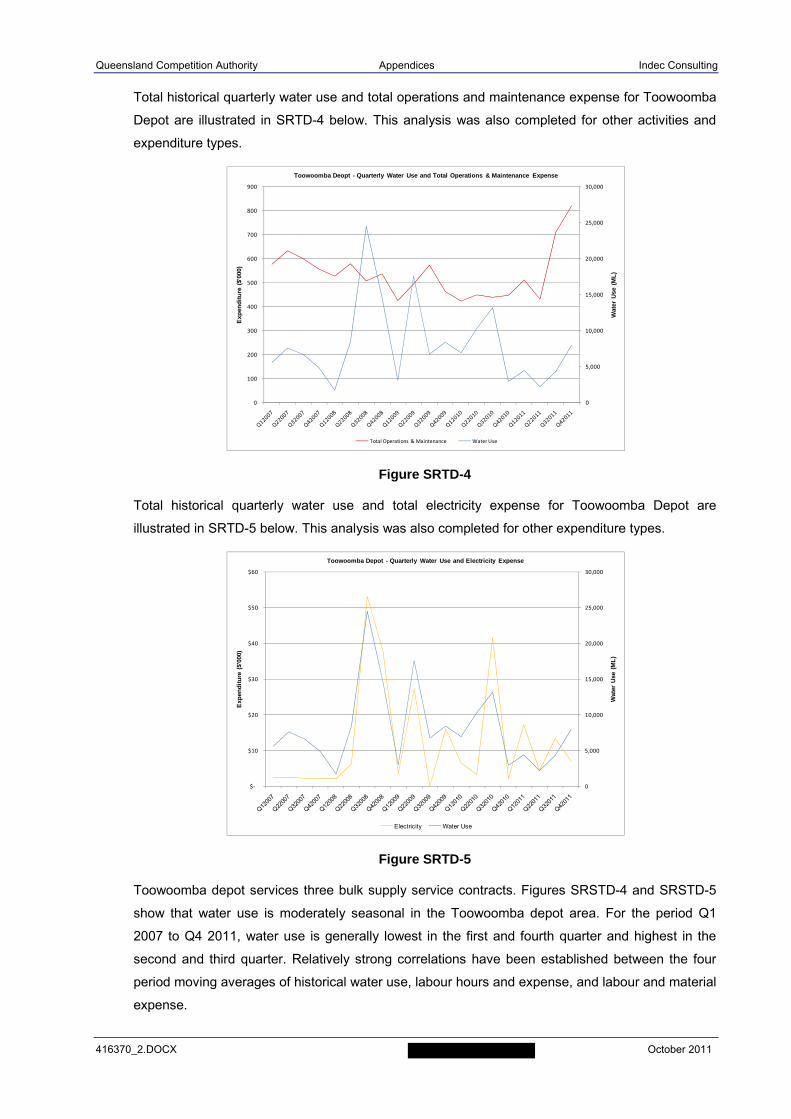
Queensland Competition Authority Appendices Indec Consulting
416370_2.DOCX October 2011
Total historical quarterly water use and total operations and maintenance expense for Toowoomba
Depot are illustrated in SRTD-4 below. This analysis was also completed for other activities and
expenditure types.
Figure SRTD-4
Total historical quarterly water use and total electricity expense for Toowoomba Depot are
illustrated in SRTD-5 below. This analysis was also completed for other expenditure types.
Figure SRTD-5
Toowoomba depot services three bulk supply service contracts. Figures SRSTD-4 and SRSTD-5
show that water use is moderately seasonal in the Toowoomba depot area. For the period Q1
2007 to Q4 2011, water use is generally lowest in the first and fourth quarter and highest in the
second and third quarter. Relatively strong correlations have been established between the four
period moving averages of historical water use, labour hours and expense, and labour and material
expense.
0
5,000
10,000
15,000
20,000
25,000
30,000
0
100
200
300
400
500
600
700
800
900
Wat
er U
se (
ML
)
Exp
end
itu
re (
$'00
0)
Toowoomba Deopt - Quarterly Water Use and Total Operations & Maintenance Expense
Total Operations & Maintenance Water Use
0
5,000
10,000
15,000
20,000
25,000
30,000
$‐
$10
$20
$30
$40
$50
$60
Wat
er U
se (
ML
)
Exp
end
itu
re (
$'00
0)
Toowoomba Depot - Quarterly Water Use and Electricity Expense
Electricity Water Use
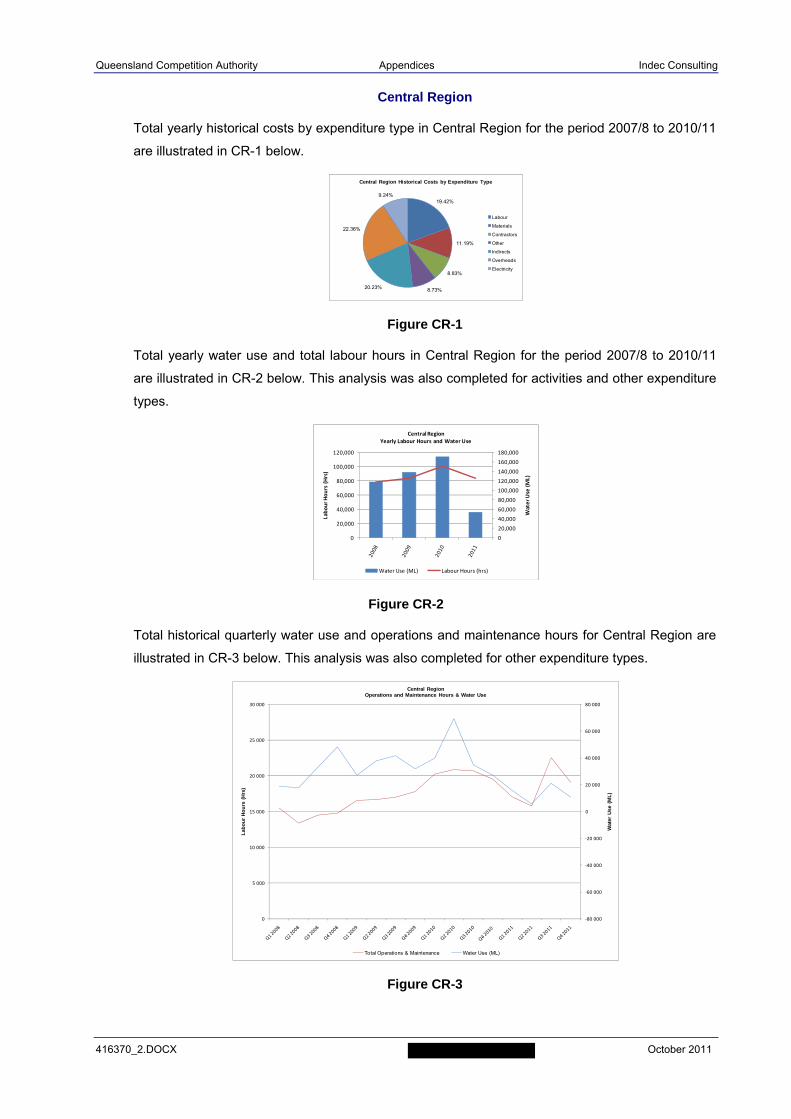
Queensland Competition Authority Appendices Indec Consulting
416370_2.DOCX October 2011
Central Region
Total yearly historical costs by expenditure type in Central Region for the period 2007/8 to 2010/11
are illustrated in CR-1 below.
Figure CR-1
Total yearly water use and total labour hours in Central Region for the period 2007/8 to 2010/11
are illustrated in CR-2 below. This analysis was also completed for activities and other expenditure
types.
Figure CR-2
Total historical quarterly water use and operations and maintenance hours for Central Region are
illustrated in CR-3 below. This analysis was also completed for other expenditure types.
Figure CR-3
19.42%
11.19%
8.83%
8.73%20.23%
22.36%
9.24%
Central Region Historical Costs by Expenditure Type
Labour
Materials
Contractors
Other
Indirects
Overheads
Electricity
0
20,000
40,000
60,000
80,000
100,000
120,000
140,000
160,000
180,000
0
20,000
40,000
60,000
80,000
100,000
120,000
Water Use (ML)
Labour Hours (Hrs)
Central RegionYearly Labour Hours and Water Use
Water Use (ML) Labour Hours (hrs)
‐80 000
‐60 000
‐40 000
‐20 000
0
20 000
40 000
60 000
80 000
0
5 000
10 000
15 000
20 000
25 000
30 000
Wat
er U
se (
ML
)
Lab
ou
r H
ou
rs (
Hrs
)
Central RegionOperations and Maintenance Hours & Water Use
Total Operations & Maintenance Water Use (ML)
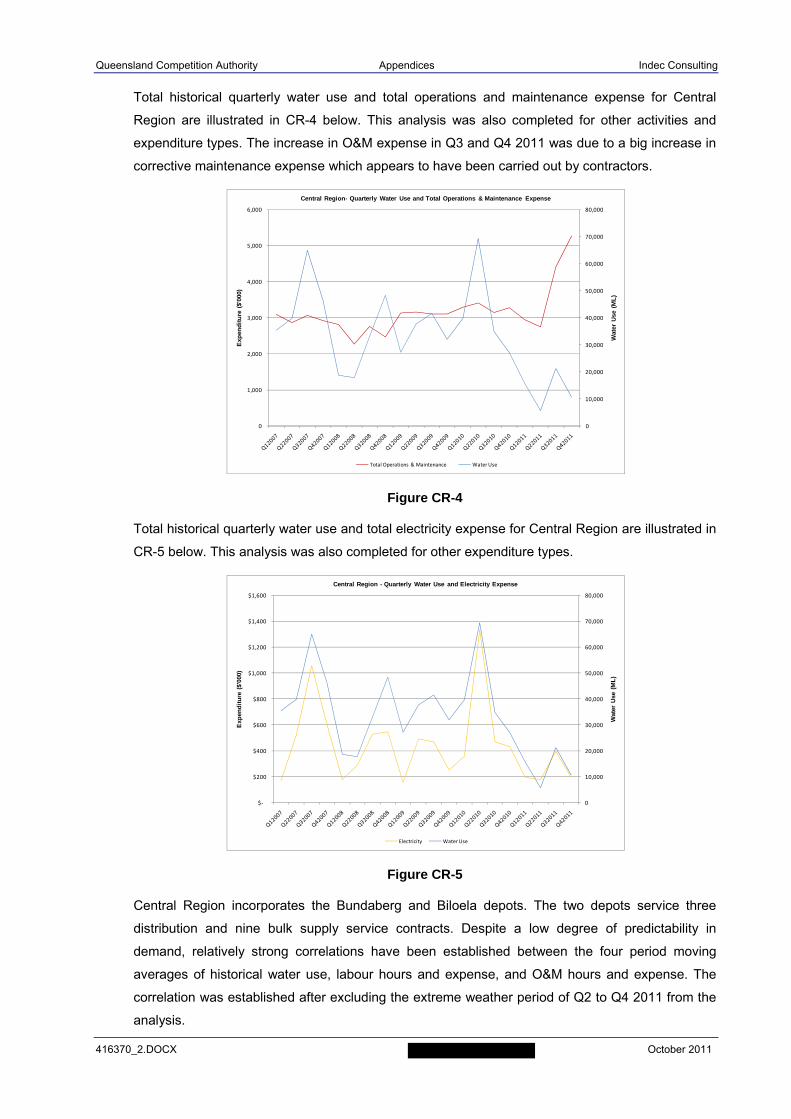
Queensland Competition Authority Appendices Indec Consulting
416370_2.DOCX October 2011
Total historical quarterly water use and total operations and maintenance expense for Central
Region are illustrated in CR-4 below. This analysis was also completed for other activities and
expenditure types. The increase in O&M expense in Q3 and Q4 2011 was due to a big increase in
corrective maintenance expense which appears to have been carried out by contractors.
Figure CR-4
Total historical quarterly water use and total electricity expense for Central Region are illustrated in
CR-5 below. This analysis was also completed for other expenditure types.
Figure CR-5
Central Region incorporates the Bundaberg and Biloela depots. The two depots service three
distribution and nine bulk supply service contracts. Despite a low degree of predictability in
demand, relatively strong correlations have been established between the four period moving
averages of historical water use, labour hours and expense, and O&M hours and expense. The
correlation was established after excluding the extreme weather period of Q2 to Q4 2011 from the
analysis.
0
10,000
20,000
30,000
40,000
50,000
60,000
70,000
80,000
0
1,000
2,000
3,000
4,000
5,000
6,000
Wat
er U
se (
ML
)
Exp
end
itu
re (
$'00
0)
Central Region- Quarterly Water Use and Total Operations & Maintenance Expense
Total Operations & Maintenance Water Use
0
10,000
20,000
30,000
40,000
50,000
60,000
70,000
80,000
$‐
$200
$400
$600
$800
$1,000
$1,200
$1,400
$1,600
Wat
er U
se (
ML
)
Exp
end
itu
re (
$'00
0)
Central Region - Quarterly Water Use and Electricity Expense
Electricity Water Use
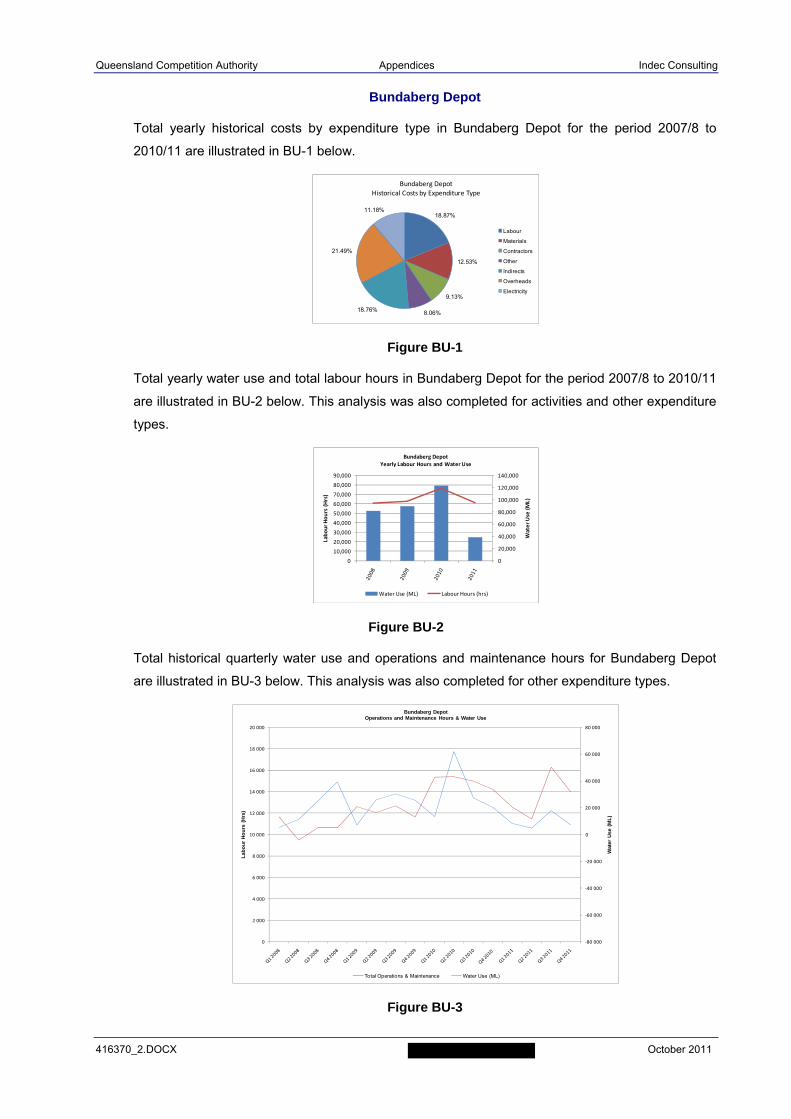
Queensland Competition Authority Appendices Indec Consulting
416370_2.DOCX October 2011
Bundaberg Depot
Total yearly historical costs by expenditure type in Bundaberg Depot for the period 2007/8 to
2010/11 are illustrated in BU-1 below.
Figure BU-1
Total yearly water use and total labour hours in Bundaberg Depot for the period 2007/8 to 2010/11
are illustrated in BU-2 below. This analysis was also completed for activities and other expenditure
types.
Figure BU-2
Total historical quarterly water use and operations and maintenance hours for Bundaberg Depot
are illustrated in BU-3 below. This analysis was also completed for other expenditure types.
Figure BU-3
18.87%
12.53%
9.13%
8.06%18.76%
21.49%
11.18%
Bundaberg DepotHistorical Costs by Expenditure Type
Labour
Materials
Contractors
Other
Indirects
Overheads
Electricity
0
20,000
40,000
60,000
80,000
100,000
120,000
140,000
0
10,000
20,000
30,000
40,000
50,000
60,000
70,000
80,000
90,000
Water Use (ML)
Labour Hours (Hrs)
Bundaberg DepotYearly Labour Hours and Water Use
Water Use (ML) Labour Hours (hrs)
‐80 000
‐60 000
‐40 000
‐20 000
0
20 000
40 000
60 000
80 000
0
2 000
4 000
6 000
8 000
10 000
12 000
14 000
16 000
18 000
20 000
Wat
er U
se (
ML
)
Lab
ou
r H
ou
rs (
Hrs
)
Bundaberg DepotOperations and Maintenance Hours & Water Use
Total Operations & Maintenance Water Use (ML)
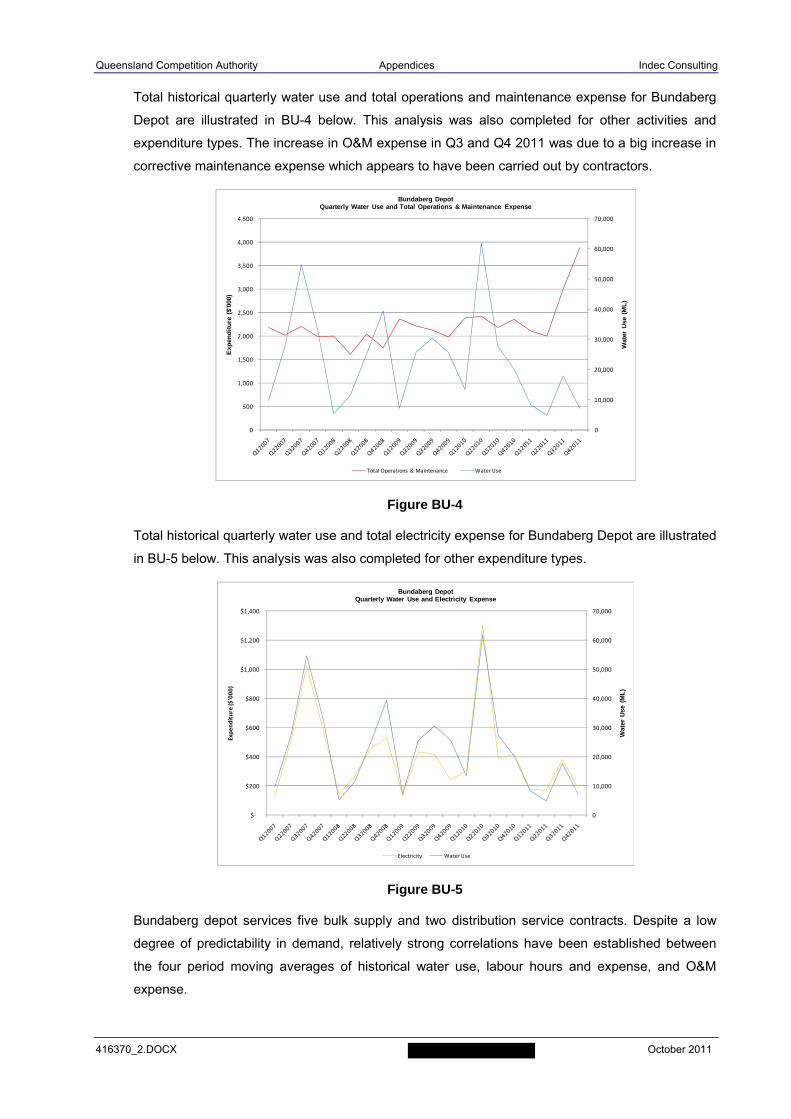
Queensland Competition Authority Appendices Indec Consulting
416370_2.DOCX October 2011
Total historical quarterly water use and total operations and maintenance expense for Bundaberg
Depot are illustrated in BU-4 below. This analysis was also completed for other activities and
expenditure types. The increase in O&M expense in Q3 and Q4 2011 was due to a big increase in
corrective maintenance expense which appears to have been carried out by contractors.
Figure BU-4
Total historical quarterly water use and total electricity expense for Bundaberg Depot are illustrated
in BU-5 below. This analysis was also completed for other expenditure types.
Figure BU-5
Bundaberg depot services five bulk supply and two distribution service contracts. Despite a low
degree of predictability in demand, relatively strong correlations have been established between
the four period moving averages of historical water use, labour hours and expense, and O&M
expense.
0
10,000
20,000
30,000
40,000
50,000
60,000
70,000
0
500
1,000
1,500
2,000
2,500
3,000
3,500
4,000
4,500
Wat
er U
se (
ML
)
Exp
end
itu
re (
$'00
0)
Bundaberg DepotQuarterly Water Use and Total Operations & Maintenance Expense
Total Operations & Maintenance Water Use
0
10,000
20,000
30,000
40,000
50,000
60,000
70,000
$‐
$200
$400
$600
$800
$1,000
$1,200
$1,400
Wat
er U
se (
ML
)
Expenditure ($'000)
Bundaberg DepotQuarterly Water Use and Electricity Expense
Electricity Water Use
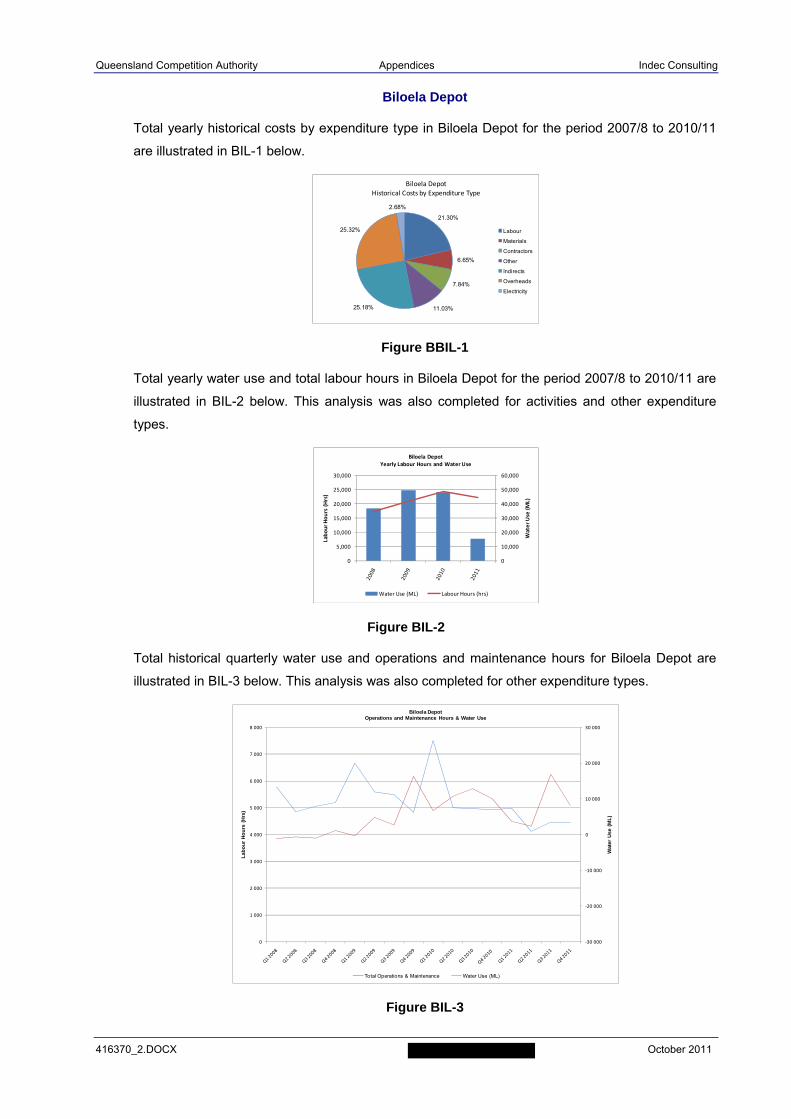
Queensland Competition Authority Appendices Indec Consulting
416370_2.DOCX October 2011
Biloela Depot
Total yearly historical costs by expenditure type in Biloela Depot for the period 2007/8 to 2010/11
are illustrated in BIL-1 below.
Figure BBIL-1
Total yearly water use and total labour hours in Biloela Depot for the period 2007/8 to 2010/11 are
illustrated in BIL-2 below. This analysis was also completed for activities and other expenditure
types.
Figure BIL-2
Total historical quarterly water use and operations and maintenance hours for Biloela Depot are
illustrated in BIL-3 below. This analysis was also completed for other expenditure types.
Figure BIL-3
21.30%
6.65%
7.84%
11.03%25.18%
25.32%
2.68%
Biloela DepotHistorical Costs by Expenditure Type
Labour
Materials
Contractors
Other
Indirects
Overheads
Electricity
0
10,000
20,000
30,000
40,000
50,000
60,000
0
5,000
10,000
15,000
20,000
25,000
30,000
Water Use (ML)
Labour Hours (Hrs)
Biloela DepotYearly Labour Hours and Water Use
Water Use (ML) Labour Hours (hrs)
‐30 000
‐20 000
‐10 000
0
10 000
20 000
30 000
0
1 000
2 000
3 000
4 000
5 000
6 000
7 000
8 000
Wat
er U
se (
ML
)
Lab
ou
r H
ou
rs (
Hrs
)
Biloela DepotOperations and Maintenance Hours & Water Use
Total Operations & Maintenance Water Use (ML)
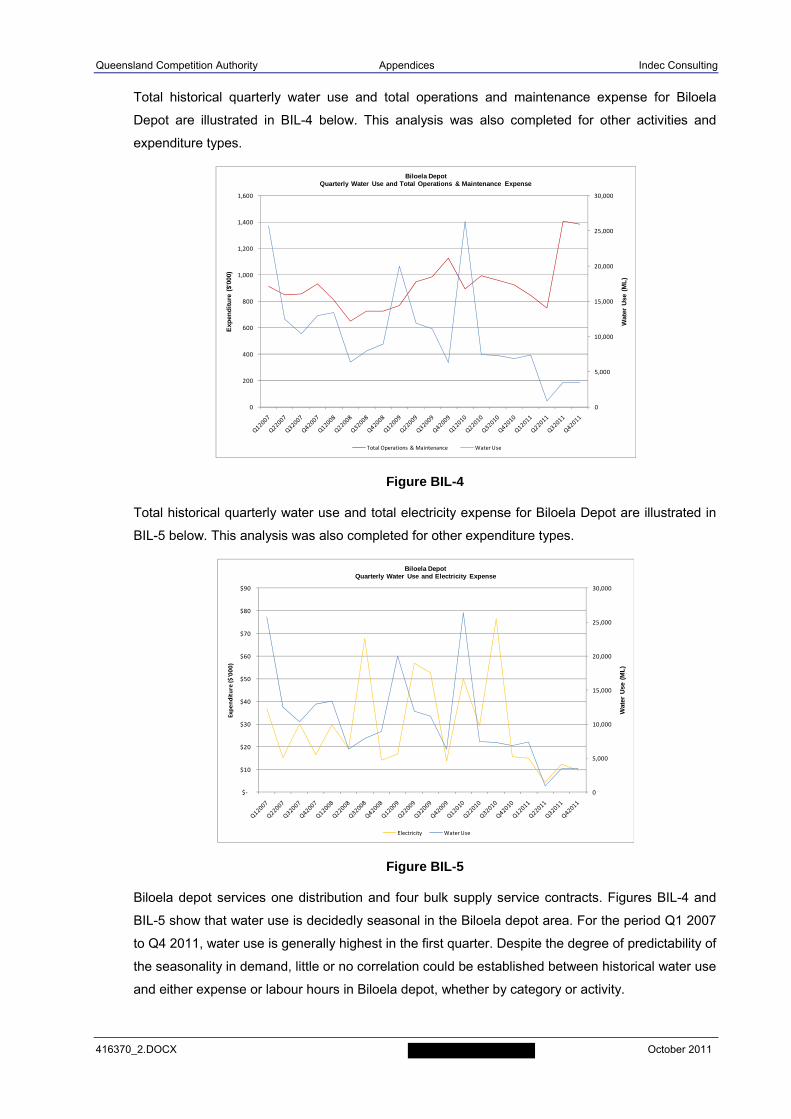
Queensland Competition Authority Appendices Indec Consulting
416370_2.DOCX October 2011
Total historical quarterly water use and total operations and maintenance expense for Biloela
Depot are illustrated in BIL-4 below. This analysis was also completed for other activities and
expenditure types.
Figure BIL-4
Total historical quarterly water use and total electricity expense for Biloela Depot are illustrated in
BIL-5 below. This analysis was also completed for other expenditure types.
Figure BIL-5
Biloela depot services one distribution and four bulk supply service contracts. Figures BIL-4 and
BIL-5 show that water use is decidedly seasonal in the Biloela depot area. For the period Q1 2007
to Q4 2011, water use is generally highest in the first quarter. Despite the degree of predictability of
the seasonality in demand, little or no correlation could be established between historical water use
and either expense or labour hours in Biloela depot, whether by category or activity.
0
5,000
10,000
15,000
20,000
25,000
30,000
0
200
400
600
800
1,000
1,200
1,400
1,600
Wat
er U
se (
ML
)
Exp
end
itu
re (
$'00
0)
Biloela DepotQuarterly Water Use and Total Operations & Maintenance Expense
Total Operations & Maintenance Water Use
0
5,000
10,000
15,000
20,000
25,000
30,000
$‐
$10
$20
$30
$40
$50
$60
$70
$80
$90
Wat
er U
se (
ML
)
Expenditure ($'000)
Biloela DepotQuarterly Water Use and Electricity Expense
Electricity Water Use
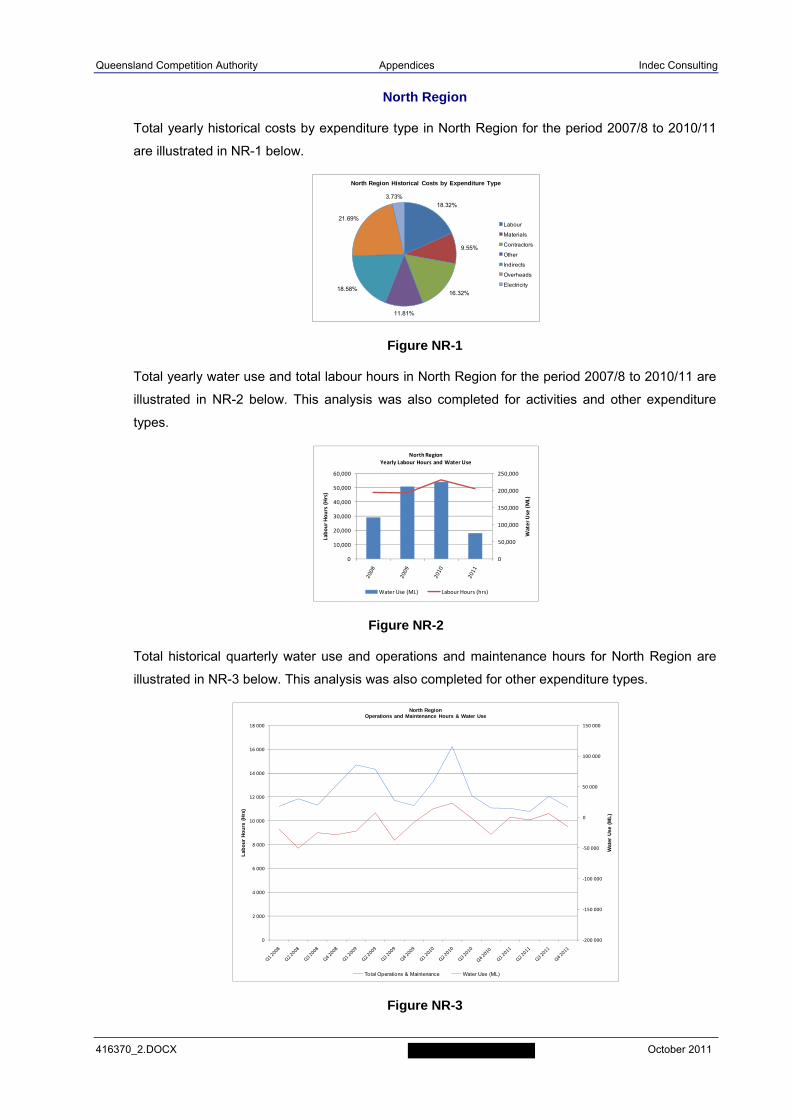
Queensland Competition Authority Appendices Indec Consulting
416370_2.DOCX October 2011
North Region
Total yearly historical costs by expenditure type in North Region for the period 2007/8 to 2010/11
are illustrated in NR-1 below.
Figure NR-1
Total yearly water use and total labour hours in North Region for the period 2007/8 to 2010/11 are
illustrated in NR-2 below. This analysis was also completed for activities and other expenditure
types.
Figure NR-2
Total historical quarterly water use and operations and maintenance hours for North Region are
illustrated in NR-3 below. This analysis was also completed for other expenditure types.
Figure NR-3
18.32%
9.55%
16.32%
11.81%
18.58%
21.69%
3.73%
North Region Historical Costs by Expenditure Type
Labour
Materials
Contractors
Other
Indirects
Overheads
Electricity
0
50,000
100,000
150,000
200,000
250,000
0
10,000
20,000
30,000
40,000
50,000
60,000
Water Use (ML)
Labour Hours (Hrs)
North RegionYearly Labour Hours and Water Use
Water Use (ML) Labour Hours (hrs)
‐200 000
‐150 000
‐100 000
‐50 000
0
50 000
100 000
150 000
0
2 000
4 000
6 000
8 000
10 000
12 000
14 000
16 000
18 000
Wat
er U
se (
ML
)
Lab
ou
r H
ou
rs (
Hrs
)
North RegionOperations and Maintenance Hours & Water Use
Total Operations & Maintenance Water Use (ML)
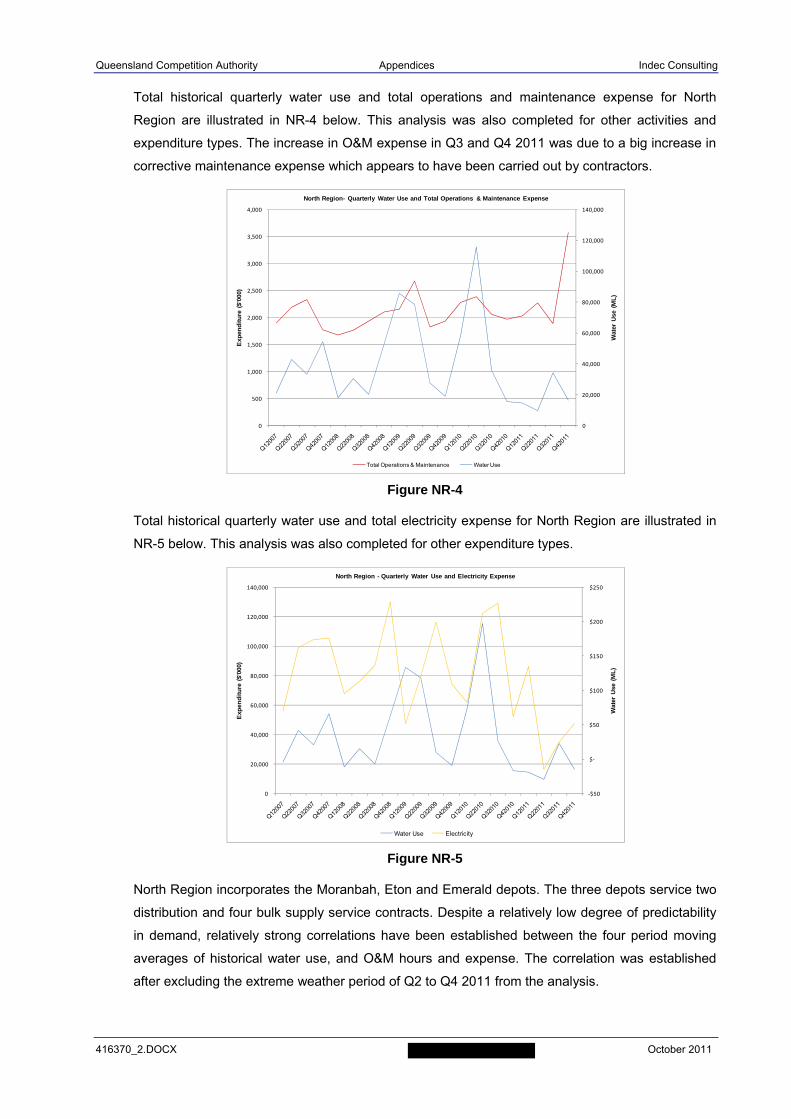
Queensland Competition Authority Appendices Indec Consulting
416370_2.DOCX October 2011
Total historical quarterly water use and total operations and maintenance expense for North
Region are illustrated in NR-4 below. This analysis was also completed for other activities and
expenditure types. The increase in O&M expense in Q3 and Q4 2011 was due to a big increase in
corrective maintenance expense which appears to have been carried out by contractors.
Figure NR-4
Total historical quarterly water use and total electricity expense for North Region are illustrated in
NR-5 below. This analysis was also completed for other expenditure types.
Figure NR-5
North Region incorporates the Moranbah, Eton and Emerald depots. The three depots service two
distribution and four bulk supply service contracts. Despite a relatively low degree of predictability
in demand, relatively strong correlations have been established between the four period moving
averages of historical water use, and O&M hours and expense. The correlation was established
after excluding the extreme weather period of Q2 to Q4 2011 from the analysis.
0
20,000
40,000
60,000
80,000
100,000
120,000
140,000
0
500
1,000
1,500
2,000
2,500
3,000
3,500
4,000
Wat
er U
se (
ML
)
Exp
end
itu
re (
$'00
0)
North Region- Quarterly Water Use and Total Operations & Maintenance Expense
Total Operations & Maintenance Water Use
‐$50
$‐
$50
$100
$150
$200
$250
0
20,000
40,000
60,000
80,000
100,000
120,000
140,000
Wat
er U
se (
ML
)
Exp
end
itu
re (
$'00
0)
North Region - Quarterly Water Use and Electricity Expense
Water Use Electricity
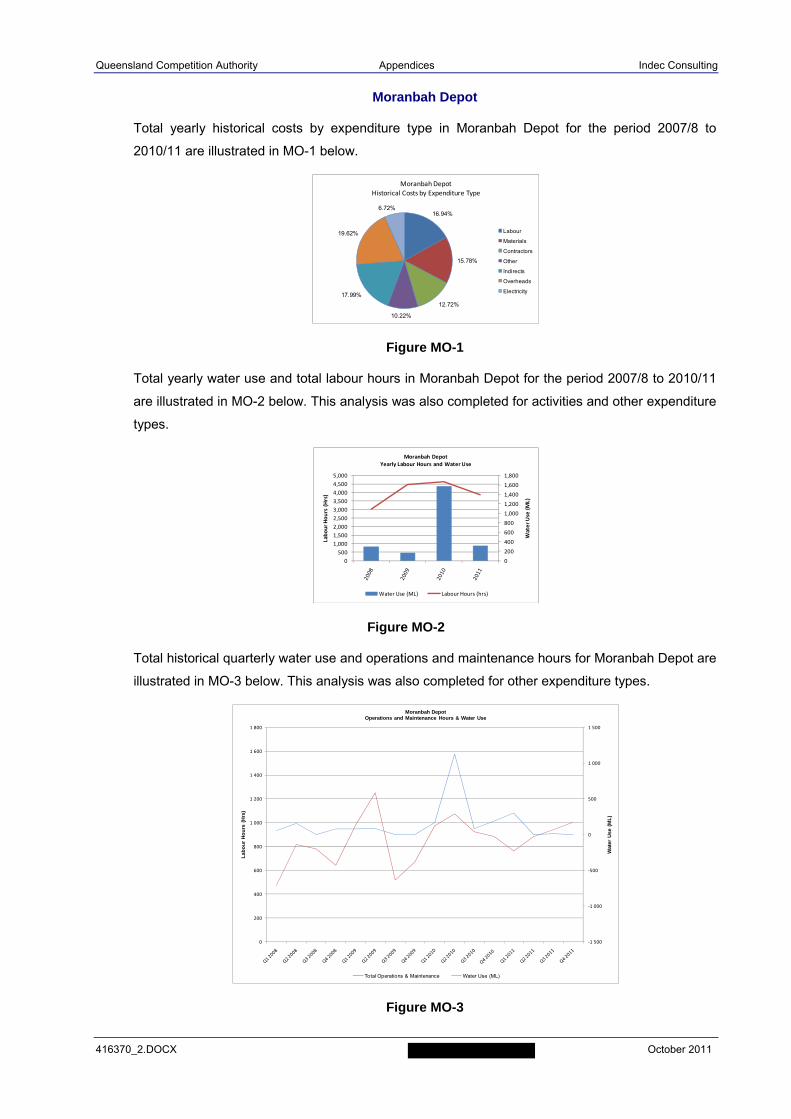
Queensland Competition Authority Appendices Indec Consulting
416370_2.DOCX October 2011
Moranbah Depot
Total yearly historical costs by expenditure type in Moranbah Depot for the period 2007/8 to
2010/11 are illustrated in MO-1 below.
Figure MO-1
Total yearly water use and total labour hours in Moranbah Depot for the period 2007/8 to 2010/11
are illustrated in MO-2 below. This analysis was also completed for activities and other expenditure
types.
Figure MO-2
Total historical quarterly water use and operations and maintenance hours for Moranbah Depot are
illustrated in MO-3 below. This analysis was also completed for other expenditure types.
Figure MO-3
16.94%
15.78%
12.72%
10.22%
17.99%
19.62%
6.72%
Moranbah DepotHistorical Costs by Expenditure Type
Labour
Materials
Contractors
Other
Indirects
Overheads
Electricity
0
200
400
600
800
1,000
1,200
1,400
1,600
1,800
0
500
1,000
1,500
2,000
2,500
3,000
3,500
4,000
4,500
5,000
Water Use (ML)
Labour Hours (Hrs)
Moranbah DepotYearly Labour Hours and Water Use
Water Use (ML) Labour Hours (hrs)
‐1 500
‐1 000
‐500
0
500
1 000
1 500
0
200
400
600
800
1 000
1 200
1 400
1 600
1 800
Wat
er U
se (
ML
)
Lab
ou
r H
ou
rs (
Hrs
)
Moranbah DepotOperations and Maintenance Hours & Water Use
Total Operations & Maintenance Water Use (ML)
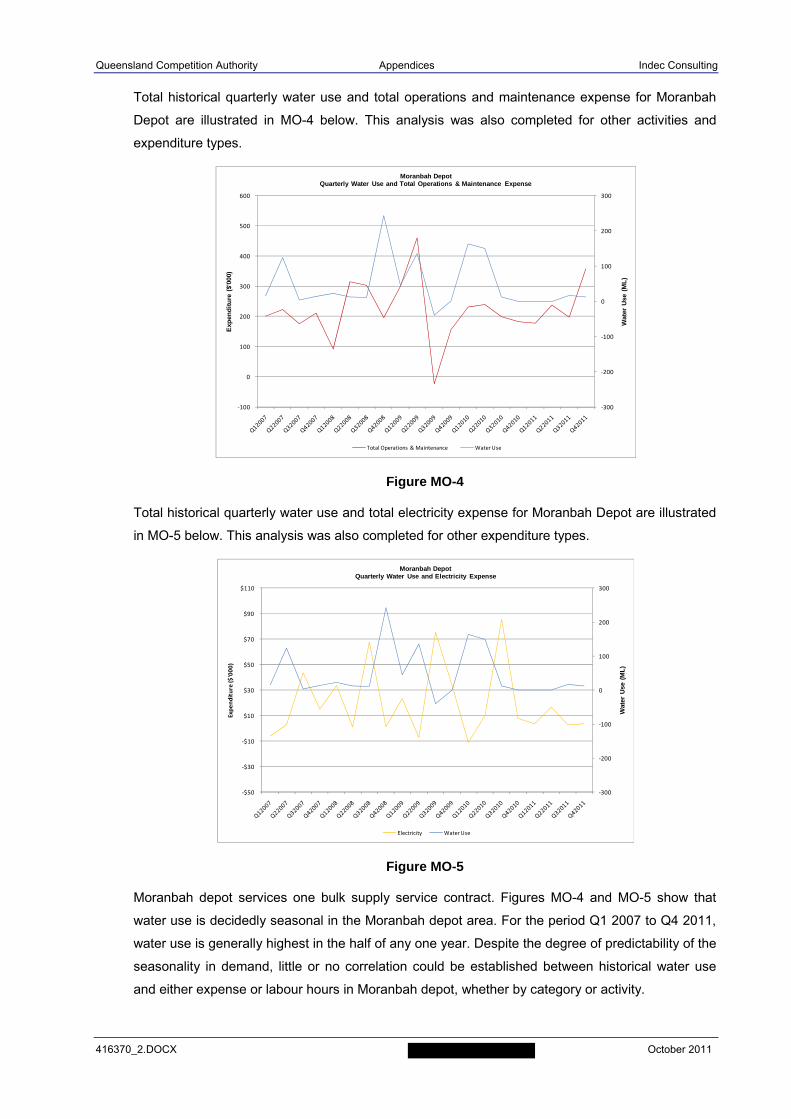
Queensland Competition Authority Appendices Indec Consulting
416370_2.DOCX October 2011
Total historical quarterly water use and total operations and maintenance expense for Moranbah
Depot are illustrated in MO-4 below. This analysis was also completed for other activities and
expenditure types.
Figure MO-4
Total historical quarterly water use and total electricity expense for Moranbah Depot are illustrated
in MO-5 below. This analysis was also completed for other expenditure types.
Figure MO-5
Moranbah depot services one bulk supply service contract. Figures MO-4 and MO-5 show that
water use is decidedly seasonal in the Moranbah depot area. For the period Q1 2007 to Q4 2011,
water use is generally highest in the half of any one year. Despite the degree of predictability of the
seasonality in demand, little or no correlation could be established between historical water use
and either expense or labour hours in Moranbah depot, whether by category or activity.
‐300
‐200
‐100
0
100
200
300
‐100
0
100
200
300
400
500
600
Wat
er U
se (
ML
)
Exp
end
itu
re (
$'00
0)
Moranbah DepotQuarterly Water Use and Total Operations & Maintenance Expense
Total Operations & Maintenance Water Use
‐300
‐200
‐100
0
100
200
300
‐$50
‐$30
‐$10
$10
$30
$50
$70
$90
$110
Wat
er U
se (
ML
)
Expenditure ($'000)
Moranbah DepotQuarterly Water Use and Electricity Expense
Electricity Water Use
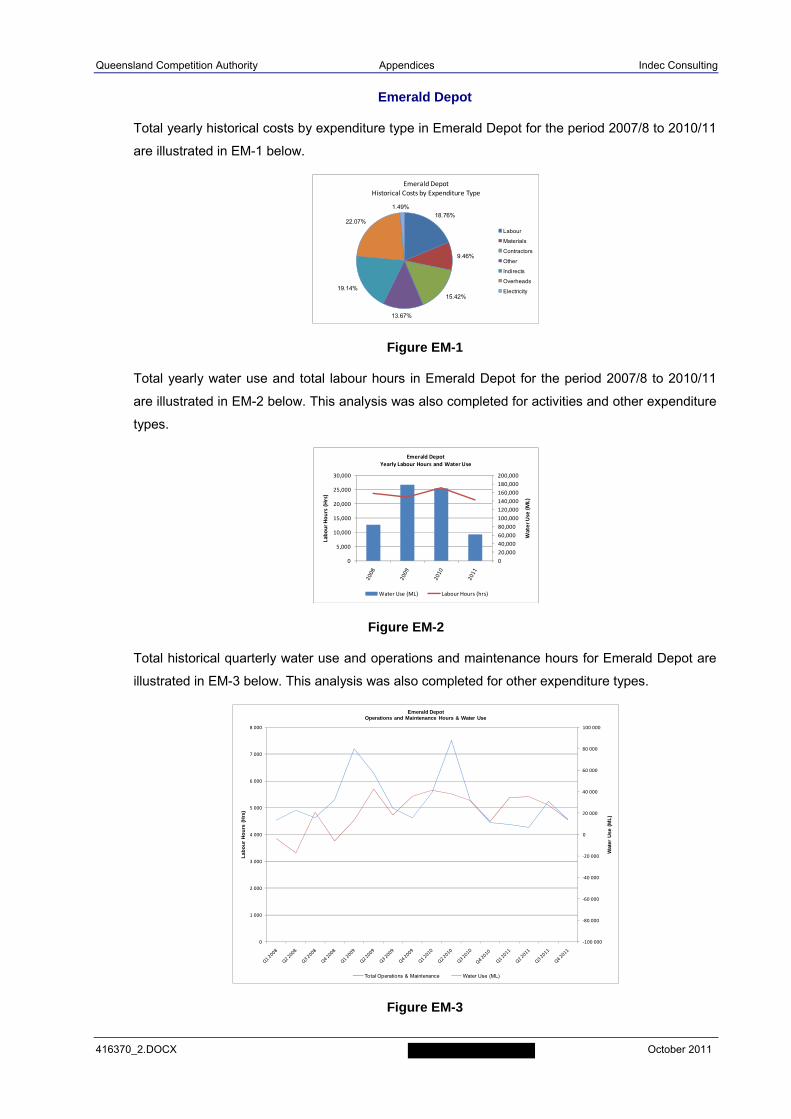
Queensland Competition Authority Appendices Indec Consulting
416370_2.DOCX October 2011
Emerald Depot
Total yearly historical costs by expenditure type in Emerald Depot for the period 2007/8 to 2010/11
are illustrated in EM-1 below.
Figure EM-1
Total yearly water use and total labour hours in Emerald Depot for the period 2007/8 to 2010/11
are illustrated in EM-2 below. This analysis was also completed for activities and other expenditure
types.
Figure EM-2
Total historical quarterly water use and operations and maintenance hours for Emerald Depot are
illustrated in EM-3 below. This analysis was also completed for other expenditure types.
Figure EM-3
18.76%
9.46%
15.42%
13.67%
19.14%
22.07%
1.49%
Emerald DepotHistorical Costs by Expenditure Type
Labour
Materials
Contractors
Other
Indirects
Overheads
Electricity
0
20,000
40,000
60,000
80,000
100,000
120,000
140,000
160,000
180,000
200,000
0
5,000
10,000
15,000
20,000
25,000
30,000
Water Use (ML)
Labour Hours (Hrs)
Emerald DepotYearly Labour Hours and Water Use
Water Use (ML) Labour Hours (hrs)
‐100 000
‐80 000
‐60 000
‐40 000
‐20 000
0
20 000
40 000
60 000
80 000
100 000
0
1 000
2 000
3 000
4 000
5 000
6 000
7 000
8 000
Wat
er U
se (
ML
)
Lab
ou
r H
ou
rs (
Hrs
)
Emerald DepotOperations and Maintenance Hours & Water Use
Total Operations & Maintenance Water Use (ML)
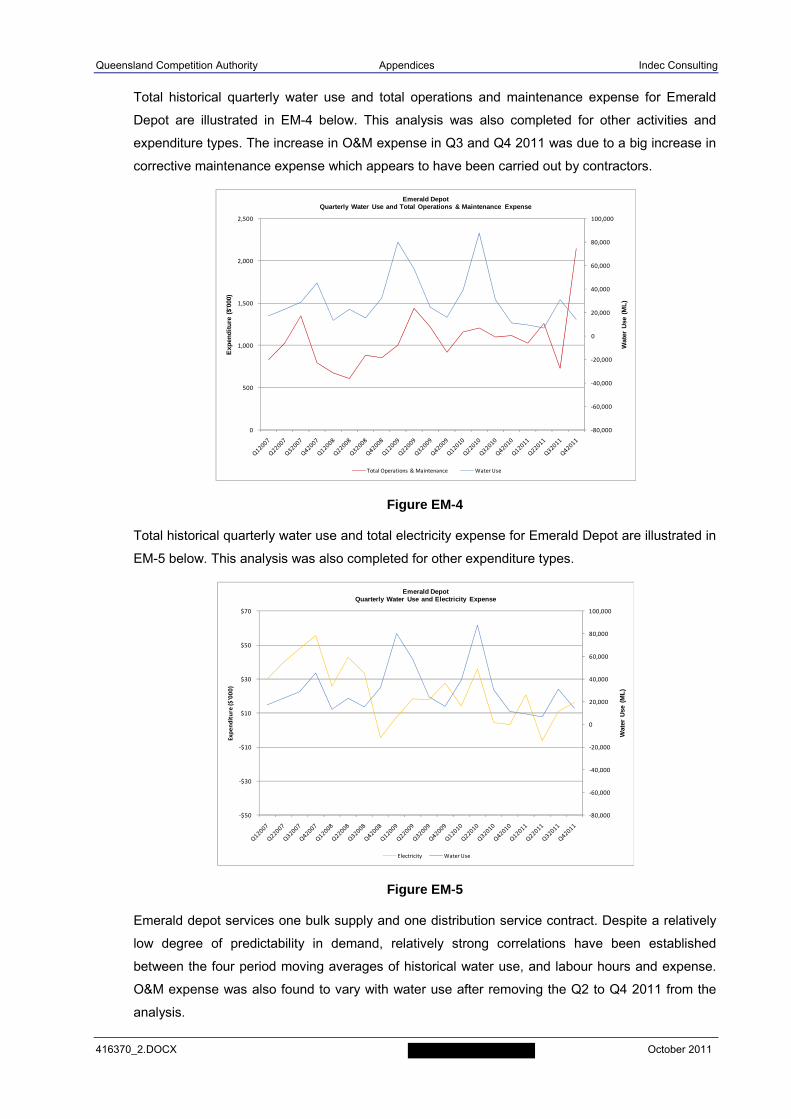
Queensland Competition Authority Appendices Indec Consulting
416370_2.DOCX October 2011
Total historical quarterly water use and total operations and maintenance expense for Emerald
Depot are illustrated in EM-4 below. This analysis was also completed for other activities and
expenditure types. The increase in O&M expense in Q3 and Q4 2011 was due to a big increase in
corrective maintenance expense which appears to have been carried out by contractors.
Figure EM-4
Total historical quarterly water use and total electricity expense for Emerald Depot are illustrated in
EM-5 below. This analysis was also completed for other expenditure types.
Figure EM-5
Emerald depot services one bulk supply and one distribution service contract. Despite a relatively
low degree of predictability in demand, relatively strong correlations have been established
between the four period moving averages of historical water use, and labour hours and expense.
O&M expense was also found to vary with water use after removing the Q2 to Q4 2011 from the
analysis.
‐80,000
‐60,000
‐40,000
‐20,000
0
20,000
40,000
60,000
80,000
100,000
0
500
1,000
1,500
2,000
2,500
Wat
er U
se (
ML
)
Exp
end
itu
re (
$'00
0)
Emerald DepotQuarterly Water Use and Total Operations & Maintenance Expense
Total Operations & Maintenance Water Use
‐80,000
‐60,000
‐40,000
‐20,000
0
20,000
40,000
60,000
80,000
100,000
‐$50
‐$30
‐$10
$10
$30
$50
$70
Wat
er U
se (
ML
)
Expenditure ($'000)
Emerald DepotQuarterly Water Use and Electricity Expense
Electricity Water Use

Queensland Competition Authority Appendices Indec Consulting
416370_2.DOCX October 2011
Eton Depot
Total yearly historical costs by expenditure type in Eton Depot for the period 2007/8 to 2010/11 are
illustrated in ET-1 below.
Figure ET-1
Total yearly water use and total labour hours in Eton Depot for the period 2007/8 to 2010/11 are
illustrated in ET-2 below. This analysis was also completed for activities and other expenditure
types.
Figure ET-2
Total historical quarterly water use and operations and maintenance hours for Eton Depot are
illustrated in ET-3 below. This analysis was also completed for other expenditure types.
Figure ET-3
18.17%
8.36%
17.97%
10.24%
18.13%
21.72%
5.41%
Eton DepotHistorical Costs by Expenditure Type
Labour
Materials
Contractors
Other
Indirects
Overheads
Electricity
0
10,000
20,000
30,000
40,000
50,000
60,000
0
5,000
10,000
15,000
20,000
25,000
30,000
Water Use (ML)
Labour Hours (Hrs)
Eton DepotYearly Labour Hours and Water Use
Water Use (ML) Labour Hours (hrs)
‐40 000
‐30 000
‐20 000
‐10 000
0
10 000
20 000
30 000
40 000
0
1 000
2 000
3 000
4 000
5 000
6 000
7 000
8 000
Wat
er U
se (
ML
)
Lab
ou
r H
ou
rs (
Hrs
)
Eton DepotOperations and Maintenance Hours & Water Use
Total Operations & Maintenance Water Use (ML)
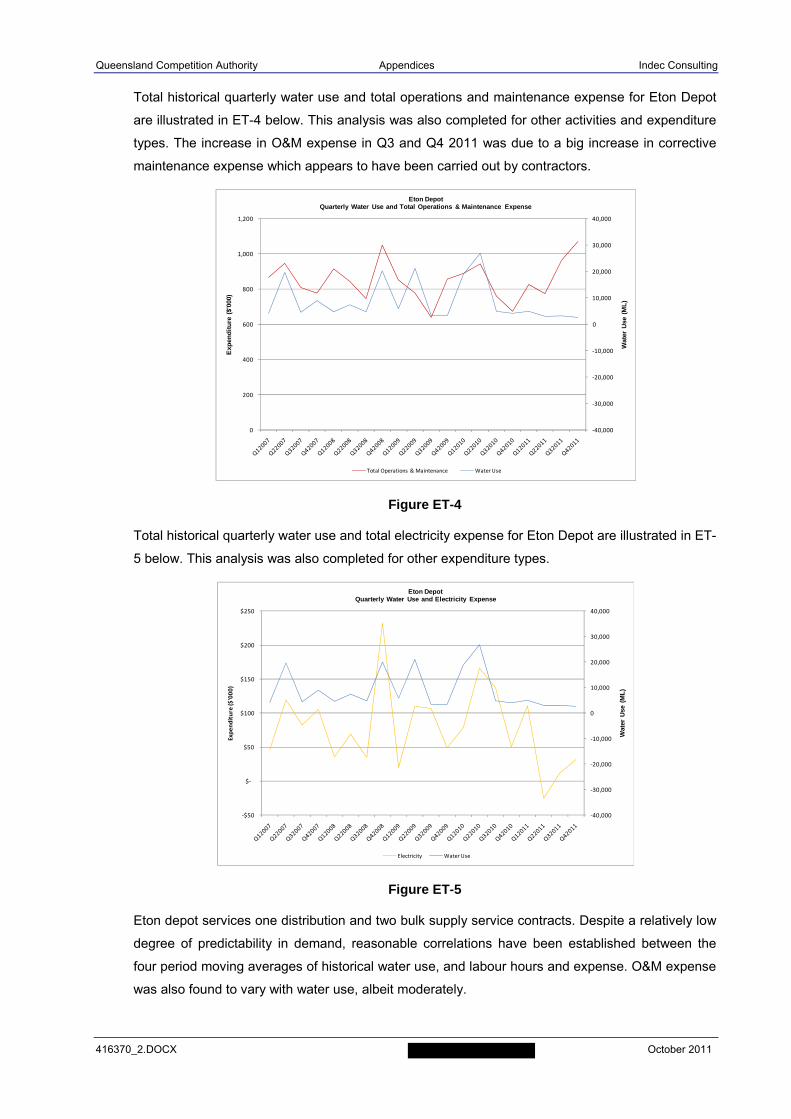
Queensland Competition Authority Appendices Indec Consulting
416370_2.DOCX October 2011
Total historical quarterly water use and total operations and maintenance expense for Eton Depot
are illustrated in ET-4 below. This analysis was also completed for other activities and expenditure
types. The increase in O&M expense in Q3 and Q4 2011 was due to a big increase in corrective
maintenance expense which appears to have been carried out by contractors.
Figure ET-4
Total historical quarterly water use and total electricity expense for Eton Depot are illustrated in ET-
5 below. This analysis was also completed for other expenditure types.
Figure ET-5
Eton depot services one distribution and two bulk supply service contracts. Despite a relatively low
degree of predictability in demand, reasonable correlations have been established between the
four period moving averages of historical water use, and labour hours and expense. O&M expense
was also found to vary with water use, albeit moderately.
‐40,000
‐30,000
‐20,000
‐10,000
0
10,000
20,000
30,000
40,000
0
200
400
600
800
1,000
1,200
Wat
er U
se (
ML
)
Exp
end
itu
re (
$'00
0)
Eton DepotQuarterly Water Use and Total Operations & Maintenance Expense
Total Operations & Maintenance Water Use
‐40,000
‐30,000
‐20,000
‐10,000
0
10,000
20,000
30,000
40,000
‐$50
$‐
$50
$100
$150
$200
$250
Wat
er U
se (
ML
)
Expenditure ($'000)
Eton DepotQuarterly Water Use and Electricity Expense
Electricity Water Use
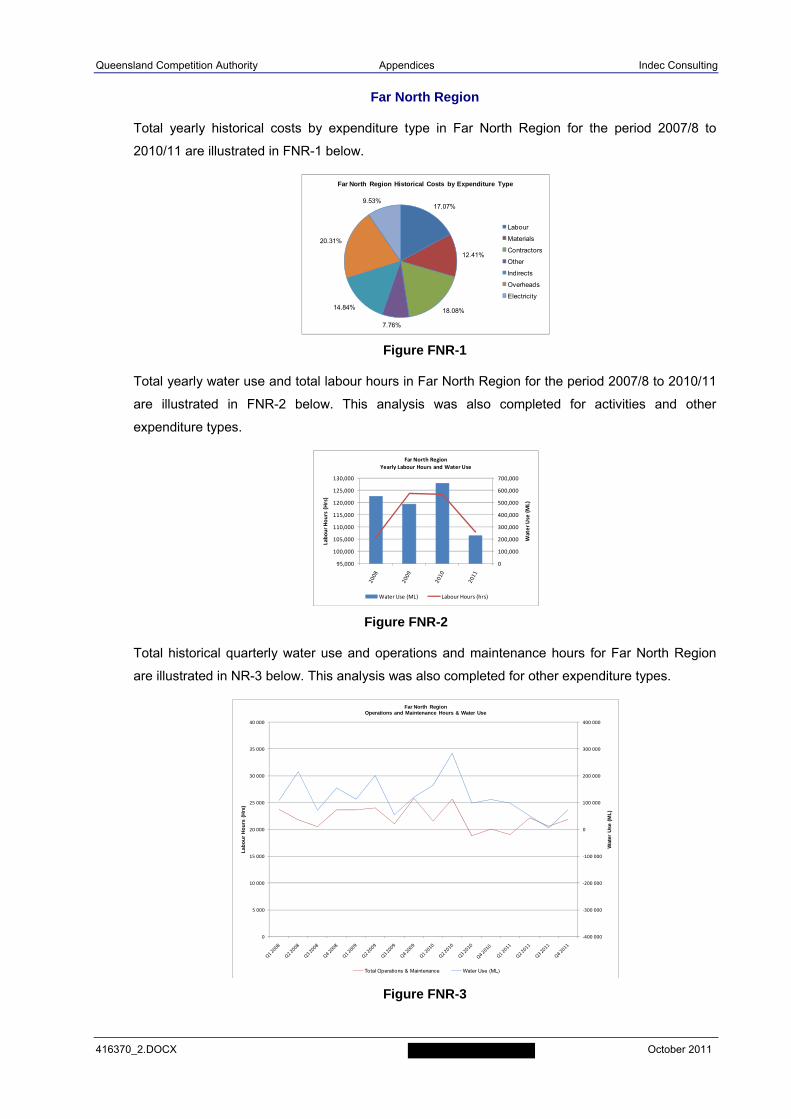
Queensland Competition Authority Appendices Indec Consulting
416370_2.DOCX October 2011
Far North Region
Total yearly historical costs by expenditure type in Far North Region for the period 2007/8 to
2010/11 are illustrated in FNR-1 below.
Figure FNR-1
Total yearly water use and total labour hours in Far North Region for the period 2007/8 to 2010/11
are illustrated in FNR-2 below. This analysis was also completed for activities and other
expenditure types.
Figure FNR-2
Total historical quarterly water use and operations and maintenance hours for Far North Region
are illustrated in NR-3 below. This analysis was also completed for other expenditure types.
Figure FNR-3
17.07%
12.41%
18.08%
7.76%
14.84%
20.31%
9.53%
Far North Region Historical Costs by Expenditure Type
Labour
Materials
Contractors
Other
Indirects
Overheads
Electricity
0
100,000
200,000
300,000
400,000
500,000
600,000
700,000
95,000
100,000
105,000
110,000
115,000
120,000
125,000
130,000
Water Use (ML)
Labour Hours (Hrs)
Far North RegionYearly Labour Hours and Water Use
Water Use (ML) Labour Hours (hrs)
‐400 000
‐300 000
‐200 000
‐100 000
0
100 000
200 000
300 000
400 000
0
5 000
10 000
15 000
20 000
25 000
30 000
35 000
40 000
Wat
er U
se (
ML
)
Lab
ou
r H
ou
rs (
Hrs
)
Far North RegionOperations and Maintenance Hours & Water Use
Total Operations & Maintenance Water Use (ML)

Queensland Competition Authority Appendices Indec Consulting
416370_2.DOCX October 2011
Total historical quarterly water use and total operations and maintenance expense for Far North
Region are illustrated in FNR-4 below. This analysis was also completed for other activities and
expenditure types.
Figure FNR-4
Total historical quarterly water use and total electricity expense for Far North Region are illustrated
in FNR-5 below. This analysis was also completed for other expenditure types.
Figure FNR-5
Far North Region incorporates the Clare and Mareeba depots. The two depots service two
distribution and three bulk supply service contracts. Figures FNR-4 and FNR-5 show that water
use is reasonably seasonal in Far North Region. For the period Q1 2007 to Q1 2011, water use is
generally lowest in the third quarter and highest in the second quarter. Despite the reasonable
degree of predictability of the seasonality in demand, only total labour hours appeared to vary with
water use, albeit weakly. Little or no correlation could be established between Far North Region
historical water use and expense in any category or activity.
‐400,000
‐300,000
‐200,000
‐100,000
0
100,000
200,000
300,000
400,000
0
1,000
2,000
3,000
4,000
5,000
6,000
7,000
8,000
Water Use (ML)
Expenditure ($'000)
Far North Region- Quarterly Water Use and Total Operations & Maintenance Expense
Total Operations & Maintenance Water Use
$-
$200
$400
$600
$800
$1,000
$1,200
$1,400
$1,600
$1,800
0
50,000
100,000
150,000
200,000
250,000
300,000
Wat
er U
se (
ML
)
Exp
end
itu
re (
$'00
0)
Far North Region - Quarterly Water Use and Electricity Expense
Water Use Electricity
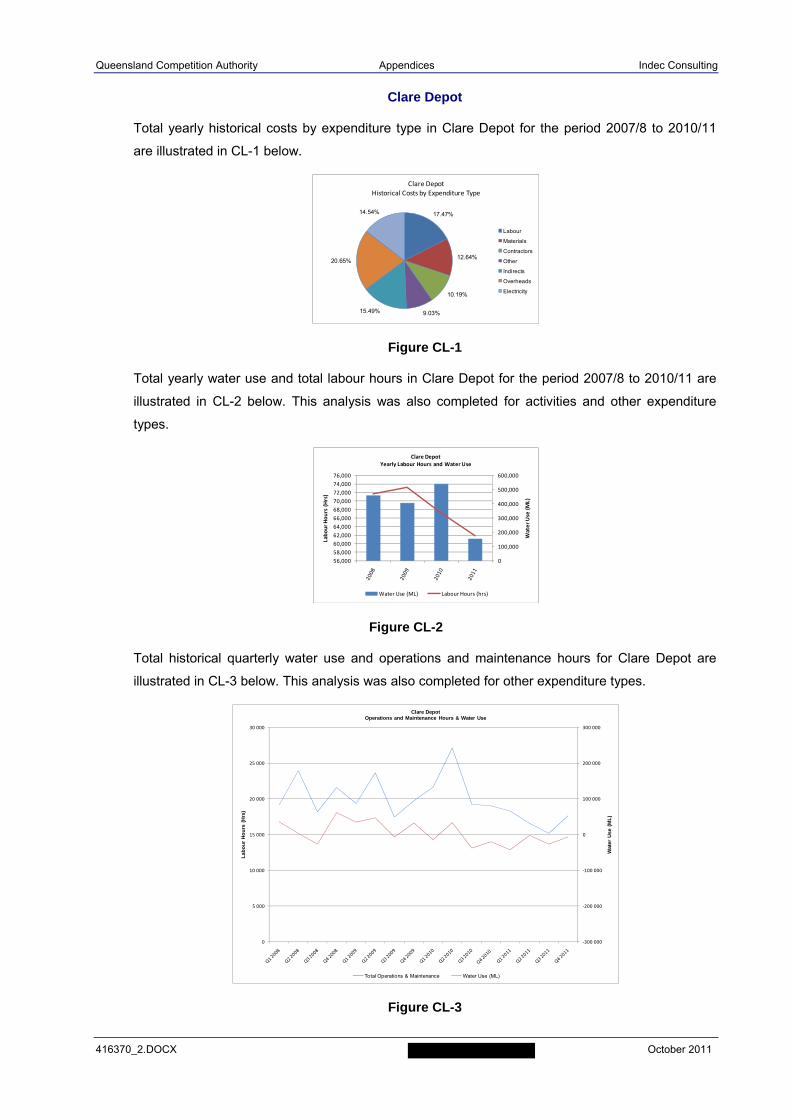
Queensland Competition Authority Appendices Indec Consulting
416370_2.DOCX October 2011
Clare Depot
Total yearly historical costs by expenditure type in Clare Depot for the period 2007/8 to 2010/11
are illustrated in CL-1 below.
Figure CL-1
Total yearly water use and total labour hours in Clare Depot for the period 2007/8 to 2010/11 are
illustrated in CL-2 below. This analysis was also completed for activities and other expenditure
types.
Figure CL-2
Total historical quarterly water use and operations and maintenance hours for Clare Depot are
illustrated in CL-3 below. This analysis was also completed for other expenditure types.
Figure CL-3
17.47%
12.64%
10.19%
9.03%15.49%
20.65%
14.54%
Clare DepotHistorical Costs by Expenditure Type
Labour
Materials
Contractors
Other
Indirects
Overheads
Electricity
0
100,000
200,000
300,000
400,000
500,000
600,000
56,000
58,000
60,000
62,000
64,000
66,000
68,000
70,000
72,000
74,000
76,000
Water Use (ML)
Labour Hours (Hrs)
Clare DepotYearly Labour Hours and Water Use
Water Use (ML) Labour Hours (hrs)
‐300 000
‐200 000
‐100 000
0
100 000
200 000
300 000
0
5 000
10 000
15 000
20 000
25 000
30 000
Wat
er U
se (
ML
)
Lab
ou
r H
ou
rs (
Hrs
)
Clare DepotOperations and Maintenance Hours & Water Use
Total Operations & Maintenance Water Use (ML)
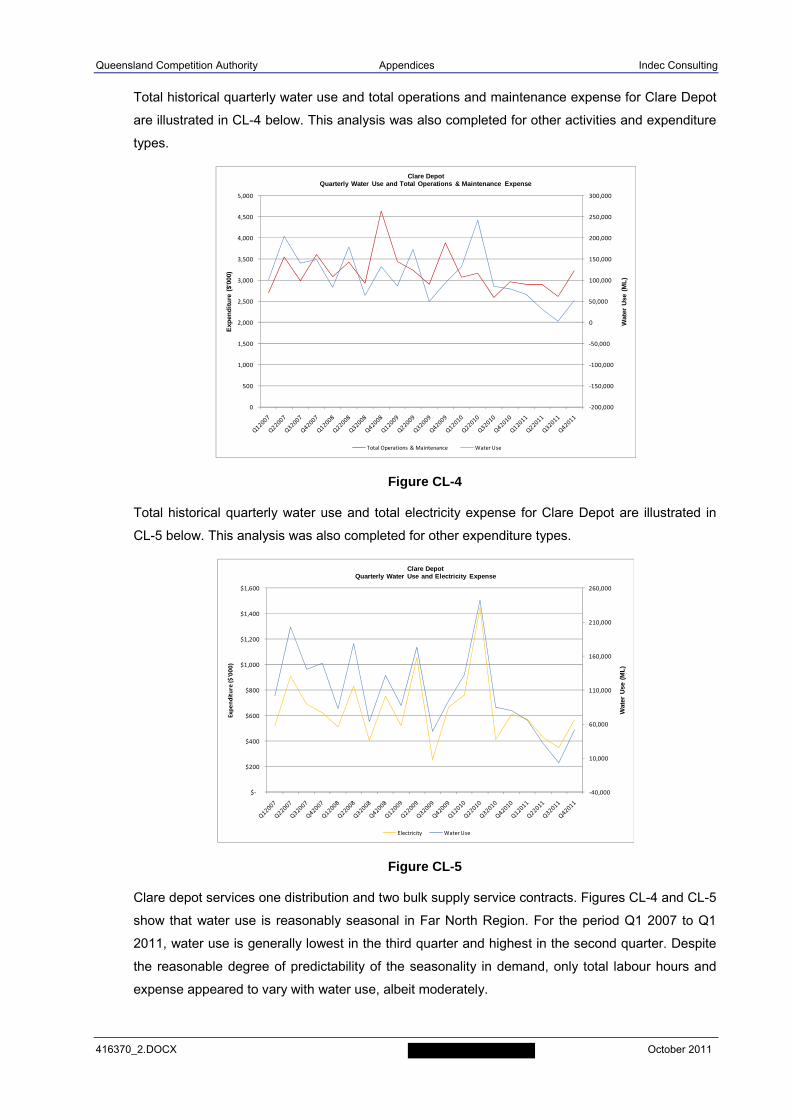
Queensland Competition Authority Appendices Indec Consulting
416370_2.DOCX October 2011
Total historical quarterly water use and total operations and maintenance expense for Clare Depot
are illustrated in CL-4 below. This analysis was also completed for other activities and expenditure
types.
Figure CL-4
Total historical quarterly water use and total electricity expense for Clare Depot are illustrated in
CL-5 below. This analysis was also completed for other expenditure types.
Figure CL-5
Clare depot services one distribution and two bulk supply service contracts. Figures CL-4 and CL-5
show that water use is reasonably seasonal in Far North Region. For the period Q1 2007 to Q1
2011, water use is generally lowest in the third quarter and highest in the second quarter. Despite
the reasonable degree of predictability of the seasonality in demand, only total labour hours and
expense appeared to vary with water use, albeit moderately.
‐200,000
‐150,000
‐100,000
‐50,000
0
50,000
100,000
150,000
200,000
250,000
300,000
0
500
1,000
1,500
2,000
2,500
3,000
3,500
4,000
4,500
5,000
Wat
er U
se (
ML
)
Exp
end
itu
re (
$'00
0)
Clare DepotQuarterly Water Use and Total Operations & Maintenance Expense
Total Operations & Maintenance Water Use
‐40,000
10,000
60,000
110,000
160,000
210,000
260,000
$‐
$200
$400
$600
$800
$1,000
$1,200
$1,400
$1,600
Wat
er U
se (
ML
)
Expenditure ($'000)
Clare DepotQuarterly Water Use and Electricity Expense
Electricity Water Use
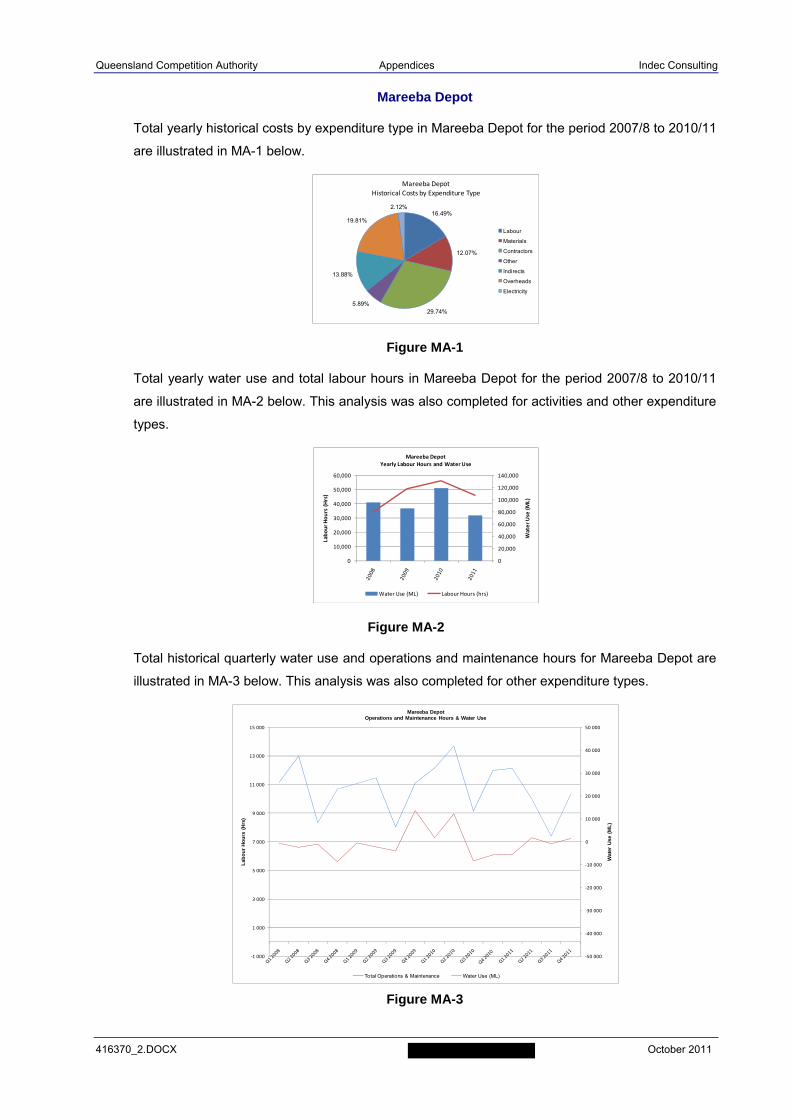
Queensland Competition Authority Appendices Indec Consulting
416370_2.DOCX October 2011
Mareeba Depot
Total yearly historical costs by expenditure type in Mareeba Depot for the period 2007/8 to 2010/11
are illustrated in MA-1 below.
Figure MA-1
Total yearly water use and total labour hours in Mareeba Depot for the period 2007/8 to 2010/11
are illustrated in MA-2 below. This analysis was also completed for activities and other expenditure
types.
Figure MA-2
Total historical quarterly water use and operations and maintenance hours for Mareeba Depot are
illustrated in MA-3 below. This analysis was also completed for other expenditure types.
Figure MA-3
16.49%
12.07%
29.74%5.89%
13.88%
19.81%
2.12%
Mareeba DepotHistorical Costs by Expenditure Type
Labour
Materials
Contractors
Other
Indirects
Overheads
Electricity
0
20,000
40,000
60,000
80,000
100,000
120,000
140,000
0
10,000
20,000
30,000
40,000
50,000
60,000
Water Use (ML)
Labour Hours (Hrs)
Mareeba DepotYearly Labour Hours and Water Use
Water Use (ML) Labour Hours (hrs)
‐50 000
‐40 000
‐30 000
‐20 000
‐10 000
0
10 000
20 000
30 000
40 000
50 000
‐1 000
1 000
3 000
5 000
7 000
9 000
11 000
13 000
15 000
Wat
er U
se (
ML
)
Lab
ou
r H
ou
rs (
Hrs
)
Mareeba DepotOperations and Maintenance Hours & Water Use
Total Operations & Maintenance Water Use (ML)
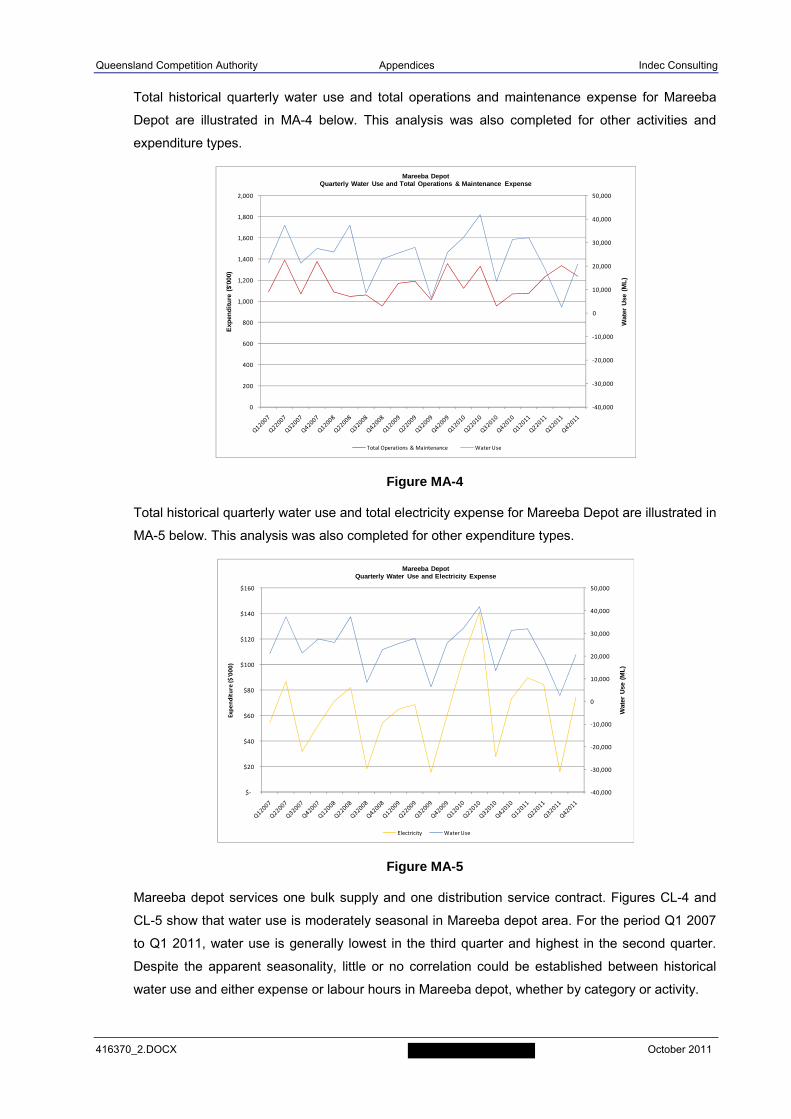
Queensland Competition Authority Appendices Indec Consulting
416370_2.DOCX October 2011
Total historical quarterly water use and total operations and maintenance expense for Mareeba
Depot are illustrated in MA-4 below. This analysis was also completed for other activities and
expenditure types.
Figure MA-4
Total historical quarterly water use and total electricity expense for Mareeba Depot are illustrated in
MA-5 below. This analysis was also completed for other expenditure types.
Figure MA-5
Mareeba depot services one bulk supply and one distribution service contract. Figures CL-4 and
CL-5 show that water use is moderately seasonal in Mareeba depot area. For the period Q1 2007
to Q1 2011, water use is generally lowest in the third quarter and highest in the second quarter.
Despite the apparent seasonality, little or no correlation could be established between historical
water use and either expense or labour hours in Mareeba depot, whether by category or activity.
‐40,000
‐30,000
‐20,000
‐10,000
0
10,000
20,000
30,000
40,000
50,000
0
200
400
600
800
1,000
1,200
1,400
1,600
1,800
2,000
Wat
er U
se (
ML
)
Exp
end
itu
re (
$'00
0)
Mareeba DepotQuarterly Water Use and Total Operations & Maintenance Expense
Total Operations & Maintenance Water Use
‐40,000
‐30,000
‐20,000
‐10,000
0
10,000
20,000
30,000
40,000
50,000
$‐
$20
$40
$60
$80
$100
$120
$140
$160
Wat
er U
se (
ML
)
Expenditure ($'000)
Mareeba DepotQuarterly Water Use and Electricity Expense
Electricity Water Use
Queensland Competition Authority Appendices Indec Consulting
416370_2.DOCX October 2011
APPENDIX G
Historical Cost Analysis
Water Distribution Systems
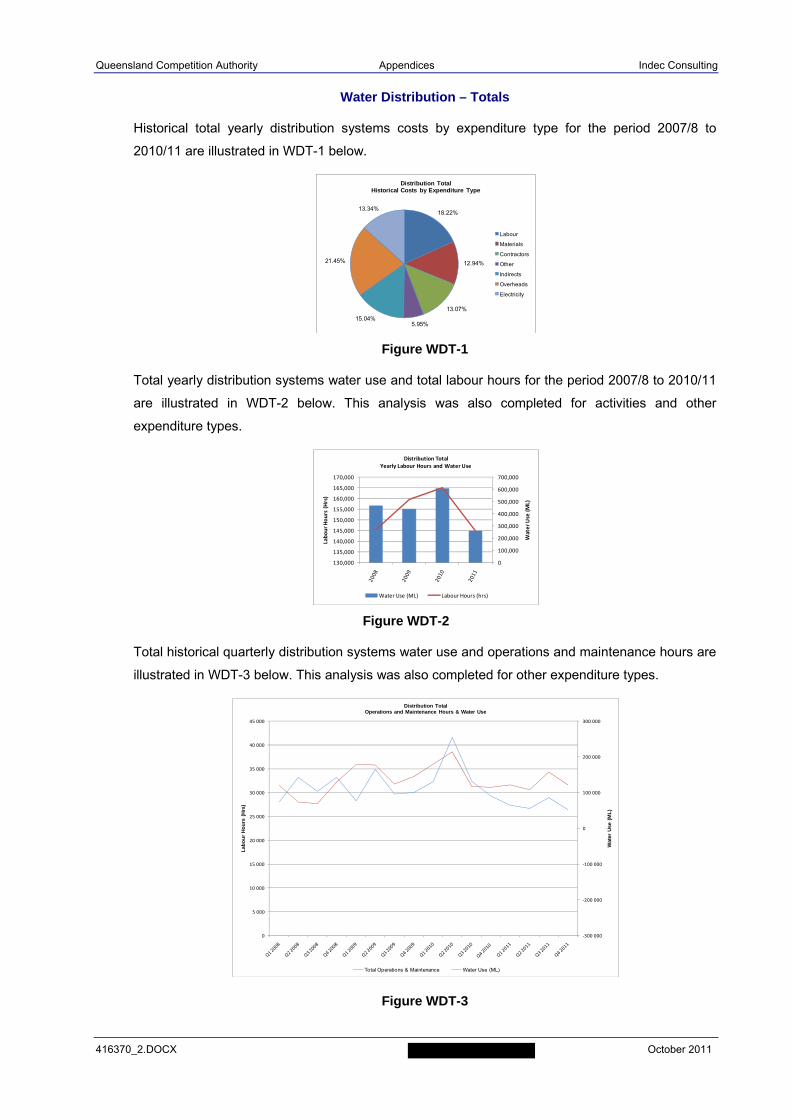
Queensland Competition Authority Appendices Indec Consulting
416370_2.DOCX October 2011
Water Distribution – Totals
Historical total yearly distribution systems costs by expenditure type for the period 2007/8 to
2010/11 are illustrated in WDT-1 below.
Figure WDT-1
Total yearly distribution systems water use and total labour hours for the period 2007/8 to 2010/11
are illustrated in WDT-2 below. This analysis was also completed for activities and other
expenditure types.
Figure WDT-2
Total historical quarterly distribution systems water use and operations and maintenance hours are
illustrated in WDT-3 below. This analysis was also completed for other expenditure types.
Figure WDT-3
18.22%
12.94%
13.07%
5.95%15.04%
21.45%
13.34%
Distribution TotalHistorical Costs by Expenditure Type
Labour
Materials
Contractors
Other
Indirects
Overheads
Electricity
0
100,000
200,000
300,000
400,000
500,000
600,000
700,000
130,000
135,000
140,000
145,000
150,000
155,000
160,000
165,000
170,000
Water Use (ML)
Labour Hours (Hrs)
Distribution TotalYearly Labour Hours and Water Use
Water Use (ML) Labour Hours (hrs)
‐300 000
‐200 000
‐100 000
0
100 000
200 000
300 000
0
5 000
10 000
15 000
20 000
25 000
30 000
35 000
40 000
45 000
Wat
er U
se (
ML
)
Lab
ou
r H
ou
rs (
Hrs
)
Distribution TotalOperations and Maintenance Hours & Water Use
Total Operations & Maintenance Water Use (ML)
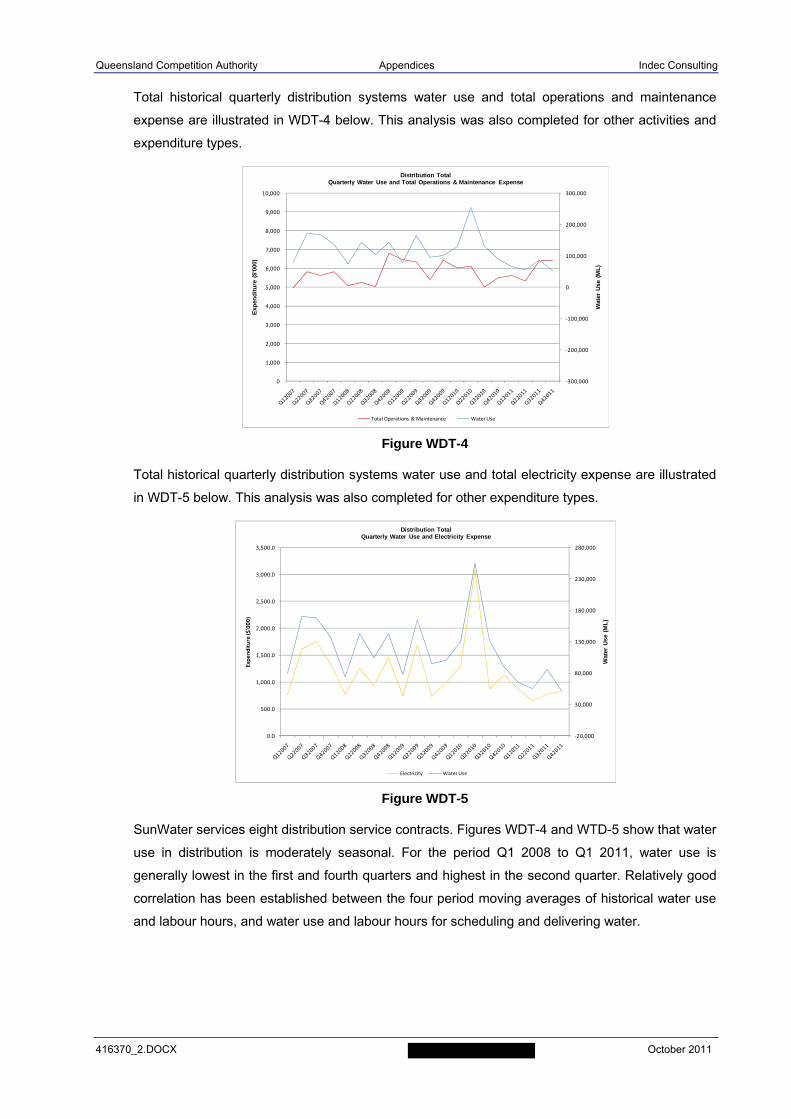
Queensland Competition Authority Appendices Indec Consulting
416370_2.DOCX October 2011
Total historical quarterly distribution systems water use and total operations and maintenance
expense are illustrated in WDT-4 below. This analysis was also completed for other activities and
expenditure types.
Figure WDT-4
Total historical quarterly distribution systems water use and total electricity expense are illustrated
in WDT-5 below. This analysis was also completed for other expenditure types.
Figure WDT-5
SunWater services eight distribution service contracts. Figures WDT-4 and WTD-5 show that water
use in distribution is moderately seasonal. For the period Q1 2008 to Q1 2011, water use is
generally lowest in the first and fourth quarters and highest in the second quarter. Relatively good
correlation has been established between the four period moving averages of historical water use
and labour hours, and water use and labour hours for scheduling and delivering water.
‐300,000
‐200,000
‐100,000
0
100,000
200,000
300,000
0
1,000
2,000
3,000
4,000
5,000
6,000
7,000
8,000
9,000
10,000
Wat
er U
se (
ML
)
Exp
end
itu
re (
$'00
0)
Distribution TotalQuarterly Water Use and Total Operations & Maintenance Expense
Total Operations & Maintenance Water Use
‐20,000
30,000
80,000
130,000
180,000
230,000
280,000
0.0
500.0
1,000.0
1,500.0
2,000.0
2,500.0
3,000.0
3,500.0
Wat
er U
se (
ML
)
Expenditure ($'000)
Distribution TotalQuarterly Water Use and Electricity Expense
Electricity Water Use
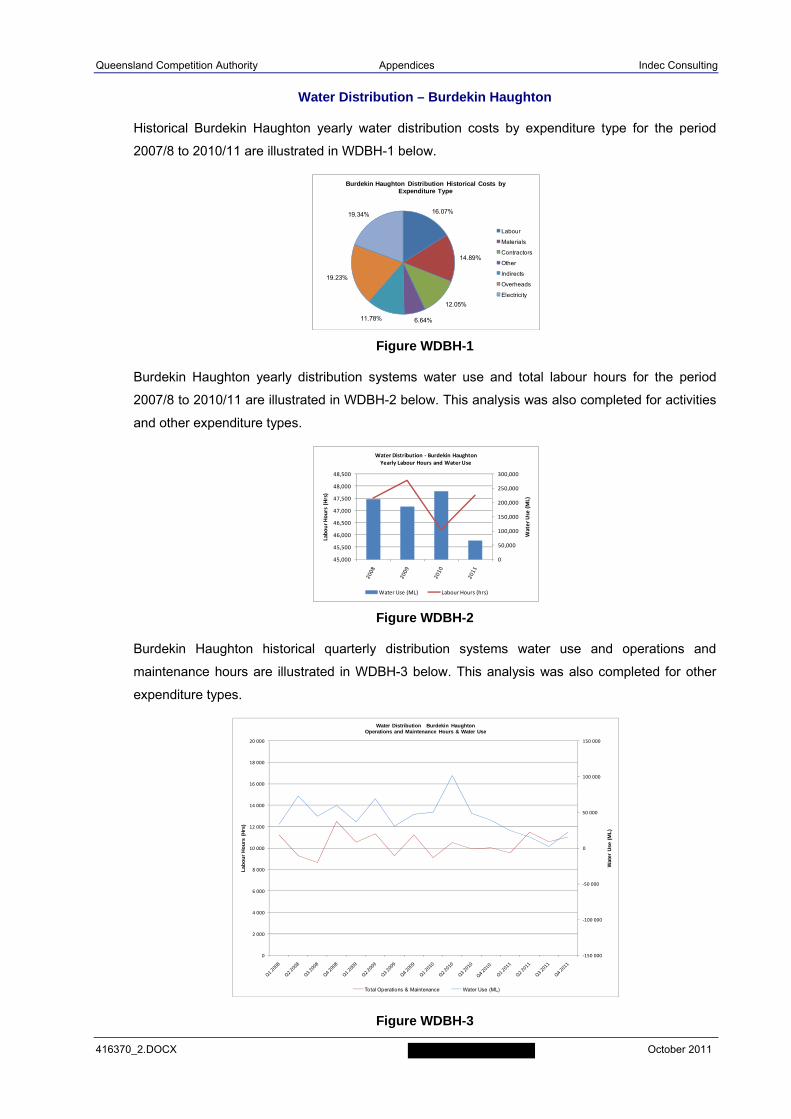
Queensland Competition Authority Appendices Indec Consulting
416370_2.DOCX October 2011
Water Distribution – Burdekin Haughton
Historical Burdekin Haughton yearly water distribution costs by expenditure type for the period
2007/8 to 2010/11 are illustrated in WDBH-1 below.
Figure WDBH-1
Burdekin Haughton yearly distribution systems water use and total labour hours for the period
2007/8 to 2010/11 are illustrated in WDBH-2 below. This analysis was also completed for activities
and other expenditure types.
Figure WDBH-2
Burdekin Haughton historical quarterly distribution systems water use and operations and
maintenance hours are illustrated in WDBH-3 below. This analysis was also completed for other
expenditure types.
Figure WDBH-3
16.07%
14.89%
12.05%
6.64%11.78%
19.23%
19.34%
Burdekin Haughton Distribution Historical Costs by Expenditure Type
Labour
Materials
Contractors
Other
Indirects
Overheads
Electricity
0
50,000
100,000
150,000
200,000
250,000
300,000
45,000
45,500
46,000
46,500
47,000
47,500
48,000
48,500
Water Use (ML)
Labour Hours (Hrs)
Water Distribution ‐ Burdekin HaughtonYearly Labour Hours and Water Use
Water Use (ML) Labour Hours (hrs)
‐150 000
‐100 000
‐50 000
0
50 000
100 000
150 000
0
2 000
4 000
6 000
8 000
10 000
12 000
14 000
16 000
18 000
20 000
Wat
er U
se (
ML
)
Lab
ou
r H
ou
rs (
Hrs
)
Water Distribution Burdekin HaughtonOperations and Maintenance Hours & Water Use
Total Operations & Maintenance Water Use (ML)
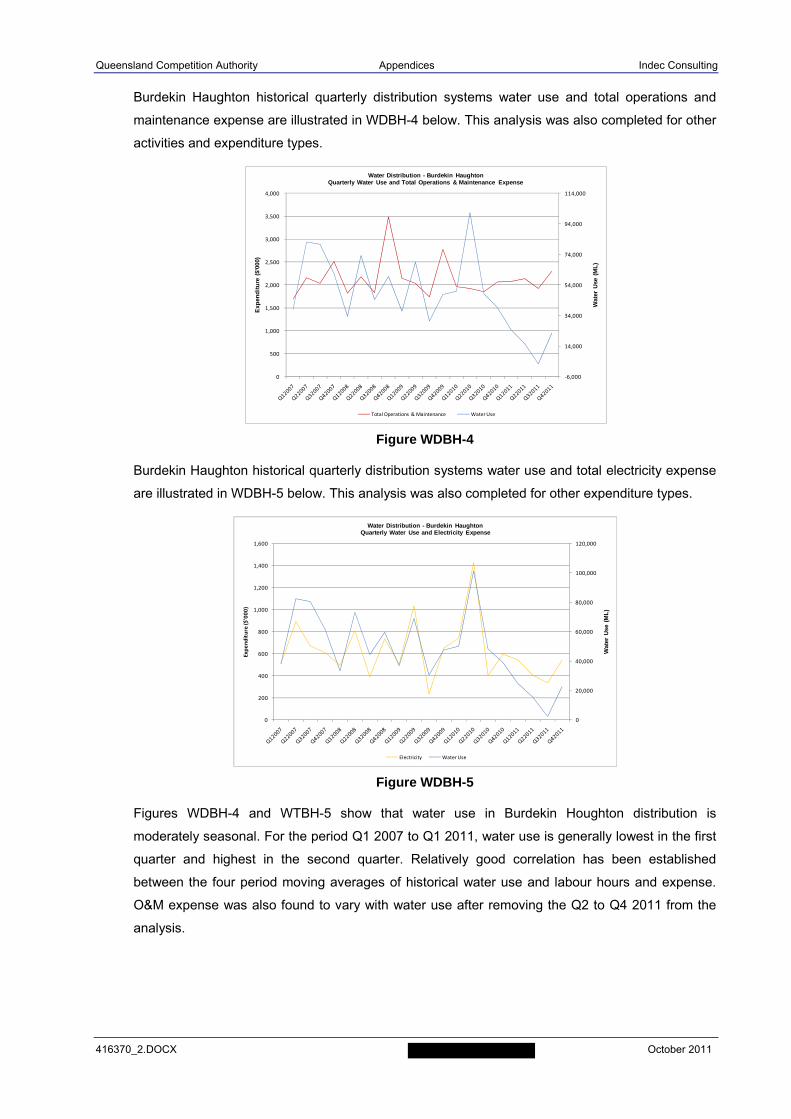
Queensland Competition Authority Appendices Indec Consulting
416370_2.DOCX October 2011
Burdekin Haughton historical quarterly distribution systems water use and total operations and
maintenance expense are illustrated in WDBH-4 below. This analysis was also completed for other
activities and expenditure types.
Figure WDBH-4
Burdekin Haughton historical quarterly distribution systems water use and total electricity expense
are illustrated in WDBH-5 below. This analysis was also completed for other expenditure types.
Figure WDBH-5
Figures WDBH-4 and WTBH-5 show that water use in Burdekin Houghton distribution is
moderately seasonal. For the period Q1 2007 to Q1 2011, water use is generally lowest in the first
quarter and highest in the second quarter. Relatively good correlation has been established
between the four period moving averages of historical water use and labour hours and expense.
O&M expense was also found to vary with water use after removing the Q2 to Q4 2011 from the
analysis.
‐6,000
14,000
34,000
54,000
74,000
94,000
114,000
0
500
1,000
1,500
2,000
2,500
3,000
3,500
4,000
Wat
er U
se (
ML
)
Exp
end
itu
re (
$'00
0)
Water Distribution - Burdekin HaughtonQuarterly Water Use and Total Operations & Maintenance Expense
Total Operations & Maintenance Water Use
0
20,000
40,000
60,000
80,000
100,000
120,000
0
200
400
600
800
1,000
1,200
1,400
1,600
Wat
er U
se (
ML
)
Expenditure ($'000)
Water Distribution - Burdekin HaughtonQuarterly Water Use and Electricity Expense
Electricity Water Use
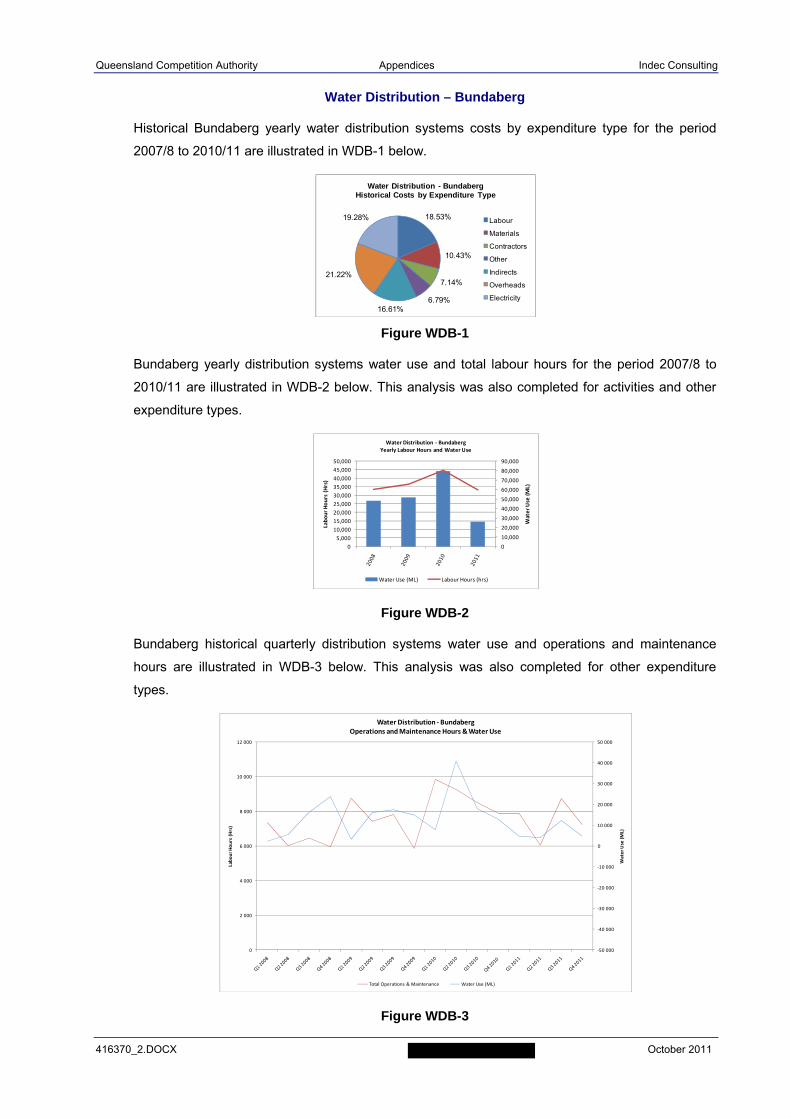
Queensland Competition Authority Appendices Indec Consulting
416370_2.DOCX October 2011
Water Distribution – Bundaberg
Historical Bundaberg yearly water distribution systems costs by expenditure type for the period
2007/8 to 2010/11 are illustrated in WDB-1 below.
Figure WDB-1
Bundaberg yearly distribution systems water use and total labour hours for the period 2007/8 to
2010/11 are illustrated in WDB-2 below. This analysis was also completed for activities and other
expenditure types.
Figure WDB-2
Bundaberg historical quarterly distribution systems water use and operations and maintenance
hours are illustrated in WDB-3 below. This analysis was also completed for other expenditure
types.
Figure WDB-3
18.53%
10.43%
7.14%
6.79%16.61%
21.22%
19.28%
Water Distribution - BundabergHistorical Costs by Expenditure Type
Labour
Materials
Contractors
Other
Indirects
Overheads
Electricity
0
10,000
20,000
30,000
40,000
50,000
60,000
70,000
80,000
90,000
0
5,000
10,000
15,000
20,000
25,000
30,000
35,000
40,000
45,000
50,000
Water Use (ML)
Labour Hours (Hrs)
Water Distribution ‐ BundabergYearly Labour Hours and Water Use
Water Use (ML) Labour Hours (hrs)
‐50 000
‐40 000
‐30 000
‐20 000
‐10 000
0
10 000
20 000
30 000
40 000
50 000
0
2 000
4 000
6 000
8 000
10 000
12 000
Water Use (ML)
Labour Hours (Hrs)
Water Distribution ‐BundabergOperations and Maintenance Hours & Water Use
Total Operations & Maintenance Water Use (ML)
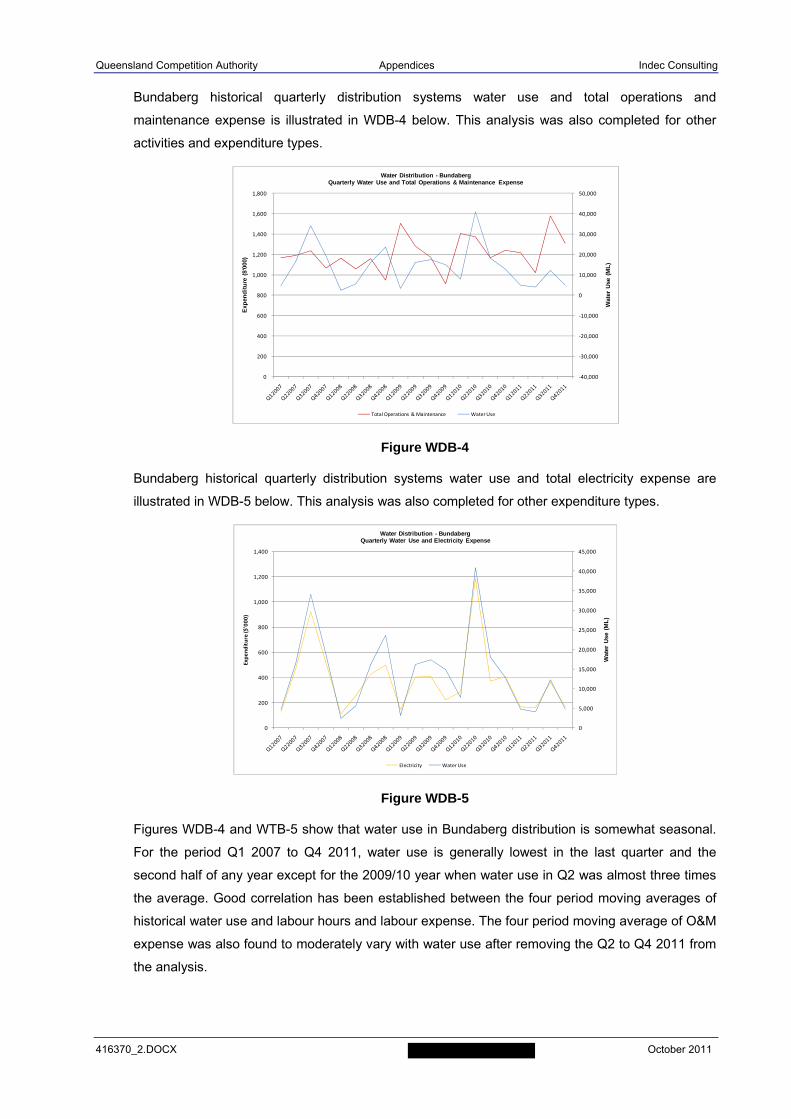
Queensland Competition Authority Appendices Indec Consulting
416370_2.DOCX October 2011
Bundaberg historical quarterly distribution systems water use and total operations and
maintenance expense is illustrated in WDB-4 below. This analysis was also completed for other
activities and expenditure types.
Figure WDB-4
Bundaberg historical quarterly distribution systems water use and total electricity expense are
illustrated in WDB-5 below. This analysis was also completed for other expenditure types.
Figure WDB-5
Figures WDB-4 and WTB-5 show that water use in Bundaberg distribution is somewhat seasonal.
For the period Q1 2007 to Q4 2011, water use is generally lowest in the last quarter and the
second half of any year except for the 2009/10 year when water use in Q2 was almost three times
the average. Good correlation has been established between the four period moving averages of
historical water use and labour hours and labour expense. The four period moving average of O&M
expense was also found to moderately vary with water use after removing the Q2 to Q4 2011 from
the analysis.
‐40,000
‐30,000
‐20,000
‐10,000
0
10,000
20,000
30,000
40,000
50,000
0
200
400
600
800
1,000
1,200
1,400
1,600
1,800
Wat
er U
se (
ML
)
Exp
end
itu
re (
$'00
0)
Water Distribution - BundabergQuarterly Water Use and Total Operations & Maintenance Expense
Total Operations & Maintenance Water Use
0
5,000
10,000
15,000
20,000
25,000
30,000
35,000
40,000
45,000
0
200
400
600
800
1,000
1,200
1,400
Wat
er U
se (
ML
)
Expenditure ($'000)
Water Distribution - BundabergQuarterly Water Use and Electricity Expense
Electricity Water Use
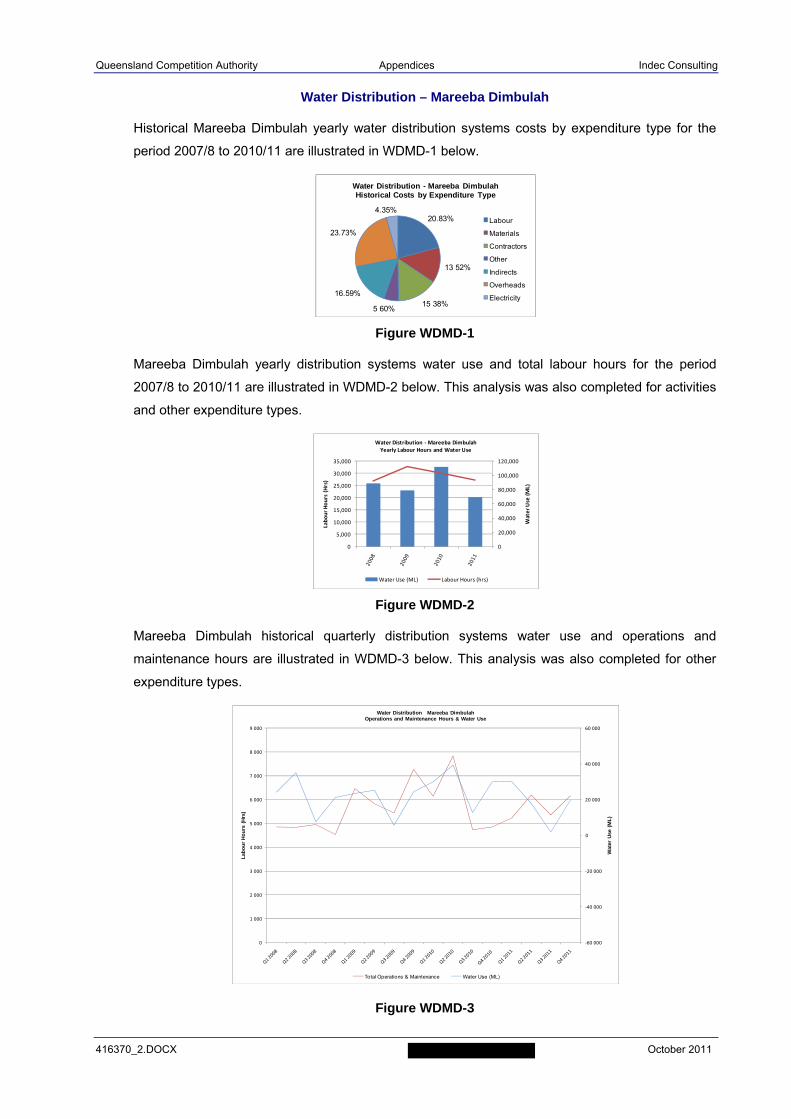
Queensland Competition Authority Appendices Indec Consulting
416370_2.DOCX October 2011
Water Distribution – Mareeba Dimbulah
Historical Mareeba Dimbulah yearly water distribution systems costs by expenditure type for the
period 2007/8 to 2010/11 are illustrated in WDMD-1 below.
Figure WDMD-1
Mareeba Dimbulah yearly distribution systems water use and total labour hours for the period
2007/8 to 2010/11 are illustrated in WDMD-2 below. This analysis was also completed for activities
and other expenditure types.
Figure WDMD-2
Mareeba Dimbulah historical quarterly distribution systems water use and operations and
maintenance hours are illustrated in WDMD-3 below. This analysis was also completed for other
expenditure types.
Figure WDMD-3
20.83%
13 52%
15 38%5 60%
16.59%
23.73%
4.35%
Water Distribution - Mareeba DimbulahHistorical Costs by Expenditure Type
Labour
Materials
Contractors
Other
Indirects
Overheads
Electricity
0
20,000
40,000
60,000
80,000
100,000
120,000
0
5,000
10,000
15,000
20,000
25,000
30,000
35,000
Water Use (ML)
Labour Hours (Hrs)
Water Distribution ‐Mareeba DimbulahYearly Labour Hours and Water Use
Water Use (ML) Labour Hours (hrs)
‐60 000
‐40 000
‐20 000
0
20 000
40 000
60 000
0
1 000
2 000
3 000
4 000
5 000
6 000
7 000
8 000
9 000
Wat
er U
se (
ML
)
Lab
ou
r H
ou
rs (
Hrs
)
Water Distribution Mareeba DimbulahOperations and Maintenance Hours & Water Use
Total Operations & Maintenance Water Use (ML)
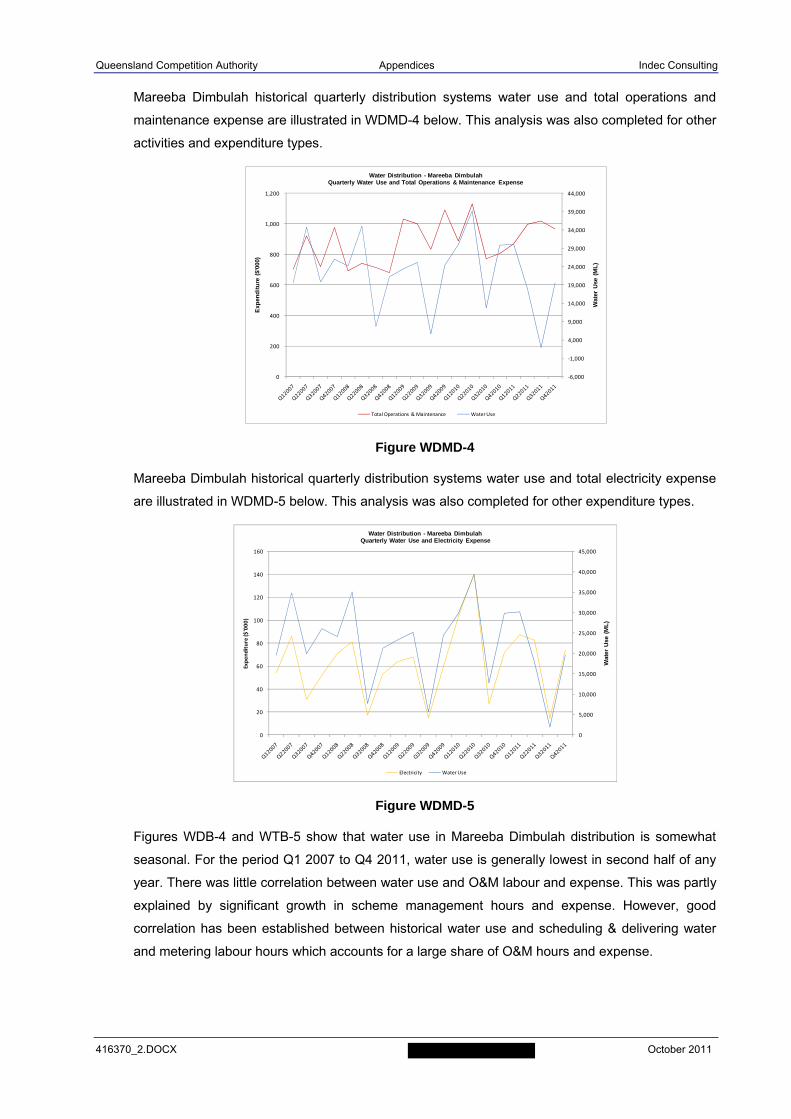
Queensland Competition Authority Appendices Indec Consulting
416370_2.DOCX October 2011
Mareeba Dimbulah historical quarterly distribution systems water use and total operations and
maintenance expense are illustrated in WDMD-4 below. This analysis was also completed for other
activities and expenditure types.
Figure WDMD-4
Mareeba Dimbulah historical quarterly distribution systems water use and total electricity expense
are illustrated in WDMD-5 below. This analysis was also completed for other expenditure types.
Figure WDMD-5
Figures WDB-4 and WTB-5 show that water use in Mareeba Dimbulah distribution is somewhat
seasonal. For the period Q1 2007 to Q4 2011, water use is generally lowest in second half of any
year. There was little correlation between water use and O&M labour and expense. This was partly
explained by significant growth in scheme management hours and expense. However, good
correlation has been established between historical water use and scheduling & delivering water
and metering labour hours which accounts for a large share of O&M hours and expense.
‐6,000
‐1,000
4,000
9,000
14,000
19,000
24,000
29,000
34,000
39,000
44,000
0
200
400
600
800
1,000
1,200
Wat
er U
se (
ML
)
Exp
end
itu
re (
$'00
0)
Water Distribution - Mareeba DimbulahQuarterly Water Use and Total Operations & Maintenance Expense
Total Operations & Maintenance Water Use
0
5,000
10,000
15,000
20,000
25,000
30,000
35,000
40,000
45,000
0
20
40
60
80
100
120
140
160
Wat
er U
se (
ML
)
Expenditure ($'000)
Water Distribution - Mareeba DimbulahQuarterly Water Use and Electricity Expense
Electricity Water Use
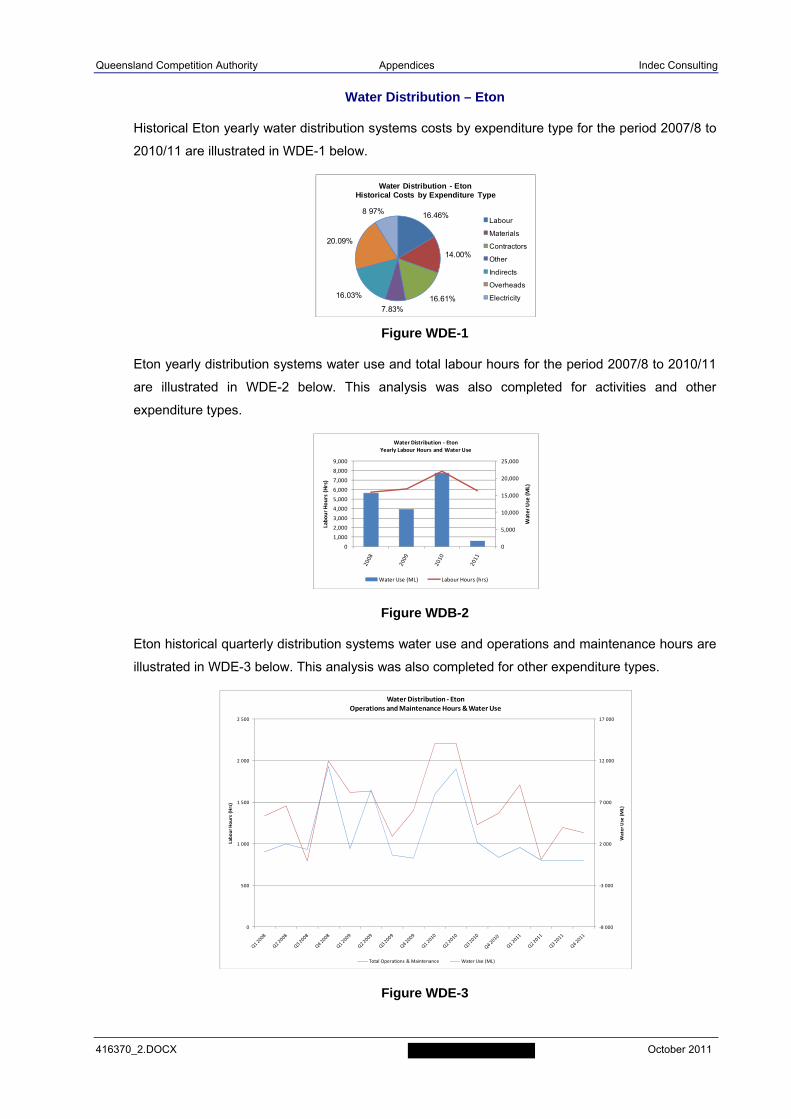
Queensland Competition Authority Appendices Indec Consulting
416370_2.DOCX October 2011
Water Distribution – Eton
Historical Eton yearly water distribution systems costs by expenditure type for the period 2007/8 to
2010/11 are illustrated in WDE-1 below.
Figure WDE-1
Eton yearly distribution systems water use and total labour hours for the period 2007/8 to 2010/11
are illustrated in WDE-2 below. This analysis was also completed for activities and other
expenditure types.
Figure WDB-2
Eton historical quarterly distribution systems water use and operations and maintenance hours are
illustrated in WDE-3 below. This analysis was also completed for other expenditure types.
Figure WDE-3
16.46%
14.00%
16.61%7.83%
16.03%
20.09%
8 97%
Water Distribution - EtonHistorical Costs by Expenditure Type
Labour
Materials
Contractors
Other
Indirects
Overheads
Electricity
0
5,000
10,000
15,000
20,000
25,000
0
1,000
2,000
3,000
4,000
5,000
6,000
7,000
8,000
9,000
Water Use (ML)
Labour Hours (Hrs)
Water Distribution ‐ EtonYearly Labour Hours and Water Use
Water Use (ML) Labour Hours (hrs)
‐8 000
‐3 000
2 000
7 000
12 000
17 000
0
500
1 000
1 500
2 000
2 500
Water Use (ML)
Labour Hours (Hrs)
Water Distribution ‐ EtonOperations and Maintenance Hours & Water Use
Total Operations & Maintenance Water Use (ML)
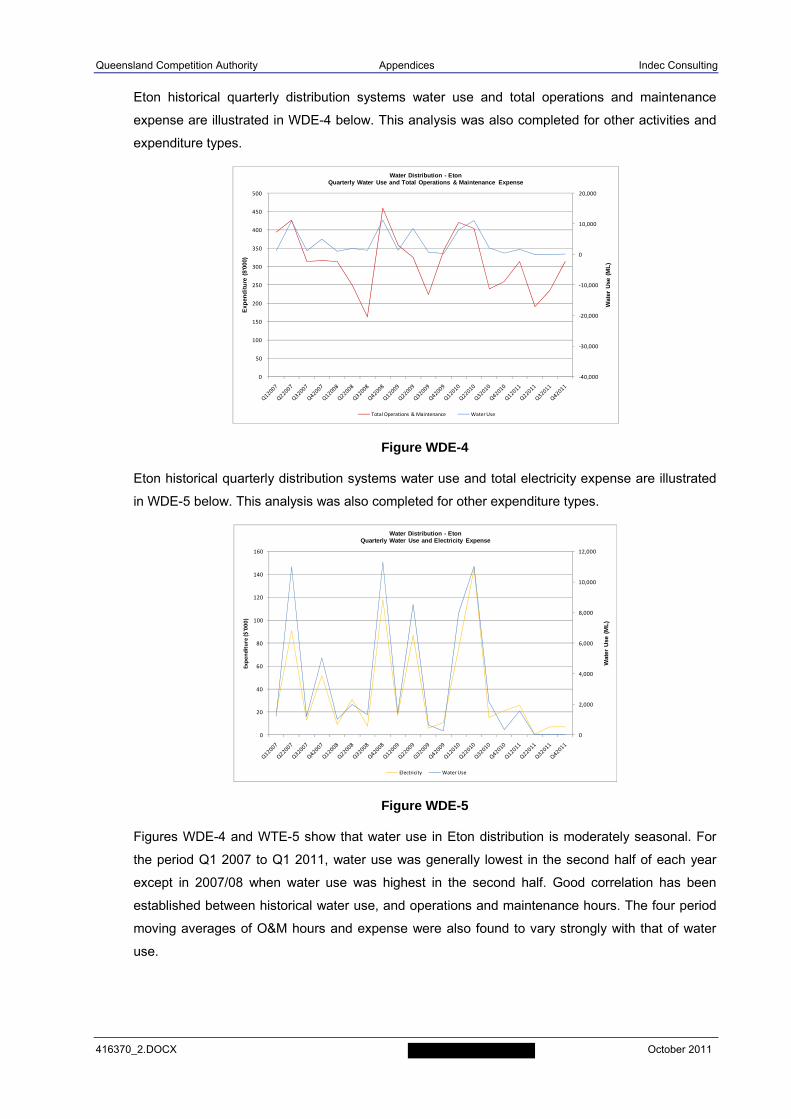
Queensland Competition Authority Appendices Indec Consulting
416370_2.DOCX October 2011
Eton historical quarterly distribution systems water use and total operations and maintenance
expense are illustrated in WDE-4 below. This analysis was also completed for other activities and
expenditure types.
Figure WDE-4
Eton historical quarterly distribution systems water use and total electricity expense are illustrated
in WDE-5 below. This analysis was also completed for other expenditure types.
Figure WDE-5
Figures WDE-4 and WTE-5 show that water use in Eton distribution is moderately seasonal. For
the period Q1 2007 to Q1 2011, water use was generally lowest in the second half of each year
except in 2007/08 when water use was highest in the second half. Good correlation has been
established between historical water use, and operations and maintenance hours. The four period
moving averages of O&M hours and expense were also found to vary strongly with that of water
use.
‐40,000
‐30,000
‐20,000
‐10,000
0
10,000
20,000
0
50
100
150
200
250
300
350
400
450
500
Wat
er U
se (
ML
)
Exp
end
itu
re (
$'00
0)
Water Distribution - EtonQuarterly Water Use and Total Operations & Maintenance Expense
Total Operations & Maintenance Water Use
0
2,000
4,000
6,000
8,000
10,000
12,000
0
20
40
60
80
100
120
140
160
Wat
er U
se (
ML
)
Expenditure ($'000)
Water Distribution - EtonQuarterly Water Use and Electricity Expense
Electricity Water Use
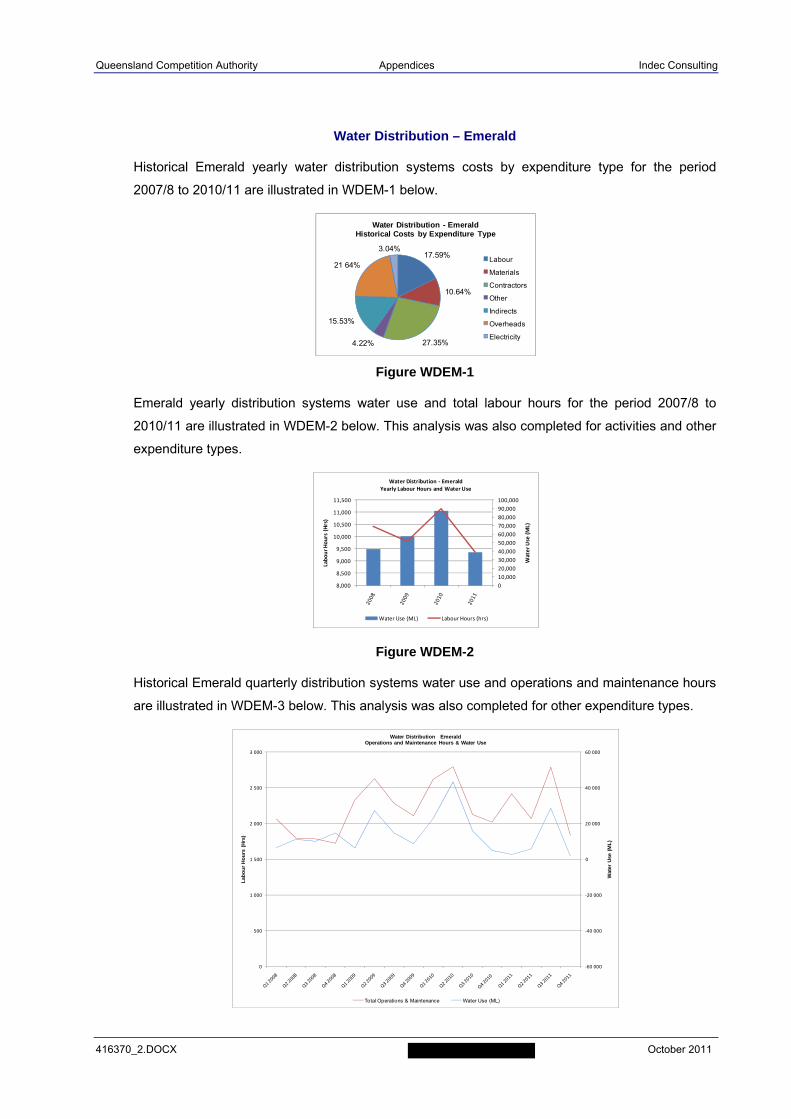
Queensland Competition Authority Appendices Indec Consulting
416370_2.DOCX October 2011
Water Distribution – Emerald
Historical Emerald yearly water distribution systems costs by expenditure type for the period
2007/8 to 2010/11 are illustrated in WDEM-1 below.
Figure WDEM-1
Emerald yearly distribution systems water use and total labour hours for the period 2007/8 to
2010/11 are illustrated in WDEM-2 below. This analysis was also completed for activities and other
expenditure types.
Figure WDEM-2
Historical Emerald quarterly distribution systems water use and operations and maintenance hours
are illustrated in WDEM-3 below. This analysis was also completed for other expenditure types.
17.59%
10.64%
27.35%4.22%
15.53%
21 64%
3.04%
Water Distribution - EmeraldHistorical Costs by Expenditure Type
Labour
Materials
Contractors
Other
Indirects
Overheads
Electricity
0
10,000
20,000
30,000
40,000
50,000
60,000
70,000
80,000
90,000
100,000
8,000
8,500
9,000
9,500
10,000
10,500
11,000
11,500
Water Use (ML)
Labour Hours (Hrs)
Water Distribution ‐ EmeraldYearly Labour Hours and Water Use
Water Use (ML) Labour Hours (hrs)
‐60 000
‐40 000
‐20 000
0
20 000
40 000
60 000
0
500
1 000
1 500
2 000
2 500
3 000
Wat
er U
se (
ML
)
Lab
ou
r H
ou
rs (
Hrs
)
Water Distribution EmeraldOperations and Maintenance Hours & Water Use
Total Operations & Maintenance Water Use (ML)
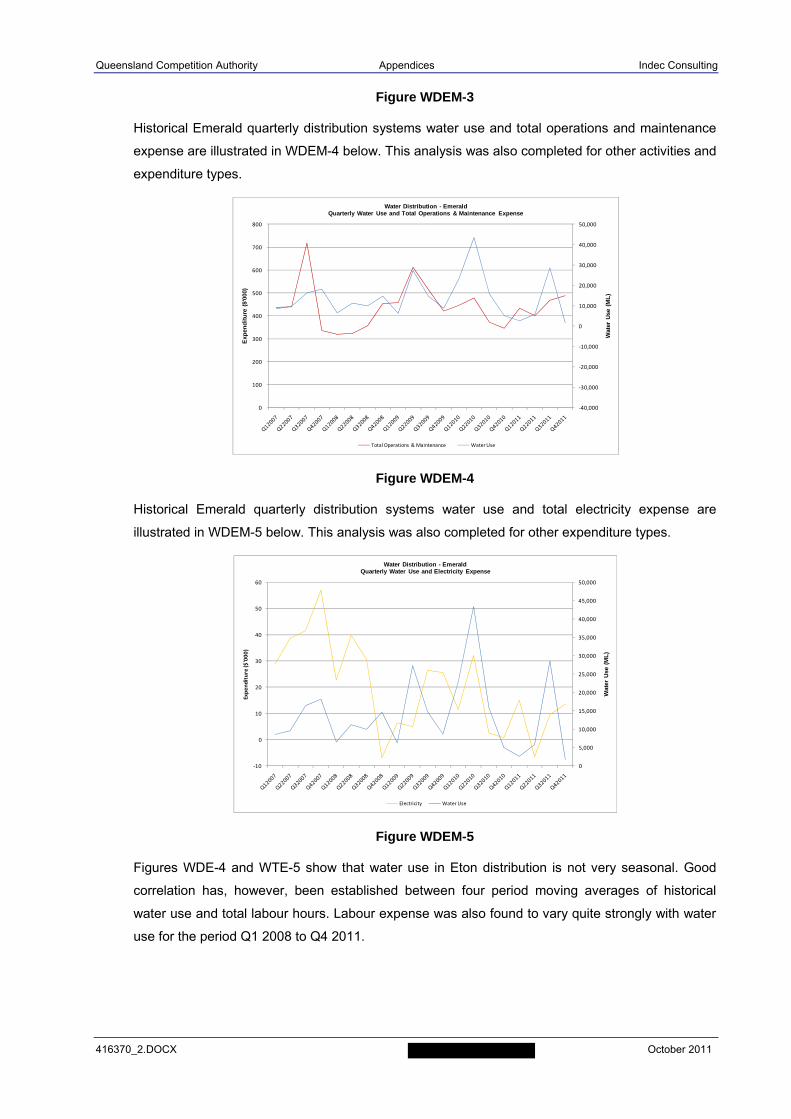
Queensland Competition Authority Appendices Indec Consulting
416370_2.DOCX October 2011
Figure WDEM-3
Historical Emerald quarterly distribution systems water use and total operations and maintenance
expense are illustrated in WDEM-4 below. This analysis was also completed for other activities and
expenditure types.
Figure WDEM-4
Historical Emerald quarterly distribution systems water use and total electricity expense are
illustrated in WDEM-5 below. This analysis was also completed for other expenditure types.
Figure WDEM-5
Figures WDE-4 and WTE-5 show that water use in Eton distribution is not very seasonal. Good
correlation has, however, been established between four period moving averages of historical
water use and total labour hours. Labour expense was also found to vary quite strongly with water
use for the period Q1 2008 to Q4 2011.
‐40,000
‐30,000
‐20,000
‐10,000
0
10,000
20,000
30,000
40,000
50,000
0
100
200
300
400
500
600
700
800
Wat
er U
se (
ML
)
Exp
end
itu
re (
$'00
0)
Water Distribution - EmeraldQuarterly Water Use and Total Operations & Maintenance Expense
Total Operations & Maintenance Water Use
0
5,000
10,000
15,000
20,000
25,000
30,000
35,000
40,000
45,000
50,000
‐10
0
10
20
30
40
50
60
Wat
er U
se (
ML
)
Expenditure ($'000)
Water Distribution - EmeraldQuarterly Water Use and Electricity Expense
Electricity Water Use
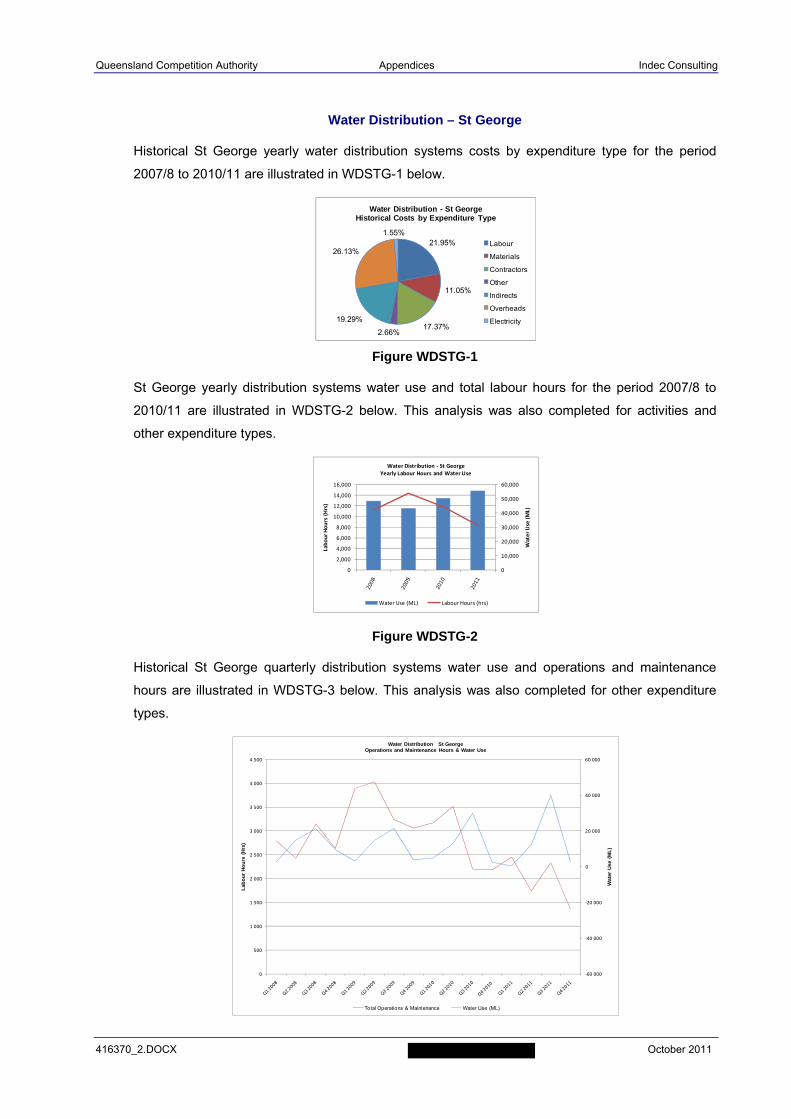
Queensland Competition Authority Appendices Indec Consulting
416370_2.DOCX October 2011
Water Distribution – St George
Historical St George yearly water distribution systems costs by expenditure type for the period
2007/8 to 2010/11 are illustrated in WDSTG-1 below.
Figure WDSTG-1
St George yearly distribution systems water use and total labour hours for the period 2007/8 to
2010/11 are illustrated in WDSTG-2 below. This analysis was also completed for activities and
other expenditure types.
Figure WDSTG-2
Historical St George quarterly distribution systems water use and operations and maintenance
hours are illustrated in WDSTG-3 below. This analysis was also completed for other expenditure
types.
21.95%
11.05%
17.37%2.66%
19.29%
26.13%
1.55%
Water Distribution - St GeorgeHistorical Costs by Expenditure Type
Labour
Materials
Contractors
Other
Indirects
Overheads
Electricity
0
10,000
20,000
30,000
40,000
50,000
60,000
0
2,000
4,000
6,000
8,000
10,000
12,000
14,000
16,000
Water Use (ML)
Labour Hours (Hrs)
Water Distribution ‐ St GeorgeYearly Labour Hours and Water Use
Water Use (ML) Labour Hours (hrs)
‐60 000
‐40 000
‐20 000
0
20 000
40 000
60 000
0
500
1 000
1 500
2 000
2 500
3 000
3 500
4 000
4 500
Wat
er U
se (
ML
)
Lab
ou
r H
ou
rs (
Hrs
)
Water Distribution St GeorgeOperations and Maintenance Hours & Water Use
Total Operations & Maintenance Water Use (ML)
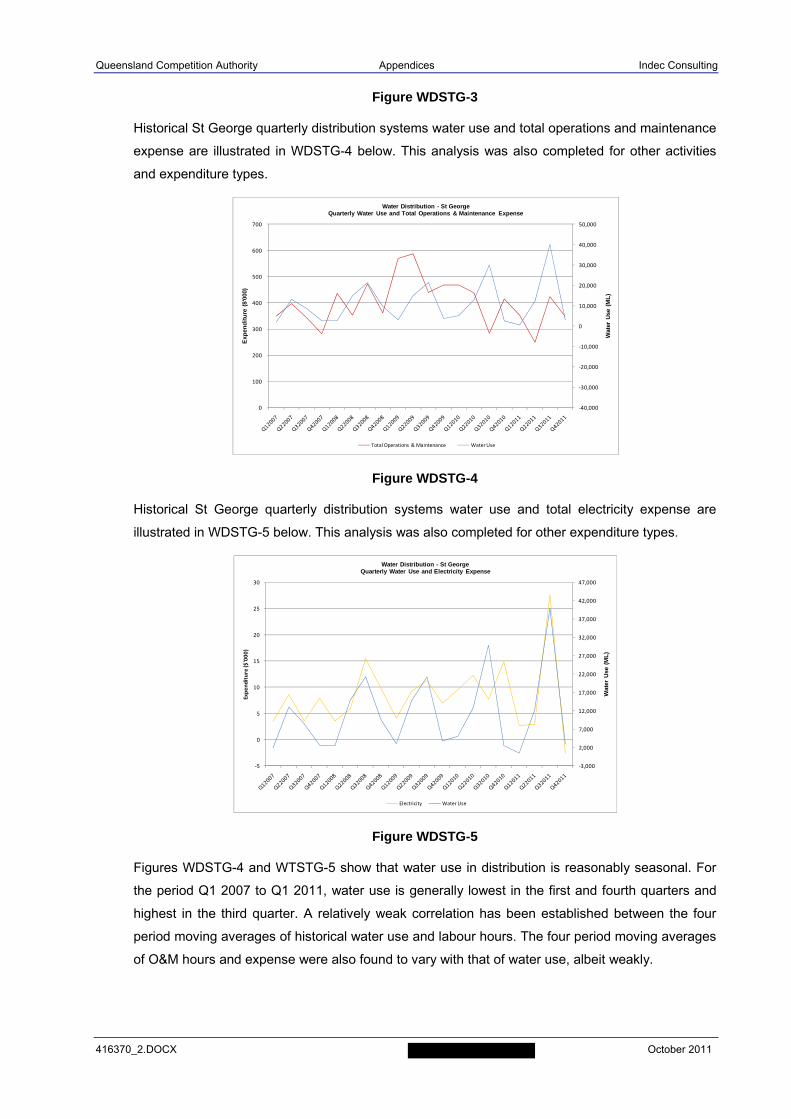
Queensland Competition Authority Appendices Indec Consulting
416370_2.DOCX October 2011
Figure WDSTG-3
Historical St George quarterly distribution systems water use and total operations and maintenance
expense are illustrated in WDSTG-4 below. This analysis was also completed for other activities
and expenditure types.
Figure WDSTG-4
Historical St George quarterly distribution systems water use and total electricity expense are
illustrated in WDSTG-5 below. This analysis was also completed for other expenditure types.
Figure WDSTG-5
Figures WDSTG-4 and WTSTG-5 show that water use in distribution is reasonably seasonal. For
the period Q1 2007 to Q1 2011, water use is generally lowest in the first and fourth quarters and
highest in the third quarter. A relatively weak correlation has been established between the four
period moving averages of historical water use and labour hours. The four period moving averages
of O&M hours and expense were also found to vary with that of water use, albeit weakly.
‐40,000
‐30,000
‐20,000
‐10,000
0
10,000
20,000
30,000
40,000
50,000
0
100
200
300
400
500
600
700
Wat
er U
se (
ML
)
Exp
end
itu
re (
$'00
0)
Water Distribution - St GeorgeQuarterly Water Use and Total Operations & Maintenance Expense
Total Operations & Maintenance Water Use
‐3,000
2,000
7,000
12,000
17,000
22,000
27,000
32,000
37,000
42,000
47,000
‐5
0
5
10
15
20
25
30
Wat
er U
se (
ML
)
Expenditure ($'000)
Water Distribution - St GeorgeQuarterly Water Use and Electricity Expense
Electricity Water Use
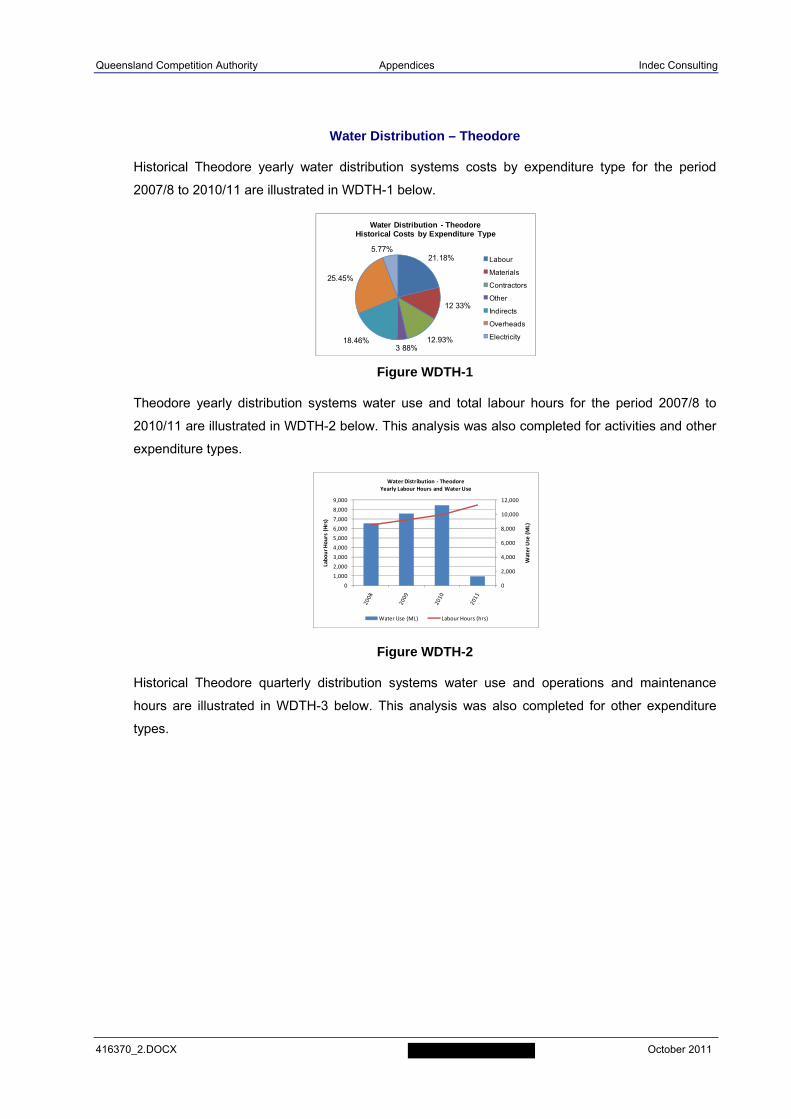
Queensland Competition Authority Appendices Indec Consulting
416370_2.DOCX October 2011
Water Distribution – Theodore
Historical Theodore yearly water distribution systems costs by expenditure type for the period
2007/8 to 2010/11 are illustrated in WDTH-1 below.
Figure WDTH-1
Theodore yearly distribution systems water use and total labour hours for the period 2007/8 to
2010/11 are illustrated in WDTH-2 below. This analysis was also completed for activities and other
expenditure types.
Figure WDTH-2
Historical Theodore quarterly distribution systems water use and operations and maintenance
hours are illustrated in WDTH-3 below. This analysis was also completed for other expenditure
types.
21.18%
12 33%
12.93%3 88%
18.46%
25.45%
5.77%
Water Distribution - TheodoreHistorical Costs by Expenditure Type
Labour
Materials
Contractors
Other
Indirects
Overheads
Electricity
0
2,000
4,000
6,000
8,000
10,000
12,000
0
1,000
2,000
3,000
4,000
5,000
6,000
7,000
8,000
9,000
Water Use (ML)
Labour Hours (Hrs)
Water Distribution ‐ TheodoreYearly Labour Hours and Water Use
Water Use (ML) Labour Hours (hrs)
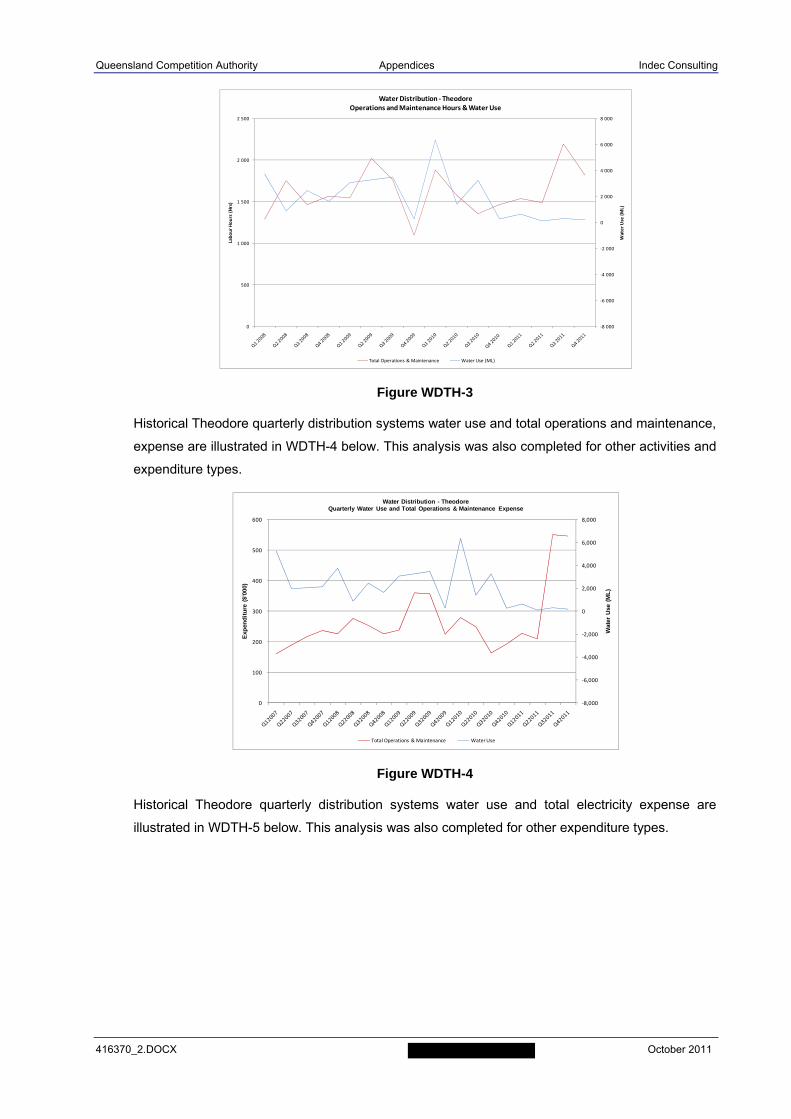
Queensland Competition Authority Appendices Indec Consulting
416370_2.DOCX October 2011
Figure WDTH-3
Historical Theodore quarterly distribution systems water use and total operations and maintenance,
expense are illustrated in WDTH-4 below. This analysis was also completed for other activities and
expenditure types.
Figure WDTH-4
Historical Theodore quarterly distribution systems water use and total electricity expense are
illustrated in WDTH-5 below. This analysis was also completed for other expenditure types.
‐8 000
‐6 000
‐4 000
‐2 000
0
2 000
4 000
6 000
8 000
0
500
1 000
1 500
2 000
2 500
Water Use (ML)
Labour Hours (Hrs)
Water Distribution ‐ TheodoreOperations and Maintenance Hours & Water Use
Total Operations & Maintenance Water Use (ML)
‐8,000
‐6,000
‐4,000
‐2,000
0
2,000
4,000
6,000
8,000
0
100
200
300
400
500
600
Wat
er U
se (
ML
)
Exp
end
itu
re (
$'00
0)
Water Distribution - TheodoreQuarterly Water Use and Total Operations & Maintenance Expense
Total Operations & Maintenance Water Use
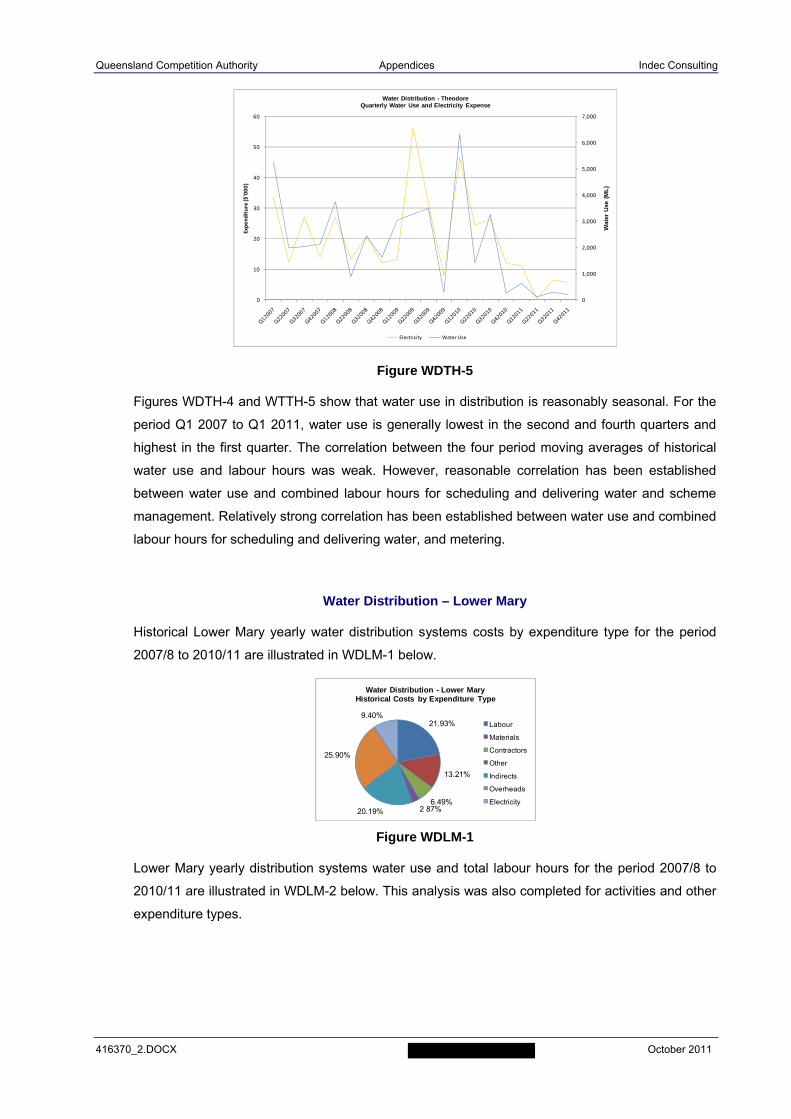
Queensland Competition Authority Appendices Indec Consulting
416370_2.DOCX October 2011
Figure WDTH-5
Figures WDTH-4 and WTTH-5 show that water use in distribution is reasonably seasonal. For the
period Q1 2007 to Q1 2011, water use is generally lowest in the second and fourth quarters and
highest in the first quarter. The correlation between the four period moving averages of historical
water use and labour hours was weak. However, reasonable correlation has been established
between water use and combined labour hours for scheduling and delivering water and scheme
management. Relatively strong correlation has been established between water use and combined
labour hours for scheduling and delivering water, and metering.
Water Distribution – Lower Mary
Historical Lower Mary yearly water distribution systems costs by expenditure type for the period
2007/8 to 2010/11 are illustrated in WDLM-1 below.
Figure WDLM-1
Lower Mary yearly distribution systems water use and total labour hours for the period 2007/8 to
2010/11 are illustrated in WDLM-2 below. This analysis was also completed for activities and other
expenditure types.
0
1,000
2,000
3,000
4,000
5,000
6,000
7,000
0
10
20
30
40
50
60
Wat
er U
se (
ML
)
Expenditure ($'000)
Water Distribution - TheodoreQuarterly Water Use and Electricity Expense
Electricity Water Use
21.93%
13.21%
6.49%2 87%20.19%
25.90%
9.40%
Water Distribution - Lower MaryHistorical Costs by Expenditure Type
Labour
Materials
Contractors
Other
Indirects
Overheads
Electricity
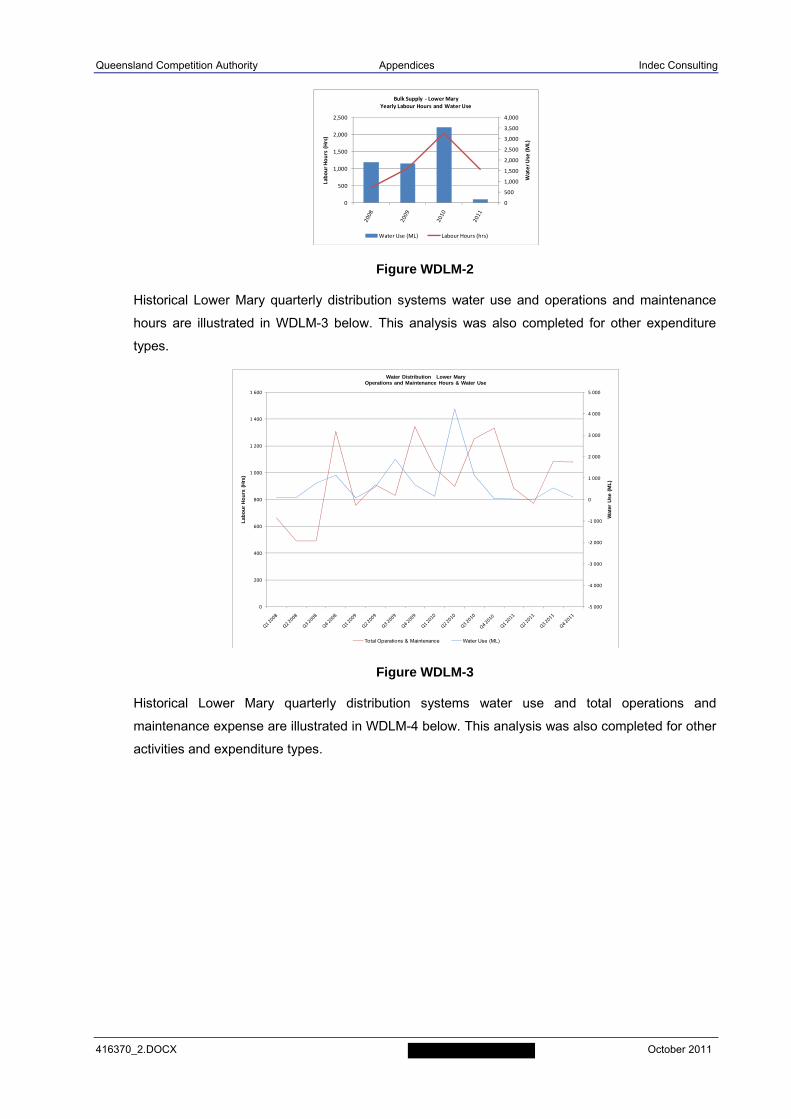
Queensland Competition Authority Appendices Indec Consulting
416370_2.DOCX October 2011
Figure WDLM-2
Historical Lower Mary quarterly distribution systems water use and operations and maintenance
hours are illustrated in WDLM-3 below. This analysis was also completed for other expenditure
types.
Figure WDLM-3
Historical Lower Mary quarterly distribution systems water use and total operations and
maintenance expense are illustrated in WDLM-4 below. This analysis was also completed for other
activities and expenditure types.
0
500
1,000
1,500
2,000
2,500
3,000
3,500
4,000
0
500
1,000
1,500
2,000
2,500
Water Use (ML)
Labour Hours (Hrs)
Bulk Supply ‐ Lower MaryYearly Labour Hours and Water Use
Water Use (ML) Labour Hours (hrs)
‐5 000
‐4 000
‐3 000
‐2 000
‐1 000
0
1 000
2 000
3 000
4 000
5 000
0
200
400
600
800
1 000
1 200
1 400
1 600
Wat
er U
se (
ML
)
Lab
ou
r H
ou
rs (
Hrs
)
Water Distribution Lower MaryOperations and Maintenance Hours & Water Use
Total Operations & Maintenance Water Use (ML)
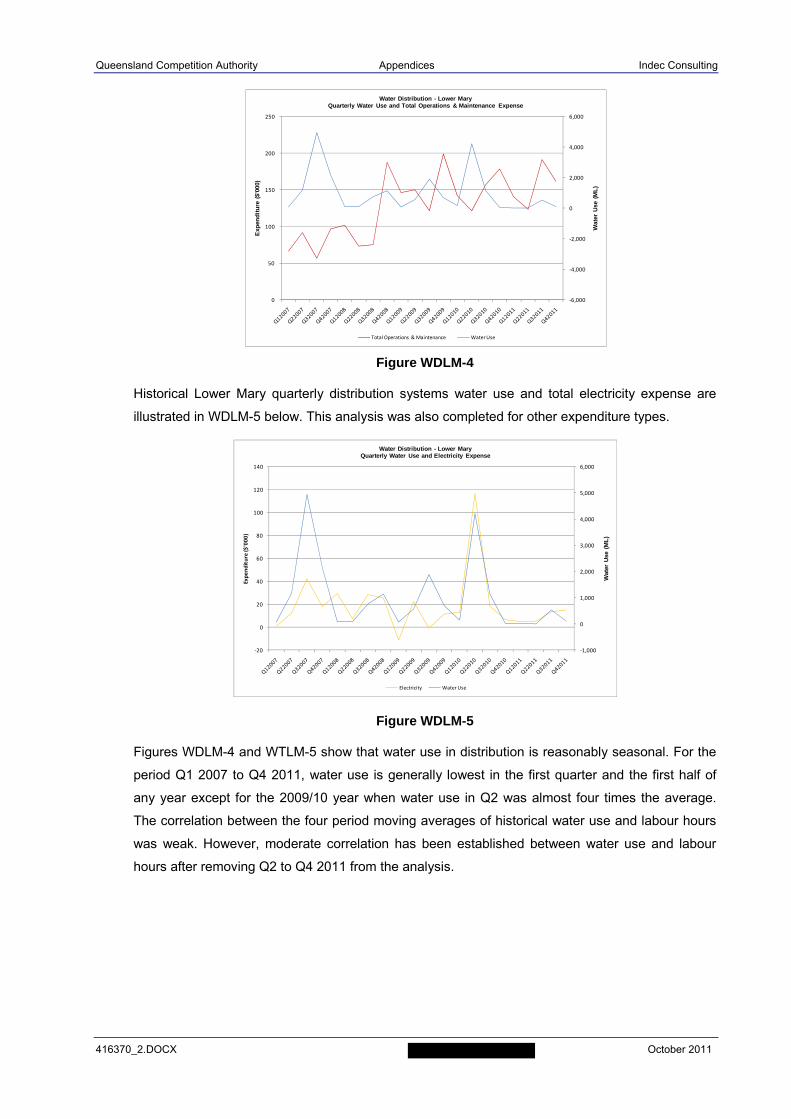
Queensland Competition Authority Appendices Indec Consulting
416370_2.DOCX October 2011
Figure WDLM-4
Historical Lower Mary quarterly distribution systems water use and total electricity expense are
illustrated in WDLM-5 below. This analysis was also completed for other expenditure types.
Figure WDLM-5
Figures WDLM-4 and WTLM-5 show that water use in distribution is reasonably seasonal. For the
period Q1 2007 to Q4 2011, water use is generally lowest in the first quarter and the first half of
any year except for the 2009/10 year when water use in Q2 was almost four times the average.
The correlation between the four period moving averages of historical water use and labour hours
was weak. However, moderate correlation has been established between water use and labour
hours after removing Q2 to Q4 2011 from the analysis.
‐6,000
‐4,000
‐2,000
0
2,000
4,000
6,000
0
50
100
150
200
250
Wat
er U
se (
ML
)
Exp
end
itu
re (
$'00
0)
Water Distribution - Lower MaryQuarterly Water Use and Total Operations & Maintenance Expense
Total Operations & Maintenance Water Use
‐1,000
0
1,000
2,000
3,000
4,000
5,000
6,000
‐20
0
20
40
60
80
100
120
140
Wat
er U
se (
ML
)
Expenditure ($'000)
Water Distribution - Lower MaryQuarterly Water Use and Electricity Expense
Electricity Water Use

Queensland Competition Authority Appendices Indec Consulting
416370_2.DOCX October 2011
APPENDIX H
Historical Cost Analysis
Bulk Supply Systems
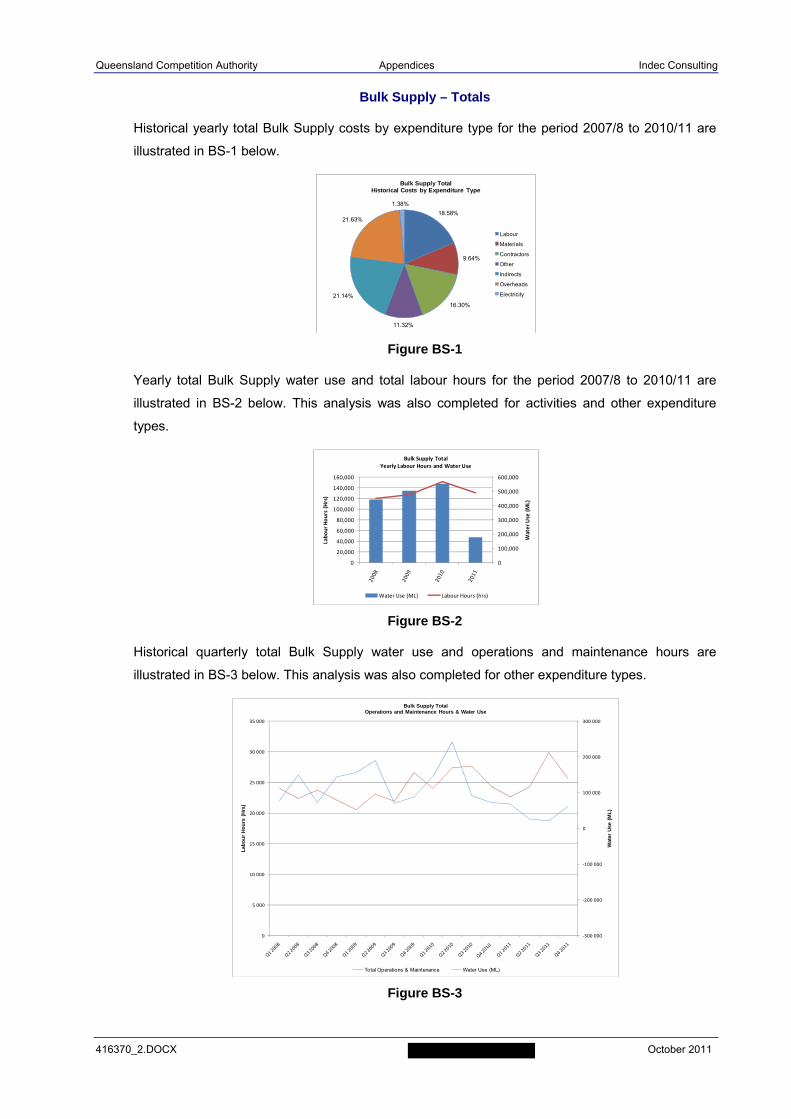
Queensland Competition Authority Appendices Indec Consulting
416370_2.DOCX October 2011
Bulk Supply – Totals
Historical yearly total Bulk Supply costs by expenditure type for the period 2007/8 to 2010/11 are
illustrated in BS-1 below.
Figure BS-1
Yearly total Bulk Supply water use and total labour hours for the period 2007/8 to 2010/11 are
illustrated in BS-2 below. This analysis was also completed for activities and other expenditure
types.
Figure BS-2
Historical quarterly total Bulk Supply water use and operations and maintenance hours are
illustrated in BS-3 below. This analysis was also completed for other expenditure types.
Figure BS-3
18.58%
9.64%
16.30%
11.32%
21.14%
21.63%
1.38%
Bulk Supply TotalHistorical Costs by Expenditure Type
Labour
Materials
Contractors
Other
Indirects
Overheads
Electricity
0
100,000
200,000
300,000
400,000
500,000
600,000
0
20,000
40,000
60,000
80,000
100,000
120,000
140,000
160,000
Water Use (ML)
Labour Hours (Hrs)
Bulk Supply TotalYearly Labour Hours and Water Use
Water Use (ML) Labour Hours (hrs)
‐300 000
‐200 000
‐100 000
0
100 000
200 000
300 000
0
5 000
10 000
15 000
20 000
25 000
30 000
35 000
Wat
er U
se (
ML
)
Lab
ou
r H
ou
rs (
Hrs
)
Bulk Supply TotalOperations and Maintenance Hours & Water Use
Total Operations & Maintenance Water Use (ML)
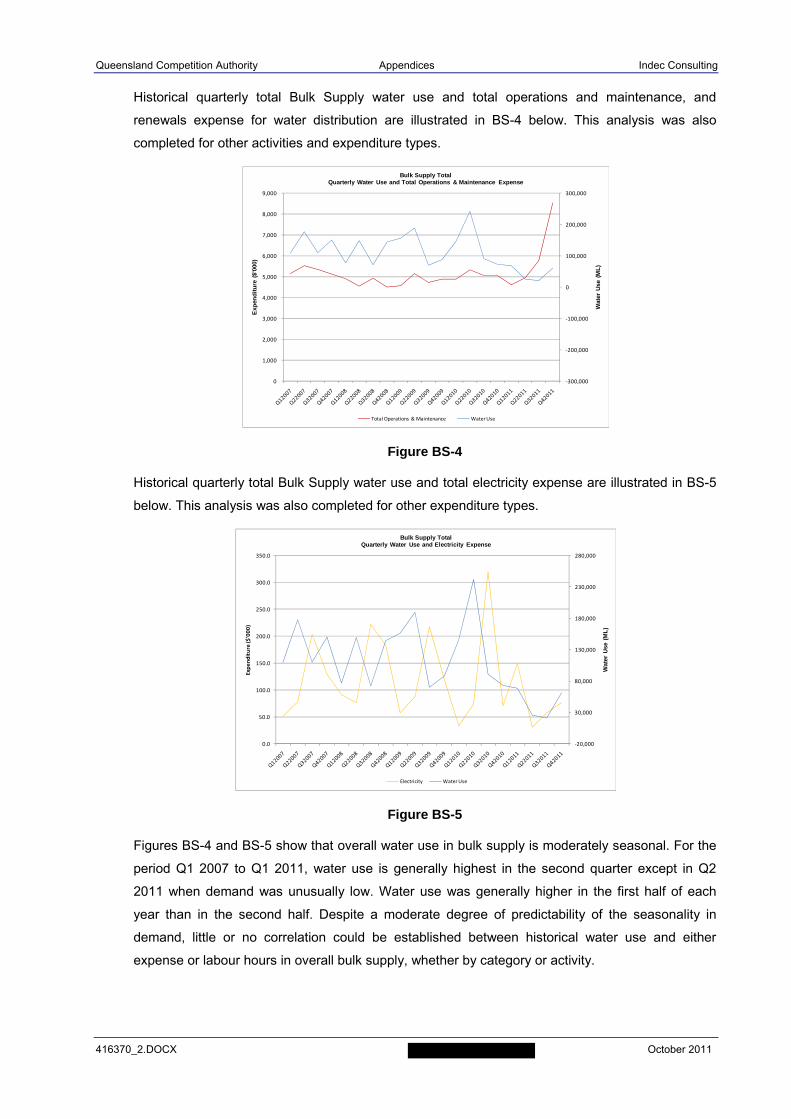
Queensland Competition Authority Appendices Indec Consulting
416370_2.DOCX October 2011
Historical quarterly total Bulk Supply water use and total operations and maintenance, and
renewals expense for water distribution are illustrated in BS-4 below. This analysis was also
completed for other activities and expenditure types.
Figure BS-4
Historical quarterly total Bulk Supply water use and total electricity expense are illustrated in BS-5
below. This analysis was also completed for other expenditure types.
Figure BS-5
Figures BS-4 and BS-5 show that overall water use in bulk supply is moderately seasonal. For the
period Q1 2007 to Q1 2011, water use is generally highest in the second quarter except in Q2
2011 when demand was unusually low. Water use was generally higher in the first half of each
year than in the second half. Despite a moderate degree of predictability of the seasonality in
demand, little or no correlation could be established between historical water use and either
expense or labour hours in overall bulk supply, whether by category or activity.
‐300,000
‐200,000
‐100,000
0
100,000
200,000
300,000
0
1,000
2,000
3,000
4,000
5,000
6,000
7,000
8,000
9,000
Wat
er U
se (
ML
)
Exp
end
itu
re (
$'00
0)
Bulk Supply TotalQuarterly Water Use and Total Operations & Maintenance Expense
Total Operations & Maintenance Water Use
‐20,000
30,000
80,000
130,000
180,000
230,000
280,000
0.0
50.0
100.0
150.0
200.0
250.0
300.0
350.0
Wat
er U
se (
ML
)
Expenditure ($'000)
Bulk Supply TotalQuarterly Water Use and Electricity Expense
Electricity Water Use
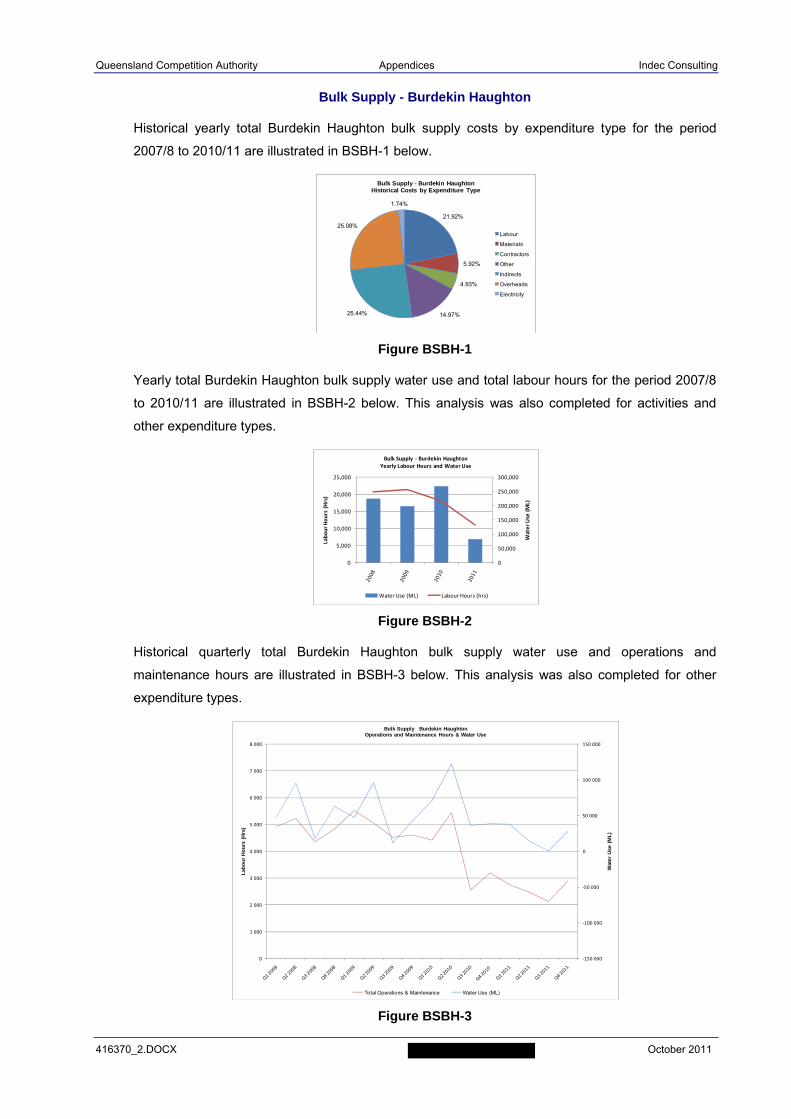
Queensland Competition Authority Appendices Indec Consulting
416370_2.DOCX October 2011
Bulk Supply - Burdekin Haughton
Historical yearly total Burdekin Haughton bulk supply costs by expenditure type for the period
2007/8 to 2010/11 are illustrated in BSBH-1 below.
Figure BSBH-1
Yearly total Burdekin Haughton bulk supply water use and total labour hours for the period 2007/8
to 2010/11 are illustrated in BSBH-2 below. This analysis was also completed for activities and
other expenditure types.
Figure BSBH-2
Historical quarterly total Burdekin Haughton bulk supply water use and operations and
maintenance hours are illustrated in BSBH-3 below. This analysis was also completed for other
expenditure types.
Figure BSBH-3
21.92%
5.92%
4.93%
14.97%25.44%
25.08%
1.74%
Bulk Supply - Burdekin HaughtonHistorical Costs by Expenditure Type
Labour
Materials
Contractors
Other
Indirects
Overheads
Electricity
0
50,000
100,000
150,000
200,000
250,000
300,000
0
5,000
10,000
15,000
20,000
25,000
Water Use (ML)
Labour Hours (Hrs)
Bulk Supply ‐ Burdekin HaughtonYearly Labour Hours and Water Use
Water Use (ML) Labour Hours (hrs)
‐150 000
‐100 000
‐50 000
0
50 000
100 000
150 000
0
1 000
2 000
3 000
4 000
5 000
6 000
7 000
8 000
Wat
er U
se (
ML
)
Lab
ou
r H
ou
rs (
Hrs
)
Bulk Supply Burdekin HaughtonOperations and Maintenance Hours & Water Use
Total Operations & Maintenance Water Use (ML)
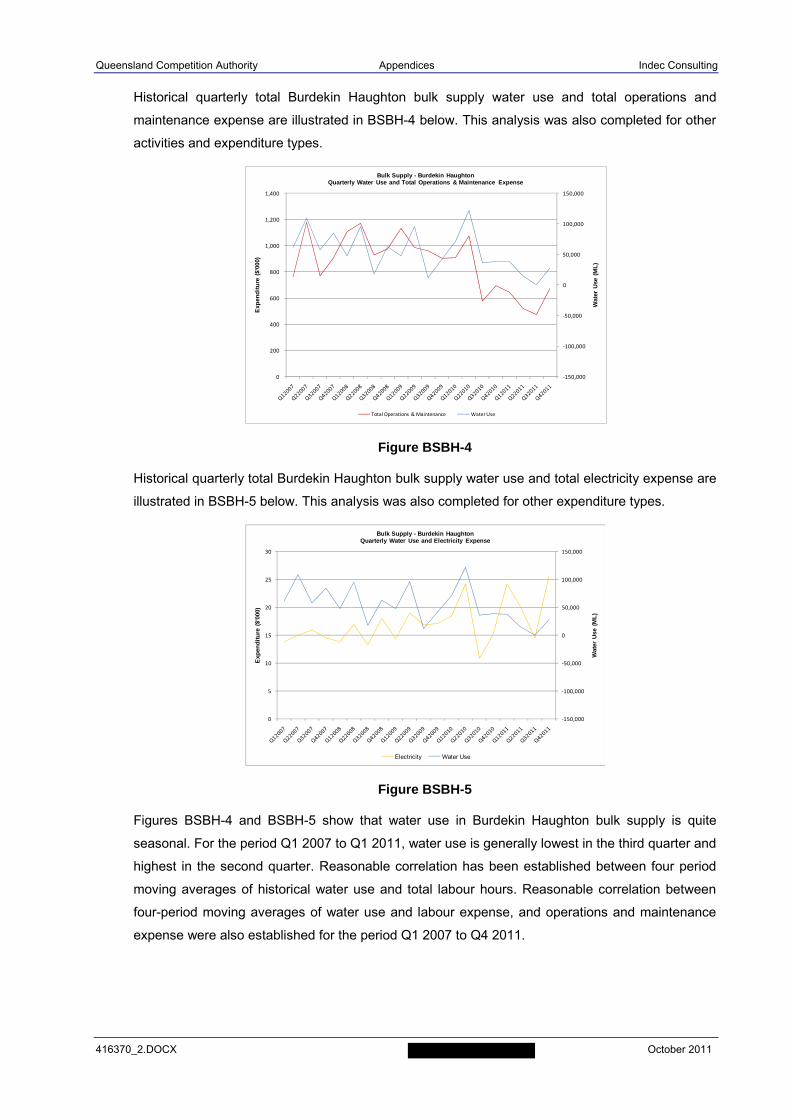
Queensland Competition Authority Appendices Indec Consulting
416370_2.DOCX October 2011
Historical quarterly total Burdekin Haughton bulk supply water use and total operations and
maintenance expense are illustrated in BSBH-4 below. This analysis was also completed for other
activities and expenditure types.
Figure BSBH-4
Historical quarterly total Burdekin Haughton bulk supply water use and total electricity expense are
illustrated in BSBH-5 below. This analysis was also completed for other expenditure types.
Figure BSBH-5
Figures BSBH-4 and BSBH-5 show that water use in Burdekin Haughton bulk supply is quite
seasonal. For the period Q1 2007 to Q1 2011, water use is generally lowest in the third quarter and
highest in the second quarter. Reasonable correlation has been established between four period
moving averages of historical water use and total labour hours. Reasonable correlation between
four-period moving averages of water use and labour expense, and operations and maintenance
expense were also established for the period Q1 2007 to Q4 2011.
‐150,000
‐100,000
‐50,000
0
50,000
100,000
150,000
0
200
400
600
800
1,000
1,200
1,400
Wat
er U
se (
ML
)
Exp
end
itu
re (
$'00
0)
Bulk Supply - Burdekin HaughtonQuarterly Water Use and Total Operations & Maintenance Expense
Total Operations & Maintenance Water Use
‐150,000
‐100,000
‐50,000
0
50,000
100,000
150,000
0
5
10
15
20
25
30
Wat
er U
se (
ML
)
Exp
end
itu
re (
$'00
0)
Bulk Supply - Burdekin HaughtonQuarterly Water Use and Electricity Expense
Electricity Water Use
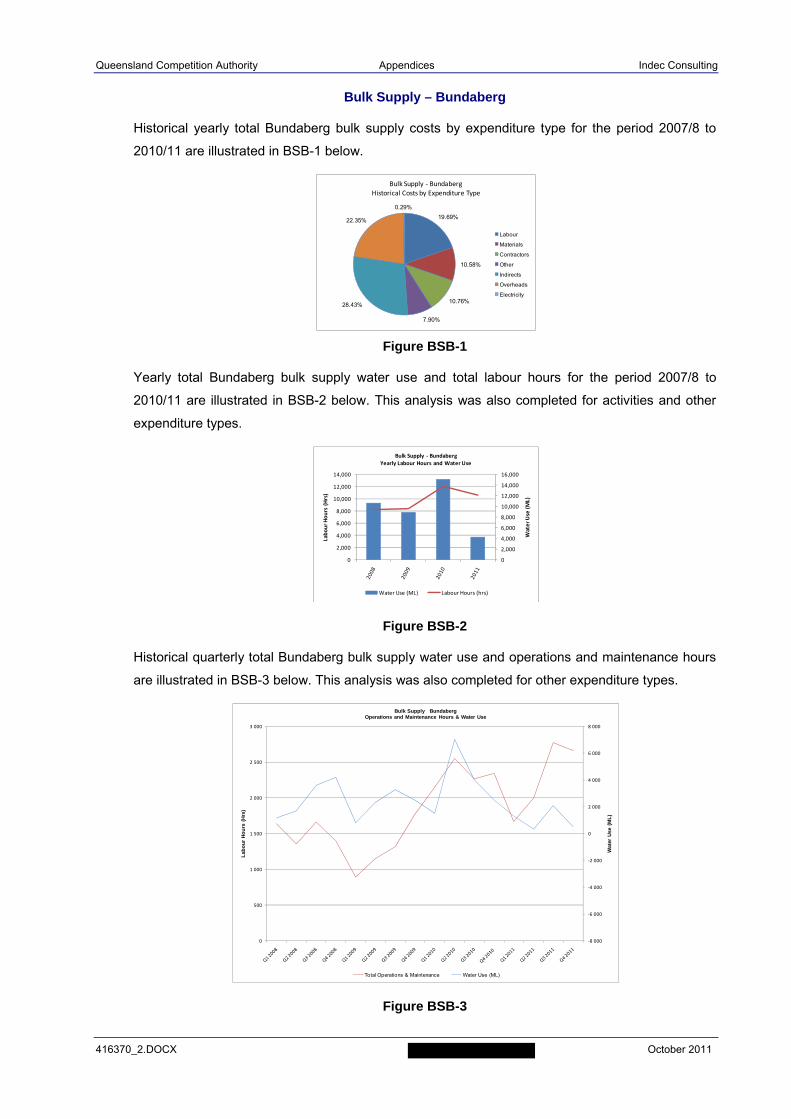
Queensland Competition Authority Appendices Indec Consulting
416370_2.DOCX October 2011
Bulk Supply – Bundaberg
Historical yearly total Bundaberg bulk supply costs by expenditure type for the period 2007/8 to
2010/11 are illustrated in BSB-1 below.
Figure BSB-1
Yearly total Bundaberg bulk supply water use and total labour hours for the period 2007/8 to
2010/11 are illustrated in BSB-2 below. This analysis was also completed for activities and other
expenditure types.
Figure BSB-2
Historical quarterly total Bundaberg bulk supply water use and operations and maintenance hours
are illustrated in BSB-3 below. This analysis was also completed for other expenditure types.
Figure BSB-3
19.69%
10.58%
10.76%
7.90%
28.43%
22.35%
0.29%
Bulk Supply ‐ BundabergHistorical Costs by Expenditure Type
Labour
Materials
Contractors
Other
Indirects
Overheads
Electricity
0
2,000
4,000
6,000
8,000
10,000
12,000
14,000
16,000
0
2,000
4,000
6,000
8,000
10,000
12,000
14,000
Water Use (ML)
Labour Hours (Hrs)
Bulk Supply ‐ BundabergYearly Labour Hours and Water Use
Water Use (ML) Labour Hours (hrs)
‐8 000
‐6 000
‐4 000
‐2 000
0
2 000
4 000
6 000
8 000
0
500
1 000
1 500
2 000
2 500
3 000
Wat
er U
se (
ML
)
Lab
ou
r H
ou
rs (
Hrs
)
Bulk Supply BundabergOperations and Maintenance Hours & Water Use
Total Operations & Maintenance Water Use (ML)
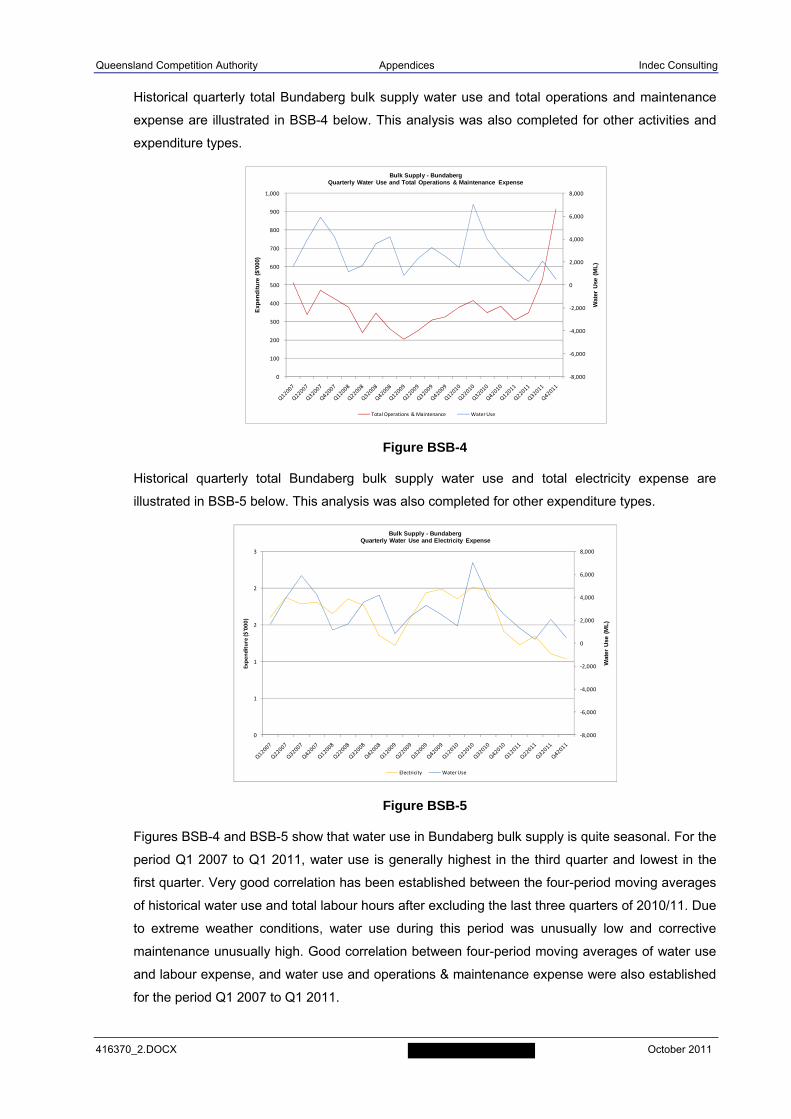
Queensland Competition Authority Appendices Indec Consulting
416370_2.DOCX October 2011
Historical quarterly total Bundaberg bulk supply water use and total operations and maintenance
expense are illustrated in BSB-4 below. This analysis was also completed for other activities and
expenditure types.
Figure BSB-4
Historical quarterly total Bundaberg bulk supply water use and total electricity expense are
illustrated in BSB-5 below. This analysis was also completed for other expenditure types.
Figure BSB-5
Figures BSB-4 and BSB-5 show that water use in Bundaberg bulk supply is quite seasonal. For the
period Q1 2007 to Q1 2011, water use is generally highest in the third quarter and lowest in the
first quarter. Very good correlation has been established between the four-period moving averages
of historical water use and total labour hours after excluding the last three quarters of 2010/11. Due
to extreme weather conditions, water use during this period was unusually low and corrective
maintenance unusually high. Good correlation between four-period moving averages of water use
and labour expense, and water use and operations & maintenance expense were also established
for the period Q1 2007 to Q1 2011.
‐8,000
‐6,000
‐4,000
‐2,000
0
2,000
4,000
6,000
8,000
0
100
200
300
400
500
600
700
800
900
1,000
Wat
er U
se (
ML
)
Exp
end
itu
re (
$'00
0)
Bulk Supply - BundabergQuarterly Water Use and Total Operations & Maintenance Expense
Total Operations & Maintenance Water Use
‐8,000
‐6,000
‐4,000
‐2,000
0
2,000
4,000
6,000
8,000
0
1
1
2
2
3
Wat
er U
se (
ML
)
Expenditure ($'000)
Bulk Supply - BundabergQuarterly Water Use and Electricity Expense
Electricity Water Use
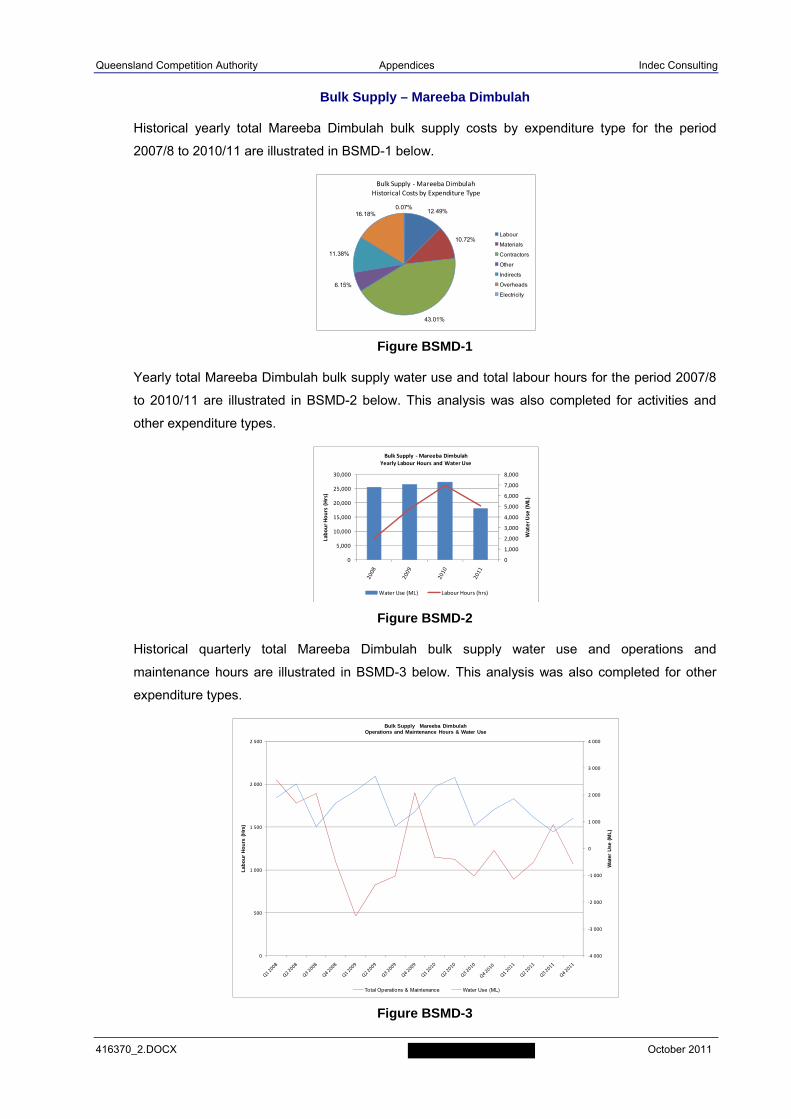
Queensland Competition Authority Appendices Indec Consulting
416370_2.DOCX October 2011
Bulk Supply – Mareeba Dimbulah
Historical yearly total Mareeba Dimbulah bulk supply costs by expenditure type for the period
2007/8 to 2010/11 are illustrated in BSMD-1 below.
Figure BSMD-1
Yearly total Mareeba Dimbulah bulk supply water use and total labour hours for the period 2007/8
to 2010/11 are illustrated in BSMD-2 below. This analysis was also completed for activities and
other expenditure types.
Figure BSMD-2
Historical quarterly total Mareeba Dimbulah bulk supply water use and operations and
maintenance hours are illustrated in BSMD-3 below. This analysis was also completed for other
expenditure types.
Figure BSMD-3
12.49%
10.72%
43.01%
6.15%
11.38%
16.18%0.07%
Bulk Supply ‐Mareeba DimbulahHistorical Costs by Expenditure Type
Labour
Materials
Contractors
Other
Indirects
Overheads
Electricity
0
1,000
2,000
3,000
4,000
5,000
6,000
7,000
8,000
0
5,000
10,000
15,000
20,000
25,000
30,000
Water Use (ML)
Labour Hours (Hrs)
Bulk Supply ‐Mareeba DimbulahYearly Labour Hours and Water Use
Water Use (ML) Labour Hours (hrs)
‐4 000
‐3 000
‐2 000
‐1 000
0
1 000
2 000
3 000
4 000
0
500
1 000
1 500
2 000
2 500
Wat
er U
se (
ML
)
Lab
ou
r H
ou
rs (
Hrs
)
Bulk Supply Mareeba DimbulahOperations and Maintenance Hours & Water Use
Total Operations & Maintenance Water Use (ML)
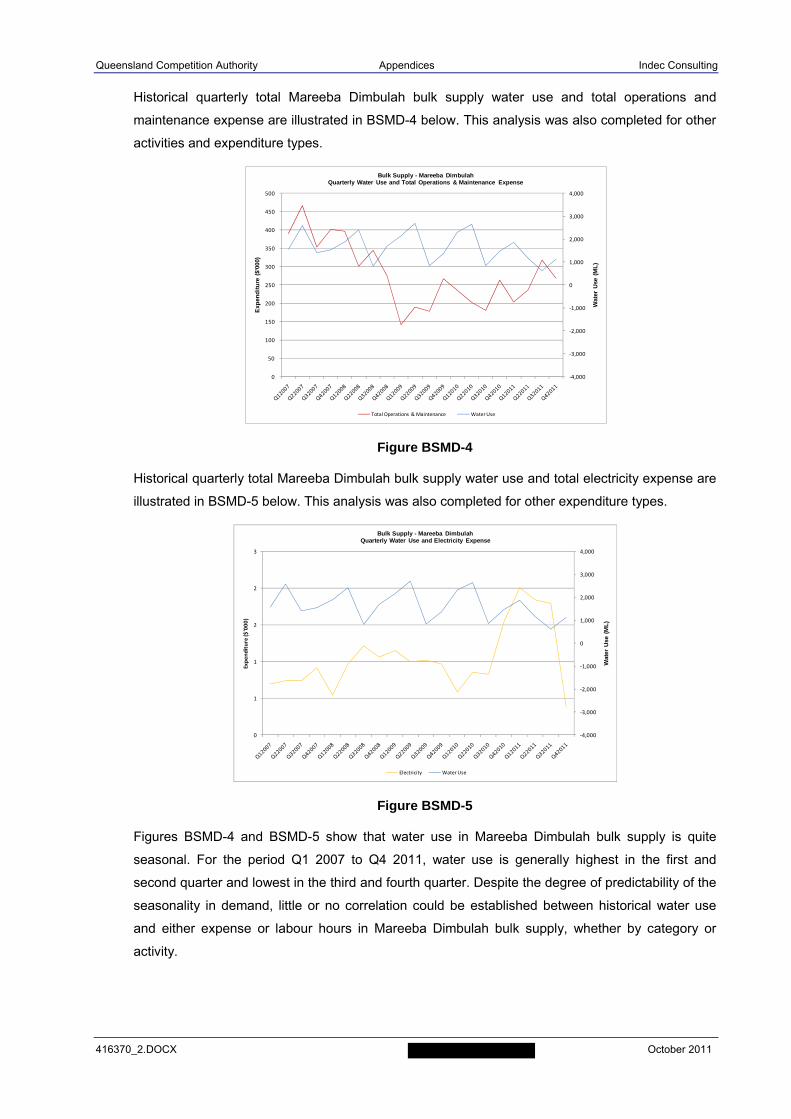
Queensland Competition Authority Appendices Indec Consulting
416370_2.DOCX October 2011
Historical quarterly total Mareeba Dimbulah bulk supply water use and total operations and
maintenance expense are illustrated in BSMD-4 below. This analysis was also completed for other
activities and expenditure types.
Figure BSMD-4
Historical quarterly total Mareeba Dimbulah bulk supply water use and total electricity expense are
illustrated in BSMD-5 below. This analysis was also completed for other expenditure types.
Figure BSMD-5
Figures BSMD-4 and BSMD-5 show that water use in Mareeba Dimbulah bulk supply is quite
seasonal. For the period Q1 2007 to Q4 2011, water use is generally highest in the first and
second quarter and lowest in the third and fourth quarter. Despite the degree of predictability of the
seasonality in demand, little or no correlation could be established between historical water use
and either expense or labour hours in Mareeba Dimbulah bulk supply, whether by category or
activity.
‐4,000
‐3,000
‐2,000
‐1,000
0
1,000
2,000
3,000
4,000
0
50
100
150
200
250
300
350
400
450
500
Wat
er U
se (
ML
)
Exp
end
itu
re (
$'00
0)
Bulk Supply - Mareeba DimbulahQuarterly Water Use and Total Operations & Maintenance Expense
Total Operations & Maintenance Water Use
‐4,000
‐3,000
‐2,000
‐1,000
0
1,000
2,000
3,000
4,000
0
1
1
2
2
3
Wat
er U
se (
ML
)
Expenditure ($'000)
Bulk Supply - Mareeba DimbulahQuarterly Water Use and Electricity Expense
Electricity Water Use
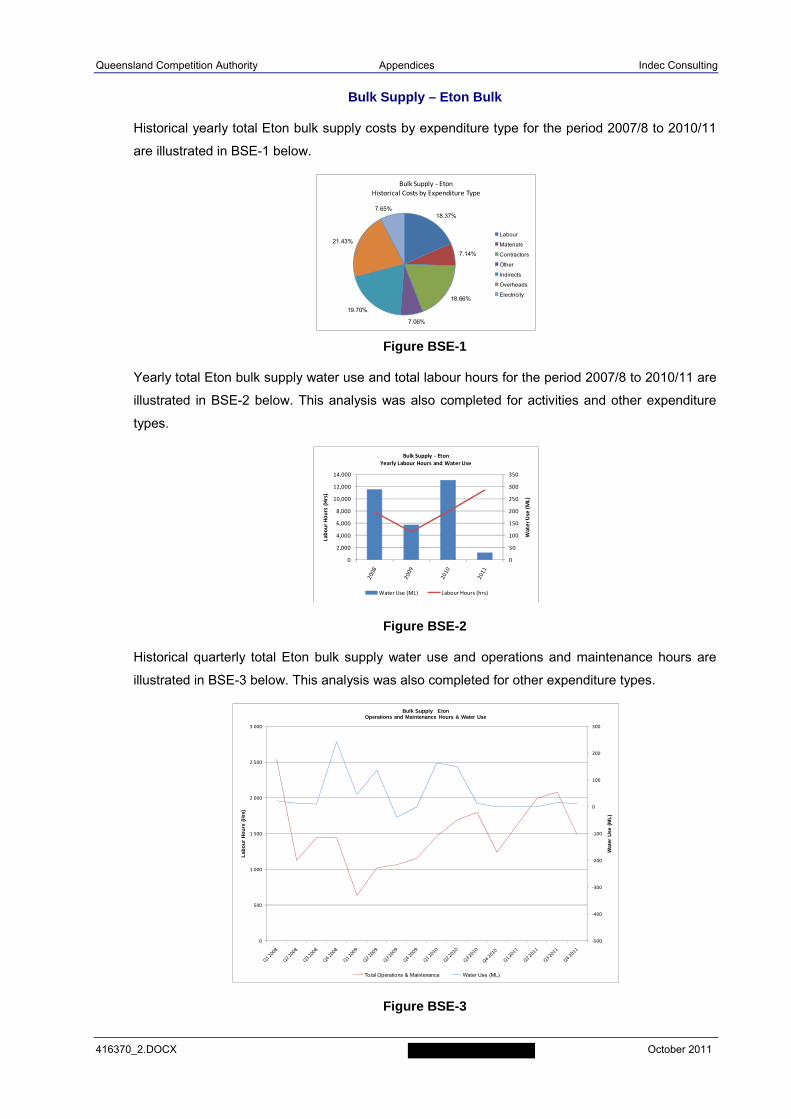
Queensland Competition Authority Appendices Indec Consulting
416370_2.DOCX October 2011
Bulk Supply – Eton Bulk
Historical yearly total Eton bulk supply costs by expenditure type for the period 2007/8 to 2010/11
are illustrated in BSE-1 below.
Figure BSE-1
Yearly total Eton bulk supply water use and total labour hours for the period 2007/8 to 2010/11 are
illustrated in BSE-2 below. This analysis was also completed for activities and other expenditure
types.
Figure BSE-2
Historical quarterly total Eton bulk supply water use and operations and maintenance hours are
illustrated in BSE-3 below. This analysis was also completed for other expenditure types.
Figure BSE-3
18.37%
7.14%
18.66%
7.06%
19.70%
21.43%
7.65%
Bulk Supply ‐ EtonHistorical Costs by Expenditure Type
Labour
Materials
Contractors
Other
Indirects
Overheads
Electricity
0
50
100
150
200
250
300
350
0
2,000
4,000
6,000
8,000
10,000
12,000
14,000
Water Use (ML)
Labour Hours (Hrs)
Bulk Supply ‐ EtonYearly Labour Hours and Water Use
Water Use (ML) Labour Hours (hrs)
‐500
‐400
‐300
‐200
‐100
0
100
200
300
0
500
1 000
1 500
2 000
2 500
3 000
Wat
er U
se (
ML
)
Lab
ou
r H
ou
rs (
Hrs
)
Bulk Supply EtonOperations and Maintenance Hours & Water Use
Total Operations & Maintenance Water Use (ML)
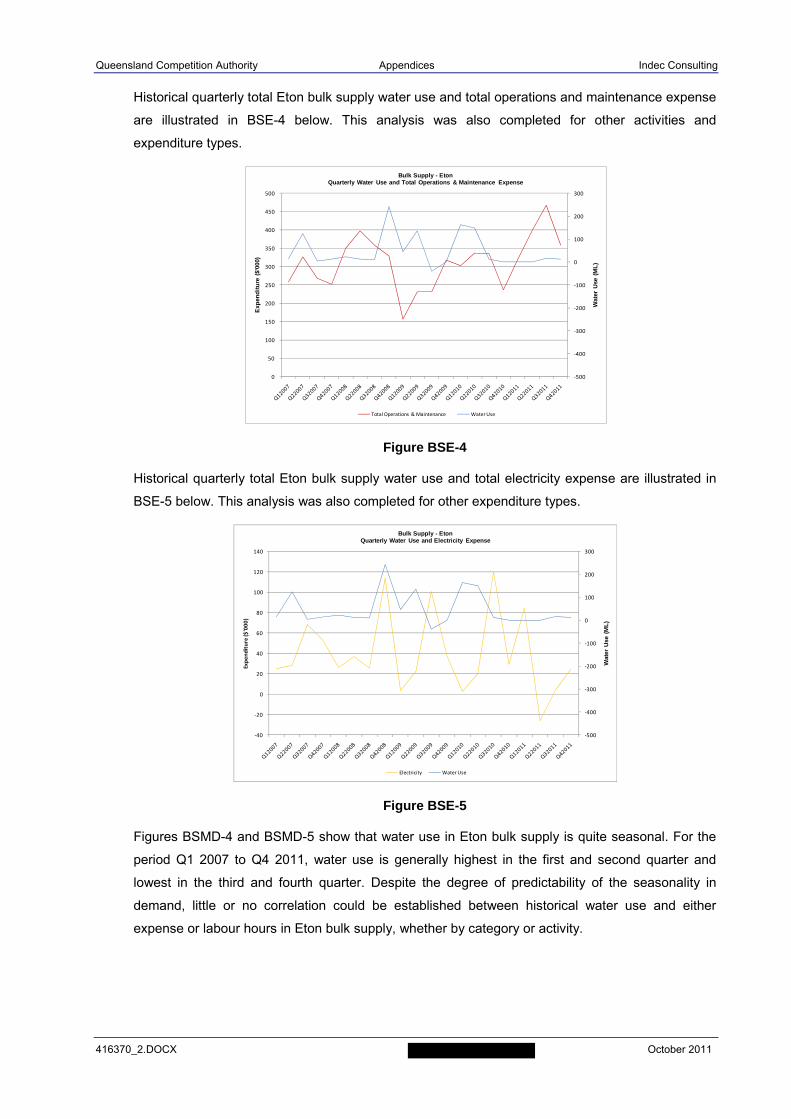
Queensland Competition Authority Appendices Indec Consulting
416370_2.DOCX October 2011
Historical quarterly total Eton bulk supply water use and total operations and maintenance expense
are illustrated in BSE-4 below. This analysis was also completed for other activities and
expenditure types.
Figure BSE-4
Historical quarterly total Eton bulk supply water use and total electricity expense are illustrated in
BSE-5 below. This analysis was also completed for other expenditure types.
Figure BSE-5
Figures BSMD-4 and BSMD-5 show that water use in Eton bulk supply is quite seasonal. For the
period Q1 2007 to Q4 2011, water use is generally highest in the first and second quarter and
lowest in the third and fourth quarter. Despite the degree of predictability of the seasonality in
demand, little or no correlation could be established between historical water use and either
expense or labour hours in Eton bulk supply, whether by category or activity.
‐500
‐400
‐300
‐200
‐100
0
100
200
300
0
50
100
150
200
250
300
350
400
450
500
Wat
er U
se (
ML
)
Exp
end
itu
re (
$'00
0)
Bulk Supply - EtonQuarterly Water Use and Total Operations & Maintenance Expense
Total Operations & Maintenance Water Use
‐500
‐400
‐300
‐200
‐100
0
100
200
300
‐40
‐20
0
20
40
60
80
100
120
140
Wat
er U
se (
ML
)
Expenditure ($'000)
Bulk Supply - EtonQuarterly Water Use and Electricity Expense
Electricity Water Use
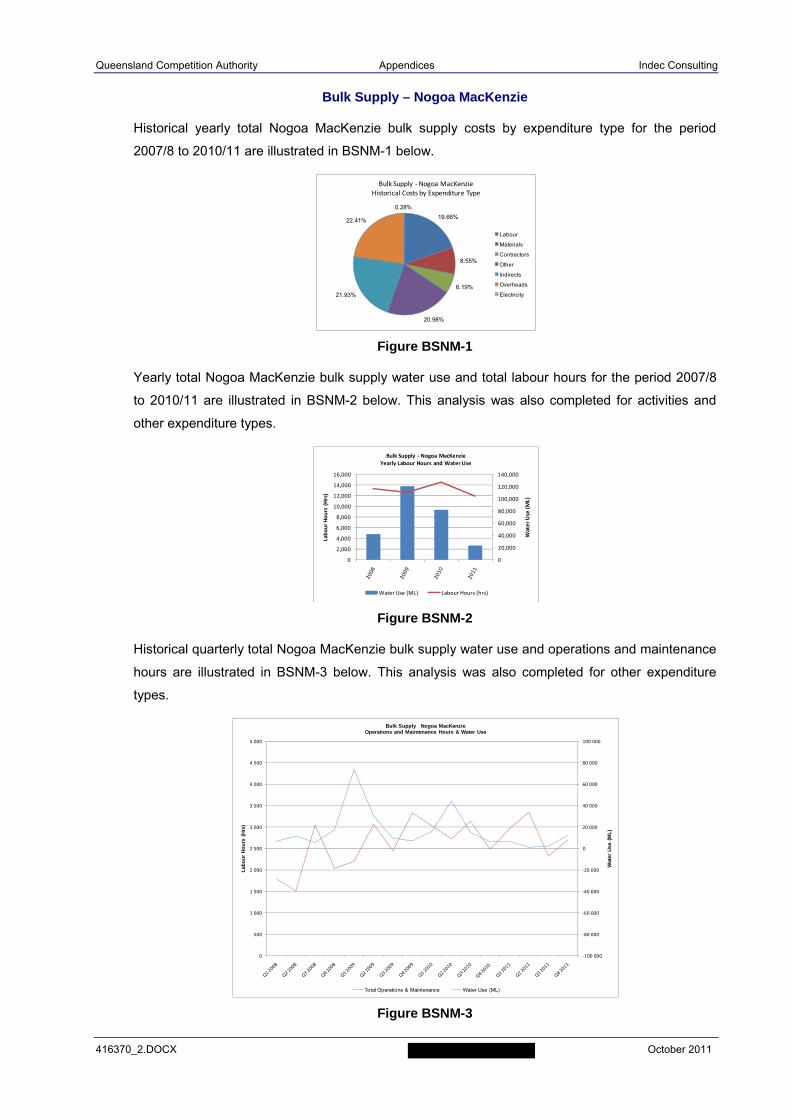
Queensland Competition Authority Appendices Indec Consulting
416370_2.DOCX October 2011
Bulk Supply – Nogoa MacKenzie
Historical yearly total Nogoa MacKenzie bulk supply costs by expenditure type for the period
2007/8 to 2010/11 are illustrated in BSNM-1 below.
Figure BSNM-1
Yearly total Nogoa MacKenzie bulk supply water use and total labour hours for the period 2007/8
to 2010/11 are illustrated in BSNM-2 below. This analysis was also completed for activities and
other expenditure types.
Figure BSNM-2
Historical quarterly total Nogoa MacKenzie bulk supply water use and operations and maintenance
hours are illustrated in BSNM-3 below. This analysis was also completed for other expenditure
types.
Figure BSNM-3
19.66%
8.55%
6.19%
20.98%
21.93%
22.41%
0.28%
Bulk Supply ‐ Nogoa MacKenzieHistorical Costs by Expenditure Type
Labour
Materials
Contractors
Other
Indirects
Overheads
Electricity
0
20,000
40,000
60,000
80,000
100,000
120,000
140,000
0
2,000
4,000
6,000
8,000
10,000
12,000
14,000
16,000
Water Use (ML)
Labour Hours (Hrs)
Bulk Supply ‐ Nogoa MacKenzieYearly Labour Hours and Water Use
Water Use (ML) Labour Hours (hrs)
‐100 000
‐80 000
‐60 000
‐40 000
‐20 000
0
20 000
40 000
60 000
80 000
100 000
0
500
1 000
1 500
2 000
2 500
3 000
3 500
4 000
4 500
5 000
Wat
er U
se (
ML
)
Lab
ou
r H
ou
rs (
Hrs
)
Bulk Supply Nogoa MacKenzieOperations and Maintenance Hours & Water Use
Total Operations & Maintenance Water Use (ML)
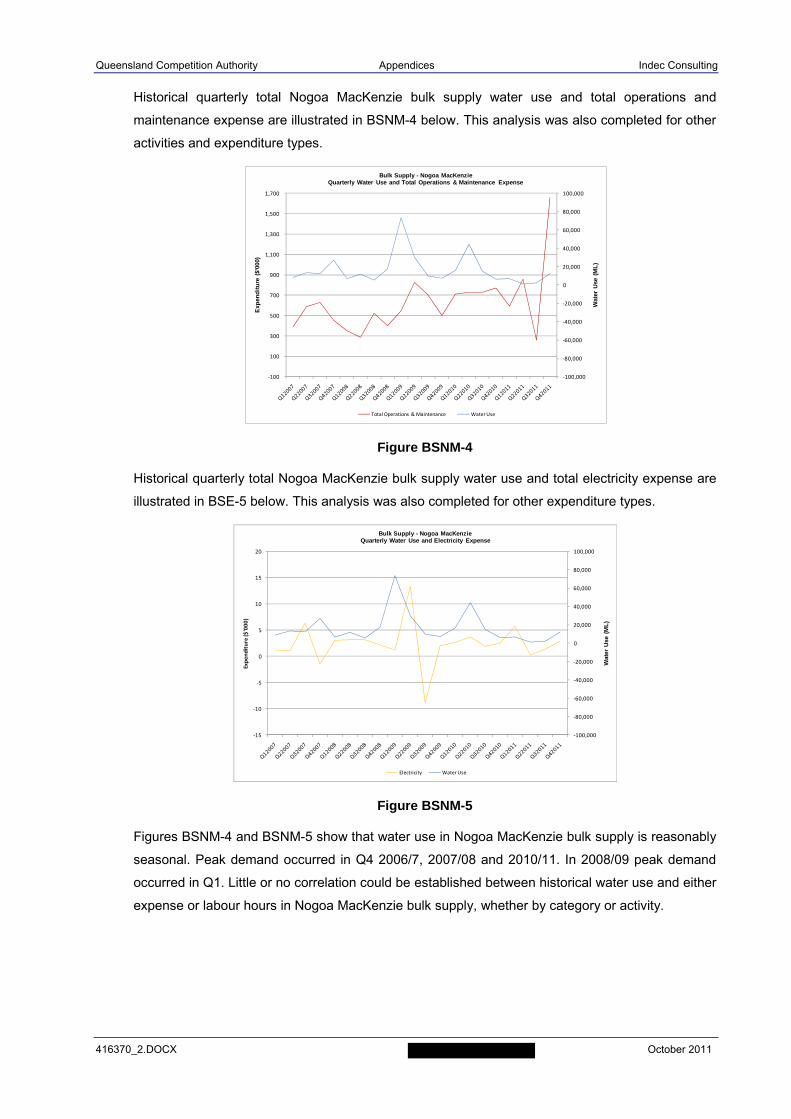
Queensland Competition Authority Appendices Indec Consulting
416370_2.DOCX October 2011
Historical quarterly total Nogoa MacKenzie bulk supply water use and total operations and
maintenance expense are illustrated in BSNM-4 below. This analysis was also completed for other
activities and expenditure types.
Figure BSNM-4
Historical quarterly total Nogoa MacKenzie bulk supply water use and total electricity expense are
illustrated in BSE-5 below. This analysis was also completed for other expenditure types.
Figure BSNM-5
Figures BSNM-4 and BSNM-5 show that water use in Nogoa MacKenzie bulk supply is reasonably
seasonal. Peak demand occurred in Q4 2006/7, 2007/08 and 2010/11. In 2008/09 peak demand
occurred in Q1. Little or no correlation could be established between historical water use and either
expense or labour hours in Nogoa MacKenzie bulk supply, whether by category or activity.
‐100,000
‐80,000
‐60,000
‐40,000
‐20,000
0
20,000
40,000
60,000
80,000
100,000
‐100
100
300
500
700
900
1,100
1,300
1,500
1,700
Wat
er U
se (
ML
)
Exp
end
itu
re (
$'00
0)
Bulk Supply - Nogoa MacKenzieQuarterly Water Use and Total Operations & Maintenance Expense
Total Operations & Maintenance Water Use
‐100,000
‐80,000
‐60,000
‐40,000
‐20,000
0
20,000
40,000
60,000
80,000
100,000
‐15
‐10
‐5
0
5
10
15
20
Wat
er U
se (
ML
)
Expenditure ($'000)
Bulk Supply - Nogoa MacKenzieQuarterly Water Use and Electricity Expense
Electricity Water Use
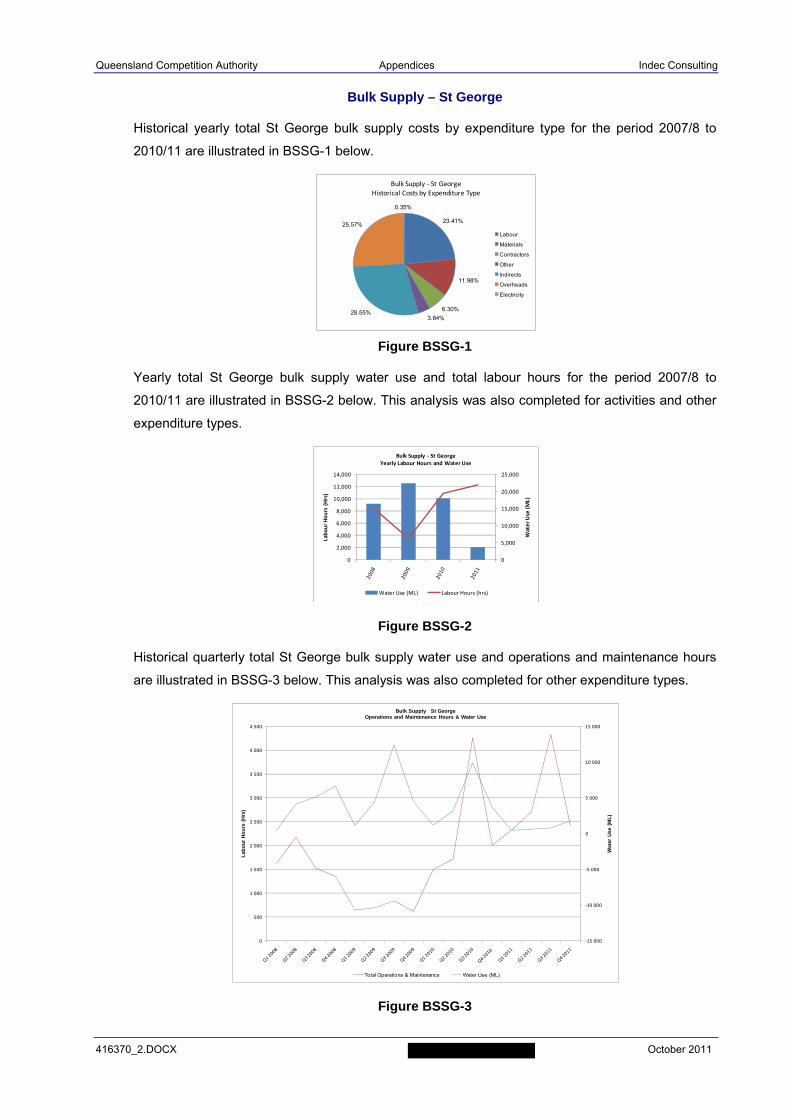
Queensland Competition Authority Appendices Indec Consulting
416370_2.DOCX October 2011
Bulk Supply – St George
Historical yearly total St George bulk supply costs by expenditure type for the period 2007/8 to
2010/11 are illustrated in BSSG-1 below.
Figure BSSG-1
Yearly total St George bulk supply water use and total labour hours for the period 2007/8 to
2010/11 are illustrated in BSSG-2 below. This analysis was also completed for activities and other
expenditure types.
Figure BSSG-2
Historical quarterly total St George bulk supply water use and operations and maintenance hours
are illustrated in BSSG-3 below. This analysis was also completed for other expenditure types.
Figure BSSG-3
23.41%
11.98%
6.30%
3.84%28.55%
25.57%
0.35%
Bulk Supply ‐ St GeorgeHistorical Costs by Expenditure Type
Labour
Materials
Contractors
Other
Indirects
Overheads
Electricity
0
5,000
10,000
15,000
20,000
25,000
0
2,000
4,000
6,000
8,000
10,000
12,000
14,000
Water Use (ML)
Labour Hours (Hrs)
Bulk Supply ‐ St GeorgeYearly Labour Hours and Water Use
Water Use (ML) Labour Hours (hrs)
‐15 000
‐10 000
‐5 000
0
5 000
10 000
15 000
0
500
1 000
1 500
2 000
2 500
3 000
3 500
4 000
4 500
Wat
er U
se (
ML
)
Lab
ou
r H
ou
rs (
Hrs
)
Bulk Supply St GeorgeOperations and Maintenance Hours & Water Use
Total Operations & Maintenance Water Use (ML)
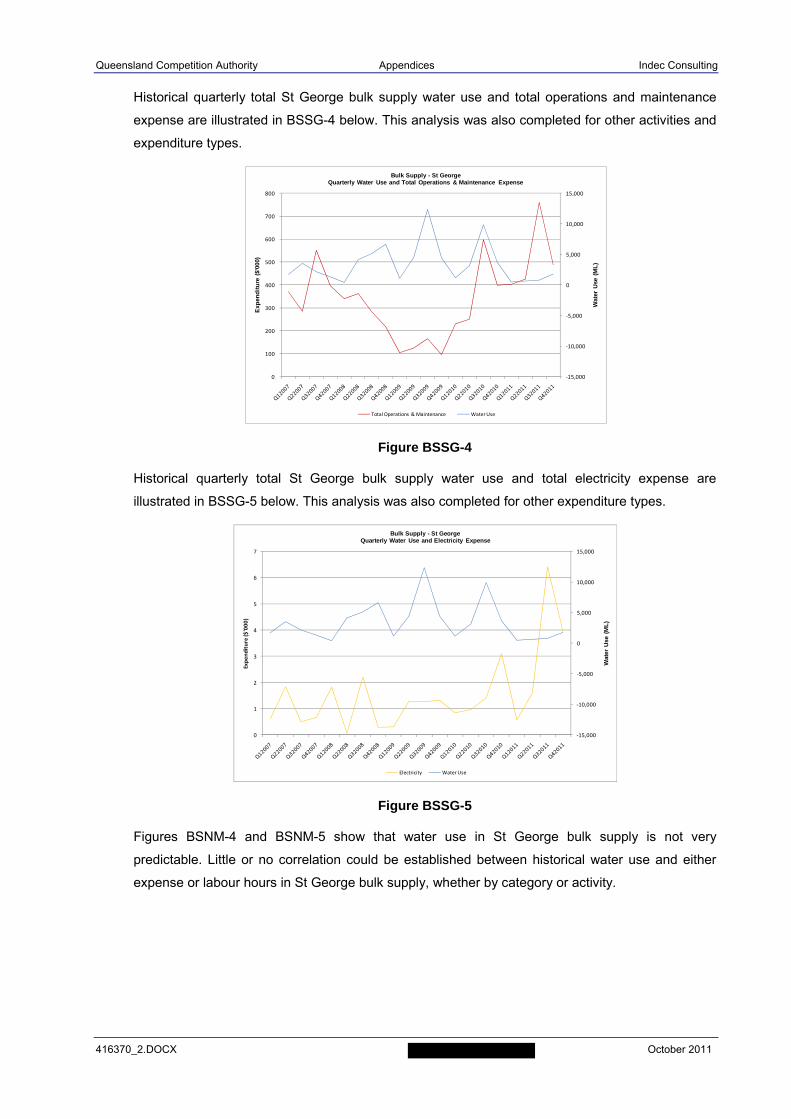
Queensland Competition Authority Appendices Indec Consulting
416370_2.DOCX October 2011
Historical quarterly total St George bulk supply water use and total operations and maintenance
expense are illustrated in BSSG-4 below. This analysis was also completed for other activities and
expenditure types.
Figure BSSG-4
Historical quarterly total St George bulk supply water use and total electricity expense are
illustrated in BSSG-5 below. This analysis was also completed for other expenditure types.
Figure BSSG-5
Figures BSNM-4 and BSNM-5 show that water use in St George bulk supply is not very
predictable. Little or no correlation could be established between historical water use and either
expense or labour hours in St George bulk supply, whether by category or activity.
‐15,000
‐10,000
‐5,000
0
5,000
10,000
15,000
0
100
200
300
400
500
600
700
800
Wat
er U
se (
ML
)
Exp
end
itu
re (
$'00
0)
Bulk Supply - St GeorgeQuarterly Water Use and Total Operations & Maintenance Expense
Total Operations & Maintenance Water Use
‐15,000
‐10,000
‐5,000
0
5,000
10,000
15,000
0
1
2
3
4
5
6
7
Wat
er U
se (
ML
)
Expenditure ($'000)
Bulk Supply - St GeorgeQuarterly Water Use and Electricity Expense
Electricity Water Use
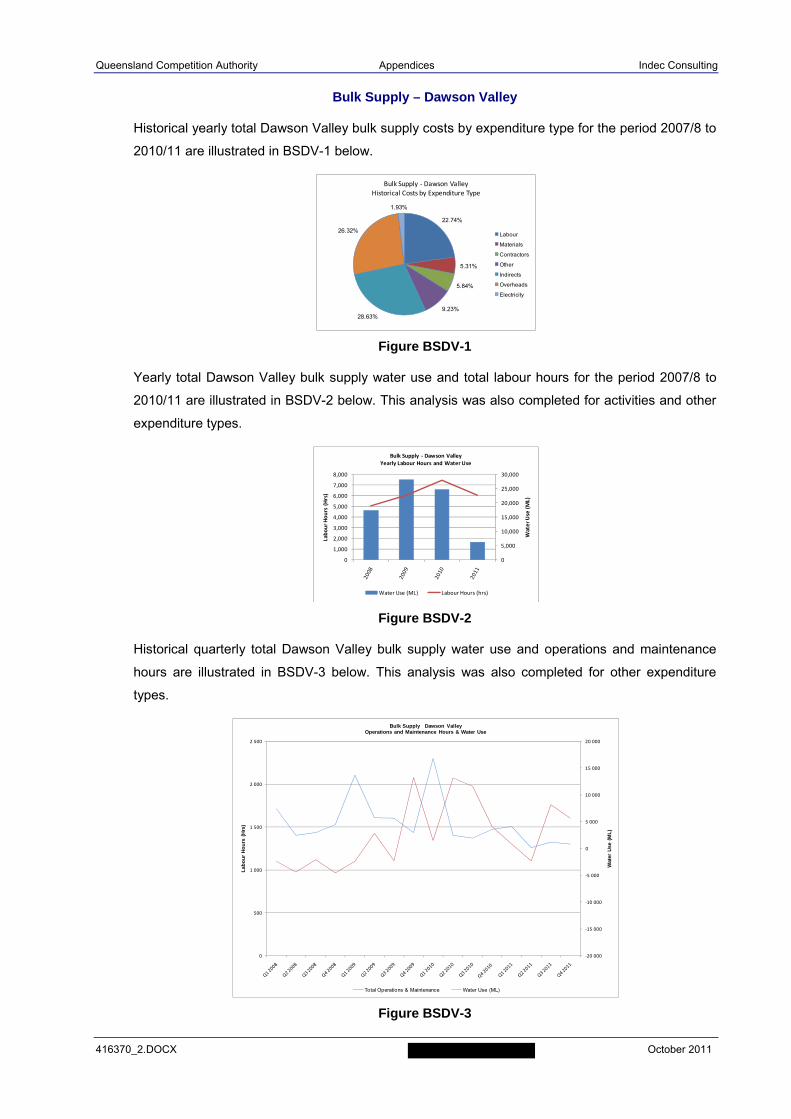
Queensland Competition Authority Appendices Indec Consulting
416370_2.DOCX October 2011
Bulk Supply – Dawson Valley
Historical yearly total Dawson Valley bulk supply costs by expenditure type for the period 2007/8 to
2010/11 are illustrated in BSDV-1 below.
Figure BSDV-1
Yearly total Dawson Valley bulk supply water use and total labour hours for the period 2007/8 to
2010/11 are illustrated in BSDV-2 below. This analysis was also completed for activities and other
expenditure types.
Figure BSDV-2
Historical quarterly total Dawson Valley bulk supply water use and operations and maintenance
hours are illustrated in BSDV-3 below. This analysis was also completed for other expenditure
types.
Figure BSDV-3
22.74%
5.31%
5.84%
9.23%28.63%
26.32%
1.93%
Bulk Supply ‐ Dawson ValleyHistorical Costs by Expenditure Type
Labour
Materials
Contractors
Other
Indirects
Overheads
Electricity
0
5,000
10,000
15,000
20,000
25,000
30,000
0
1,000
2,000
3,000
4,000
5,000
6,000
7,000
8,000
Water Use (ML)
Labour Hours (Hrs)
Bulk Supply ‐ Dawson ValleyYearly Labour Hours and Water Use
Water Use (ML) Labour Hours (hrs)
‐20 000
‐15 000
‐10 000
‐5 000
0
5 000
10 000
15 000
20 000
0
500
1 000
1 500
2 000
2 500
Wat
er U
se (
ML
)
Lab
ou
r H
ou
rs (
Hrs
)
Bulk Supply Dawson ValleyOperations and Maintenance Hours & Water Use
Total Operations & Maintenance Water Use (ML)
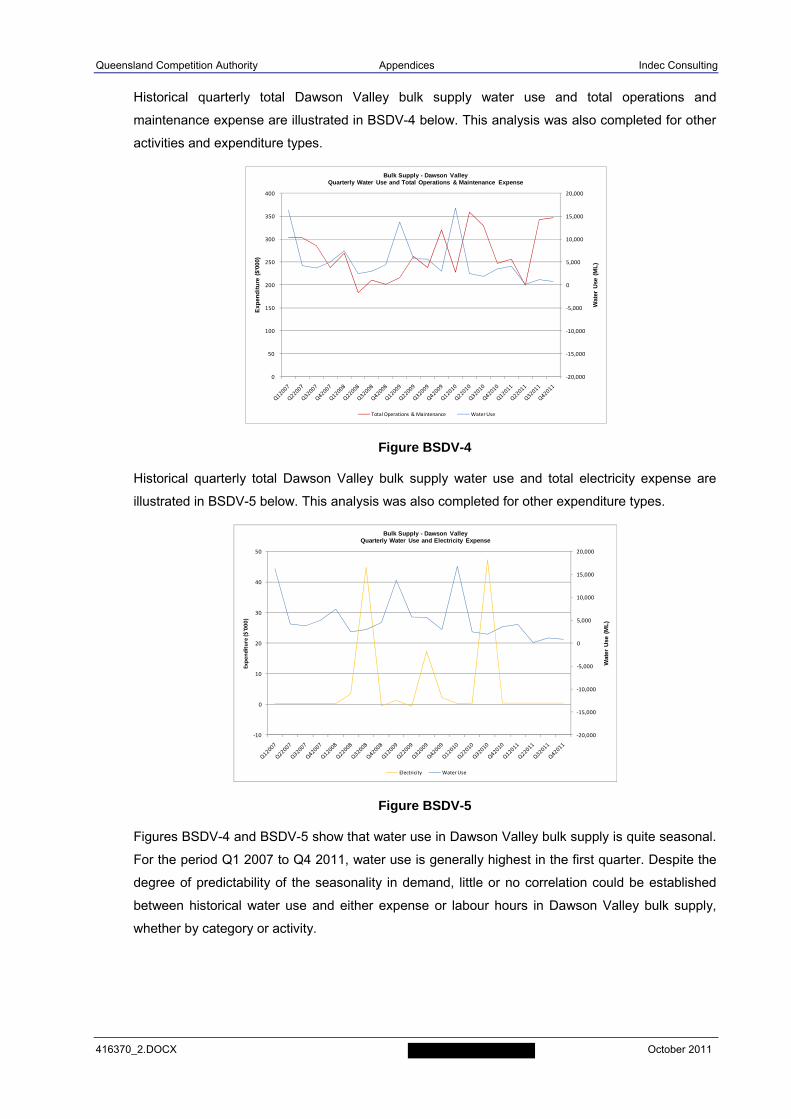
Queensland Competition Authority Appendices Indec Consulting
416370_2.DOCX October 2011
Historical quarterly total Dawson Valley bulk supply water use and total operations and
maintenance expense are illustrated in BSDV-4 below. This analysis was also completed for other
activities and expenditure types.
Figure BSDV-4
Historical quarterly total Dawson Valley bulk supply water use and total electricity expense are
illustrated in BSDV-5 below. This analysis was also completed for other expenditure types.
Figure BSDV-5
Figures BSDV-4 and BSDV-5 show that water use in Dawson Valley bulk supply is quite seasonal.
For the period Q1 2007 to Q4 2011, water use is generally highest in the first quarter. Despite the
degree of predictability of the seasonality in demand, little or no correlation could be established
between historical water use and either expense or labour hours in Dawson Valley bulk supply,
whether by category or activity.
‐20,000
‐15,000
‐10,000
‐5,000
0
5,000
10,000
15,000
20,000
0
50
100
150
200
250
300
350
400
Wat
er U
se (
ML
)
Exp
end
itu
re (
$'00
0)
Bulk Supply - Dawson ValleyQuarterly Water Use and Total Operations & Maintenance Expense
Total Operations & Maintenance Water Use
‐20,000
‐15,000
‐10,000
‐5,000
0
5,000
10,000
15,000
20,000
‐10
0
10
20
30
40
50
Wat
er U
se (
ML
)
Expenditure ($'000)
Bulk Supply - Dawson ValleyQuarterly Water Use and Electricity Expense
Electricity Water Use
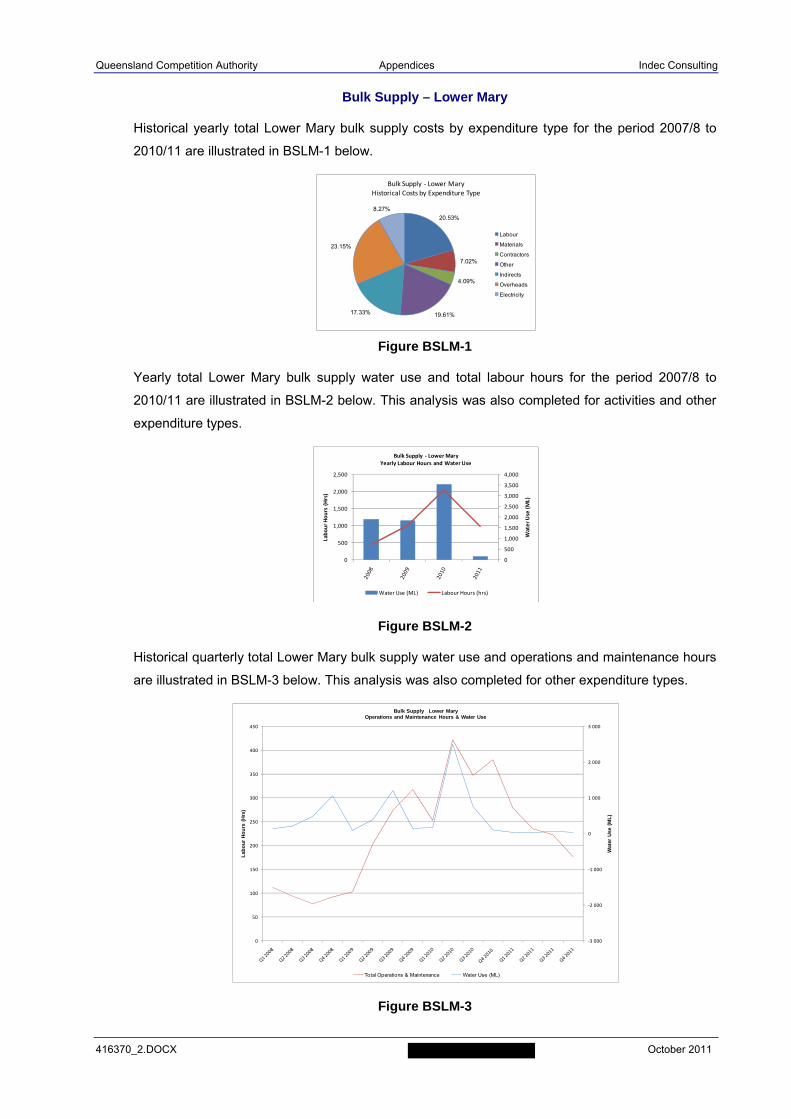
Queensland Competition Authority Appendices Indec Consulting
416370_2.DOCX October 2011
Bulk Supply – Lower Mary
Historical yearly total Lower Mary bulk supply costs by expenditure type for the period 2007/8 to
2010/11 are illustrated in BSLM-1 below.
Figure BSLM-1
Yearly total Lower Mary bulk supply water use and total labour hours for the period 2007/8 to
2010/11 are illustrated in BSLM-2 below. This analysis was also completed for activities and other
expenditure types.
Figure BSLM-2
Historical quarterly total Lower Mary bulk supply water use and operations and maintenance hours
are illustrated in BSLM-3 below. This analysis was also completed for other expenditure types.
Figure BSLM-3
20.53%
7.02%
4.09%
19.61%17.33%
23.15%
8.27%
Bulk Supply ‐ Lower MaryHistorical Costs by Expenditure Type
Labour
Materials
Contractors
Other
Indirects
Overheads
Electricity
0
500
1,000
1,500
2,000
2,500
3,000
3,500
4,000
0
500
1,000
1,500
2,000
2,500
Water Use (ML)
Labour Hours (Hrs)
Bulk Supply ‐ Lower MaryYearly Labour Hours and Water Use
Water Use (ML) Labour Hours (hrs)
‐3 000
‐2 000
‐1 000
0
1 000
2 000
3 000
0
50
100
150
200
250
300
350
400
450
Wat
er U
se (
ML
)
Lab
ou
r H
ou
rs (
Hrs
)
Bulk Supply Lower MaryOperations and Maintenance Hours & Water Use
Total Operations & Maintenance Water Use (ML)
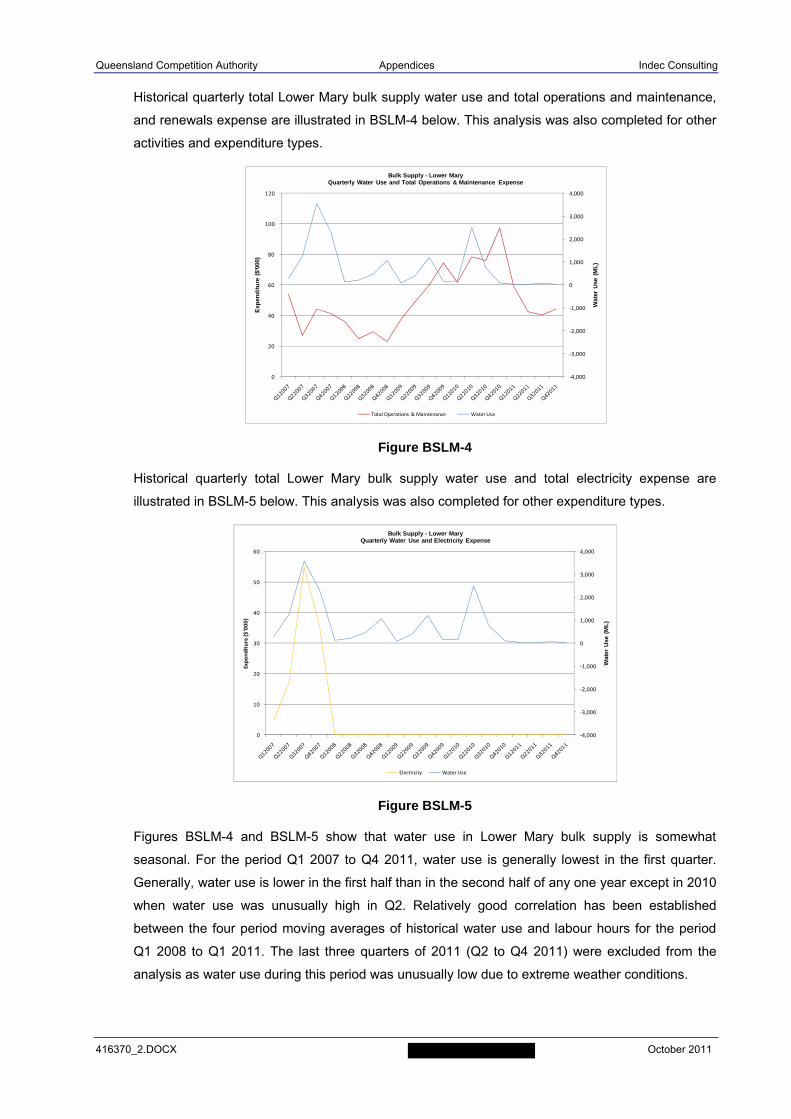
Queensland Competition Authority Appendices Indec Consulting
416370_2.DOCX October 2011
Historical quarterly total Lower Mary bulk supply water use and total operations and maintenance,
and renewals expense are illustrated in BSLM-4 below. This analysis was also completed for other
activities and expenditure types.
Figure BSLM-4
Historical quarterly total Lower Mary bulk supply water use and total electricity expense are
illustrated in BSLM-5 below. This analysis was also completed for other expenditure types.
Figure BSLM-5
Figures BSLM-4 and BSLM-5 show that water use in Lower Mary bulk supply is somewhat
seasonal. For the period Q1 2007 to Q4 2011, water use is generally lowest in the first quarter.
Generally, water use is lower in the first half than in the second half of any one year except in 2010
when water use was unusually high in Q2. Relatively good correlation has been established
between the four period moving averages of historical water use and labour hours for the period
Q1 2008 to Q1 2011. The last three quarters of 2011 (Q2 to Q4 2011) were excluded from the
analysis as water use during this period was unusually low due to extreme weather conditions.
‐4,000
‐3,000
‐2,000
‐1,000
0
1,000
2,000
3,000
4,000
0
20
40
60
80
100
120
Wat
er U
se (
ML
)
Exp
end
itu
re (
$'00
0)
Bulk Supply - Lower MaryQuarterly Water Use and Total Operations & Maintenance Expense
Total Operations & Maintenance Water Use
‐4,000
‐3,000
‐2,000
‐1,000
0
1,000
2,000
3,000
4,000
0
10
20
30
40
50
60
Wat
er U
se (
ML
)
Expenditure ($'000)
Bulk Supply - Lower MaryQuarterly Water Use and Electricity Expense
Electricity Water Use
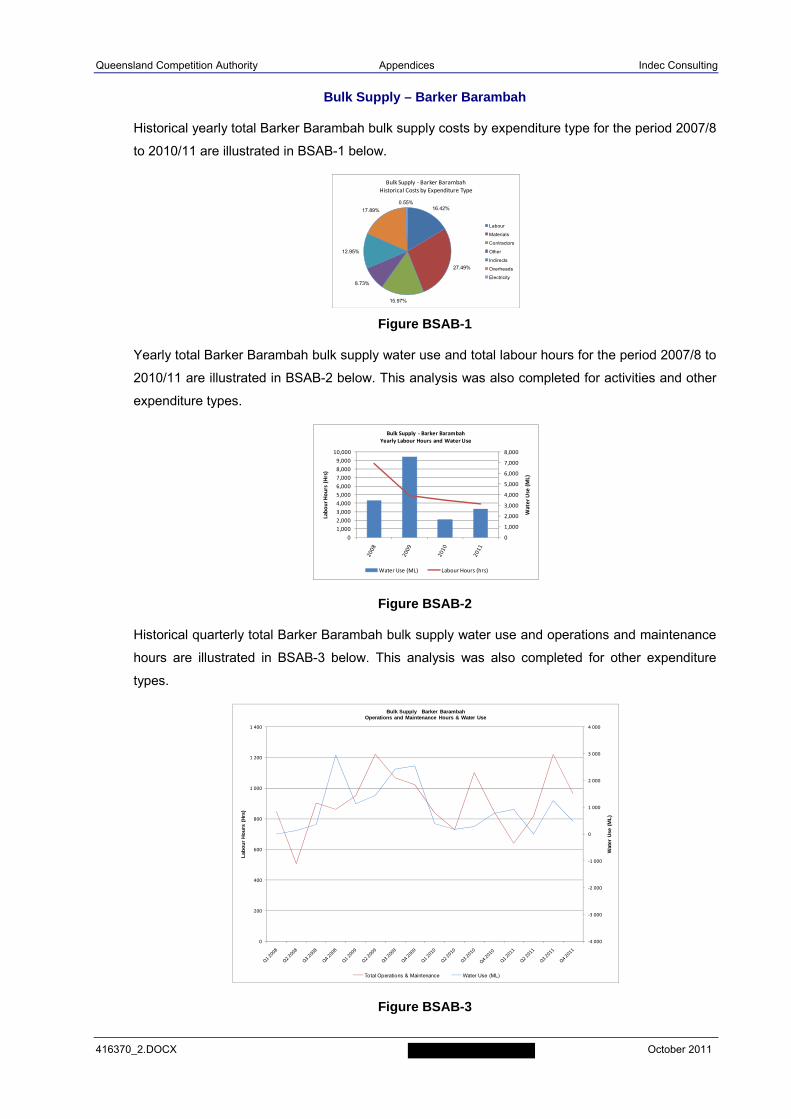
Queensland Competition Authority Appendices Indec Consulting
416370_2.DOCX October 2011
Bulk Supply – Barker Barambah
Historical yearly total Barker Barambah bulk supply costs by expenditure type for the period 2007/8
to 2010/11 are illustrated in BSAB-1 below.
Figure BSAB-1
Yearly total Barker Barambah bulk supply water use and total labour hours for the period 2007/8 to
2010/11 are illustrated in BSAB-2 below. This analysis was also completed for activities and other
expenditure types.
Figure BSAB-2
Historical quarterly total Barker Barambah bulk supply water use and operations and maintenance
hours are illustrated in BSAB-3 below. This analysis was also completed for other expenditure
types.
Figure BSAB-3
16.42%
27.49%
15.97%
8.73%
12.95%
17.89%
0.55%
Bulk Supply ‐ Barker Barambah
Historical Costs by Expenditure Type
Labour
Materials
Contractors
Other
Indirects
Overheads
Electricity
0
1,000
2,000
3,000
4,000
5,000
6,000
7,000
8,000
0
1,000
2,000
3,000
4,000
5,000
6,000
7,000
8,000
9,000
10,000
Water Use (ML)
Labour Hours (Hrs)
Bulk Supply ‐ Barker BarambahYearly Labour Hours and Water Use
Water Use (ML) Labour Hours (hrs)
‐4 000
‐3 000
‐2 000
‐1 000
0
1 000
2 000
3 000
4 000
0
200
400
600
800
1 000
1 200
1 400
Wat
er U
se (
ML
)
Lab
ou
r H
ou
rs (
Hrs
)
Bulk Supply Barker BarambahOperations and Maintenance Hours & Water Use
Total Operations & Maintenance Water Use (ML)
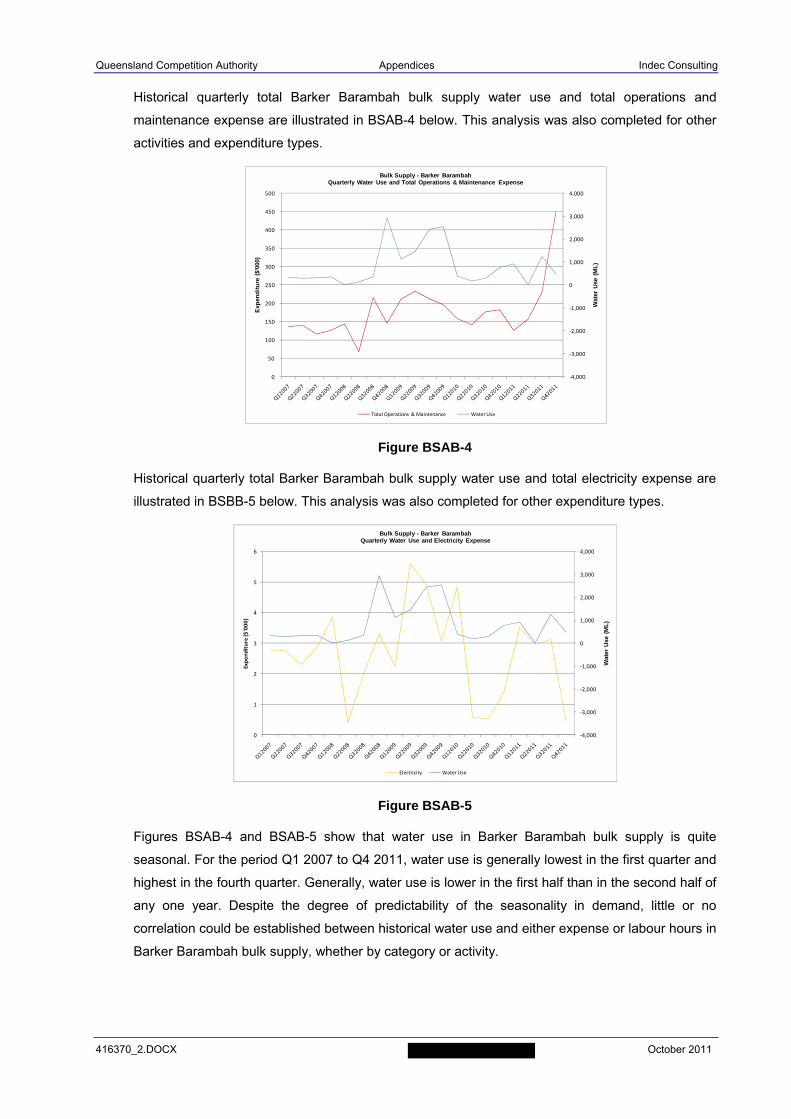
Queensland Competition Authority Appendices Indec Consulting
416370_2.DOCX October 2011
Historical quarterly total Barker Barambah bulk supply water use and total operations and
maintenance expense are illustrated in BSAB-4 below. This analysis was also completed for other
activities and expenditure types.
Figure BSAB-4
Historical quarterly total Barker Barambah bulk supply water use and total electricity expense are
illustrated in BSBB-5 below. This analysis was also completed for other expenditure types.
Figure BSAB-5
Figures BSAB-4 and BSAB-5 show that water use in Barker Barambah bulk supply is quite
seasonal. For the period Q1 2007 to Q4 2011, water use is generally lowest in the first quarter and
highest in the fourth quarter. Generally, water use is lower in the first half than in the second half of
any one year. Despite the degree of predictability of the seasonality in demand, little or no
correlation could be established between historical water use and either expense or labour hours in
Barker Barambah bulk supply, whether by category or activity.
‐4,000
‐3,000
‐2,000
‐1,000
0
1,000
2,000
3,000
4,000
0
50
100
150
200
250
300
350
400
450
500
Wat
er U
se (
ML
)
Exp
end
itu
re (
$'00
0)
Bulk Supply - Barker BarambahQuarterly Water Use and Total Operations & Maintenance Expense
Total Operations & Maintenance Water Use
‐4,000
‐3,000
‐2,000
‐1,000
0
1,000
2,000
3,000
4,000
0
1
2
3
4
5
6
Wat
er U
se (
ML
)
Expenditure ($'000)
Bulk Supply - Barker BarambahQuarterly Water Use and Electricity Expense
Electricity Water Use
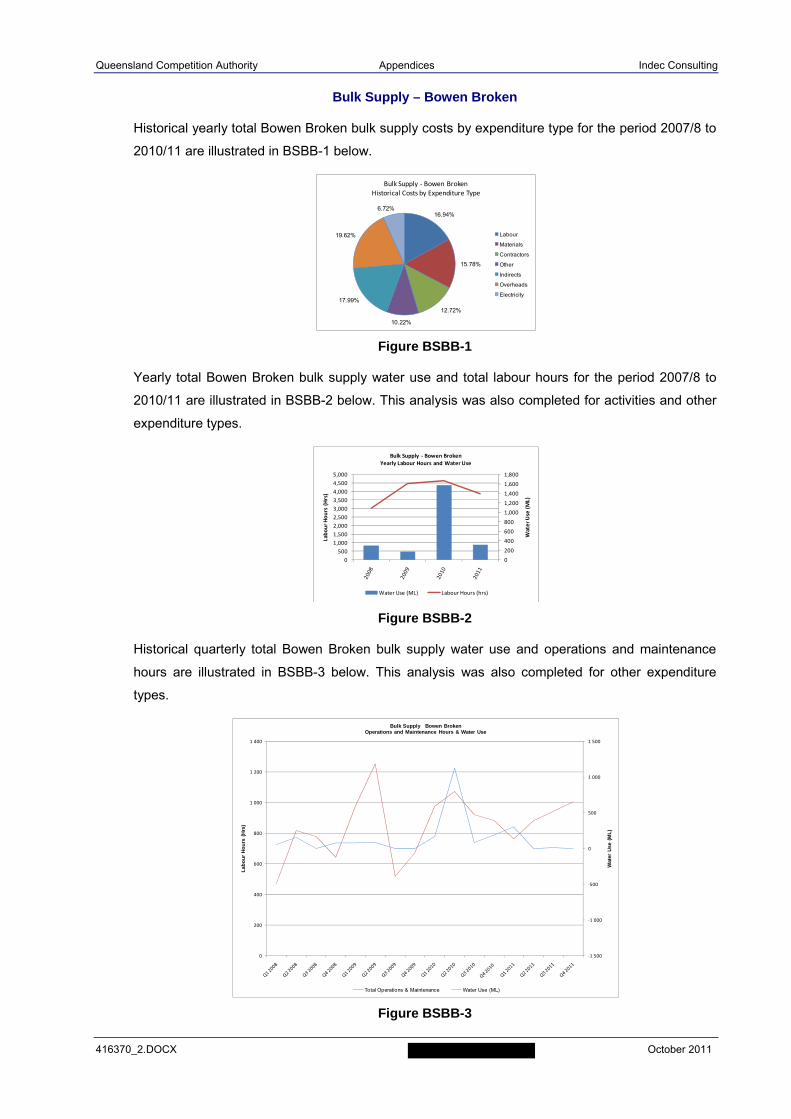
Queensland Competition Authority Appendices Indec Consulting
416370_2.DOCX October 2011
Bulk Supply – Bowen Broken
Historical yearly total Bowen Broken bulk supply costs by expenditure type for the period 2007/8 to
2010/11 are illustrated in BSBB-1 below.
Figure BSBB-1
Yearly total Bowen Broken bulk supply water use and total labour hours for the period 2007/8 to
2010/11 are illustrated in BSBB-2 below. This analysis was also completed for activities and other
expenditure types.
Figure BSBB-2
Historical quarterly total Bowen Broken bulk supply water use and operations and maintenance
hours are illustrated in BSBB-3 below. This analysis was also completed for other expenditure
types.
Figure BSBB-3
16.94%
15.78%
12.72%
10.22%
17.99%
19.62%
6.72%
Bulk Supply ‐ Bowen BrokenHistorical Costs by Expenditure Type
Labour
Materials
Contractors
Other
Indirects
Overheads
Electricity
0
200
400
600
800
1,000
1,200
1,400
1,600
1,800
0
500
1,000
1,500
2,000
2,500
3,000
3,500
4,000
4,500
5,000
Water Use (ML)
Labour Hours (Hrs)
Bulk Supply ‐ Bowen BrokenYearly Labour Hours and Water Use
Water Use (ML) Labour Hours (hrs)
‐1 500
‐1 000
‐500
0
500
1 000
1 500
0
200
400
600
800
1 000
1 200
1 400
Wat
er U
se (
ML
)
Lab
ou
r H
ou
rs (
Hrs
)
Bulk Supply Bowen BrokenOperations and Maintenance Hours & Water Use
Total Operations & Maintenance Water Use (ML)
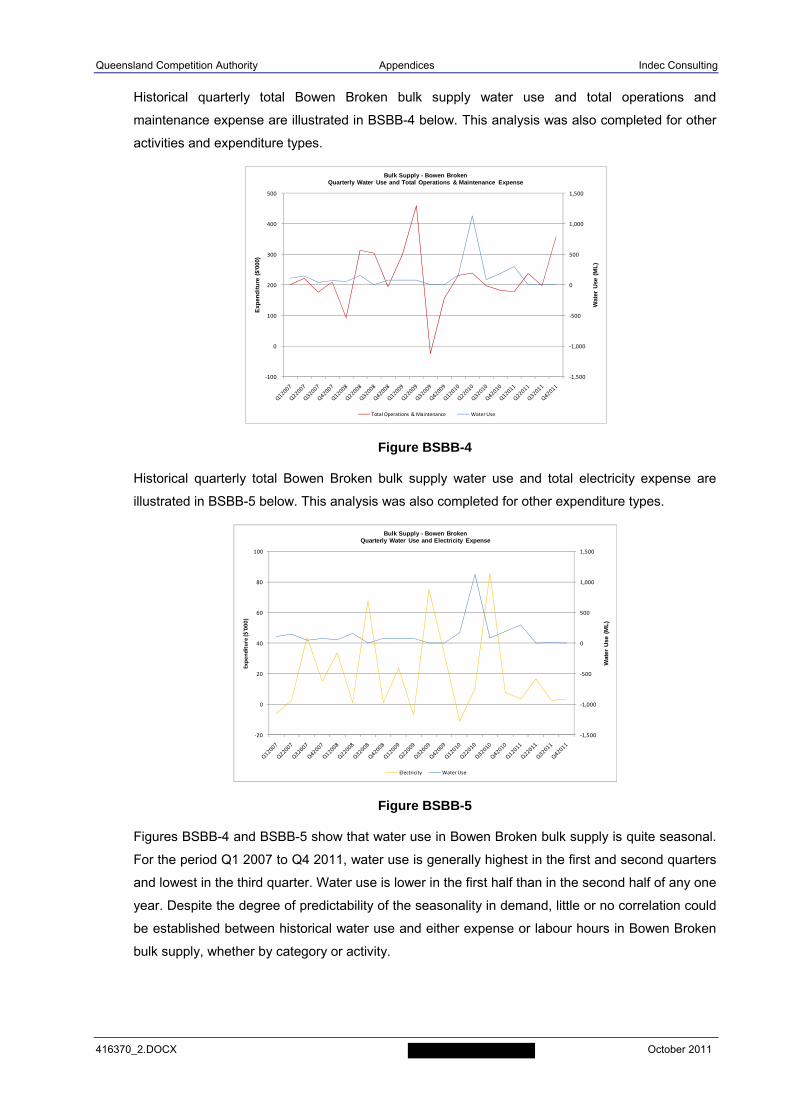
Queensland Competition Authority Appendices Indec Consulting
416370_2.DOCX October 2011
Historical quarterly total Bowen Broken bulk supply water use and total operations and
maintenance expense are illustrated in BSBB-4 below. This analysis was also completed for other
activities and expenditure types.
Figure BSBB-4
Historical quarterly total Bowen Broken bulk supply water use and total electricity expense are
illustrated in BSBB-5 below. This analysis was also completed for other expenditure types.
Figure BSBB-5
Figures BSBB-4 and BSBB-5 show that water use in Bowen Broken bulk supply is quite seasonal.
For the period Q1 2007 to Q4 2011, water use is generally highest in the first and second quarters
and lowest in the third quarter. Water use is lower in the first half than in the second half of any one
year. Despite the degree of predictability of the seasonality in demand, little or no correlation could
be established between historical water use and either expense or labour hours in Bowen Broken
bulk supply, whether by category or activity.
‐1,500
‐1,000
‐500
0
500
1,000
1,500
‐100
0
100
200
300
400
500
Wat
er U
se (
ML
)
Exp
end
itu
re (
$'00
0)
Bulk Supply - Bowen BrokenQuarterly Water Use and Total Operations & Maintenance Expense
Total Operations & Maintenance Water Use
‐1,500
‐1,000
‐500
0
500
1,000
1,500
‐20
0
20
40
60
80
100
Wat
er U
se (
ML
)
Expenditure ($'000)
Bulk Supply - Bowen BrokenQuarterly Water Use and Electricity Expense
Electricity Water Use
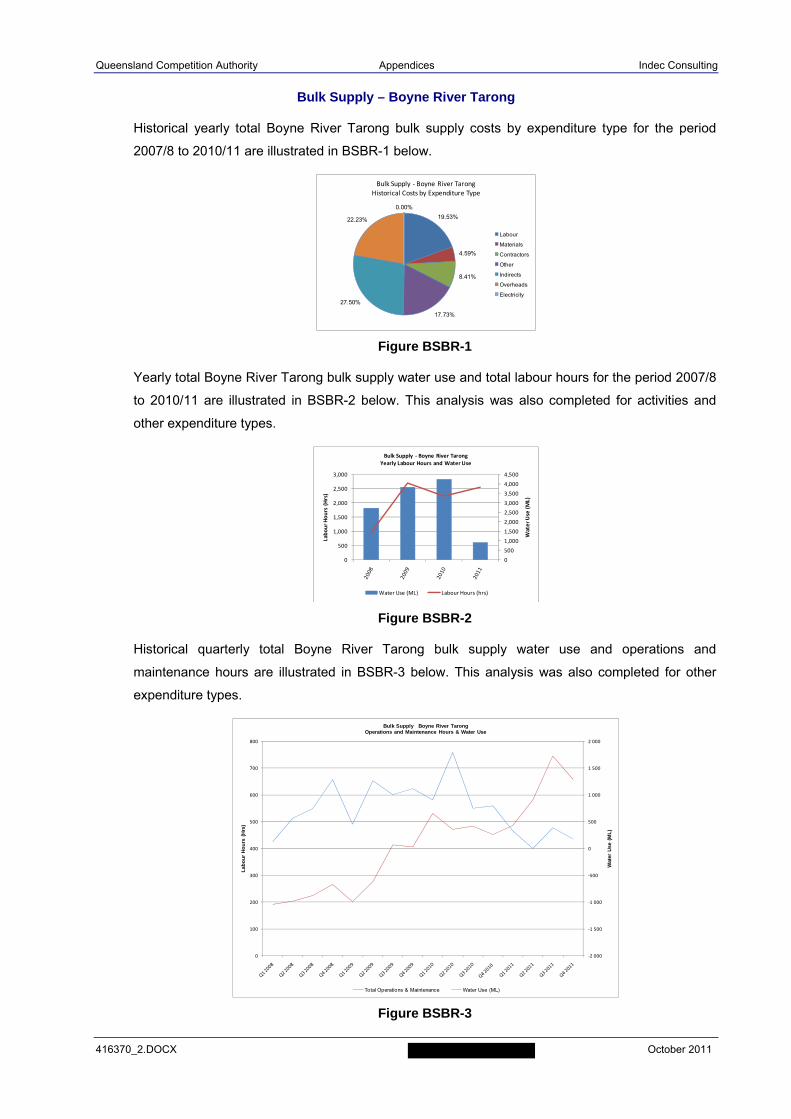
Queensland Competition Authority Appendices Indec Consulting
416370_2.DOCX October 2011
Bulk Supply – Boyne River Tarong
Historical yearly total Boyne River Tarong bulk supply costs by expenditure type for the period
2007/8 to 2010/11 are illustrated in BSBR-1 below.
Figure BSBR-1
Yearly total Boyne River Tarong bulk supply water use and total labour hours for the period 2007/8
to 2010/11 are illustrated in BSBR-2 below. This analysis was also completed for activities and
other expenditure types.
Figure BSBR-2
Historical quarterly total Boyne River Tarong bulk supply water use and operations and
maintenance hours are illustrated in BSBR-3 below. This analysis was also completed for other
expenditure types.
Figure BSBR-3
19.53%
4.59%
8.41%
17.73%
27.50%
22.23%
0.00%
Bulk Supply ‐ Boyne River TarongHistorical Costs by Expenditure Type
Labour
Materials
Contractors
Other
Indirects
Overheads
Electricity
0
500
1,000
1,500
2,000
2,500
3,000
3,500
4,000
4,500
0
500
1,000
1,500
2,000
2,500
3,000
Water Use (ML)
Labour Hours (Hrs)
Bulk Supply ‐ Boyne River TarongYearly Labour Hours and Water Use
Water Use (ML) Labour Hours (hrs)
‐2 000
‐1 500
‐1 000
‐500
0
500
1 000
1 500
2 000
0
100
200
300
400
500
600
700
800
Wat
er U
se (
ML
)
Lab
ou
r H
ou
rs (
Hrs
)
Bulk Supply Boyne River TarongOperations and Maintenance Hours & Water Use
Total Operations & Maintenance Water Use (ML)
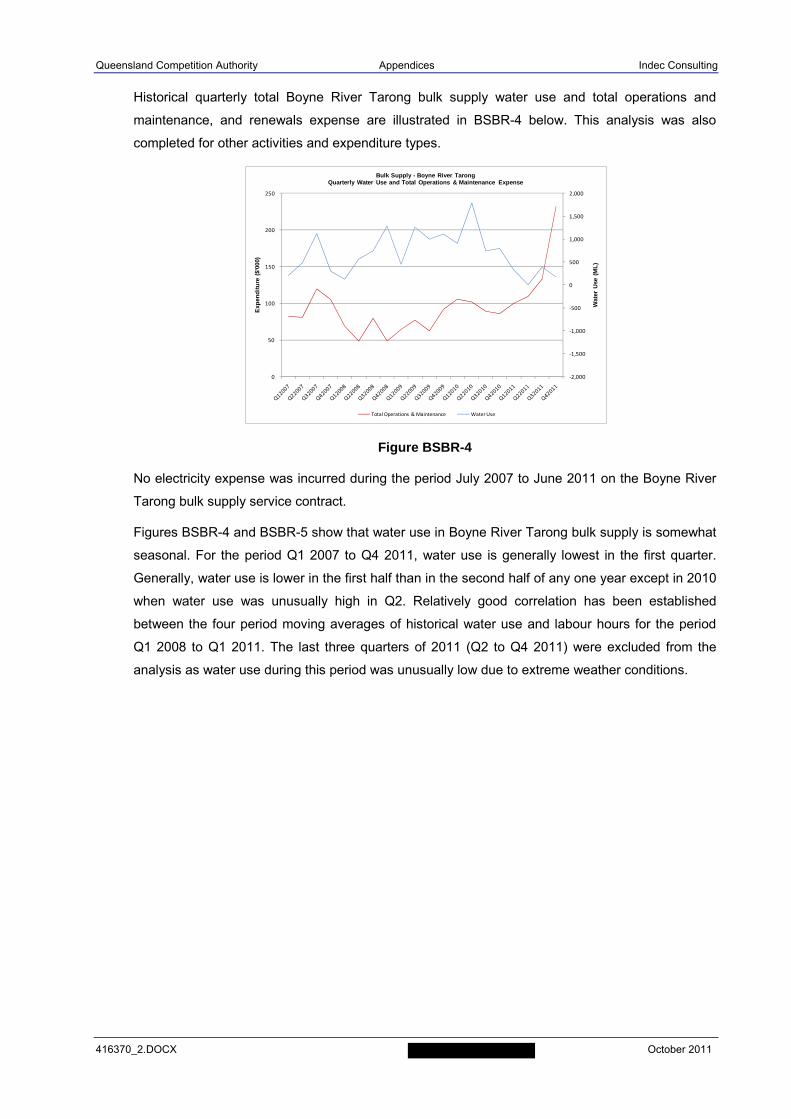
Queensland Competition Authority Appendices Indec Consulting
416370_2.DOCX October 2011
Historical quarterly total Boyne River Tarong bulk supply water use and total operations and
maintenance, and renewals expense are illustrated in BSBR-4 below. This analysis was also
completed for other activities and expenditure types.
Figure BSBR-4
No electricity expense was incurred during the period July 2007 to June 2011 on the Boyne River
Tarong bulk supply service contract.
Figures BSBR-4 and BSBR-5 show that water use in Boyne River Tarong bulk supply is somewhat
seasonal. For the period Q1 2007 to Q4 2011, water use is generally lowest in the first quarter.
Generally, water use is lower in the first half than in the second half of any one year except in 2010
when water use was unusually high in Q2. Relatively good correlation has been established
between the four period moving averages of historical water use and labour hours for the period
Q1 2008 to Q1 2011. The last three quarters of 2011 (Q2 to Q4 2011) were excluded from the
analysis as water use during this period was unusually low due to extreme weather conditions.
‐2,000
‐1,500
‐1,000
‐500
0
500
1,000
1,500
2,000
0
50
100
150
200
250
Wat
er U
se (
ML
)
Exp
end
itu
re (
$'00
0)
Bulk Supply - Boyne River TarongQuarterly Water Use and Total Operations & Maintenance Expense
Total Operations & Maintenance Water Use
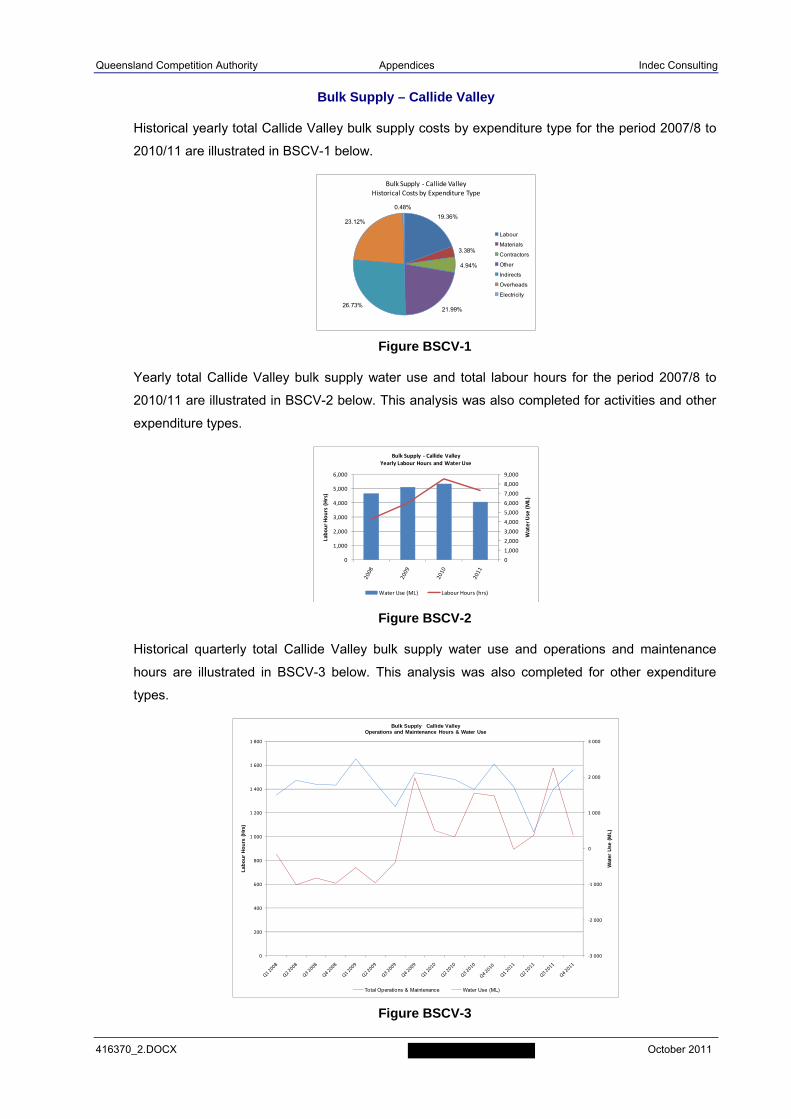
Queensland Competition Authority Appendices Indec Consulting
416370_2.DOCX October 2011
Bulk Supply – Callide Valley
Historical yearly total Callide Valley bulk supply costs by expenditure type for the period 2007/8 to
2010/11 are illustrated in BSCV-1 below.
Figure BSCV-1
Yearly total Callide Valley bulk supply water use and total labour hours for the period 2007/8 to
2010/11 are illustrated in BSCV-2 below. This analysis was also completed for activities and other
expenditure types.
Figure BSCV-2
Historical quarterly total Callide Valley bulk supply water use and operations and maintenance
hours are illustrated in BSCV-3 below. This analysis was also completed for other expenditure
types.
Figure BSCV-3
19.36%
3.38%
4.94%
21.99%26.73%
23.12%
0.48%
Bulk Supply ‐ Callide ValleyHistorical Costs by Expenditure Type
Labour
Materials
Contractors
Other
Indirects
Overheads
Electricity
0
1,000
2,000
3,000
4,000
5,000
6,000
7,000
8,000
9,000
0
1,000
2,000
3,000
4,000
5,000
6,000
Water Use (ML)
Labour Hours (Hrs)
Bulk Supply ‐ Callide ValleyYearly Labour Hours and Water Use
Water Use (ML) Labour Hours (hrs)
‐3 000
‐2 000
‐1 000
0
1 000
2 000
3 000
0
200
400
600
800
1 000
1 200
1 400
1 600
1 800
Wat
er U
se (
ML
)
Lab
ou
r H
ou
rs (
Hrs
)
Bulk Supply Callide ValleyOperations and Maintenance Hours & Water Use
Total Operations & Maintenance Water Use (ML)
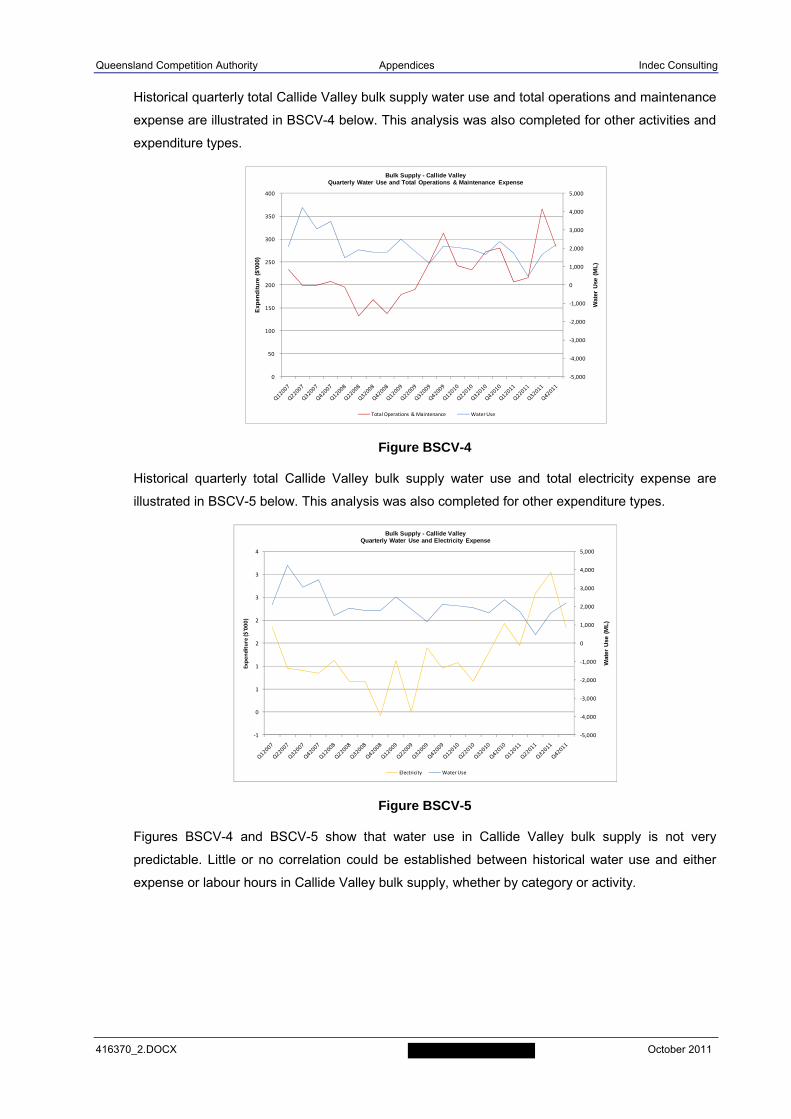
Queensland Competition Authority Appendices Indec Consulting
416370_2.DOCX October 2011
Historical quarterly total Callide Valley bulk supply water use and total operations and maintenance
expense are illustrated in BSCV-4 below. This analysis was also completed for other activities and
expenditure types.
Figure BSCV-4
Historical quarterly total Callide Valley bulk supply water use and total electricity expense are
illustrated in BSCV-5 below. This analysis was also completed for other expenditure types.
Figure BSCV-5
Figures BSCV-4 and BSCV-5 show that water use in Callide Valley bulk supply is not very
predictable. Little or no correlation could be established between historical water use and either
expense or labour hours in Callide Valley bulk supply, whether by category or activity.
‐5,000
‐4,000
‐3,000
‐2,000
‐1,000
0
1,000
2,000
3,000
4,000
5,000
0
50
100
150
200
250
300
350
400
Wat
er U
se (
ML
)
Exp
end
itu
re (
$'00
0)
Bulk Supply - Callide ValleyQuarterly Water Use and Total Operations & Maintenance Expense
Total Operations & Maintenance Water Use
‐5,000
‐4,000
‐3,000
‐2,000
‐1,000
0
1,000
2,000
3,000
4,000
5,000
‐1
0
1
1
2
2
3
3
4
Wat
er U
se (
ML
)
Expenditure ($'000)
Bulk Supply - Callide ValleyQuarterly Water Use and Electricity Expense
Electricity Water Use
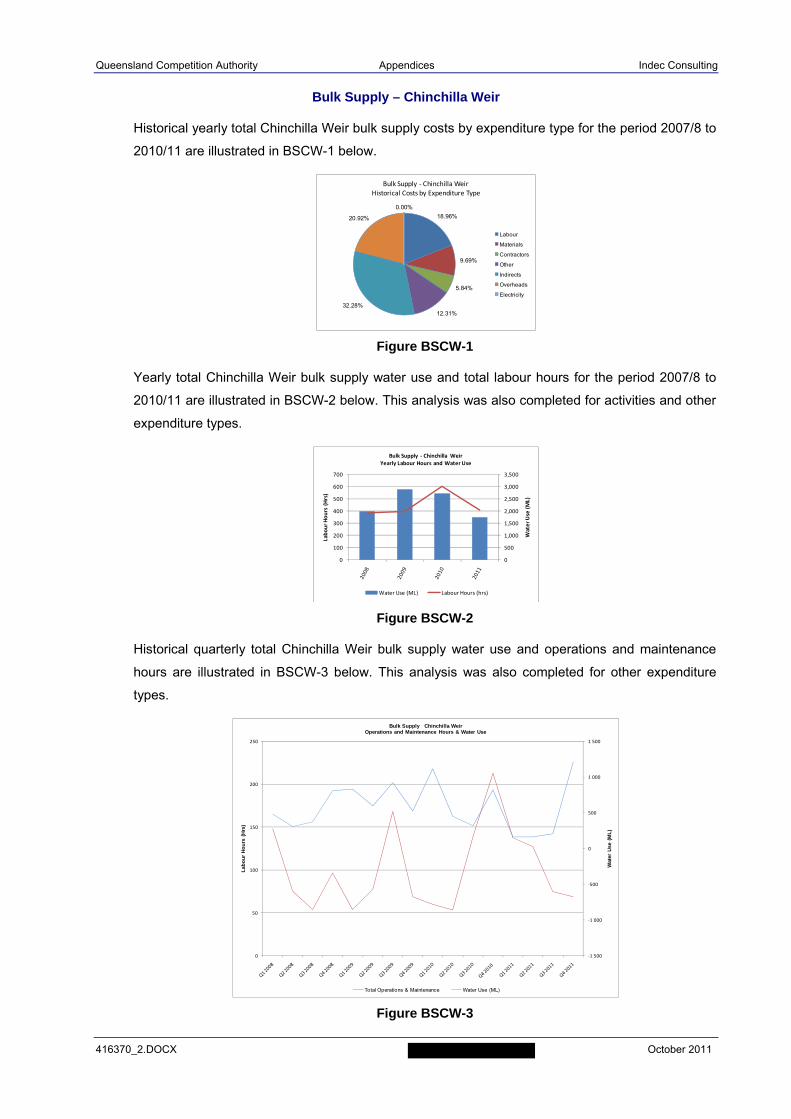
Queensland Competition Authority Appendices Indec Consulting
416370_2.DOCX October 2011
Bulk Supply – Chinchilla Weir
Historical yearly total Chinchilla Weir bulk supply costs by expenditure type for the period 2007/8 to
2010/11 are illustrated in BSCW-1 below.
Figure BSCW-1
Yearly total Chinchilla Weir bulk supply water use and total labour hours for the period 2007/8 to
2010/11 are illustrated in BSCW-2 below. This analysis was also completed for activities and other
expenditure types.
Figure BSCW-2
Historical quarterly total Chinchilla Weir bulk supply water use and operations and maintenance
hours are illustrated in BSCW-3 below. This analysis was also completed for other expenditure
types.
Figure BSCW-3
18.96%
9.69%
5.84%
12.31%32.28%
20.92%
0.00%
Bulk Supply ‐ Chinchilla WeirHistorical Costs by Expenditure Type
Labour
Materials
Contractors
Other
Indirects
Overheads
Electricity
0
500
1,000
1,500
2,000
2,500
3,000
3,500
0
100
200
300
400
500
600
700
Water Use (ML)
Labour Hours (Hrs)
Bulk Supply ‐ Chinchilla WeirYearly Labour Hours and Water Use
Water Use (ML) Labour Hours (hrs)
‐1 500
‐1 000
‐500
0
500
1 000
1 500
0
50
100
150
200
250
Wat
er U
se (
ML
)
Lab
ou
r H
ou
rs (
Hrs
)
Bulk Supply Chinchilla WeirOperations and Maintenance Hours & Water Use
Total Operations & Maintenance Water Use (ML)
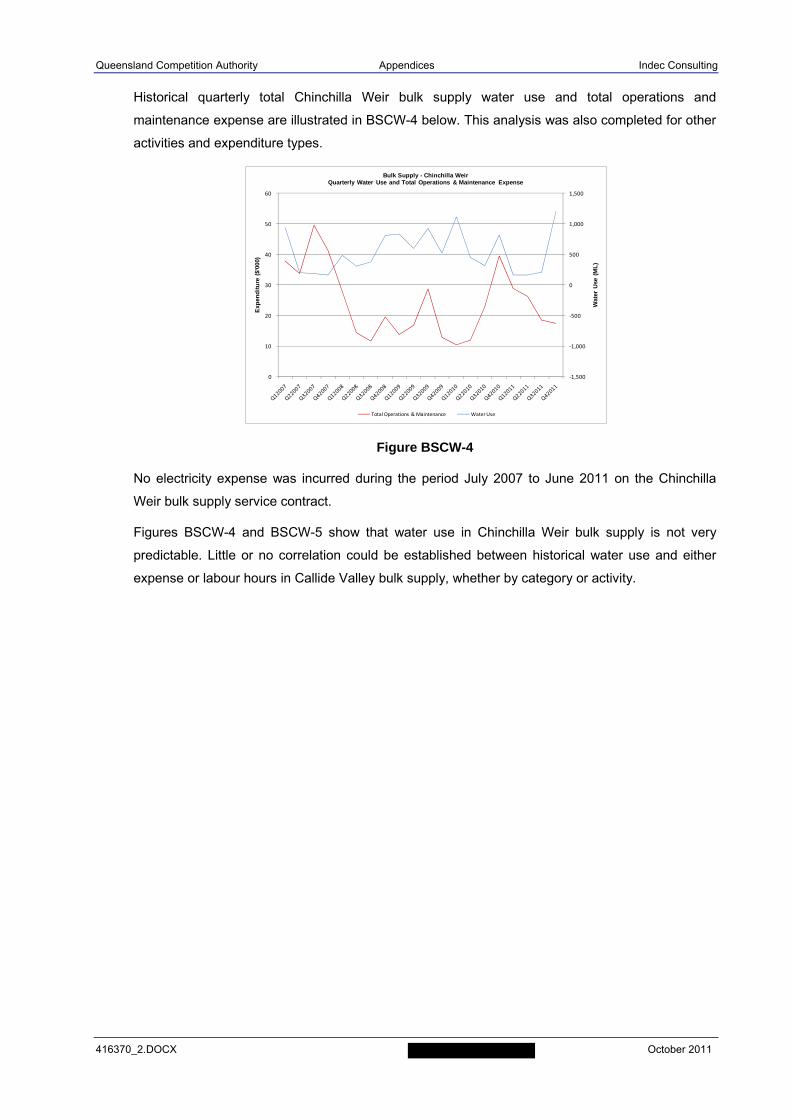
Queensland Competition Authority Appendices Indec Consulting
416370_2.DOCX October 2011
Historical quarterly total Chinchilla Weir bulk supply water use and total operations and
maintenance expense are illustrated in BSCW-4 below. This analysis was also completed for other
activities and expenditure types.
Figure BSCW-4
No electricity expense was incurred during the period July 2007 to June 2011 on the Chinchilla
Weir bulk supply service contract.
Figures BSCW-4 and BSCW-5 show that water use in Chinchilla Weir bulk supply is not very
predictable. Little or no correlation could be established between historical water use and either
expense or labour hours in Callide Valley bulk supply, whether by category or activity.
‐1,500
‐1,000
‐500
0
500
1,000
1,500
0
10
20
30
40
50
60
Wat
er U
se (
ML
)
Exp
end
itu
re (
$'00
0)
Bulk Supply - Chinchilla WeirQuarterly Water Use and Total Operations & Maintenance Expense
Total Operations & Maintenance Water Use
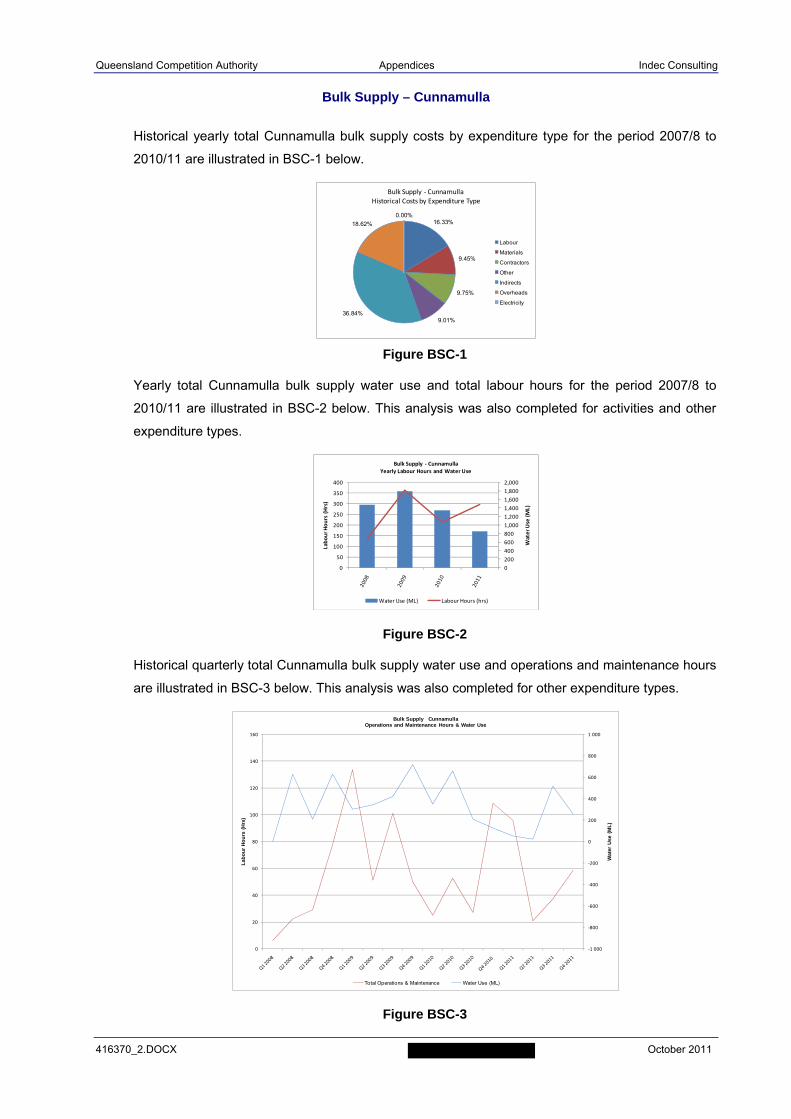
Queensland Competition Authority Appendices Indec Consulting
416370_2.DOCX October 2011
Bulk Supply – Cunnamulla
Historical yearly total Cunnamulla bulk supply costs by expenditure type for the period 2007/8 to
2010/11 are illustrated in BSC-1 below.
Figure BSC-1
Yearly total Cunnamulla bulk supply water use and total labour hours for the period 2007/8 to
2010/11 are illustrated in BSC-2 below. This analysis was also completed for activities and other
expenditure types.
Figure BSC-2
Historical quarterly total Cunnamulla bulk supply water use and operations and maintenance hours
are illustrated in BSC-3 below. This analysis was also completed for other expenditure types.
Figure BSC-3
16.33%
9.45%
9.75%
9.01%36.84%
18.62%
0.00%
Bulk Supply ‐ CunnamullaHistorical Costs by Expenditure Type
Labour
Materials
Contractors
Other
Indirects
Overheads
Electricity
0
200
400
600
800
1,000
1,200
1,400
1,600
1,800
2,000
0
50
100
150
200
250
300
350
400
Water Use (ML)
Labour Hours (Hrs)
Bulk Supply ‐ CunnamullaYearly Labour Hours and Water Use
Water Use (ML) Labour Hours (hrs)
‐1 000
‐800
‐600
‐400
‐200
0
200
400
600
800
1 000
0
20
40
60
80
100
120
140
160
Wat
er U
se (
ML
)
Lab
ou
r H
ou
rs (
Hrs
)
Bulk Supply CunnamullaOperations and Maintenance Hours & Water Use
Total Operations & Maintenance Water Use (ML)
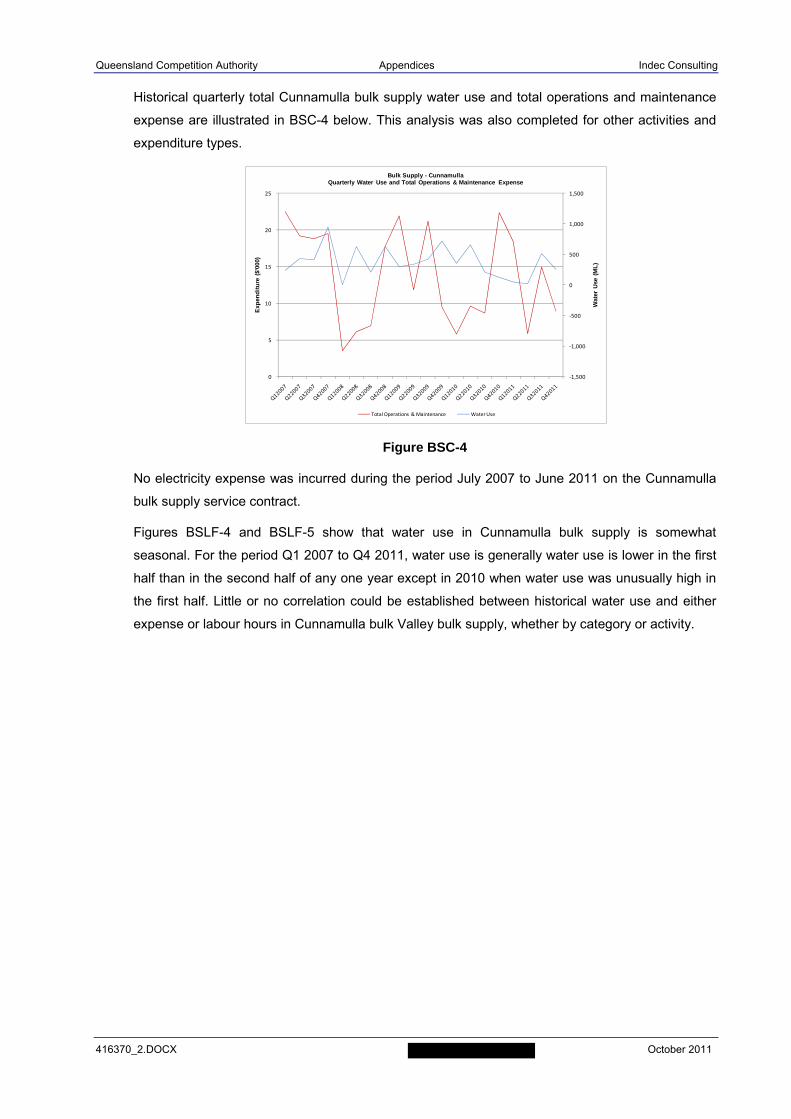
Queensland Competition Authority Appendices Indec Consulting
416370_2.DOCX October 2011
Historical quarterly total Cunnamulla bulk supply water use and total operations and maintenance
expense are illustrated in BSC-4 below. This analysis was also completed for other activities and
expenditure types.
Figure BSC-4
No electricity expense was incurred during the period July 2007 to June 2011 on the Cunnamulla
bulk supply service contract.
Figures BSLF-4 and BSLF-5 show that water use in Cunnamulla bulk supply is somewhat
seasonal. For the period Q1 2007 to Q4 2011, water use is generally water use is lower in the first
half than in the second half of any one year except in 2010 when water use was unusually high in
the first half. Little or no correlation could be established between historical water use and either
expense or labour hours in Cunnamulla bulk Valley bulk supply, whether by category or activity.
‐1,500
‐1,000
‐500
0
500
1,000
1,500
0
5
10
15
20
25
Wat
er U
se (
ML
)
Exp
end
itu
re (
$'00
0)
Bulk Supply - CunnamullaQuarterly Water Use and Total Operations & Maintenance Expense
Total Operations & Maintenance Water Use
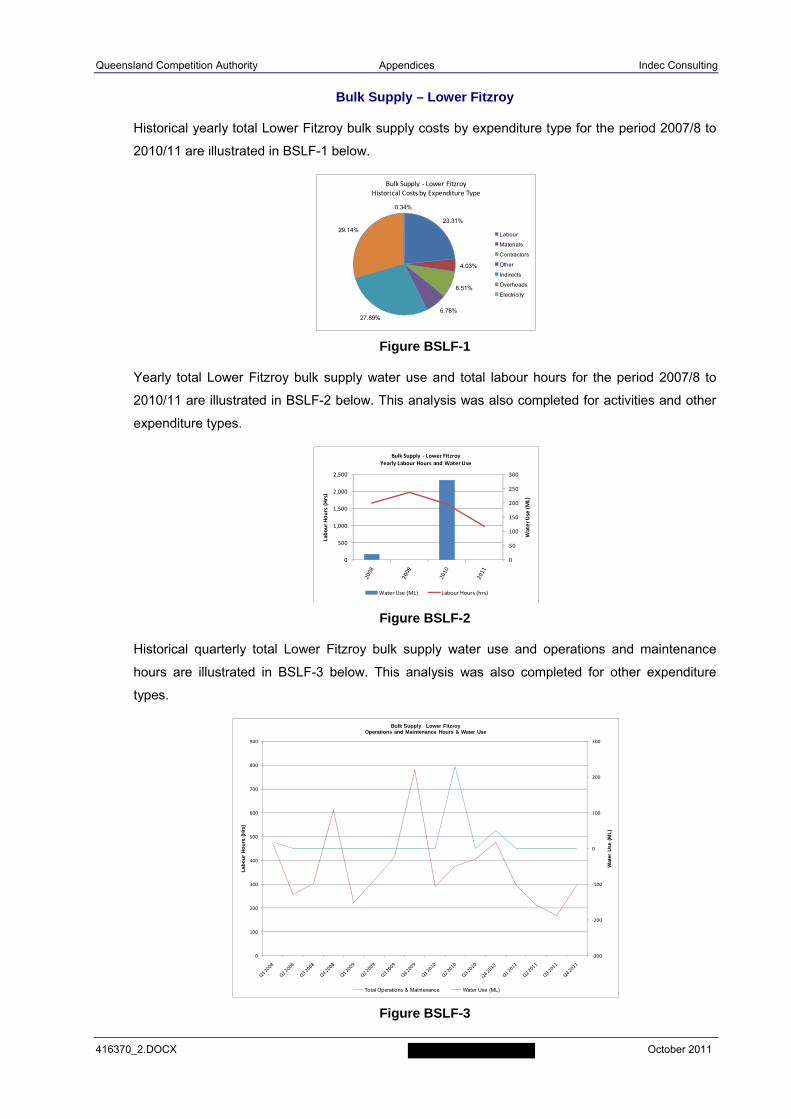
Queensland Competition Authority Appendices Indec Consulting
416370_2.DOCX October 2011
Bulk Supply – Lower Fitzroy
Historical yearly total Lower Fitzroy bulk supply costs by expenditure type for the period 2007/8 to
2010/11 are illustrated in BSLF-1 below.
Figure BSLF-1
Yearly total Lower Fitzroy bulk supply water use and total labour hours for the period 2007/8 to
2010/11 are illustrated in BSLF-2 below. This analysis was also completed for activities and other
expenditure types.
Figure BSLF-2
Historical quarterly total Lower Fitzroy bulk supply water use and operations and maintenance
hours are illustrated in BSLF-3 below. This analysis was also completed for other expenditure
types.
Figure BSLF-3
23.31%
4.03%
8.51%
6.78%27.89%
29.14%
0.34%
Bulk Supply ‐ Lower FitzroyHistorical Costs by Expenditure Type
Labour
Materials
Contractors
Other
Indirects
Overheads
Electricity
0
50
100
150
200
250
300
0
500
1,000
1,500
2,000
2,500
Water Use (ML)
Labour Hours (Hrs)
Bulk Supply ‐ Lower FitzroyYearly Labour Hours and Water Use
Water Use (ML) Labour Hours (hrs)
‐300
‐200
‐100
0
100
200
300
0
100
200
300
400
500
600
700
800
900
Wat
er U
se (
ML
)
Lab
ou
r H
ou
rs (
Hrs
)
Bulk Supply Lower FitzroyOperations and Maintenance Hours & Water Use
Total Operations & Maintenance Water Use (ML)
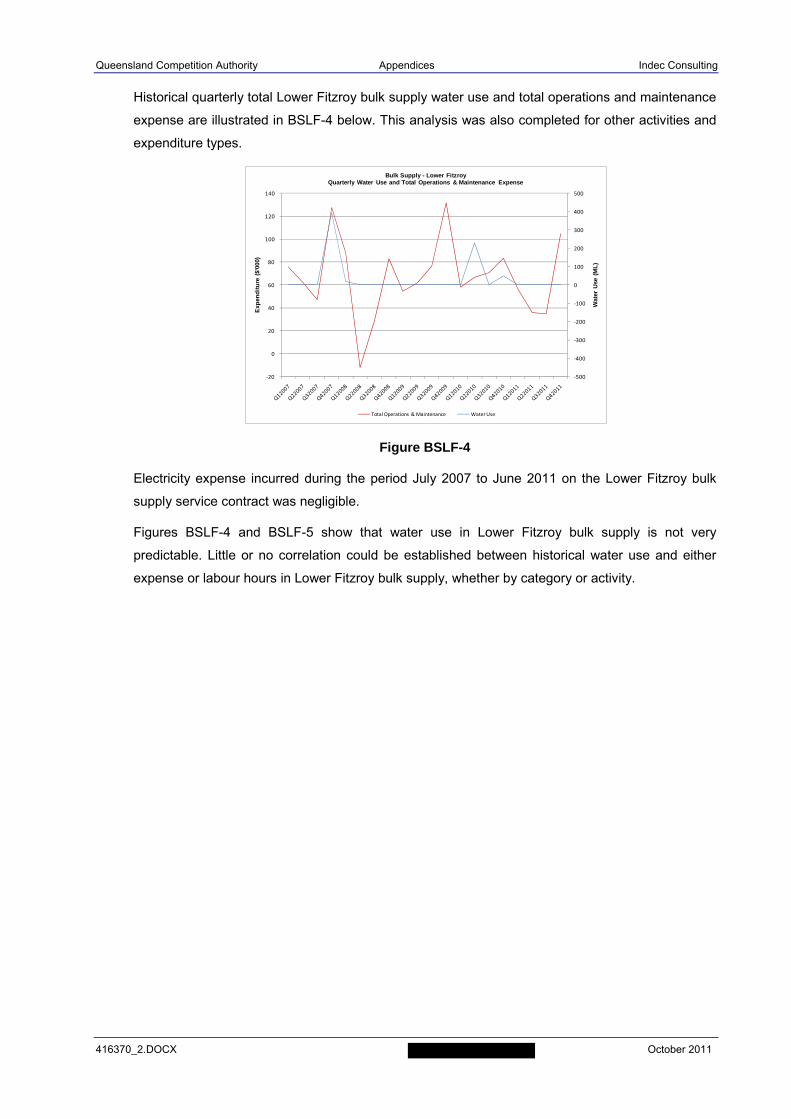
Queensland Competition Authority Appendices Indec Consulting
416370_2.DOCX October 2011
Historical quarterly total Lower Fitzroy bulk supply water use and total operations and maintenance
expense are illustrated in BSLF-4 below. This analysis was also completed for other activities and
expenditure types.
Figure BSLF-4
Electricity expense incurred during the period July 2007 to June 2011 on the Lower Fitzroy bulk
supply service contract was negligible.
Figures BSLF-4 and BSLF-5 show that water use in Lower Fitzroy bulk supply is not very
predictable. Little or no correlation could be established between historical water use and either
expense or labour hours in Lower Fitzroy bulk supply, whether by category or activity.
‐500
‐400
‐300
‐200
‐100
0
100
200
300
400
500
‐20
0
20
40
60
80
100
120
140
Wat
er U
se (
ML
)
Exp
end
itu
re (
$'00
0)
Bulk Supply - Lower FitzroyQuarterly Water Use and Total Operations & Maintenance Expense
Total Operations & Maintenance Water Use

Queensland Competition Authority Appendices Indec Consulting
416370_2.DOCX October 2011
Bulk Supply – Macintyre Brook
Historical yearly total Macintyre Brook bulk supply costs by expenditure type for the period 2007/8
to 2010/11 are illustrated in BSMB-1 below.
Figure BSMB-1
Yearly total Macintyre Brook bulk supply water use and total labour hours for the period 2007/8 to
2010/11 are illustrated in BSMB-2 below. This analysis was also completed for activities and other
expenditure types.
Figure BSMB-2
Historical quarterly total Macintyre Brook bulk supply water use and operations and maintenance
hours are illustrated in BSMB-3 below. This analysis was also completed for other expenditure
types.
Figure BSMB-3
20.08%
8.86%
17.30%
7.91%
23.26%
22.51%
0.07%
Bulk Supply ‐Macintyre BrookHistorical Costs by Expenditure Type
Labour
Materials
Contractors
Other
Indirects
Overheads
Electricity
0
2,000
4,000
6,000
8,000
10,000
12,000
14,000
16,000
18,000
20,000
0
1,000
2,000
3,000
4,000
5,000
6,000
7,000
8,000
9,000
Water Use (ML)
Labour Hours (Hrs)
Bulk Supply ‐Macintyre BrookYearly Labour Hours and Water Use
Water Use (ML) Labour Hours (hrs)
‐15 000
‐10 000
‐5 000
0
5 000
10 000
15 000
0
500
1 000
1 500
2 000
2 500
Wat
er U
se (
ML
)
Lab
ou
r H
ou
rs (
Hrs
)
Bulk Supply Macintyre BrookOperations and Maintenance Hours & Water Use
Total Operations & Maintenance Water Use (ML)
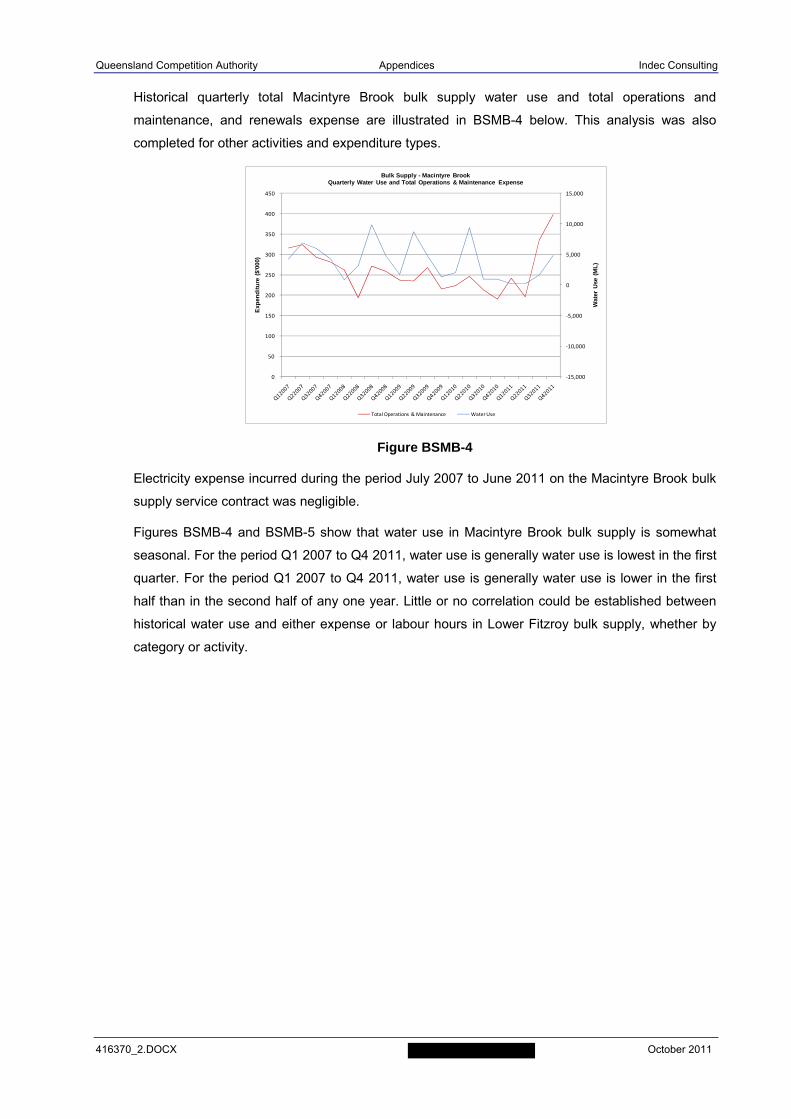
Queensland Competition Authority Appendices Indec Consulting
416370_2.DOCX October 2011
Historical quarterly total Macintyre Brook bulk supply water use and total operations and
maintenance, and renewals expense are illustrated in BSMB-4 below. This analysis was also
completed for other activities and expenditure types.
Figure BSMB-4
Electricity expense incurred during the period July 2007 to June 2011 on the Macintyre Brook bulk
supply service contract was negligible.
Figures BSMB-4 and BSMB-5 show that water use in Macintyre Brook bulk supply is somewhat
seasonal. For the period Q1 2007 to Q4 2011, water use is generally water use is lowest in the first
quarter. For the period Q1 2007 to Q4 2011, water use is generally water use is lower in the first
half than in the second half of any one year. Little or no correlation could be established between
historical water use and either expense or labour hours in Lower Fitzroy bulk supply, whether by
category or activity.
‐15,000
‐10,000
‐5,000
0
5,000
10,000
15,000
0
50
100
150
200
250
300
350
400
450
Wat
er U
se (
ML
)
Exp
end
itu
re (
$'00
0)
Bulk Supply - Macintyre BrookQuarterly Water Use and Total Operations & Maintenance Expense
Total Operations & Maintenance Water Use
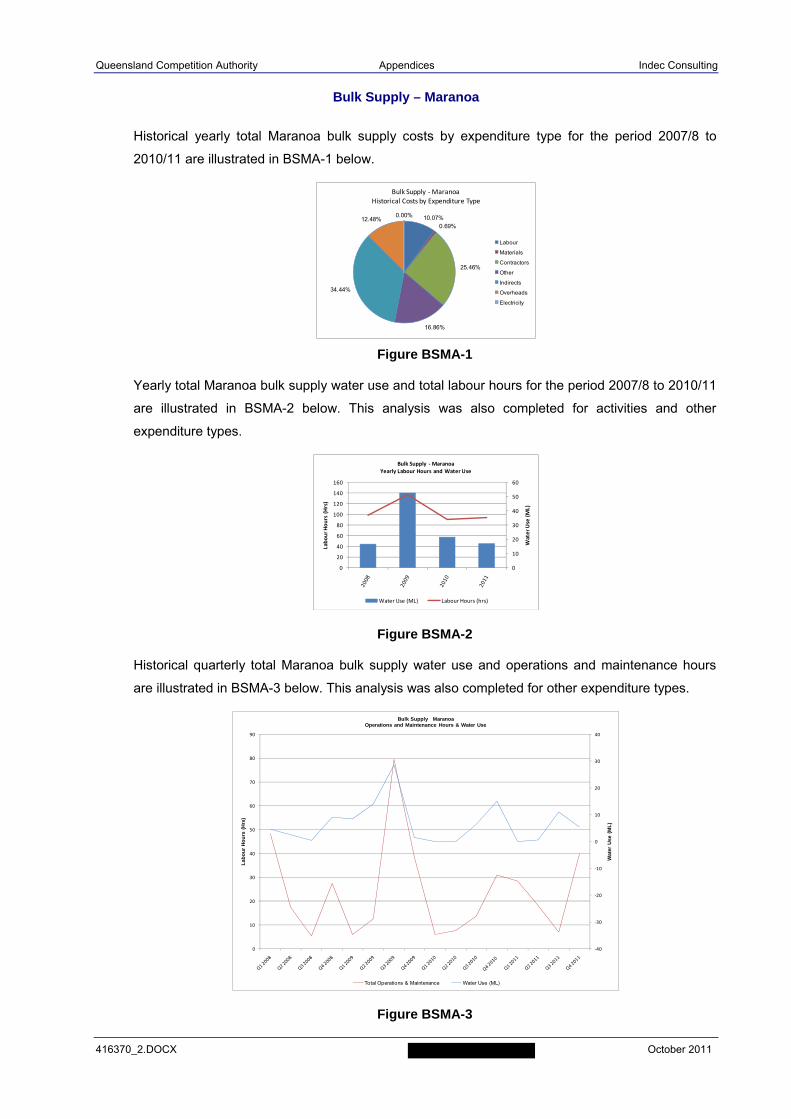
Queensland Competition Authority Appendices Indec Consulting
416370_2.DOCX October 2011
Bulk Supply – Maranoa
Historical yearly total Maranoa bulk supply costs by expenditure type for the period 2007/8 to
2010/11 are illustrated in BSMA-1 below.
Figure BSMA-1
Yearly total Maranoa bulk supply water use and total labour hours for the period 2007/8 to 2010/11
are illustrated in BSMA-2 below. This analysis was also completed for activities and other
expenditure types.
Figure BSMA-2
Historical quarterly total Maranoa bulk supply water use and operations and maintenance hours
are illustrated in BSMA-3 below. This analysis was also completed for other expenditure types.
Figure BSMA-3
10.07%0.69%
25.46%
16.86%
34.44%
12.48%0.00%
Bulk Supply ‐MaranoaHistorical Costs by Expenditure Type
Labour
Materials
Contractors
Other
Indirects
Overheads
Electricity
0
10
20
30
40
50
60
0
20
40
60
80
100
120
140
160
Water Use (ML)
Labour Hours (Hrs)
Bulk Supply ‐MaranoaYearly Labour Hours and Water Use
Water Use (ML) Labour Hours (hrs)
‐40
‐30
‐20
‐10
0
10
20
30
40
0
10
20
30
40
50
60
70
80
90
Wat
er U
se (
ML
)
Lab
ou
r H
ou
rs (
Hrs
)
Bulk Supply MaranoaOperations and Maintenance Hours & Water Use
Total Operations & Maintenance Water Use (ML)
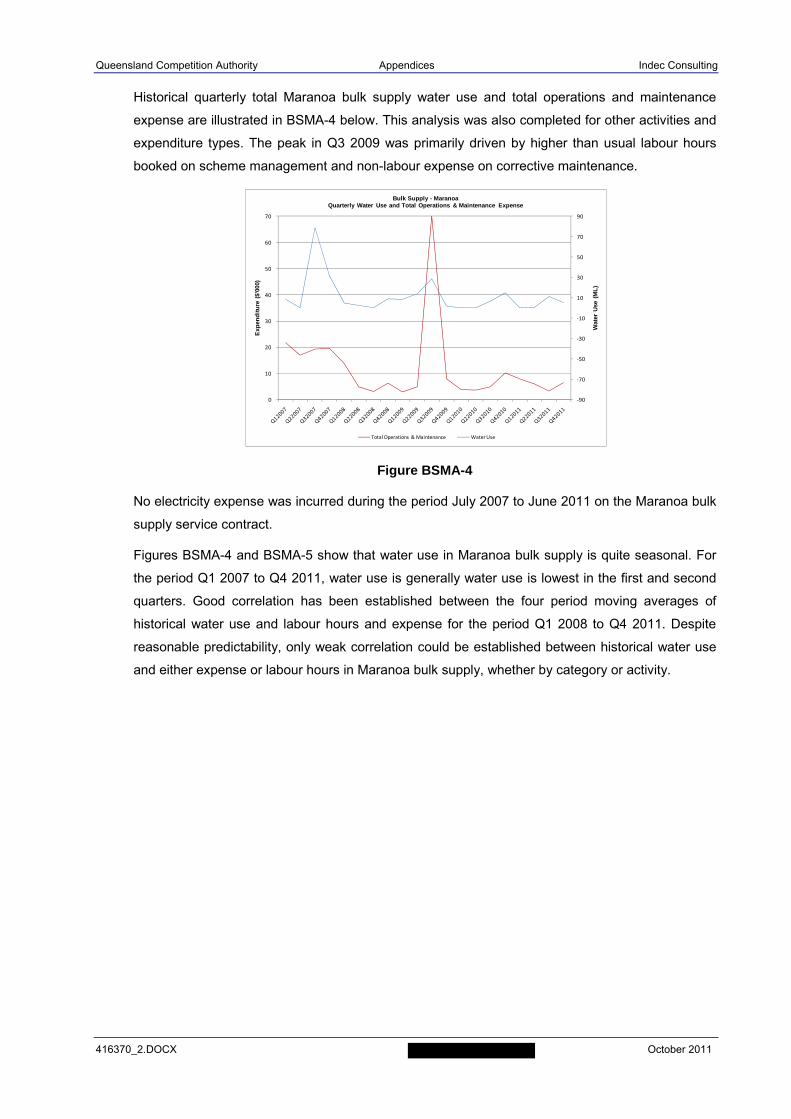
Queensland Competition Authority Appendices Indec Consulting
416370_2.DOCX October 2011
Historical quarterly total Maranoa bulk supply water use and total operations and maintenance
expense are illustrated in BSMA-4 below. This analysis was also completed for other activities and
expenditure types. The peak in Q3 2009 was primarily driven by higher than usual labour hours
booked on scheme management and non-labour expense on corrective maintenance.
Figure BSMA-4
No electricity expense was incurred during the period July 2007 to June 2011 on the Maranoa bulk
supply service contract.
Figures BSMA-4 and BSMA-5 show that water use in Maranoa bulk supply is quite seasonal. For
the period Q1 2007 to Q4 2011, water use is generally water use is lowest in the first and second
quarters. Good correlation has been established between the four period moving averages of
historical water use and labour hours and expense for the period Q1 2008 to Q4 2011. Despite
reasonable predictability, only weak correlation could be established between historical water use
and either expense or labour hours in Maranoa bulk supply, whether by category or activity.
‐90
‐70
‐50
‐30
‐10
10
30
50
70
90
0
10
20
30
40
50
60
70
Wat
er U
se (
ML
)
Exp
end
itu
re (
$'00
0)
Bulk Supply - MaranoaQuarterly Water Use and Total Operations & Maintenance Expense
Total Operations & Maintenance Water Use
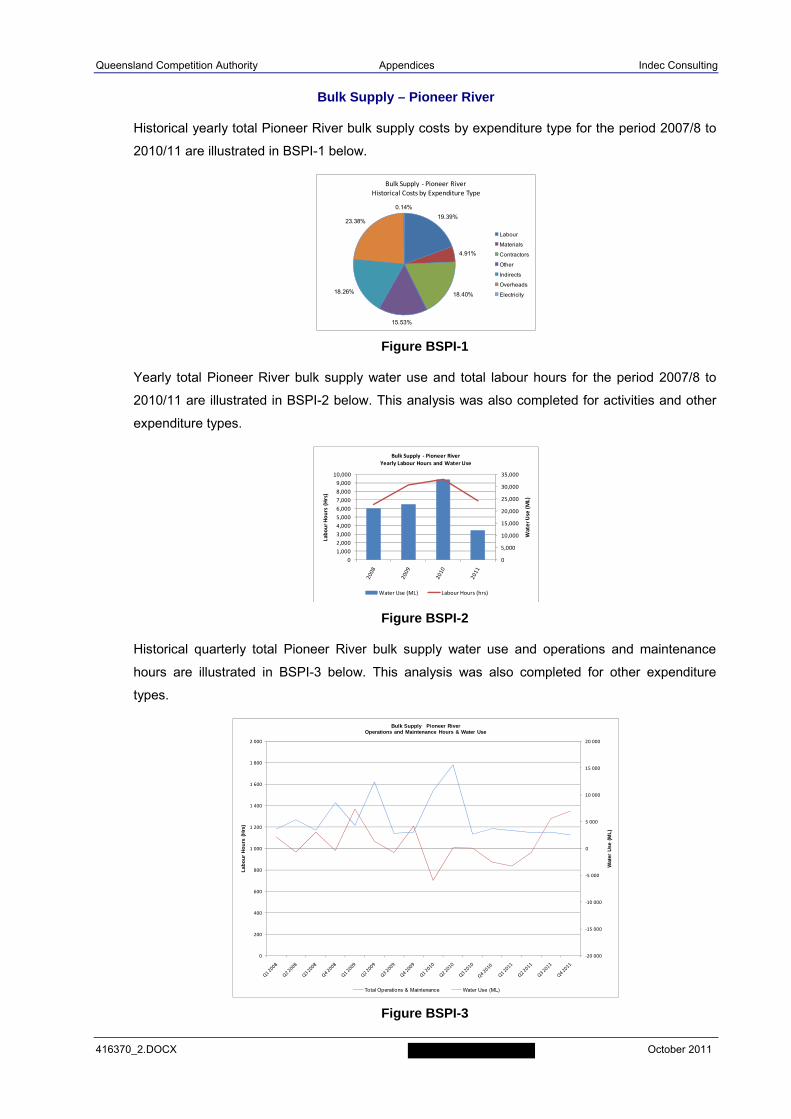
Queensland Competition Authority Appendices Indec Consulting
416370_2.DOCX October 2011
Bulk Supply – Pioneer River
Historical yearly total Pioneer River bulk supply costs by expenditure type for the period 2007/8 to
2010/11 are illustrated in BSPI-1 below.
Figure BSPI-1
Yearly total Pioneer River bulk supply water use and total labour hours for the period 2007/8 to
2010/11 are illustrated in BSPI-2 below. This analysis was also completed for activities and other
expenditure types.
Figure BSPI-2
Historical quarterly total Pioneer River bulk supply water use and operations and maintenance
hours are illustrated in BSPI-3 below. This analysis was also completed for other expenditure
types.
Figure BSPI-3
19.39%
4.91%
18.40%
15.53%
18.26%
23.38%
0.14%
Bulk Supply ‐ Pioneer RiverHistorical Costs by Expenditure Type
Labour
Materials
Contractors
Other
Indirects
Overheads
Electricity
0
5,000
10,000
15,000
20,000
25,000
30,000
35,000
0
1,000
2,000
3,000
4,000
5,000
6,000
7,000
8,000
9,000
10,000
Water Use (ML)
Labour Hours (Hrs)
Bulk Supply ‐ Pioneer RiverYearly Labour Hours and Water Use
Water Use (ML) Labour Hours (hrs)
‐20 000
‐15 000
‐10 000
‐5 000
0
5 000
10 000
15 000
20 000
0
200
400
600
800
1 000
1 200
1 400
1 600
1 800
2 000
Wat
er U
se (
ML
)
Lab
ou
r H
ou
rs (
Hrs
)
Bulk Supply Pioneer RiverOperations and Maintenance Hours & Water Use
Total Operations & Maintenance Water Use (ML)
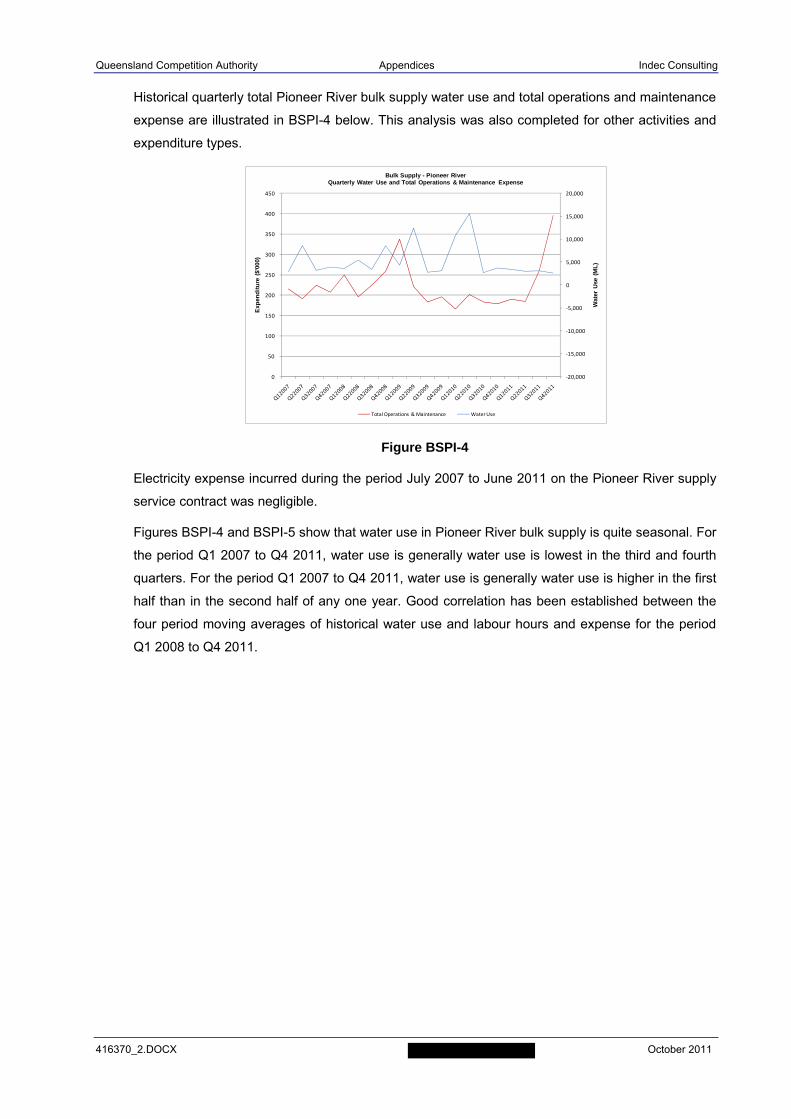
Queensland Competition Authority Appendices Indec Consulting
416370_2.DOCX October 2011
Historical quarterly total Pioneer River bulk supply water use and total operations and maintenance
expense are illustrated in BSPI-4 below. This analysis was also completed for other activities and
expenditure types.
Figure BSPI-4
Electricity expense incurred during the period July 2007 to June 2011 on the Pioneer River supply
service contract was negligible.
Figures BSPI-4 and BSPI-5 show that water use in Pioneer River bulk supply is quite seasonal. For
the period Q1 2007 to Q4 2011, water use is generally water use is lowest in the third and fourth
quarters. For the period Q1 2007 to Q4 2011, water use is generally water use is higher in the first
half than in the second half of any one year. Good correlation has been established between the
four period moving averages of historical water use and labour hours and expense for the period
Q1 2008 to Q4 2011.
‐20,000
‐15,000
‐10,000
‐5,000
0
5,000
10,000
15,000
20,000
0
50
100
150
200
250
300
350
400
450
Wat
er U
se (
ML
)
Exp
end
itu
re (
$'00
0)
Bulk Supply - Pioneer RiverQuarterly Water Use and Total Operations & Maintenance Expense
Total Operations & Maintenance Water Use
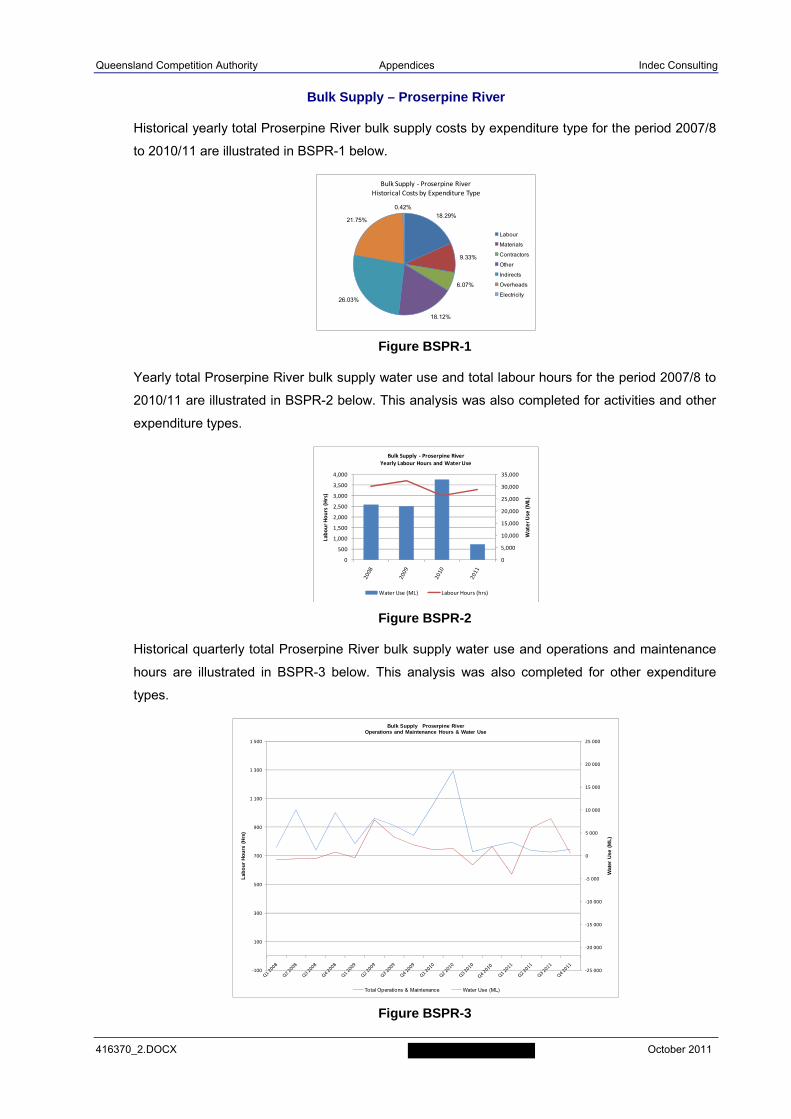
Queensland Competition Authority Appendices Indec Consulting
416370_2.DOCX October 2011
Bulk Supply – Proserpine River
Historical yearly total Proserpine River bulk supply costs by expenditure type for the period 2007/8
to 2010/11 are illustrated in BSPR-1 below.
Figure BSPR-1
Yearly total Proserpine River bulk supply water use and total labour hours for the period 2007/8 to
2010/11 are illustrated in BSPR-2 below. This analysis was also completed for activities and other
expenditure types.
Figure BSPR-2
Historical quarterly total Proserpine River bulk supply water use and operations and maintenance
hours are illustrated in BSPR-3 below. This analysis was also completed for other expenditure
types.
Figure BSPR-3
18.29%
9.33%
6.07%
18.12%
26.03%
21.75%
0.42%
Bulk Supply ‐ Proserpine RiverHistorical Costs by Expenditure Type
Labour
Materials
Contractors
Other
Indirects
Overheads
Electricity
0
5,000
10,000
15,000
20,000
25,000
30,000
35,000
0
500
1,000
1,500
2,000
2,500
3,000
3,500
4,000
Water Use (ML)
Labour Hours (Hrs)
Bulk Supply ‐ Proserpine RiverYearly Labour Hours and Water Use
Water Use (ML) Labour Hours (hrs)
‐25 000
‐20 000
‐15 000
‐10 000
‐5 000
0
5 000
10 000
15 000
20 000
25 000
‐100
100
300
500
700
900
1 100
1 300
1 500
Wat
er U
se (
ML
)
Lab
ou
r H
ou
rs (
Hrs
)
Bulk Supply Proserpine RiverOperations and Maintenance Hours & Water Use
Total Operations & Maintenance Water Use (ML)
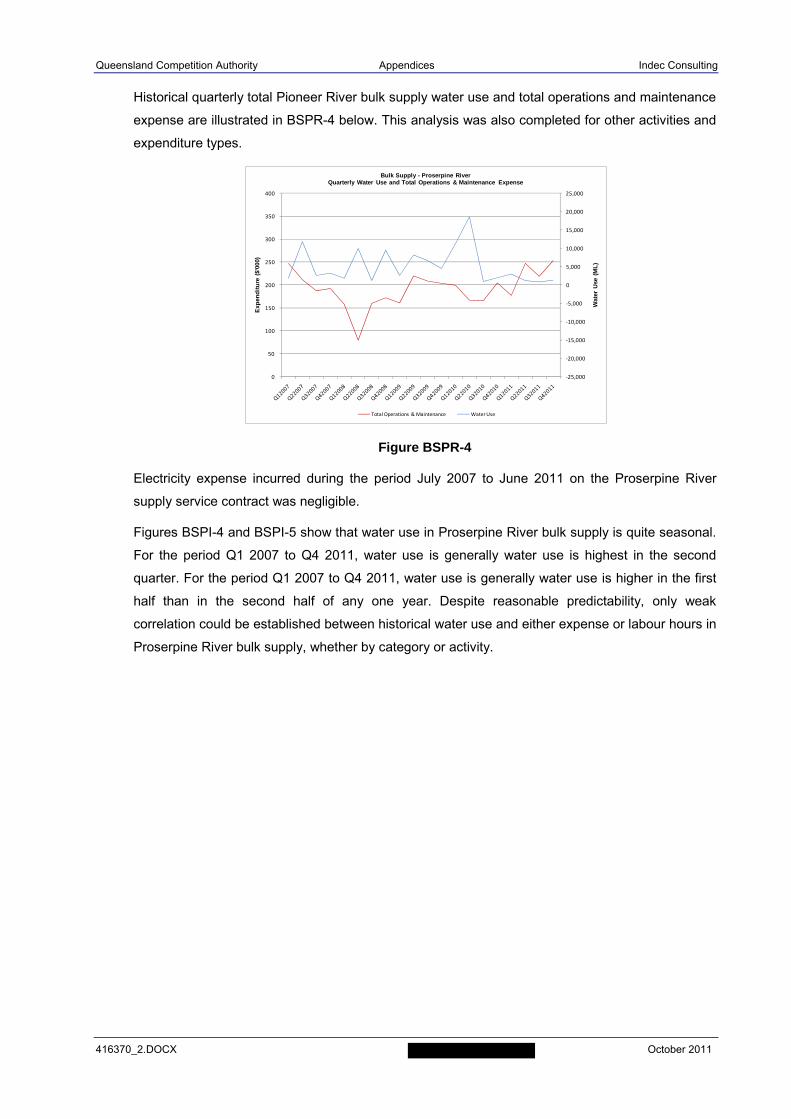
Queensland Competition Authority Appendices Indec Consulting
416370_2.DOCX October 2011
Historical quarterly total Pioneer River bulk supply water use and total operations and maintenance
expense are illustrated in BSPR-4 below. This analysis was also completed for other activities and
expenditure types.
Figure BSPR-4
Electricity expense incurred during the period July 2007 to June 2011 on the Proserpine River
supply service contract was negligible.
Figures BSPI-4 and BSPI-5 show that water use in Proserpine River bulk supply is quite seasonal.
For the period Q1 2007 to Q4 2011, water use is generally water use is highest in the second
quarter. For the period Q1 2007 to Q4 2011, water use is generally water use is higher in the first
half than in the second half of any one year. Despite reasonable predictability, only weak
correlation could be established between historical water use and either expense or labour hours in
Proserpine River bulk supply, whether by category or activity.
‐25,000
‐20,000
‐15,000
‐10,000
‐5,000
0
5,000
10,000
15,000
20,000
25,000
0
50
100
150
200
250
300
350
400
Wat
er U
se (
ML
)
Exp
end
itu
re (
$'00
0)
Bulk Supply - Proserpine RiverQuarterly Water Use and Total Operations & Maintenance Expense
Total Operations & Maintenance Water Use
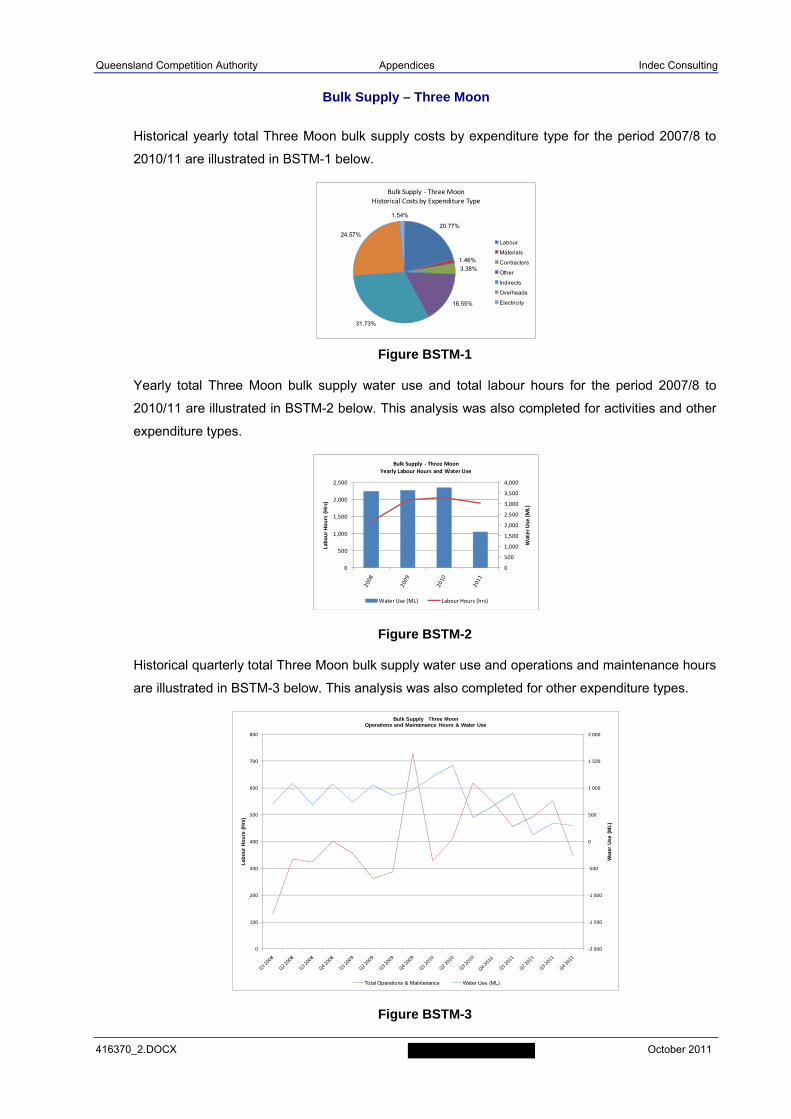
Queensland Competition Authority Appendices Indec Consulting
416370_2.DOCX October 2011
Bulk Supply – Three Moon
Historical yearly total Three Moon bulk supply costs by expenditure type for the period 2007/8 to
2010/11 are illustrated in BSTM-1 below.
Figure BSTM-1
Yearly total Three Moon bulk supply water use and total labour hours for the period 2007/8 to
2010/11 are illustrated in BSTM-2 below. This analysis was also completed for activities and other
expenditure types.
Figure BSTM-2
Historical quarterly total Three Moon bulk supply water use and operations and maintenance hours
are illustrated in BSTM-3 below. This analysis was also completed for other expenditure types.
Figure BSTM-3
20.77%
1.46%
3.38%
16.55%
31.73%
24.57%
1.54%
Bulk Supply ‐ Three MoonHistorical Costs by Expenditure Type
Labour
Materials
Contractors
Other
Indirects
Overheads
Electricity
0
500
1,000
1,500
2,000
2,500
3,000
3,500
4,000
0
500
1,000
1,500
2,000
2,500
Water Use (ML)
Labour Hours (Hrs)
Bulk Supply ‐ Three MoonYearly Labour Hours and Water Use
Water Use (ML) Labour Hours (hrs)
‐2 000
‐1 500
‐1 000
‐500
0
500
1 000
1 500
2 000
0
100
200
300
400
500
600
700
800
Wat
er U
se (
ML
)
Lab
ou
r H
ou
rs (
Hrs
)
Bulk Supply Three MoonOperations and Maintenance Hours & Water Use
Total Operations & Maintenance Water Use (ML)
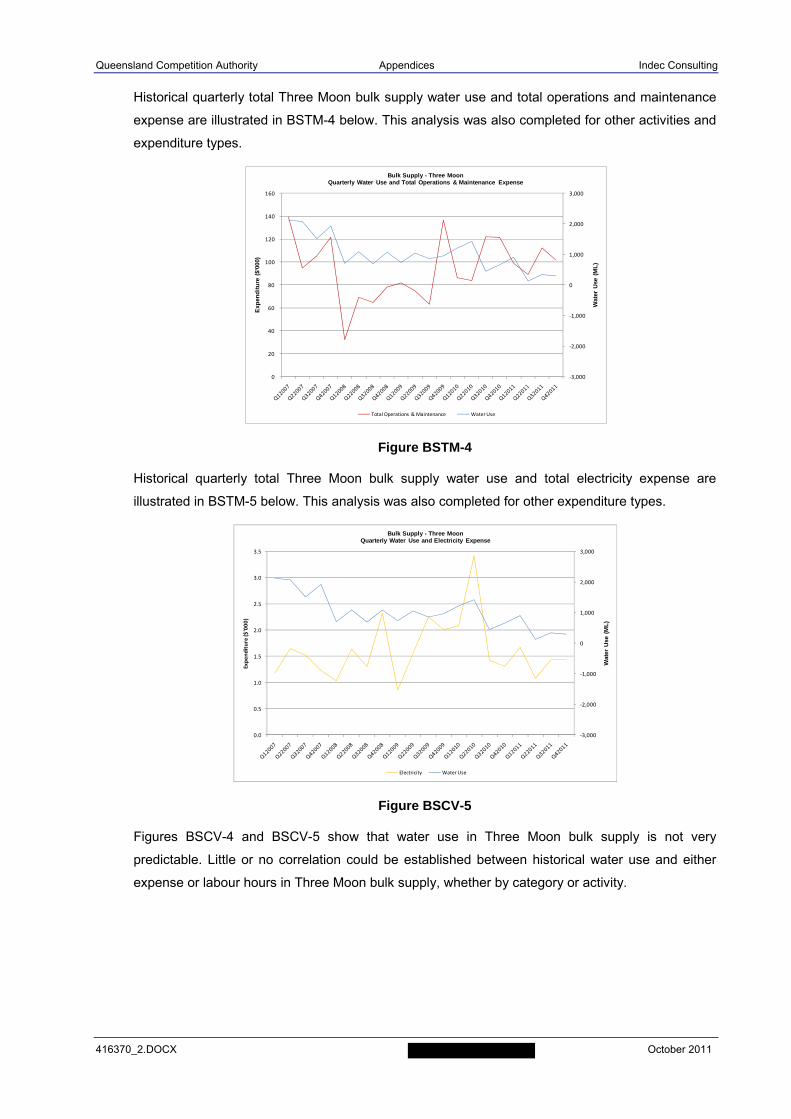
Queensland Competition Authority Appendices Indec Consulting
416370_2.DOCX October 2011
Historical quarterly total Three Moon bulk supply water use and total operations and maintenance
expense are illustrated in BSTM-4 below. This analysis was also completed for other activities and
expenditure types.
Figure BSTM-4
Historical quarterly total Three Moon bulk supply water use and total electricity expense are
illustrated in BSTM-5 below. This analysis was also completed for other expenditure types.
Figure BSCV-5
Figures BSCV-4 and BSCV-5 show that water use in Three Moon bulk supply is not very
predictable. Little or no correlation could be established between historical water use and either
expense or labour hours in Three Moon bulk supply, whether by category or activity.
‐3,000
‐2,000
‐1,000
0
1,000
2,000
3,000
0
20
40
60
80
100
120
140
160
Wat
er U
se (
ML
)
Exp
end
itu
re (
$'00
0)
Bulk Supply - Three MoonQuarterly Water Use and Total Operations & Maintenance Expense
Total Operations & Maintenance Water Use
‐3,000
‐2,000
‐1,000
0
1,000
2,000
3,000
0.0
0.5
1.0
1.5
2.0
2.5
3.0
3.5
Wat
er U
se (
ML
)
Expenditure ($'000)
Bulk Supply - Three MoonQuarterly Water Use and Electricity Expense
Electricity Water Use

Queensland Competition Authority Appendices Indec Consulting
416370_2.DOCX October 2011
Bulk Supply – Upper Burnett
Historical yearly total Upper Burnett bulk supply costs by expenditure type for the period 2007/8 to
2010/11 are illustrated in BSUB-1 below.
Figure BSUB-1
Yearly total Upper Burnett bulk supply water use and total labour hours for the period 2007/8 to
2010/11 are illustrated in BSUB-2 below. This analysis was also completed for activities and other
expenditure types.
Figure BSUB-2
Historical quarterly total Upper Burnett bulk supply water use and operations and maintenance
hours are illustrated in BSUB-3 below. This analysis was also completed for other expenditure
types.
Figure BSUB-3
21.07%
9.45%
11.56%
13.23%
20.08%
24.10%
0.51%
Bulk Supply ‐ Upper BurnettHistorical Costs by Expenditure Type
Labour
Materials
Contractors
Other
Indirects
Overheads
Electricity
0
2,000
4,000
6,000
8,000
10,000
12,000
14,000
16,000
3,800
4,000
4,200
4,400
4,600
4,800
5,000
5,200
5,400
Water Use (ML)
Labour Hours (Hrs)
Bulk Supply ‐ Upper BurnettYearly Labour Hours and Water Use
Water Use (ML) Labour Hours (hrs)
‐6 000
‐4 000
‐2 000
0
2 000
4 000
6 000
0
200
400
600
800
1 000
1 200
1 400
1 600
Wat
er U
se (
ML
)
Lab
ou
r H
ou
rs (
Hrs
)
Bulk Supply Upper BurnettOperations and Maintenance Hours & Water Use
Total Operations & Maintenance Water Use (ML)
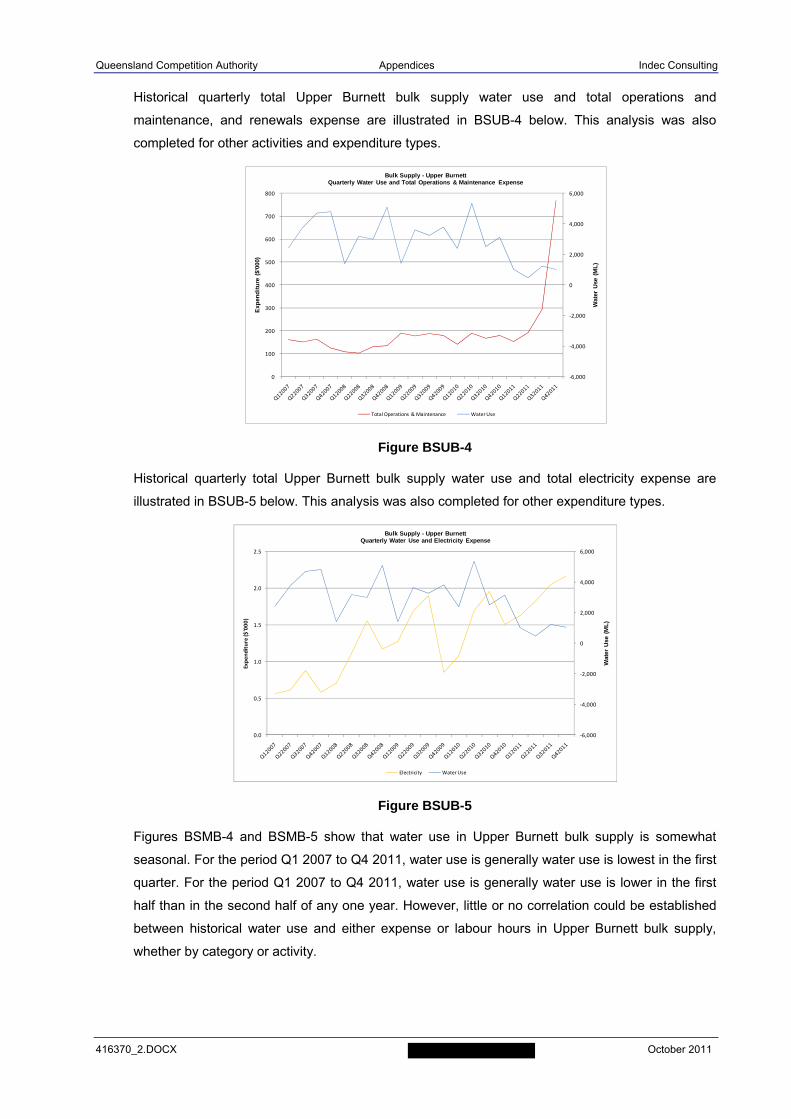
Queensland Competition Authority Appendices Indec Consulting
416370_2.DOCX October 2011
Historical quarterly total Upper Burnett bulk supply water use and total operations and
maintenance, and renewals expense are illustrated in BSUB-4 below. This analysis was also
completed for other activities and expenditure types.
Figure BSUB-4
Historical quarterly total Upper Burnett bulk supply water use and total electricity expense are
illustrated in BSUB-5 below. This analysis was also completed for other expenditure types.
Figure BSUB-5
Figures BSMB-4 and BSMB-5 show that water use in Upper Burnett bulk supply is somewhat
seasonal. For the period Q1 2007 to Q4 2011, water use is generally water use is lowest in the first
quarter. For the period Q1 2007 to Q4 2011, water use is generally water use is lower in the first
half than in the second half of any one year. However, little or no correlation could be established
between historical water use and either expense or labour hours in Upper Burnett bulk supply,
whether by category or activity.
‐6,000
‐4,000
‐2,000
0
2,000
4,000
6,000
0
100
200
300
400
500
600
700
800
Wat
er U
se (
ML
)
Exp
end
itu
re (
$'00
0)
Bulk Supply - Upper BurnettQuarterly Water Use and Total Operations & Maintenance Expense
Total Operations & Maintenance Water Use
‐6,000
‐4,000
‐2,000
0
2,000
4,000
6,000
0.0
0.5
1.0
1.5
2.0
2.5
Wat
er U
se (
ML
)
Expenditure ($'000)
Bulk Supply - Upper BurnettQuarterly Water Use and Electricity Expense
Electricity Water Use
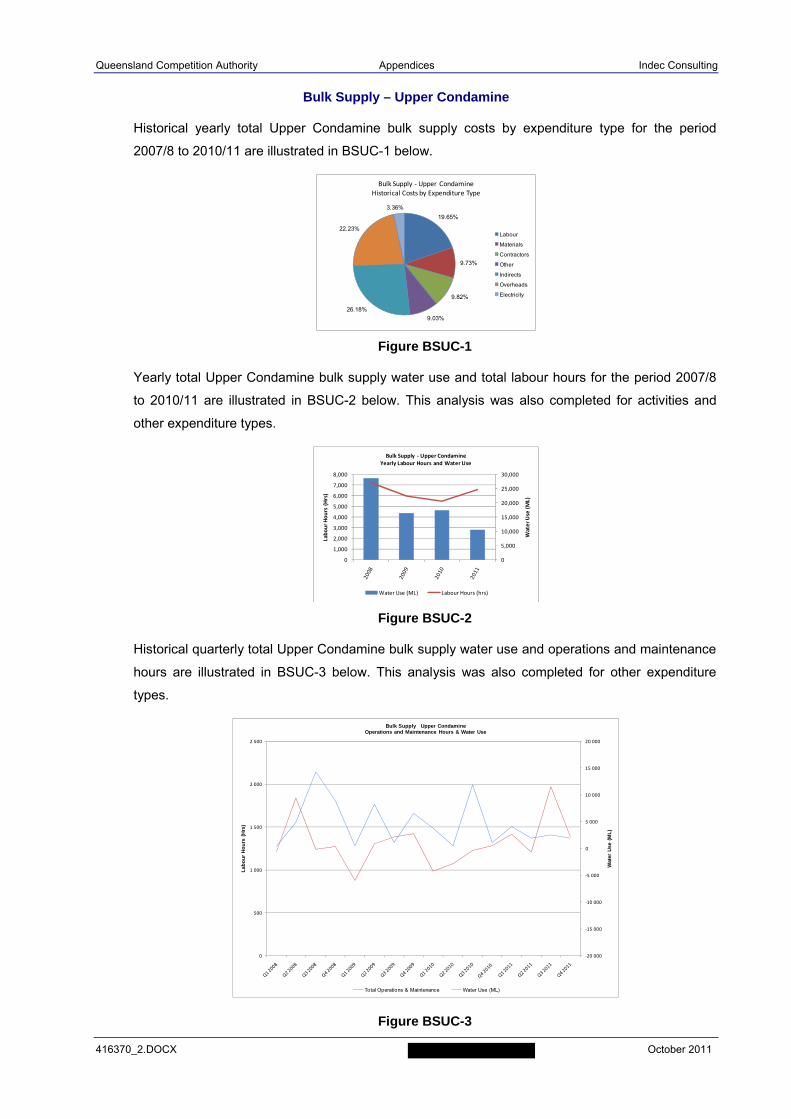
Queensland Competition Authority Appendices Indec Consulting
416370_2.DOCX October 2011
Bulk Supply – Upper Condamine
Historical yearly total Upper Condamine bulk supply costs by expenditure type for the period
2007/8 to 2010/11 are illustrated in BSUC-1 below.
Figure BSUC-1
Yearly total Upper Condamine bulk supply water use and total labour hours for the period 2007/8
to 2010/11 are illustrated in BSUC-2 below. This analysis was also completed for activities and
other expenditure types.
Figure BSUC-2
Historical quarterly total Upper Condamine bulk supply water use and operations and maintenance
hours are illustrated in BSUC-3 below. This analysis was also completed for other expenditure
types.
Figure BSUC-3
19.65%
9.73%
9.82%
9.03%
26.18%
22.23%
3.36%
Bulk Supply ‐ Upper CondamineHistorical Costs by Expenditure Type
Labour
Materials
Contractors
Other
Indirects
Overheads
Electricity
0
5,000
10,000
15,000
20,000
25,000
30,000
0
1,000
2,000
3,000
4,000
5,000
6,000
7,000
8,000
Water Use (ML)
Labour Hours (Hrs)
Bulk Supply ‐ Upper CondamineYearly Labour Hours and Water Use
Water Use (ML) Labour Hours (hrs)
‐20 000
‐15 000
‐10 000
‐5 000
0
5 000
10 000
15 000
20 000
0
500
1 000
1 500
2 000
2 500
Wat
er U
se (
ML
)
Lab
ou
r H
ou
rs (
Hrs
)
Bulk Supply Upper CondamineOperations and Maintenance Hours & Water Use
Total Operations & Maintenance Water Use (ML)
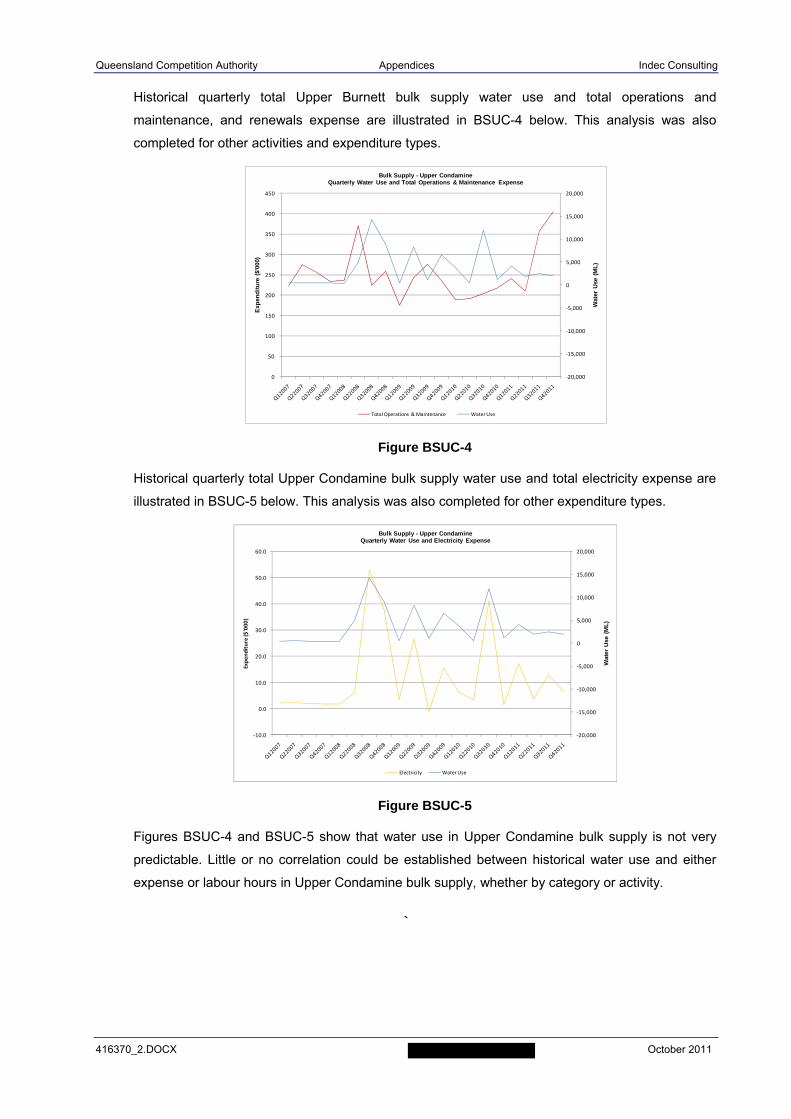
Queensland Competition Authority Appendices Indec Consulting
416370_2.DOCX October 2011
Historical quarterly total Upper Burnett bulk supply water use and total operations and
maintenance, and renewals expense are illustrated in BSUC-4 below. This analysis was also
completed for other activities and expenditure types.
Figure BSUC-4
Historical quarterly total Upper Condamine bulk supply water use and total electricity expense are
illustrated in BSUC-5 below. This analysis was also completed for other expenditure types.
Figure BSUC-5
Figures BSUC-4 and BSUC-5 show that water use in Upper Condamine bulk supply is not very
predictable. Little or no correlation could be established between historical water use and either
expense or labour hours in Upper Condamine bulk supply, whether by category or activity.
`
‐20,000
‐15,000
‐10,000
‐5,000
0
5,000
10,000
15,000
20,000
0
50
100
150
200
250
300
350
400
450
Wat
er U
se (
ML
)
Exp
end
itu
re (
$'00
0)
Bulk Supply - Upper CondamineQuarterly Water Use and Total Operations & Maintenance Expense
Total Operations & Maintenance Water Use
‐20,000
‐15,000
‐10,000
‐5,000
0
5,000
10,000
15,000
20,000
‐10.0
0.0
10.0
20.0
30.0
40.0
50.0
60.0
Wat
er U
se (
ML
)
Expenditure ($'000)
Bulk Supply - Upper CondamineQuarterly Water Use and Electricity Expense
Electricity Water Use

Queensland Competition Authority Appendices Indec Consulting
416370_2.DOCX October 2011
APPENDIX I
Fixed/Variable Assessment
Water Distribution Systems
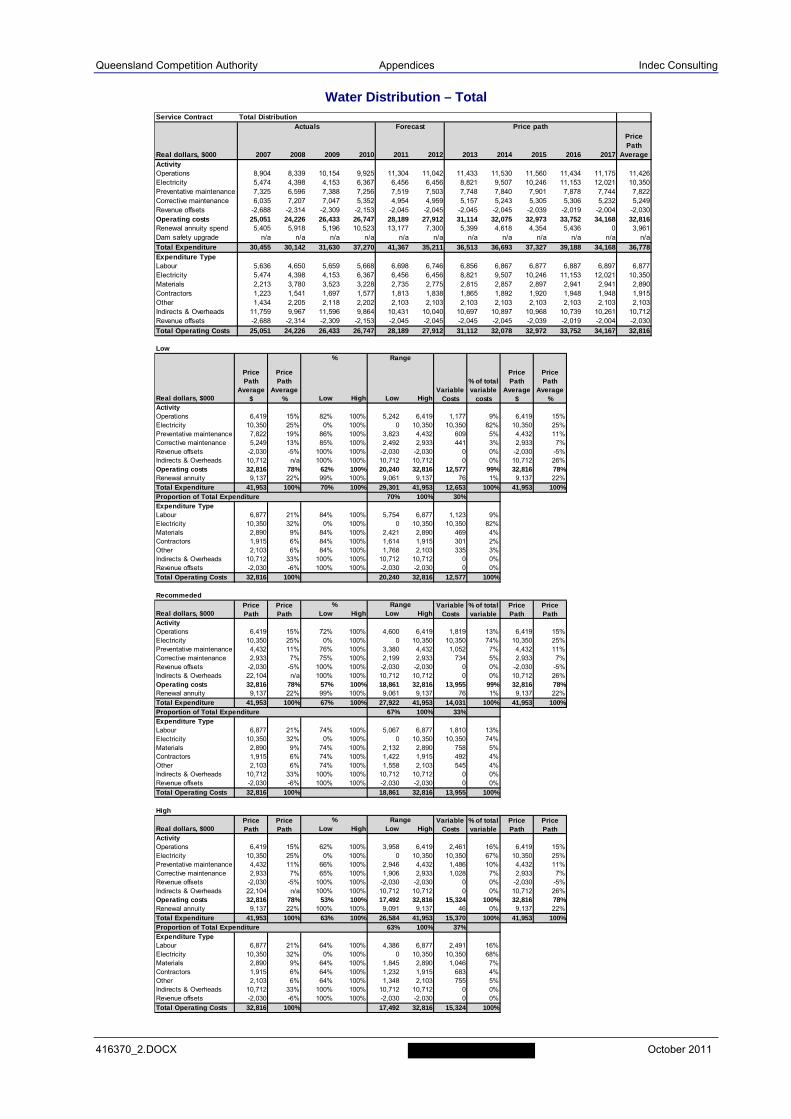
Queensland Competition Authority Appendices Indec Consulting
416370_2.DOCX October 2011
Water Distribution – Total
Service Contract Total Distribution
Real dollars, $000 2007 2008 2009 2010 2011 2012 2013 2014 2015 2016 2017ActivityOperations 8,904 8,339 10,154 9,925 11,304 11,042 11,433 11,530 11,560 11,434 11,175 11,426Electricity 5,474 4,398 4,153 6,367 6,456 6,456 8,821 9,507 10,246 11,153 12,021 10,350Preventative maintenance 7,325 6,596 7,388 7,256 7,519 7,503 7,748 7,840 7,901 7,878 7,744 7,822Corrective maintenance 6,035 7,207 7,047 5,352 4,954 4,959 5,157 5,243 5,305 5,306 5,232 5,249Revenue offsets -2,688 -2,314 -2,309 -2,153 -2,045 -2,045 -2,045 -2,045 -2,039 -2,019 -2,004 -2,030Operating costs 25,051 24,226 26,433 26,747 28,189 27,912 31,114 32,075 32,973 33,752 34,168 32,816Renewal annuity spend 5,405 5,918 5,196 10,523 13,177 7,300 5,399 4,618 4,354 5,436 0 3,961Dam safety upgrade n/a n/a n/a n/a n/a n/a n/a n/a n/a n/a n/a n/a
Total Expenditure 30,455 30,142 31,630 37,270 41,367 35,211 36,513 36,693 37,327 39,188 34,168 36,778Expenditure TypeLabour 5,636 4,650 5,659 5,668 6,698 6,746 6,856 6,867 6,877 6,887 6,897 6,877Electricity 5,474 4,398 4,153 6,367 6,456 6,456 8,821 9,507 10,246 11,153 12,021 10,350Materials 2,213 3,780 3,523 3,228 2,735 2,775 2,815 2,857 2,897 2,941 2,941 2,890Contractors 1,223 1,541 1,697 1,577 1,813 1,838 1,865 1,892 1,920 1,948 1,948 1,915Other 1,434 2,205 2,118 2,202 2,103 2,103 2,103 2,103 2,103 2,103 2,103 2,103Indirects & Overheads 11,759 9,967 11,596 9,864 10,431 10,040 10,697 10,897 10,968 10,739 10,261 10,712Revenue offsets -2,688 -2,314 -2,309 -2,153 -2,045 -2,045 -2,045 -2,045 -2,039 -2,019 -2,004 -2,030
Total Operating Costs 25,051 24,226 26,433 26,747 28,189 27,912 31,112 32,078 32,972 33,752 34,167 32,816
Price Path
Average
Actuals Forecast Price path
Low
Real dollars, $000 Low High Low HighActivityOperations 6,419 15% 82% 100% 5,242 6,419 1,177 9% 6,419 15%Electricity 10,350 25% 0% 100% 0 10,350 10,350 82% 10,350 25%Preventative maintenance 7,822 19% 86% 100% 3,823 4,432 609 5% 4,432 11%Corrective maintenance 5,249 13% 85% 100% 2,492 2,933 441 3% 2,933 7%Revenue offsets -2,030 -5% 100% 100% -2,030 -2,030 0 0% -2,030 -5%Indirects & Overheads 10,712 n/a 100% 100% 10,712 10,712 0 0% 10,712 26%Operating costs 32,816 78% 62% 100% 20,240 32,816 12,577 99% 32,816 78%Renewal annuity 9,137 22% 99% 100% 9,061 9,137 76 1% 9,137 22%
Total Expenditure 41,953 100% 70% 100% 29,301 41,953 12,653 100% 41,953 100%Proportion of Total Expenditure 70% 100% 30%Expenditure TypeLabour 6,877 21% 84% 100% 5,754 6,877 1,123 9%Electricity 10,350 32% 0% 100% 0 10,350 10,350 82%Materials 2,890 9% 84% 100% 2,421 2,890 469 4%Contractors 1,915 6% 84% 100% 1,614 1,915 301 2%Other 2,103 6% 84% 100% 1,768 2,103 335 3%Indirects & Overheads 10,712 33% 100% 100% 10,712 10,712 0 0%Revenue offsets -2,030 -6% 100% 100% -2,030 -2,030 0 0%
Total Operating Costs 32,816 100% 20,240 32,816 12,577 100%
Recommeded
Real dollars, $000 Low High Low HighActivityOperations 6,419 15% 72% 100% 4,600 6,419 1,819 13% 6,419 15%Electricity 10,350 25% 0% 100% 0 10,350 10,350 74% 10,350 25%Preventative maintenance 4,432 11% 76% 100% 3,380 4,432 1,052 7% 4,432 11%Corrective maintenance 2,933 7% 75% 100% 2,199 2,933 734 5% 2,933 7%Revenue offsets -2,030 -5% 100% 100% -2,030 -2,030 0 0% -2,030 -5%Indirects & Overheads 22,104 n/a 100% 100% 10,712 10,712 0 0% 10,712 26%Operating costs 32,816 78% 57% 100% 18,861 32,816 13,955 99% 32,816 78%Renewal annuity 9,137 22% 99% 100% 9,061 9,137 76 1% 9,137 22%
Total Expenditure 41,953 100% 67% 100% 27,922 41,953 14,031 100% 41,953 100%Proportion of Total Expenditure 67% 100% 33%Expenditure TypeLabour 6,877 21% 74% 100% 5,067 6,877 1,810 13%Electricity 10,350 32% 0% 100% 0 10,350 10,350 74%Materials 2,890 9% 74% 100% 2,132 2,890 758 5%Contractors 1,915 6% 74% 100% 1,422 1,915 492 4%Other 2,103 6% 74% 100% 1,558 2,103 545 4%Indirects & Overheads 10,712 33% 100% 100% 10,712 10,712 0 0%Revenue offsets -2,030 -6% 100% 100% -2,030 -2,030 0 0%
Total Operating Costs 32,816 100% 18,861 32,816 13,955 100%
High
Real dollars, $000 Low High Low HighActivityOperations 6,419 15% 62% 100% 3,958 6,419 2,461 16% 6,419 15%Electricity 10,350 25% 0% 100% 0 10,350 10,350 67% 10,350 25%Preventative maintenance 4,432 11% 66% 100% 2,946 4,432 1,486 10% 4,432 11%Corrective maintenance 2,933 7% 65% 100% 1,906 2,933 1,028 7% 2,933 7%Revenue offsets -2,030 -5% 100% 100% -2,030 -2,030 0 0% -2,030 -5%Indirects & Overheads 22,104 n/a 100% 100% 10,712 10,712 0 0% 10,712 26%Operating costs 32,816 78% 53% 100% 17,492 32,816 15,324 100% 32,816 78%Renewal annuity 9,137 22% 100% 100% 9,091 9,137 46 0% 9,137 22%
Total Expenditure 41,953 100% 63% 100% 26,584 41,953 15,370 100% 41,953 100%Proportion of Total Expenditure 63% 100% 37%Expenditure TypeLabour 6,877 21% 64% 100% 4,386 6,877 2,491 16%Electricity 10,350 32% 0% 100% 0 10,350 10,350 68%Materials 2,890 9% 64% 100% 1,845 2,890 1,046 7%Contractors 1,915 6% 64% 100% 1,232 1,915 683 4%Other 2,103 6% 64% 100% 1,348 2,103 755 5%Indirects & Overheads 10,712 33% 100% 100% 10,712 10,712 0 0%Revenue offsets -2,030 -6% 100% 100% -2,030 -2,030 0 0%
Total Operating Costs 32,816 100% 17,492 32,816 15,324 100%
% of total variable
Price Path
Price Path
Price Path
Price Path
% Range Variable Costs
Price Path
Average %
Price Path
Average $
Price Path
Average %
% Range
Variable Costs
% of total variable
costs
Price Path
Average $
% of total variable
Price Path
Price Path
Price Path
Price Path
% Range Variable Costs
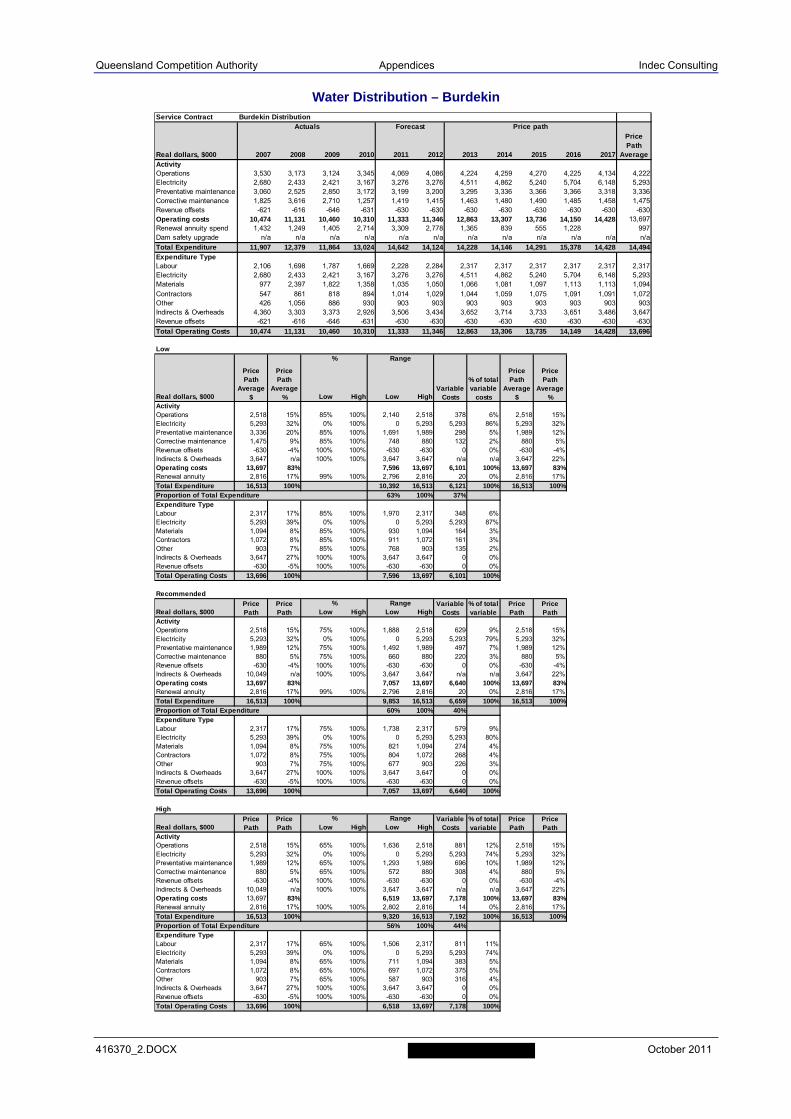
Queensland Competition Authority Appendices Indec Consulting
416370_2.DOCX October 2011
Water Distribution – Burdekin
Service Contract Burdekin Distribution
Real dollars, $000 2007 2008 2009 2010 2011 2012 2013 2014 2015 2016 2017ActivityOperations 3,530 3,173 3,124 3,345 4,069 4,086 4,224 4,259 4,270 4,225 4,134 4,222Electricity 2,680 2,433 2,421 3,167 3,276 3,276 4,511 4,862 5,240 5,704 6,148 5,293Preventative maintenance 3,060 2,525 2,850 3,172 3,199 3,200 3,295 3,336 3,366 3,366 3,318 3,336Corrective maintenance 1,825 3,616 2,710 1,257 1,419 1,415 1,463 1,480 1,490 1,485 1,458 1,475Revenue offsets -621 -616 -646 -631 -630 -630 -630 -630 -630 -630 -630 -630Operating costs 10,474 11,131 10,460 10,310 11,333 11,346 12,863 13,307 13,736 14,150 14,428 13,697Renewal annuity spend 1,432 1,249 1,405 2,714 3,309 2,778 1,365 839 555 1,228 997Dam safety upgrade n/a n/a n/a n/a n/a n/a n/a n/a n/a n/a n/a n/a
Total Expenditure 11,907 12,379 11,864 13,024 14,642 14,124 14,228 14,146 14,291 15,378 14,428 14,494Expenditure TypeLabour 2,106 1,698 1,787 1,669 2,228 2,284 2,317 2,317 2,317 2,317 2,317 2,317Electricity 2,680 2,433 2,421 3,167 3,276 3,276 4,511 4,862 5,240 5,704 6,148 5,293Materials 977 2,397 1,822 1,358 1,035 1,050 1,066 1,081 1,097 1,113 1,113 1,094Contractors 547 861 818 894 1,014 1,029 1,044 1,059 1,075 1,091 1,091 1,072Other 426 1,056 886 930 903 903 903 903 903 903 903 903Indirects & Overheads 4,360 3,303 3,373 2,926 3,506 3,434 3,652 3,714 3,733 3,651 3,486 3,647Revenue offsets -621 -616 -646 -631 -630 -630 -630 -630 -630 -630 -630 -630
Total Operating Costs 10,474 11,131 10,460 10,310 11,333 11,346 12,863 13,306 13,735 14,149 14,428 13,696
Price Path
Average
Actuals Forecast Price path
Low
Real dollars, $000 Low High Low HighActivityOperations 2,518 15% 85% 100% 2,140 2,518 378 6% 2,518 15%Electricity 5,293 32% 0% 100% 0 5,293 5,293 86% 5,293 32%Preventative maintenance 3,336 20% 85% 100% 1,691 1,989 298 5% 1,989 12%Corrective maintenance 1,475 9% 85% 100% 748 880 132 2% 880 5%Revenue offsets -630 -4% 100% 100% -630 -630 0 0% -630 -4%Indirects & Overheads 3,647 n/a 100% 100% 3,647 3,647 n/a n/a 3,647 22%Operating costs 13,697 83% 7,596 13,697 6,101 100% 13,697 83%Renewal annuity 2,816 17% 99% 100% 2,796 2,816 20 0% 2,816 17%
Total Expenditure 16,513 100% 10,392 16,513 6,121 100% 16,513 100%Proportion of Total Expenditure 63% 100% 37%Expenditure TypeLabour 2,317 17% 85% 100% 1,970 2,317 348 6%Electricity 5,293 39% 0% 100% 0 5,293 5,293 87%Materials 1,094 8% 85% 100% 930 1,094 164 3%Contractors 1,072 8% 85% 100% 911 1,072 161 3%Other 903 7% 85% 100% 768 903 135 2%Indirects & Overheads 3,647 27% 100% 100% 3,647 3,647 0 0%Revenue offsets -630 -5% 100% 100% -630 -630 0 0%
Total Operating Costs 13,696 100% 7,596 13,697 6,101 100%
Recommended
Real dollars, $000 Low High Low HighActivityOperations 2,518 15% 75% 100% 1,888 2,518 629 9% 2,518 15%Electricity 5,293 32% 0% 100% 0 5,293 5,293 79% 5,293 32%Preventative maintenance 1,989 12% 75% 100% 1,492 1,989 497 7% 1,989 12%Corrective maintenance 880 5% 75% 100% 660 880 220 3% 880 5%Revenue offsets -630 -4% 100% 100% -630 -630 0 0% -630 -4%Indirects & Overheads 10,049 n/a 100% 100% 3,647 3,647 n/a n/a 3,647 22%Operating costs 13,697 83% 7,057 13,697 6,640 100% 13,697 83%Renewal annuity 2,816 17% 99% 100% 2,796 2,816 20 0% 2,816 17%
Total Expenditure 16,513 100% 9,853 16,513 6,659 100% 16,513 100%Proportion of Total Expenditure 60% 100% 40%Expenditure TypeLabour 2,317 17% 75% 100% 1,738 2,317 579 9%Electricity 5,293 39% 0% 100% 0 5,293 5,293 80%Materials 1,094 8% 75% 100% 821 1,094 274 4%Contractors 1,072 8% 75% 100% 804 1,072 268 4%Other 903 7% 75% 100% 677 903 226 3%Indirects & Overheads 3,647 27% 100% 100% 3,647 3,647 0 0%Revenue offsets -630 -5% 100% 100% -630 -630 0 0%
Total Operating Costs 13,696 100% 7,057 13,697 6,640 100%
High
Real dollars, $000 Low High Low HighActivityOperations 2,518 15% 65% 100% 1,636 2,518 881 12% 2,518 15%Electricity 5,293 32% 0% 100% 0 5,293 5,293 74% 5,293 32%Preventative maintenance 1,989 12% 65% 100% 1,293 1,989 696 10% 1,989 12%Corrective maintenance 880 5% 65% 100% 572 880 308 4% 880 5%Revenue offsets -630 -4% 100% 100% -630 -630 0 0% -630 -4%Indirects & Overheads 10,049 n/a 100% 100% 3,647 3,647 n/a n/a 3,647 22%Operating costs 13,697 83% 6,519 13,697 7,178 100% 13,697 83%Renewal annuity 2,816 17% 100% 100% 2,802 2,816 14 0% 2,816 17%
Total Expenditure 16,513 100% 9,320 16,513 7,192 100% 16,513 100%Proportion of Total Expenditure 56% 100% 44%Expenditure TypeLabour 2,317 17% 65% 100% 1,506 2,317 811 11%Electricity 5,293 39% 0% 100% 0 5,293 5,293 74%Materials 1,094 8% 65% 100% 711 1,094 383 5%Contractors 1,072 8% 65% 100% 697 1,072 375 5%Other 903 7% 65% 100% 587 903 316 4%Indirects & Overheads 3,647 27% 100% 100% 3,647 3,647 0 0%Revenue offsets -630 -5% 100% 100% -630 -630 0 0%
Total Operating Costs 13,696 100% 6,518 13,697 7,178 100%
% of total variable
Price Path
Price Path
Price Path
Price Path
% Range Variable Costs
Price Path
Average $
%
Variable Costs
Range
Price Path
Average %
% of total variable
costs
Price Path
Average $
Price Path
Average %
% of total variable
Price Path
Price Path
Price Path
Price Path
% Range Variable Costs
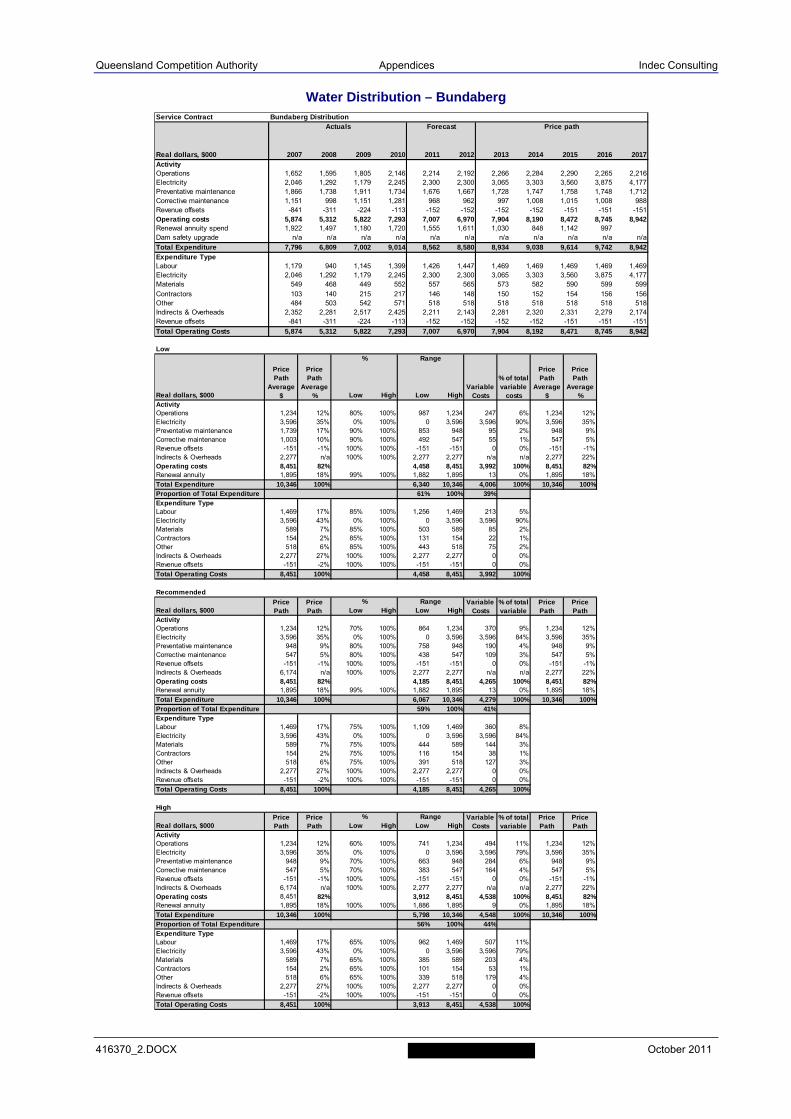
Queensland Competition Authority Appendices Indec Consulting
416370_2.DOCX October 2011
Water Distribution – Bundaberg
Service Contract Bundaberg Distribution
Real dollars, $000 2007 2008 2009 2010 2011 2012 2013 2014 2015 2016 2017ActivityOperations 1,652 1,595 1,805 2,146 2,214 2,192 2,266 2,284 2,290 2,265 2,216Electricity 2,046 1,292 1,179 2,245 2,300 2,300 3,065 3,303 3,560 3,875 4,177Preventative maintenance 1,866 1,738 1,911 1,734 1,676 1,667 1,728 1,747 1,758 1,748 1,712Corrective maintenance 1,151 998 1,151 1,281 968 962 997 1,008 1,015 1,008 988Revenue offsets -841 -311 -224 -113 -152 -152 -152 -152 -151 -151 -151Operating costs 5,874 5,312 5,822 7,293 7,007 6,970 7,904 8,190 8,472 8,745 8,942Renewal annuity spend 1,922 1,497 1,180 1,720 1,555 1,611 1,030 848 1,142 997Dam safety upgrade n/a n/a n/a n/a n/a n/a n/a n/a n/a n/a n/a
Total Expenditure 7,796 6,809 7,002 9,014 8,562 8,580 8,934 9,038 9,614 9,742 8,942Expenditure TypeLabour 1,179 940 1,145 1,399 1,426 1,447 1,469 1,469 1,469 1,469 1,469Electricity 2,046 1,292 1,179 2,245 2,300 2,300 3,065 3,303 3,560 3,875 4,177Materials 549 468 449 552 557 565 573 582 590 599 599Contractors 103 140 215 217 146 148 150 152 154 156 156Other 484 503 542 571 518 518 518 518 518 518 518Indirects & Overheads 2,352 2,281 2,517 2,425 2,211 2,143 2,281 2,320 2,331 2,279 2,174Revenue offsets -841 -311 -224 -113 -152 -152 -152 -152 -151 -151 -151
Total Operating Costs 5,874 5,312 5,822 7,293 7,007 6,970 7,904 8,192 8,471 8,745 8,942
Actuals Forecast Price path
Low
Real dollars, $000 Low High Low HighActivityOperations 1,234 12% 80% 100% 987 1,234 247 6% 1,234 12%Electricity 3,596 35% 0% 100% 0 3,596 3,596 90% 3,596 35%Preventative maintenance 1,739 17% 90% 100% 853 948 95 2% 948 9%Corrective maintenance 1,003 10% 90% 100% 492 547 55 1% 547 5%Revenue offsets -151 -1% 100% 100% -151 -151 0 0% -151 -1%Indirects & Overheads 2,277 n/a 100% 100% 2,277 2,277 n/a n/a 2,277 22%Operating costs 8,451 82% 4,458 8,451 3,992 100% 8,451 82%Renewal annuity 1,895 18% 99% 100% 1,882 1,895 13 0% 1,895 18%
Total Expenditure 10,346 100% 6,340 10,346 4,006 100% 10,346 100%Proportion of Total Expenditure 61% 100% 39%Expenditure TypeLabour 1,469 17% 85% 100% 1,256 1,469 213 5%Electricity 3,596 43% 0% 100% 0 3,596 3,596 90%Materials 589 7% 85% 100% 503 589 85 2%Contractors 154 2% 85% 100% 131 154 22 1%Other 518 6% 85% 100% 443 518 75 2%Indirects & Overheads 2,277 27% 100% 100% 2,277 2,277 0 0%Revenue offsets -151 -2% 100% 100% -151 -151 0 0%
Total Operating Costs 8,451 100% 4,458 8,451 3,992 100%
Recommended
Real dollars, $000 Low High Low HighActivityOperations 1,234 12% 70% 100% 864 1,234 370 9% 1,234 12%Electricity 3,596 35% 0% 100% 0 3,596 3,596 84% 3,596 35%Preventative maintenance 948 9% 80% 100% 758 948 190 4% 948 9%Corrective maintenance 547 5% 80% 100% 438 547 109 3% 547 5%Revenue offsets -151 -1% 100% 100% -151 -151 0 0% -151 -1%Indirects & Overheads 6,174 n/a 100% 100% 2,277 2,277 n/a n/a 2,277 22%Operating costs 8,451 82% 4,185 8,451 4,265 100% 8,451 82%Renewal annuity 1,895 18% 99% 100% 1,882 1,895 13 0% 1,895 18%
Total Expenditure 10,346 100% 6,067 10,346 4,279 100% 10,346 100%Proportion of Total Expenditure 59% 100% 41%Expenditure TypeLabour 1,469 17% 75% 100% 1,109 1,469 360 8%Electricity 3,596 43% 0% 100% 0 3,596 3,596 84%Materials 589 7% 75% 100% 444 589 144 3%Contractors 154 2% 75% 100% 116 154 38 1%Other 518 6% 75% 100% 391 518 127 3%Indirects & Overheads 2,277 27% 100% 100% 2,277 2,277 0 0%Revenue offsets -151 -2% 100% 100% -151 -151 0 0%
Total Operating Costs 8,451 100% 4,185 8,451 4,265 100%
High
Real dollars, $000 Low High Low HighActivityOperations 1,234 12% 60% 100% 741 1,234 494 11% 1,234 12%Electricity 3,596 35% 0% 100% 0 3,596 3,596 79% 3,596 35%Preventative maintenance 948 9% 70% 100% 663 948 284 6% 948 9%Corrective maintenance 547 5% 70% 100% 383 547 164 4% 547 5%Revenue offsets -151 -1% 100% 100% -151 -151 0 0% -151 -1%Indirects & Overheads 6,174 n/a 100% 100% 2,277 2,277 n/a n/a 2,277 22%Operating costs 8,451 82% 3,912 8,451 4,538 100% 8,451 82%Renewal annuity 1,895 18% 100% 100% 1,886 1,895 9 0% 1,895 18%
Total Expenditure 10,346 100% 5,798 10,346 4,548 100% 10,346 100%Proportion of Total Expenditure 56% 100% 44%Expenditure TypeLabour 1,469 17% 65% 100% 962 1,469 507 11%Electricity 3,596 43% 0% 100% 0 3,596 3,596 79%Materials 589 7% 65% 100% 385 589 203 4%Contractors 154 2% 65% 100% 101 154 53 1%Other 518 6% 65% 100% 339 518 179 4%Indirects & Overheads 2,277 27% 100% 100% 2,277 2,277 0 0%Revenue offsets -151 -2% 100% 100% -151 -151 0 0%
Total Operating Costs 8,451 100% 3,913 8,451 4,538 100%
% of total variable
Price Path
Price Path
Price Path
Price Path
% Range Variable Costs
Price Path
Average $
% Range
Variable Costs
Price Path
Average %
% of total variable
costs
Price Path
Average $
Price Path
Average %
% of total variable
Price Path
Price Path
Price Path
Price Path
% Range Variable Costs
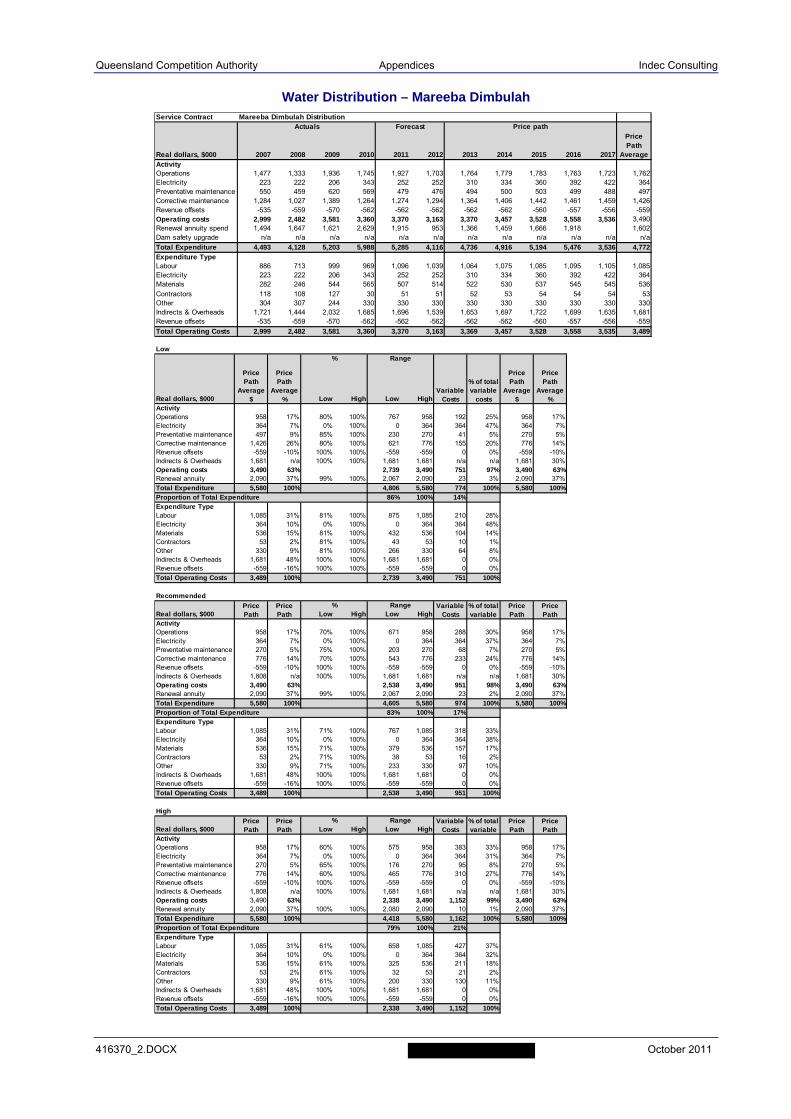
Queensland Competition Authority Appendices Indec Consulting
416370_2.DOCX October 2011
Water Distribution – Mareeba Dimbulah
Service Contract Mareeba Dimbulah Distribution
Real dollars, $000 2007 2008 2009 2010 2011 2012 2013 2014 2015 2016 2017ActivityOperations 1,477 1,333 1,936 1,745 1,927 1,703 1,764 1,779 1,783 1,763 1,723 1,762Electricity 223 222 206 343 252 252 310 334 360 392 422 364Preventative maintenance 550 459 620 569 479 476 494 500 503 499 488 497Corrective maintenance 1,284 1,027 1,389 1,264 1,274 1,294 1,364 1,406 1,442 1,461 1,459 1,426Revenue offsets -535 -559 -570 -562 -562 -562 -562 -562 -560 -557 -556 -559Operating costs 2,999 2,482 3,581 3,360 3,370 3,163 3,370 3,457 3,528 3,558 3,536 3,490Renewal annuity spend 1,494 1,647 1,621 2,629 1,915 953 1,366 1,459 1,666 1,918 1,602Dam safety upgrade n/a n/a n/a n/a n/a n/a n/a n/a n/a n/a n/a n/a
Total Expenditure 4,493 4,128 5,203 5,988 5,285 4,116 4,736 4,916 5,194 5,476 3,536 4,772Expenditure TypeLabour 886 713 999 969 1,096 1,039 1,064 1,075 1,085 1,095 1,105 1,085Electricity 223 222 206 343 252 252 310 334 360 392 422 364Materials 282 246 544 565 507 514 522 530 537 545 545 536Contractors 118 108 127 30 51 51 52 53 54 54 54 53Other 304 307 244 330 330 330 330 330 330 330 330 330Indirects & Overheads 1,721 1,444 2,032 1,685 1,696 1,539 1,653 1,697 1,722 1,699 1,635 1,681Revenue offsets -535 -559 -570 -562 -562 -562 -562 -562 -560 -557 -556 -559
Total Operating Costs 2,999 2,482 3,581 3,360 3,370 3,163 3,369 3,457 3,528 3,558 3,535 3,489
Price Path
Average
Actuals Forecast Price path
Low
Real dollars, $000 Low High Low HighActivityOperations 958 17% 80% 100% 767 958 192 25% 958 17%Electricity 364 7% 0% 100% 0 364 364 47% 364 7%Preventative maintenance 497 9% 85% 100% 230 270 41 5% 270 5%Corrective maintenance 1,426 26% 80% 100% 621 776 155 20% 776 14%Revenue offsets -559 -10% 100% 100% -559 -559 0 0% -559 -10%Indirects & Overheads 1,681 n/a 100% 100% 1,681 1,681 n/a n/a 1,681 30%Operating costs 3,490 63% 2,739 3,490 751 97% 3,490 63%Renewal annuity 2,090 37% 99% 100% 2,067 2,090 23 3% 2,090 37%
Total Expenditure 5,580 100% 4,806 5,580 774 100% 5,580 100%Proportion of Total Expenditure 86% 100% 14%Expenditure TypeLabour 1,085 31% 81% 100% 875 1,085 210 28%Electricity 364 10% 0% 100% 0 364 364 48%Materials 536 15% 81% 100% 432 536 104 14%Contractors 53 2% 81% 100% 43 53 10 1%Other 330 9% 81% 100% 266 330 64 8%Indirects & Overheads 1,681 48% 100% 100% 1,681 1,681 0 0%Revenue offsets -559 -16% 100% 100% -559 -559 0 0%
Total Operating Costs 3,489 100% 2,739 3,490 751 100%
Recommended
Real dollars, $000 Low High Low HighActivityOperations 958 17% 70% 100% 671 958 288 30% 958 17%Electricity 364 7% 0% 100% 0 364 364 37% 364 7%Preventative maintenance 270 5% 75% 100% 203 270 68 7% 270 5%Corrective maintenance 776 14% 70% 100% 543 776 233 24% 776 14%Revenue offsets -559 -10% 100% 100% -559 -559 0 0% -559 -10%Indirects & Overheads 1,808 n/a 100% 100% 1,681 1,681 n/a n/a 1,681 30%Operating costs 3,490 63% 2,538 3,490 951 98% 3,490 63%Renewal annuity 2,090 37% 99% 100% 2,067 2,090 23 2% 2,090 37%
Total Expenditure 5,580 100% 4,605 5,580 974 100% 5,580 100%Proportion of Total Expenditure 83% 100% 17%Expenditure TypeLabour 1,085 31% 71% 100% 767 1,085 318 33%Electricity 364 10% 0% 100% 0 364 364 38%Materials 536 15% 71% 100% 379 536 157 17%Contractors 53 2% 71% 100% 38 53 16 2%Other 330 9% 71% 100% 233 330 97 10%Indirects & Overheads 1,681 48% 100% 100% 1,681 1,681 0 0%Revenue offsets -559 -16% 100% 100% -559 -559 0 0%
Total Operating Costs 3,489 100% 2,538 3,490 951 100%
High
Real dollars, $000 Low High Low HighActivityOperations 958 17% 60% 100% 575 958 383 33% 958 17%Electricity 364 7% 0% 100% 0 364 364 31% 364 7%Preventative maintenance 270 5% 65% 100% 176 270 95 8% 270 5%Corrective maintenance 776 14% 60% 100% 465 776 310 27% 776 14%Revenue offsets -559 -10% 100% 100% -559 -559 0 0% -559 -10%Indirects & Overheads 1,808 n/a 100% 100% 1,681 1,681 n/a n/a 1,681 30%Operating costs 3,490 63% 2,338 3,490 1,152 99% 3,490 63%Renewal annuity 2,090 37% 100% 100% 2,080 2,090 10 1% 2,090 37%
Total Expenditure 5,580 100% 4,418 5,580 1,162 100% 5,580 100%Proportion of Total Expenditure 79% 100% 21%Expenditure TypeLabour 1,085 31% 61% 100% 658 1,085 427 37%Electricity 364 10% 0% 100% 0 364 364 32%Materials 536 15% 61% 100% 325 536 211 18%Contractors 53 2% 61% 100% 32 53 21 2%Other 330 9% 61% 100% 200 330 130 11%Indirects & Overheads 1,681 48% 100% 100% 1,681 1,681 0 0%Revenue offsets -559 -16% 100% 100% -559 -559 0 0%
Total Operating Costs 3,489 100% 2,338 3,490 1,152 100%
% of total variable
Price Path
Price Path
Price Path
Price Path
% Range Variable Costs
Price Path
Average $
% Range
Variable Costs
Price Path
Average %
% of total variable
costs
Price Path
Average $
Price Path
Average %
% of total variable
Price Path
Price Path
Price Path
Price Path
% Range Variable Costs

Queensland Competition Authority Appendices Indec Consulting
416370_2.DOCX October 2011
Water Distribution – Eton
Service Contract Eton Distribution
Real dollars, $000 2007 2008 2009 2010 2011 2012 2013 2014 2015 2016 2017ActivityOperations 553 445 463 465 682 675 699 705 707 699 683 699Electricity 176 166 120 258 230 230 436 470 506 551 594 511Preventative maintenance 497 340 362 431 608 607 627 634 639 637 626 633Corrective maintenance 407 402 427 421 428 428 441 447 450 450 444 446Revenue offsets -12 -26 -14 -13 -4 -4 -4 -4 -4 -4 -4 -4Operating costs 1,621 1,327 1,358 1,562 1,944 1,935 2,199 2,252 2,298 2,333 2,343 2,285Renewal annuity spend 50 50 215 634 611 359 634 297 357 737 506Dam safety upgrade n/a n/a n/a n/a n/a n/a n/a n/a n/a n/a n/a n/a
Total Expenditure 1,671 1,376 1,573 2,196 2,556 2,294 2,833 2,549 2,655 3,070 2,343 2,690Expenditure TypeLabour 268 241 259 301 457 464 471 471 471 471 471 471Electricity 176 166 120 258 230 230 436 470 506 551 594 511Materials 137 282 212 268 231 235 238 242 245 249 249 245Contractors 67 86 125 81 189 191 194 197 200 203 203 199Other 121 120 129 139 125 125 125 125 125 125 125 125Indirects & Overheads 865 457 527 528 717 695 739 752 756 739 705 738Revenue offsets -12 -26 -14 -13 -4 -4 -4 -4 -4 -4 -4 -4
Total Operating Costs 1,621 1,327 1,358 1,562 1,944 1,935 2,199 2,253 2,299 2,334 2,343 2,286
Price Path
Average
Actuals Forecast Price path
Low
Real dollars, $000 Low High Low HighActivityOperations 409 14% 80% 100% 327 409 82 12% 409 14%Electricity 511 17% 0% 100% 0 511 511 72% 511 17%Preventative maintenance 633 21% 85% 100% 314 370 55 8% 370 13%Corrective maintenance 446 15% 80% 100% 209 261 52 7% 261 9%Revenue offsets -4 0% 100% 100% -4 -4 0 0% -4 0%Indirects & Overheads 738 n/a 100% 100% 738 738 n/a n/a 738 25%Operating costs 2,285 78% 1,584 2,285 701 99% 2,285 78%Renewal annuity 660 22% 99% 100% 653 660 7 1% 660 22%
Total Expenditure 2,945 100% 2,237 2,945 708 100% 2,945 100%Proportion of Total Expenditure 76% 100% 24%Expenditure TypeLabour 471 21% 82% 100% 385 471 86 12%Electricity 511 22% 0% 100% 0 511 511 73%Materials 245 11% 82% 100% 200 245 45 6%Contractors 199 9% 82% 100% 163 199 36 5%Other 125 5% 82% 100% 102 125 23 3%Indirects & Overheads 738 32% 100% 100% 738 738 0 0%Revenue offsets -4 0% 100% 100% -4 -4 0 0%
Total Operating Costs 2,286 100% 1,584 2,285 701 100%
Recommended
Real dollars, $000 Low High Low HighActivityOperations 409 14% 70% 100% 286 409 123 15% 409 14%Electricity 511 17% 0% 100% 0 511 511 63% 511 17%Preventative maintenance 370 13% 75% 100% 277 370 92 11% 370 13%Corrective maintenance 261 9% 70% 100% 183 261 78 10% 261 9%Revenue offsets -4 0% 100% 100% -4 -4 0 0% -4 0%Indirects & Overheads 1,547 n/a 100% 100% 738 738 n/a n/a 738 25%Operating costs 2,285 78% 1,480 2,285 805 99% 2,285 78%Renewal annuity 660 22% 99% 100% 653 660 7 1% 660 22%
Total Expenditure 2,945 100% 2,133 2,945 812 100% 2,945 100%Proportion of Total Expenditure 72% 100% 28%Expenditure TypeLabour 471 21% 72% 100% 338 471 133 17%Electricity 511 22% 0% 100% 0 511 511 64%Materials 245 11% 72% 100% 176 245 69 9%Contractors 199 9% 72% 100% 143 199 56 7%Other 125 5% 72% 100% 90 125 35 4%Indirects & Overheads 738 32% 100% 100% 738 738 0 0%Revenue offsets -4 0% 100% 100% -4 -4 0 0%
Total Operating Costs 2,286 100% 1,480 2,285 805 100%
High
Real dollars, $000 Low High Low HighActivityOperations 409 14% 60% 100% 245 409 163 18% 409 14%Electricity 511 17% 0% 100% 0 511 511 56% 511 17%Preventative maintenance 370 13% 65% 100% 240 370 129 14% 370 13%Corrective maintenance 261 9% 60% 100% 157 261 104 11% 261 9%Revenue offsets -4 0% 100% 100% -4 -4 0 0% -4 0%Indirects & Overheads 1,547 n/a 100% 100% 738 738 n/a n/a 738 25%Operating costs 2,285 78% 1,376 2,285 909 100% 2,285 78%Renewal annuity 660 22% 100% 100% 657 660 3 0% 660 22%
Total Expenditure 2,945 100% 2,033 2,945 912 100% 2,945 100%Proportion of Total Expenditure 69% 100% 31%Expenditure TypeLabour 471 21% 62% 100% 291 471 180 20%Electricity 511 22% 0% 100% 0 511 511 56%Materials 245 11% 62% 100% 151 245 93 10%Contractors 199 9% 62% 100% 123 199 76 8%Other 125 5% 62% 100% 77 125 48 5%Indirects & Overheads 738 32% 100% 100% 738 738 0 0%Revenue offsets -4 0% 100% 100% -4 -4 0 0%
Total Operating Costs 2,286 100% 1,376 2,285 909 100%
% of total variable
Price Path
Price Path
Price Path
Price Path
% Range Variable Costs
Price Path
Average $
% Range
Variable Costs
Price Path
Average %
% of total variable
costs
Price Path
Average $
Price Path
Average %
% of total variable
Price Path
Price Path
Price Path
Price Path
% Range Variable Costs

Queensland Competition Authority Appendices Indec Consulting
416370_2.DOCX October 2011
Water Distribution – Emerald
Service Contract Emerald Distribution
Real dollars, $000 2007 2008 2009 2010 2011 2012 2013 2014 2015 2016 2017ActivityOperations 653 635 954 890 823 814 846 853 856 846 825 845Electricity 166 86 64 47 95 95 135 145 157 170 184 158Preventative maintenance 462 425 508 539 599 600 617 625 630 631 623 625Corrective maintenance 820 387 523 206 279 279 288 291 294 293 288 291Revenue offsets -418 -529 -570 -558 -427 -427 -427 -427 -424 -407 -395 -416Operating costs 1,683 1,004 1,479 1,123 1,369 1,361 1,459 1,487 1,513 1,533 1,525 1,503Renewal annuity spend 291 1,177 171 1,615 1,218 345 290 237 210 194 233Dam safety upgrade n/a n/a n/a n/a n/a n/a n/a n/a n/a n/a n/a n/a
Total Expenditure 1,973 2,181 1,650 2,738 2,588 1,706 1,749 1,724 1,723 1,727 1,525 1,690Expenditure TypeLabour 442 306 424 421 457 464 471 471 471 471 471 471Electricity 166 86 64 47 95 95 135 145 157 170 184 158Materials 146 170 242 127 193 196 198 201 204 207 207 203Contractors 325 229 237 232 235 238 242 245 249 253 253 248Other 30 108 123 119 101 101 101 101 101 101 101 101Indirects & Overheads 991 634 960 735 716 694 738 751 755 738 704 737Revenue offsets -418 -529 -570 -558 -427 -427 -427 -427 -424 -407 -395 -416
Total Operating Costs 1,683 1,004 1,479 1,123 1,369 1,361 1,458 1,487 1,513 1,533 1,525 1,503
Price Path
Average
Actuals Forecast Price path
Low
Real dollars, $000 Low High Low HighActivityOperations 491 23% 80% 100% 393 491 98 31% 491 23%Electricity 158 8% 0% 100% 0 158 158 50% 158 8%Preventative maintenance 625 30% 90% 100% 327 363 36 12% 363 17%Corrective maintenance 291 14% 90% 100% 152 169 17 5% 169 8%Revenue offsets -416 -20% 100% 100% -416 -416 0 0% -416 -20%Indirects & Overheads 737 n/a 100% 100% 737 737 n/a n/a 737 35%Operating costs 1,503 71% 1,194 1,503 310 99% 1,503 71%Renewal annuity 604 29% 99% 100% 600 604 4 1% 604 29%
Total Expenditure 2,107 100% 1,793 2,107 314 100% 2,107 100%Proportion of Total Expenditure 85% 100% 15%Expenditure TypeLabour 471 31% 85% 100% 401 471 70 23%Electricity 158 11% 0% 100% 0 158 158 51%Materials 203 14% 85% 100% 173 203 30 10%Contractors 248 17% 85% 100% 212 248 37 12%Other 101 7% 85% 100% 86 101 15 5%Indirects & Overheads 737 49% 100% 100% 737 737 0 0%Revenue offsets -416 -28% 100% 100% -416 -416 0 0%
Total Operating Costs 1,503 100% 1,194 1,503 310 100%
Recommended
Real dollars, $000 Low High Low HighActivityOperations 491 23% 70% 100% 344 491 147 35% 491 23%Electricity 158 8% 0% 100% 0 158 158 38% 158 8%Preventative maintenance 363 17% 80% 100% 291 363 73 17% 363 17%Corrective maintenance 169 8% 80% 100% 135 169 34 8% 169 8%Revenue offsets -416 -20% 100% 100% -416 -416 0 0% -416 -20%Indirects & Overheads 766 n/a 100% 100% 737 737 n/a n/a 737 35%Operating costs 1,503 71% 1,091 1,503 412 99% 1,503 71%Renewal annuity 604 29% 99% 100% 600 604 4 1% 604 29%
Total Expenditure 2,107 100% 1,691 2,107 416 100% 2,107 100%Proportion of Total Expenditure 80% 100% 20%Expenditure TypeLabour 471 31% 75% 100% 354 471 117 28%Electricity 158 11% 0% 100% 0 158 158 38%Materials 203 14% 75% 100% 153 203 50 12%Contractors 248 17% 75% 100% 187 248 62 15%Other 101 7% 75% 100% 76 101 25 6%Indirects & Overheads 737 49% 100% 100% 737 737 0 0%Revenue offsets -416 -28% 100% 100% -416 -416 0 0%
Total Operating Costs 1,503 100% 1,091 1,503 412 100%
High
Real dollars, $000 Low High Low HighActivityOperations 491 23% 60% 100% 295 491 197 38% 491 23%Electricity 158 8% 0% 100% 0 158 158 31% 158 8%Preventative maintenance 363 17% 70% 100% 254 363 109 21% 363 17%Corrective maintenance 169 8% 70% 100% 118 169 51 10% 169 8%Revenue offsets -416 -20% 100% 100% -416 -416 0 0% -416 -20%Indirects & Overheads 766 n/a 100% 100% 737 737 n/a n/a 737 35%Operating costs 1,503 71% 989 1,503 515 99% 1,503 71%Renewal annuity 604 29% 100% 100% 601 604 3 1% 604 29%
Total Expenditure 2,107 100% 1,590 2,107 518 100% 2,107 100%Proportion of Total Expenditure 75% 100% 25%Expenditure TypeLabour 471 31% 65% 100% 307 471 164 32%Electricity 158 11% 0% 100% 0 158 158 31%Materials 203 14% 65% 100% 133 203 71 14%Contractors 248 17% 65% 100% 162 248 86 17%Other 101 7% 65% 100% 66 101 35 7%Indirects & Overheads 737 49% 100% 100% 737 737 0 0%Revenue offsets -416 -28% 100% 100% -416 -416 0 0%
Total Operating Costs 1,503 100% 989 1,503 515 100%
% of total variable
Price Path
Price Path
Price Path
Price Path
% Range Variable Costs
Price Path
Average $
% Range
Variable Costs
Price Path
Average %
% of total variable
costs
Price Path
Average $
Price Path
Average %
% of total variable
Price Path
Price Path
Price Path
Price Path
% Range Variable Costs

Queensland Competition Authority Appendices Indec Consulting
416370_2.DOCX October 2011
Water Distribution – St George
Service Contract St George Distribution
Real dollars, $000 2007 2008 2009 2010 2011 2012 2013 2014 2015 2016 2017ActivityOperations 704 767 1,280 799 820 812 844 852 855 846 825 844Electricity 23 35 32 44 42 42 44 48 51 56 60 52Preventative maintenance 400 517 434 308 331 330 341 345 348 346 340 344Corrective maintenance 265 337 350 487 237 235 244 247 248 246 240 245Revenue offsets -206 -201 -204 -212 -202 -202 -202 -202 -202 -202 -202 -202Operating costs 1,186 1,455 1,891 1,426 1,228 1,216 1,271 1,290 1,300 1,292 1,263 1,283Renewal annuity spend 114 49 245 305 2,616 715 473 38 99 223 208Dam safety upgrade n/a n/a n/a n/a n/a n/a n/a n/a n/a n/a n/a n/a
Total Expenditure 1,300 1,504 2,136 1,731 3,844 1,931 1,744 1,328 1,399 1,515 1,263 1,450Expenditure TypeLabour 434 407 611 454 454 460 467 467 467 467 467 467Electricity 23 35 32 44 42 42 44 48 51 56 60 52Materials 49 122 130 253 86 88 89 90 91 93 93 91Contractors 3 42 58 45 104 106 107 109 110 112 112 110Other 51 57 61 59 49 49 49 49 49 49 49 49Indirects & Overheads 833 994 1,203 784 696 674 718 730 734 717 684 717Revenue offsets -206 -201 -204 -212 -202 -202 -202 -202 -202 -202 -202 -202
Total Operating Costs 1,186 1,455 1,891 1,426 1,228 1,216 1,272 1,291 1,300 1,292 1,263 1,284
Price Path
Average
Actuals Forecast Price path
Low
Real dollars, $000 Low High Low HighActivityOperations 422 27% 80% 100% 338 422 84 48% 422 27%Electricity 52 3% 0% 100% 0 52 52 29% 52 3%Preventative maintenance 344 22% 85% 100% 146 172 26 15% 172 11%Corrective maintenance 245 16% 90% 100% 110 123 12 7% 123 8%Revenue offsets -202 -13% 100% 100% -202 -202 0 0% -202 -13%Indirects & Overheads 716 n/a 100% 100% 716 716 n/a n/a 716 46%Operating costs 1,283 82% 1,109 1,283 174 98% 1,283 82%Renewal annuity 283 18% 99% 100% 280 283 3 2% 283 18%
Total Expenditure 1,566 100% 1,389 1,566 177 100% 1,566 100%Proportion of Total Expenditure 89% 100% 11%Expenditure TypeLabour 467 36% 83% 100% 387 467 80 46%Electricity 52 4% 0% 100% 0 52 52 30%Materials 91 7% 83% 100% 76 91 16 9%Contractors 110 9% 83% 100% 91 110 19 11%Other 49 4% 83% 100% 41 49 8 5%Indirects & Overheads 717 56% 100% 100% 717 717 0 0%Revenue offsets -202 -16% 100% 100% -202 -202 0 0%
Total Operating Costs 1,284 100% 1,109 1,283 174 100%
Recommended
Real dollars, $000 Low High Low HighActivityOperations 422 27% 70% 100% 296 422 127 51% 422 27%Electricity 52 3% 0% 100% 0 52 52 21% 52 3%Preventative maintenance 172 11% 75% 100% 129 172 43 17% 172 11%Corrective maintenance 123 8% 80% 100% 98 123 25 10% 123 8%Revenue offsets -202 -13% 100% 100% -202 -202 0 0% -202 -13%Indirects & Overheads 567 n/a 100% 100% 716 716 n/a n/a 716 46%Operating costs 1,283 82% 1,037 1,283 246 99% 1,283 82%Renewal annuity 283 18% 99% 100% 280 283 3 1% 283 18%
Total Expenditure 1,566 100% 1,317 1,566 249 100% 1,566 100%Proportion of Total Expenditure 84% 100% 16%Expenditure TypeLabour 467 36% 73% 100% 340 467 126 51%Electricity 52 4% 0% 100% 0 52 52 21%Materials 91 7% 73% 100% 66 91 25 10%Contractors 110 9% 73% 100% 80 110 30 12%Other 49 4% 73% 100% 36 49 13 5%Indirects & Overheads 717 56% 100% 100% 717 717 0 0%Revenue offsets -202 -16% 100% 100% -202 -202 0 0%
Total Operating Costs 1,284 100% 1,037 1,283 246 100%
High
Real dollars, $000 Low High Low HighActivityOperations 422 27% 60% 100% 253 422 169 53% 422 27%Electricity 52 3% 0% 100% 0 52 52 16% 52 3%Preventative maintenance 172 11% 65% 100% 112 172 60 19% 172 11%Corrective maintenance 123 8% 70% 100% 86 123 37 12% 123 8%Revenue offsets -202 -13% 100% 100% -202 -202 0 0% -202 -13%Indirects & Overheads 567 n/a 100% 100% 716 716 n/a n/a 716 46%Operating costs 1,283 82% 965 1,283 318 100% 1,283 82%Renewal annuity 283 18% 100% 100% 282 283 1 0% 283 18%
Total Expenditure 1,566 100% 1,247 1,566 319 100% 1,566 100%Proportion of Total Expenditure 80% 100% 20%Expenditure TypeLabour 467 36% 63% 100% 294 467 173 54%Electricity 52 4% 0% 100% 0 52 52 16%Materials 91 7% 63% 100% 57 91 34 11%Contractors 110 9% 63% 100% 69 110 41 13%Other 49 4% 63% 100% 31 49 18 6%Indirects & Overheads 717 56% 100% 100% 717 717 0 0%Revenue offsets -202 -16% 100% 100% -202 -202 0 0%
Total Operating Costs 1,284 100% 966 1,283 318 100%
% of total variable
Price Path
Price Path
Price Path
Price Path
% Range Variable Costs
Price Path
Average $
% Range
Variable Costs
Price Path
Average %
% of total variable
costs
Price Path
Average $
Price Path
Average %
% of total variable
Price Path
Price Path
Price Path
Price Path
% Range Variable Costs

Queensland Competition Authority Appendices Indec Consulting
416370_2.DOCX October 2011
Water Distribution – Theodore
Service Contract Theodore Distribution
Real dollars, $000 2007 2008 2009 2010 2011 2012 2013 2014 2015 2016 2017ActivityOperations 267 284 388 341 532 525 547 553 554 547 532 547Electricity 87 73 109 109 119 119 153 165 178 194 209 180Preventative maintenance 332 361 455 332 386 384 398 402 405 402 394 400Corrective maintenance 201 339 333 212 203 201 209 212 213 211 206 210Revenue offsets -55 -62 -56 -58 -55 -55 -55 -55 -55 -55 -53 -55Operating costs 833 995 1,229 936 1,185 1,174 1,252 1,277 1,295 1,299 1,288 1,282Renewal annuity spend 12 80 148 516 1,412 271 73 470 229 110 221Dam safety upgrade n/a n/a n/a n/a n/a n/a n/a n/a n/a n/a n/a n/a
Total Expenditure 844 1,076 1,377 1,452 2,596 1,445 1,325 1,747 1,524 1,409 1,288 1,459Expenditure TypeLabour 243 239 276 271 381 386 392 392 392 392 392 392Electricity 87 73 109 109 119 119 153 165 178 194 209 180Materials 49 58 75 47 72 73 74 75 76 77 77 76Contractors 55 67 70 44 59 60 61 62 63 63 63 62Other 6 35 121 44 27 27 27 27 27 27 27 27Indirects & Overheads 447 584 633 478 582 564 600 611 614 600 572 599Revenue offsets -55 -62 -56 -58 -55 -55 -55 -55 -55 -55 -53 -55
Total Operating Costs 833 995 1,229 936 1,185 1,174 1,252 1,277 1,295 1,298 1,287 1,282
Price Path
Average
Actuals Forecast Price path
Low
Real dollars, $000 Low High Low HighActivityOperations 263 16% 75% 100% 197 263 66 22% 263 16%Electricity 180 11% 0% 100% 0 180 180 60% 180 11%Preventative maintenance 400 25% 80% 100% 154 193 39 13% 193 12%Corrective maintenance 210 13% 90% 100% 91 101 10 3% 101 6%Revenue offsets -55 -3% 100% 100% -55 -55 0 0% -55 -3%Indirects & Overheads 600 n/a 100% 100% 600 600 n/a n/a 600 37%Operating costs 1,282 80% 988 1,282 294 99% 1,282 80%Renewal annuity 322 20% 99% 100% 319 322 3 1% 322 20%
Total Expenditure 1,604 100% 1,307 1,604 297 100% 1,604 100%Proportion of Total Expenditure 81% 100% 19%Expenditure TypeLabour 392 31% 79% 100% 312 392 81 27%Electricity 180 14% 0% 100% 0 180 180 61%Materials 76 6% 79% 100% 60 76 16 5%Contractors 62 5% 79% 100% 50 62 13 4%Other 27 2% 79% 100% 21 27 6 2%Indirects & Overheads 599 47% 100% 100% 599 599 0 0%Revenue offsets -55 -4% 100% 100% -55 -55 0 0%
Total Operating Costs 1,282 100% 988 1,282 294 100%
Recommended
Real dollars, $000 Low High Low HighActivityOperations 263 16% 65% 100% 171 263 92 26% 263 16%Electricity 180 11% 0% 100% 0 180 180 51% 180 11%Preventative maintenance 193 12% 70% 100% 135 193 58 16% 193 12%Corrective maintenance 101 6% 80% 100% 81 101 20 6% 101 6%Revenue offsets -55 -3% 100% 100% -55 -55 0 0% -55 -3%Indirects & Overheads 683 n/a 100% 100% 600 600 n/a n/a 600 37%Operating costs 1,282 80% 932 1,282 350 99% 1,282 80%Renewal annuity 322 20% 99% 100% 319 322 3 1% 322 20%
Total Expenditure 1,604 100% 1,251 1,604 353 100% 1,604 100%Proportion of Total Expenditure 78% 100% 22%Expenditure TypeLabour 392 31% 69% 100% 272 392 120 34%Electricity 180 14% 0% 100% 0 180 180 51%Materials 76 6% 69% 100% 53 76 23 7%Contractors 62 5% 69% 100% 43 62 19 5%Other 27 2% 69% 100% 19 27 8 2%Indirects & Overheads 599 47% 100% 100% 599 599 0 0%Revenue offsets -55 -4% 100% 100% -55 -55 0 0%
Total Operating Costs 1,282 100% 932 1,282 350 100%
High
Real dollars, $000 Low High Low HighActivityOperations 263 16% 55% 100% 145 263 118 30% 263 16%Electricity 180 11% 0% 100% 0 180 180 45% 180 11%Preventative maintenance 193 12% 65% 100% 125 193 67 17% 193 12%Corrective maintenance 101 6% 70% 100% 71 101 30 8% 101 6%Revenue offsets -55 -3% 100% 100% -55 -55 0 0% -55 -3%Indirects & Overheads 683 n/a 100% 100% 600 600 n/a n/a 600 37%Operating costs 1,282 80% 886 1,282 396 100% 1,282 80%Renewal annuity 322 20% 100% 100% 320 322 2 0% 322 20%
Total Expenditure 1,604 100% 1,206 1,604 398 100% 1,604 100%Proportion of Total Expenditure 75% 100% 25%Expenditure TypeLabour 392 31% 61% 100% 240 392 152 38%Electricity 180 14% 0% 100% 0 180 180 45%Materials 76 6% 61% 100% 46 76 29 7%Contractors 62 5% 61% 100% 38 62 24 6%Other 27 2% 61% 100% 17 27 10 3%Indirects & Overheads 599 47% 100% 100% 599 599 0 0%Revenue offsets -55 -4% 100% 100% -55 -55 0 0%
Total Operating Costs 1,282 100% 886 1,282 396 100%
% of total variable
Price Path
Price Path
Price Path
Price Path
% Range Variable Costs
Price Path
Average $
% Range
Variable Costs
Price Path
Average %
% of total variable
costs
Price Path
Average $
Price Path
Average %
% of total variable
Price Path
Price Path
Price Path
Price Path
% Range Variable Costs

Queensland Competition Authority Appendices Indec Consulting
416370_2.DOCX October 2011
Water Distribution – Lower Mary
Service Contract Lower Mary Distribution
Real dollars, $000 2007 2008 2009 2010 2011 2012 2013 2014 2015 2016 2017ActivityOperations 68 107 204 194 237 235 243 245 245 243 237 243Electricity 73 91 22 154 142 142 167 180 194 211 227 196Preventative maintenance 158 231 248 171 241 239 248 251 252 249 243 249Corrective maintenance 82 101 164 224 146 145 151 152 153 152 149 151Revenue offsets 0 -10 -25 -6 -13 -13 -13 -13 -13 -13 -13 -13Operating costs 381 520 613 737 753 747 796 815 831 842 843 825Renewal annuity spend 90 169 211 390 541 268 168 430 96 29 181Dam safety upgrade n/a n/a n/a n/a n/a n/a n/a n/a n/a n/a n/a n/a
Total Expenditure 471 689 825 1,127 1,294 1,015 964 1,245 927 871 843 970Expenditure TypeLabour 78 106 158 184 199 202 205 205 205 205 205 205Electricity 73 91 22 154 142 142 167 180 194 211 227 196Materials 24 37 49 58 54 54 55 56 57 58 58 57Contractors 5 8 47 34 15 15 15 15 15 16 16 15Other 12 19 12 10 50 50 50 50 50 50 50 50Indirects & Overheads 190 270 351 303 307 297 316 322 323 316 301 316Revenue offsets 0 -10 -25 -6 -13 -13 -13 -13 -13 -13 -13 -13
Total Operating Costs 381 520 613 737 753 747 795 815 831 843 844 826
Price Path
Average
Actuals Forecast Price path
Low
Real dollars, $000 Low High Low HighActivityOperations 123 10% 75% 100% 93 123 31 12% 123 10%Electricity 196 15% 0% 100% 0 196 196 77% 196 15%Preventative maintenance 249 19% 85% 100% 108 127 19 7% 127 10%Corrective maintenance 151 12% 90% 100% 69 77 8 3% 77 6%Revenue offsets -13 -1% 100% 100% -13 -13 0 0% -13 -1%Indirects & Overheads 316 n/a 100% 100% 316 316 n/a n/a 316 24%Operating costs 825 64% 572 825 253 99% 825 64%Renewal annuity 467 36% 100% 100% 465 467 2 1% 467 36%
Total Expenditure 1,292 100% 1,037 1,292 256 100% 1,292 100%Proportion of Total Expenditure 80% 100% 20%Expenditure TypeLabour 205 25% 82% 100% 169 205 36 14%Electricity 196 24% 0% 100% 0 196 196 77%Materials 57 7% 82% 100% 47 57 10 4%Contractors 15 2% 82% 100% 13 15 3 1%Other 50 6% 82% 100% 41 50 9 3%Indirects & Overheads 316 38% 100% 100% 316 316 0 0%Revenue offsets -13 -2% 100% 100% -13 -13 0 0%
Total Operating Costs 826 100% 572 825 253 100%
Recommended
Real dollars, $000 Low High Low HighActivityOperations 123 10% 65% 100% 80 123 43 15% 123 10%Electricity 196 15% 0% 100% 0 196 196 68% 196 15%Preventative maintenance 127 10% 75% 100% 95 127 32 11% 127 10%Corrective maintenance 77 6% 80% 100% 62 77 15 5% 77 6%Revenue offsets -13 -1% 100% 100% -13 -13 0 0% -13 -1%Indirects & Overheads 510 n/a 100% 100% 316 316 n/a n/a 316 24%Operating costs 825 64% 539 825 286 99% 825 64%Renewal annuity 467 36% 100% 100% 465 467 2 1% 467 36%
Total Expenditure 1,292 100% 1,004 1,292 288 100% 1,292 100%Proportion of Total Expenditure 78% 100% 22%Expenditure TypeLabour 205 25% 72% 100% 148 205 57 20%Electricity 196 24% 0% 100% 0 196 196 68%Materials 57 7% 72% 100% 41 57 16 5%Contractors 15 2% 72% 100% 11 15 4 1%Other 50 6% 72% 100% 36 50 14 5%Indirects & Overheads 316 38% 100% 100% 316 316 0 0%Revenue offsets -13 -2% 100% 100% -13 -13 0 0%
Total Operating Costs 826 100% 539 825 286 100%
High
Real dollars, $000 Low High Low HighActivityOperations 123 10% 55% 100% 68 123 56 17% 123 10%Electricity 196 15% 0% 100% 0 196 196 61% 196 15%Preventative maintenance 127 10% 65% 100% 82 127 44 14% 127 10%Corrective maintenance 77 6% 70% 100% 54 77 23 7% 77 6%Revenue offsets -13 -1% 100% 100% -13 -13 0 0% -13 -1%Indirects & Overheads 510 n/a 100% 100% 316 316 n/a n/a 316 24%Operating costs 825 64% 507 825 319 99% 825 64%Renewal annuity 467 36% 100% 100% 465 467 2 1% 467 36%
Total Expenditure 1,292 100% 971 1,292 321 100% 1,292 100%Proportion of Total Expenditure 75% 100% 25%Expenditure TypeLabour 205 25% 62% 100% 128 205 77 24%Electricity 196 24% 0% 100% 0 196 196 61%Materials 57 7% 62% 100% 35 57 21 7%Contractors 15 2% 62% 100% 10 15 6 2%Other 50 6% 62% 100% 31 50 19 6%Indirects & Overheads 316 38% 100% 100% 316 316 0 0%Revenue offsets -13 -2% 100% 100% -13 -13 0 0%
Total Operating Costs 826 100% 507 825 319 100%
% of total variable
Price Path
Price Path
Price Path
Price Path
% Range Variable Costs
Price Path
Average $
% Range
Variable Costs
Price Path
Average %
% of total variable
costs
Price Path
Average $
Price Path
Average %
% of total variable
Price Path
Price Path
Price Path
Price Path
% Range Variable Costs
Queensland Competition Authority Appendices Indec Consulting
416370_2.DOCX October 2011
APPENDIX J
Fixed/Variable Assessment
Bulk Water Supply Systems
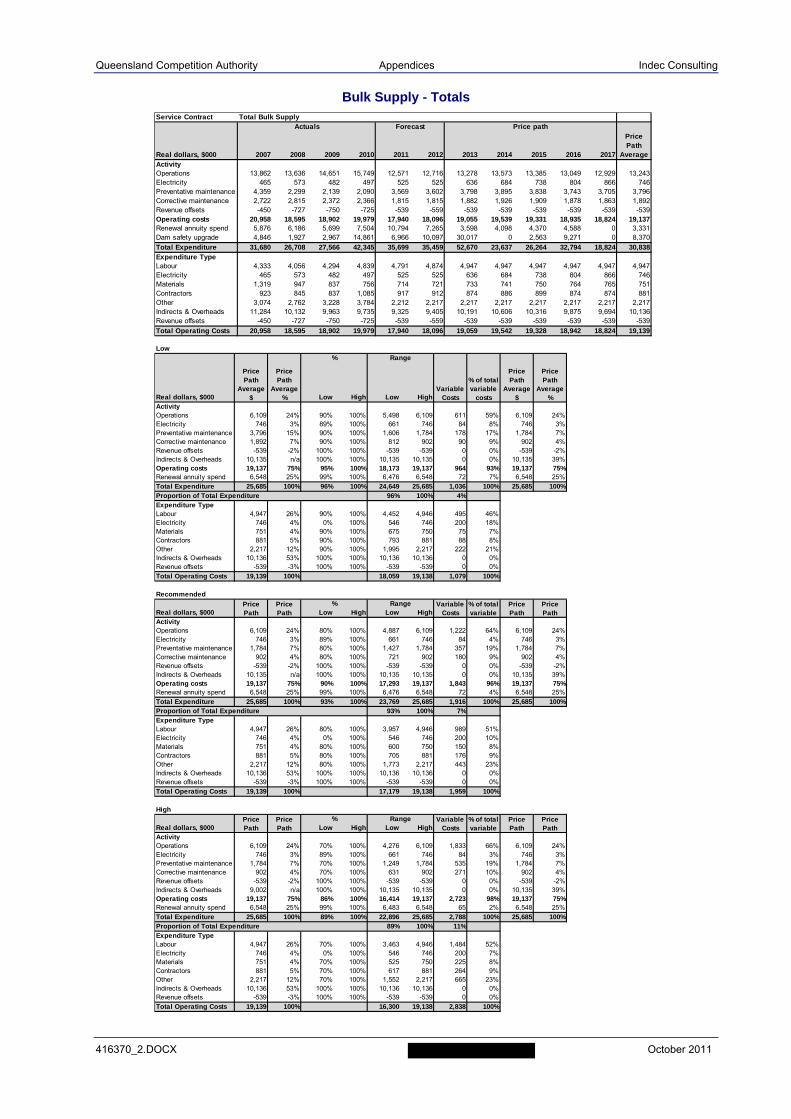
Queensland Competition Authority Appendices Indec Consulting
416370_2.DOCX October 2011
Bulk Supply - Totals
Service Contract Total Bulk Supply
Real dollars, $000 2007 2008 2009 2010 2011 2012 2013 2014 2015 2016 2017ActivityOperations 13,862 13,636 14,651 15,749 12,571 12,716 13,278 13,573 13,385 13,049 12,929 13,243Electricity 465 573 482 497 525 525 636 684 738 804 866 746Preventative maintenance 4,359 2,299 2,139 2,090 3,569 3,602 3,798 3,895 3,838 3,743 3,705 3,796Corrective maintenance 2,722 2,815 2,372 2,366 1,815 1,815 1,882 1,926 1,909 1,878 1,863 1,892Revenue offsets -450 -727 -750 -725 -539 -559 -539 -539 -539 -539 -539 -539Operating costs 20,958 18,595 18,902 19,979 17,940 18,096 19,055 19,539 19,331 18,935 18,824 19,137Renewal annuity spend 5,876 6,186 5,699 7,504 10,794 7,265 3,598 4,098 4,370 4,588 0 3,331Dam safety upgrade 4,846 1,927 2,967 14,861 6,966 10,097 30,017 0 2,563 9,271 0 8,370
Total Expenditure 31,680 26,708 27,566 42,345 35,699 35,459 52,670 23,637 26,264 32,794 18,824 30,838Expenditure TypeLabour 4,333 4,056 4,294 4,839 4,791 4,874 4,947 4,947 4,947 4,947 4,947 4,947Electricity 465 573 482 497 525 525 636 684 738 804 866 746Materials 1,319 947 837 756 714 721 733 741 750 764 765 751Contractors 923 845 837 1,085 917 912 874 886 899 874 874 881Other 3,074 2,762 3,228 3,784 2,212 2,217 2,217 2,217 2,217 2,217 2,217 2,217Indirects & Overheads 11,284 10,132 9,963 9,735 9,325 9,405 10,191 10,606 10,316 9,875 9,694 10,136Revenue offsets -450 -727 -750 -725 -539 -559 -539 -539 -539 -539 -539 -539
Total Operating Costs 20,958 18,595 18,902 19,979 17,940 18,096 19,059 19,542 19,328 18,942 18,824 19,139
Actuals Forecast Price pathPrice Path
Average
Low
Real dollars, $000 Low High Low HighActivityOperations 6,109 24% 90% 100% 5,498 6,109 611 59% 6,109 24%Electricity 746 3% 89% 100% 661 746 84 8% 746 3%Preventative maintenance 3,796 15% 90% 100% 1,606 1,784 178 17% 1,784 7%Corrective maintenance 1,892 7% 90% 100% 812 902 90 9% 902 4%Revenue offsets -539 -2% 100% 100% -539 -539 0 0% -539 -2%Indirects & Overheads 10,135 n/a 100% 100% 10,135 10,135 0 0% 10,135 39%Operating costs 19,137 75% 95% 100% 18,173 19,137 964 93% 19,137 75%Renewal annuity spend 6,548 25% 99% 100% 6,476 6,548 72 7% 6,548 25%
Total Expenditure 25,685 100% 96% 100% 24,649 25,685 1,036 100% 25,685 100%Proportion of Total Expenditure 96% 100% 4%Expenditure TypeLabour 4,947 26% 90% 100% 4,452 4,946 495 46%Electricity 746 4% 0% 100% 546 746 200 18%Materials 751 4% 90% 100% 675 750 75 7%Contractors 881 5% 90% 100% 793 881 88 8%Other 2,217 12% 90% 100% 1,995 2,217 222 21%Indirects & Overheads 10,136 53% 100% 100% 10,136 10,136 0 0%Revenue offsets -539 -3% 100% 100% -539 -539 0 0%
Total Operating Costs 19,139 100% 18,059 19,138 1,079 100%
Recommended
Real dollars, $000 Low High Low HighActivityOperations 6,109 24% 80% 100% 4,887 6,109 1,222 64% 6,109 24%Electricity 746 3% 89% 100% 661 746 84 4% 746 3%Preventative maintenance 1,784 7% 80% 100% 1,427 1,784 357 19% 1,784 7%Corrective maintenance 902 4% 80% 100% 721 902 180 9% 902 4%Revenue offsets -539 -2% 100% 100% -539 -539 0 0% -539 -2%Indirects & Overheads 10,135 n/a 100% 100% 10,135 10,135 0 0% 10,135 39%Operating costs 19,137 75% 90% 100% 17,293 19,137 1,843 96% 19,137 75%Renewal annuity spend 6,548 25% 99% 100% 6,476 6,548 72 4% 6,548 25%
Total Expenditure 25,685 100% 93% 100% 23,769 25,685 1,916 100% 25,685 100%Proportion of Total Expenditure 93% 100% 7%Expenditure TypeLabour 4,947 26% 80% 100% 3,957 4,946 989 51%Electricity 746 4% 0% 100% 546 746 200 10%Materials 751 4% 80% 100% 600 750 150 8%Contractors 881 5% 80% 100% 705 881 176 9%Other 2,217 12% 80% 100% 1,773 2,217 443 23%Indirects & Overheads 10,136 53% 100% 100% 10,136 10,136 0 0%Revenue offsets -539 -3% 100% 100% -539 -539 0 0%
Total Operating Costs 19,139 100% 17,179 19,138 1,959 100%
High
Real dollars, $000 Low High Low HighActivityOperations 6,109 24% 70% 100% 4,276 6,109 1,833 66% 6,109 24%Electricity 746 3% 89% 100% 661 746 84 3% 746 3%Preventative maintenance 1,784 7% 70% 100% 1,249 1,784 535 19% 1,784 7%Corrective maintenance 902 4% 70% 100% 631 902 271 10% 902 4%Revenue offsets -539 -2% 100% 100% -539 -539 0 0% -539 -2%Indirects & Overheads 9,002 n/a 100% 100% 10,135 10,135 0 0% 10,135 39%Operating costs 19,137 75% 86% 100% 16,414 19,137 2,723 98% 19,137 75%Renewal annuity spend 6,548 25% 99% 100% 6,483 6,548 65 2% 6,548 25%
Total Expenditure 25,685 100% 89% 100% 22,896 25,685 2,788 100% 25,685 100%Proportion of Total Expenditure 89% 100% 11%Expenditure TypeLabour 4,947 26% 70% 100% 3,463 4,946 1,484 52%Electricity 746 4% 0% 100% 546 746 200 7%Materials 751 4% 70% 100% 525 750 225 8%Contractors 881 5% 70% 100% 617 881 264 9%Other 2,217 12% 70% 100% 1,552 2,217 665 23%Indirects & Overheads 10,136 53% 100% 100% 10,136 10,136 0 0%Revenue offsets -539 -3% 100% 100% -539 -539 0 0%
Total Operating Costs 19,139 100% 16,300 19,138 2,838 100%
% of total variable
Price Path
Price Path
Price Path
Price Path
% Range Variable Costs
% of total variable
costs
Price Path
Average $
Price Path
Average %
Price Path
Average $
Price Path
Average %
% Range
Variable Costs
% of total variable
Price Path
Price Path
Price Path
Price Path
% Range Variable Costs

Queensland Competition Authority Appendices Indec Consulting
416370_2.DOCX October 2011
Bulk Supply - Burdekin Haughton
Service Contract Burdekin Haughton Bulk Supply
Real dollars, $000 2007 2008 2009 2010 2011 2012 2013 2014 2015 2016 2017ActivityOperations 2,605 3,635 3,248 2,321 2,356 2,373 2,494 2,555 2,514 2,453 2,430 2,489Electricity 59 62 67 69 75 75 98 106 114 124 134 115Preventative maintenance 464 241 299 256 332 335 353 362 357 349 345 353Corrective maintenance 538 309 430 661 239 226 221 226 224 220 218 222Revenue offsets -81 -84 -99 -98 -95 -95 -95 -95 -95 -95 -95 -95Operating costs 3,586 4,164 3,946 3,209 2,907 2,914 3,071 3,154 3,114 3,051 3,032 3,084Renewal annuity spend 379 442 267 294 564 824 464 253 262 283 316Dam safety upgrade 0 0 0 358 0 1,333 10,160 0 0 0 2,540
Total Expenditure 3,965 4,607 4,213 3,861 3,470 5,071 13,695 3,407 3,376 3,334 3,032 5,369Expenditure TypeLabour 672 981 981 749 808 820 832 832 832 832 832 832Electricity 59 62 67 69 75 75 98 106 114 124 134 115Materials 210 178 167 246 109 111 113 114 116 118 118 116Contractors 110 105 79 174 90 76 62 63 64 65 65 64Other 945 608 448 527 329 329 329 329 329 329 329 329Indirects & Overheads 1,670 2,315 2,302 1,543 1,590 1,598 1,732 1,805 1,754 1,678 1,650 1,724Revenue offsets -81 -84 -99 -98 -95 -95 -95 -95 -95 -95 -95 -95
Total Operating Costs 3,586 4,164 3,946 3,209 2,907 2,914 3,071 3,154 3,114 3,051 3,033 3,085
Actuals Forecast Price pathPrice Path
Average
Low
Real dollars, $000 Low High Low HighActivityOperations 1,089 27% 90% 100% 980 1,089 109 77% 1,089 27%Electricity 115 3% 100% 100% 115 115 0 0% 115 3%Preventative maintenance 353 9% 90% 100% 139 155 15 11% 155 4%Corrective maintenance 222 6% 90% 100% 87 97 10 7% 97 2%Revenue offsets -95 -2% 100% 100% -95 -95 0 0% -95 -2%Indirects & Overheads 1,724 n/a 100% 100% 1,724 1,724 n/a n/a 1,724 43%Operating costs 3,084 77% 2,950 3,084 134 95% 3,084 77%Renewal annuity 920 23% 99% 100% 913 920 7 5% 920 23%
Total Expenditure 4,004 100% 3,863 4,004 141 100% 4,004 100%Proportion of Total Expenditure 96% 100% 4%Expenditure TypeLabour 832 27% 90% 100% 749 832 83 33%Electricity 115 4% 0% 100% 0 115 115 46%Materials 116 4% 90% 100% 104 116 12 5%Contractors 64 2% 90% 100% 57 64 6 3%Other 329 11% 90% 100% 296 329 33 13%Indirects & Overheads 1,724 56% 100% 100% 1,724 1,724 0 0%Revenue offsets -95 -3% 100% 100% -95 -95 0 0%
Total Operating Costs 3,085 100% 2,835 3,085 249 100%
Recommended
Real dollars, $000 Low High Low HighActivityOperations 1,089 27% 80% 100% 871 1,089 218 79% 1,089 27%Electricity 115 3% 100% 100% 115 115 0 0% 115 3%Preventative maintenance 155 4% 80% 100% 124 155 31 11% 155 4%Corrective maintenance 97 2% 80% 100% 78 97 19 7% 97 2%Revenue offsets -95 -2% 100% 100% -95 -95 0 0% -95 -2%Indirects & Overheads 1,724 n/a 100% 100% 1,724 1,724 n/a n/a 1,724 43%Operating costs 3,084 77% 2,816 3,084 268 97% 3,084 77%Renewal annuity 920 23% 99% 100% 913 920 7 3% 920 23%
Total Expenditure 4,004 100% 3,729 4,004 275 100% 4,004 100%Proportion of Total Expenditure 93% 100% 7%Expenditure TypeLabour 832 27% 80% 100% 666 832 166 43%Electricity 115 4% 0% 100% 0 115 115 30%Materials 116 4% 80% 100% 93 116 23 6%Contractors 64 2% 80% 100% 51 64 13 3%Other 329 11% 80% 100% 263 329 66 17%Indirects & Overheads 1,724 56% 100% 100% 1,724 1,724 0 0%Revenue offsets -95 -3% 100% 100% -95 -95 0 0%
Total Operating Costs 3,085 100% 2,701 3,085 383 100%
High
Real dollars, $000 Low High Low HighActivityOperations 1,089 27% 70% 100% 762 1,089 327 79% 1,089 27%Electricity 115 3% 100% 100% 115 115 0 0% 115 3%Preventative maintenance 155 4% 70% 100% 108 155 46 11% 155 4%Corrective maintenance 97 2% 70% 100% 68 97 29 7% 97 2%Revenue offsets -95 -2% 100% 100% -95 -95 0 0% -95 -2%Indirects & Overheads 1,361 n/a 100% 100% 1,724 1,724 n/a n/a 1,724 43%Operating costs 3,084 77% 2,682 3,084 402 98% 3,084 77%Renewal annuity 920 23% 99% 100% 911 920 9 2% 920 23%
Total Expenditure 4,004 100% 3,593 4,004 411 100% 4,004 100%Proportion of Total Expenditure 90% 100% 10%Expenditure TypeLabour 832 27% 70% 100% 582 832 250 48%Electricity 115 4% 0% 100% 0 115 115 22%Materials 116 4% 70% 100% 81 116 35 7%Contractors 64 2% 70% 100% 45 64 19 4%Other 329 11% 70% 100% 230 329 99 19%Indirects & Overheads 1,724 56% 100% 100% 1,724 1,724 0 0%Revenue offsets -95 -3% 100% 100% -95 -95 0 0%
Total Operating Costs 3,085 100% 2,567 3,085 517 100%
% of total variable
Price Path
Price Path
Price Path
Price Path
% Range Variable Costs
% of total variable
costs
Price Path
Average $
Price Path
Average %
Price Path
Average $
Price Path
Average %
% Range
Variable Costs
% of total variable
Price Path
Price Path
Price Path
Price Path
% Range Variable Costs
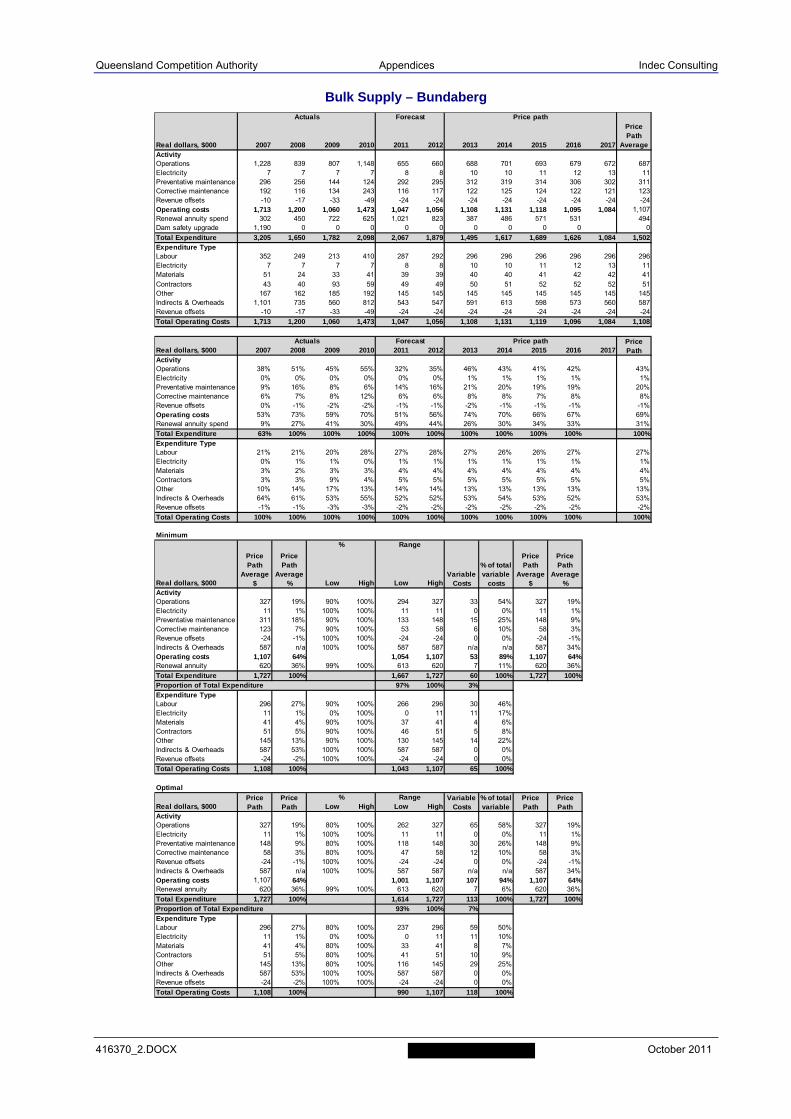
Queensland Competition Authority Appendices Indec Consulting
416370_2.DOCX October 2011
Bulk Supply – Bundaberg
Real dollars, $000 2007 2008 2009 2010 2011 2012 2013 2014 2015 2016 2017ActivityOperations 1,228 839 807 1,148 655 660 688 701 693 679 672 687Electricity 7 7 7 7 8 8 10 10 11 12 13 11Preventative maintenance 296 256 144 124 292 295 312 319 314 306 302 311Corrective maintenance 192 116 134 243 116 117 122 125 124 122 121 123Revenue offsets -10 -17 -33 -49 -24 -24 -24 -24 -24 -24 -24 -24Operating costs 1,713 1,200 1,060 1,473 1,047 1,056 1,108 1,131 1,118 1,095 1,084 1,107Renewal annuity spend 302 450 722 625 1,021 823 387 486 571 531 494Dam safety upgrade 1,190 0 0 0 0 0 0 0 0 0 0
Total Expenditure 3,205 1,650 1,782 2,098 2,067 1,879 1,495 1,617 1,689 1,626 1,084 1,502Expenditure TypeLabour 352 249 213 410 287 292 296 296 296 296 296 296Electricity 7 7 7 7 8 8 10 10 11 12 13 11Materials 51 24 33 41 39 39 40 40 41 42 42 41Contractors 43 40 93 59 49 49 50 51 52 52 52 51Other 167 162 185 192 145 145 145 145 145 145 145 145Indirects & Overheads 1,101 735 560 812 543 547 591 613 598 573 560 587Revenue offsets -10 -17 -33 -49 -24 -24 -24 -24 -24 -24 -24 -24
Total Operating Costs 1,713 1,200 1,060 1,473 1,047 1,056 1,108 1,131 1,119 1,096 1,084 1,108
Real dollars, $000 2007 2008 2009 2010 2011 2012 2013 2014 2015 2016 2017ActivityOperations 38% 51% 45% 55% 32% 35% 46% 43% 41% 42% 43%Electricity 0% 0% 0% 0% 0% 0% 1% 1% 1% 1% 1%Preventative maintenance 9% 16% 8% 6% 14% 16% 21% 20% 19% 19% 20%Corrective maintenance 6% 7% 8% 12% 6% 6% 8% 8% 7% 8% 8%Revenue offsets 0% -1% -2% -2% -1% -1% -2% -1% -1% -1% -1%Operating costs 53% 73% 59% 70% 51% 56% 74% 70% 66% 67% 69%Renewal annuity spend 9% 27% 41% 30% 49% 44% 26% 30% 34% 33% 31%
Total Expenditure 63% 100% 100% 100% 100% 100% 100% 100% 100% 100% 100%Expenditure TypeLabour 21% 21% 20% 28% 27% 28% 27% 26% 26% 27% 27%Electricity 0% 1% 1% 0% 1% 1% 1% 1% 1% 1% 1%Materials 3% 2% 3% 3% 4% 4% 4% 4% 4% 4% 4%Contractors 3% 3% 9% 4% 5% 5% 5% 5% 5% 5% 5%Other 10% 14% 17% 13% 14% 14% 13% 13% 13% 13% 13%Indirects & Overheads 64% 61% 53% 55% 52% 52% 53% 54% 53% 52% 53%Revenue offsets -1% -1% -3% -3% -2% -2% -2% -2% -2% -2% -2%
Total Operating Costs 100% 100% 100% 100% 100% 100% 100% 100% 100% 100% 100%
Actuals Forecast Price pathPrice Path
Average
Actuals Forecast Price Path
Price path
Minimum
Real dollars, $000 Low High Low HighActivityOperations 327 19% 90% 100% 294 327 33 54% 327 19%Electricity 11 1% 100% 100% 11 11 0 0% 11 1%Preventative maintenance 311 18% 90% 100% 133 148 15 25% 148 9%Corrective maintenance 123 7% 90% 100% 53 58 6 10% 58 3%Revenue offsets -24 -1% 100% 100% -24 -24 0 0% -24 -1%Indirects & Overheads 587 n/a 100% 100% 587 587 n/a n/a 587 34%Operating costs 1,107 64% 1,054 1,107 53 89% 1,107 64%Renewal annuity 620 36% 99% 100% 613 620 7 11% 620 36%
Total Expenditure 1,727 100% 1,667 1,727 60 100% 1,727 100%Proportion of Total Expenditure 97% 100% 3%Expenditure TypeLabour 296 27% 90% 100% 266 296 30 46%Electricity 11 1% 0% 100% 0 11 11 17%Materials 41 4% 90% 100% 37 41 4 6%Contractors 51 5% 90% 100% 46 51 5 8%Other 145 13% 90% 100% 130 145 14 22%Indirects & Overheads 587 53% 100% 100% 587 587 0 0%Revenue offsets -24 -2% 100% 100% -24 -24 0 0%
Total Operating Costs 1,108 100% 1,043 1,107 65 100%
Optimal
Real dollars, $000 Low High Low HighActivityOperations 327 19% 80% 100% 262 327 65 58% 327 19%Electricity 11 1% 100% 100% 11 11 0 0% 11 1%Preventative maintenance 148 9% 80% 100% 118 148 30 26% 148 9%Corrective maintenance 58 3% 80% 100% 47 58 12 10% 58 3%Revenue offsets -24 -1% 100% 100% -24 -24 0 0% -24 -1%Indirects & Overheads 587 n/a 100% 100% 587 587 n/a n/a 587 34%Operating costs 1,107 64% 1,001 1,107 107 94% 1,107 64%Renewal annuity 620 36% 99% 100% 613 620 7 6% 620 36%
Total Expenditure 1,727 100% 1,614 1,727 113 100% 1,727 100%Proportion of Total Expenditure 93% 100% 7%Expenditure TypeLabour 296 27% 80% 100% 237 296 59 50%Electricity 11 1% 0% 100% 0 11 11 10%Materials 41 4% 80% 100% 33 41 8 7%Contractors 51 5% 80% 100% 41 51 10 9%Other 145 13% 80% 100% 116 145 29 25%Indirects & Overheads 587 53% 100% 100% 587 587 0 0%Revenue offsets -24 -2% 100% 100% -24 -24 0 0%
Total Operating Costs 1,108 100% 990 1,107 118 100%
% of total variable
costs
Price Path
Average $
Price Path
Average %
Price Path
Average $
Price Path
Average %
% Range
Variable Costs
% of total variable
Price Path
Price Path
Price Path
Price Path
% Range Variable Costs

Queensland Competition Authority Appendices Indec Consulting
416370_2.DOCX October 2011
Bulk Supply – Mareeba Dimbulah
Service Contract Mareeba Dimbulah Bulk Supply
Real dollars, $000 2007 2008 2009 2010 2011 2012 2013 2014 2015 2016 2017ActivityOperations 769 802 663 781 793 798 790 806 795 778 772 788Electricity 3 4 4 4 4 4 6 6 7 8 8 7Preventative maintenance 583 347 85 86 180 182 193 198 195 189 187 192Corrective maintenance 258 167 13 8 23 23 24 25 24 24 24 24Revenue offsets -74 -77 -78 -75 -78 -78 -78 -78 -78 -78 -78 -78Operating costs 1,539 1,242 687 804 922 929 935 957 943 921 913 934Renewal annuity spend 101 47 91 39 238 350 0 101 0 89 48Dam safety upgrade 0 100 2,967 14,427 5,965 213 0 0 0 0 0
Total Expenditure 1,640 1,389 3,745 15,270 7,125 1,492 935 1,058 943 1,010 913 972Expenditure TypeLabour 416 280 215 202 248 252 256 256 256 256 256 256Electricity 3 4 4 4 4 4 6 6 7 8 8 7Materials 82 50 46 5 13 13 14 14 14 14 14 14Contractors 25 21 12 18 57 58 18 18 18 19 19 18Other 148 197 196 243 184 184 184 184 184 184 184 184Indirects & Overheads 938 768 291 407 493 496 535 558 542 519 510 533Revenue offsets -74 -77 -78 -75 -78 -78 -78 -78 -78 -78 -78 -78
Total Operating Costs 1,539 1,242 687 804 922 929 935 958 943 922 913 934
Actuals Forecast Price pathPrice Path
Average
Low
Real dollars, $000 Low High Low HighActivityOperations 370 37% 90% 100% 333 370 37 77% 370 37%Electricity 7 1% 100% 100% 7 7 0 0% 7 1%Preventative maintenance 192 19% 90% 100% 81 90 9 19% 90 9%Corrective maintenance 24 2% 90% 100% 10 11 1 2% 11 1%Revenue offsets -78 -8% 100% 100% -78 -78 0 0% -78 -8%Indirects & Overheads 533 n/a 100% 100% 533 533 n/a n/a 533 53%Operating costs 934 94% 887 934 47 98% 934 94%Renewal annuity 62 6% 98% 100% 61 62 1 2% 62 6%
Total Expenditure 996 100% 947 996 48 100% 996 100%Proportion of Total Expenditure 95% 100% 5%Expenditure TypeLabour 256 27% 90% 100% 230 256 26 54%Electricity 7 1% 100% 100% 7 7 0 0%Materials 14 1% 90% 100% 13 14 1 3%Contractors 18 2% 90% 100% 17 18 2 4%Other 184 20% 90% 100% 166 184 18 39%Indirects & Overheads 533 57% 100% 100% 533 533 0 0%Revenue offsets -78 -8% 100% 100% -78 -78 0 0%
Total Operating Costs 934 100% 887 934 47 100%
Recommended
Real dollars, $000 Low High Low HighActivityOperations 370 37% 80% 100% 296 370 74 78% 370 37%Electricity 7 1% 100% 100% 7 7 0 0% 7 1%Preventative maintenance 90 9% 80% 100% 72 90 18 19% 90 9%Corrective maintenance 11 1% 80% 100% 9 11 2 2% 11 1%Revenue offsets -78 -8% 100% 100% -78 -78 0 0% -78 -8%Indirects & Overheads 533 n/a 100% 100% 533 533 n/a n/a 533 53%Operating costs 934 94% 839 934 94 99% 934 94%Renewal annuity 62 6% 98% 100% 61 62 1 1% 62 6%
Total Expenditure 996 100% 900 996 96 100% 996 100%Proportion of Total Expenditure 90% 100% 10%Expenditure TypeLabour 256 27% 80% 100% 205 256 51 54%Electricity 7 1% 100% 100% 7 7 0 0%Materials 14 1% 80% 100% 11 14 3 3%Contractors 18 2% 80% 100% 15 18 4 4%Other 184 20% 80% 100% 147 184 37 39%Indirects & Overheads 533 57% 100% 100% 533 533 0 0%Revenue offsets -78 -8% 100% 100% -78 -78 0 0%
Total Operating Costs 934 100% 840 934 94 100%
High
Real dollars, $000 Low High Low HighActivityOperations 370 37% 70% 100% 259 370 111 78% 370 37%Electricity 7 1% 100% 100% 7 7 0 0% 7 1%Preventative maintenance 90 9% 70% 100% 63 90 27 19% 90 9%Corrective maintenance 11 1% 70% 100% 8 11 3 2% 11 1%Revenue offsets -78 -8% 100% 100% -78 -78 0 0% -78 -8%Indirects & Overheads 401 n/a 100% 100% 533 533 n/a n/a 533 53%Operating costs 934 94% 792 934 142 100% 934 94%Renewal annuity 62 6% 99% 100% 61 62 1 0% 62 6%
Total Expenditure 996 100% 854 996 142 100% 996 100%Proportion of Total Expenditure 86% 100% 14%Expenditure TypeLabour 256 27% 70% 100% 179 256 77 54%Electricity 7 1% 100% 100% 7 7 0 0%Materials 14 1% 70% 100% 10 14 4 3%Contractors 18 2% 70% 100% 13 18 6 4%Other 184 20% 70% 100% 129 184 55 39%Indirects & Overheads 533 57% 100% 100% 533 533 0 0%Revenue offsets -78 -8% 100% 100% -78 -78 0 0%
Total Operating Costs 934 100% 792 934 142 100%
% of total variable
Price Path
Price Path
Price Path
Price Path
% Range Variable Costs
% of total variable
costs
Price Path
Average $
Price Path
Average %
Price Path
Average $
Price Path
Average %
% Range
Variable Costs
% of total variable
Price Path
Price Path
Price Path
Price Path
% Range Variable Costs
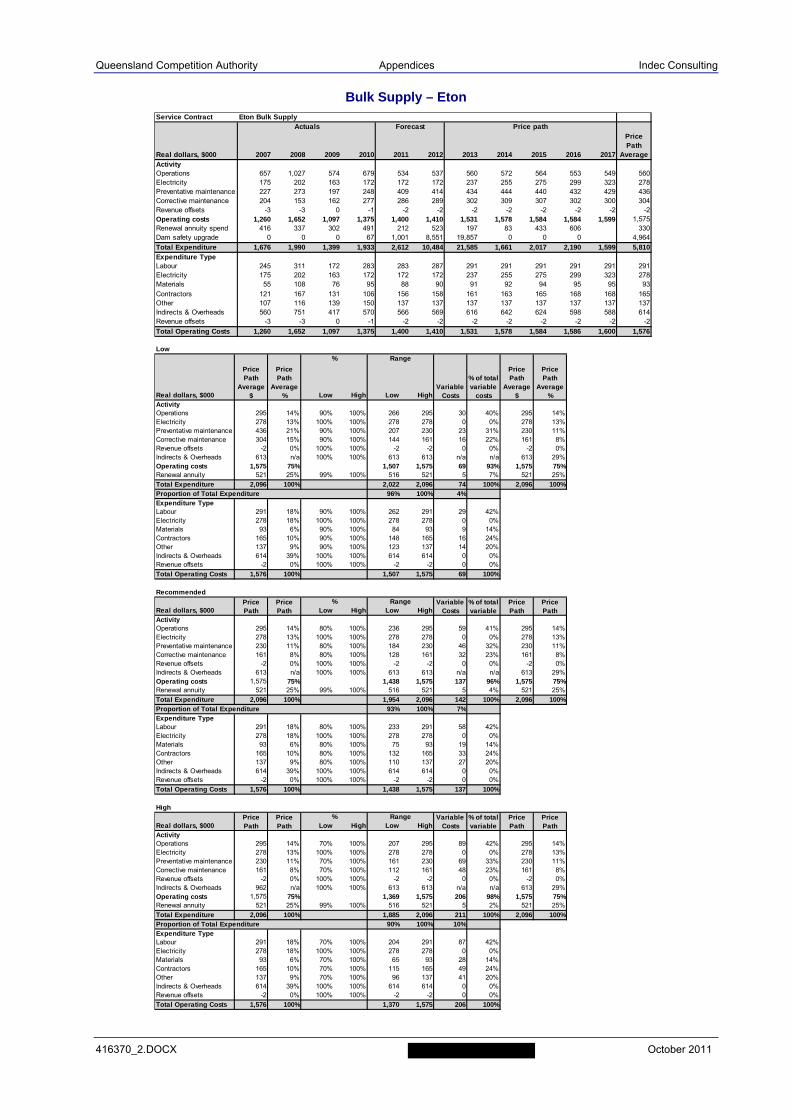
Queensland Competition Authority Appendices Indec Consulting
416370_2.DOCX October 2011
Bulk Supply – Eton
Service Contract Eton Bulk Supply
Real dollars, $000 2007 2008 2009 2010 2011 2012 2013 2014 2015 2016 2017ActivityOperations 657 1,027 574 679 534 537 560 572 564 553 549 560Electricity 175 202 163 172 172 172 237 255 275 299 323 278Preventative maintenance 227 273 197 248 409 414 434 444 440 432 429 436Corrective maintenance 204 153 162 277 286 289 302 309 307 302 300 304Revenue offsets -3 -3 0 -1 -2 -2 -2 -2 -2 -2 -2 -2Operating costs 1,260 1,652 1,097 1,375 1,400 1,410 1,531 1,578 1,584 1,584 1,599 1,575Renewal annuity spend 416 337 302 491 212 523 197 83 433 606 330Dam safety upgrade 0 0 0 67 1,001 8,551 19,857 0 0 0 4,964
Total Expenditure 1,676 1,990 1,399 1,933 2,612 10,484 21,585 1,661 2,017 2,190 1,599 5,810Expenditure TypeLabour 245 311 172 283 283 287 291 291 291 291 291 291Electricity 175 202 163 172 172 172 237 255 275 299 323 278Materials 55 108 76 95 88 90 91 92 94 95 95 93Contractors 121 167 131 106 156 158 161 163 165 168 168 165Other 107 116 139 150 137 137 137 137 137 137 137 137Indirects & Overheads 560 751 417 570 566 569 616 642 624 598 588 614Revenue offsets -3 -3 0 -1 -2 -2 -2 -2 -2 -2 -2 -2
Total Operating Costs 1,260 1,652 1,097 1,375 1,400 1,410 1,531 1,578 1,584 1,586 1,600 1,576
Actuals Forecast Price pathPrice Path
Average
Low
Real dollars, $000 Low High Low HighActivityOperations 295 14% 90% 100% 266 295 30 40% 295 14%Electricity 278 13% 100% 100% 278 278 0 0% 278 13%Preventative maintenance 436 21% 90% 100% 207 230 23 31% 230 11%Corrective maintenance 304 15% 90% 100% 144 161 16 22% 161 8%Revenue offsets -2 0% 100% 100% -2 -2 0 0% -2 0%Indirects & Overheads 613 n/a 100% 100% 613 613 n/a n/a 613 29%Operating costs 1,575 75% 1,507 1,575 69 93% 1,575 75%Renewal annuity 521 25% 99% 100% 516 521 5 7% 521 25%
Total Expenditure 2,096 100% 2,022 2,096 74 100% 2,096 100%Proportion of Total Expenditure 96% 100% 4%Expenditure TypeLabour 291 18% 90% 100% 262 291 29 42%Electricity 278 18% 100% 100% 278 278 0 0%Materials 93 6% 90% 100% 84 93 9 14%Contractors 165 10% 90% 100% 148 165 16 24%Other 137 9% 90% 100% 123 137 14 20%Indirects & Overheads 614 39% 100% 100% 614 614 0 0%Revenue offsets -2 0% 100% 100% -2 -2 0 0%
Total Operating Costs 1,576 100% 1,507 1,575 69 100%
Recommended
Real dollars, $000 Low High Low HighActivityOperations 295 14% 80% 100% 236 295 59 41% 295 14%Electricity 278 13% 100% 100% 278 278 0 0% 278 13%Preventative maintenance 230 11% 80% 100% 184 230 46 32% 230 11%Corrective maintenance 161 8% 80% 100% 128 161 32 23% 161 8%Revenue offsets -2 0% 100% 100% -2 -2 0 0% -2 0%Indirects & Overheads 613 n/a 100% 100% 613 613 n/a n/a 613 29%Operating costs 1,575 75% 1,438 1,575 137 96% 1,575 75%Renewal annuity 521 25% 99% 100% 516 521 5 4% 521 25%
Total Expenditure 2,096 100% 1,954 2,096 142 100% 2,096 100%Proportion of Total Expenditure 93% 100% 7%Expenditure TypeLabour 291 18% 80% 100% 233 291 58 42%Electricity 278 18% 100% 100% 278 278 0 0%Materials 93 6% 80% 100% 75 93 19 14%Contractors 165 10% 80% 100% 132 165 33 24%Other 137 9% 80% 100% 110 137 27 20%Indirects & Overheads 614 39% 100% 100% 614 614 0 0%Revenue offsets -2 0% 100% 100% -2 -2 0 0%
Total Operating Costs 1,576 100% 1,438 1,575 137 100%
High
Real dollars, $000 Low High Low HighActivityOperations 295 14% 70% 100% 207 295 89 42% 295 14%Electricity 278 13% 100% 100% 278 278 0 0% 278 13%Preventative maintenance 230 11% 70% 100% 161 230 69 33% 230 11%Corrective maintenance 161 8% 70% 100% 112 161 48 23% 161 8%Revenue offsets -2 0% 100% 100% -2 -2 0 0% -2 0%Indirects & Overheads 962 n/a 100% 100% 613 613 n/a n/a 613 29%Operating costs 1,575 75% 1,369 1,575 206 98% 1,575 75%Renewal annuity 521 25% 99% 100% 516 521 5 2% 521 25%
Total Expenditure 2,096 100% 1,885 2,096 211 100% 2,096 100%Proportion of Total Expenditure 90% 100% 10%Expenditure TypeLabour 291 18% 70% 100% 204 291 87 42%Electricity 278 18% 100% 100% 278 278 0 0%Materials 93 6% 70% 100% 65 93 28 14%Contractors 165 10% 70% 100% 115 165 49 24%Other 137 9% 70% 100% 96 137 41 20%Indirects & Overheads 614 39% 100% 100% 614 614 0 0%Revenue offsets -2 0% 100% 100% -2 -2 0 0%
Total Operating Costs 1,576 100% 1,370 1,575 206 100%
% of total variable
Price Path
Price Path
Price Path
Price Path
% Range Variable Costs
% of total variable
costs
Price Path
Average $
Price Path
Average %
Price Path
Average $
Price Path
Average %
% Range
Variable Costs
% of total variable
Price Path
Price Path
Price Path
Price Path
% Range Variable Costs

Queensland Competition Authority Appendices Indec Consulting
416370_2.DOCX October 2011
Bulk Supply – Nogoa MacKenzie
Service Contract Nogoa-Mackenzie Bulk Supply
Real dollars, $000 2007 2008 2009 2010 2011 2012 2013 2014 2015 2016 2017ActivityOperations 1,415 1,140 2,079 2,541 1,717 1,730 1,825 1,869 1,841 1,798 1,782 1,823Electricity 7 12 8 11 12 12 14 15 16 17 19 16Preventative maintenance 371 92 148 167 245 247 261 268 263 256 254 260Corrective maintenance 274 305 333 215 184 186 195 200 198 194 193 196Revenue offsets -21 -114 -190 -161 -54 -54 -54 -54 -54 -54 -54 -54Operating costs 2,046 1,434 2,379 2,773 2,103 2,120 2,241 2,298 2,264 2,211 2,194 2,242Renewal annuity spend 1,492 1,176 440 883 2,303 1,417 104 328 535 250 304Dam safety upgrade 0 0 0 0 0 0 0 0 0 0 0
Total Expenditure 3,538 2,610 2,819 3,656 4,407 3,537 2,345 2,626 2,799 2,461 2,194 2,485Expenditure TypeLabour 433 332 552 571 591 599 611 611 611 611 611 611Electricity 7 12 8 11 12 12 14 15 16 17 19 16Materials 114 63 158 56 75 76 77 78 79 80 80 79Contractors 138 63 -130 157 94 95 97 98 100 101 101 99Other 310 263 553 952 224 224 224 224 224 224 224 224Indirects & Overheads 1,063 814 1,427 1,186 1,163 1,168 1,272 1,326 1,288 1,233 1,212 1,266Revenue offsets -21 -114 -190 -161 -54 -54 -54 -54 -54 -54 -54 -54
Total Operating Costs 2,046 1,434 2,379 2,773 2,103 2,120 2,241 2,298 2,264 2,212 2,193 2,242
Actuals Forecast Price pathPrice Path
Average
Low
Real dollars, $000 Low High Low HighActivityOperations 810 30% 90% 100% 729 810 81 75% 810 30%Electricity 16 1% 100% 100% 16 16 0 0% 16 1%Preventative maintenance 260 10% 90% 100% 104 116 12 11% 116 4%Corrective maintenance 196 7% 90% 100% 78 87 9 8% 87 3%Revenue offsets -54 -2% 100% 100% -54 -54 0 0% -54 -2%Indirects & Overheads 1,266 n/a 100% 100% 1,266 1,266 n/a n/a 1,266 46%Operating costs 2,242 82% 2,140 2,242 101 94% 2,242 82%Renewal annuity 485 18% 99% 100% 479 485 6 6% 485 18%
Total Expenditure 2,727 100% 2,619 2,727 108 100% 2,727 100%Proportion of Total Expenditure 96% 100% 4%Expenditure TypeLabour 611 27% 90% 100% 550 611 61 60%Electricity 16 1% 100% 100% 16 16 0 0%Materials 79 4% 90% 100% 71 79 8 8%Contractors 99 4% 90% 100% 89 99 10 10%Other 224 10% 90% 100% 202 224 22 22%Indirects & Overheads 1,266 56% 100% 100% 1,266 1,266 0 0%Revenue offsets -54 -2% 100% 100% -54 -54 0 0%
Total Operating Costs 2,242 100% 2,140 2,242 101 100%
Recommended
Real dollars, $000 Low High Low HighActivityOperations 810 30% 80% 100% 648 810 162 78% 810 30%Electricity 16 1% 100% 100% 16 16 0 0% 16 1%Preventative maintenance 116 4% 80% 100% 93 116 23 11% 116 4%Corrective maintenance 87 3% 80% 100% 70 87 17 8% 87 3%Revenue offsets -54 -2% 100% 100% -54 -54 0 0% -54 -2%Indirects & Overheads 1,266 n/a 100% 100% 1,266 1,266 n/a n/a 1,266 46%Operating costs 2,242 82% 2,039 2,242 203 97% 2,242 82%Renewal annuity 485 18% 99% 100% 479 485 6 3% 485 18%
Total Expenditure 2,727 100% 2,518 2,727 209 100% 2,727 100%Proportion of Total Expenditure 92% 100% 8%Expenditure TypeLabour 611 27% 80% 100% 489 611 122 60%Electricity 16 1% 100% 100% 16 16 0 0%Materials 79 4% 80% 100% 63 79 16 8%Contractors 99 4% 80% 100% 80 99 20 10%Other 224 10% 80% 100% 179 224 45 22%Indirects & Overheads 1,266 56% 100% 100% 1,266 1,266 0 0%Revenue offsets -54 -2% 100% 100% -54 -54 0 0%
Total Operating Costs 2,242 100% 2,039 2,242 203 100%
High
Real dollars, $000 Low High Low HighActivityOperations 810 30% 70% 100% 567 810 243 79% 810 30%Electricity 16 1% 100% 100% 16 16 0 0% 16 1%Preventative maintenance 116 4% 70% 100% 81 116 35 11% 116 4%Corrective maintenance 87 3% 70% 100% 61 87 26 8% 87 3%Revenue offsets -54 -2% 100% 100% -54 -54 0 0% -54 -2%Indirects & Overheads 975 n/a 100% 100% 1,266 1,266 n/a n/a 1,266 46%Operating costs 2,242 82% 1,938 2,242 304 98% 2,242 82%Renewal annuity 485 18% 99% 100% 480 485 5 2% 485 18%
Total Expenditure 2,727 100% 2,418 2,727 309 100% 2,727 100%Proportion of Total Expenditure 89% 100% 11%Expenditure TypeLabour 611 27% 70% 100% 428 611 183 60%Electricity 16 1% 100% 100% 16 16 0 0%Materials 79 4% 70% 100% 55 79 24 8%Contractors 99 4% 70% 100% 70 99 30 10%Other 224 10% 70% 100% 157 224 67 22%Indirects & Overheads 1,266 56% 100% 100% 1,266 1,266 0 0%Revenue offsets -54 -2% 100% 100% -54 -54 0 0%
Total Operating Costs 2,242 100% 1,938 2,242 304 100%
% of total variable
Price Path
Price Path
Price Path
Price Path
% Range Variable Costs
% of total variable
costs
Price Path
Average $
Price Path
Average %
Price Path
Average $
Price Path
Average %
% Range
Variable Costs
% of total variable
Price Path
Price Path
Price Path
Price Path
% Range Variable Costs
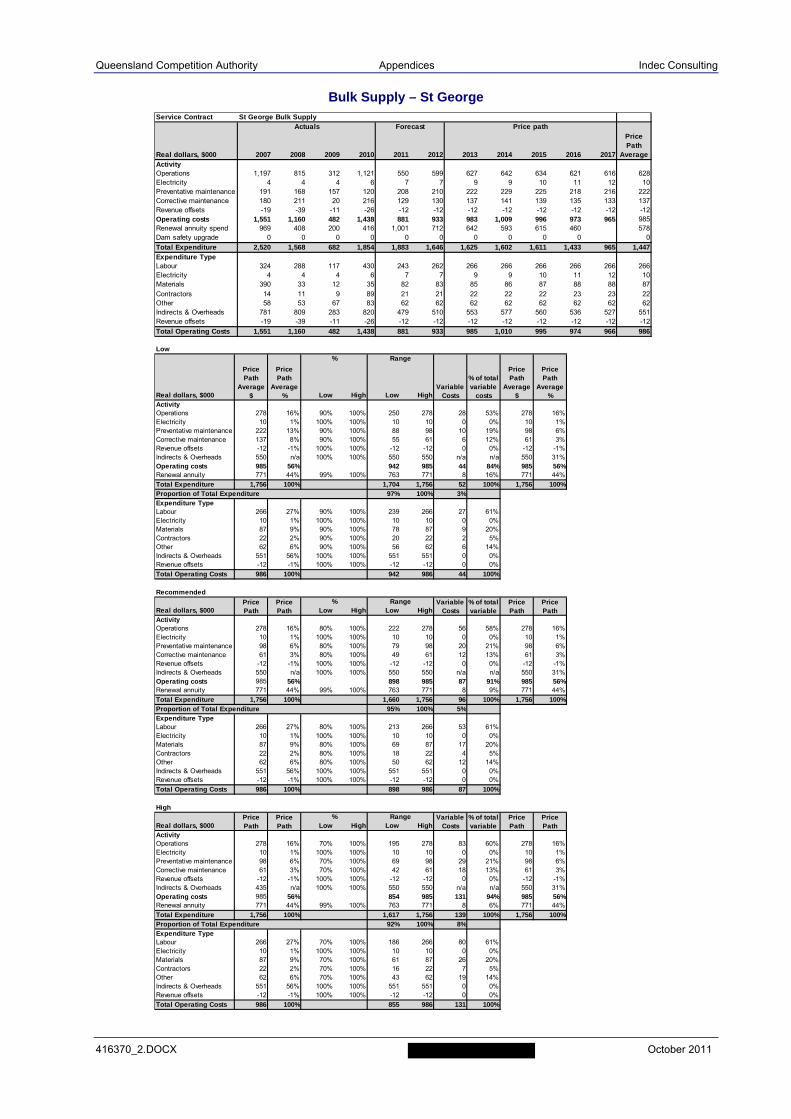
Queensland Competition Authority Appendices Indec Consulting
416370_2.DOCX October 2011
Bulk Supply – St George
Service Contract St George Bulk Supply
Real dollars, $000 2007 2008 2009 2010 2011 2012 2013 2014 2015 2016 2017ActivityOperations 1,197 815 312 1,121 550 599 627 642 634 621 616 628Electricity 4 4 4 6 7 7 9 9 10 11 12 10Preventative maintenance 191 168 157 120 208 210 222 229 225 218 216 222Corrective maintenance 180 211 20 216 129 130 137 141 139 135 133 137Revenue offsets -19 -39 -11 -26 -12 -12 -12 -12 -12 -12 -12 -12Operating costs 1,551 1,160 482 1,438 881 933 983 1,009 996 973 965 985Renewal annuity spend 969 408 200 416 1,001 712 642 593 615 460 578Dam safety upgrade 0 0 0 0 0 0 0 0 0 0 0
Total Expenditure 2,520 1,568 682 1,854 1,883 1,646 1,625 1,602 1,611 1,433 965 1,447Expenditure TypeLabour 324 288 117 430 243 262 266 266 266 266 266 266Electricity 4 4 4 6 7 7 9 9 10 11 12 10Materials 390 33 12 35 82 83 85 86 87 88 88 87Contractors 14 11 9 89 21 21 22 22 22 23 23 22Other 58 53 67 83 62 62 62 62 62 62 62 62Indirects & Overheads 781 809 283 820 479 510 553 577 560 536 527 551Revenue offsets -19 -39 -11 -26 -12 -12 -12 -12 -12 -12 -12 -12
Total Operating Costs 1,551 1,160 482 1,438 881 933 985 1,010 995 974 966 986
Actuals Forecast Price pathPrice Path
Average
Low
Real dollars, $000 Low High Low HighActivityOperations 278 16% 90% 100% 250 278 28 53% 278 16%Electricity 10 1% 100% 100% 10 10 0 0% 10 1%Preventative maintenance 222 13% 90% 100% 88 98 10 19% 98 6%Corrective maintenance 137 8% 90% 100% 55 61 6 12% 61 3%Revenue offsets -12 -1% 100% 100% -12 -12 0 0% -12 -1%Indirects & Overheads 550 n/a 100% 100% 550 550 n/a n/a 550 31%Operating costs 985 56% 942 985 44 84% 985 56%Renewal annuity 771 44% 99% 100% 763 771 8 16% 771 44%
Total Expenditure 1,756 100% 1,704 1,756 52 100% 1,756 100%Proportion of Total Expenditure 97% 100% 3%Expenditure TypeLabour 266 27% 90% 100% 239 266 27 61%Electricity 10 1% 100% 100% 10 10 0 0%Materials 87 9% 90% 100% 78 87 9 20%Contractors 22 2% 90% 100% 20 22 2 5%Other 62 6% 90% 100% 56 62 6 14%Indirects & Overheads 551 56% 100% 100% 551 551 0 0%Revenue offsets -12 -1% 100% 100% -12 -12 0 0%
Total Operating Costs 986 100% 942 986 44 100%
Recommended
Real dollars, $000 Low High Low HighActivityOperations 278 16% 80% 100% 222 278 56 58% 278 16%Electricity 10 1% 100% 100% 10 10 0 0% 10 1%Preventative maintenance 98 6% 80% 100% 79 98 20 21% 98 6%Corrective maintenance 61 3% 80% 100% 49 61 12 13% 61 3%Revenue offsets -12 -1% 100% 100% -12 -12 0 0% -12 -1%Indirects & Overheads 550 n/a 100% 100% 550 550 n/a n/a 550 31%Operating costs 985 56% 898 985 87 91% 985 56%Renewal annuity 771 44% 99% 100% 763 771 8 9% 771 44%
Total Expenditure 1,756 100% 1,660 1,756 96 100% 1,756 100%Proportion of Total Expenditure 95% 100% 5%Expenditure TypeLabour 266 27% 80% 100% 213 266 53 61%Electricity 10 1% 100% 100% 10 10 0 0%Materials 87 9% 80% 100% 69 87 17 20%Contractors 22 2% 80% 100% 18 22 4 5%Other 62 6% 80% 100% 50 62 12 14%Indirects & Overheads 551 56% 100% 100% 551 551 0 0%Revenue offsets -12 -1% 100% 100% -12 -12 0 0%
Total Operating Costs 986 100% 898 986 87 100%
High
Real dollars, $000 Low High Low HighActivityOperations 278 16% 70% 100% 195 278 83 60% 278 16%Electricity 10 1% 100% 100% 10 10 0 0% 10 1%Preventative maintenance 98 6% 70% 100% 69 98 29 21% 98 6%Corrective maintenance 61 3% 70% 100% 42 61 18 13% 61 3%Revenue offsets -12 -1% 100% 100% -12 -12 0 0% -12 -1%Indirects & Overheads 435 n/a 100% 100% 550 550 n/a n/a 550 31%Operating costs 985 56% 854 985 131 94% 985 56%Renewal annuity 771 44% 99% 100% 763 771 8 6% 771 44%
Total Expenditure 1,756 100% 1,617 1,756 139 100% 1,756 100%Proportion of Total Expenditure 92% 100% 8%Expenditure TypeLabour 266 27% 70% 100% 186 266 80 61%Electricity 10 1% 100% 100% 10 10 0 0%Materials 87 9% 70% 100% 61 87 26 20%Contractors 22 2% 70% 100% 16 22 7 5%Other 62 6% 70% 100% 43 62 19 14%Indirects & Overheads 551 56% 100% 100% 551 551 0 0%Revenue offsets -12 -1% 100% 100% -12 -12 0 0%
Total Operating Costs 986 100% 855 986 131 100%
% of total variable
Price Path
Price Path
Price Path
Price Path
% Range Variable Costs
% of total variable
costs
Price Path
Average $
Price Path
Average %
Price Path
Average $
Price Path
Average %
% Range
Variable Costs
% of total variable
Price Path
Price Path
Price Path
Price Path
% Range Variable Costs

Queensland Competition Authority Appendices Indec Consulting
416370_2.DOCX October 2011
Bulk Supply – Dawson Valley
Service Contract Dawson Valley Bulk Supply
Real dollars, $000 2007 2008 2009 2010 2011 2012 2013 2014 2015 2016 2017ActivityOperations 598 587 722 910 592 598 628 642 633 618 610 626Electricity 1 48 20 48 41 41 35 37 40 44 47 41Preventative maintenance 269 140 147 104 184 186 196 200 197 193 190 195Corrective maintenance 260 132 161 142 84 85 90 92 91 88 87 90Revenue offsets -14 -11 -14 -14 -5 -5 -5 -5 -5 -5 -5 -5Operating costs 1,114 897 1,036 1,190 896 904 944 966 956 938 929 947Renewal annuity spend 180 219 124 130 345 118 160 199 153 89 150Dam safety upgrade 0 0 0 0 0 0 0 0 0 0 0
Total Expenditure 1,295 1,116 1,160 1,320 1,241 1,022 1,104 1,165 1,109 1,027 929 1,067Expenditure TypeLabour 228 179 258 335 263 267 271 271 271 271 271 271Electricity 1 48 20 48 41 41 35 37 40 44 47 41Materials 63 34 31 25 23 23 23 24 24 25 25 24Contractors 15 49 14 27 10 10 11 11 11 11 11 11Other 122 139 100 103 72 72 72 72 72 72 72 72Indirects & Overheads 699 459 627 665 492 495 536 556 542 520 508 532Revenue offsets -14 -11 -14 -14 -5 -5 -5 -5 -5 -5 -5 -5
Total Operating Costs 1,114 897 1,036 1,190 896 904 943 966 955 938 929 946
Actuals Forecast Price pathPrice Path
Average
Low
Real dollars, $000 Low High Low HighActivityOperations 260 27% 90% 100% 234 260 26 63% 260 27%Electricity 41 4% 100% 100% 41 41 0 0% 41 4%Preventative maintenance 195 20% 90% 100% 73 81 8 20% 81 8%Corrective maintenance 90 9% 90% 100% 33 37 4 9% 37 4%Revenue offsets -5 -1% 100% 100% -5 -5 0 0% -5 -1%Indirects & Overheads 533 n/a 100% 100% 533 533 n/a n/a 533 55%Operating costs 947 97% 909 947 38 92% 947 97%Renewal annuity 25 3% 87% 100% 22 25 3 8% 25 3%
Total Expenditure 972 100% 930 972 41 100% 972 100%Proportion of Total Expenditure 96% 100% 4%Expenditure TypeLabour 271 29% 90% 100% 244 271 27 72%Electricity 41 4% 100% 100% 41 41 0 0%Materials 24 3% 90% 100% 22 24 2 6%Contractors 11 1% 90% 100% 10 11 1 3%Other 72 8% 90% 100% 65 72 7 19%Indirects & Overheads 532 56% 100% 100% 532 532 0 0%Revenue offsets -5 -1% 100% 100% -5 -5 0 0%
Total Operating Costs 946 100% 909 946 38 100%
Recommended
Real dollars, $000 Low High Low HighActivityOperations 260 27% 80% 100% 208 260 52 66% 260 27%Electricity 41 4% 100% 100% 41 41 0 0% 41 4%Preventative maintenance 81 8% 80% 100% 65 81 16 21% 81 8%Corrective maintenance 37 4% 80% 100% 30 37 7 9% 37 4%Revenue offsets -5 -1% 100% 100% -5 -5 0 0% -5 -1%Indirects & Overheads 533 n/a 100% 100% 533 533 n/a n/a 533 55%Operating costs 947 97% 871 947 76 96% 947 97%Renewal annuity 25 3% 87% 100% 22 25 3 4% 25 3%
Total Expenditure 972 100% 893 972 79 100% 972 100%Proportion of Total Expenditure 92% 100% 8%Expenditure TypeLabour 271 29% 80% 100% 217 271 54 72%Electricity 41 4% 100% 100% 41 41 0 0%Materials 24 3% 80% 100% 19 24 5 6%Contractors 11 1% 80% 100% 9 11 2 3%Other 72 8% 80% 100% 58 72 14 19%Indirects & Overheads 532 56% 100% 100% 532 532 0 0%Revenue offsets -5 -1% 100% 100% -5 -5 0 0%
Total Operating Costs 946 100% 871 946 76 100%
High
Real dollars, $000 Low High Low HighActivityOperations 260 27% 70% 100% 182 260 78 69% 260 27%Electricity 41 4% 100% 100% 41 41 0 0% 41 4%Preventative maintenance 81 8% 70% 100% 57 81 24 21% 81 8%Corrective maintenance 37 4% 70% 100% 26 37 11 10% 37 4%Revenue offsets -5 -1% 100% 100% -5 -5 0 0% -5 -1%Indirects & Overheads 414 n/a 100% 100% 533 533 n/a n/a 533 55%Operating costs 947 97% 833 947 114 100% 947 97%Renewal annuity 25 3% 99% 100% 25 25 0 0% 25 3%
Total Expenditure 972 100% 858 972 114 100% 972 100%Proportion of Total Expenditure 88% 100% 12%Expenditure TypeLabour 271 29% 70% 100% 190 271 81 72%Electricity 41 4% 100% 100% 41 41 0 0%Materials 24 3% 70% 100% 17 24 7 6%Contractors 11 1% 70% 100% 8 11 3 3%Other 72 8% 70% 100% 50 72 22 19%Indirects & Overheads 532 56% 100% 100% 532 532 0 0%Revenue offsets -5 -1% 100% 100% -5 -5 0 0%
Total Operating Costs 946 100% 833 946 114 100%
% of total variable
Price Path
Price Path
Price Path
Price Path
% Range Variable Costs
% of total variable
costs
Price Path
Average $
Price Path
Average %
Price Path
Average $
Price Path
Average %
% Range
Variable Costs
% of total variable
Price Path
Price Path
Price Path
Price Path
% Range Variable Costs
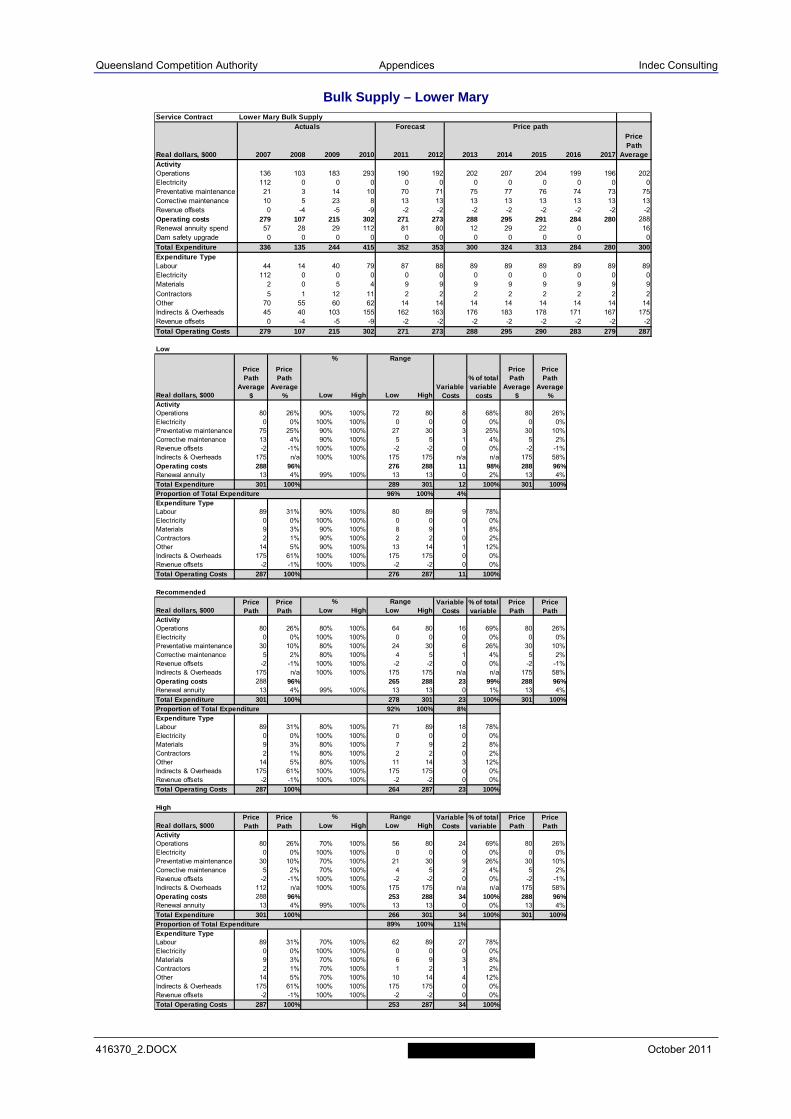
Queensland Competition Authority Appendices Indec Consulting
416370_2.DOCX October 2011
Bulk Supply – Lower Mary
Service Contract Lower Mary Bulk Supply
Real dollars, $000 2007 2008 2009 2010 2011 2012 2013 2014 2015 2016 2017ActivityOperations 136 103 183 293 190 192 202 207 204 199 196 202Electricity 112 0 0 0 0 0 0 0 0 0 0 0Preventative maintenance 21 3 14 10 70 71 75 77 76 74 73 75Corrective maintenance 10 5 23 8 13 13 13 13 13 13 13 13Revenue offsets 0 -4 -5 -9 -2 -2 -2 -2 -2 -2 -2 -2Operating costs 279 107 215 302 271 273 288 295 291 284 280 288Renewal annuity spend 57 28 29 112 81 80 12 29 22 0 16Dam safety upgrade 0 0 0 0 0 0 0 0 0 0 0
Total Expenditure 336 135 244 415 352 353 300 324 313 284 280 300Expenditure TypeLabour 44 14 40 79 87 88 89 89 89 89 89 89Electricity 112 0 0 0 0 0 0 0 0 0 0 0Materials 2 0 5 4 9 9 9 9 9 9 9 9Contractors 5 1 12 11 2 2 2 2 2 2 2 2Other 70 55 60 62 14 14 14 14 14 14 14 14Indirects & Overheads 45 40 103 155 162 163 176 183 178 171 167 175Revenue offsets 0 -4 -5 -9 -2 -2 -2 -2 -2 -2 -2 -2
Total Operating Costs 279 107 215 302 271 273 288 295 290 283 279 287
Actuals Forecast Price pathPrice Path
Average
Low
Real dollars, $000 Low High Low HighActivityOperations 80 26% 90% 100% 72 80 8 68% 80 26%Electricity 0 0% 100% 100% 0 0 0 0% 0 0%Preventative maintenance 75 25% 90% 100% 27 30 3 25% 30 10%Corrective maintenance 13 4% 90% 100% 5 5 1 4% 5 2%Revenue offsets -2 -1% 100% 100% -2 -2 0 0% -2 -1%Indirects & Overheads 175 n/a 100% 100% 175 175 n/a n/a 175 58%Operating costs 288 96% 276 288 11 98% 288 96%Renewal annuity 13 4% 99% 100% 13 13 0 2% 13 4%
Total Expenditure 301 100% 289 301 12 100% 301 100%Proportion of Total Expenditure 96% 100% 4%Expenditure TypeLabour 89 31% 90% 100% 80 89 9 78%Electricity 0 0% 100% 100% 0 0 0 0%Materials 9 3% 90% 100% 8 9 1 8%Contractors 2 1% 90% 100% 2 2 0 2%Other 14 5% 90% 100% 13 14 1 12%Indirects & Overheads 175 61% 100% 100% 175 175 0 0%Revenue offsets -2 -1% 100% 100% -2 -2 0 0%
Total Operating Costs 287 100% 276 287 11 100%
Recommended
Real dollars, $000 Low High Low HighActivityOperations 80 26% 80% 100% 64 80 16 69% 80 26%Electricity 0 0% 100% 100% 0 0 0 0% 0 0%Preventative maintenance 30 10% 80% 100% 24 30 6 26% 30 10%Corrective maintenance 5 2% 80% 100% 4 5 1 4% 5 2%Revenue offsets -2 -1% 100% 100% -2 -2 0 0% -2 -1%Indirects & Overheads 175 n/a 100% 100% 175 175 n/a n/a 175 58%Operating costs 288 96% 265 288 23 99% 288 96%Renewal annuity 13 4% 99% 100% 13 13 0 1% 13 4%
Total Expenditure 301 100% 278 301 23 100% 301 100%Proportion of Total Expenditure 92% 100% 8%Expenditure TypeLabour 89 31% 80% 100% 71 89 18 78%Electricity 0 0% 100% 100% 0 0 0 0%Materials 9 3% 80% 100% 7 9 2 8%Contractors 2 1% 80% 100% 2 2 0 2%Other 14 5% 80% 100% 11 14 3 12%Indirects & Overheads 175 61% 100% 100% 175 175 0 0%Revenue offsets -2 -1% 100% 100% -2 -2 0 0%
Total Operating Costs 287 100% 264 287 23 100%
High
Real dollars, $000 Low High Low HighActivityOperations 80 26% 70% 100% 56 80 24 69% 80 26%Electricity 0 0% 100% 100% 0 0 0 0% 0 0%Preventative maintenance 30 10% 70% 100% 21 30 9 26% 30 10%Corrective maintenance 5 2% 70% 100% 4 5 2 4% 5 2%Revenue offsets -2 -1% 100% 100% -2 -2 0 0% -2 -1%Indirects & Overheads 112 n/a 100% 100% 175 175 n/a n/a 175 58%Operating costs 288 96% 253 288 34 100% 288 96%Renewal annuity 13 4% 99% 100% 13 13 0 0% 13 4%
Total Expenditure 301 100% 266 301 34 100% 301 100%Proportion of Total Expenditure 89% 100% 11%Expenditure TypeLabour 89 31% 70% 100% 62 89 27 78%Electricity 0 0% 100% 100% 0 0 0 0%Materials 9 3% 70% 100% 6 9 3 8%Contractors 2 1% 70% 100% 1 2 1 2%Other 14 5% 70% 100% 10 14 4 12%Indirects & Overheads 175 61% 100% 100% 175 175 0 0%Revenue offsets -2 -1% 100% 100% -2 -2 0 0%
Total Operating Costs 287 100% 253 287 34 100%
% of total variable
Price Path
Price Path
Price Path
Price Path
% Range Variable Costs
% of total variable
costs
Price Path
Average $
Price Path
Average %
Price Path
Average $
Price Path
Average %
% Range
Variable Costs
% of total variable
Price Path
Price Path
Price Path
Price Path
% Range Variable Costs

Queensland Competition Authority Appendices Indec Consulting
416370_2.DOCX October 2011
Bulk Supply – Barker Barambah
Service Contract Barker Barambah Bulk Supply
Real dollars, $000 2007 2008 2009 2010 2011 2012 2013 2014 2015 2016 2017ActivityOperations 348 398 690 541 529 539 561 572 566 515 509 545Electricity 11 10 16 7 19 19 18 20 21 23 25 21Preventative maintenance 136 61 83 54 103 104 110 112 111 108 107 110Corrective maintenance 14 65 54 48 48 48 51 52 51 50 50 51Revenue offsets -11 -20 -28 -28 -19 -19 -19 -19 -19 -19 -19 -19Operating costs 498 514 815 622 680 691 721 737 730 677 672 707Renewal annuity spend 144 185 124 161 173 558 42 184 6 28 65Dam safety upgrade 3,656 1,827 0 0 0 0 0 0 0 0 0
Total Expenditure 4,298 2,526 939 783 853 1,249 763 921 736 705 672 759Expenditure TypeLabour 127 119 175 148 176 179 181 181 181 181 181 181Electricity 11 10 16 7 19 19 18 20 21 23 25 21Materials 21 23 16 8 18 18 19 19 19 19 19 19Contractors 34 44 24 41 46 47 47 48 49 11 11 33Other 114 108 158 150 105 110 110 110 110 110 110 110Indirects & Overheads 202 229 454 296 334 337 364 377 368 351 343 361Revenue offsets -11 -20 -28 -28 -19 -19 -19 -19 -19 -19 -19 -19
Total Operating Costs 498 514 815 622 680 691 720 736 729 676 670 706
Actuals Forecast Price pathPrice Path
Average
Low
Real dollars, $000 Low High Low HighActivityOperations 266 28% 90% 100% 239 266 27 47% 266 28%Electricity 21 2% 0% 100% 0 21 21 38% 21 2%Preventative maintenance 110 11% 90% 100% 48 53 5 9% 53 6%Corrective maintenance 51 5% 90% 100% 22 25 2 4% 25 3%Revenue offsets -19 -2% 100% 100% -19 -19 0 0% -19 -2%Indirects & Overheads 361 n/a 100% 100% 361 361 n/a n/a 361 38%Operating costs 707 74% 652 707 56 98% 707 74%Renewal annuity 246 26% 100% 100% 245 246 1 2% 246 26%
Total Expenditure 953 100% 897 953 57 100% 953 100%Proportion of Total Expenditure 94% 100% 6%Expenditure TypeLabour 181 26% 90% 100% 163 181 18 33%Electricity 21 3% 0% 100% 0 21 21 38%Materials 19 3% 90% 100% 17 19 2 3%Contractors 33 5% 90% 100% 30 33 3 6%Other 110 16% 90% 100% 99 110 11 20%Indirects & Overheads 361 51% 100% 100% 361 361 0 0%Revenue offsets -19 -3% 100% 100% -19 -19 0 0%
Total Operating Costs 706 100% 651 707 56 100%
Recommended
Real dollars, $000 Low High Low HighActivityOperations 266 28% 80% 100% 212 266 53 58% 266 28%Electricity 21 2% 0% 100% 0 21 21 23% 21 2%Preventative maintenance 53 6% 80% 100% 43 53 11 12% 53 6%Corrective maintenance 25 3% 80% 100% 20 25 5 5% 25 3%Revenue offsets -19 -2% 100% 100% -19 -19 0 0% -19 -2%Indirects & Overheads 361 n/a 100% 100% 361 361 n/a n/a 361 38%Operating costs 707 74% 617 707 90 99% 707 74%Renewal annuity 246 26% 100% 100% 245 246 1 1% 246 26%
Total Expenditure 953 100% 862 953 91 100% 953 100%Proportion of Total Expenditure 90% 100% 10%Expenditure TypeLabour 181 26% 80% 100% 145 181 36 40%Electricity 21 3% 0% 100% 0 21 21 24%Materials 19 3% 80% 100% 15 19 4 4%Contractors 33 5% 80% 100% 27 33 7 7%Other 110 16% 80% 100% 88 110 22 24%Indirects & Overheads 361 51% 100% 100% 361 361 0 0%Revenue offsets -19 -3% 100% 100% -19 -19 0 0%
Total Operating Costs 706 100% 617 707 90 100%
High
Real dollars, $000 Low High Low HighActivityOperations 266 28% 70% 100% 186 266 80 63% 266 28%Electricity 21 2% 0% 100% 0 21 21 17% 21 2%Preventative maintenance 53 6% 70% 100% 37 53 16 13% 53 6%Corrective maintenance 25 3% 70% 100% 17 25 7 6% 25 3%Revenue offsets -19 -2% 100% 100% -19 -19 0 0% -19 -2%Indirects & Overheads 346 n/a 100% 100% 361 361 n/a n/a 361 38%Operating costs 707 74% 583 707 125 98% 707 74%Renewal annuity 246 26% 99% 100% 244 246 2 2% 246 26%
Total Expenditure 953 100% 826 953 127 100% 953 100%Proportion of Total Expenditure 87% 100% 13%Expenditure TypeLabour 181 26% 70% 100% 127 181 54 44%Electricity 21 3% 0% 100% 0 21 21 17%Materials 19 3% 70% 100% 13 19 6 5%Contractors 33 5% 70% 100% 23 33 10 8%Other 110 16% 70% 100% 77 110 33 27%Indirects & Overheads 361 51% 100% 100% 361 361 0 0%Revenue offsets -19 -3% 100% 100% -19 -19 0 0%
Total Operating Costs 706 100% 582 707 125 100%
% of total variable
Price Path
Price Path
Price Path
Price Path
% Range Variable Costs
% of total variable
costs
Price Path
Average $
Price Path
Average %
Price Path
Average $
Price Path
Average %
% Range
Variable Costs
% of total variable
Price Path
Price Path
Price Path
Price Path
% Range Variable Costs

Queensland Competition Authority Appendices Indec Consulting
416370_2.DOCX October 2011
Bulk Supply – Bowen Broken
Service Contract Bowen Broken Bulk Supply
Real dollars, $000 2007 2008 2009 2010 2011 2012 2013 2014 2015 2016 2017ActivityOperations 578 405 500 636 473 477 497 507 502 492 487 497Electricity 56 104 125 93 102 102 119 129 139 151 163 140Preventative maintenance 101 80 76 100 183 185 194 198 196 193 190 194Corrective maintenance 123 421 287 117 203 206 213 217 217 216 214 215Revenue offsets -6 -12 -22 -12 -12 7 -12 -12 -12 -12 -12 -12Operating costs 853 999 965 934 949 976 1,011 1,039 1,042 1,040 1,042 1,035Renewal annuity spend 15 91 475 287 203 75 149 162 255 236 201Dam safety upgrade 0 0 0 0 0 0 0 0 0 0 0
Total Expenditure 868 1,090 1,440 1,220 1,152 1,051 1,160 1,201 1,297 1,276 1,042 1,195Expenditure TypeLabour 145 128 166 208 202 205 208 208 208 208 208 208Electricity 56 104 125 93 102 102 119 129 139 151 163 140Materials 15 216 55 54 42 42 43 43 44 45 45 44Contractors 66 125 195 77 141 143 145 147 149 152 152 149Other 139 123 141 92 86 86 86 86 86 86 86 86Indirects & Overheads 437 315 306 423 387 390 422 437 427 410 400 419Revenue offsets -6 -12 -22 -12 -12 7 -12 -12 -12 -12 -12 -12
Total Operating Costs 853 999 965 934 949 976 1,011 1,038 1,041 1,040 1,042 1,034
Actuals Forecast Price pathPrice Path
Average
Low
Real dollars, $000 Low High Low HighActivityOperations 267 20% 90% 100% 240 267 27 52% 267 20%Electricity 140 10% 100% 100% 140 140 0 0% 140 10%Preventative maintenance 194 14% 90% 100% 94 104 10 20% 104 8%Corrective maintenance 215 16% 90% 100% 104 116 12 23% 116 9%Revenue offsets -12 -1% 100% 100% -12 -12 0 0% -12 -1%Indirects & Overheads 419 n/a 100% 100% 419 419 n/a n/a 419 31%Operating costs 1,035 76% 986 1,035 49 95% 1,035 76%Renewal annuity 318 24% 99% 100% 315 318 3 5% 318 24%
Total Expenditure 1,353 100% 1,302 1,353 51 100% 1,353 100%Proportion of Total Expenditure 96% 100% 4%Expenditure TypeLabour 208 20% 90% 100% 187 208 21 43%Electricity 140 14% 100% 100% 140 140 0 0%Materials 44 4% 90% 100% 40 44 4 9%Contractors 149 14% 90% 100% 134 149 15 31%Other 86 8% 90% 100% 77 86 9 18%Indirects & Overheads 419 41% 100% 100% 419 419 0 0%Revenue offsets -12 -1% 100% 100% -12 -12 0 0%
Total Operating Costs 1,034 100% 986 1,035 49 100%
Recommended
Real dollars, $000 Low High Low HighActivityOperations 267 20% 80% 100% 214 267 53 53% 267 20%Electricity 140 10% 100% 100% 140 140 0 0% 140 10%Preventative maintenance 104 8% 80% 100% 83 104 21 21% 104 8%Corrective maintenance 116 9% 80% 100% 93 116 23 23% 116 9%Revenue offsets -12 -1% 100% 100% -12 -12 0 0% -12 -1%Indirects & Overheads 419 n/a 100% 100% 419 419 n/a n/a 419 31%Operating costs 1,035 76% 937 1,035 97 97% 1,035 76%Renewal annuity 318 24% 99% 100% 315 318 3 3% 318 24%
Total Expenditure 1,353 100% 1,253 1,353 100 100% 1,353 100%Proportion of Total Expenditure 93% 100% 7%Expenditure TypeLabour 208 20% 80% 100% 166 208 42 43%Electricity 140 14% 100% 100% 140 140 0 0%Materials 44 4% 80% 100% 35 44 9 9%Contractors 149 14% 80% 100% 119 149 30 31%Other 86 8% 80% 100% 69 86 17 18%Indirects & Overheads 419 41% 100% 100% 419 419 0 0%Revenue offsets -12 -1% 100% 100% -12 -12 0 0%
Total Operating Costs 1,034 100% 937 1,035 97 100%
High
Real dollars, $000 Low High Low HighActivityOperations 267 20% 70% 100% 187 267 80 54% 267 20%Electricity 140 10% 100% 100% 140 140 0 0% 140 10%Preventative maintenance 104 8% 70% 100% 73 104 31 21% 104 8%Corrective maintenance 116 9% 70% 100% 81 116 35 23% 116 9%Revenue offsets -12 -1% 100% 100% -12 -12 0 0% -12 -1%Indirects & Overheads 615 n/a 100% 100% 419 419 n/a n/a 419 31%Operating costs 1,035 76% 889 1,035 146 98% 1,035 76%Renewal annuity 318 24% 99% 100% 315 318 3 2% 318 24%
Total Expenditure 1,353 100% 1,203 1,353 149 100% 1,353 100%Proportion of Total Expenditure 89% 100% 11%Expenditure TypeLabour 208 20% 70% 100% 146 208 62 43%Electricity 140 14% 100% 100% 140 140 0 0%Materials 44 4% 70% 100% 31 44 13 9%Contractors 149 14% 70% 100% 104 149 45 31%Other 86 8% 70% 100% 60 86 26 18%Indirects & Overheads 419 41% 100% 100% 419 419 0 0%Revenue offsets -12 -1% 100% 100% -12 -12 0 0%
Total Operating Costs 1,034 100% 888 1,035 146 100%
% of total variable
Price Path
Price Path
Price Path
Price Path
% Range Variable Costs
% of total variable
costs
Price Path
Average $
Price Path
Average %
Price Path
Average $
Price Path
Average %
% Range
Variable Costs
% of total variable
Price Path
Price Path
Price Path
Price Path
% Range Variable Costs
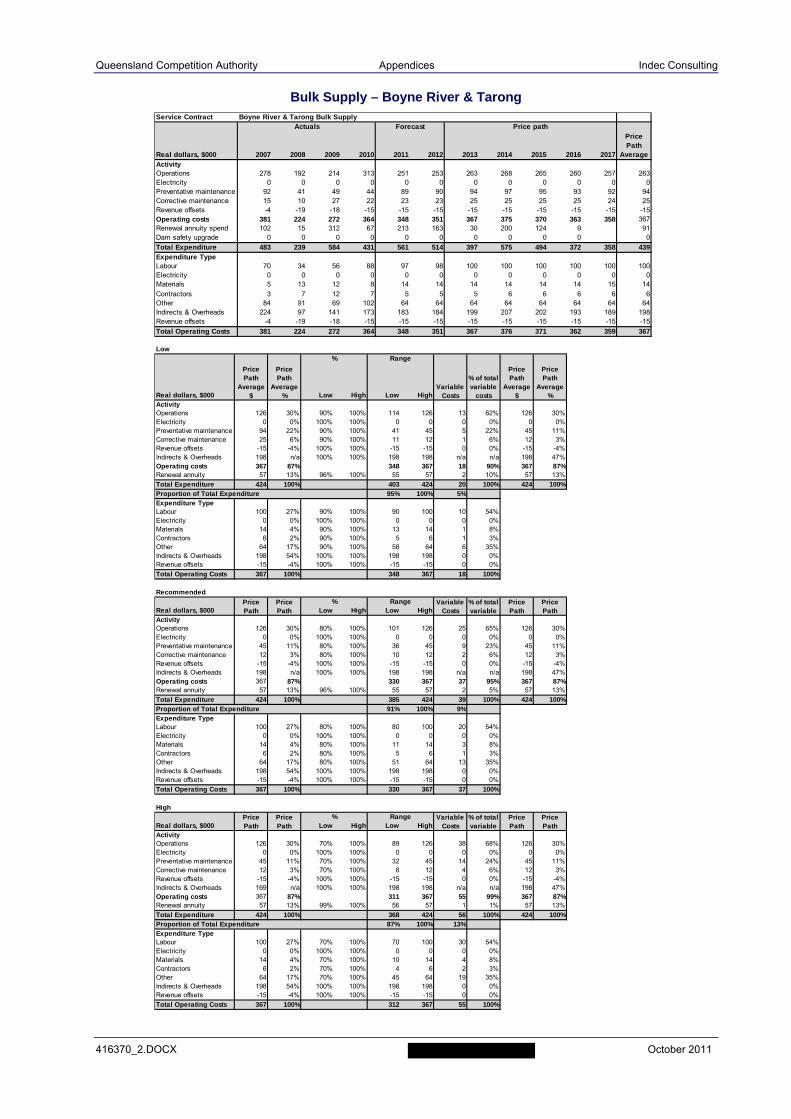
Queensland Competition Authority Appendices Indec Consulting
416370_2.DOCX October 2011
Bulk Supply – Boyne River & Tarong
Service Contract Boyne River & Tarong Bulk Supply
Real dollars, $000 2007 2008 2009 2010 2011 2012 2013 2014 2015 2016 2017ActivityOperations 278 192 214 313 251 253 263 268 265 260 257 263Electricity 0 0 0 0 0 0 0 0 0 0 0 0Preventative maintenance 92 41 49 44 89 90 94 97 95 93 92 94Corrective maintenance 15 10 27 22 23 23 25 25 25 25 24 25Revenue offsets -4 -19 -18 -15 -15 -15 -15 -15 -15 -15 -15 -15Operating costs 381 224 272 364 348 351 367 375 370 363 358 367Renewal annuity spend 102 15 312 67 213 163 30 200 124 9 91Dam safety upgrade 0 0 0 0 0 0 0 0 0 0 0
Total Expenditure 483 239 584 431 561 514 397 575 494 372 358 439Expenditure TypeLabour 70 34 56 88 97 98 100 100 100 100 100 100Electricity 0 0 0 0 0 0 0 0 0 0 0 0Materials 5 13 12 8 14 14 14 14 14 14 15 14Contractors 3 7 12 7 5 5 5 6 6 6 6 6Other 84 91 69 102 64 64 64 64 64 64 64 64Indirects & Overheads 224 97 141 173 183 184 199 207 202 193 189 198Revenue offsets -4 -19 -18 -15 -15 -15 -15 -15 -15 -15 -15 -15
Total Operating Costs 381 224 272 364 348 351 367 376 371 362 359 367
Actuals Forecast Price pathPrice Path
Average
Low
Real dollars, $000 Low High Low HighActivityOperations 126 30% 90% 100% 114 126 13 62% 126 30%Electricity 0 0% 100% 100% 0 0 0 0% 0 0%Preventative maintenance 94 22% 90% 100% 41 45 5 22% 45 11%Corrective maintenance 25 6% 90% 100% 11 12 1 6% 12 3%Revenue offsets -15 -4% 100% 100% -15 -15 0 0% -15 -4%Indirects & Overheads 198 n/a 100% 100% 198 198 n/a n/a 198 47%Operating costs 367 87% 348 367 18 90% 367 87%Renewal annuity 57 13% 96% 100% 55 57 2 10% 57 13%
Total Expenditure 424 100% 403 424 20 100% 424 100%Proportion of Total Expenditure 95% 100% 5%Expenditure TypeLabour 100 27% 90% 100% 90 100 10 54%Electricity 0 0% 100% 100% 0 0 0 0%Materials 14 4% 90% 100% 13 14 1 8%Contractors 6 2% 90% 100% 5 6 1 3%Other 64 17% 90% 100% 58 64 6 35%Indirects & Overheads 198 54% 100% 100% 198 198 0 0%Revenue offsets -15 -4% 100% 100% -15 -15 0 0%
Total Operating Costs 367 100% 348 367 18 100%
Recommended
Real dollars, $000 Low High Low HighActivityOperations 126 30% 80% 100% 101 126 25 65% 126 30%Electricity 0 0% 100% 100% 0 0 0 0% 0 0%Preventative maintenance 45 11% 80% 100% 36 45 9 23% 45 11%Corrective maintenance 12 3% 80% 100% 10 12 2 6% 12 3%Revenue offsets -15 -4% 100% 100% -15 -15 0 0% -15 -4%Indirects & Overheads 198 n/a 100% 100% 198 198 n/a n/a 198 47%Operating costs 367 87% 330 367 37 95% 367 87%Renewal annuity 57 13% 96% 100% 55 57 2 5% 57 13%
Total Expenditure 424 100% 385 424 39 100% 424 100%Proportion of Total Expenditure 91% 100% 9%Expenditure TypeLabour 100 27% 80% 100% 80 100 20 54%Electricity 0 0% 100% 100% 0 0 0 0%Materials 14 4% 80% 100% 11 14 3 8%Contractors 6 2% 80% 100% 5 6 1 3%Other 64 17% 80% 100% 51 64 13 35%Indirects & Overheads 198 54% 100% 100% 198 198 0 0%Revenue offsets -15 -4% 100% 100% -15 -15 0 0%
Total Operating Costs 367 100% 330 367 37 100%
High
Real dollars, $000 Low High Low HighActivityOperations 126 30% 70% 100% 89 126 38 68% 126 30%Electricity 0 0% 100% 100% 0 0 0 0% 0 0%Preventative maintenance 45 11% 70% 100% 32 45 14 24% 45 11%Corrective maintenance 12 3% 70% 100% 8 12 4 6% 12 3%Revenue offsets -15 -4% 100% 100% -15 -15 0 0% -15 -4%Indirects & Overheads 169 n/a 100% 100% 198 198 n/a n/a 198 47%Operating costs 367 87% 311 367 55 99% 367 87%Renewal annuity 57 13% 99% 100% 56 57 1 1% 57 13%
Total Expenditure 424 100% 368 424 56 100% 424 100%Proportion of Total Expenditure 87% 100% 13%Expenditure TypeLabour 100 27% 70% 100% 70 100 30 54%Electricity 0 0% 100% 100% 0 0 0 0%Materials 14 4% 70% 100% 10 14 4 8%Contractors 6 2% 70% 100% 4 6 2 3%Other 64 17% 70% 100% 45 64 19 35%Indirects & Overheads 198 54% 100% 100% 198 198 0 0%Revenue offsets -15 -4% 100% 100% -15 -15 0 0%
Total Operating Costs 367 100% 312 367 55 100%
% of total variable
Price Path
Price Path
Price Path
Price Path
% Range Variable Costs
% of total variable
costs
Price Path
Average $
Price Path
Average %
Price Path
Average $
Price Path
Average %
% Range
Variable Costs
% of total variable
Price Path
Price Path
Price Path
Price Path
% Range Variable Costs

Queensland Competition Authority Appendices Indec Consulting
416370_2.DOCX October 2011
Bulk Supply – Callide Valley
Service Contract Callide Valley Bulk Supply
Real dollars, $000 2007 2008 2009 2010 2011 2012 2013 2014 2015 2016 2017ActivityOperations 444 433 723 796 572 575 598 609 601 590 586 597Electricity 5 2 3 5 5 5 7 7 8 9 9 8Preventative maintenance 326 130 184 192 260 263 278 286 281 273 270 278Corrective maintenance 66 69 23 28 34 34 36 37 36 35 35 36Revenue offsets -1 -84 -21 -18 -9 -9 -9 -9 -9 -9 -9 -9Operating costs 839 550 913 1,002 863 868 910 930 917 898 891 909Renewal annuity spend 92 84 51 182 244 189 316 142 444 434 334Dam safety upgrade 0 0 0 0 0 0 0 0 0 0 0
Total Expenditure 931 634 963 1,185 1,107 1,057 1,226 1,072 1,361 1,332 891 1,176Expenditure TypeLabour 131 107 168 228 216 219 222 222 222 222 222 222Electricity 5 2 3 5 5 5 7 7 8 9 9 8Materials 24 20 66 14 13 13 13 14 14 14 14 14Contractors 19 14 31 57 14 14 15 15 15 15 15 15Other 183 189 259 267 194 194 194 194 194 194 194 194Indirects & Overheads 478 301 406 449 429 431 467 487 473 452 445 465Revenue offsets -1 -84 -21 -18 -9 -9 -9 -9 -9 -9 -9 -9
Total Operating Costs 839 550 913 1,002 863 868 909 930 917 897 890 909
Actuals Forecast Price pathPrice Path
Average
Low
Real dollars, $000 Low High Low HighActivityOperations 292 23% 90% 100% 263 292 29 56% 292 23%Electricity 8 1% 100% 100% 8 8 0 0% 8 1%Preventative maintenance 278 22% 90% 100% 122 136 14 26% 136 11%Corrective maintenance 36 3% 90% 100% 16 18 2 3% 18 1%Revenue offsets -9 -1% 100% 100% -9 -9 0 0% -9 -1%Indirects & Overheads 465 n/a 100% 100% 465 465 n/a n/a 465 36%Operating costs 909 71% 865 909 45 85% 909 71%Renewal annuity 378 29% 98% 100% 370 378 8 15% 378 29%
Total Expenditure 1,287 100% 1,235 1,287 52 100% 1,287 100%Proportion of Total Expenditure 96% 100% 4%Expenditure TypeLabour 222 24% 90% 100% 200 222 22 50%Electricity 8 1% 100% 100% 8 8 0 0%Materials 14 2% 90% 100% 12 14 1 3%Contractors 15 2% 90% 100% 14 15 2 3%Other 194 21% 90% 100% 175 194 19 44%Indirects & Overheads 465 51% 100% 100% 465 465 0 0%Revenue offsets -9 -1% 100% 100% -9 -9 0 0%
Total Operating Costs 909 100% 864 909 45 100%
Recommended
Real dollars, $000 Low High Low HighActivityOperations 292 23% 80% 100% 233 292 58 60% 292 23%Electricity 8 1% 100% 100% 8 8 0 0% 8 1%Preventative maintenance 136 11% 80% 100% 109 136 27 28% 136 11%Corrective maintenance 18 1% 80% 100% 14 18 4 4% 18 1%Revenue offsets -9 -1% 100% 100% -9 -9 0 0% -9 -1%Indirects & Overheads 465 n/a 100% 100% 465 465 n/a n/a 465 36%Operating costs 909 71% 820 909 89 92% 909 71%Renewal annuity 378 29% 98% 100% 370 378 8 8% 378 29%
Total Expenditure 1,287 100% 1,191 1,287 97 100% 1,287 100%Proportion of Total Expenditure 92% 100% 8%Expenditure TypeLabour 222 24% 80% 100% 178 222 44 50%Electricity 8 1% 100% 100% 8 8 0 0%Materials 14 2% 80% 100% 11 14 3 3%Contractors 15 2% 80% 100% 12 15 3 3%Other 194 21% 80% 100% 155 194 39 44%Indirects & Overheads 465 51% 100% 100% 465 465 0 0%Revenue offsets -9 -1% 100% 100% -9 -9 0 0%
Total Operating Costs 909 100% 820 909 89 100%
High
Real dollars, $000 Low High Low HighActivityOperations 292 23% 70% 100% 204 292 88 64% 292 23%Electricity 8 1% 100% 100% 8 8 0 0% 8 1%Preventative maintenance 136 11% 70% 100% 95 136 41 30% 136 11%Corrective maintenance 18 1% 70% 100% 12 18 5 4% 18 1%Revenue offsets -9 -1% 100% 100% -9 -9 0 0% -9 -1%Indirects & Overheads 444 n/a 100% 100% 465 465 n/a n/a 465 36%Operating costs 909 71% 776 909 134 97% 909 71%Renewal annuity 378 29% 99% 100% 374 378 4 3% 378 29%
Total Expenditure 1,287 100% 1,150 1,287 137 100% 1,287 100%Proportion of Total Expenditure 89% 100% 11%Expenditure TypeLabour 222 24% 70% 100% 156 222 67 50%Electricity 8 1% 100% 100% 8 8 0 0%Materials 14 2% 70% 100% 10 14 4 3%Contractors 15 2% 70% 100% 11 15 5 3%Other 194 21% 70% 100% 136 194 58 44%Indirects & Overheads 465 51% 100% 100% 465 465 0 0%Revenue offsets -9 -1% 100% 100% -9 -9 0 0%
Total Operating Costs 909 100% 775 909 134 100%
% of total variable
Price Path
Price Path
Price Path
Price Path
% Range Variable Costs
% of total variable
costs
Price Path
Average $
Price Path
Average %
Price Path
Average $
Price Path
Average %
% Range
Variable Costs
% of total variable
Price Path
Price Path
Price Path
Price Path
% Range Variable Costs
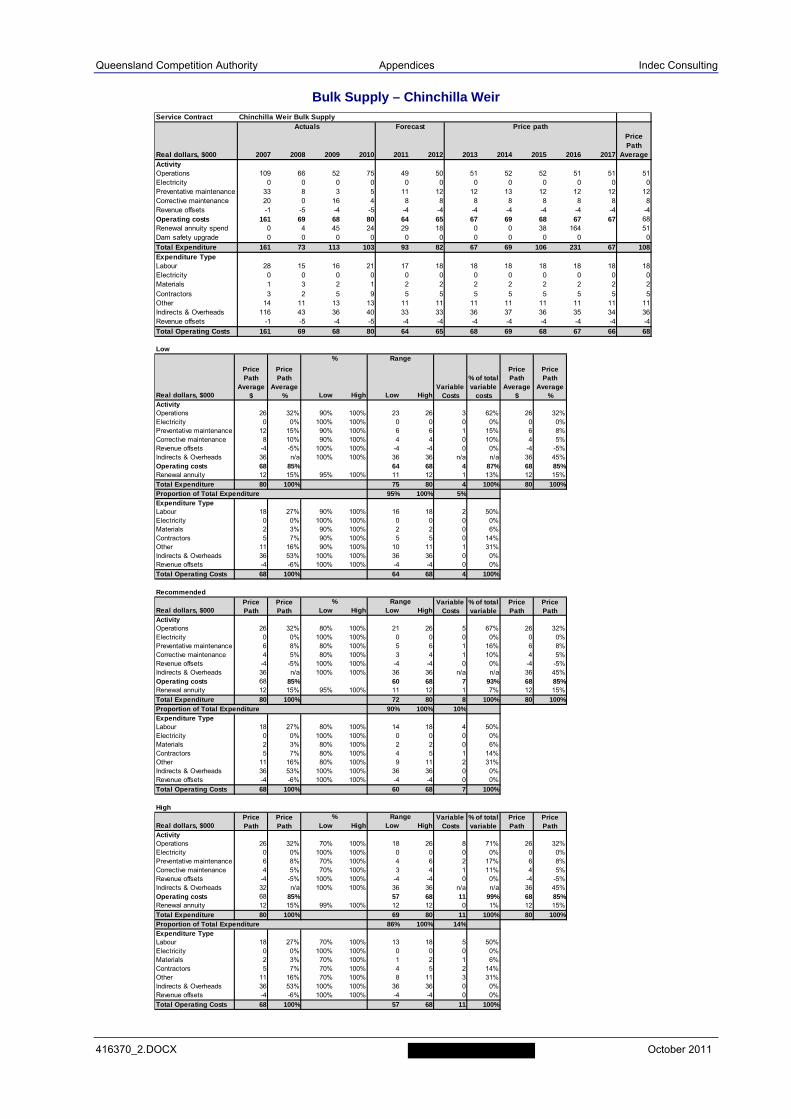
Queensland Competition Authority Appendices Indec Consulting
416370_2.DOCX October 2011
Bulk Supply – Chinchilla Weir
Service Contract Chinchilla Weir Bulk Supply
Real dollars, $000 2007 2008 2009 2010 2011 2012 2013 2014 2015 2016 2017ActivityOperations 109 66 52 75 49 50 51 52 52 51 51 51Electricity 0 0 0 0 0 0 0 0 0 0 0 0Preventative maintenance 33 8 3 5 11 12 12 13 12 12 12 12Corrective maintenance 20 0 16 4 8 8 8 8 8 8 8 8Revenue offsets -1 -5 -4 -5 -4 -4 -4 -4 -4 -4 -4 -4Operating costs 161 69 68 80 64 65 67 69 68 67 67 68Renewal annuity spend 0 4 45 24 29 18 0 0 38 164 51Dam safety upgrade 0 0 0 0 0 0 0 0 0 0 0
Total Expenditure 161 73 113 103 93 82 67 69 106 231 67 108Expenditure TypeLabour 28 15 16 21 17 18 18 18 18 18 18 18Electricity 0 0 0 0 0 0 0 0 0 0 0 0Materials 1 3 2 1 2 2 2 2 2 2 2 2Contractors 3 2 5 9 5 5 5 5 5 5 5 5Other 14 11 13 13 11 11 11 11 11 11 11 11Indirects & Overheads 116 43 36 40 33 33 36 37 36 35 34 36Revenue offsets -1 -5 -4 -5 -4 -4 -4 -4 -4 -4 -4 -4
Total Operating Costs 161 69 68 80 64 65 68 69 68 67 66 68
Actuals Forecast Price pathPrice Path
Average
Low
Real dollars, $000 Low High Low HighActivityOperations 26 32% 90% 100% 23 26 3 62% 26 32%Electricity 0 0% 100% 100% 0 0 0 0% 0 0%Preventative maintenance 12 15% 90% 100% 6 6 1 15% 6 8%Corrective maintenance 8 10% 90% 100% 4 4 0 10% 4 5%Revenue offsets -4 -5% 100% 100% -4 -4 0 0% -4 -5%Indirects & Overheads 36 n/a 100% 100% 36 36 n/a n/a 36 45%Operating costs 68 85% 64 68 4 87% 68 85%Renewal annuity 12 15% 95% 100% 11 12 1 13% 12 15%
Total Expenditure 80 100% 75 80 4 100% 80 100%Proportion of Total Expenditure 95% 100% 5%Expenditure TypeLabour 18 27% 90% 100% 16 18 2 50%Electricity 0 0% 100% 100% 0 0 0 0%Materials 2 3% 90% 100% 2 2 0 6%Contractors 5 7% 90% 100% 5 5 0 14%Other 11 16% 90% 100% 10 11 1 31%Indirects & Overheads 36 53% 100% 100% 36 36 0 0%Revenue offsets -4 -6% 100% 100% -4 -4 0 0%
Total Operating Costs 68 100% 64 68 4 100%
Recommended
Real dollars, $000 Low High Low HighActivityOperations 26 32% 80% 100% 21 26 5 67% 26 32%Electricity 0 0% 100% 100% 0 0 0 0% 0 0%Preventative maintenance 6 8% 80% 100% 5 6 1 16% 6 8%Corrective maintenance 4 5% 80% 100% 3 4 1 10% 4 5%Revenue offsets -4 -5% 100% 100% -4 -4 0 0% -4 -5%Indirects & Overheads 36 n/a 100% 100% 36 36 n/a n/a 36 45%Operating costs 68 85% 60 68 7 93% 68 85%Renewal annuity 12 15% 95% 100% 11 12 1 7% 12 15%
Total Expenditure 80 100% 72 80 8 100% 80 100%Proportion of Total Expenditure 90% 100% 10%Expenditure TypeLabour 18 27% 80% 100% 14 18 4 50%Electricity 0 0% 100% 100% 0 0 0 0%Materials 2 3% 80% 100% 2 2 0 6%Contractors 5 7% 80% 100% 4 5 1 14%Other 11 16% 80% 100% 9 11 2 31%Indirects & Overheads 36 53% 100% 100% 36 36 0 0%Revenue offsets -4 -6% 100% 100% -4 -4 0 0%
Total Operating Costs 68 100% 60 68 7 100%
High
Real dollars, $000 Low High Low HighActivityOperations 26 32% 70% 100% 18 26 8 71% 26 32%Electricity 0 0% 100% 100% 0 0 0 0% 0 0%Preventative maintenance 6 8% 70% 100% 4 6 2 17% 6 8%Corrective maintenance 4 5% 70% 100% 3 4 1 11% 4 5%Revenue offsets -4 -5% 100% 100% -4 -4 0 0% -4 -5%Indirects & Overheads 32 n/a 100% 100% 36 36 n/a n/a 36 45%Operating costs 68 85% 57 68 11 99% 68 85%Renewal annuity 12 15% 99% 100% 12 12 0 1% 12 15%
Total Expenditure 80 100% 69 80 11 100% 80 100%Proportion of Total Expenditure 86% 100% 14%Expenditure TypeLabour 18 27% 70% 100% 13 18 5 50%Electricity 0 0% 100% 100% 0 0 0 0%Materials 2 3% 70% 100% 1 2 1 6%Contractors 5 7% 70% 100% 4 5 2 14%Other 11 16% 70% 100% 8 11 3 31%Indirects & Overheads 36 53% 100% 100% 36 36 0 0%Revenue offsets -4 -6% 100% 100% -4 -4 0 0%
Total Operating Costs 68 100% 57 68 11 100%
% of total variable
Price Path
Price Path
Price Path
Price Path
% Range Variable Costs
% of total variable
costs
Price Path
Average $
Price Path
Average %
Price Path
Average $
Price Path
Average %
% Range
Variable Costs
% of total variable
Price Path
Price Path
Price Path
Price Path
% Range Variable Costs
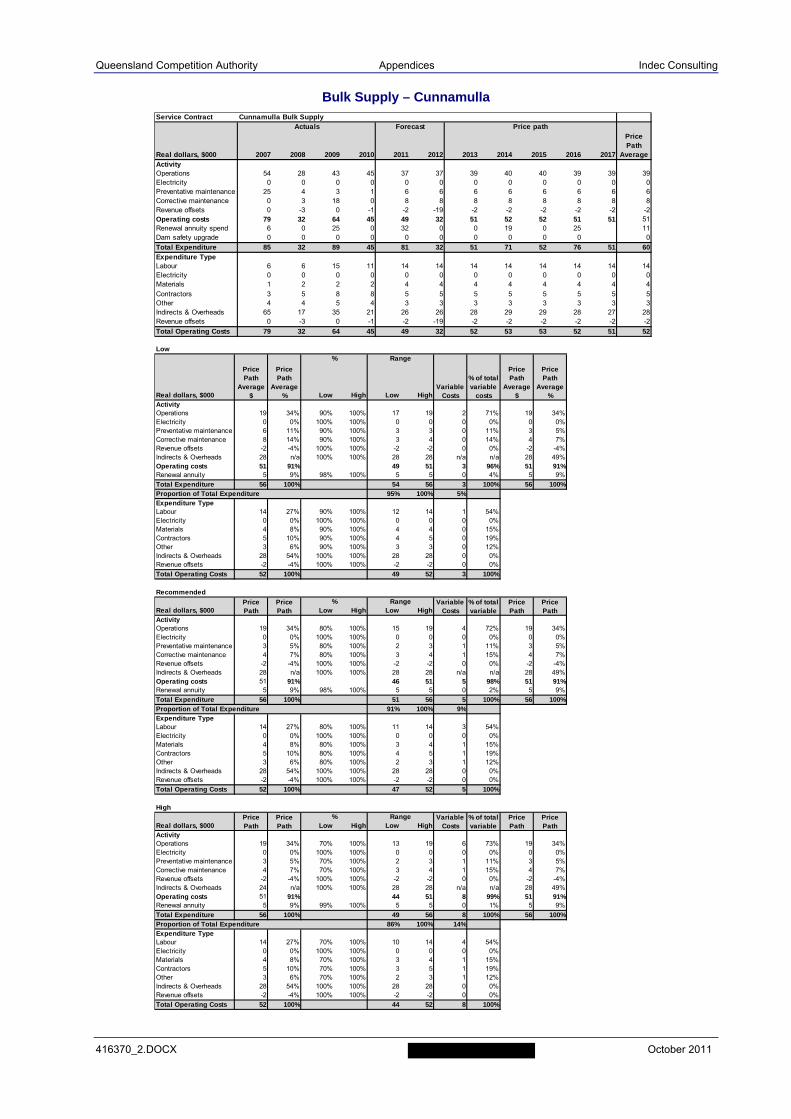
Queensland Competition Authority Appendices Indec Consulting
416370_2.DOCX October 2011
Bulk Supply – Cunnamulla
Service Contract Cunnamulla Bulk Supply
Real dollars, $000 2007 2008 2009 2010 2011 2012 2013 2014 2015 2016 2017ActivityOperations 54 28 43 45 37 37 39 40 40 39 39 39Electricity 0 0 0 0 0 0 0 0 0 0 0 0Preventative maintenance 25 4 3 1 6 6 6 6 6 6 6 6Corrective maintenance 0 3 18 0 8 8 8 8 8 8 8 8Revenue offsets 0 -3 0 -1 -2 -19 -2 -2 -2 -2 -2 -2Operating costs 79 32 64 45 49 32 51 52 52 51 51 51Renewal annuity spend 6 0 25 0 32 0 0 19 0 25 11Dam safety upgrade 0 0 0 0 0 0 0 0 0 0 0
Total Expenditure 85 32 89 45 81 32 51 71 52 76 51 60Expenditure TypeLabour 6 6 15 11 14 14 14 14 14 14 14 14Electricity 0 0 0 0 0 0 0 0 0 0 0 0Materials 1 2 2 2 4 4 4 4 4 4 4 4Contractors 3 5 8 8 5 5 5 5 5 5 5 5Other 4 4 5 4 3 3 3 3 3 3 3 3Indirects & Overheads 65 17 35 21 26 26 28 29 29 28 27 28Revenue offsets 0 -3 0 -1 -2 -19 -2 -2 -2 -2 -2 -2
Total Operating Costs 79 32 64 45 49 32 52 53 53 52 51 52
Actuals Forecast Price pathPrice Path
Average
Low
Real dollars, $000 Low High Low HighActivityOperations 19 34% 90% 100% 17 19 2 71% 19 34%Electricity 0 0% 100% 100% 0 0 0 0% 0 0%Preventative maintenance 6 11% 90% 100% 3 3 0 11% 3 5%Corrective maintenance 8 14% 90% 100% 3 4 0 14% 4 7%Revenue offsets -2 -4% 100% 100% -2 -2 0 0% -2 -4%Indirects & Overheads 28 n/a 100% 100% 28 28 n/a n/a 28 49%Operating costs 51 91% 49 51 3 96% 51 91%Renewal annuity 5 9% 98% 100% 5 5 0 4% 5 9%
Total Expenditure 56 100% 54 56 3 100% 56 100%Proportion of Total Expenditure 95% 100% 5%Expenditure TypeLabour 14 27% 90% 100% 12 14 1 54%Electricity 0 0% 100% 100% 0 0 0 0%Materials 4 8% 90% 100% 4 4 0 15%Contractors 5 10% 90% 100% 4 5 0 19%Other 3 6% 90% 100% 3 3 0 12%Indirects & Overheads 28 54% 100% 100% 28 28 0 0%Revenue offsets -2 -4% 100% 100% -2 -2 0 0%
Total Operating Costs 52 100% 49 52 3 100%
Recommended
Real dollars, $000 Low High Low HighActivityOperations 19 34% 80% 100% 15 19 4 72% 19 34%Electricity 0 0% 100% 100% 0 0 0 0% 0 0%Preventative maintenance 3 5% 80% 100% 2 3 1 11% 3 5%Corrective maintenance 4 7% 80% 100% 3 4 1 15% 4 7%Revenue offsets -2 -4% 100% 100% -2 -2 0 0% -2 -4%Indirects & Overheads 28 n/a 100% 100% 28 28 n/a n/a 28 49%Operating costs 51 91% 46 51 5 98% 51 91%Renewal annuity 5 9% 98% 100% 5 5 0 2% 5 9%
Total Expenditure 56 100% 51 56 5 100% 56 100%Proportion of Total Expenditure 91% 100% 9%Expenditure TypeLabour 14 27% 80% 100% 11 14 3 54%Electricity 0 0% 100% 100% 0 0 0 0%Materials 4 8% 80% 100% 3 4 1 15%Contractors 5 10% 80% 100% 4 5 1 19%Other 3 6% 80% 100% 2 3 1 12%Indirects & Overheads 28 54% 100% 100% 28 28 0 0%Revenue offsets -2 -4% 100% 100% -2 -2 0 0%
Total Operating Costs 52 100% 47 52 5 100%
High
Real dollars, $000 Low High Low HighActivityOperations 19 34% 70% 100% 13 19 6 73% 19 34%Electricity 0 0% 100% 100% 0 0 0 0% 0 0%Preventative maintenance 3 5% 70% 100% 2 3 1 11% 3 5%Corrective maintenance 4 7% 70% 100% 3 4 1 15% 4 7%Revenue offsets -2 -4% 100% 100% -2 -2 0 0% -2 -4%Indirects & Overheads 24 n/a 100% 100% 28 28 n/a n/a 28 49%Operating costs 51 91% 44 51 8 99% 51 91%Renewal annuity 5 9% 99% 100% 5 5 0 1% 5 9%
Total Expenditure 56 100% 49 56 8 100% 56 100%Proportion of Total Expenditure 86% 100% 14%Expenditure TypeLabour 14 27% 70% 100% 10 14 4 54%Electricity 0 0% 100% 100% 0 0 0 0%Materials 4 8% 70% 100% 3 4 1 15%Contractors 5 10% 70% 100% 3 5 1 19%Other 3 6% 70% 100% 2 3 1 12%Indirects & Overheads 28 54% 100% 100% 28 28 0 0%Revenue offsets -2 -4% 100% 100% -2 -2 0 0%
Total Operating Costs 52 100% 44 52 8 100%
% of total variable
Price Path
Price Path
Price Path
Price Path
% Range Variable Costs
% of total variable
costs
Price Path
Average $
Price Path
Average %
Price Path
Average $
Price Path
Average %
% Range
Variable Costs
% of total variable
Price Path
Price Path
Price Path
Price Path
% Range Variable Costs

Queensland Competition Authority Appendices Indec Consulting
416370_2.DOCX October 2011
Bulk Supply – Lower Fitzroy
Service Contract Lower Fitzroy Bulk Supply
Real dollars, $000 2007 2008 2009 2010 2011 2012 2013 2014 2015 2016 2017ActivityOperations 109 76 169 165 138 141 149 152 149 144 144 148Electricity 1 1 1 1 1 1 1 2 2 2 2 2Preventative maintenance 61 43 59 55 84 86 91 93 91 88 89 90Corrective maintenance 142 69 97 57 42 43 45 46 45 44 44 45Revenue offsets 0 -1 0 0 0 0 0 0 0 0 0 0Operating costs 313 188 327 278 265 272 286 293 287 278 279 285Renewal annuity spend 3 6 61 19 158 68 24 63 12 47 37Dam safety upgrade 0 0 0 0 0 0 0 0 0 0 0
Total Expenditure 315 194 388 296 423 340 310 356 299 325 279 314Expenditure TypeLabour 73 43 82 76 82 83 84 84 84 84 84 84Electricity 1 1 1 1 1 1 1 2 2 2 2 2Materials 35 -26 13 15 11 11 11 11 11 12 12 11Contractors 17 3 6 10 10 10 10 10 11 11 11 11Other 11 19 23 24 15 15 15 15 15 15 15 15Indirects & Overheads 176 149 201 151 147 152 165 171 165 155 156 162Revenue offsets 0 -1 0 0 0 0 0 0 0 0 0 0
Total Operating Costs 313 188 327 278 265 272 286 293 288 279 280 285
Actuals Forecast Price pathPrice Path
Average
Low
Real dollars, $000 Low High Low HighActivityOperations 63 21% 90% 100% 57 63 6 50% 63 21%Electricity 2 1% 100% 100% 2 2 0 0% 2 1%Preventative maintenance 90 30% 90% 100% 35 39 4 31% 39 13%Corrective maintenance 45 15% 90% 100% 17 19 2 15% 19 6%Revenue offsets 0 0% 100% 100% 0 0 0 0% 0 0%Indirects & Overheads 162 n/a 100% 100% 162 162 n/a n/a 162 54%Operating costs 285 94% 273 285 12 96% 285 94%Renewal annuity 18 6% 97% 100% 18 18 0 4% 18 6%
Total Expenditure 303 100% 290 303 13 100% 303 100%Proportion of Total Expenditure 96% 100% 4%Expenditure TypeLabour 84 29% 90% 100% 75 84 8 69%Electricity 2 1% 100% 100% 2 2 0 0%Materials 11 4% 90% 100% 10 11 1 9%Contractors 11 4% 90% 100% 10 11 1 9%Other 15 5% 90% 100% 13 15 1 12%Indirects & Overheads 162 57% 100% 100% 162 162 0 0%Revenue offsets 0 0% 100% 100% 0 0 0 0%
Total Operating Costs 285 100% 273 285 12 100%
Recommended
Real dollars, $000 Low High Low HighActivityOperations 63 21% 80% 100% 50 63 13 51% 63 21%Electricity 2 1% 100% 100% 2 2 0 0% 2 1%Preventative maintenance 39 13% 80% 100% 31 39 8 31% 39 13%Corrective maintenance 19 6% 80% 100% 15 19 4 16% 19 6%Revenue offsets 0 0% 100% 100% 0 0 0 0% 0 0%Indirects & Overheads 162 n/a 100% 100% 162 162 n/a n/a 162 54%Operating costs 285 94% 260 285 24 98% 285 94%Renewal annuity 18 6% 97% 100% 18 18 0 2% 18 6%
Total Expenditure 303 100% 278 303 25 100% 303 100%Proportion of Total Expenditure 92% 100% 8%Expenditure TypeLabour 84 29% 80% 100% 67 84 17 69%Electricity 2 1% 100% 100% 2 2 0 0%Materials 11 4% 80% 100% 9 11 2 9%Contractors 11 4% 80% 100% 8 11 2 9%Other 15 5% 80% 100% 12 15 3 12%Indirects & Overheads 162 57% 100% 100% 162 162 0 0%Revenue offsets 0 0% 100% 100% 0 0 0 0%
Total Operating Costs 285 100% 261 285 24 100%
High
Real dollars, $000 Low High Low HighActivityOperations 63 21% 70% 100% 44 63 19 52% 63 21%Electricity 2 1% 100% 100% 2 2 0 0% 2 1%Preventative maintenance 39 13% 70% 100% 27 39 12 32% 39 13%Corrective maintenance 19 6% 70% 100% 13 19 6 16% 19 6%Revenue offsets 0 0% 100% 100% 0 0 0 0% 0 0%Indirects & Overheads 123 n/a 100% 100% 162 162 n/a n/a 162 54%Operating costs 285 94% 248 285 36 100% 285 94%Renewal annuity 18 6% 99% 100% 18 18 0 0% 18 6%
Total Expenditure 303 100% 266 303 36 100% 303 100%Proportion of Total Expenditure 88% 100% 12%Expenditure TypeLabour 84 29% 70% 100% 59 84 25 69%Electricity 2 1% 100% 100% 2 2 0 0%Materials 11 4% 70% 100% 8 11 3 9%Contractors 11 4% 70% 100% 7 11 3 9%Other 15 5% 70% 100% 10 15 4 12%Indirects & Overheads 162 57% 100% 100% 162 162 0 0%Revenue offsets 0 0% 100% 100% 0 0 0 0%
Total Operating Costs 285 100% 249 285 36 100%
% of total variable
Price Path
Price Path
Price Path
Price Path
% Range Variable Costs
% of total variable
costs
Price Path
Average $
Price Path
Average %
Price Path
Average $
Price Path
Average %
% Range
Variable Costs
% of total variable
Price Path
Price Path
Price Path
Price Path
% Range Variable Costs
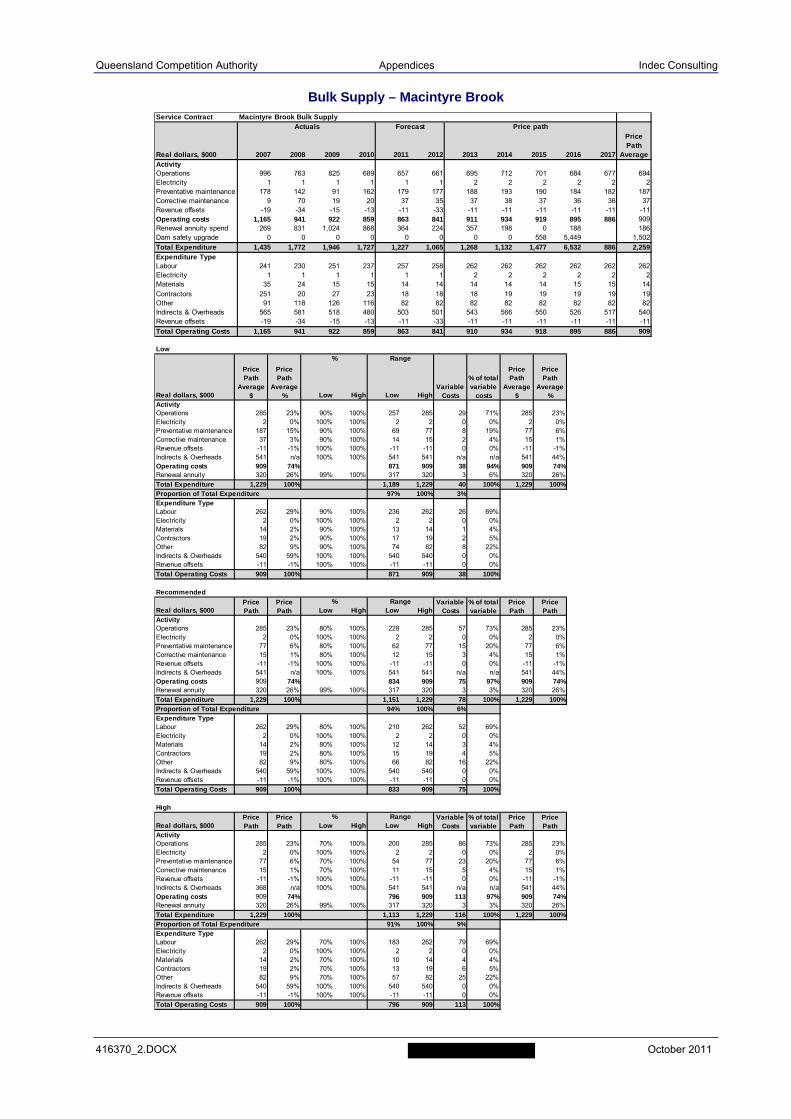
Queensland Competition Authority Appendices Indec Consulting
416370_2.DOCX October 2011
Bulk Supply – Macintyre Brook
Service Contract Macintyre Brook Bulk Supply
Real dollars, $000 2007 2008 2009 2010 2011 2012 2013 2014 2015 2016 2017ActivityOperations 996 763 825 689 657 661 695 712 701 684 677 694Electricity 1 1 1 1 1 1 2 2 2 2 2 2Preventative maintenance 178 142 91 162 179 177 188 193 190 184 182 187Corrective maintenance 9 70 19 20 37 35 37 38 37 36 36 37Revenue offsets -19 -34 -15 -13 -11 -33 -11 -11 -11 -11 -11 -11Operating costs 1,165 941 922 859 863 841 911 934 919 895 886 909Renewal annuity spend 269 831 1,024 868 364 224 357 198 0 188 186Dam safety upgrade 0 0 0 0 0 0 0 0 558 5,449 1,502
Total Expenditure 1,435 1,772 1,946 1,727 1,227 1,065 1,268 1,132 1,477 6,532 886 2,259Expenditure TypeLabour 241 230 251 237 257 258 262 262 262 262 262 262Electricity 1 1 1 1 1 1 2 2 2 2 2 2Materials 35 24 15 15 14 14 14 14 14 15 15 14Contractors 251 20 27 23 18 18 18 19 19 19 19 19Other 91 118 126 116 82 82 82 82 82 82 82 82Indirects & Overheads 565 581 518 480 503 501 543 566 550 526 517 540Revenue offsets -19 -34 -15 -13 -11 -33 -11 -11 -11 -11 -11 -11
Total Operating Costs 1,165 941 922 859 863 841 910 934 918 895 886 909
Actuals Forecast Price pathPrice Path
Average
Low
Real dollars, $000 Low High Low HighActivityOperations 285 23% 90% 100% 257 285 29 71% 285 23%Electricity 2 0% 100% 100% 2 2 0 0% 2 0%Preventative maintenance 187 15% 90% 100% 69 77 8 19% 77 6%Corrective maintenance 37 3% 90% 100% 14 15 2 4% 15 1%Revenue offsets -11 -1% 100% 100% -11 -11 0 0% -11 -1%Indirects & Overheads 541 n/a 100% 100% 541 541 n/a n/a 541 44%Operating costs 909 74% 871 909 38 94% 909 74%Renewal annuity 320 26% 99% 100% 317 320 3 6% 320 26%
Total Expenditure 1,229 100% 1,189 1,229 40 100% 1,229 100%Proportion of Total Expenditure 97% 100% 3%Expenditure TypeLabour 262 29% 90% 100% 236 262 26 69%Electricity 2 0% 100% 100% 2 2 0 0%Materials 14 2% 90% 100% 13 14 1 4%Contractors 19 2% 90% 100% 17 19 2 5%Other 82 9% 90% 100% 74 82 8 22%Indirects & Overheads 540 59% 100% 100% 540 540 0 0%Revenue offsets -11 -1% 100% 100% -11 -11 0 0%
Total Operating Costs 909 100% 871 909 38 100%
Recommended
Real dollars, $000 Low High Low HighActivityOperations 285 23% 80% 100% 228 285 57 73% 285 23%Electricity 2 0% 100% 100% 2 2 0 0% 2 0%Preventative maintenance 77 6% 80% 100% 62 77 15 20% 77 6%Corrective maintenance 15 1% 80% 100% 12 15 3 4% 15 1%Revenue offsets -11 -1% 100% 100% -11 -11 0 0% -11 -1%Indirects & Overheads 541 n/a 100% 100% 541 541 n/a n/a 541 44%Operating costs 909 74% 834 909 75 97% 909 74%Renewal annuity 320 26% 99% 100% 317 320 3 3% 320 26%
Total Expenditure 1,229 100% 1,151 1,229 78 100% 1,229 100%Proportion of Total Expenditure 94% 100% 6%Expenditure TypeLabour 262 29% 80% 100% 210 262 52 69%Electricity 2 0% 100% 100% 2 2 0 0%Materials 14 2% 80% 100% 12 14 3 4%Contractors 19 2% 80% 100% 15 19 4 5%Other 82 9% 80% 100% 66 82 16 22%Indirects & Overheads 540 59% 100% 100% 540 540 0 0%Revenue offsets -11 -1% 100% 100% -11 -11 0 0%
Total Operating Costs 909 100% 833 909 75 100%
High
Real dollars, $000 Low High Low HighActivityOperations 285 23% 70% 100% 200 285 86 73% 285 23%Electricity 2 0% 100% 100% 2 2 0 0% 2 0%Preventative maintenance 77 6% 70% 100% 54 77 23 20% 77 6%Corrective maintenance 15 1% 70% 100% 11 15 5 4% 15 1%Revenue offsets -11 -1% 100% 100% -11 -11 0 0% -11 -1%Indirects & Overheads 368 n/a 100% 100% 541 541 n/a n/a 541 44%Operating costs 909 74% 796 909 113 97% 909 74%Renewal annuity 320 26% 99% 100% 317 320 3 3% 320 26%
Total Expenditure 1,229 100% 1,113 1,229 116 100% 1,229 100%Proportion of Total Expenditure 91% 100% 9%Expenditure TypeLabour 262 29% 70% 100% 183 262 79 69%Electricity 2 0% 100% 100% 2 2 0 0%Materials 14 2% 70% 100% 10 14 4 4%Contractors 19 2% 70% 100% 13 19 6 5%Other 82 9% 70% 100% 57 82 25 22%Indirects & Overheads 540 59% 100% 100% 540 540 0 0%Revenue offsets -11 -1% 100% 100% -11 -11 0 0%
Total Operating Costs 909 100% 796 909 113 100%
% of total variable
Price Path
Price Path
Price Path
Price Path
% Range Variable Costs
% of total variable
costs
Price Path
Average $
Price Path
Average %
Price Path
Average $
Price Path
Average %
% Range
Variable Costs
% of total variable
Price Path
Price Path
Price Path
Price Path
% Range Variable Costs
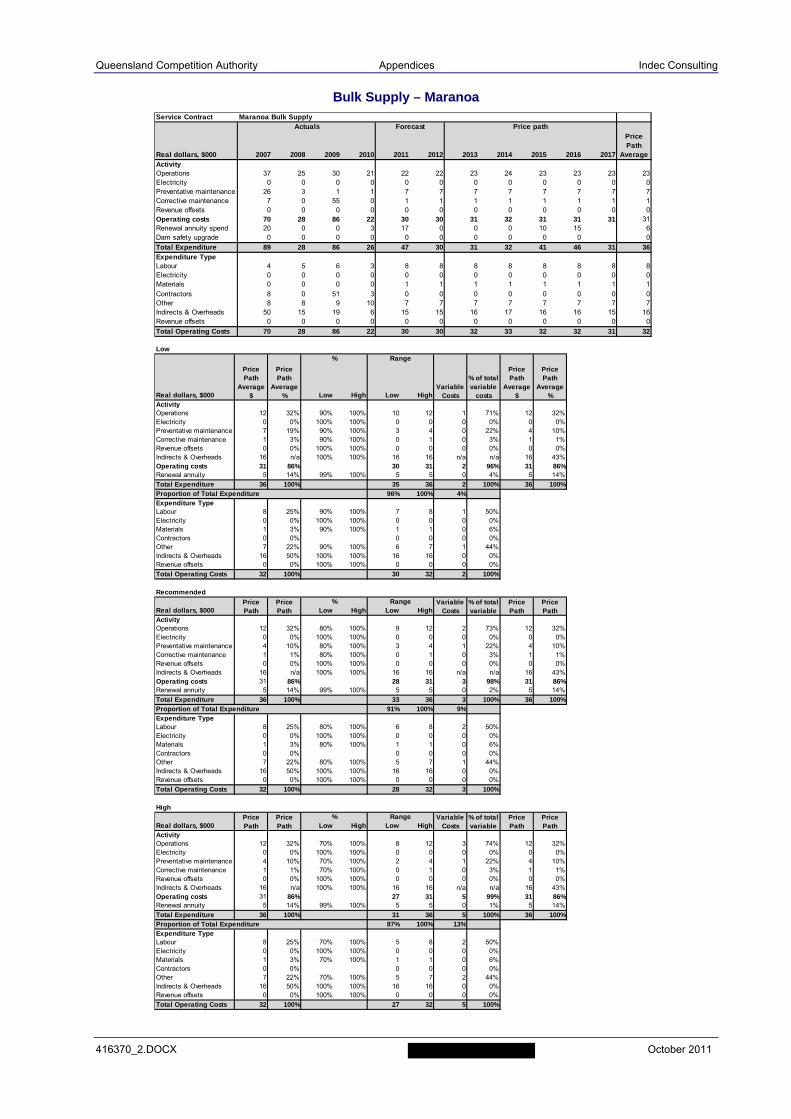
Queensland Competition Authority Appendices Indec Consulting
416370_2.DOCX October 2011
Bulk Supply – Maranoa
Service Contract Maranoa Bulk Supply
Real dollars, $000 2007 2008 2009 2010 2011 2012 2013 2014 2015 2016 2017ActivityOperations 37 25 30 21 22 22 23 24 23 23 23 23Electricity 0 0 0 0 0 0 0 0 0 0 0 0Preventative maintenance 26 3 1 1 7 7 7 7 7 7 7 7Corrective maintenance 7 0 55 0 1 1 1 1 1 1 1 1Revenue offsets 0 0 0 0 0 0 0 0 0 0 0 0Operating costs 70 28 86 22 30 30 31 32 31 31 31 31Renewal annuity spend 20 0 0 3 17 0 0 0 10 15 6Dam safety upgrade 0 0 0 0 0 0 0 0 0 0 0
Total Expenditure 89 28 86 26 47 30 31 32 41 46 31 36Expenditure TypeLabour 4 5 6 3 8 8 8 8 8 8 8 8Electricity 0 0 0 0 0 0 0 0 0 0 0 0Materials 0 0 0 0 1 1 1 1 1 1 1 1Contractors 8 0 51 3 0 0 0 0 0 0 0 0Other 8 8 9 10 7 7 7 7 7 7 7 7Indirects & Overheads 50 15 19 6 15 15 16 17 16 16 15 16Revenue offsets 0 0 0 0 0 0 0 0 0 0 0 0
Total Operating Costs 70 28 86 22 30 30 32 33 32 32 31 32
Actuals Forecast Price pathPrice Path
Average
Low
Real dollars, $000 Low High Low HighActivityOperations 12 32% 90% 100% 10 12 1 71% 12 32%Electricity 0 0% 100% 100% 0 0 0 0% 0 0%Preventative maintenance 7 19% 90% 100% 3 4 0 22% 4 10%Corrective maintenance 1 3% 90% 100% 0 1 0 3% 1 1%Revenue offsets 0 0% 100% 100% 0 0 0 0% 0 0%Indirects & Overheads 16 n/a 100% 100% 16 16 n/a n/a 16 43%Operating costs 31 86% 30 31 2 96% 31 86%Renewal annuity 5 14% 99% 100% 5 5 0 4% 5 14%
Total Expenditure 36 100% 35 36 2 100% 36 100%Proportion of Total Expenditure 96% 100% 4%Expenditure TypeLabour 8 25% 90% 100% 7 8 1 50%Electricity 0 0% 100% 100% 0 0 0 0%Materials 1 3% 90% 100% 1 1 0 6%Contractors 0 0% 0 0 0 0%Other 7 22% 90% 100% 6 7 1 44%Indirects & Overheads 16 50% 100% 100% 16 16 0 0%Revenue offsets 0 0% 100% 100% 0 0 0 0%
Total Operating Costs 32 100% 30 32 2 100%
Recommended
Real dollars, $000 Low High Low HighActivityOperations 12 32% 80% 100% 9 12 2 73% 12 32%Electricity 0 0% 100% 100% 0 0 0 0% 0 0%Preventative maintenance 4 10% 80% 100% 3 4 1 22% 4 10%Corrective maintenance 1 1% 80% 100% 0 1 0 3% 1 1%Revenue offsets 0 0% 100% 100% 0 0 0 0% 0 0%Indirects & Overheads 16 n/a 100% 100% 16 16 n/a n/a 16 43%Operating costs 31 86% 28 31 3 98% 31 86%Renewal annuity 5 14% 99% 100% 5 5 0 2% 5 14%
Total Expenditure 36 100% 33 36 3 100% 36 100%Proportion of Total Expenditure 91% 100% 9%Expenditure TypeLabour 8 25% 80% 100% 6 8 2 50%Electricity 0 0% 100% 100% 0 0 0 0%Materials 1 3% 80% 100% 1 1 0 6%Contractors 0 0% 0 0 0 0%Other 7 22% 80% 100% 5 7 1 44%Indirects & Overheads 16 50% 100% 100% 16 16 0 0%Revenue offsets 0 0% 100% 100% 0 0 0 0%
Total Operating Costs 32 100% 28 32 3 100%
High
Real dollars, $000 Low High Low HighActivityOperations 12 32% 70% 100% 8 12 3 74% 12 32%Electricity 0 0% 100% 100% 0 0 0 0% 0 0%Preventative maintenance 4 10% 70% 100% 2 4 1 22% 4 10%Corrective maintenance 1 1% 70% 100% 0 1 0 3% 1 1%Revenue offsets 0 0% 100% 100% 0 0 0 0% 0 0%Indirects & Overheads 16 n/a 100% 100% 16 16 n/a n/a 16 43%Operating costs 31 86% 27 31 5 99% 31 86%Renewal annuity 5 14% 99% 100% 5 5 0 1% 5 14%
Total Expenditure 36 100% 31 36 5 100% 36 100%Proportion of Total Expenditure 87% 100% 13%Expenditure TypeLabour 8 25% 70% 100% 5 8 2 50%Electricity 0 0% 100% 100% 0 0 0 0%Materials 1 3% 70% 100% 1 1 0 6%Contractors 0 0% 0 0 0 0%Other 7 22% 70% 100% 5 7 2 44%Indirects & Overheads 16 50% 100% 100% 16 16 0 0%Revenue offsets 0 0% 100% 100% 0 0 0 0%
Total Operating Costs 32 100% 27 32 5 100%
% of total variable
Price Path
Price Path
Price Path
Price Path
% Range Variable Costs
% of total variable
costs
Price Path
Average $
Price Path
Average %
Price Path
Average $
Price Path
Average %
% Range
Variable Costs
% of total variable
Price Path
Price Path
Price Path
Price Path
% Range Variable Costs

Queensland Competition Authority Appendices Indec Consulting
416370_2.DOCX October 2011
Bulk Supply – Pioneer River
Service Contract Pioneer River Bulk Supply
Real dollars, $000 2007 2008 2009 2010 2011 2012 2013 2014 2015 2016 2017ActivityOperations 423 472 486 514 482 485 508 519 512 500 496 507Electricity 3 4 2 3 3 3 4 4 5 5 6 5Preventative maintenance 139 87 97 83 217 219 231 238 234 228 225 231Corrective maintenance 265 355 337 129 175 176 184 188 187 185 184 186Revenue offsets -9 -9 -9 -10 -10 -10 -10 -10 -10 -10 -10 -10Operating costs 821 909 913 719 867 874 917 939 928 908 901 919Renewal annuity spend 224 810 825 2,220 2,857 66 129 61 107 271 142Dam safety upgrade 0 0 0 9 0 0 0 0 2,005 3,223 1,307
Total Expenditure 1,045 1,718 1,738 2,948 3,724 940 1,046 1,000 3,040 4,402 901 2,078Expenditure TypeLabour 203 198 208 168 224 227 230 230 230 230 230 230Electricity 3 4 2 3 3 3 4 4 5 5 6 5Materials 41 94 38 34 46 46 47 48 48 49 49 48Contractors 32 95 126 37 53 54 55 56 56 57 57 56Other 110 110 143 147 109 109 109 109 109 109 109 109Indirects & Overheads 440 416 405 340 443 445 483 503 489 468 460 481Revenue offsets -9 -9 -9 -10 -10 -10 -10 -10 -10 -10 -10 -10
Total Operating Costs 821 909 913 719 867 874 918 940 927 908 901 919
Actuals Forecast Price pathPrice Path
Average
Low
Real dollars, $000 Low High Low HighActivityOperations 243 17% 90% 100% 219 243 24 51% 243 17%Electricity 5 0% 100% 100% 5 5 0 0% 5 0%Preventative maintenance 231 16% 90% 100% 100 111 11 23% 111 8%Corrective maintenance 186 13% 90% 100% 80 89 9 19% 89 6%Revenue offsets -10 -1% 100% 100% -10 -10 0 0% -10 -1%Indirects & Overheads 480 n/a 100% 100% 480 480 n/a n/a 480 33%Operating costs 919 64% 874 919 44 93% 919 64%Renewal annuity 520 36% 99% 100% 517 520 3 7% 520 36%
Total Expenditure 1,439 100% 1,391 1,439 47 100% 1,439 100%Proportion of Total Expenditure 97% 100% 3%Expenditure TypeLabour 230 25% 90% 100% 207 230 23 52%Electricity 5 1% 100% 100% 5 5 0 0%Materials 48 5% 90% 100% 43 48 5 11%Contractors 56 6% 90% 100% 51 56 6 13%Other 109 12% 90% 100% 98 109 11 25%Indirects & Overheads 481 52% 100% 100% 481 481 0 0%Revenue offsets -10 -1% 100% 100% -10 -10 0 0%
Total Operating Costs 919 100% 874 919 44 100%
Recommended
Real dollars, $000 Low High Low HighActivityOperations 243 17% 80% 100% 195 243 49 53% 243 17%Electricity 5 0% 100% 100% 5 5 0 0% 5 0%Preventative maintenance 111 8% 80% 100% 89 111 22 24% 111 8%Corrective maintenance 89 6% 80% 100% 71 89 18 19% 89 6%Revenue offsets -10 -1% 100% 100% -10 -10 0 0% -10 -1%Indirects & Overheads 480 n/a 100% 100% 480 480 n/a n/a 480 33%Operating costs 919 64% 830 919 89 97% 919 64%Renewal annuity 520 36% 99% 100% 517 520 3 3% 520 36%
Total Expenditure 1,439 100% 1,347 1,439 92 100% 1,439 100%Proportion of Total Expenditure 94% 100% 6%Expenditure TypeLabour 230 25% 80% 100% 184 230 46 52%Electricity 5 1% 100% 100% 5 5 0 0%Materials 48 5% 80% 100% 39 48 10 11%Contractors 56 6% 80% 100% 45 56 11 13%Other 109 12% 80% 100% 87 109 22 25%Indirects & Overheads 481 52% 100% 100% 481 481 0 0%Revenue offsets -10 -1% 100% 100% -10 -10 0 0%
Total Operating Costs 919 100% 830 919 89 100%
High
Real dollars, $000 Low High Low HighActivityOperations 243 17% 70% 100% 170 243 73 53% 243 17%Electricity 5 0% 100% 100% 5 5 0 0% 5 0%Preventative maintenance 111 8% 70% 100% 78 111 33 24% 111 8%Corrective maintenance 89 6% 70% 100% 62 89 27 19% 89 6%Revenue offsets -10 -1% 100% 100% -10 -10 0 0% -10 -1%Indirects & Overheads 438 n/a 100% 100% 480 480 n/a n/a 480 33%Operating costs 919 64% 786 919 133 96% 919 64%Renewal annuity 520 36% 99% 100% 515 520 5 4% 520 36%
Total Expenditure 1,439 100% 1,300 1,439 138 100% 1,439 100%Proportion of Total Expenditure 90% 100% 10%Expenditure TypeLabour 230 25% 70% 100% 161 230 69 52%Electricity 5 1% 100% 100% 5 5 0 0%Materials 48 5% 70% 100% 34 48 14 11%Contractors 56 6% 70% 100% 39 56 17 13%Other 109 12% 70% 100% 76 109 33 25%Indirects & Overheads 481 52% 100% 100% 481 481 0 0%Revenue offsets -10 -1% 100% 100% -10 -10 0 0%
Total Operating Costs 919 100% 786 919 133 100%
% of total variable
Price Path
Price Path
Price Path
Price Path
% Range Variable Costs
% of total variable
costs
Price Path
Average $
Price Path
Average %
Price Path
Average $
Price Path
Average %
% Range
Variable Costs
% of total variable
Price Path
Price Path
Price Path
Price Path
% Range Variable Costs

Queensland Competition Authority Appendices Indec Consulting
416370_2.DOCX October 2011
Bulk Supply – Proserpine River
Service Contract Proserpine River Bulk Supply
Real dollars, $000 2007 2008 2009 2010 2011 2012 2013 2014 2015 2016 2017ActivityOperations 493 513 660 617 603 607 632 645 638 627 622 633Electricity 3 3 3 4 4 4 5 6 6 7 7 6Preventative maintenance 273 -3 77 65 134 135 141 145 144 142 141 143Corrective maintenance 57 60 52 48 49 50 51 52 53 53 52 52Revenue offsets -170 -170 -173 -170 -169 -169 -169 -169 -169 -169 -169 -169Operating costs 656 402 619 564 621 627 660 679 672 660 653 665Renewal annuity spend 141 136 133 17 114 56 40 190 44 44 80Dam safety upgrade 0 0 0 0 0 0 0 0 0 0 0
Total Expenditure 797 538 752 581 735 684 700 869 716 704 653 728Expenditure TypeLabour 129 122 152 134 164 167 169 169 169 169 169 169Electricity 3 3 3 4 4 4 5 6 6 7 7 6Materials 103 20 46 58 62 63 64 64 65 66 66 65Contractors -12 5 75 80 95 96 98 99 101 102 102 100Other 133 123 160 179 133 133 133 133 133 133 133 133Indirects & Overheads 469 300 356 279 332 334 362 377 366 351 345 360Revenue offsets -170 -170 -173 -170 -169 -169 -169 -169 -169 -169 -169 -169
Total Operating Costs 656 402 619 564 621 627 662 679 671 659 653 665
Actuals Forecast Price pathPrice Path
Average
Low
Real dollars, $000 Low High Low HighActivityOperations 357 41% 90% 100% 322 357 36 73% 357 41%Electricity 6 1% 100% 100% 6 6 0 0% 6 1%Preventative maintenance 143 16% 90% 100% 72 81 8 17% 81 9%Corrective maintenance 52 6% 90% 100% 27 29 3 6% 29 3%Revenue offsets -169 -19% 100% 100% -169 -169 0 0% -169 -19%Indirects & Overheads 360 n/a 100% 100% 360 360 n/a n/a 360 42%Operating costs 665 77% 618 665 47 96% 665 77%Renewal annuity 202 23% 99% 100% 200 202 2 4% 202 23%
Total Expenditure 867 100% 818 867 49 100% 867 100%Proportion of Total Expenditure 94% 100% 6%Expenditure TypeLabour 169 25% 90% 100% 152 169 17 36%Electricity 6 1% 100% 100% 6 6 0 0%Materials 65 10% 90% 100% 59 65 7 14%Contractors 100 15% 90% 100% 90 100 10 21%Other 133 20% 90% 100% 120 133 13 28%Indirects & Overheads 360 54% 100% 100% 360 360 0 0%Revenue offsets -169 -25% 100% 100% -169 -169 0 0%
Total Operating Costs 665 100% 618 665 47 100%
Recommended
Real dollars, $000 Low High Low HighActivityOperations 357 41% 80% 100% 286 357 71 75% 357 41%Electricity 6 1% 100% 100% 6 6 0 0% 6 1%Preventative maintenance 81 9% 80% 100% 64 81 16 17% 81 9%Corrective maintenance 29 3% 80% 100% 24 29 6 6% 29 3%Revenue offsets -169 -19% 100% 100% -169 -169 0 0% -169 -19%Indirects & Overheads 360 n/a 100% 100% 360 360 n/a n/a 360 42%Operating costs 665 77% 571 665 93 98% 665 77%Renewal annuity 202 23% 99% 100% 200 202 2 2% 202 23%
Total Expenditure 867 100% 771 867 96 100% 867 100%Proportion of Total Expenditure 89% 100% 11%Expenditure TypeLabour 169 25% 80% 100% 135 169 34 36%Electricity 6 1% 100% 100% 6 6 0 0%Materials 65 10% 80% 100% 52 65 13 14%Contractors 100 15% 80% 100% 80 100 20 21%Other 133 20% 80% 100% 106 133 27 28%Indirects & Overheads 360 54% 100% 100% 360 360 0 0%Revenue offsets -169 -25% 100% 100% -169 -169 0 0%
Total Operating Costs 665 100% 571 665 93 100%
High
Real dollars, $000 Low High Low HighActivityOperations 357 41% 70% 100% 250 357 107 75% 357 41%Electricity 6 1% 100% 100% 6 6 0 0% 6 1%Preventative maintenance 81 9% 70% 100% 56 81 24 17% 81 9%Corrective maintenance 29 3% 70% 100% 21 29 9 6% 29 3%Revenue offsets -169 -19% 100% 100% -169 -169 0 0% -169 -19%Indirects & Overheads 305 n/a 100% 100% 360 360 n/a n/a 360 42%Operating costs 665 77% 525 665 140 99% 665 77%Renewal annuity 202 23% 99% 100% 200 202 2 1% 202 23%
Total Expenditure 867 100% 725 867 142 100% 867 100%Proportion of Total Expenditure 84% 100% 16%Expenditure TypeLabour 169 25% 70% 100% 118 169 51 36%Electricity 6 1% 100% 100% 6 6 0 0%Materials 65 10% 70% 100% 46 65 20 14%Contractors 100 15% 70% 100% 70 100 30 21%Other 133 20% 70% 100% 93 133 40 28%Indirects & Overheads 360 54% 100% 100% 360 360 0 0%Revenue offsets -169 -25% 100% 100% -169 -169 0 0%
Total Operating Costs 665 100% 525 665 140 100%
% of total variable
Price Path
Price Path
Price Path
Price Path
% Range Variable Costs
% of total variable
costs
Price Path
Average $
Price Path
Average %
Price Path
Average $
Price Path
Average %
% Range
Variable Costs
% of total variable
Price Path
Price Path
Price Path
Price Path
% Range Variable Costs

Queensland Competition Authority Appendices Indec Consulting
416370_2.DOCX October 2011
Bulk Supply – Three Moon
Service Contract Three Moon Creek Bulk Supply
Real dollars, $000 2007 2008 2009 2010 2011 2012 2013 2014 2015 2016 2017ActivityOperations 253 198 311 368 218 220 230 234 231 226 224 229Electricity 6 6 7 8 9 9 9 10 11 12 13 11Preventative maintenance 183 30 35 33 83 83 88 90 89 86 85 88Corrective maintenance 26 16 1 12 13 13 13 14 14 13 13 13Revenue offsets -4 -4 -3 -3 -2 -2 -2 -2 -2 -2 -2 -2Operating costs 463 246 351 418 320 323 338 346 343 335 333 339Renewal annuity spend 4 62 87 30 52 117 58 127 124 0 77Dam safety upgrade 0 0 0 0 0 0 0 0 0 0 0
Total Expenditure 467 308 438 448 372 440 396 473 467 335 333 401Expenditure TypeLabour 75 52 77 96 89 90 92 92 92 92 92 92Electricity 6 6 7 8 9 9 9 10 11 12 13 11Materials 11 5 2 3 4 4 4 4 4 4 4 4Contractors 2 3 6 17 3 3 4 4 4 4 4 4Other 47 47 88 96 50 50 50 50 50 50 50 50Indirects & Overheads 326 138 172 200 167 168 182 189 184 177 173 181Revenue offsets -4 -4 -3 -3 -2 -2 -2 -2 -2 -2 -2 -2
Total Operating Costs 463 246 351 418 320 323 339 347 343 337 334 340
Actuals Forecast Price pathPrice Path
Average
Low
Real dollars, $000 Low High Low HighActivityOperations 104 23% 90% 100% 93 104 10 64% 104 23%Electricity 11 2% 100% 100% 11 11 0 0% 11 2%Preventative maintenance 88 20% 90% 100% 36 40 4 24% 40 9%Corrective maintenance 13 3% 90% 100% 5 6 1 4% 6 1%Revenue offsets -2 0% 100% 100% -2 -2 0 0% -2 0%Indirects & Overheads 180 n/a 100% 100% 180 180 n/a n/a 180 41%Operating costs 339 76% 324 339 15 92% 339 76%Renewal annuity 106 24% 99% 100% 105 106 1 8% 106 24%
Total Expenditure 445 100% 429 445 16 100% 445 100%Proportion of Total Expenditure 96% 100% 4%Expenditure TypeLabour 92 27% 90% 100% 83 92 9 61%Electricity 11 3% 100% 100% 11 11 0 0%Materials 4 1% 90% 100% 4 4 0 3%Contractors 4 1% 90% 100% 4 4 0 3%Other 50 15% 90% 100% 45 50 5 33%Indirects & Overheads 181 53% 100% 100% 181 181 0 0%Revenue offsets -2 -1% 100% 100% -2 -2 0 0%
Total Operating Costs 340 100% 325 340 15 100%
Recommended
Real dollars, $000 Low High Low HighActivityOperations 104 23% 80% 100% 83 104 21 67% 104 23%Electricity 11 2% 100% 100% 11 11 0 0% 11 2%Preventative maintenance 40 9% 80% 100% 32 40 8 25% 40 9%Corrective maintenance 6 1% 80% 100% 5 6 1 4% 6 1%Revenue offsets -2 0% 100% 100% -2 -2 0 0% -2 0%Indirects & Overheads 180 n/a 100% 100% 180 180 n/a n/a 180 41%Operating costs 339 76% 309 339 30 96% 339 76%Renewal annuity 106 24% 99% 100% 105 106 1 4% 106 24%
Total Expenditure 445 100% 414 445 31 100% 445 100%Proportion of Total Expenditure 93% 100% 7%Expenditure TypeLabour 92 27% 80% 100% 73 92 18 61%Electricity 11 3% 100% 100% 11 11 0 0%Materials 4 1% 80% 100% 3 4 1 3%Contractors 4 1% 80% 100% 3 4 1 3%Other 50 15% 80% 100% 40 50 10 33%Indirects & Overheads 181 53% 100% 100% 181 181 0 0%Revenue offsets -2 -1% 100% 100% -2 -2 0 0%
Total Operating Costs 340 100% 310 340 30 100%
High
Real dollars, $000 Low High Low HighActivityOperations 104 23% 70% 100% 73 104 31 68% 104 23%Electricity 11 2% 100% 100% 11 11 0 0% 11 2%Preventative maintenance 40 9% 70% 100% 28 40 12 26% 40 9%Corrective maintenance 6 1% 70% 100% 4 6 2 4% 6 1%Revenue offsets -2 0% 100% 100% -2 -2 0 0% -2 0%Indirects & Overheads 159 n/a 100% 100% 180 180 n/a n/a 180 41%Operating costs 339 76% 294 339 45 98% 339 76%Renewal annuity 106 24% 99% 100% 105 106 1 2% 106 24%
Total Expenditure 445 100% 399 445 46 100% 445 100%Proportion of Total Expenditure 90% 100% 10%Expenditure TypeLabour 92 27% 70% 100% 64 92 28 61%Electricity 11 3% 100% 100% 11 11 0 0%Materials 4 1% 70% 100% 3 4 1 3%Contractors 4 1% 70% 100% 3 4 1 3%Other 50 15% 70% 100% 35 50 15 33%Indirects & Overheads 181 53% 100% 100% 181 181 0 0%Revenue offsets -2 -1% 100% 100% -2 -2 0 0%
Total Operating Costs 340 100% 295 340 45 100%
% of total variable
Price Path
Price Path
Price Path
Price Path
% Range Variable Costs
% of total variable
costs
Price Path
Average $
Price Path
Average %
Price Path
Average $
Price Path
Average %
% Range
Variable Costs
% of total variable
Price Path
Price Path
Price Path
Price Path
% Range Variable Costs

Queensland Competition Authority Appendices Indec Consulting
416370_2.DOCX October 2011
Bulk Supply – Upper Burnett
Service Contract Upper Burnett Bulk Supply
Real dollars, $000 2007 2008 2009 2010 2011 2012 2013 2014 2015 2016 2017ActivityOperations 439 375 632 549 507 511 534 545 538 526 520 533Electricity 3 5 6 6 7 7 8 8 9 10 10 9Preventative maintenance 117 58 76 64 130 131 138 141 139 136 134 138Corrective maintenance 20 26 26 56 32 32 34 35 34 34 33 34Revenue offsets -2 -12 -20 -9 -8 -8 -8 -8 -8 -8 -8 -8Operating costs 578 451 720 666 667 673 706 721 712 698 689 705Renewal annuity spend 280 275 148 374 160 324 227 270 237 165 225Dam safety upgrade 0 0 0 0 0 0 0 0 0 599 150
Total Expenditure 858 725 868 1,041 827 997 933 991 949 1,462 689 1,005Expenditure TypeLabour 164 131 158 169 190 192 195 195 195 195 195 195Electricity 3 5 6 6 7 7 8 8 9 10 10 9Materials 12 9 12 11 12 12 12 12 12 13 13 12Contractors 16 16 24 22 15 15 15 15 15 16 16 15Other 98 88 146 131 96 96 96 96 96 96 96 96Indirects & Overheads 286 212 391 334 356 359 388 402 393 376 368 385Revenue offsets -2 -12 -20 -9 -8 -8 -8 -8 -8 -8 -8 -8
Total Operating Costs 578 451 720 666 667 673 706 720 712 698 690 705
Actuals Forecast Price pathPrice Path
Average
Low
Real dollars, $000 Low High Low HighActivityOperations 241 25% 90% 100% 217 241 24 68% 241 25%Electricity 9 1% 100% 100% 9 9 0 0% 9 1%Preventative maintenance 138 14% 90% 100% 56 62 6 18% 62 6%Corrective maintenance 34 4% 90% 100% 14 15 2 4% 15 2%Revenue offsets -8 -1% 100% 100% -8 -8 0 0% -8 -1%Indirects & Overheads 385 n/a 100% 100% 385 385 n/a n/a 385 40%Operating costs 705 73% 673 705 32 91% 705 73%Renewal annuity 257 27% 99% 100% 254 257 3 9% 257 27%
Total Expenditure 962 100% 927 962 35 100% 962 100%Proportion of Total Expenditure 96% 100% 4%Expenditure TypeLabour 195 28% 90% 100% 176 195 20 61%Electricity 9 1% 100% 100% 9 9 0 0%Materials 12 2% 90% 100% 11 12 1 4%Contractors 15 2% 90% 100% 14 15 2 5%Other 96 14% 90% 100% 86 96 10 30%Indirects & Overheads 385 55% 100% 100% 385 385 0 0%Revenue offsets -8 -1% 100% 100% -8 -8 0 0%
Total Operating Costs 705 100% 673 705 32 100%
Recommended
Real dollars, $000 Low High Low HighActivityOperations 241 25% 80% 100% 193 241 48 72% 241 25%Electricity 9 1% 100% 100% 9 9 0 0% 9 1%Preventative maintenance 62 6% 80% 100% 50 62 12 19% 62 6%Corrective maintenance 15 2% 80% 100% 12 15 3 5% 15 2%Revenue offsets -8 -1% 100% 100% -8 -8 0 0% -8 -1%Indirects & Overheads 385 n/a 100% 100% 385 385 n/a n/a 385 40%Operating costs 705 73% 641 705 64 95% 705 73%Renewal annuity 257 27% 99% 100% 254 257 3 5% 257 27%
Total Expenditure 962 100% 895 962 67 100% 962 100%Proportion of Total Expenditure 93% 100% 7%Expenditure TypeLabour 195 28% 80% 100% 156 195 39 61%Electricity 9 1% 100% 100% 9 9 0 0%Materials 12 2% 80% 100% 10 12 2 4%Contractors 15 2% 80% 100% 12 15 3 5%Other 96 14% 80% 100% 77 96 19 30%Indirects & Overheads 385 55% 100% 100% 385 385 0 0%Revenue offsets -8 -1% 100% 100% -8 -8 0 0%
Total Operating Costs 705 100% 641 705 64 100%
High
Real dollars, $000 Low High Low HighActivityOperations 241 25% 70% 100% 169 241 72 74% 241 25%Electricity 9 1% 100% 100% 9 9 0 0% 9 1%Preventative maintenance 62 6% 70% 100% 44 62 19 19% 62 6%Corrective maintenance 15 2% 70% 100% 11 15 5 5% 15 2%Revenue offsets -8 -1% 100% 100% -8 -8 0 0% -8 -1%Indirects & Overheads 320 n/a 100% 100% 385 385 n/a n/a 385 40%Operating costs 705 73% 610 705 96 97% 705 73%Renewal annuity 257 27% 99% 100% 254 257 3 3% 257 27%
Total Expenditure 962 100% 864 962 98 100% 962 100%Proportion of Total Expenditure 90% 100% 10%Expenditure TypeLabour 195 28% 70% 100% 137 195 59 61%Electricity 9 1% 100% 100% 9 9 0 0%Materials 12 2% 70% 100% 9 12 4 4%Contractors 15 2% 70% 100% 11 15 5 5%Other 96 14% 70% 100% 67 96 29 30%Indirects & Overheads 385 55% 100% 100% 385 385 0 0%Revenue offsets -8 -1% 100% 100% -8 -8 0 0%
Total Operating Costs 705 100% 610 705 96 100%
% of total variable
Price Path
Price Path
Price Path
Price Path
% Range Variable Costs
% of total variable
costs
Price Path
Average $
Price Path
Average %
Price Path
Average $
Price Path
Average %
% Range
Variable Costs
% of total variable
Price Path
Price Path
Price Path
Price Path
% Range Variable Costs

Queensland Competition Authority Appendices Indec Consulting
416370_2.DOCX October 2011
Bulk Supply – Upper Condamine
Service Contract Upper Condamine Bulk Supply
Real dollars, $000 2007 2008 2009 2010 2011 2012 2013 2014 2015 2016 2017ActivityOperations 696 744 728 626 646 651 684 700 689 673 667 683Electricity 8 98 45 52 55 55 54 58 62 68 73 63Preventative maintenance 247 95 114 116 163 164 174 179 176 170 169 174Corrective maintenance 42 253 84 55 68 69 72 74 73 72 72 73Revenue offsets -1 -5 -7 -8 -6 -6 -6 -6 -6 -6 -6 -6Operating costs 993 1,186 965 842 927 934 978 1,005 994 977 975 986Renewal annuity spend 680 580 214 262 413 560 260 410 378 654 426Dam safety upgrade 0 0 0 0 0 0 0 0 0 0 0
Total Expenditure 1,673 1,766 1,178 1,104 1,340 1,494 1,238 1,415 1,372 1,631 975 1,326Expenditure TypeLabour 223 232 216 193 245 249 252 252 252 252 252 252Electricity 8 98 45 52 55 55 54 58 62 68 73 63Materials 48 54 30 26 33 33 33 34 34 35 35 34Contractors 10 49 27 53 28 28 29 29 30 30 30 30Other 111 130 140 141 90 90 90 90 90 90 90 90Indirects & Overheads 593 628 513 385 482 484 525 547 532 509 500 523Revenue offsets -1 -5 -7 -8 -6 -6 -6 -6 -6 -6 -6 -6
Total Operating Costs 993 1,186 965 842 927 934 977 1,004 994 978 974 985
Actuals Forecast Price pathPrice Path
Average
Low
Real dollars, $000 Low High Low HighActivityOperations 298 18% 90% 100% 269 298 30 27% 298 18%Electricity 63 4% 0% 100% 0 63 63 57% 63 4%Preventative maintenance 174 10% 90% 100% 68 76 8 7% 76 5%Corrective maintenance 73 4% 90% 100% 29 32 3 3% 32 2%Revenue offsets -6 0% 100% 100% -6 -6 0 0% -6 0%Indirects & Overheads 523 n/a 100% 100% 523 523 n/a n/a 523 31%Operating costs 986 59% 882 986 104 94% 986 59%Renewal annuity 687 41% 99% 100% 680 687 7 6% 687 41%
Total Expenditure 1,673 100% 1,562 1,673 110 100% 1,673 100%Proportion of Total Expenditure 93% 100% 7%Expenditure TypeLabour 252 26% 90% 100% 227 252 25 24%Electricity 63 6% 0% 100% 0 63 63 61%Materials 34 3% 90% 100% 31 34 3 3%Contractors 30 3% 90% 100% 27 30 3 3%Other 90 9% 90% 100% 81 90 9 9%Indirects & Overheads 523 53% 100% 100% 523 523 0 0%Revenue offsets -6 -1% 100% 100% -6 -6 0 0%
Total Operating Costs 985 100% 882 986 104 100%
Recommended
Real dollars, $000 Low High Low HighActivityOperations 298 18% 80% 100% 239 298 60 40% 298 18%Electricity 63 4% 0% 100% 0 63 63 42% 63 4%Preventative maintenance 76 5% 80% 100% 61 76 15 10% 76 5%Corrective maintenance 32 2% 80% 100% 25 32 6 4% 32 2%Revenue offsets -6 0% 100% 100% -6 -6 0 0% -6 0%Indirects & Overheads 523 n/a 100% 100% 523 523 n/a n/a 523 31%Operating costs 986 59% 842 986 144 95% 986 59%Renewal annuity 687 41% 99% 100% 680 687 7 5% 687 41%
Total Expenditure 1,673 100% 1,522 1,673 151 100% 1,673 100%Proportion of Total Expenditure 91% 100% 9%Expenditure TypeLabour 252 26% 80% 100% 202 252 50 35%Electricity 63 6% 0% 100% 0 63 63 44%Materials 34 3% 80% 100% 27 34 7 5%Contractors 30 3% 80% 100% 24 30 6 4%Other 90 9% 80% 100% 72 90 18 12%Indirects & Overheads 523 53% 100% 100% 523 523 0 0%Revenue offsets -6 -1% 100% 100% -6 -6 0 0%
Total Operating Costs 985 100% 841 986 144 100%
High
Real dollars, $000 Low High Low HighActivityOperations 298 18% 70% 100% 209 298 90 47% 298 18%Electricity 63 4% 0% 100% 0 63 63 33% 63 4%Preventative maintenance 76 5% 70% 100% 53 76 23 12% 76 5%Corrective maintenance 32 2% 70% 100% 22 32 10 5% 32 2%Revenue offsets -6 0% 100% 100% -6 -6 0 0% -6 0%Indirects & Overheads 463 n/a 100% 100% 523 523 n/a n/a 523 31%Operating costs 986 59% 801 986 185 96% 986 59%Renewal annuity 687 41% 99% 100% 680 687 7 4% 687 41%
Total Expenditure 1,673 100% 1,481 1,673 192 100% 1,673 100%Proportion of Total Expenditure 89% 100% 11%Expenditure TypeLabour 252 26% 70% 100% 176 252 76 41%Electricity 63 6% 0% 100% 0 63 63 34%Materials 34 3% 70% 100% 24 34 10 6%Contractors 30 3% 70% 100% 21 30 9 5%Other 90 9% 70% 100% 63 90 27 15%Indirects & Overheads 523 53% 100% 100% 523 523 0 0%Revenue offsets -6 -1% 100% 100% -6 -6 0 0%
Total Operating Costs 985 100% 801 986 185 100%
% of total variable
Price Path
Price Path
Price Path
Price Path
% Range Variable Costs
% of total variable
costs
Price Path
Average $
Price Path
Average %
Price Path
Average $
Price Path
Average %
% Range
Variable Costs
% of total variable
Price Path
Price Path
Price Path
Price Path
% Range Variable Costs