Embed Size (px)
Citation preview
1 | P a g e
Prince Mohammad Bin Fahd University
College of Engineering
Civil Engineering Department
Fall 2016/17
Learning Outcome Assessment III/CIV.
Qualitative and Quantitative Risk Assessment Models for
Al Khalidiya Road
Group members and ID’s:
Omar Ghalib Abdullah 201200201
Ahmed Baydoun 201002522
Ahmed Ibrahim 201102964
Supervisor:
Dr. Alaa Salman
2017
2 | P a g e
ABSTRACT
Most of the students and employees of Prince Mohamad Bin Fahd University (PMU) use Al-
Khalidiya road due to two reasons, first it is connecting the Highway to the university, and it
second thing the road is shorter than Al-Aziziya road. However, this road is considered very
risky by its users. “69 deaths happened in this dangerous road and most of them are students, Al-
Yaum newspaper (2015)”. Therefore, losing young people life is an issue worth to study in
details, in able to find solutions for stopping death risk. The current project is conducting a new
prospective management tools to help; (1) the decision makers and municipal engineers to
manage Al-Khalidiya road, (2) the road users by alerting them about the level of risk. Two
approach models, qualitative and quantitative, are developed to address the risk level of the road.
The level of the work and amount of information about the road is the main obstacle for the
project to be done within the limited time. Data is collected from municipalities, a questionnaire
survey, scientific journal papers to achieve the project objectives.
3 | P a g e
ACKNOWLEDGEMENT
We would like to thank all the people who contributed in some way to the work described in this
project. First and foremost, I thank my academic advisor, Dr. Alaa Salman, for accepting us into
his group research. During our tenure, he contributed to a rewarding graduate school experience
by giving us intellectual freedom in our work, engaging us in new ideas, and demanding a high
quality of work in all our endeavors. Additionally, we would like to thank my committee
members Dr. Andi Asiz, Dr. Tahar Ayadat, Dr. Omar Ouda, and Engr. Danish Ahmed for their
interest in our project.
We would like to acknowledge the Department of Civil Engineering at PMU. our graduation
experience benefited greatly from the courses we took. Also, we would like to thank Dr. Sami
from Dammam university, as well as, the dean of Academic Development at KFUPM for his
assistance. In addition, deep thanks to Engr. Ghalib Abdullah for his supporting.
Finally, we would like to acknowledge our friend Abdulaziz Al Mulhim for his kind support.
Additionally, deeply thanks to our families who supported us during our time here.
4 | P a g e
TABLE OF CONTENT
1. Introduction
1.1 Overview ……………………………………………………….…… 1-3
1.2 Current Practices and Their Limitations ……………….…………… 4-5
1.3 Organization Structure ………………………………………………. 5
2. Literature Review
2.1 Risk Factor ………………………………………………………….. 6-14
2.2 Risk Management …………………………………………………... 15
2.3 Road Risk Assessment ……………………………………………… 16 -17
2.4 Qualitative Method…………………………………………………. . 17-18
2.5 Quantitative Method ………………………………………………… 18-19
2.6 SMART Method ……………………………………………………... 19-20
3. Methodology of The Project
3.1 Introduction ………………………………………………………….. 21-22
3.2 Data Collection (Survey and Municipality)………………………….. 23-25
3.3 Develop Risk Models ………………………………………………. 26
3.4 Model Implementation …………………………………………….. 27-36
4. Risk Responses
4.1 Introduction ………………………………………………………… 37
4.2 The Nine Responses ……………………………………………….. 37
5 | P a g e
5. Summary, Limitations, & Future Works
5.1 Summary …………………………………………………………….. 55
5.2 Limitation ……………………………………………………………. 55-56
5.3 Future Works ………………………………………………………… 56
5.4 Summarized Of Risk And Risk Factors ……………………………... 57-58
5.5 Figure Summarized All Responses ………………………………….. 59
6 | P a g e
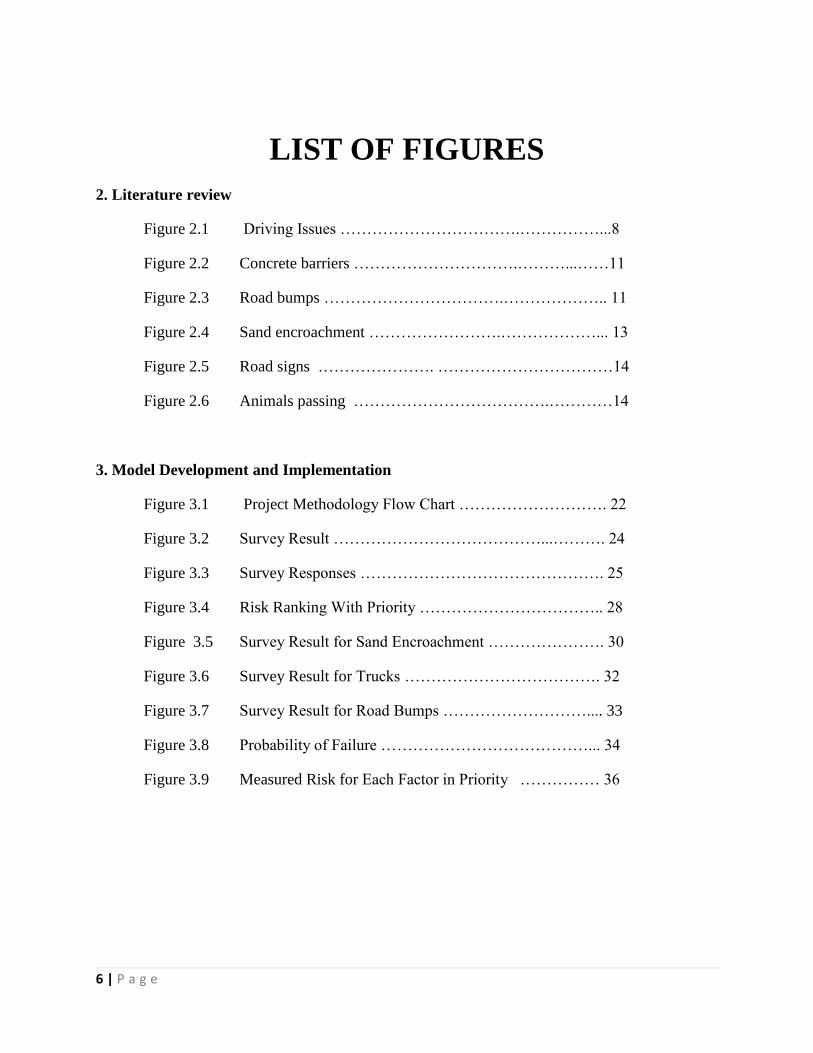
LIST OF FIGURES
2. Literature review
Figure 2.1 Driving Issues …………………………….……………...8
Figure 2.2 Concrete barriers ………………………….………...……11
Figure 2.3 Road bumps …………………………….……………….. 11
Figure 2.4 Sand encroachment …………………….………………... 13
Figure 2.5 Road signs …………………. ……………………………14
Figure 2.6 Animals passing ……………………………….…………14
3. Model Development and Implementation
Figure 3.1 Project Methodology Flow Chart ………………………. 22
Figure 3.2 Survey Result …………………………………...………. 24
Figure 3.3 Survey Responses ………………………………………. 25
Figure 3.4 Risk Ranking With Priority …………………………….. 28
Figure 3.5 Survey Result for Sand Encroachment …………………. 30
Figure 3.6 Survey Result for Trucks ………………………………. 32
Figure 3.7 Survey Result for Road Bumps ……………………….... 33
Figure 3.8 Probability of Failure …………………………………... 34
Figure 3.9 Measured Risk for Each Factor in Priority …………… 36
7 | P a g e
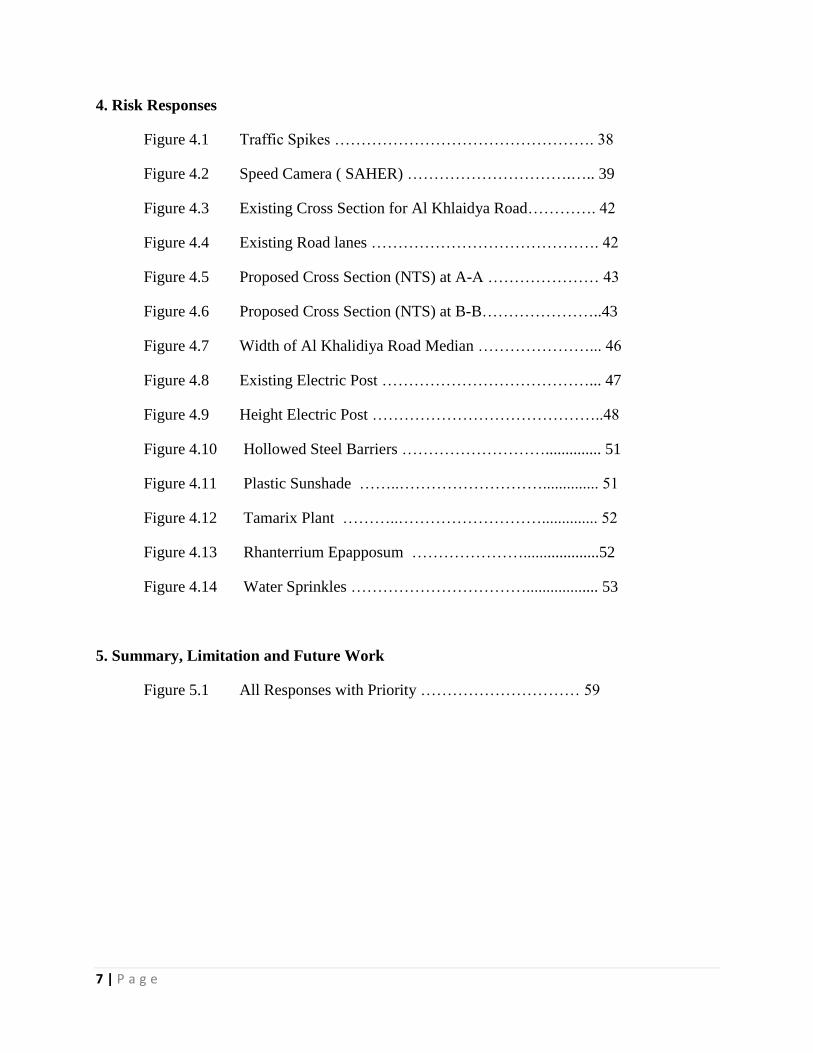
4. Risk Responses
Figure 4.1 Traffic Spikes …………………………………………. 38
Figure 4.2 Speed Camera ( SAHER) ………………………….….. 39
Figure 4.3 Existing Cross Section for Al Khlaidya Road…………. 42
Figure 4.4 Existing Road lanes ……………………………………. 42
Figure 4.5 Proposed Cross Section (NTS) at A-A ………………… 43
Figure 4.6 Proposed Cross Section (NTS) at B-B…………………..43
Figure 4.7 Width of Al Khalidiya Road Median …………………... 46
Figure 4.8 Existing Electric Post …………………………………... 47
Figure 4.9 Height Electric Post ……………………………………..48
Figure 4.10 Hollowed Steel Barriers ……………………….............. 51
Figure 4.11 Plastic Sunshade ……..……………………….............. 51
Figure 4.12 Tamarix Plant ………..……………………….............. 52
Figure 4.13 Rhanterrium Epapposum …………………...................52
Figure 4.14 Water Sprinkles …………………………….................. 53
5. Summary, Limitation and Future Work
Figure 5.1 All Responses with Priority ………………………… 59
8 | P a g e
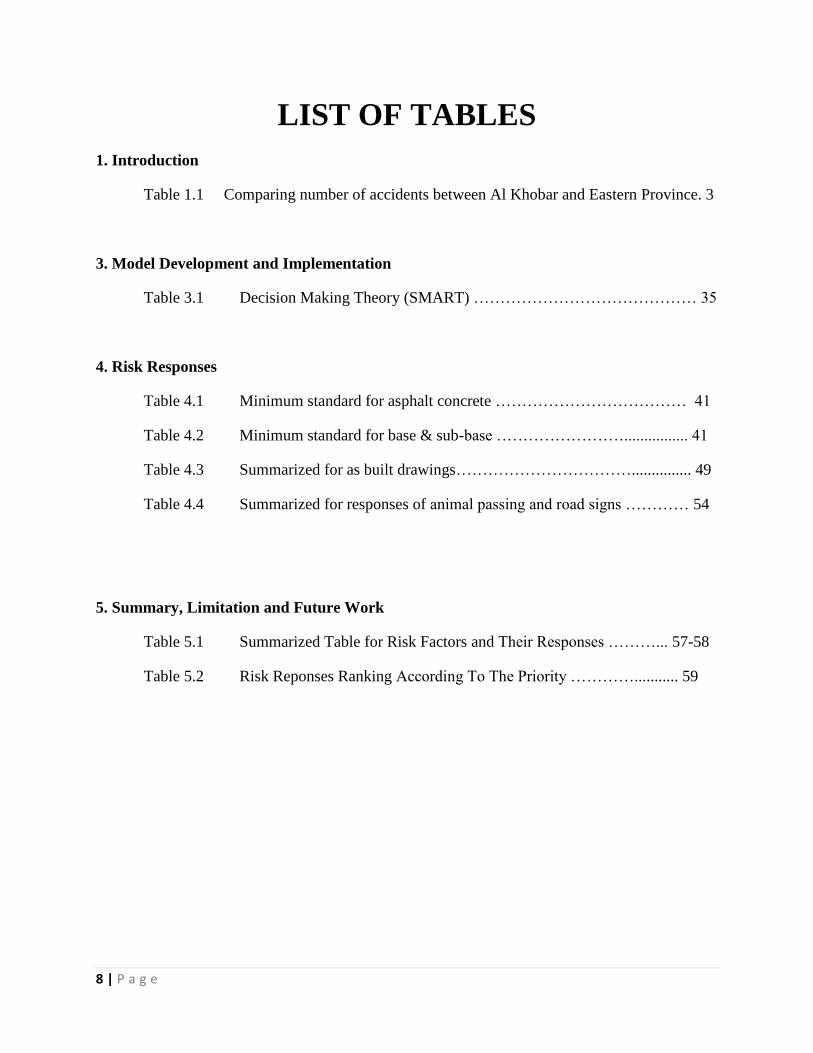
LIST OF TABLES
1. Introduction
Table 1.1 Comparing number of accidents between Al Khobar and Eastern Province. 3
3. Model Development and Implementation
Table 3.1 Decision Making Theory (SMART) …………………………………… 35
4. Risk Responses
Table 4.1 Minimum standard for asphalt concrete ……………………………… 41
Table 4.2 Minimum standard for base & sub-base ……………………................ 41
Table 4.3 Summarized for as built drawings……………………………............... 49
Table 4.4 Summarized for responses of animal passing and road signs ………… 54
5. Summary, Limitation and Future Work
Table 5.1 Summarized Table for Risk Factors and Their Responses ………... 57-58
Table 5.2 Risk Reponses Ranking According To The Priority …………........... 59
9 | P a g e
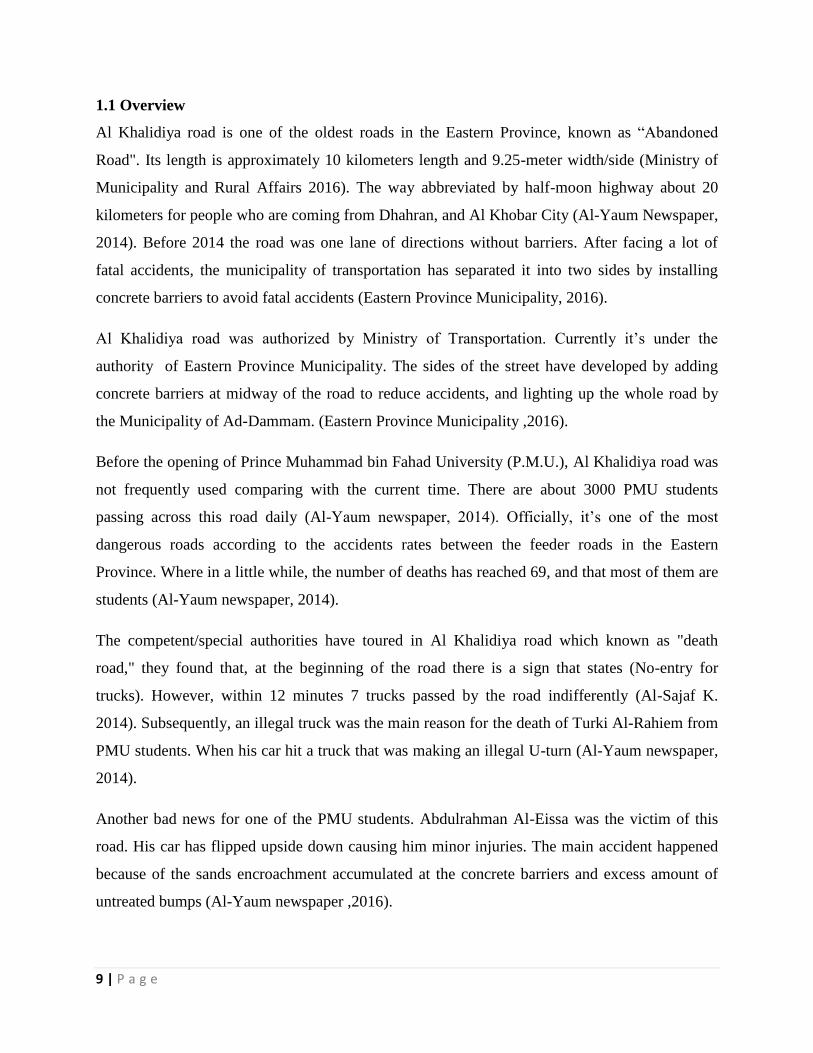
1.1 Overview
Al Khalidiya road is one of the oldest roads in the Eastern Province, known as “Abandoned
Road". Its length is approximately 10 kilometers length and 9.25-meter width/side (Ministry of
Municipality and Rural Affairs 2016). The way abbreviated by half-moon highway about 20
kilometers for people who are coming from Dhahran, and Al Khobar City (Al-Yaum Newspaper,
2014). Before 2014 the road was one lane of directions without barriers. After facing a lot of
fatal accidents, the municipality of transportation has separated it into two sides by installing
concrete barriers to avoid fatal accidents (Eastern Province Municipality, 2016).
Al Khalidiya road was authorized by Ministry of Transportation. Currently it’s under the
authority of Eastern Province Municipality. The sides of the street have developed by adding
concrete barriers at midway of the road to reduce accidents, and lighting up the whole road by
the Municipality of Ad-Dammam. (Eastern Province Municipality ,2016).
Before the opening of Prince Muhammad bin Fahad University (P.M.U.), Al Khalidiya road was
not frequently used comparing with the current time. There are about 3000 PMU students
passing across this road daily (Al-Yaum newspaper, 2014). Officially, it’s one of the most
dangerous roads according to the accidents rates between the feeder roads in the Eastern
Province. Where in a little while, the number of deaths has reached 69, and that most of them are
students (Al-Yaum newspaper, 2014).
The competent/special authorities have toured in Al Khalidiya road which known as "death
road," they found that, at the beginning of the road there is a sign that states (No-entry for
trucks). However, within 12 minutes 7 trucks passed by the road indifferently (Al-Sajaf K.
2014). Subsequently, an illegal truck was the main reason for the death of Turki Al-Rahiem from
PMU students. When his car hit a truck that was making an illegal U-turn (Al-Yaum newspaper,
2014).
Another bad news for one of the PMU students. Abdulrahman Al-Eissa was the victim of this
road. His car has flipped upside down causing him minor injuries. The main accident happened
because of the sands encroachment accumulated at the concrete barriers and excess amount of
untreated bumps (Al-Yaum newspaper ,2016).
10 | P a g e
Al Khalidiya road was closed in December 8th, 2014 as a prelude to rehabilitate fully, by adding
bumps and means of safety for the road. Closing the road was done by coordination between the
responsible authorities and management of Prince Mohammed Bin Fahd University due to the
impact that was caused by the loss of 69 lives in which most of them were students (Al-Yaum
newspaper, 2014).
A committee was formed by the municipality of the eastern region, traffic management, and
management of roads and transport, as well as, Saudi Aramco for studying Al Khalidiya road
situation. The committee reached durable and temporary solutions, as there are some proposals
request implementation of the Eastern Province Municipality and Saudi Aramco. Also, his Royal
Highness Prince Saud bin Nayef bin Abdul-Aziz, Governor of the Eastern Region has stressed
the concerned authorities in the secretariat and management of roads and traffic management in
the region; to find instant solutions to to prevent this issue from aggravating (Al-Yaum
newspaper ,2014).
As a primary solution for the road environmental issue, Management Services of Municipality of
Al Khobar has allocated heavy construction equipment operating on a cliff encroached sand
accumulated at the concrete barriers (Eastern Province Municipality ,2016).
In any project, the possibility of risk is a must but in different levels. The same in roads and
highways, the possibility of risk is natural and maybe bigger than any other engineering project.
However, Al Khalidiya road has nine risk factors that can cause fatal accidents. For example, in
five years from 2009 – 2014, there was more than 1600 accidents occurred in Al Khalidiya road
(Makkah Newspaper ,2014). i.e. 320 accidents yearly.
The number of accidents occurred in Eastern Province in 2013 was about 104,976 accidents
(Alamdoonah 2015) Therefore, the percentage of total accidents of EP for Al Khalidiya Road is
0.1% of total accidents occurred in that years. And Al Khalidiya road takes approximately 2% of
total acciedents happened in Al Khobar City only in 2013. This proportion is a huge portion
comparing with a street of 10 Km length and 18.50 meters’ width. The following table
demonstrate the number of accidents between KSA, Eastern Province, and Al Khalidya road
with percentages.
11 | P a g e
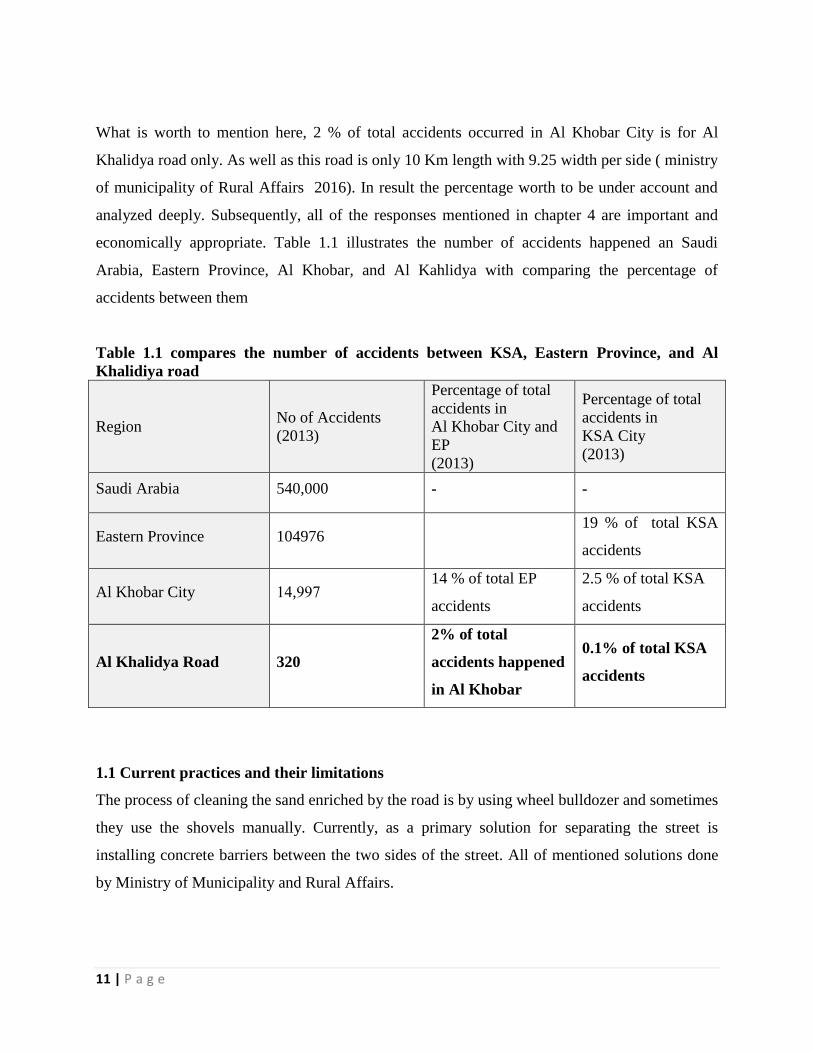
What is worth to mention here, 2 % of total accidents occurred in Al Khobar City is for Al
Khalidya road only. As well as this road is only 10 Km length with 9.25 width per side ( ministry
of municipality of Rural Affairs 2016). In result the percentage worth to be under account and
analyzed deeply. Subsequently, all of the responses mentioned in chapter 4 are important and
economically appropriate. Table 1.1 illustrates the number of accidents happened an Saudi
Arabia, Eastern Province, Al Khobar, and Al Kahlidya with comparing the percentage of
accidents between them
Table 1.1 compares the number of accidents between KSA, Eastern Province, and Al
Khalidiya road
Region No of Accidents
(2013)
Percentage of total
accidents in
Al Khobar City and
EP
(2013)
Percentage of total
accidents in
KSA City
(2013)
Saudi Arabia 540,000 - -
Eastern Province 104976 19 % of total KSA
accidents
Al Khobar City 14,997 14 % of total EP
accidents
2.5 % of total KSA
accidents
Al Khalidya Road 320
2% of total
accidents happened
in Al Khobar
0.1% of total KSA
accidents
1.1 Current practices and their limitations
The process of cleaning the sand enriched by the road is by using wheel bulldozer and sometimes
they use the shovels manually. Currently, as a primary solution for separating the street is
installing concrete barriers between the two sides of the street. All of mentioned solutions done
by Ministry of Municipality and Rural Affairs.
12 | P a g e
1.2 Project Objectives
Several objectives are intended to achieve in this project as listed as follows:
1. Identify risk factors of Al Khalidiya Road.
2. Perform a qualitative risk model (QLRM) for the road users. The model output will be
risk category for each risk factor; for example, “Red” for “Risk X”, “Orange” for “Risk
Y”, and “Yellow” for “Risk Z”.
3. Cary out a quantitative risk model (QNRM) for decision makers and municipal
engineers, who are responsible for the road operations, to consider required plans
accordingly to mitigate the current and future risk.
4. Recommend suitable action plans for the future graduation projects.
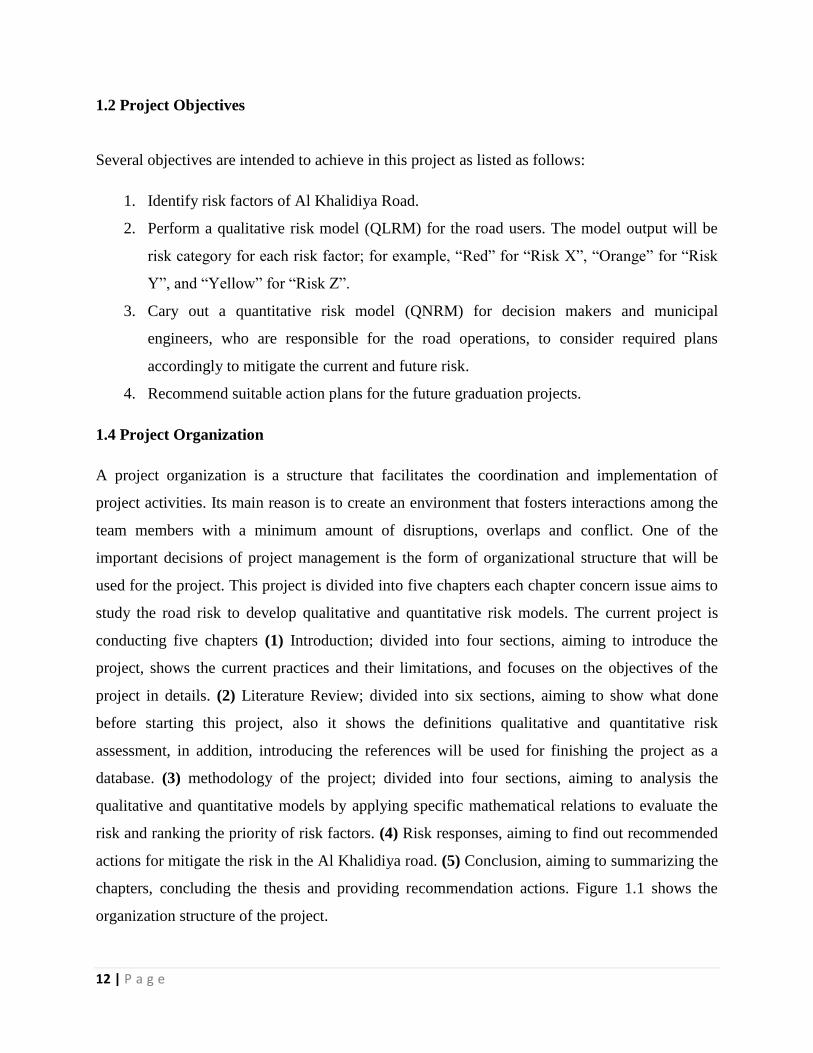
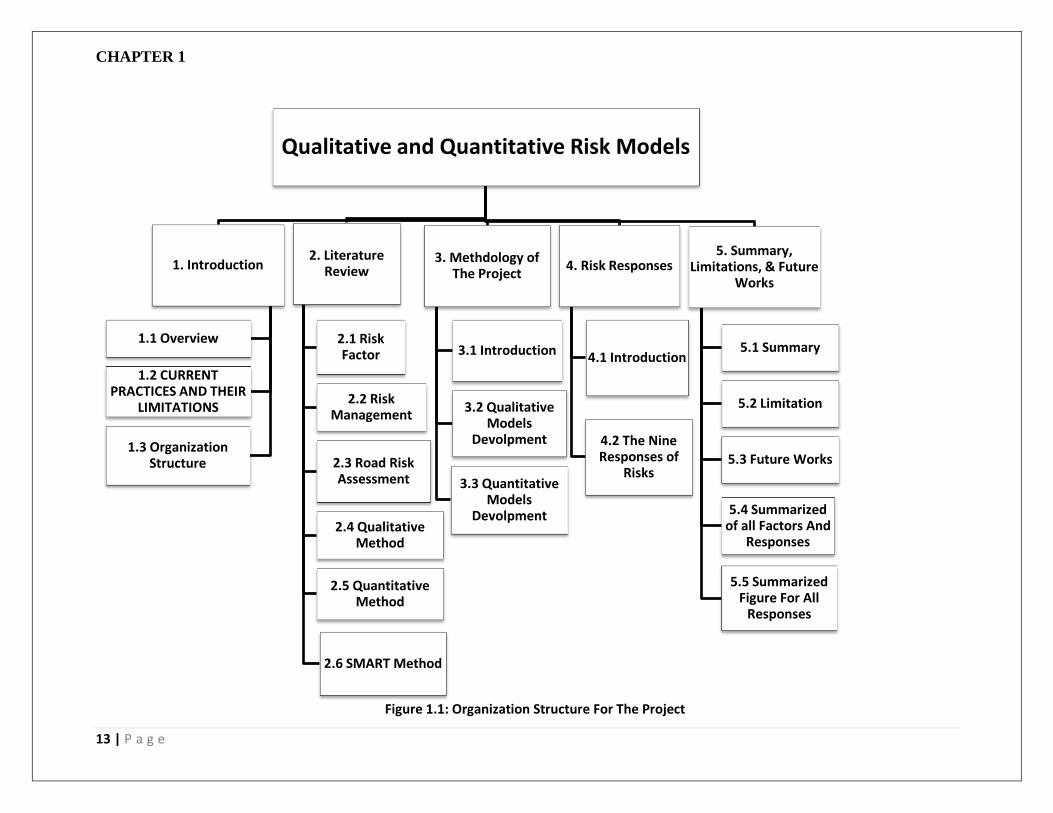
1.4 Project Organization
A project organization is a structure that facilitates the coordination and implementation of
project activities. Its main reason is to create an environment that fosters interactions among the
team members with a minimum amount of disruptions, overlaps and conflict. One of the
important decisions of project management is the form of organizational structure that will be
used for the project. This project is divided into five chapters each chapter concern issue aims to
study the road risk to develop qualitative and quantitative risk models. The current project is
conducting five chapters (1) Introduction; divided into four sections, aiming to introduce the
project, shows the current practices and their limitations, and focuses on the objectives of the
project in details. (2) Literature Review; divided into six sections, aiming to show what done
before starting this project, also it shows the definitions qualitative and quantitative risk
assessment, in addition, introducing the references will be used for finishing the project as a
database. (3) methodology of the project; divided into four sections, aiming to analysis the
qualitative and quantitative models by applying specific mathematical relations to evaluate the
risk and ranking the priority of risk factors. (4) Risk responses, aiming to find out recommended
actions for mitigate the risk in the Al Khalidiya road. (5) Conclusion, aiming to summarizing the
chapters, concluding the thesis and providing recommendation actions. Figure 1.1 shows the
organization structure of the project.
CHAPTER 1
13 | P a g e
Qualitative and Quantitative Risk Models
1. Introduction
1.1 Overview
1.2 CURRENT PRACTICES AND THEIR
LIMITATIONS
1.3 Organization Structure
2. Literature Review
2.1 Risk Factor
2.2 Risk Management
2.3 Road Risk Assessment
2.4 Qualitative Method
2.5 Quantitative Method
2.6 SMART Method
3. Methdology of The Project
3.1 Introduction
3.2 Qualitative Models
Devolpment
3.3 Quantitative Models
Devolpment
4. Risk Responses
4.1 Introduction
4.2 The Nine Responses of
Risks
5. Summary, Limitations, & Future
Works
5.1 Summary
5.2 Limitation
5.3 Future Works
5.4 Summarized of all Factors And
Responses
5.5 Summarized Figure For All
Responses
Figure 1.1: Organization Structure For The Project
14 | P a g e
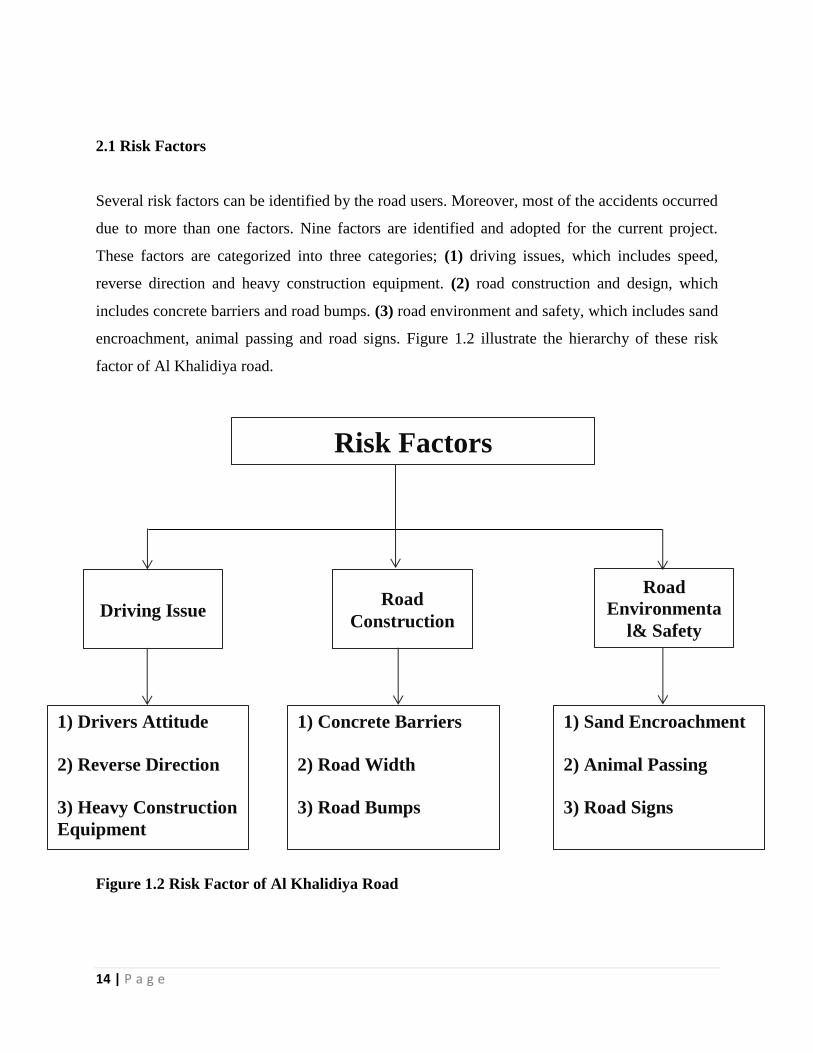
2.1 Risk Factors
Several risk factors can be identified by the road users. Moreover, most of the accidents occurred
due to more than one factors. Nine factors are identified and adopted for the current project.
These factors are categorized into three categories; (1) driving issues, which includes speed,
reverse direction and heavy construction equipment. (2) road construction and design, which
includes concrete barriers and road bumps. (3) road environment and safety, which includes sand
encroachment, animal passing and road signs. Figure 1.2 illustrate the hierarchy of these risk
factor of Al Khalidiya road.
Figure 1.2 Risk Factor of Al Khalidiya Road
Risk Factors
1) Drivers Attitude
2) Reverse Direction
3) Heavy Construction
Equipment
Road
Construction Driving Issue
Road
Environmenta
l& Safety
1) Concrete Barriers
2) Road Width
3) Road Bumps
1) Sand Encroachment
2) Animal Passing
3) Road Signs
15 | P a g e
2.1.1 Driving Issue
It’s the first issue that should be studied and taking care of, where the majority of people who
drives on this way are young people some of them are indifferent. Also, there are more than 3000
students are using this road daily. Driving issue categorized under; speed, reverse direction and
heavy construction equipment going to be studied in details.
I. Drivers Attitude:
Driver attitude is a factor which should be taken into account. Thus, what if speed and other
behavior are in road like Al Khalidiya? Surly hazard and fatal accidents will occur. All of the
nine factors are proportionally with attitude. Bad attitude and illegal U-turn by trucks were the
major reason for one of the PMU student’s death (Al Sajaf K. 2014). Speed bumps was a
solution for decreasing speed in the street. But, it has turned down to be an issue regarding sand
encroachment as cars driving at high speed are at high risk of being flipped upside down.
II. Reverse Direction
Every day; in all times, there are people in Al Khalidiya road drive in reverse direction, due to
several reasons; (1) Reckless drivers (2) Construction project related to PMU (3) Intersections of
street. Regardless that reversing roads direction is an illegal issue. The problem here is with the
width of the road itself, where it does not allow cars driving reversely. Moreover, this street is a
feeder road was designed for people who going to Half-Moon beach and buying cattle. Now a
day, it’s used by university students and heavy construction equipment, according to last
statistic; the capacity of the road is 3000 students and employees using the road daily
(Makkah Newspaper 2014). Subsequently, PMU students are suffering from those people who
reverse the road direction caused fatal accidents. Unfortunately, there is no action implemented
for those people to stop them reversing directions of the road. The action should be taken in
place is to build up traffic spikes that can prevent people to reverse road direction. This action
should be done by municipality of Dammam which is in charge for this road.
16 | P a g e
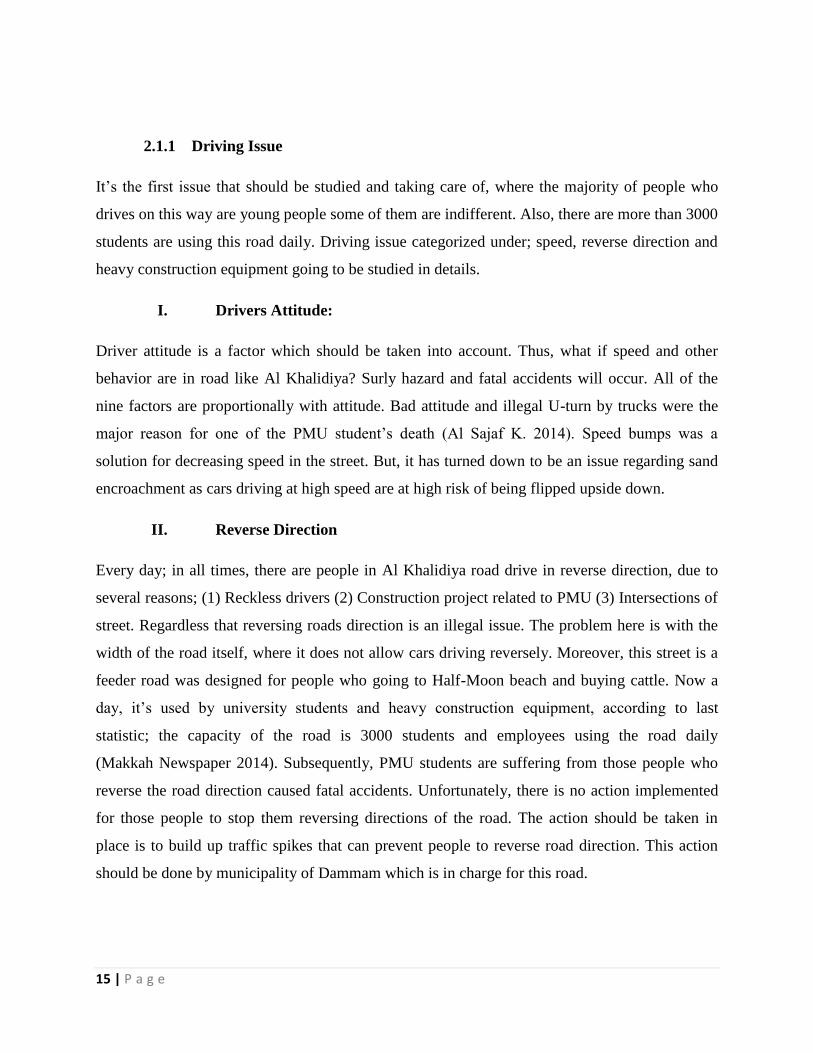
III. Heavy Construction Equipment
Indeed, the road itself is narrow, so existing of mechanical equipment for removing sand
accumulated at the concrete barriers make risk for the drivers driving on the road. PMU students
facing a big risk from that equipment. Removing concrete barriers will help solving the problem
so that, no need to have that equipment. This action should be done by municipality of Dammam
which is in charge for this road.
Figure 2.1: Driving Issues
17 | P a g e
2.1.2 Road Construction
Al Khalidiya road before opening Prince Muhammad Bin Fahad University (PMU) was
constructed as feeder way abbreviate 20 km for people who are coming from Dhahran and
Al Khobar going to Half-moon beach and buying cattle. It was one way serves both directions.
After PMU opened the road has become full of thousands students and too many heavy
construction equipment work for the projects located at this road. In result, a lot of fatal accidents
occurred caused tens of deaths (Al-Yaum Newspaper 2014). After municipality of transportation
separate the street into two sides by concrete barriers, the width of the street became narrow.
Road construction is categorized under; concrete barriers, width of the street and road bumps.
I. Concrete Barriers
Concrete barriers is one of the potential hazards facing Al Khalidiya road, these barriers were a
solution for the road to separate it into two different sides. Unfortunately, the barriers were
posing a risk in the street. Where, the street surrounded by sand which encroaching by the street
then the sand accumulated at those barriers, therefore, sand accumulate causing narrowing to
make it two or one lane instead of three lanes. The accumulate could cause dangerous accidents.
Here is a real example, during work in this project, October 2nd
of 2016, car has flipped upside
down and the main accident happened because of the sands encroachment and excess amount of
untreated bumps. Accordingly, people at risk of concrete barriers are in general all cars crossing
this road and specially Prince Muhammad bin Fahad (PMU) students. In the risk responses
chapter there will be detailed explanation about the solution for this potential hazard. In general,
the further action required in this road is to replace concrete barriers by hollowed steel barriers.
This action should be done by municipality of Dammam which is in charge for this road.
II. Road Width (Capacity of the Street)
The total road width is 18.5 m divided into 9.25m per side. (Ministry of Municipality and Rural
Affairs 2016). Capacity of the street is only 2 lanes per each side. However, currently the road
carries, trucks, heavy construction equipment, and 5000 students daily (Al-Yaum Newspaper
18 | P a g e
2014). Two lanes are not enough for all of these drivers driving in rush hours. Therefore, road
width causing hazard for the road users. Most of the drivers who face the risk are PMU students.
The further action required for reducing the risk comes from road width is increasing the road
width that can carry all of mentioned drivers in safety and secure conditions. In the risk
responses chapter there will be detailed explanation about the solution for this potential hazard
This action must be done by Ministry of Municipality and Rural Affairs, as per proposed plan
attached with report.
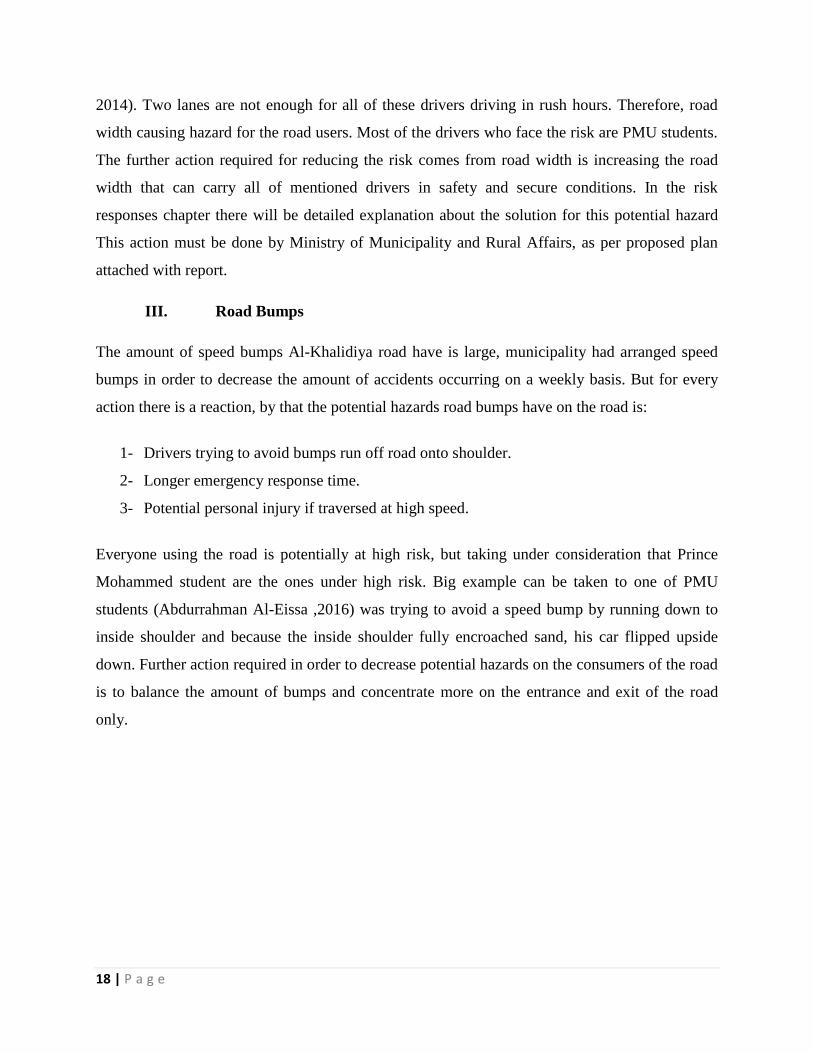
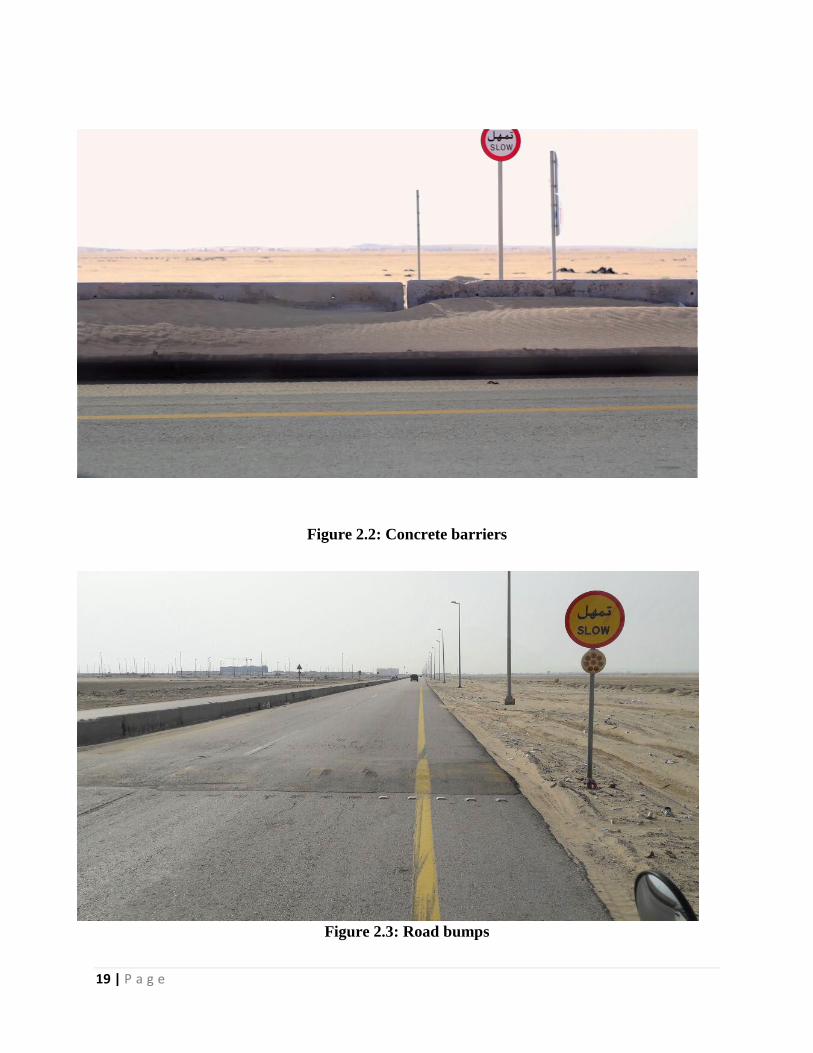
III. Road Bumps
The amount of speed bumps Al-Khalidiya road have is large, municipality had arranged speed
bumps in order to decrease the amount of accidents occurring on a weekly basis. But for every
action there is a reaction, by that the potential hazards road bumps have on the road is:
1- Drivers trying to avoid bumps run off road onto shoulder.
2- Longer emergency response time.
3- Potential personal injury if traversed at high speed.
Everyone using the road is potentially at high risk, but taking under consideration that Prince
Mohammed student are the ones under high risk. Big example can be taken to one of PMU
students (Abdurrahman Al-Eissa ,2016) was trying to avoid a speed bump by running down to
inside shoulder and because the inside shoulder fully encroached sand, his car flipped upside
down. Further action required in order to decrease potential hazards on the consumers of the road
is to balance the amount of bumps and concentrate more on the entrance and exit of the road
only.
19 | P a g e
Figure 2.2: Concrete barriers
Figure 2.3: Road bumps
20 | P a g e
2.1.3 Road Environmental and Safety
The road environment is very important for road safety. Infrastructure gives the framework for
the physical movement within a society. Infrastructure planning, design, implementation and
maintenance involve many levels of activity and disciplines. The aspect of environment and
safety will be studied in details in this project divided into the following points:
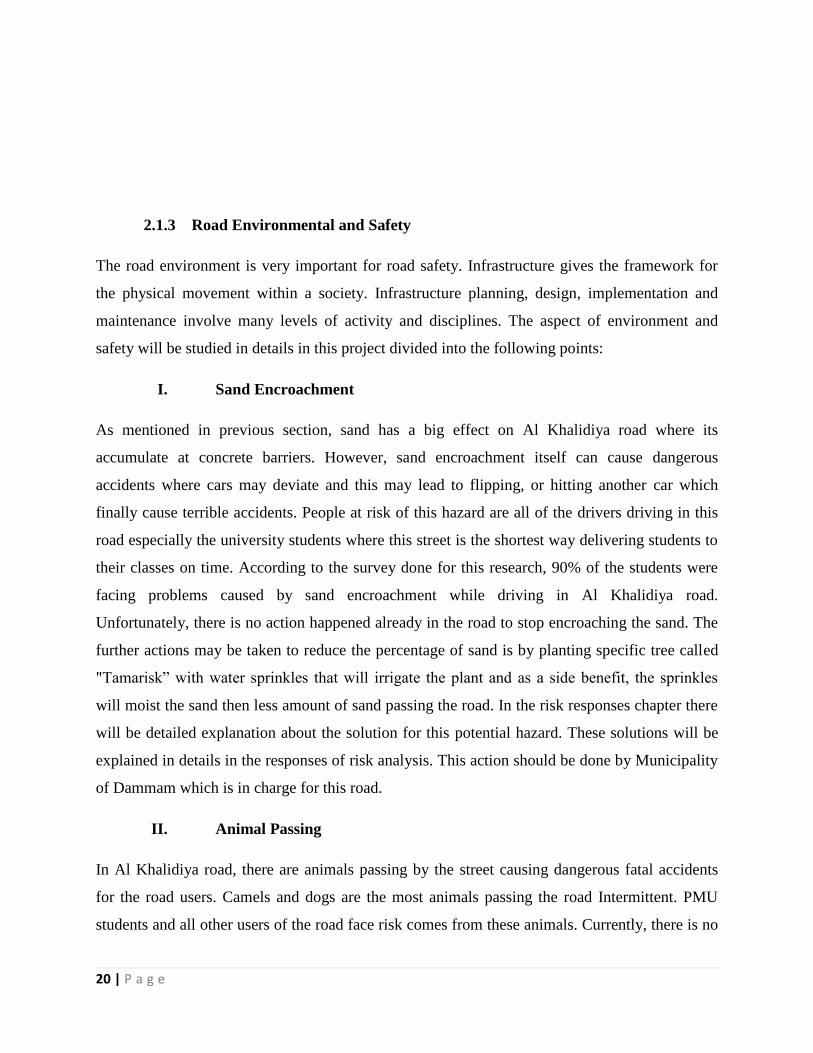
I. Sand Encroachment
As mentioned in previous section, sand has a big effect on Al Khalidiya road where its
accumulate at concrete barriers. However, sand encroachment itself can cause dangerous
accidents where cars may deviate and this may lead to flipping, or hitting another car which
finally cause terrible accidents. People at risk of this hazard are all of the drivers driving in this
road especially the university students where this street is the shortest way delivering students to
their classes on time. According to the survey done for this research, 90% of the students were
facing problems caused by sand encroachment while driving in Al Khalidiya road.
Unfortunately, there is no action happened already in the road to stop encroaching the sand. The
further actions may be taken to reduce the percentage of sand is by planting specific tree called
"Tamarisk” with water sprinkles that will irrigate the plant and as a side benefit, the sprinkles
will moist the sand then less amount of sand passing the road. In the risk responses chapter there
will be detailed explanation about the solution for this potential hazard. These solutions will be
explained in details in the responses of risk analysis. This action should be done by Municipality
of Dammam which is in charge for this road.
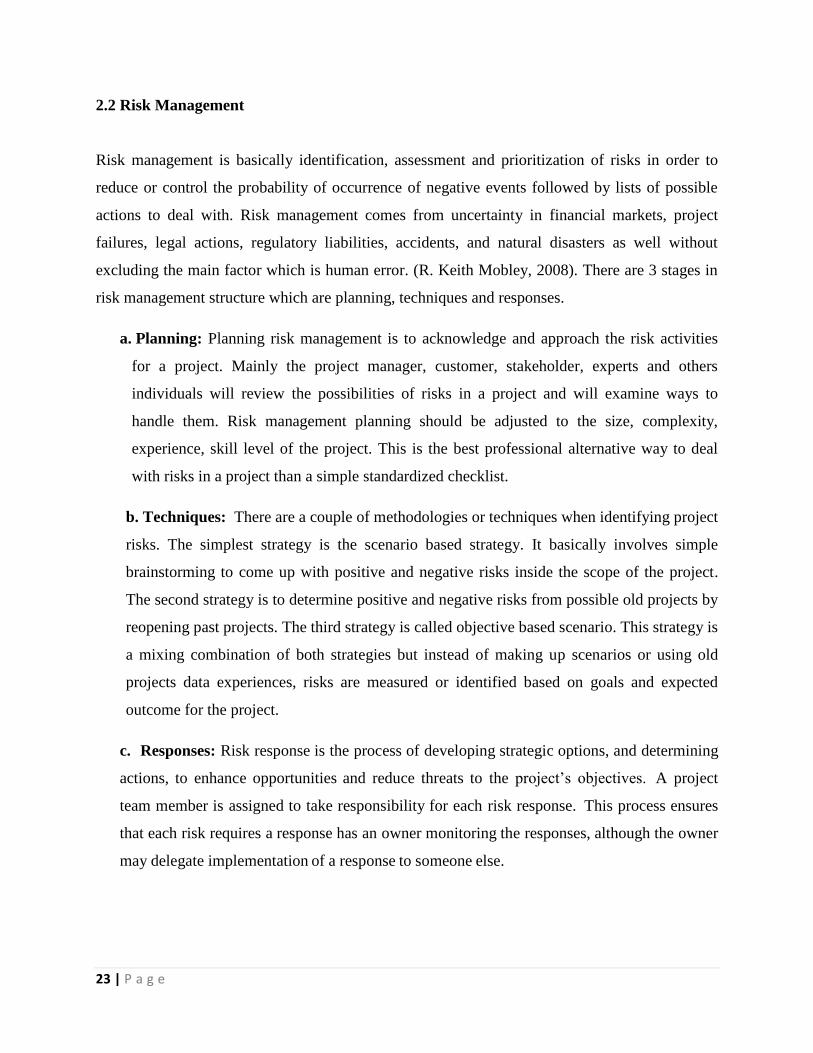
II. Animal Passing
In Al Khalidiya road, there are animals passing by the street causing dangerous fatal accidents
for the road users. Camels and dogs are the most animals passing the road Intermittent. PMU
students and all other users of the road face risk comes from these animals. Currently, there is no
21 | P a g e
action have already taken. The further action required for the road is supporting it by signboards.
This action should be done by Ministry of Municipality and Rural Affairs which is in charge for
this road.
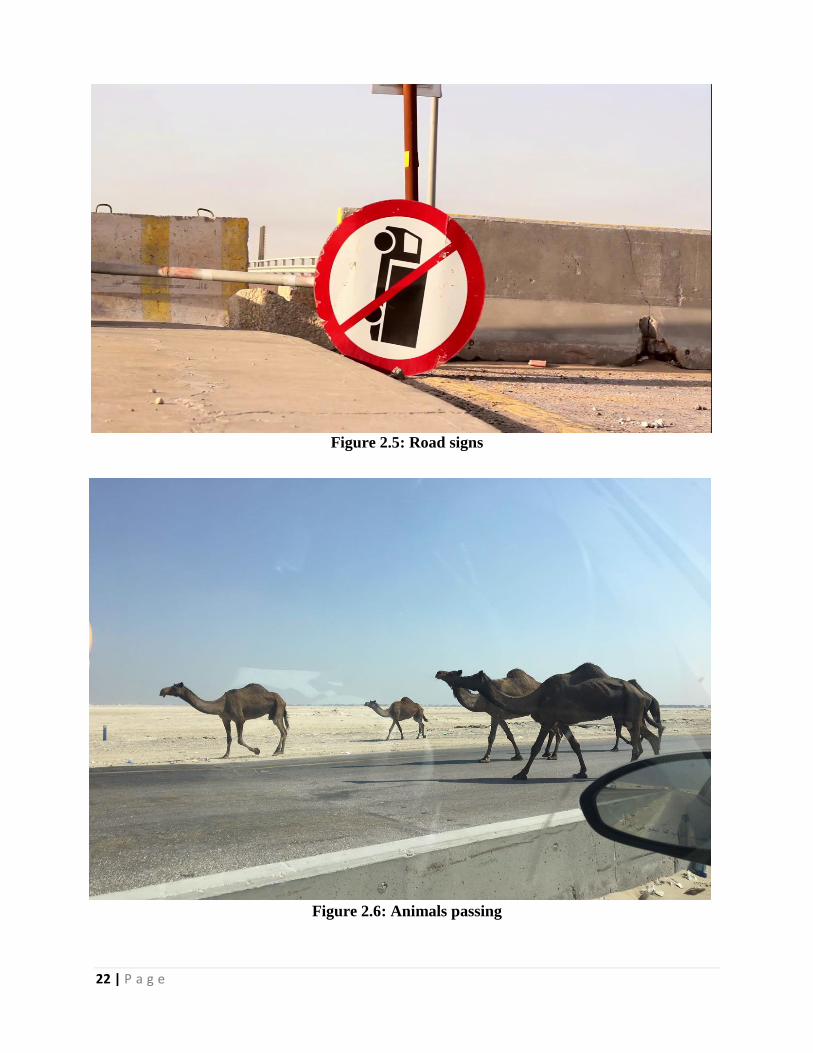
III. Road Signs
Road signs are very important roads, where signs make the organizational structure of the road.
A several problems may occur on a road that without signs. According to questionnaire survey,
Al Khalidiya road is currently a random road because of the lack of signs that guide behavior of
the drivers in the road. PMU students are the people who face the risk comes from lack of road
signs. The action already taken in the road is speed radar cars in which taking tickets for people
who exceed speed limit. The further action must be taken for reducing the risk comes from this
factor is installing enough signs for the road in which make the driving flow is organized. This
action must be done by Ministry of Municipality and Rural Affairs.
Figure 2.4: Sand encroachment
22 | P a g e
Figure 2.5: Road signs
Figure 2.6: Animals passing
23 | P a g e
2.2 Risk Management
Risk management is basically identification, assessment and prioritization of risks in order to
reduce or control the probability of occurrence of negative events followed by lists of possible
actions to deal with. Risk management comes from uncertainty in financial markets, project
failures, legal actions, regulatory liabilities, accidents, and natural disasters as well without
excluding the main factor which is human error. (R. Keith Mobley, 2008). There are 3 stages in
risk management structure which are planning, techniques and responses.
a. Planning: Planning risk management is to acknowledge and approach the risk activities
for a project. Mainly the project manager, customer, stakeholder, experts and others
individuals will review the possibilities of risks in a project and will examine ways to
handle them. Risk management planning should be adjusted to the size, complexity,
experience, skill level of the project. This is the best professional alternative way to deal
with risks in a project than a simple standardized checklist.
b. Techniques: There are a couple of methodologies or techniques when identifying project
risks. The simplest strategy is the scenario based strategy. It basically involves simple
brainstorming to come up with positive and negative risks inside the scope of the project.
The second strategy is to determine positive and negative risks from possible old projects by
reopening past projects. The third strategy is called objective based scenario. This strategy is
a mixing combination of both strategies but instead of making up scenarios or using old
projects data experiences, risks are measured or identified based on goals and expected
outcome for the project.
c. Responses: Risk response is the process of developing strategic options, and determining
actions, to enhance opportunities and reduce threats to the project’s objectives. A project
team member is assigned to take responsibility for each risk response. This process ensures
that each risk requires a response has an owner monitoring the responses, although the owner
may delegate implementation of a response to someone else.
24 | P a g e
2.3 Road Risk Assessment
Road risk assessment is a field that contains standard risk assessment approach to certain amount
of potential hazards with driving for work/university, that includes the trip taken, allowing
enough time for the journey length, arrangement to take a break, driving posture, route choice
and thinking of alternatives to driving.
Road Risk assessment is very important that there are a lot of risk factors coming from natural
and human being. The Royal Society for the Prevention of Accidents (RoSPA) encourages this
project to create road risk assessment based on the following key steps:
Step 1: Audit vehicle usage, accidents and their cost
Employers should audit the following information:
The number of vans, lorries, and essential or casual car users;
Journeys – the current mileage by types of vehicle and the length of journeys;
The date, time and place of accidents, and the severity of injuries sustained; and
The annual cost of insurance, repairs and absences from work following road accidents.
Step 2: Carry out a risk assessment
In occupational safety, a hazard is something that has the potential to cause harm. Risk is the
likelihood that harm will arise from a hazard. RoSPA recommends using a scoring system to
highlight issues of highest concern.
Step 3: Introduce safety and control measures
Many of these ideas are also sound advice for the individual driver:
• Eliminate unnecessary journeys and consider alternative means of communication.
• Change the mode of transport, e.g. take the train, then a bus or taxi.
• Avoid driving in adverse conditions, e.g. at night, or in poor weather.
• Reduce distances – set maximum driving distances (e.g. per day, per week or per year).
• Control drivers' hours. Set upper limits for driving hours each day, week and month.
• Specify the safest routes.
• Specify safer vehicles.
• Set driver capability standards, e.g. by requiring drivers to pass an advanced driving test paid
for by the employer.
• Require regular eyesight tests. The legal visual standard for a car or motorbike driver is to be
25 | P a g e
able to read a number plate at 20.5 meters, with glasses if worn.
• Set clear policies on use of alcohol and other substances. Prohibit the use of mobile phones,
including hands-free sets, while on the move.
2.4 Qualitative methods
i. Process definition:
Qualitative risk analysis is a process which ranks risk factors from highest to lowest by assessing
their probability of occurring and their impaction.
Naturally this process uses the definitions of the risk management plan. The Qualitative Risk
Analysis is a qualitative risk analysis (and not a quantitative risk analysis) because single risks
are "manually" classified by raw types of impacts and probability (and not by really computed
values with respect to the whole project and the side effects of other risks) (R. Keith Mobley,
2008).
ii. Tools and technique:
1. Risk probability and impact assessment is a method for "investigating the likelihood that
each specific risk will occur" and a method for explicating their "potential effects" on the
project which can be positive (risk is an "opportunity") or negative (risk is a "threat")
2. Probability and impact matrix combines the estimated / found values for probability and
impact (both represented in a range between 0 and 1) and computes the importness by
multiplying the values: risks, which will probably occur and which will have heavy
impacts are more important than those which will probably not occur and which will have
low impacts.
3. Risk and data quality assessment is a method to evaluate the quality of the basic data,
also, there is method called risk urgency assessment used to classify the risks (being
already pre classified by the probability – impact - matrix) with respect to the time: even
a lower classified risk can become more important than the higher classified, in opposite
of site higher classified, occur in the near future
26 | P a g e
iii. Process Output:
Updates of the Risk Register build an expansion of the initially generated risk registered by
following:
Relative ranking or priority list of project risks based upon the probability-impact-matrix and
the urgencies of the risks
Risks grouped by categories for being able to find collective answers
List of risks requiring response in the near-term
List of risks for additional analysis and response
Watch lists of low priority risks
Trends in qualitative risk analysis results
2.5 Quantitative methods
i. Process definition:
Quantitative Risk Analysis is the process for “numerically analyzing the effect on overall project
objectivities of identified risks" ( PMBOK 2011).
On the base of the results of the Qualitative Risk Analysis the "Quantitative Risk Analysis is
performed on risks that have been prioritized analyses the effects of those risks events and
assigns a numerical rating to those risks. Instead of estimating the single impacts by using a raw
typology in the process of Quantitative Risk Analysis the impacts to the whole project will be
computed for generating a more elaborated total ranking. Useful techniques are for example
"SMART" or "decision making theory" (PMBOK 2011).
To sum up, "quantitative risk analysis breaks down risks from a high, medium, and low ranking
to actual numerical values and probabilities of occurrence" for being able to compute the overall
effects (CROSSWIND7 2009)
ii. Tools and techniques:
Data gathering and representation techniques like "Interviewing" and computing the
"probability distributions" on the base of "expert judgments" (PMBOK 2011)
Quantitative risk analysis and modeling techniques (PMBOK 2011) like
Sensitivity analysis which results for example may be represented by the "tornado diagram"
27 | P a g e
Expected monetary value analysis (EVM) which is “statistical concept that calculates the average
outcome when the future includes scenarios that may or may not happen". Opportunities are
positive values, treated as negative.
Decision tree analysis "is usually structured using a decision tree diagram that describes a
situation under considerations, and the implications of each available choices and possible
scenarios"
Modeling and simulation for computing the whole effects for example by using the Monte Carlo
analysis
iii. Process output:
Updates of the Risk Register build an expansion of the initially generated and already updated /
widened risk register by the following additional information
Probabilistic analysis of the project
Probability of achieving cost and time objectives
Prioritized list of quantified risks
Trends in quantitative risk analysis results
2.6 Simple Multi Attributes Rating Technique (SMART) Method
Based on Harris (1980), SMART is a decision making Theory, which is “the study of identifying
and choosing alternatives based on the values and preferences of the decision maker”. Making a
decision implies that there are alternative choices to be considered, and in such a case we want
not only to identify as many of these alternatives as possible but to choose the one that best fits
with our goals, objectives, desires, values, and so on”. According to Baker et al. (2001), decision
making should start with the identification of the decision makers and stakeholders in the
decision, reducing the possible disagreement about problem definition, requirements, goals and
criteria. Then, a general decision making process can be divided into the following steps:
1) Define the Problem
2) Determine Requirement
3) Establish Goals
4) Identify Alternative
28 | P a g e
5) Define Criteria
6) Select Decision making theory
7) Evaluate Alternative Against Criteria
8) Validate Solution Against Problem Statement
Smart is adapted in this project as a decision making method to develop the risk index (RI)
mathematical model.
29 | P a g e
3.1 Introduction
There is no accurate data and statistics for Al Khalidiya road but from local newspaper and
students from the university faced fatal accidents that during the five years past, there were
almost 1600 accidents in this road, and 69 deaths among those accidents. Based on the data
gathered from the newspapers, municipality, and questionnaires, it has been determined that Al
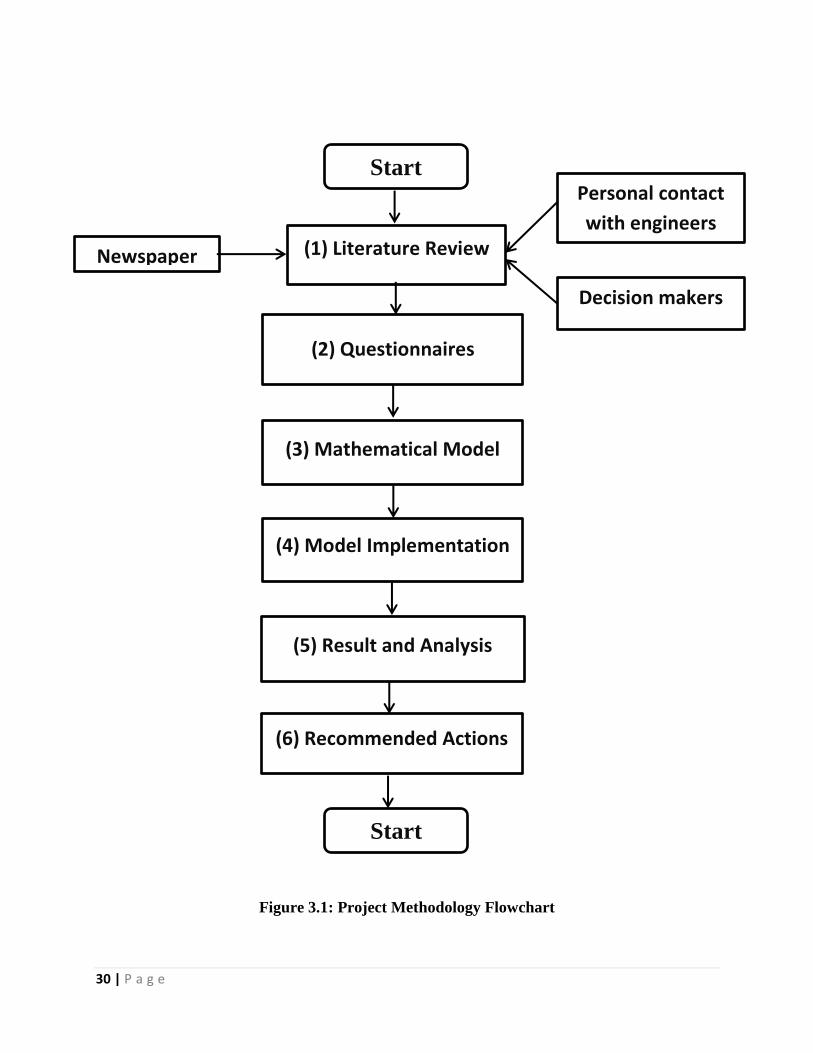
Khalidiya Road is risky. Therefore, this project is a new source to manage the road. Figure 3.1
demonstrate the flowchart of the project methodology. It consists of literature review first,
questionnaire second, developed mathematical models third, model implementation fourth, result
and analysis fifth, and recommended actions is sixth.
30 | P a g e
(1) Literature Review
(2) Questionnaires
(3) Mathematical Model
(4) Model Implementation
(5) Result and Analysis
(6) Recommended Actions
Figure 3.1: Project Methodology Flowchart
Start
Newspaper
Personal contact
with engineers
Decision makers
Start
31 | P a g e
3.2 Data collections (survey and municipality)
The survey consists of three questions; 1st is general questions for road users. 2
nd is evaluating
the nine risk factors from 1 to 10, where 1 represent no risk and 10 very risky, and 3rd
question is
optional about the required actions to be taken for solving the risk of the road.
3.2.1 Literature Review
The main focus of this project is to develop an index for Al Khalidiya road to be compared with
other road in Al Khobar city. A research paper is likely to contain a literature review as one of its
parts. In a research paper, the review of literature used as a foundation and as support for a new
insight that contributes to develop risk assessment for the road. The focus of a literature review,
however, is to summarize and synthesize the arguments and ideas of others without adding new
contributions.
3.2.2 Questionnaires
The data collection has been done as a survey conducted in PMU into two phases, Phase one is
questionnaire for students using the road at a daily basis. Phase two is the feedback from
facilities of PMU, Dammam, KFUPM Universities. In addition, municipality engineers and
decision makers are involved in this questionnaire. As a result, their feedback has taken as a
correction factor for the risk analysis.
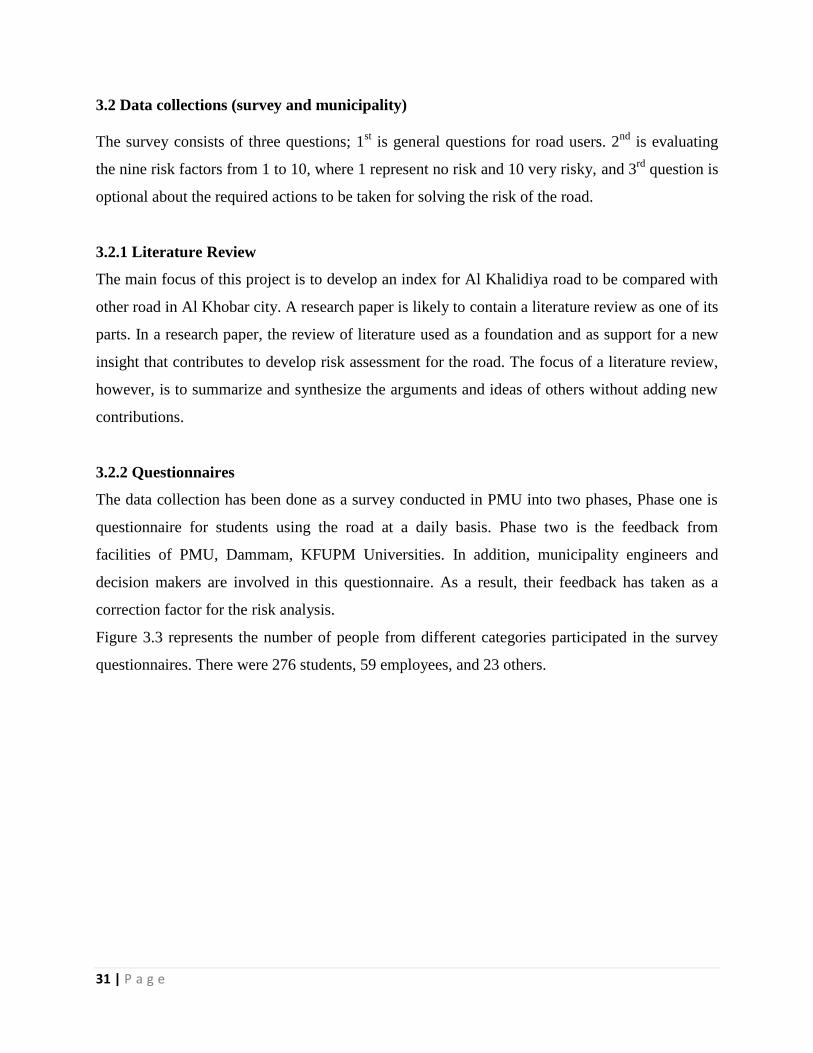
Figure 3.3 represents the number of people from different categories participated in the survey
questionnaires. There were 276 students, 59 employees, and 23 others.
32 | P a g e
Figure 3.2: Survey results
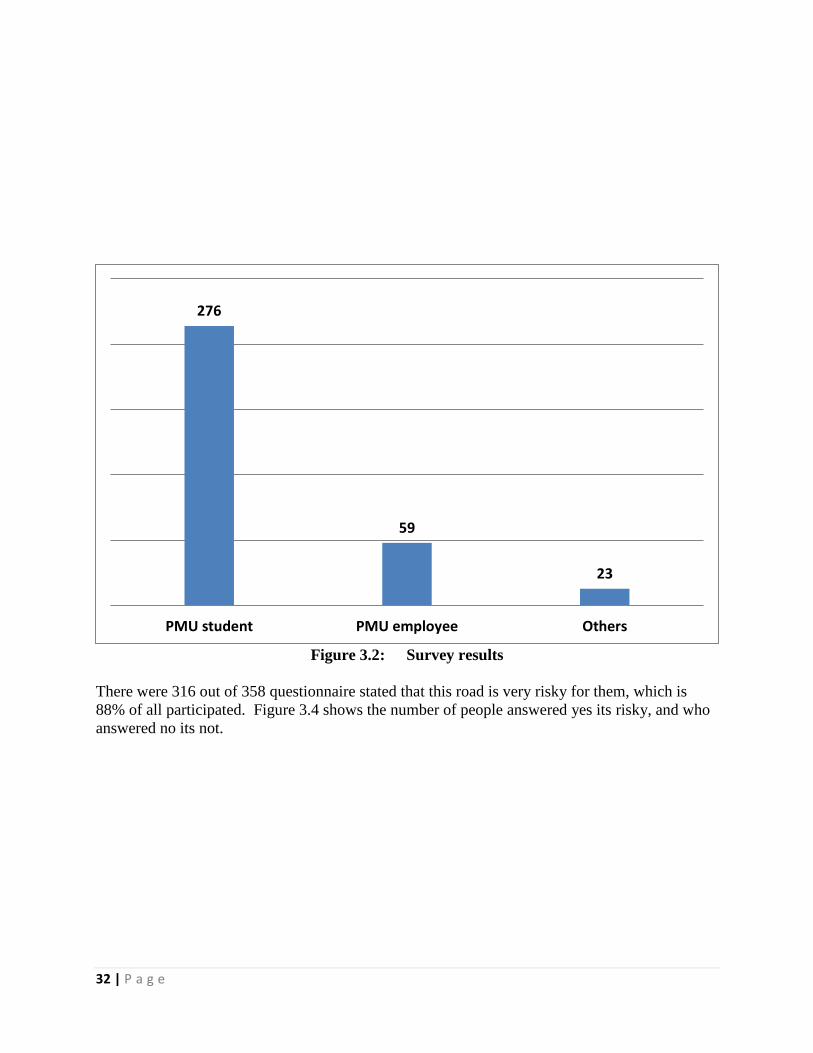
There were 316 out of 358 questionnaire stated that this road is very risky for them, which is
88% of all participated. Figure 3.4 shows the number of people answered yes its risky, and who
answered no its not.
276
59
23
PMU student PMU employee Others
33 | P a g e
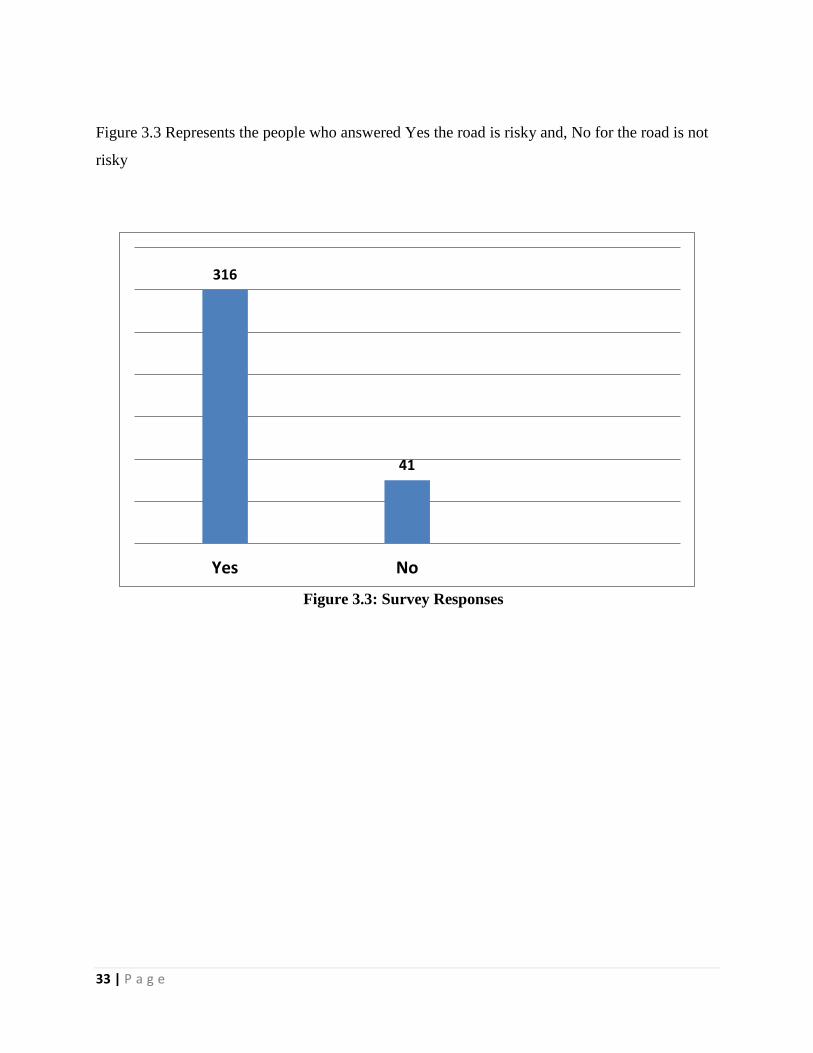
Figure 3.3 Represents the people who answered Yes the road is risky and, No for the road is not
risky
Figure 3.3: Survey Responses
316
41
Yes No
34 | P a g e
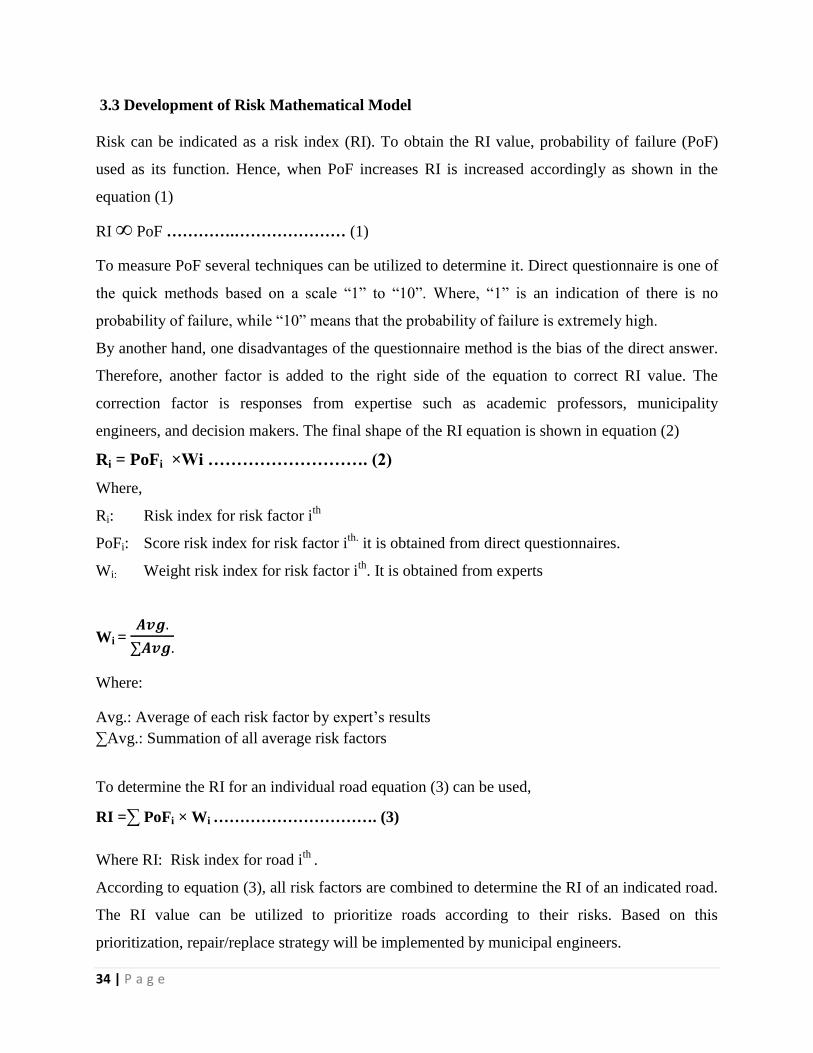
3.3 Development of Risk Mathematical Model
Risk can be indicated as a risk index (RI). To obtain the RI value, probability of failure (PoF)
used as its function. Hence, when PoF increases RI is increased accordingly as shown in the
equation (1)
RI ∞ PoF ………….………………… (1)
To measure PoF several techniques can be utilized to determine it. Direct questionnaire is one of
the quick methods based on a scale “1” to “10”. Where, “1” is an indication of there is no
probability of failure, while “10” means that the probability of failure is extremely high.
By another hand, one disadvantages of the questionnaire method is the bias of the direct answer.
Therefore, another factor is added to the right side of the equation to correct RI value. The
correction factor is responses from expertise such as academic professors, municipality
engineers, and decision makers. The final shape of the RI equation is shown in equation (2)
Ri = PoFi ×Wi ………………………. (2)
Where,
Ri: Risk index for risk factor ith
PoFi: Score risk index for risk factor ith.
it is obtained from direct questionnaires.
Wi: Weight risk index for risk factor ith
. It is obtained from experts
Wi = 𝑨𝒗𝒈.
∑𝑨𝒗𝒈.
Where:
Avg.: Average of each risk factor by expert’s results
∑Avg.: Summation of all average risk factors
To determine the RI for an individual road equation (3) can be used,
RI =∑ PoFi × Wi …………………………. (3)
Where RI: Risk index for road ith
.
According to equation (3), all risk factors are combined to determine the RI of an indicated road.
The RI value can be utilized to prioritize roads according to their risks. Based on this
prioritization, repair/replace strategy will be implemented by municipal engineers.
35 | P a g e
3.4 Model Implementation:
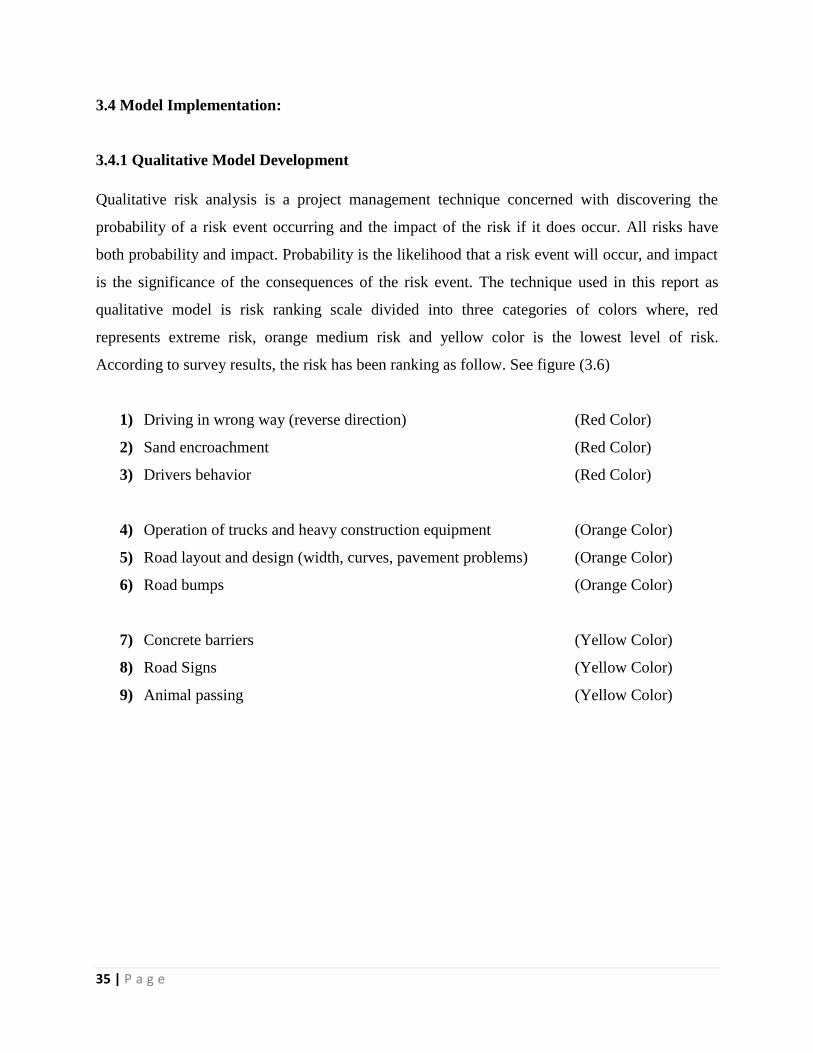
3.4.1 Qualitative Model Development
Qualitative risk analysis is a project management technique concerned with discovering the
probability of a risk event occurring and the impact of the risk if it does occur. All risks have
both probability and impact. Probability is the likelihood that a risk event will occur, and impact
is the significance of the consequences of the risk event. The technique used in this report as
qualitative model is risk ranking scale divided into three categories of colors where, red
represents extreme risk, orange medium risk and yellow color is the lowest level of risk.
According to survey results, the risk has been ranking as follow. See figure (3.6)
1) Driving in wrong way (reverse direction) (Red Color)
2) Sand encroachment (Red Color)
3) Drivers behavior (Red Color)
4) Operation of trucks and heavy construction equipment (Orange Color)
5) Road layout and design (width, curves, pavement problems) (Orange Color)
6) Road bumps (Orange Color)
7) Concrete barriers (Yellow Color)
8) Road Signs (Yellow Color)
9) Animal passing (Yellow Color)
36 | P a g e
3.4.2 Quantitative Model Development
Contains 9 risk factors that make this road one of the most dangerous roads in Eastern province.
Sand, Trucks, Bumps, Concrete barriers, passing animals, drivers exceeds speed limit and its bad
design are the main factors that make this road risky. The above factors are ranked in order to
show how dangerous each one is.
Like any potential hazard, there is influences that can cause a disaster. The effects are divided
into many parts such as, physical, physiological, tolerance, and frequency of existence of the
risk. These effects are implemented into the nine factors of risk in Al Khalidiya road. Each factor
has different effects. The following sections show how these influences affect the nine factors of
risk.
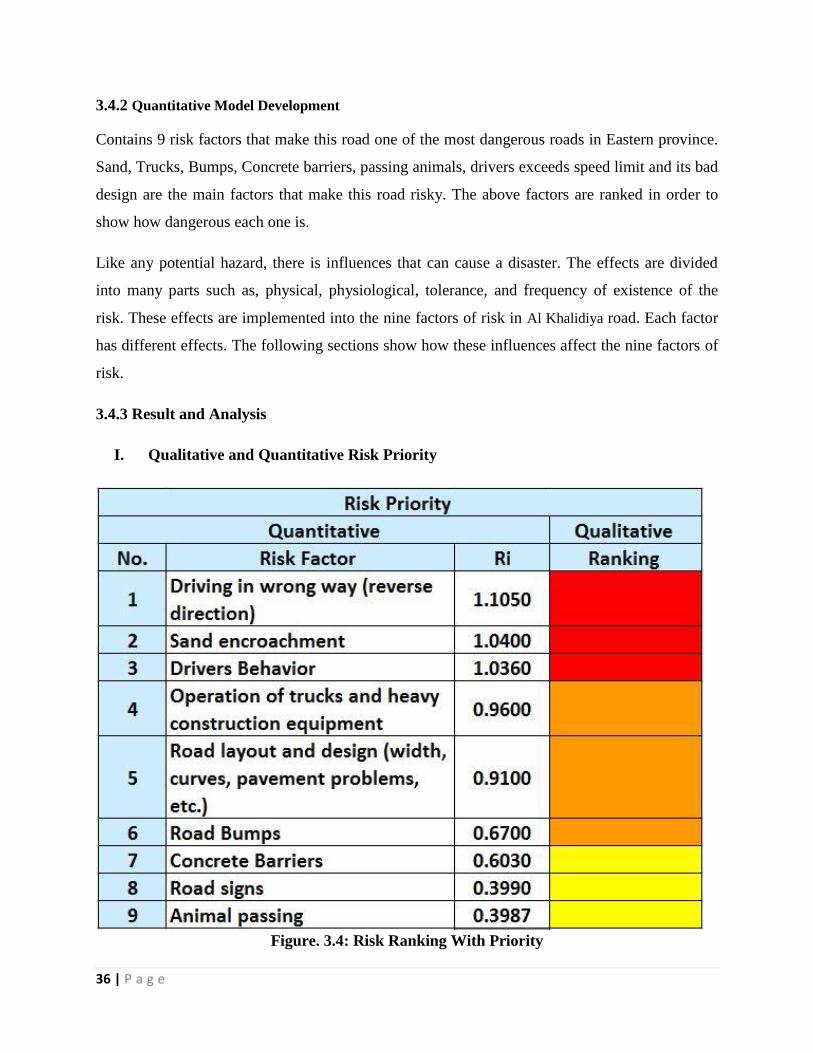
3.4.3 Result and Analysis
I. Qualitative and Quantitative Risk Priority
Figure. 3.4: Risk Ranking With Priority
37 | P a g e
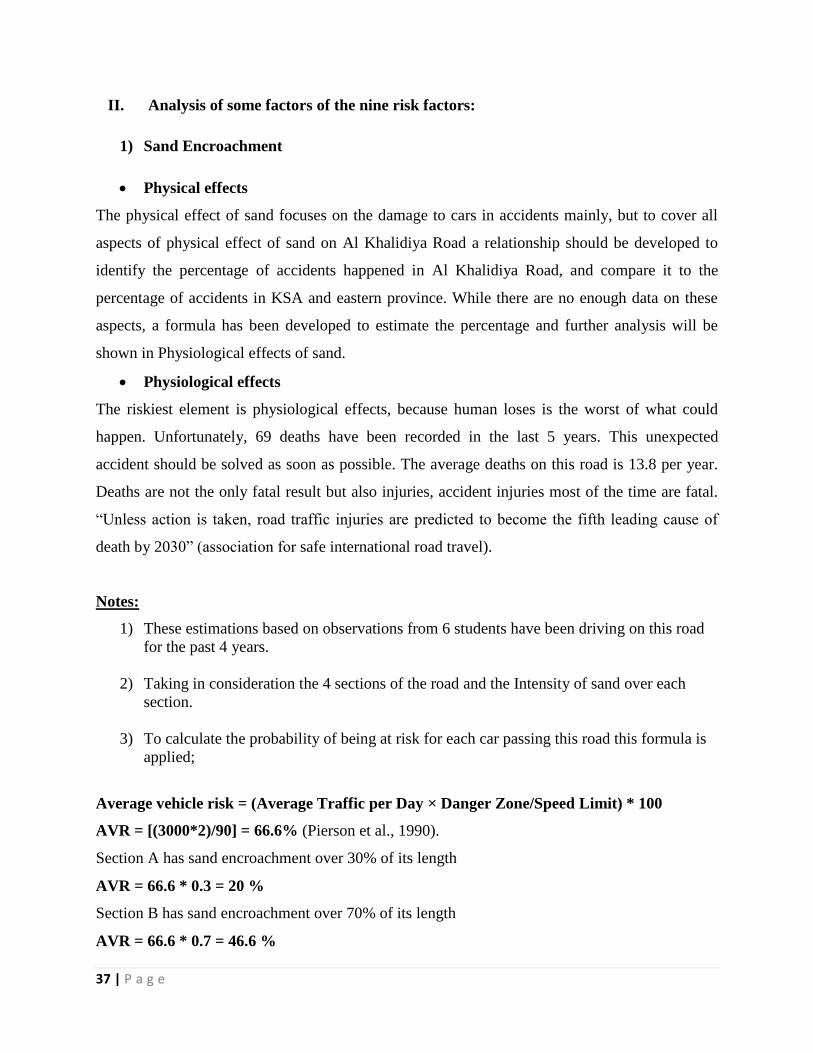
II. Analysis of some factors of the nine risk factors:
1) Sand Encroachment
Physical effects
The physical effect of sand focuses on the damage to cars in accidents mainly, but to cover all
aspects of physical effect of sand on Al Khalidiya Road a relationship should be developed to
identify the percentage of accidents happened in Al Khalidiya Road, and compare it to the
percentage of accidents in KSA and eastern province. While there are no enough data on these
aspects, a formula has been developed to estimate the percentage and further analysis will be
shown in Physiological effects of sand.
Physiological effects
The riskiest element is physiological effects, because human loses is the worst of what could
happen. Unfortunately, 69 deaths have been recorded in the last 5 years. This unexpected
accident should be solved as soon as possible. The average deaths on this road is 13.8 per year.
Deaths are not the only fatal result but also injuries, accident injuries most of the time are fatal.
“Unless action is taken, road traffic injuries are predicted to become the fifth leading cause of
death by 2030” (association for safe international road travel).
Notes:
1) These estimations based on observations from 6 students have been driving on this road
for the past 4 years.
2) Taking in consideration the 4 sections of the road and the Intensity of sand over each
section.
3) To calculate the probability of being at risk for each car passing this road this formula is
applied;
Average vehicle risk = (Average Traffic per Day × Danger Zone/Speed Limit) * 100
AVR = [(3000*2)/90] = 66.6% (Pierson et al., 1990).
Section A has sand encroachment over 30% of its length
AVR = 66.6 * 0.3 = 20 %
Section B has sand encroachment over 70% of its length
AVR = 66.6 * 0.7 = 46.6 %
38 | P a g e
Section C has sand encroachment over 70% of its length
AVR = 66.6 * 0.7 = 46.6 %
Section D has sand encroachment over 50% of its length
AVR = 66.6 * 0.5 = 33.3 %
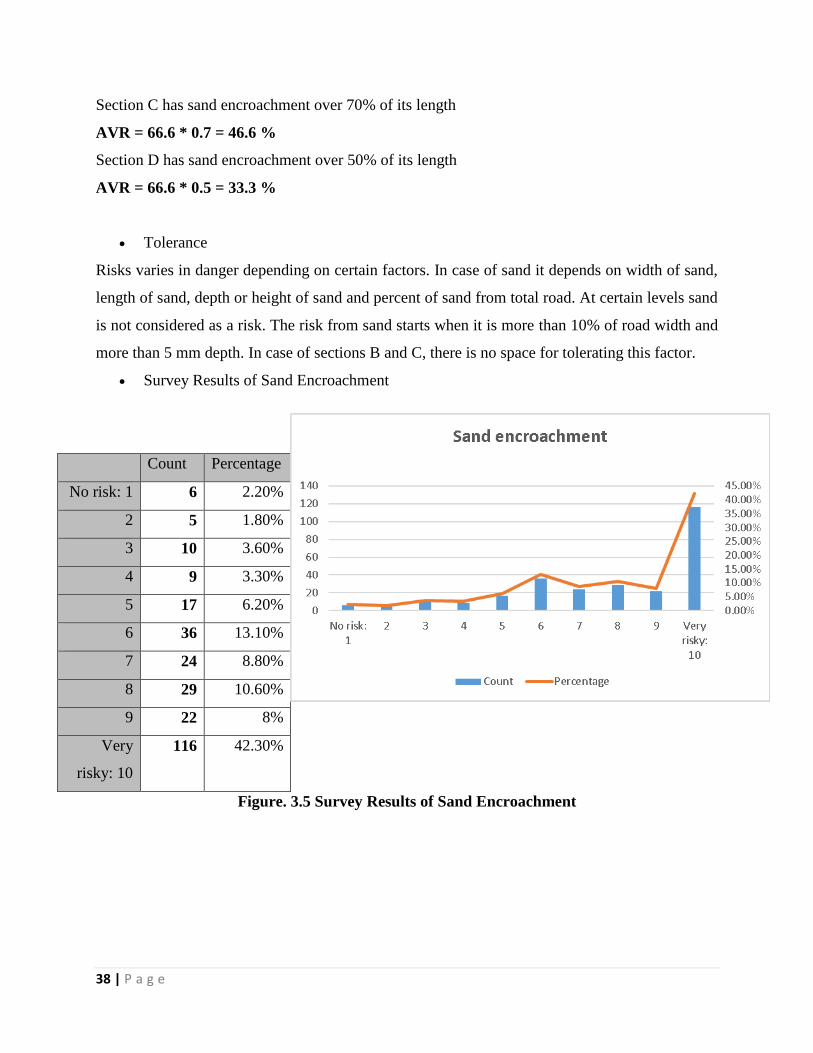
Tolerance
Risks varies in danger depending on certain factors. In case of sand it depends on width of sand,
length of sand, depth or height of sand and percent of sand from total road. At certain levels sand
is not considered as a risk. The risk from sand starts when it is more than 10% of road width and
more than 5 mm depth. In case of sections B and C, there is no space for tolerating this factor.
Survey Results of Sand Encroachment
Count Percentage
No risk: 1 6 2.20%
2 5 1.80%
3 10 3.60%
4 9 3.30%
5 17 6.20%
6 36 13.10%
7 24 8.80%
8 29 10.60%
9 22 8%
Very
risky: 10
116 42.30%
Figure. 3.5 Survey Results of Sand Encroachment
39 | P a g e
Mean of risk level: (1+2+3+4+5+6+7+8+9+10)/10 = 10
Mean of percentage: 100/10 = 10
Variance: (from excel) = 0.014
Standard deviation = 0.118
2) Trucks
Physical effects
The average cost of a fatal crash is over $3 million. The average cost of a large truck crash that
does not involve a death is approximately $62,000. Considering that a huge percent of accidents
caused by trucks involves death shows how much physical damage truck can cause. The worst
thing in this part is that trucks are not allowed to use this road, regardless of how much problems
they can cause.
Frequency analysis
There are a lot of reasons behind accidents caused by trucks. The number of accidents caused by
trucks can be estimated by the frequency and intensity during the normal times on the road Also,
considering the main reasons for trucks accidents which are:
1. Driving in the "No-Zones" -- the areas behind and beside a commercial truck where the
truck driver has limited or zero visibility.
2. Changing lanes abruptly in front of a truck.
3. Maneuvering to the right of a truck that is making a right turn.
4. Merging improperly into traffic, causing a truck to maneuver or brake quickly.
5. Failure to slow down or speed up when a truck begins to change lanes or merge.
6. Unsafe passing, particularly passing with insufficient headway.
7. Passing a truck, then being blown out of position by air turbulence or cross-wind.
8. Pulling into traffic from the roadside in front of a truck without accelerating sufficiently.
9. Driving between large trucks.
10. Abandoning a vehicle in a travel lane, or failing to get a disabled vehicle completely off
the highway and onto the shoulder.

40 | P a g e
Tolerance
In case of trucks, tolerance could be in consideration if the trucks pass the road, which is
almost nonexistent compared to trucks crossing the road. Also, the fact that it is illegal to drive a
truck on this road should eliminate any chance of tolerance.
Risk calculation
In course of one hour, 13 trucks crossed the road. If we estimate the working time for trucks as 6
hours per day as a result it will be concluded that only 80 % of the trucks cross the road per day.
While there is an average of 2000 cars passing in this period, 80 cars per hour will be in risk of a
truck crossing the road.
Survey results for trucks
Count Percentage
No risk: 1 8 2.90%
2 5 1.80%
3 6 2.20%
4 5 1.80%
5 22 8%
6 34 12.40%
7 20 7.30%
8 25 9.10%
9 19 6.90%
Very
risky: 10
130 47.40%
Fig. 3.6 Survey Results For Trucks
41 | P a g e
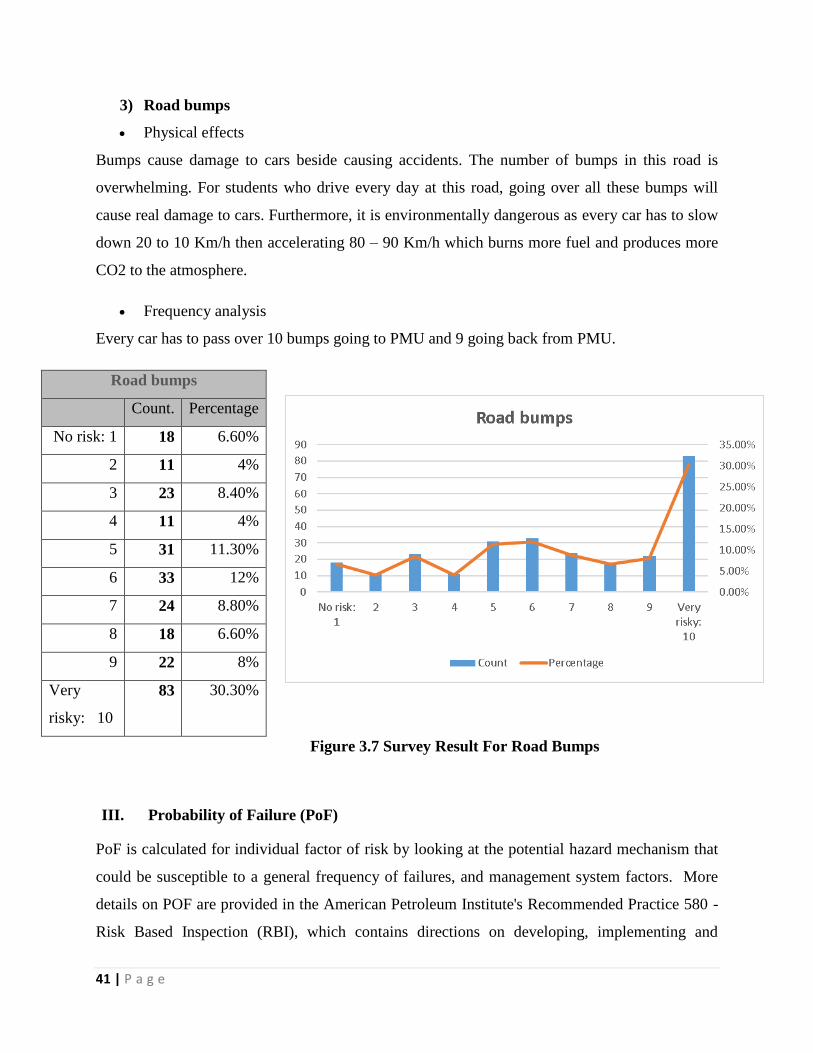
3) Road bumps
Physical effects
Bumps cause damage to cars beside causing accidents. The number of bumps in this road is
overwhelming. For students who drive every day at this road, going over all these bumps will
cause real damage to cars. Furthermore, it is environmentally dangerous as every car has to slow
down 20 to 10 Km/h then accelerating 80 – 90 Km/h which burns more fuel and produces more
CO2 to the atmosphere.
Frequency analysis
Every car has to pass over 10 bumps going to PMU and 9 going back from PMU.
Road bumps
Count. Percentage
No risk: 1 18 6.60%
2 11 4%
3 23 8.40%
4 11 4%
5 31 11.30%
6 33 12%
7 24 8.80%
8 18 6.60%
9 22 8%
Very
risky: 10
83 30.30%
Figure 3.7 Survey Result For Road Bumps
III. Probability of Failure (PoF)
PoF is calculated for individual factor of risk by looking at the potential hazard mechanism that
could be susceptible to a general frequency of failures, and management system factors. More
details on POF are provided in the American Petroleum Institute's Recommended Practice 580 -
Risk Based Inspection (RBI), which contains directions on developing, implementing and
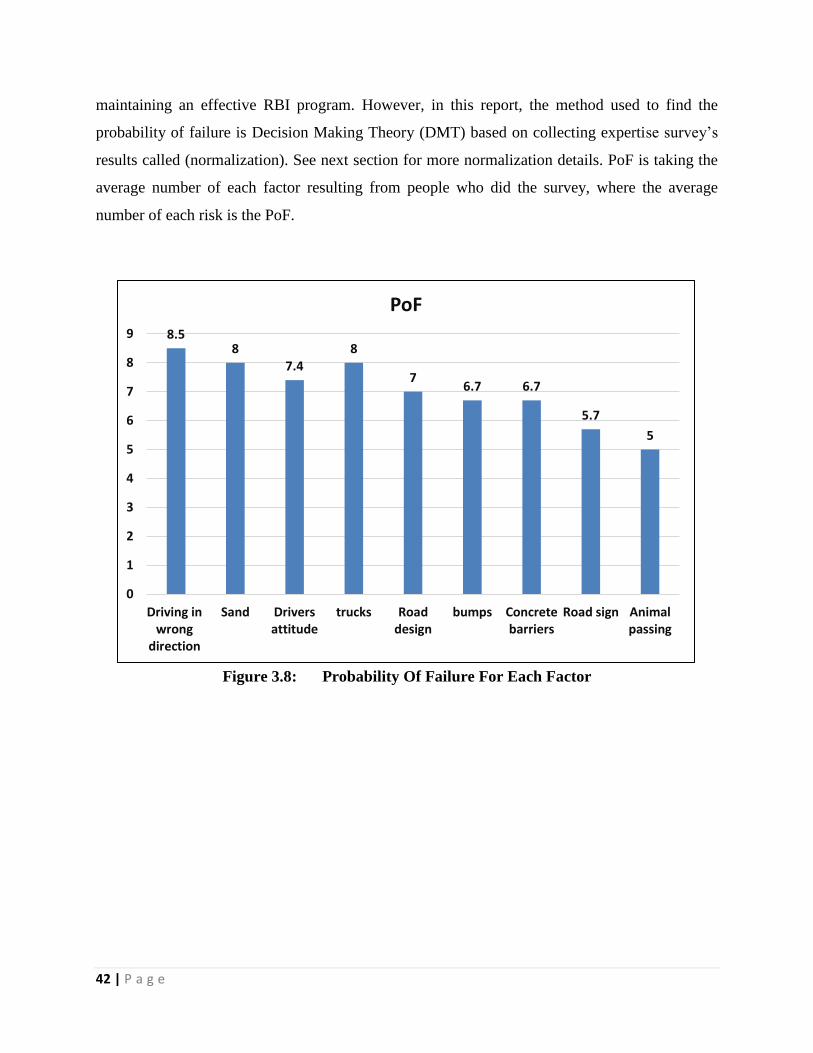
42 | P a g e
maintaining an effective RBI program. However, in this report, the method used to find the
probability of failure is Decision Making Theory (DMT) based on collecting expertise survey’s
results called (normalization). See next section for more normalization details. PoF is taking the
average number of each factor resulting from people who did the survey, where the average
number of each risk is the PoF.
Figure 3.8: Probability Of Failure For Each Factor
8.5 8
7.4 8
7 6.7 6.7
5.7
5
0
1
2
3
4
5
6
7
8
9
Driving inwrong
direction
Sand Driversattitude
trucks Roaddesign
bumps Concretebarriers
Road sign Animalpassing
PoF
CHAPTER 3
43 | P a g e
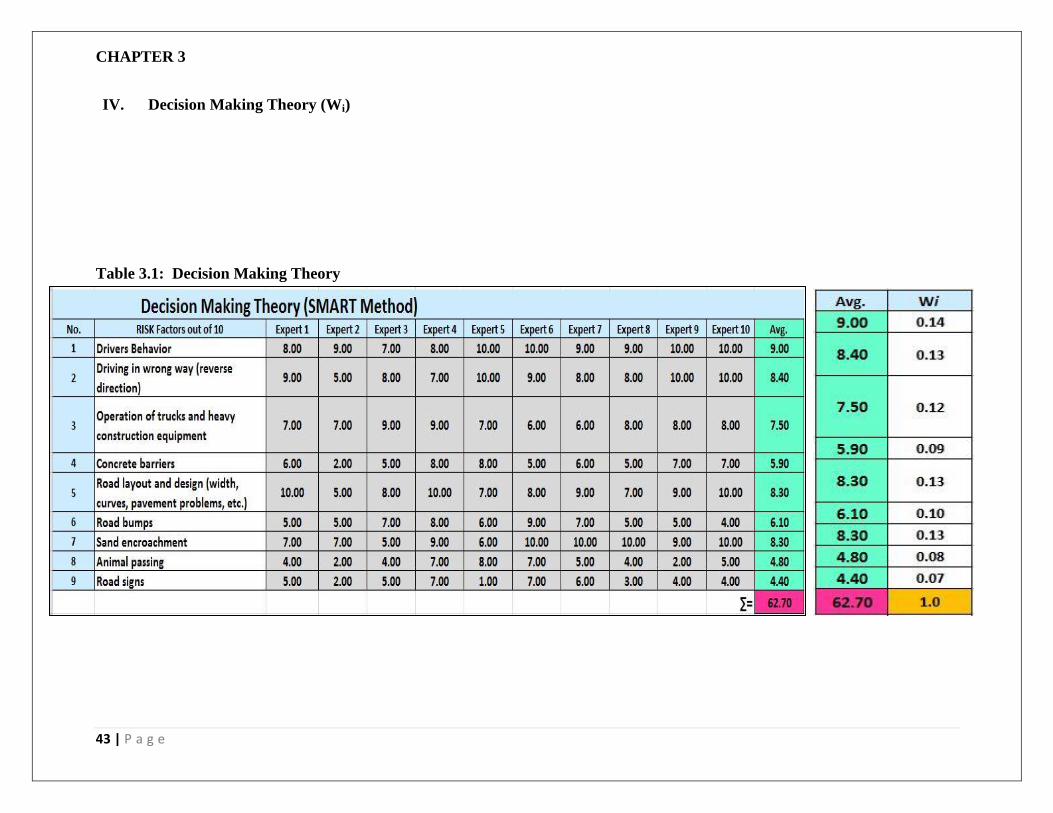
IV. Decision Making Theory (Wi)
Table 3.1: Decision Making Theory
44 | P a g e
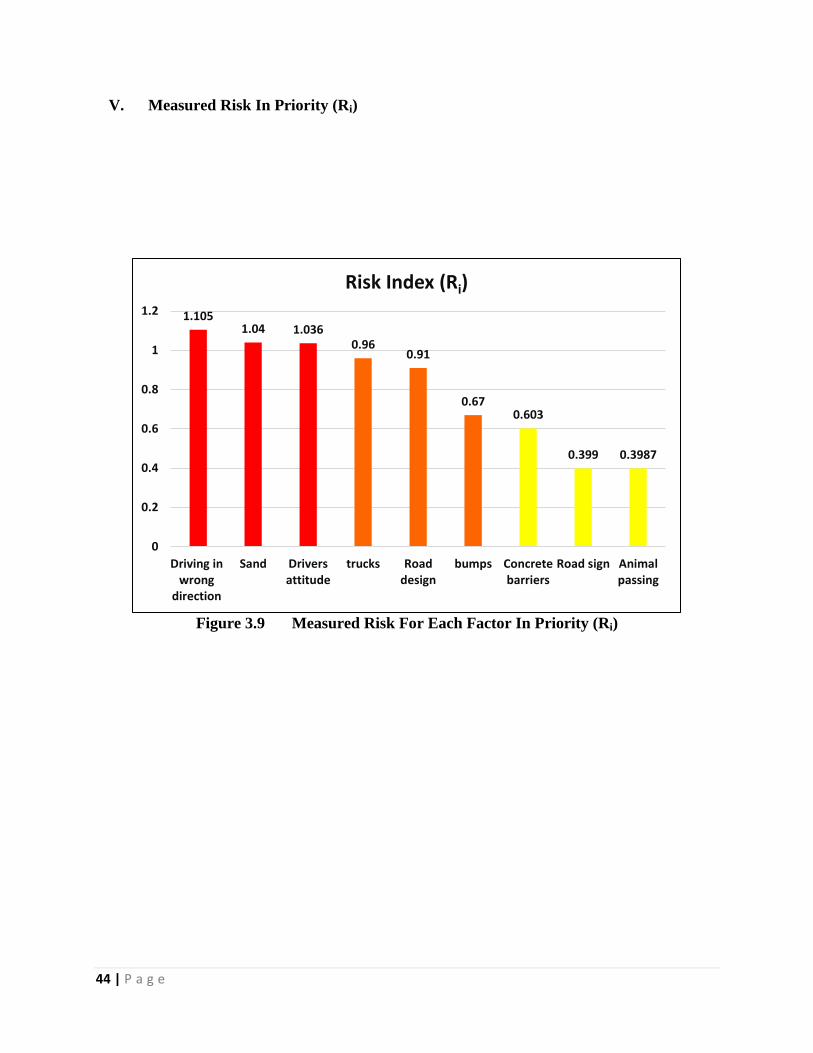
V. Measured Risk In Priority (Ri)
Figure 3.9 Measured Risk For Each Factor In Priority (Ri)
1.105 1.04 1.036
0.96 0.91
0.67 0.603
0.399 0.3987
0
0.2
0.4
0.6
0.8
1
1.2
Driving inwrong
direction
Sand Driversattitude
trucks Roaddesign
bumps Concretebarriers
Road sign Animalpassing
Risk Index (Ri)
45 | P a g e
4.1 Risk Responses
After analyzing and discussing the risks faced Al Khalidiya road, supposed to have responses for
those risks. The following list is the suggested solutions for the road and it will be discussed in
details in this section with safety and cost wise.
The below is the list of the risk factors ranked from high to low.
4.1 Driving in wrong way (Reverse direction).
4.2 Operations of trucks and heavy construction equipment’s.
4.3 Driver behaviors.
4.4 Road layout and design (width, curves, pavement problems and etc).
4.5 Sand encroachment.
4.6 Road bumps.
4.7 Concrete barriers.
4.8 Animal passing.
4.9 Road signs.
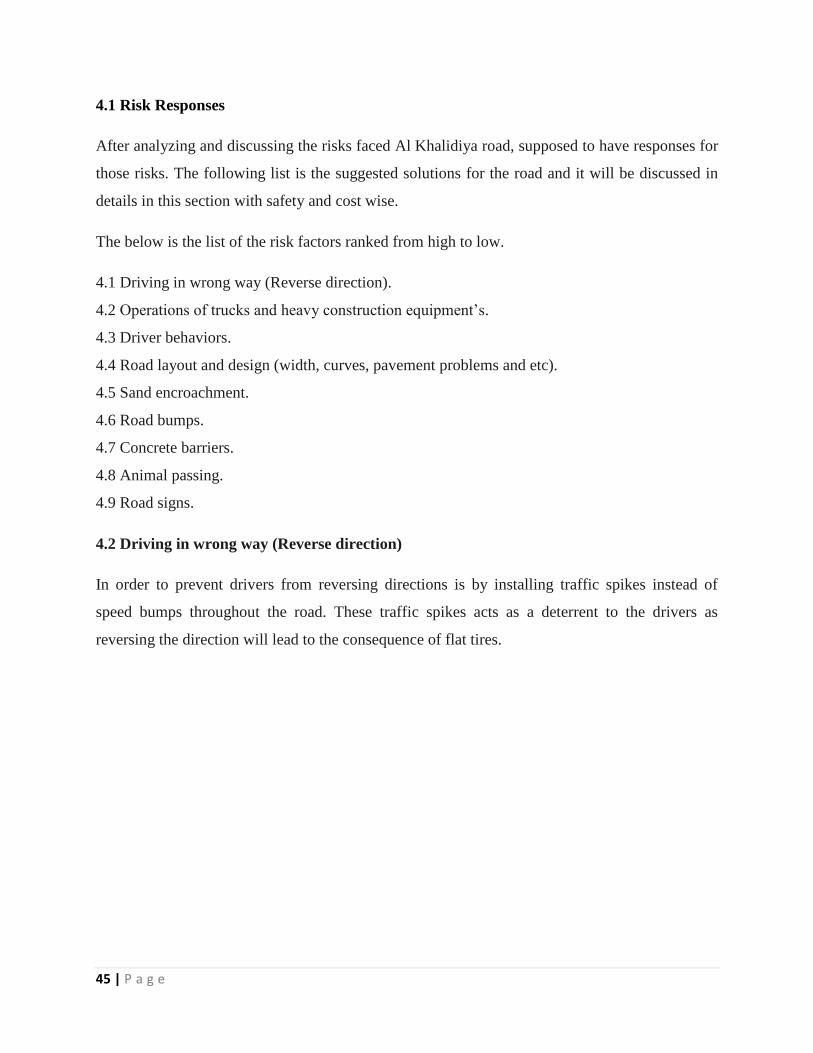
4.2 Driving in wrong way (Reverse direction)
In order to prevent drivers from reversing directions is by installing traffic spikes instead of
speed bumps throughout the road. These traffic spikes acts as a deterrent to the drivers as
reversing the direction will lead to the consequence of flat tires.
46 | P a g e
Figure 4.1: Traffic Spikes - Secure Lane LLC (Christine 2013)
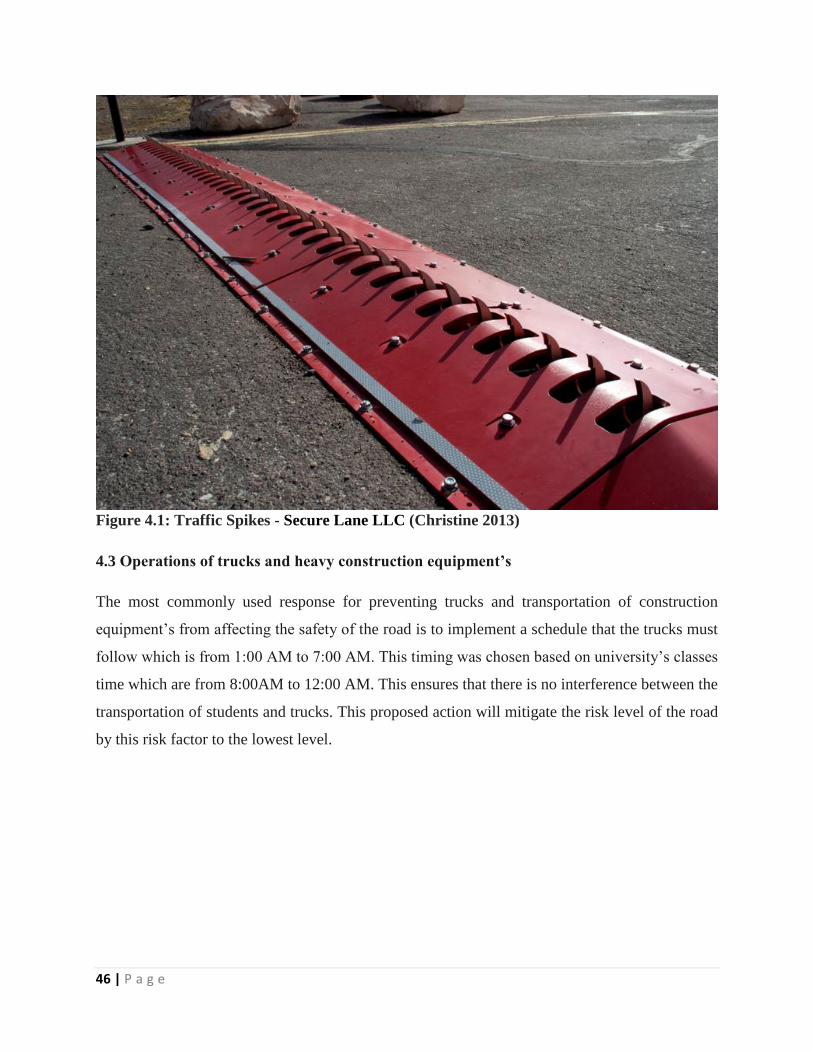
4.3 Operations of trucks and heavy construction equipment’s
The most commonly used response for preventing trucks and transportation of construction
equipment’s from affecting the safety of the road is to implement a schedule that the trucks must
follow which is from 1:00 AM to 7:00 AM. This timing was chosen based on university’s classes
time which are from 8:00AM to 12:00 AM. This ensures that there is no interference between the
transportation of students and trucks. This proposed action will mitigate the risk level of the road
by this risk factor to the lowest level.
47 | P a g e
4.4 Driver behaviors
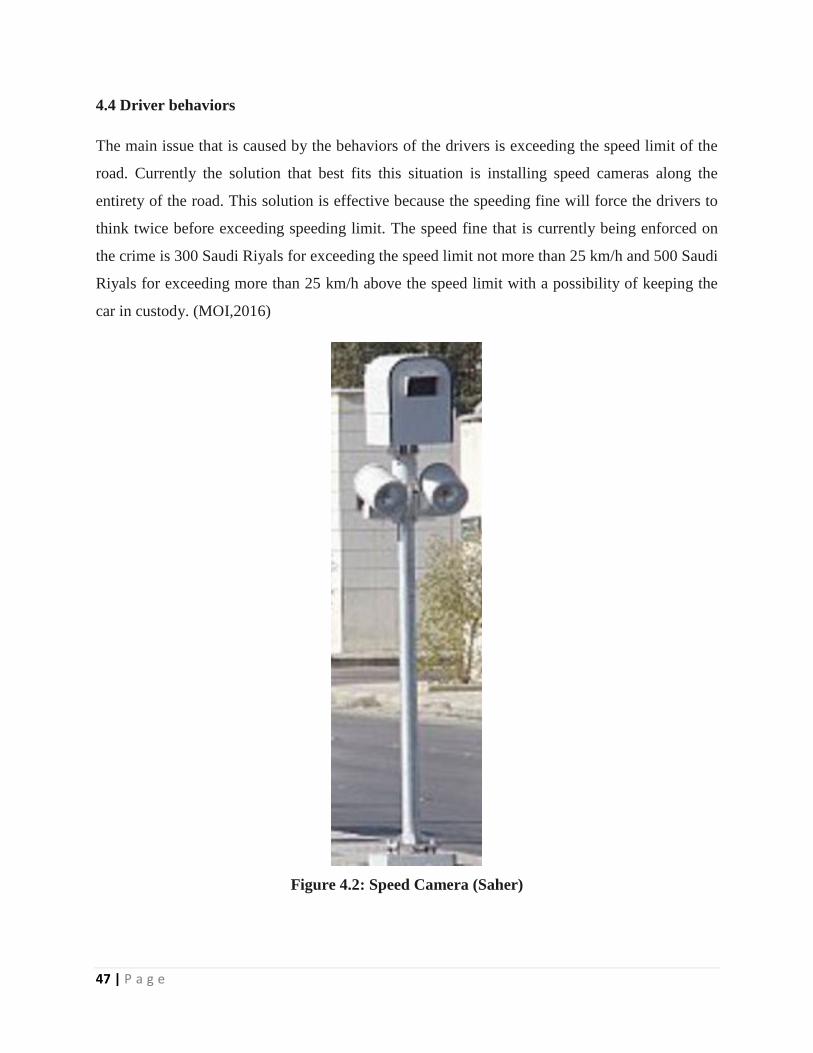
The main issue that is caused by the behaviors of the drivers is exceeding the speed limit of the
road. Currently the solution that best fits this situation is installing speed cameras along the
entirety of the road. This solution is effective because the speeding fine will force the drivers to
think twice before exceeding speeding limit. The speed fine that is currently being enforced on
the crime is 300 Saudi Riyals for exceeding the speed limit not more than 25 km/h and 500 Saudi
Riyals for exceeding more than 25 km/h above the speed limit with a possibility of keeping the
car in custody. (MOI,2016)
Figure 4.2: Speed Camera (Saher)
48 | P a g e
4.5 Road layout and design (width, curves, pavement problems and etc.)
4.5.1 As Built Drawings
Introduction:
Unlike roads used by the general public, Al Khalidiya road is a secondary road which gives
access to the area in the process of exploitation, merging into the main road. In exceptional
circumstances, this secondary road can carry traffic required by the general needs of exploitation
(students, transport of equipment, heavy construction equipment, trucks, etc.). Thus, this road
should be maintaining in advance so that the provided services will be acceptable.
This section is comparing Al Khalidiya road with proposed plan for Al Khalidiya road done by
Ministry of Municipality of Rural and Affairs. Where, Al Khalidiya does not fit most of
standards requirements of streets in Saudi Arabia according to American Association of State
Highway and Transportation Officials (AASHTO) standard. Therefore, the following details
showing the standards and criteria have to be done in Al Khalidiya road to meet the safety and
security standard:
Pavement Design and Layers:
Standard of pavement Design and Layers
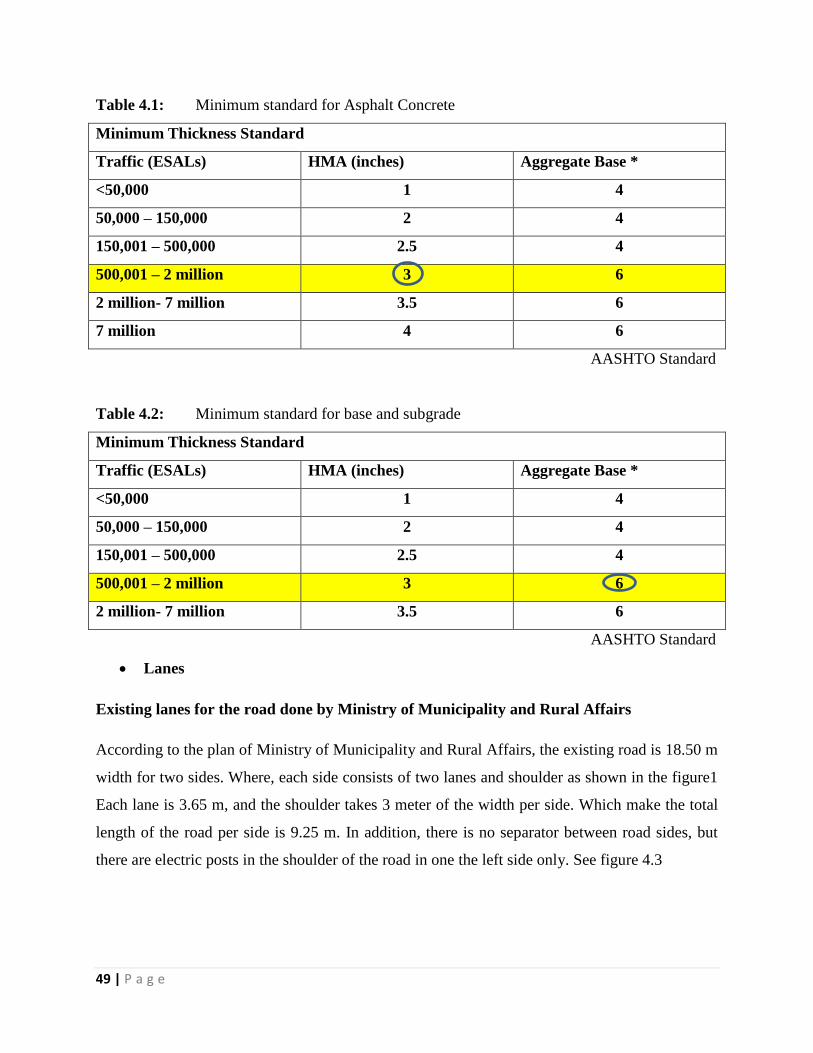
Like any street, the pavement design must contain three layers; (1) Asphalt/concrete
(2) Aggregate base, (3) Subgrade. According to minimum thickness standard for base and
subgrade. All of the layers full fit the standards. See tables (1 & 2)
49 | P a g e
Table 4.1: Minimum standard for Asphalt Concrete
Minimum Thickness Standard
Traffic (ESALs) HMA (inches) Aggregate Base *
<50,000 1 4
50,000 – 150,000 2 4
150,001 – 500,000 2.5 4
500,001 – 2 million 3 6
2 million- 7 million 3.5 6
7 million 4 6
AASHTO Standard
Table 4.2: Minimum standard for base and subgrade
Minimum Thickness Standard
Traffic (ESALs) HMA (inches) Aggregate Base *
<50,000 1 4
50,000 – 150,000 2 4
150,001 – 500,000 2.5 4
500,001 – 2 million 3 6
2 million- 7 million 3.5 6
AASHTO Standard
Lanes
Existing lanes for the road done by Ministry of Municipality and Rural Affairs
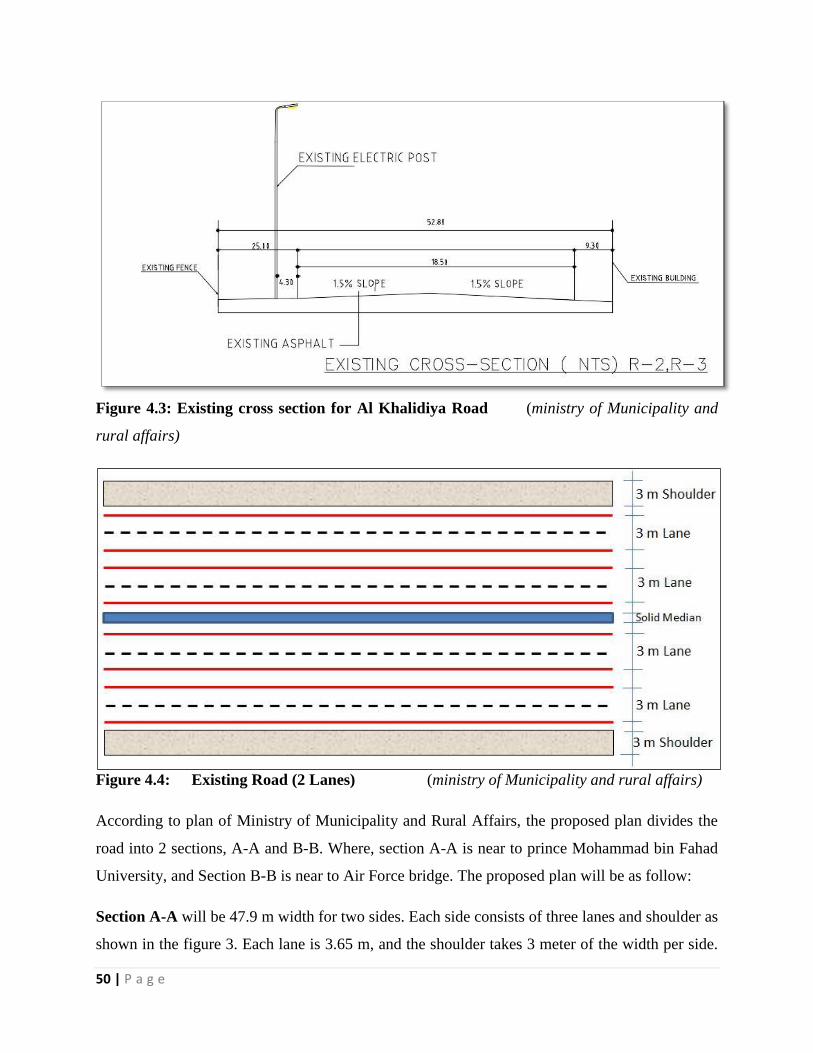
According to the plan of Ministry of Municipality and Rural Affairs, the existing road is 18.50 m
width for two sides. Where, each side consists of two lanes and shoulder as shown in the figure1
Each lane is 3.65 m, and the shoulder takes 3 meter of the width per side. Which make the total
length of the road per side is 9.25 m. In addition, there is no separator between road sides, but
there are electric posts in the shoulder of the road in one the left side only. See figure 4.3
50 | P a g e
Figure 4.3: Existing cross section for Al Khalidiya Road (ministry of Municipality and
rural affairs)
Figure 4.4: Existing Road (2 Lanes) (ministry of Municipality and rural affairs)
According to plan of Ministry of Municipality and Rural Affairs, the proposed plan divides the
road into 2 sections, A-A and B-B. Where, section A-A is near to prince Mohammad bin Fahad
University, and Section B-B is near to Air Force bridge. The proposed plan will be as follow:
Section A-A will be 47.9 m width for two sides. Each side consists of three lanes and shoulder as
shown in the figure 3. Each lane is 3.65 m, and the shoulder takes 3 meter of the width per side.
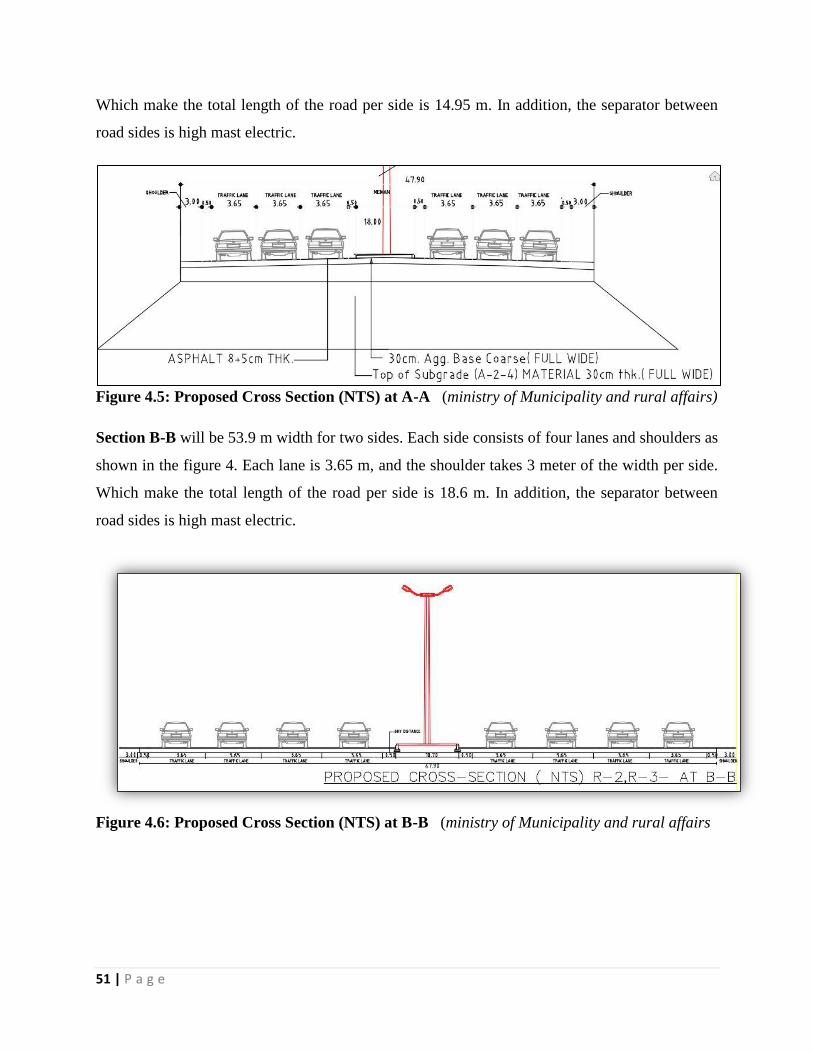
51 | P a g e
Which make the total length of the road per side is 14.95 m. In addition, the separator between
road sides is high mast electric.
Figure 4.5: Proposed Cross Section (NTS) at A-A (ministry of Municipality and rural affairs)
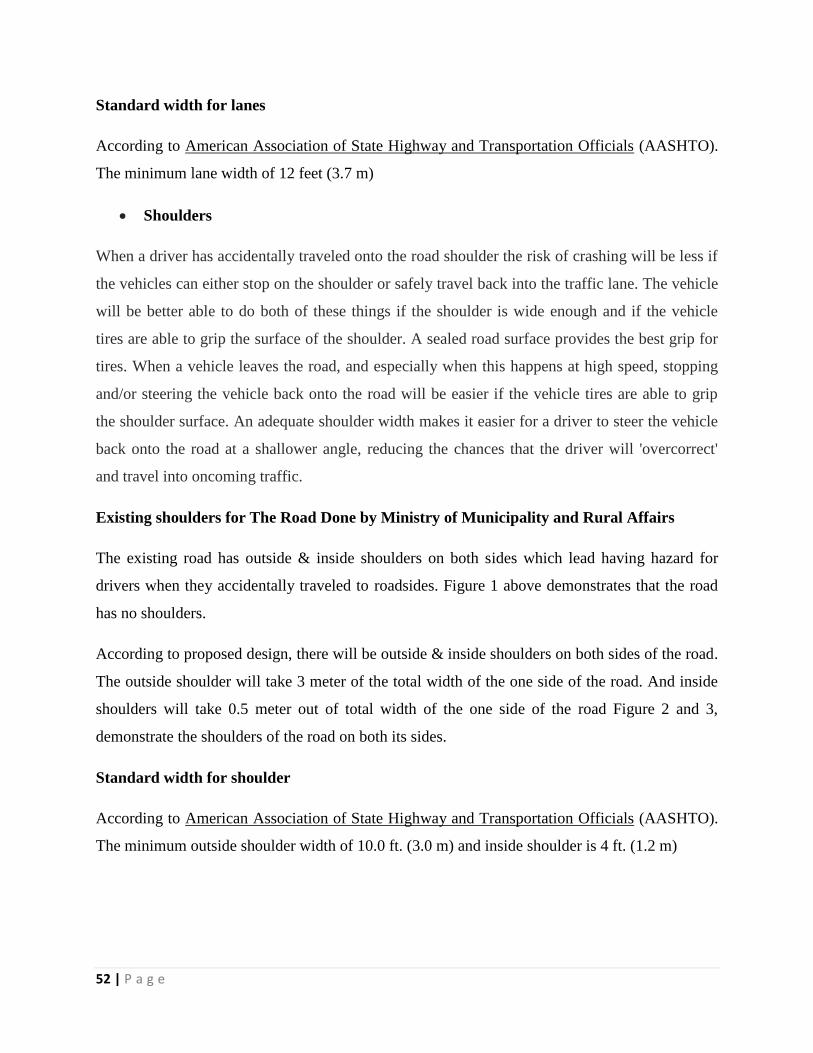
Section B-B will be 53.9 m width for two sides. Each side consists of four lanes and shoulders as
shown in the figure 4. Each lane is 3.65 m, and the shoulder takes 3 meter of the width per side.
Which make the total length of the road per side is 18.6 m. In addition, the separator between
road sides is high mast electric.
Figure 4.6: Proposed Cross Section (NTS) at B-B (ministry of Municipality and rural affairs
52 | P a g e
Standard width for lanes
According to American Association of State Highway and Transportation Officials (AASHTO).
The minimum lane width of 12 feet (3.7 m)
Shoulders
When a driver has accidentally traveled onto the road shoulder the risk of crashing will be less if
the vehicles can either stop on the shoulder or safely travel back into the traffic lane. The vehicle
will be better able to do both of these things if the shoulder is wide enough and if the vehicle
tires are able to grip the surface of the shoulder. A sealed road surface provides the best grip for
tires. When a vehicle leaves the road, and especially when this happens at high speed, stopping
and/or steering the vehicle back onto the road will be easier if the vehicle tires are able to grip
the shoulder surface. An adequate shoulder width makes it easier for a driver to steer the vehicle
back onto the road at a shallower angle, reducing the chances that the driver will 'overcorrect'
and travel into oncoming traffic.
Existing shoulders for The Road Done by Ministry of Municipality and Rural Affairs
The existing road has outside & inside shoulders on both sides which lead having hazard for
drivers when they accidentally traveled to roadsides. Figure 1 above demonstrates that the road
has no shoulders.
According to proposed design, there will be outside & inside shoulders on both sides of the road.
The outside shoulder will take 3 meter of the total width of the one side of the road. And inside
shoulders will take 0.5 meter out of total width of the one side of the road Figure 2 and 3,
demonstrate the shoulders of the road on both its sides.
Standard width for shoulder
According to American Association of State Highway and Transportation Officials (AASHTO).
The minimum outside shoulder width of 10.0 ft. (3.0 m) and inside shoulder is 4 ft. (1.2 m)
53 | P a g e
Median of the road
Road median is the portion in between the dual carriageway which separates the traffic flow in
opposite direction. There are three types of road median: (1) Travelable median on which
vehicles can move in case of emergency, this type of median was in the road before Municipality
of Eastern Province of Saudi Arabia allocate concrete barriers as a median for the road. (2)
Barrier median on which vehicles cannot approach is known as barrier median. It is made up of
concrete or steel. It currently exists in the road by Municipality of Eastern Province (2016). (3)
Deterring median which is artificial median which may be removed in case of any emergency.
Existing Median for the Road Done by Ministry of Municipality and Rural Affairs
Currently, the existing road median is concrete barriers. But these barriers caused hazard for the
drivers because it can accumulate sands surrounding the road area. It takes 0.55 meter of the road
width. Does not fit AASHTO standard.
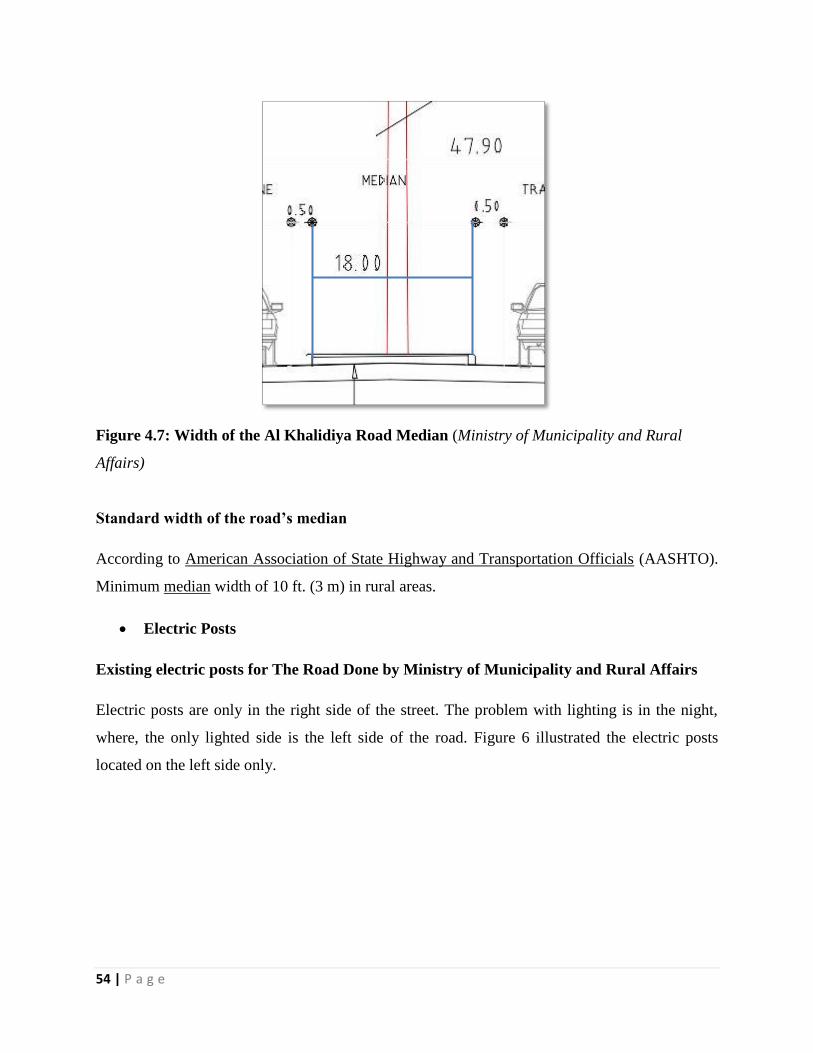
The Median used to separate the directions of the road. According to plan of Ministry of
Municipality and Rural Affairs the width of the road median is 18 m. fit the AASHTO standard.
See figure 4.7
54 | P a g e
Figure 4.7: Width of the Al Khalidiya Road Median (Ministry of Municipality and Rural
Affairs)
Standard width of the road’s median
According to American Association of State Highway and Transportation Officials (AASHTO).
Minimum median width of 10 ft. (3 m) in rural areas.
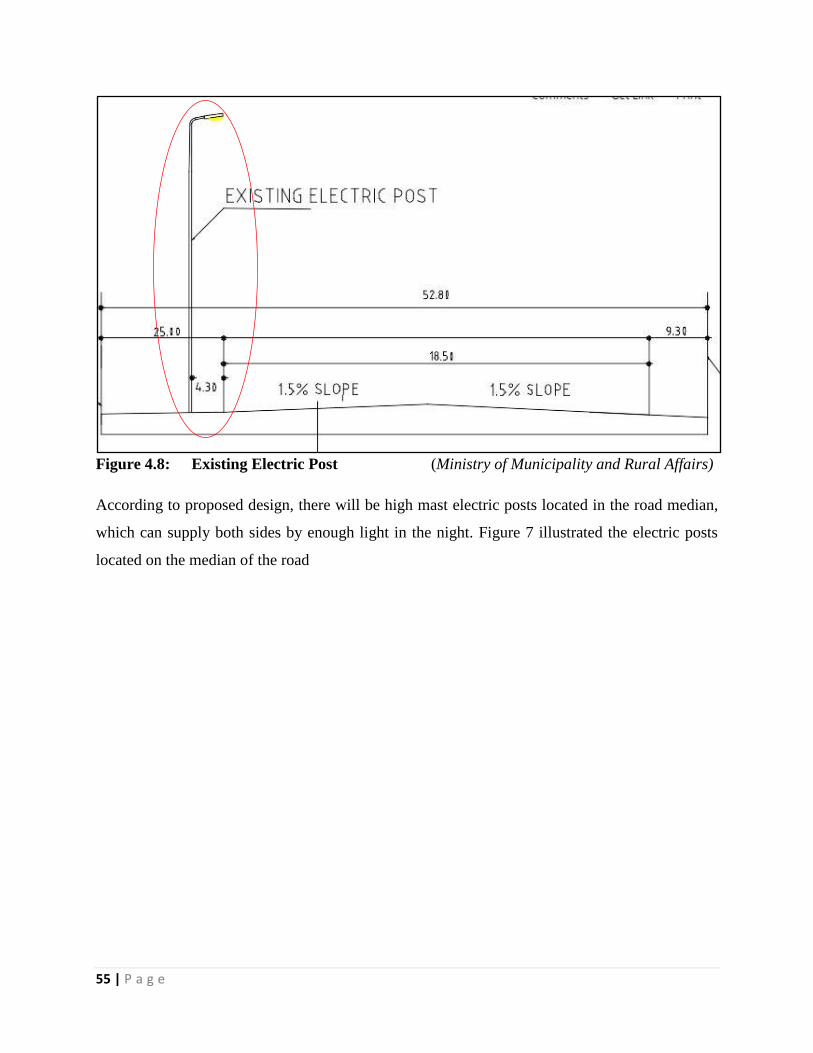
Electric Posts
Existing electric posts for The Road Done by Ministry of Municipality and Rural Affairs
Electric posts are only in the right side of the street. The problem with lighting is in the night,
where, the only lighted side is the left side of the road. Figure 6 illustrated the electric posts
located on the left side only.
55 | P a g e
Figure 4.8: Existing Electric Post (Ministry of Municipality and Rural Affairs)
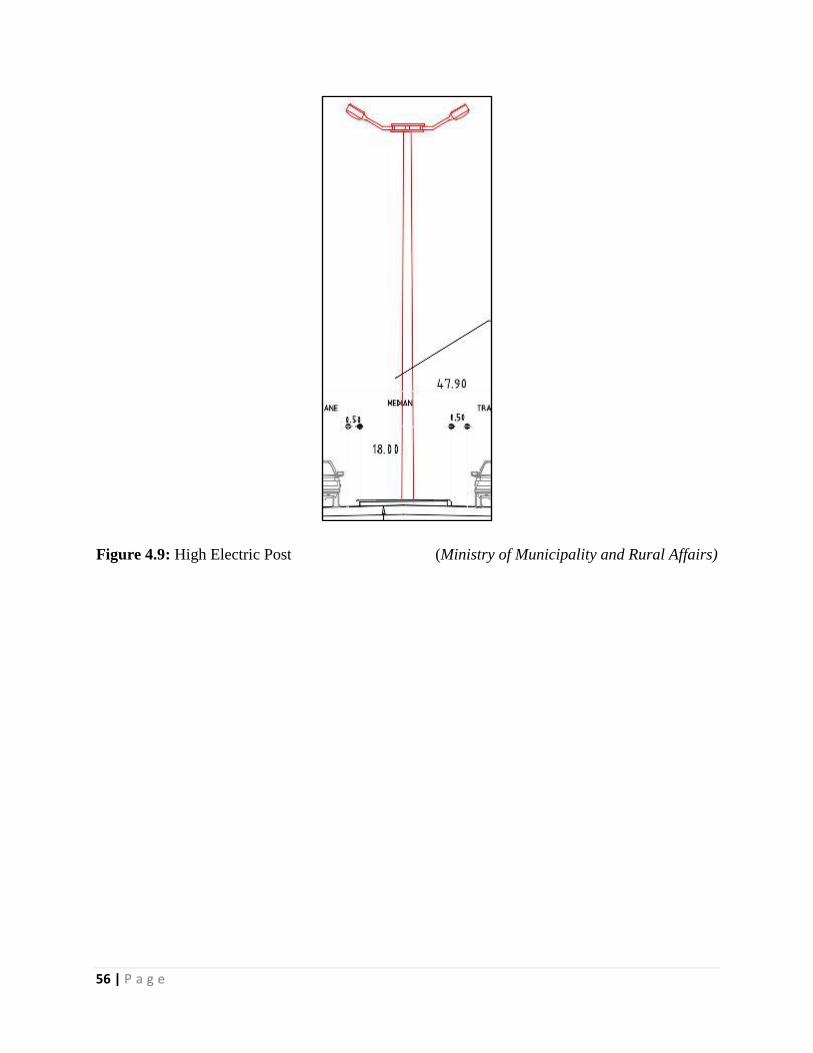
According to proposed design, there will be high mast electric posts located in the road median,
which can supply both sides by enough light in the night. Figure 7 illustrated the electric posts
located on the median of the road
56 | P a g e
Figure 4.9: High Electric Post (Ministry of Municipality and Rural Affairs)
57 | P a g e
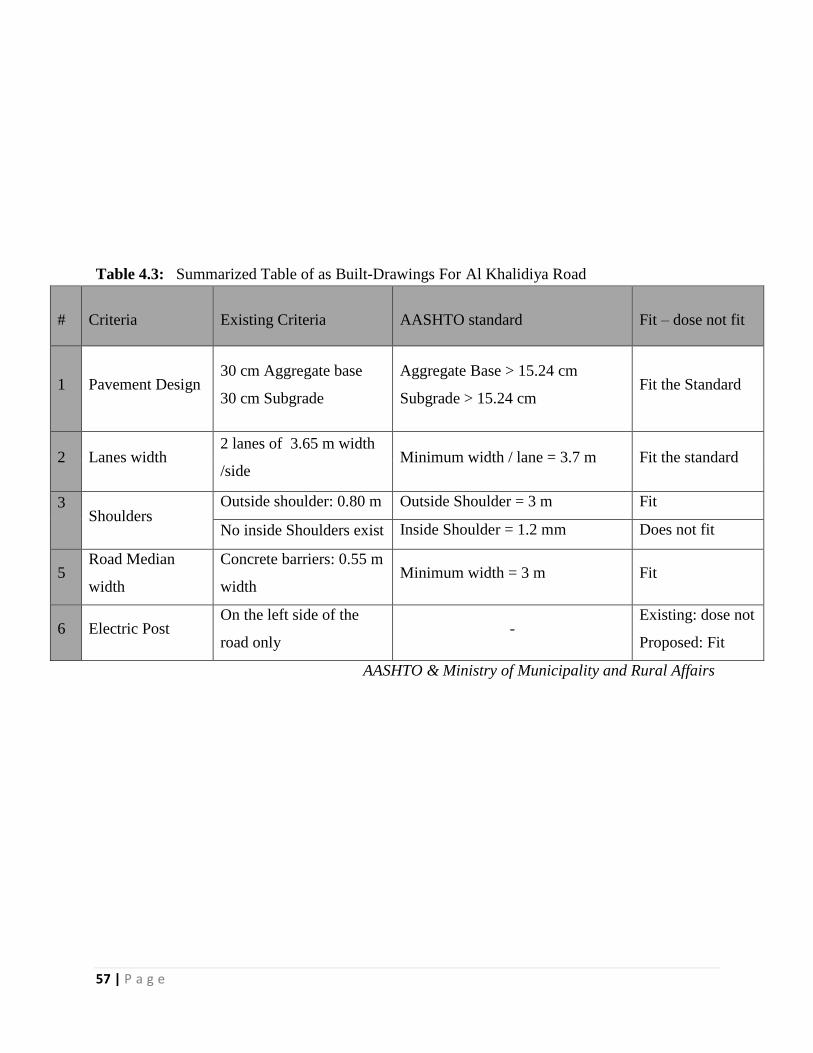
Table 4.3: Summarized Table of as Built-Drawings For Al Khalidiya Road
# Criteria Existing Criteria AASHTO standard Fit – dose not fit
1 Pavement Design 30 cm Aggregate base
30 cm Subgrade
Aggregate Base > 15.24 cm
Subgrade > 15.24 cm Fit the Standard
2 Lanes width 2 lanes of 3.65 m width
/side Minimum width / lane = 3.7 m Fit the standard
3
Shoulders
Outside shoulder: 0.80 m Outside Shoulder = 3 m Fit
No inside Shoulders exist Inside Shoulder = 1.2 mm Does not fit
5 Road Median
width
Concrete barriers: 0.55 m
width Minimum width = 3 m Fit
6 Electric Post On the left side of the
road only -
Existing: dose not
Proposed: Fit
AASHTO & Ministry of Municipality and Rural Affairs
58 | P a g e
4.6 Sand Encroachment
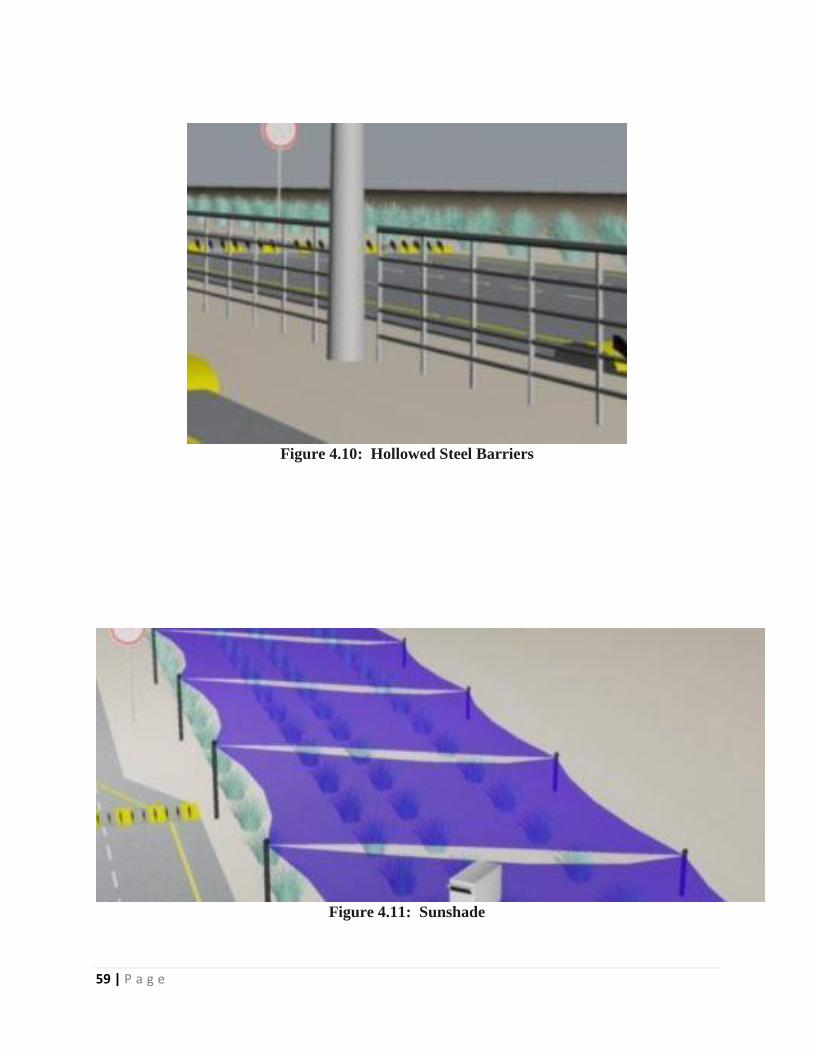
The recommended response for the sand encroachment is subdivided into four parts.
The first part is installing hollowed steel barriers which will immediately after installing allow
the sand to pass from one side to another to prevent sand from accumulating at the barriers see
figure 4.10. The second part is installing sunshade alongside the road with slope see figure 4.11
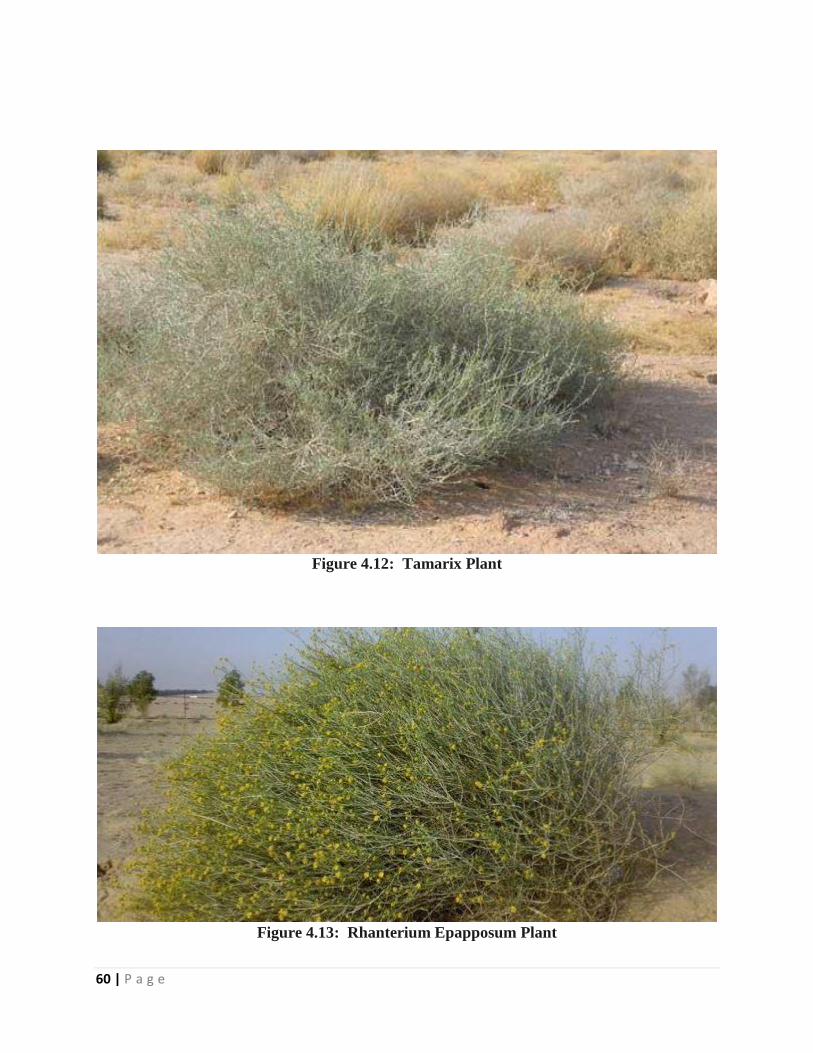
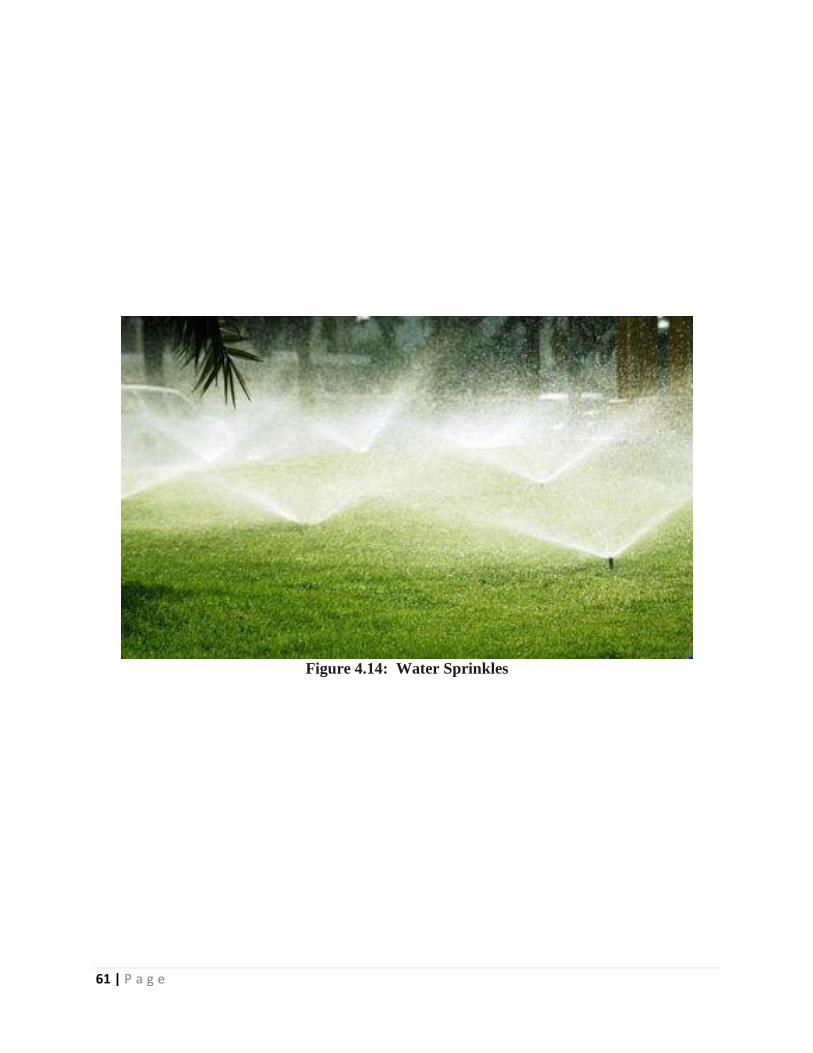
The third part is planting trees alongside the road to stop the sand from encroaching see figures
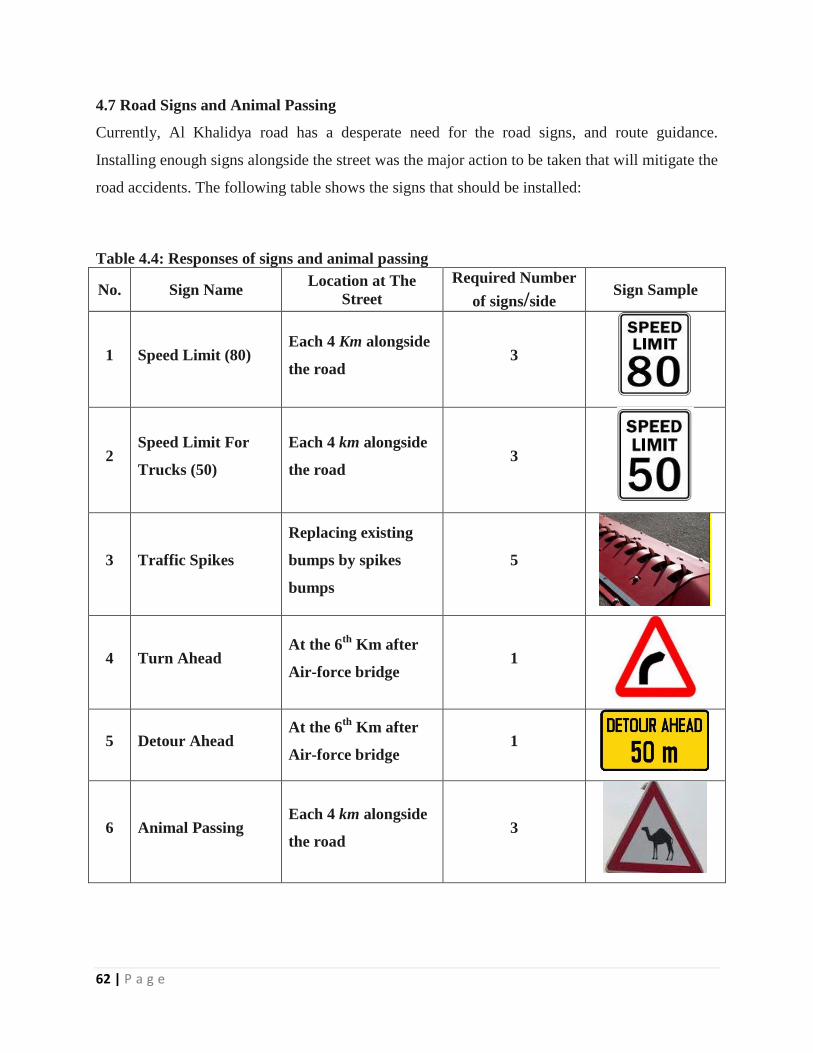
4.12, 4.13. The fourth part is installing sprinkles that irrigate the plants. The aim of this sprinkles
is when they start flowing vertically, as a result the water spray will drop immediately downward
moistening the sand and mitigate encroachment. See figure 4.14
There are two proposed suggestions regarding different kinds of tress:
1. Tamarix plant kwon as Al Athel, it is a desert plant that mainly used in the desert roads
especially in Saudi Arabia to prevent sand encroaching by the street. Installing water
sprinkles between the plants will as well solution for stopping sand encroaching where it
will moist the sand then no sand will be encroaching by the street see figure 4.12
2. Rhanterium Epapposum plant known as is one of the plants that exists frequently in the
desert areas although it is exposed to hunting, and uprooting. Due do that actions, the
number of this plant is decreased significantly. Moreover, this plants grow in a sandy,
coherent, and fertile soil. This plant can be found mostly in Saudi Arabia, and Kuwait.
See figure 4.13
59 | P a g e
Figure 4.10: Hollowed Steel Barriers
Figure 4.11: Sunshade
60 | P a g e
Figure 4.12: Tamarix Plant
Figure 4.13: Rhanterium Epapposum Plant
61 | P a g e
Figure 4.14: Water Sprinkles
62 | P a g e
4.7 Road Signs and Animal Passing
Currently, Al Khalidya road has a desperate need for the road signs, and route guidance.
Installing enough signs alongside the street was the major action to be taken that will mitigate the
road accidents. The following table shows the signs that should be installed:
Table 4.4: Responses of signs and animal passing
No. Sign Name Location at The
Street
Required Number
of signs/side Sign Sample
1 Speed Limit (80) Each 4 Km alongside
the road 3
2 Speed Limit For
Trucks (50)
Each 4 km alongside
the road 3
3 Traffic Spikes
Replacing existing
bumps by spikes
bumps
5
4 Turn Ahead At the 6
th Km after
Air-force bridge 1
5 Detour Ahead At the 6
th Km after
Air-force bridge 1
6 Animal Passing Each 4 km alongside
the road 3
63 | P a g e
5.1 Summary
In conclusion, the objectives of the project have been done probably based on proposed plan. As
a primary step, by collecting data form newspaper, ministry of municipality and rural affairs, and
questionnaires the literature review has been done.
The major part in the project was the qualitative and quantitative models done by decision
making theory (SMART method). This method used mathematical relations that has assisted in
finding the result of the project.
The following objectives have been successfully done:
1. Identify the risk factors of Al Khalidiya Road.
2. Perform a qualitative risk model (QLRM) for the road users. The model output will be
risk category for each risk factor.
3. Carry out a quantitative risk model (QNRM) for decision makers and municipal
engineers, who are responsible for the road operations, to consider required plans
accordingly for mitigating the current and future risk.
4. Recommend suitable action plans for the future graduation projects.
5.2 Limitation
Since the project started from scratch without any previous supporting documents, and the
typical project needs more time to meet the requirements. Four months working was the
challenge.
There was a lack of literature review. Due to time limitations the expected outcomes were
comparing Al Khalidiya road with similar road in the city. Therefore, as full time students, one
semester was a challenge to complete full risk assessment study. For example, Consequence of
Failure was missing in the project where it was a good source that supports the project.
5.2.1 Mathematical Models
In general, the purpose of the project is to create an index for Al Khalidiya road to be used for
future work. The major mathematical models used in this project are as follow, (1) Simple Multi
Attributes Rating Technique (SMART), and (2) probability of failure (PoF). These two methods
aim to find the risk for each factor along the entirety of the road. Where, PoF is obtained from
64 | P a g e
the distribution of questionnaires. After that, the average was taken from the feedbacks. In the
future, Consequence of Failure (CoF) is a subject that will be focused on by the engineers in the
future works.
5.2.2 Questionnaires
First of all, since the project has a direct relation with PMU students particularly, the results of
the project will be related to questionnaires analyzed the factors of the risk associated with the
use of road. The survey subdivided into three parts; (1) Al Khalidiya road users; (2) Al Khalidiya
road risk factors; (3) Al Khalidiya road action plan. The results of the questionnaires were
inserted in a software program called Google Form.
5.3 Future work
1. Consequences of Failure (CoF).
2. Incorporate risk software for more analysis.
3. Cost estimation for risk responses.
4. 3D Model for risk responses.
As a result, qualitative and quantitative models have been used to analyze the risk level in Al
Khalidiya road. By using SMART model, nine factors of risk have been analyzed. For further
analysis, the above points will be completed in the future.
CHAPTER 5
65 | P a g e
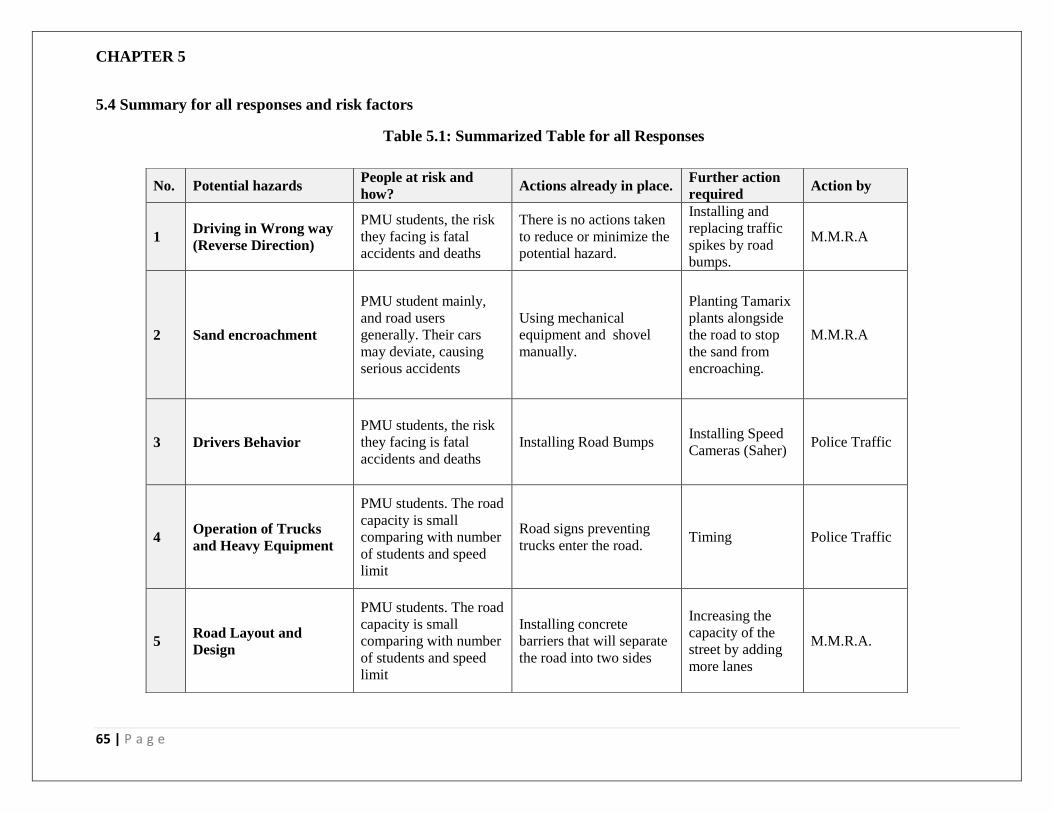
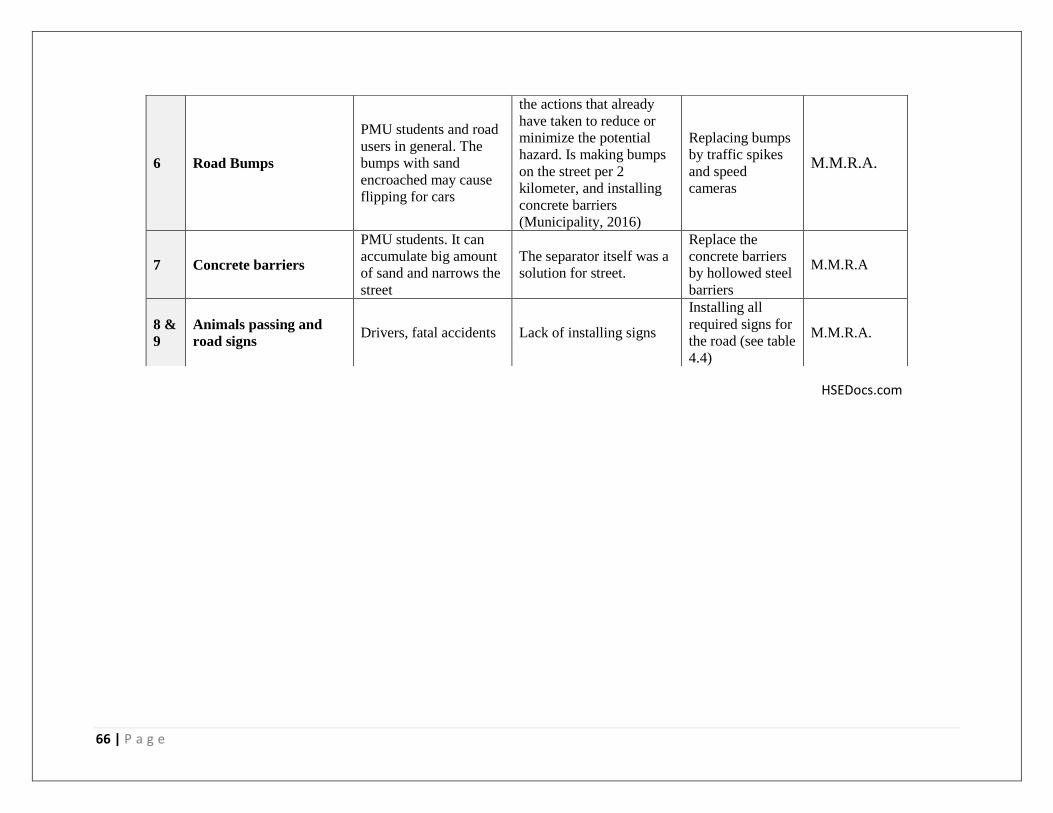
5.4 Summary for all responses and risk factors
Table 5.1: Summarized Table for all Responses
No. Potential hazards People at risk and
how? Actions already in place.
Further action
required Action by
1 Driving in Wrong way
(Reverse Direction)
PMU students, the risk
they facing is fatal
accidents and deaths
There is no actions taken
to reduce or minimize the
potential hazard.
Installing and
replacing traffic
spikes by road
bumps.
M.M.R.A
2 Sand encroachment
PMU student mainly,
and road users
generally. Their cars
may deviate, causing
serious accidents
Using mechanical
equipment and shovel
manually.
Planting Tamarix
plants alongside
the road to stop
the sand from
encroaching.
M.M.R.A
3 Drivers Behavior
PMU students, the risk
they facing is fatal
accidents and deaths
Installing Road Bumps Installing Speed
Cameras (Saher) Police Traffic
4 Operation of Trucks
and Heavy Equipment
PMU students. The road
capacity is small
comparing with number
of students and speed
limit
Road signs preventing
trucks enter the road. Timing Police Traffic
5 Road Layout and
Design
PMU students. The road
capacity is small
comparing with number
of students and speed
limit
Installing concrete
barriers that will separate
the road into two sides
Increasing the
capacity of the
street by adding
more lanes
M.M.R.A.
66 | P a g e
HSEDocs.com
6 Road Bumps
PMU students and road
users in general. The
bumps with sand
encroached may cause
flipping for cars
the actions that already
have taken to reduce or
minimize the potential
hazard. Is making bumps
on the street per 2
kilometer, and installing
concrete barriers
(Municipality, 2016)
Replacing bumps
by traffic spikes
and speed
cameras
M.M.R.A.
7 Concrete barriers
PMU students. It can
accumulate big amount
of sand and narrows the
street
The separator itself was a
solution for street.
Replace the
concrete barriers
by hollowed steel
barriers
M.M.R.A
8 &
9
Animals passing and
road signs Drivers, fatal accidents Lack of installing signs
Installing all
required signs for
the road (see table
4.4)
M.M.R.A.
67
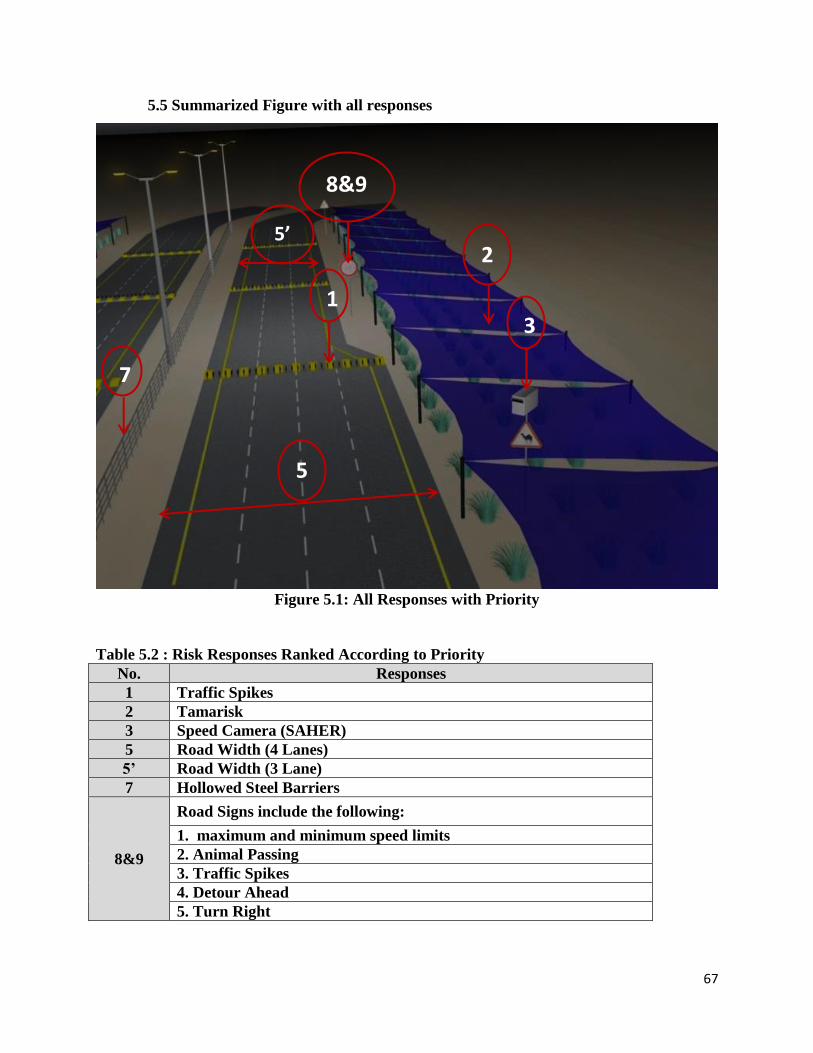
5.5 Summarized Figure with all responses
Figure 5.1: All Responses with Priority
Table 5.2 : Risk Responses Ranked According to Priority
No. Responses
1 Traffic Spikes
2 Tamarisk
3 Speed Camera (SAHER)
5 Road Width (4 Lanes)
5’ Road Width (3 Lane)
7 Hollowed Steel Barriers
8&9
Road Signs include the following:
1. maximum and minimum speed limits
2. Animal Passing
3. Traffic Spikes
4. Detour Ahead
5. Turn Right
1
2
8&9
5
7
&
8
5’
3

68
Appendix A
69
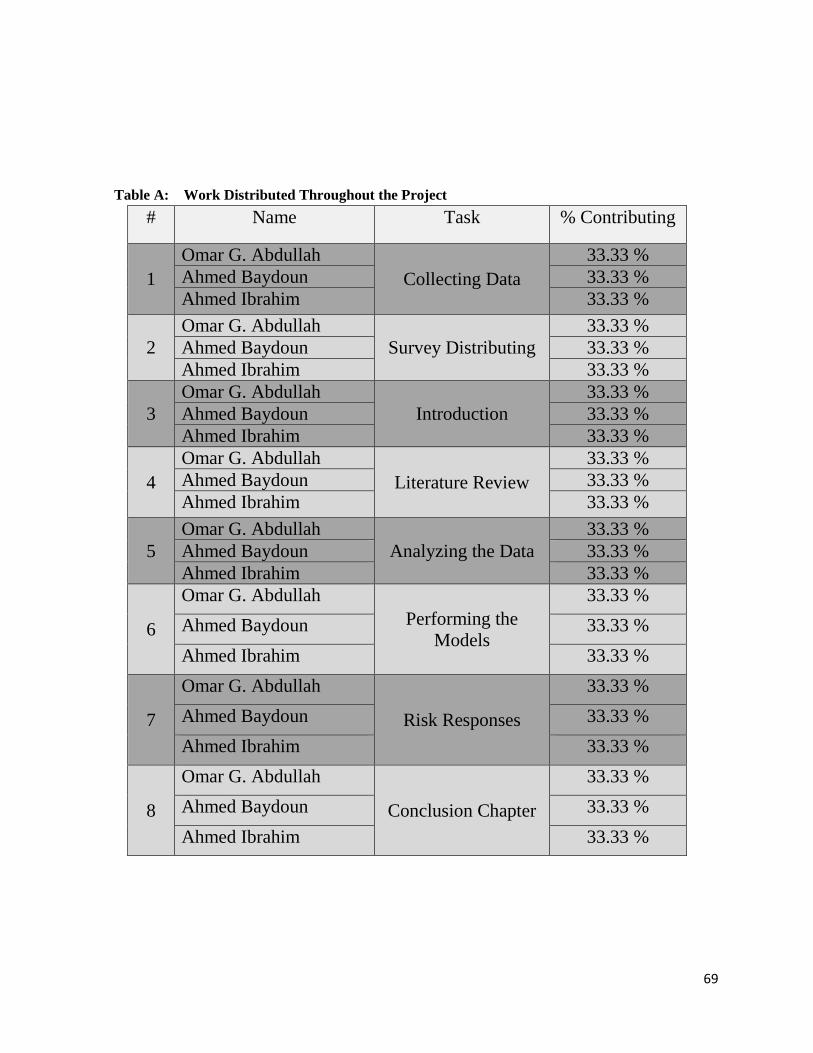
Table A: Work Distributed Throughout the Project
# Name Task % Contributing
1
Omar G. Abdullah
Collecting Data
33.33 %
Ahmed Baydoun 33.33 %
Ahmed Ibrahim 33.33 %
2
Omar G. Abdullah
Survey Distributing
33.33 %
Ahmed Baydoun 33.33 %
Ahmed Ibrahim 33.33 %
3
Omar G. Abdullah
Introduction
33.33 %
Ahmed Baydoun 33.33 %
Ahmed Ibrahim 33.33 %
4
Omar G. Abdullah
Literature Review
33.33 %
Ahmed Baydoun 33.33 %
Ahmed Ibrahim 33.33 %
5
Omar G. Abdullah
Analyzing the Data
33.33 %
Ahmed Baydoun 33.33 %
Ahmed Ibrahim 33.33 %
6
Omar G. Abdullah
Performing the
Models
33.33 %
Ahmed Baydoun 33.33 %
Ahmed Ibrahim 33.33 %
7
Omar G. Abdullah
Risk Responses
33.33 %
Ahmed Baydoun 33.33 %
Ahmed Ibrahim 33.33 %
8
Omar G. Abdullah
Conclusion Chapter
33.33 %
Ahmed Baydoun 33.33 %
Ahmed Ibrahim 33.33 %
70
A.3 Project Execution Monitoring As project members, we had periodic meetings with our advisor and almost daily meetings with
the group members.
We have arranged that every Thursday we had a meeting with our advisor and Sunday will
arrange a short meeting for feedbacks.
A.4 Challenges and Decision Making
The project was all about collecting data for a road that doesn’t really have much data available
on net and off net. We as a group tried our maximum efforts to bring out all the available data as
much as we can. But of course we had our struggles with meetings with government officials
because it’s not easy to arrange a meeting with a decision maker.
A.5 Project Bill of Materials and Budget (if applicable)
No budget was recorded.

71
Appendix B
72
B.1 Life-long Learning
In this project we had used a limited amount of programs since our project was concerned
about data collection and analyzing with respect to risk management side. We had used 3d Max
to accomplish the picture used in risk responses at the end of our report. Time management
skills is one of the key success that led us to complete our project since we had a very limited
time to accomplish such a huge project with data collection and analyzation and providing
some risk responses for it.
We have used some of construction management project techniques and convert it to time
techniques. We had a list of finish to start work and finish to finish and so on. We had to
manage our work in order to finish the report within the required time line.
For our project, our main helper was googling and books, specially EBooks since we had our
research throughout newspapers and articles through google.
B.2 Impact of Engineering Solutions
Alkhalidiya road is one of the dangerous roads in the eastern province, as an engineering
students we had to start our career with managing and raising up an important issue to save
the lives of thousands of students driving onto the road on a daily basis.
The project itself will be the start of saving a lot of lives, we had made a risk index for the road
and raised up some of recommended actions to fix the road on a permanent basis. Our project
is just the start; we hope as group members that our voice will be raised to the right ears.
73
Appendix C
74
Questionnaire
Dear Sir/ Madame,
We are PMU students in the area of Civil Engineering. We are currently conducting a project on the risk
assessment of Al Khalidiya Road.
We would like to seek your assistance in our project as we are currently trying to gather information
about risk factors of Al Khalidiya Road to be used in our data base. We would be grateful if you could
complete the attached questionnaire, which it takes only 5 minute, and send it back to Mr.Omar
Abdullah ([email protected]) or to Dr.Alaa Salman ([email protected]).
Please be assured that all information shared will be strictly confidential and used only for academic
purposes. Please do not hesitate to contact us if you need any clarification or additional information.
Sharing your valuable information is highly appreciated.
Best regards,
Omar Abdullah, Ahmed Baydoun, and Ahmad Ibrahim
Civil Engineering Students -Prince Mohamad Bin Fahd University (PMU)
Supervisor: Dr. Alaa Salman,
PhD, PMP, P.Eng (Ontario-Canada)
Department of Civil Engineering
College of Engineering
Prince Mohammad Bin Fahd University
PO BOX 1664, Al Khobar 31952
Kingdom of Saudi Arabia
Email: [email protected]
Tel: +966 3 849-9780
Fax: +966 3 849-8890
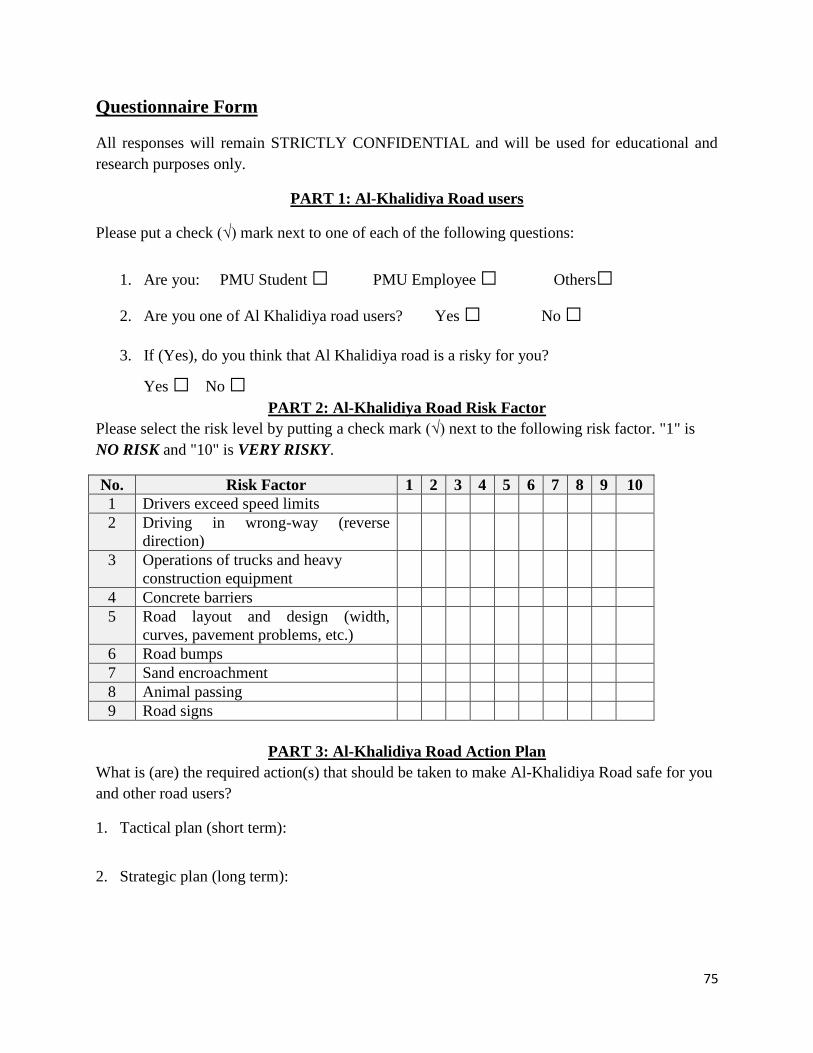
75
Questionnaire Form
All responses will remain STRICTLY CONFIDENTIAL and will be used for educational and
research purposes only.
PART 1: Al-Khalidiya Road users
Please put a check (√) mark next to one of each of the following questions:
1. Are you: PMU Student □ PMU Employee □ Others□
2. Are you one of Al Khalidiya road users? Yes □ No □
3. If (Yes), do you think that Al Khalidiya road is a risky for you?
Yes □ No □
PART 2: Al-Khalidiya Road Risk Factor
Please select the risk level by putting a check mark (√) next to the following risk factor. "1" is
NO RISK and "10" is VERY RISKY.
No. Risk Factor 1 2 3 4 5 6 7 8 9 10
1 Drivers exceed speed limits
2 Driving in wrong-way (reverse
direction)
3 Operations of trucks and heavy
construction equipment
4 Concrete barriers
5 Road layout and design (width,
curves, pavement problems, etc.)
6 Road bumps
7 Sand encroachment
8 Animal passing
9 Road signs
PART 3: Al-Khalidiya Road Action Plan
What is (are) the required action(s) that should be taken to make Al-Khalidiya Road safe for you
and other road users?
1. Tactical plan (short term):
2. Strategic plan (long term):
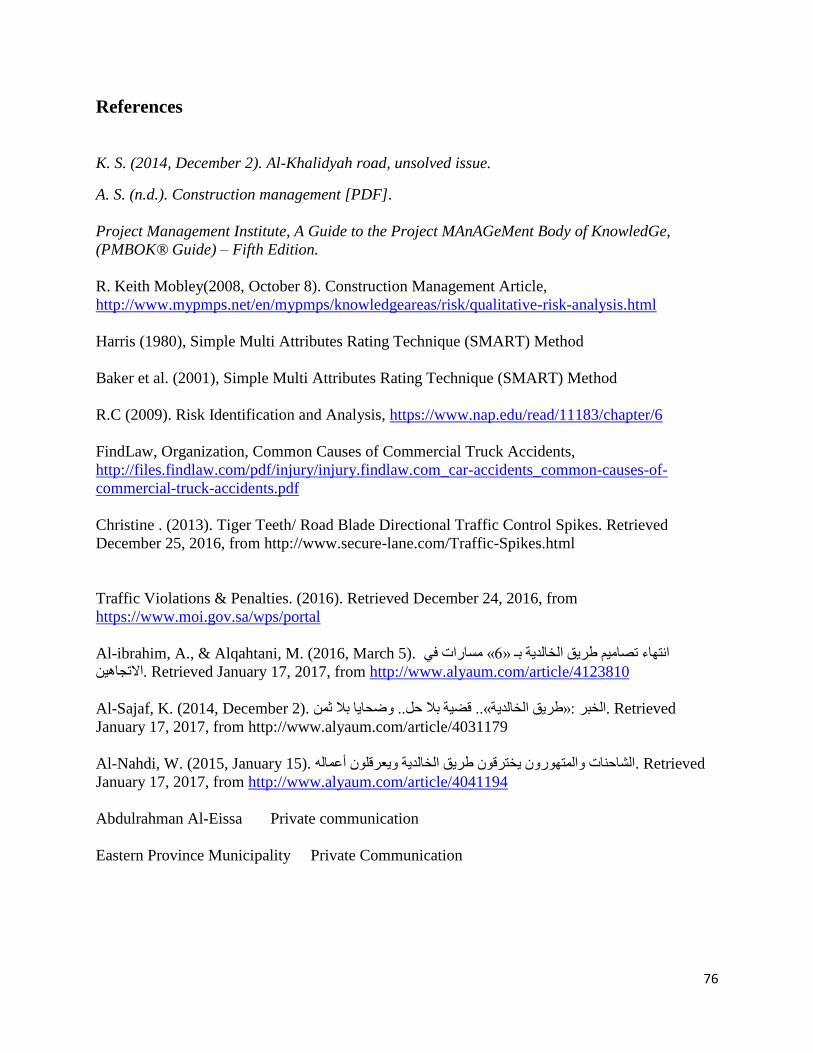
76
References
K. S. (2014, December 2). Al-Khalidyah road, unsolved issue.
A. S. (n.d.). Construction management [PDF].
Project Management Institute, A Guide to the Project MAnAGeMent Body of KnowledGe,
(PMBOK® Guide) – Fifth Edition.
R. Keith Mobley(2008, October 8). Construction Management Article,
http://www.mypmps.net/en/mypmps/knowledgeareas/risk/qualitative-risk-analysis.html
Harris (1980), Simple Multi Attributes Rating Technique (SMART) Method
Baker et al. (2001), Simple Multi Attributes Rating Technique (SMART) Method
R.C (2009). Risk Identification and Analysis, https://www.nap.edu/read/11183/chapter/6
FindLaw, Organization, Common Causes of Commercial Truck Accidents,
http://files.findlaw.com/pdf/injury/injury.findlaw.com_car-accidents_common-causes-of-
commercial-truck-accidents.pdf
Christine . (2013). Tiger Teeth/ Road Blade Directional Traffic Control Spikes. Retrieved
December 25, 2016, from http://www.secure-lane.com/Traffic-Spikes.html
Traffic Violations & Penalties. (2016). Retrieved December 24, 2016, from
https://www.moi.gov.sa/wps/portal
Al-ibrahim, A., & Alqahtani, M. (2016, March 5). مسارات في « 6»انتهاء تصاميم طريق الخالدية بـ
Retrieved January 17, 2017, from http://www.alyaum.com/article/4123810 .االتجاهين
Al-Sajaf, K. (2014, December 2). قضية بال حل.. وضحايا بال ثمن«.. طريق الخالدية:»الخبر . Retrieved
January 17, 2017, from http://www.alyaum.com/article/4031179
Al-Nahdi, W. (2015, January 15). الشاحنات والمتهورون يخترقون طريق الخالدية ويعرقلون أعماله. Retrieved
January 17, 2017, from http://www.alyaum.com/article/4041194
Abdulrahman Al-Eissa Private communication
Eastern Province Municipality Private Communication