Embed Size (px)
Citation preview

QUADERNI DEL DIPARTIMENTO
DI ECONOMIA POLITICA E STATISTICA
Monica Bozzano Gabriele Cappelli
The legacy of history or the outcome of reforms?
Primary education and literacy in Liberal Italy (1871-1911)
n. 801 – Marzo 2019

The legacy of history or the outcome of reforms? Primary education and
literacy in Liberal Italy (1871-1911)
Monica Bozzano1
Gabriele Cappelli2
March 2019
Abstract
This paper shows how historical institutions, inherited from pre-unification regional states,
cast a long shadow on the evolution of literacy across the provinces of Liberal Italy (1871-
1911). Although increasing local inputs into public primary schooling were associated with
higher literacy, pre-unification schooling is found to be a crucial predictor of literacy in the
period under study. New provincial estimates of school efficiency based on Data
Envelopment Analysis suggest that pre-unification education and parental literacy were also
important determinants of the success in converting schooling into literacy.
JEL codes: E02, H75, I25, N33.
Keywords: schooling, effectiveness, efficiency, human capital, education production
function, economic history, institutions, reforms, Italy.
1 University of Pavia. Address: Department of Law, Via Strada Nuova, 27100, Pavia, e-mail
[email protected]. 2 University of Siena. Address: Department of Economics and Statistics, Piazza San Francesco 7, 53100, Siena,
e-mail [email protected].
1
Introduction
Human capital plays a central role in modern economic performance, as highlighted by
theoretical models of growth since the 1980s (Lucas 1988; Romer 1990; Galor 2005).
Empirical research has confirmed that education and skills are among the main determinants
of per-capita income disparities across countries (Hanushek and Woessmann 2012). New data
and estimates on historical schooling, education and human capital formation that has
become available in the last decades shows, in turn, that e.g. educational attainments and
numeracy in the past are strongly related to contemporary human-capital levels (Morrisson
and Murtin 2009; Joerg Baten and Juif 2014).
By stretching the time span of the analysis, recent research within economics and economic
history has made some progress in explaining which factors determined human-capital
inequality within and across countries. This line of work has focused – among the other
things – on landownership concentration and funding of schooling (Cinnirella and Hornung
2016), the gender gap (Baten and de Pleijt 2018), the demand for skills due to
industrialization (Diebolt, Le Chapelain, and Menard 2017) and persistent historical legacies
vs. school reforms aimed to change the status quo (Chaudhary and Garg 2015; Cvrcek and
Zajicek 2018).
Part of this literature has focused on Italy, particularly in the last few years, when a resurgent
body of quantitative evidence has prompted new interpretations on the comparative economic
performance of the country and of its persistent regional divide – stressing that human capital
is central to explain the country’s comparative economic performance and the persistence of
a very large regional inequality (Di Martino and Vasta 2017; Cappelli 2017a).
While recent contributions on the historical determinants of human capital accumulation in
Italy and its regions – which are discussed more in depth in the literature review below –
have mainly dealt with the supply of primary schooling (Cappelli 2016; A’Hearn and Vecchi
2017), other considerations concerning the demand for schooling and the efficient use of
available inputs have been largely neglected. Furthermore, although a recent article by Carlo
Ciccarelli and Jacob Weisdorf (2018) has put forward some new interpretations concerning
this, no empirical research has been rigorously carried out on the relationship between public
schooling in pre-unification regional states and post-unification human capital accumulation.
Indeed, some questions originally raised by the Italian historiography of the 1990s remain

2
unanswered to date: did the supply of schooling matter for human capital accumulation,
against the alternative argument that literacy was mainly demand-driven? Did the culture and
capability to provide public schooling inherited from the pre-unification period cast a shadow
on the educational fortunes of post-unification Italian regions, even when we factor in other
aspects in the analysis? Although some progress has been recently made, a systematic
assessment of such mechanisms has been impossible until now, due to both methodological
limitations and data constraints.
We answer such questions by implementing a new two-step methodology, based on the
distinction between the concepts of effectiveness and efficiency. Effectiveness can be defined
as the association between inputs and outputs and captures the process by which inputs are
transformed into outputs: it tells us to what extent each input determines or contributes to the
production of a certain level of output, which in our case is literacy. Efficiency might be
defined as effectiveness at the lowest possible cost. Thus, the production of literacy may be
deemed efficient if it is the best result that can be reached with the inputs provided by the
education system.
Following this framework, we first investigate to what extent the spread of youngsters’
literacy (those aged 15-19) across Italy’s provinces was due to (i) varying primary-school
inputs, (ii) a different demand for skills linked to the structure of the economy or (iii)
historical traditions of supplying public primary schooling by pre-unification (pre-1861)
regional states. To do so, we estimate provincial Education Production Functions (henceforth
EPFs). We find that going to (public) schools was crucial, as more inputs – particularly
enrolments – are always linked to higher literacy, even when controlling for demand-side
features. At the same time, pre-unification schooling is correlated with post-unification
literacy, suggesting a high degree of inertia to change and path dependence of past
institutional settings.
Secondly, we estimate primary-school efficiency by relying on Data Envelopment Analysis
(henceforth DEA). We find that the capability to improve literacy based on a given supply of
inputs varied greatly across Italy’s provinces – although our series show that North-South
convergence accelerated between 1901 and 1911. Based on a Simar-Wilson econometric
model (Simar and Wilson 2007), we find that demand-side features do not explain territorial
disparities in school efficiency; instead, our results highlight that the provinces characterized
by higher literacy at the beginning of the 19th century were the most efficient in converting
3
school inputs into literacy between 1871 and 1911. This aspect of persistence is also
reinforced by the fact that post-1871 literacy is positively related to parental education.
This paper thus relates to the economic literature on the role of historical institutions and their
persistence over time (see Valencia Caicedo 2019 for an overview). Indeed, the fortunes of
Italy’s regions were persistently linked to their pre-unification development – particularly
concerning education: those that fared better were the ones that had accumulated human
capital by the early 19th century. Even in the presence of a major shock that harmonized
formal institutions across regions, such as the Italy’s unification, culture and informal norms
concerning schooling and education cast a long shadow on Italy’s South. Persistence does not
mean destiny, though: our results show that the link between pre-unification education and
literacy faded out over time, and that convergence in school efficiency between the North and
the South occurred in the first decade of the 20th century. Although testing the following
argument formally goes beyond the scope of this analysis, we argue that the observed pattern
is consistent with Italy’s governments making the first steps towards a change in the primary-
school system, bringing about more funding and more centralized management (Cappelli and
Vasta 2017.
The rest of the paper is organized as follows: Section 1 discusses the relevant literature.
Section 2 briefly describes Italy’s education system. Section 3 presents the data employed in
the analysis and some relevant stylized facts. Section 4 presents our estimates of Education
Production Functions and the evidence on the persistent legacy of pre-unitarian human capital
accumulation. Section 5 measures the efficiency of the schooling system and then
investigates its determinants across provinces. Section 6 concludes.
1. Selected literature review
An important line of research within economics has focused on the role played by historical
institutions as key determinants of economic growth and development (see seminal work by
Acemoglu, Johnson, and Robinson 2001; Engerman and Sokoloff 2002). Such work
highlights the persistence and inertia of both formal and informal institutions over time
(Nunn 2008; Michalopoulos and Papaioannou 2013; Maloney and Caicedo 2016; Waldinger
2017; Valencia Caicedo 2019). Granted that most institutions evolve slowly, recent research

4
has shown that important changes in beliefs, norms and rules might be prompted by effective
policy interventions (Chaudhary and Garg 2015; Alston 2017).
Among institutions affecting economic growth, the norms that regulate a school system and
provide the framework for human-capital accumulation are influenced by historical legacies.
Due to this, a large body of research in economics and economic history has explored the
determinants of human-capital inequality within and across countries – in the past and in the
long run. An important line of work has focused on soil endowments and land inequality in a
political-economy framework, stressing that the concentration of land in the hands of a
restricted elite limited investment in schooling for all (Cinnirella and Hornung 2016; Joerg
Baten and Hippe 2018). Although the view that elites did not invest in public education has
been recently challenged by new empirical research – particularly on Sweden and Austria
(Andersson and Berger 2018; Cvrcek and Zajicek 2018) –, this mechanism certainly is a valid
explanation of regional schooling inequality in many parts of Europe and North America
during the 19th century (Go and Lindert 2010; Goñi 2018; Beltrán Tapia and Martinez-
Galarraga 2018). Gender inequality held back the development of education, too, thus
hampering long-term human capital accumulation (Hippe and Perrin 2017; Baten and de
Pleijt 2018). A complementary line of research has stressed that the rise of mass education in
the past often depended on demand. This mechanism is confirmed by research on the spread
of steam engines in France (Franck and Galor 2017; Diebolt, Le Chapelain, and Menard
2017) and evidence on the industrialization of the US (Katz 2016). Instead, de Pleijt,
Nuvolari and Weisdorf (2016) find mixed evidence on the role that new-technology adoption
played for education, while de Pleijt and Weisdorf (2017) argue that a decrease in average
skills occurred in England from the end of the 16th century to the beginning of the 19th
century.
Recently, similar issues have been addressed referring to Italy’s comparative economic
performance and the role that human capital accumulation played in determining the
country’s persistent regional divide (Felice 2013, 2015). Di Martino and Vasta (2017) argue
that limited human capital and a deficient national innovation system hampered Italy’s
growth in the long run. Concerning the country’s regional divide, Federico, Nuvolari and
Vasta (2019) have estimated real wages for all provinces in the Liberal Age (1861 – 1913).
They find that provinces with better human-capital endowments – as measured by literacy –
experienced the largest increase in wages in the 50 years preceding the Great War. The
5
positive link between regional growth and human capital has also been shown by Felice
(2012) and Ciccarelli and Fachin (2017). Missiaia (2018) has relied on an empirical model
based on the New Economic Geography to test what factors determined the location of
industry across Italian regions from unification to the eve of WWI. She finds that human
capital was one of the most important determinants of industrial location – similarly to what
Basile and Ciccarelli (2018) find when performing a similar test across Italy’s provinces for
the same period.
A’Hearn and Vecchi (2017) argue that the political-economy mechanism, through which
landowning elites hampered the spread of schooling – especially in the South – was at work
in Italy in the 19th century, even though they do not provide econometric evidence supporting
this claim. Cappelli (2016) captures such a mechanism by using access to local election
(suffrage) as a proxy for wealth and land inequality – but finds no consistent relationship
between electoral franchise and primary schooling. According to his quantitative results,
local fiscal capacity – itself a proxy of income per capita – was a major determinant of school
investments under Italy’s decentralized education system: indeed, Cappelli and Vasta (2017)
show that the shift to centralized education in 1911 (the Daneo-Credaro Reform) prompted
more rapid human capital accumulation and regional convergence in schooling. The Italian
regional education divide was also affected by a large gender gap, as shown by Bertocchi and
Bozzano (2016), who argue that female education was more prominent in provinces linked to
medieval-commerce routes – and that such an effect dissipates on the eve of the 20th century
due to the implementation of national school reforms.
Ciccarelli and Weisdorf (2018, henceforth CW) have provided the first-ever estimates of
literacy encompassing all of Italy’s provinces in the long 19th century, from 1821 to 1911.
They rely on back-casting to estimate the literacy of adults by relying on the age structure of
the population, as recorded by coeval censuses. They find that the North-South educational
gap widened up to the unification of Italy (which occurred in 1861), to decline thereafter;
despite this, the North-South gap was the same in 1911 as it had been in 1821. Furthermore,
CW show a reduction in the gender gap within the North before 1911, while gender
inequality stagnated (at very high levels) in the South. The authors conclude that, “although
the state school initiative after unification helped close the rising gap in literacy between the
north and the south, progress in the south was slow and average male literacy in Southern

6
Italy in 1911 was no higher than in Northern Italy in 1821” (Ciccarelli and Weisdorf 2018:
3).
Despite this recent wave of research on human capital accumulation in Italy and its regions,
some hypotheses remain unexplored. For example, although CW show educational trends in
the long 19th century, their analysis remains silent on the respective role played by historical
legacies vs. school reforms, school inputs and the demand for schooling in Liberal Italy – that
is, post-unification. Under Italy’s decentralized primary-school system, based on local
management and funding by the municipalities, whether persistent regional educational
inequality was due to limited local inputs, limited demand for literacy and numeracy, or to a
deficient organizational and administrative knowledge due to the legacy of the past, still is a
contended issue. Indeed, although Cappelli (2016) has shown that some local institutional and
socioeconomic aspects affected inputs into primary schooling, his analysis does not explore
the link between inputs and educational outputs, for example literacy.
To sum up, to date, it is still a matter of speculation whether the provision of mass schooling
did matter to improve literacy in Liberal Italy, against the alternative argument that human
capital accumulation was mainly demand-driven; nor we know whether the culture and
capability to provide public schooling inherited from the pre-unification regional states cast a
gloomy shadow on the educational fortunes of post-unification Italian regions.
2. Italy at school in the 19th century: pre-unitary education and the national system
of primary education (1871 – 1911)
This section illustrates the pervasive regional differentiation in human accumulation and
educational policies inherited from the pre-unification period (1815-1861) and then by
describing the new national system of primary education implemented in the subsequent
period (1861-1911).
At unification, Liberal Italy had not yet embarked on sustained industrialization and
economic growth: a substantial share of its labour force was employed in agriculture, very
limited railway and road infrastructure had been built, extensive poverty and land inequality
characterized large areas and low literacy rates and enrolments into schooling. Despite its low
level of development, the country was already characterized by regional economic inequality.
7
If little regional disparities could be discerned by 1871 concerning industrial activity and
GDP per capita, large regional inequality was evident in terms of infrastructures (Ciccarelli
and Groote 2017), innovation capacity (Nuvolari and Vasta 2015, 2017) and literacy and
schooling (Bertocchi and Bozzano 2016; Cappelli 2016).
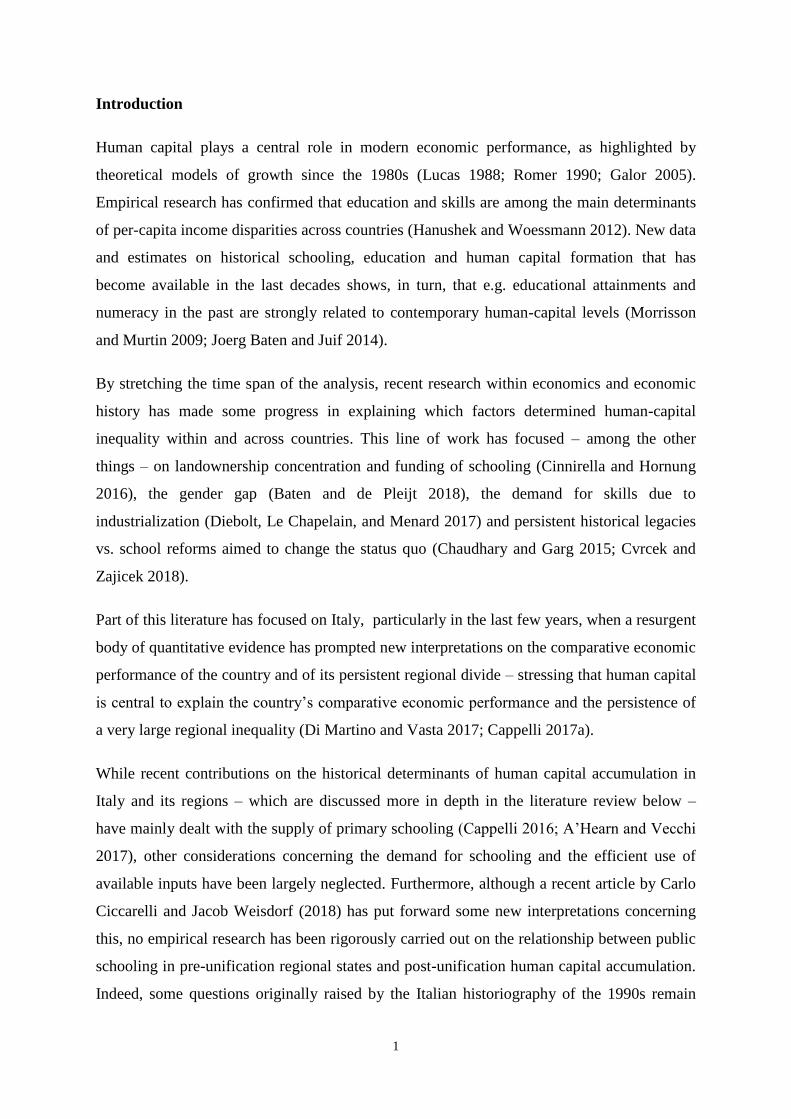
More specifically, the profound territorial heterogeneity in human capital accumulation was
largely inherited from pre-unification regional states, due to very diverse education policies
(A’Hearn and Vecchi 2017). Pre-unification regional inequality in schooling persisted to the
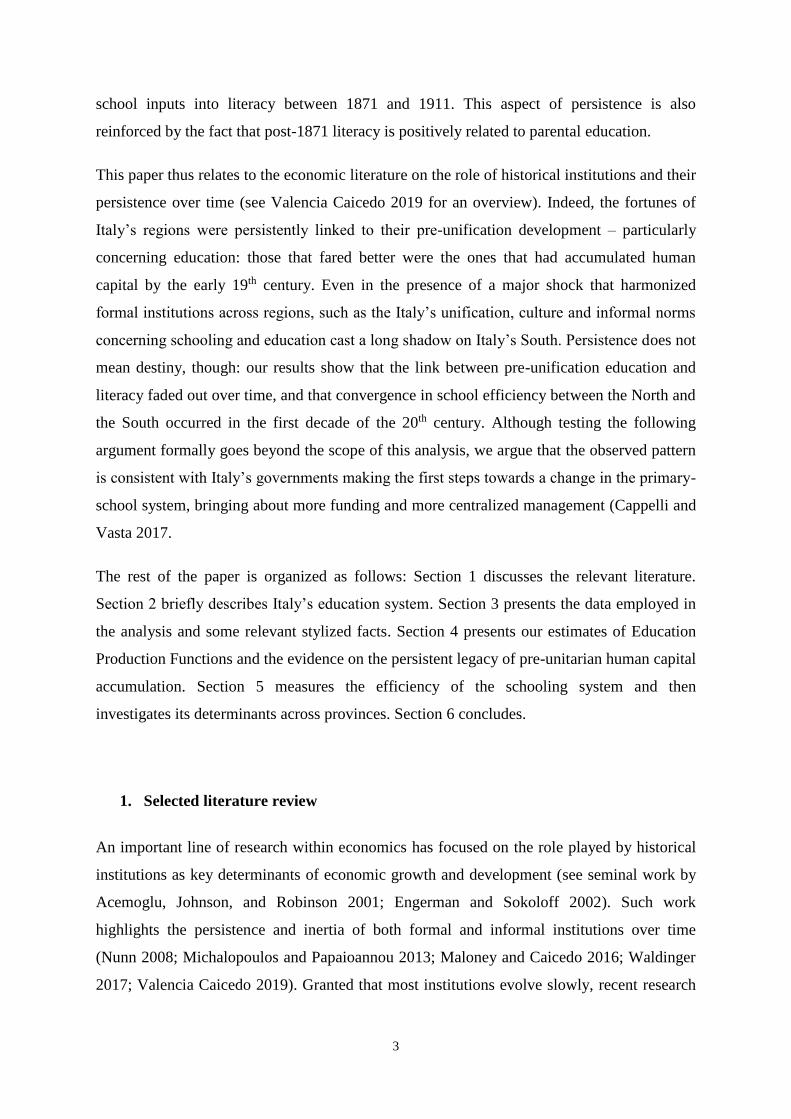
Liberal Age, highlighting a high level of inertia from one period to the other. Figures 1 shows
adult literacy rates in 1831 and enrolment rates in pre-unification states, approximately
between the 1820s and the 1850s, while Figure 2 illustrates adult literacy rates in 1871 and
1911.3 This descriptive evidence confirms that the distribution of human capital accumulation
across the country was highly persistent through time and remained fairly unchanged for
almost a century.
3 Data on literacy rates in 1831 are taken from Ciccarelli and Weisdorf (2018), who employ a backcasting
methodology in combination with post-unification censuses.

8
Figure 1: Literacy and Enrolment rates in pre-unitarian States
a) Literacy rate 1831
b) Pre-unitarian Enrolment rate
Notes: adult literacy rates in 1831 refers to adult population aged 30-40. Sources: literacy rates in 1831 are taken
from Ciccarelli and Weisdorf (2018). Data on enrolment rates are taken from Vigo (1971).
Figure 2: Adult literacy rates in 1871 and 1911
1871
1911
Notes: Adult literacy rates in 1871 and 1911 refer to population aged 15+. Sources: census data.
9
Already in the early 19th century, a well-functioning schooling system was present in the
Kingdom of Sardinia (including Piedmont, Liguria and the isle of Sardinia), which had the
highest literacy in the period, followed by Lombardy and Venetia under the Habsburg Empire
(Genovesi 1998): as Figure 1 shows, literacy in Piedmont and Lombardy ranged between 38
and 55 percent, in line with foreign neighbouring countries. The very same pre-unification
states are also the leading ones when considering enrolment figures, as Figure 1-b clearly
points out. Instead, human capital was low in the territories that belonged to the Papal States
and to the Kingdom of the Two Sicilies, in the Centre-South of the peninsula, where no such
policies were implemented. Notice, for example, that in 1831 in some southern territories of
the Kingdom of the Two Sicilies only 10 to 15 people out of 100 were able to at least read.
During unification (started during the 1860s and completed by 1871), the Kingdom of Italy
began to implement a series of education policies.4 This new trend started with the
establishment of a national education system, based on the imprint given by the Casati Law,
passed in the Kingdom of Sardinia in 1859 and later extended to the newly annexed areas of
the unified Kingdom. As far as primary education was concerned, the central government set
all the formal norms regulating the primary schools. The Law stated that primary schooling
had to be provided free of charge, for at least two years. Additional two years were
compulsory in larger municipalities, and where a secondary school had already been
established.
Despite a bulk of centralized formal provisions, the funding and management of schooling
was fully decentralized: hiring teachers, paying them, building and running schools and
enforce attendance was the responsibility of the municipalities, i.e. the city councils.5 When it
was set forth in 1859, the Casati primary-education Law lacked any redistributive mechanism
to make up for large regional economic disparities, which translated into large regional
inequalities in the capability to fund primary education, causing education to spread quite
slowly at the national level. Such issue was first tackled by the Coppino Reform of 1877,
which strengthened the very weak sanctions for the families of children who did not enrol,
failing to comply with the Casati Law. Compulsory education was also brought to three years
(up from two), yet this had little effect on enrolments and the growth of literacy – even
though a weak system of subsidies aimed at the poorest municipalities was implemented.
4 The provinces of Mantua and those belonging to today’s Veneto were annexed in 1867, whereas the province
of Rome (and Comarca) was annexed in 1871. 5 Decentralized education can be defined as the devolution of school management to lower levels of public
administration. Centralization, instead, is the inverse process, i.e. a concentration of power in the hand of the
central government (Bray 1991). According to this definition, Italy’s education system from 1859 to 1911 was
very decentralized, although the norms and curricula were set forth by the central administration.

10
State intervention became more decisive at the turn of the 20th century, although a real step
towards centralization was only taken in 1911, with the Daneo-Credaro Reform. Still, in 1903
and 1904 the Orlando and Nasi Laws increased teachers’ salaries and improved their legal
position vis-à-vis the city councils, which up to that point could discretionarily hire or lay-off
them.
To sum up, given the history of primary schooling in Liberal Italy, it is perhaps unsurprising
to observe a high persistence of regional educational inequality – as shown by Figure 2.
However, next, we test whether such differences are a mere legacy of the pre-unification
period (whereby provinces inherited different stocks of human capital due to very distinct
education models implemented by early-19th century polities), against the alternative
hypothesis that the main factor hindering regional education was limited school inputs, which
in turn can be linked to the decision to provide primary education through a decentralized
system up to 1911.
3. Data and stylized facts
To explore whether historical legacies affected the diffusion of literacy across the provinces
of Italy, the first issue that we need to tackle is how to measure inputs into schooling,
educational outcomes and school efficiency in the long 19th century. Although collecting
fine-grain data concerning this period is normally difficult, Italy’s historical statistics provide
rich and reliable data. We rely on a newly assembled panel dataset (Bozzano and Cappelli
2018) on educational outcomes and school inputs at the provincial level (roughly today’s
NUTS-3) and at ten-year intervals between 1861 and 1911.
Education and schooling variables
The literacy rates of the youngsters (aged 15 to 19), which is our dependent variable, are
calculated based on the population censuses.6 State inquiries into primary education provide
information on the number of pupils enrolled in primary (state and private) schools, the
number of teachers and the number of schools, from which we calculate the primary Gross
6 Since the unification of Italy in 1861 censuses specifically inquired about the literacy of population. More
specifically, the question about literacy was asked to the head of the family who answered for all components of
the household.

11
Enrolment Ratio7, the pupil-teacher ratio, and the density of state schools (as the number of
schools per squared km). We collected information on expenditures on education from the
municipalities’ balance sheets (Bilanci comunali), published by the Ministry of Agriculture,
Industry and Trade (see Ministero di Agricoltura Industria e Commercio, various years),
from which we calculate expenditure on education per pupil. Expenditure figures are in
current Lire pro capita; yet, one may note that, in the period concerned by our analysis, the
mean rate of inflation was basically zero, due to the influence exerted by the Gold Standard:
hence, our figures approximate those in constant prices.
Geographic, demographic and socio-economic variables
To run our analysis, we complement our dataset with a series of variables that are not
pertaining to the education system itself, and divide them into three groups: geography,
demography, and socio-economic aspects.
Geography controls include latitude, longitude, average temperature, and average rainfall.
Demographic variables include population density (residents per squared km) and a proxy for
the dependency ratio (children aged 6 to 10 as a share of total population) in order to capture
the potential differences in the age structure of the population. We also collect and calculate
the infant mortality rate and the rate of outward migration (emigrants as a share of total
residents). The latter is added to control for potential brain drain (Gomellini and O’Grada
2013; Giffoni and Gomellini 2015). Figures on emigrants are obtained from the Yearbook on
Italian Migration (Commissariato generale dell’emigrazione 1926). Infant mortality rates are
calculated from vital statistics (Direzione generale della statistica, various years), while
population density and the dependency ratio are elaborations from census figures.
Socio-economic variables include the height of conscripts8 aged 20 organized by birth cohort,
obtained from A’Hearn and Vecchi (2017) as a proxy for economic well-being; industrial
Value Added per capita obtained by combining data from Ciccarelli and Fenoaltea (2013)
with population figures; the share of the labour force in agriculture, thanks to data kindly
provided by Anna Missiaia (2014); electoral franchise, represented by the share of adult
males (21+) entitled to vote in local (e.g. municipal) elections (Cappelli 2016); finally, we
7 The primary Gross Enrolment Ratio is defined here as the total number of pupils enrolled in primary schools,
regardless of age, divided by the number of children of the age group that officially corresponds to the primary
level of schooling, in our case children aged 6-10. The GER does not account for actual attendance. 8 Height is commonly employed in economics and economic history as a proxy for wealth and living standard
because it provides important information on the stock of nutritional investment, and therefore on changes in the
well-being of populations. For an in-depth presentation of the methodology, see A’Hearn and Vecchi (2011) and
(2014).

12
also include a measure of parental literacy collecting data on the percentage of spouses who
were able to sign wedding acts, which are obtained from vital statistics (smoothed on three
years and centred at the years of the censuses).
All the socio-economic controls should capture features that may affect the expansion of
education, like its opportunity cost, the fact the poorer provinces would not be able to fund
primary schools, and the varying degree of support for the diffusion of mass education, which
likely depended on enfranchisement and parental human capital (Lindert 2004).
Finally, we include a proxy of land inequality to further capture the delaying effect of landed
élites in the process of expansion of mass schooling (Beltrán Tapia and Martinez-Galarraga
2018). This index, elaborated by Gabriele Cappelli (Cappelli 2017b) and referring to c. 1871,
is the share of large landowners9 on the total number of landowners.
Early 19th century variables
We exploit data on early-19th-century literacy rates (1831) as estimated by Ciccarelli and
Weisdorf (2018), which were presented in the previous section. Data are based on the
backcasting methodology, a procedure in which literacy rates recorded in 1881 and 1911 are
projected backwards to estimate literacy rates before unification.10
To complement this part of the analysis, we also include the following pre-unification
schooling variables: the GER, the pupil-to-teacher ratio, and the supply of teachers (here as
the number of teachers over total population). The pre-unification data are available at the
province level but for a reduced number of provinces, because of missing observations.11
Data are provided by Vigo (1971)12 and concern various years over the pre-unification period
between 1824 and1858.13 Since the inaccuracy of pre-unification statistics has already been
broadly emphasized in the literature (Vigo 1971), we employ them with caution and mostly
interpret them as suggestive evidence for our argument.
Descriptive statistics
9 The landowners classified as large are those who paid, annually, more than 40 Lire of land-related tax. 10 The authors decide to focus on the literacy rates of the age group 30-40 because, as they explain, they assume
that male literacy was only complete after the age 30. 11 The former two variables are available for 50 provinces out of 69, whereas the latter is available for 52. When
these variables are introduced the total number of observations in the regressions is reduced. For more
information of the data see the Appendix. 12 For the supply of teachers, we calculate the values referring to Lucca and Parma from Genovesi (1998). 13 Refer to the Appendix for further details.

13
Our dataset covers 69 Italian provinces (at 1871 boundaries) for 5 points in time (1871, 1881,
1891, 1901, and 1911), spanning the initial fifty years of the unified Kingdom of Italy. These
figures are uncommonly rich for a 19th-century country and give us the opportunity to gain
new insights into the performance of the Italian education system before more pervasive and
coherent education policies were introduced starting during the first decade of the 20th
century. More details on the definitions and sources for all variables can be found in the
Appendix.
Table 1: Descriptive Statistics of Dependent Variables and School Inputs: 1871-1911.
1871 1881 1891 1901 1911
Mean St.Dev. Mean St.Dev. Mean St.Dev. Mean St.Dev. Mean St.Dev.
Literacy Rate 15-19 0.343 0.195 0.428 0.222 0.514 0.224 0.601 0.231 0.719 0.202
GER 6-10 0.626 0.360 0.810 0.348 0.840 0.313 0.934 0.288 1.087 0.254
Pupil-teacher ratio 41.71 9.436 44.308 9.834 45.068 9.090 47.841 7.955 51.591 8.126
Expenditure per pupil 18.33 6.977 30.02 11.238 32.45 10.04 38.555 13.38 44.99 22.086
School density 0.141 0.103 0.177 0.131 0.201 0.153 0.238 0.189 0.282 0.237
Selected descriptive statistics are reported in Table 1. The data show that, on average, of all
young people aged 15 to 19, only 34 percent were literate in 1871. This share increased
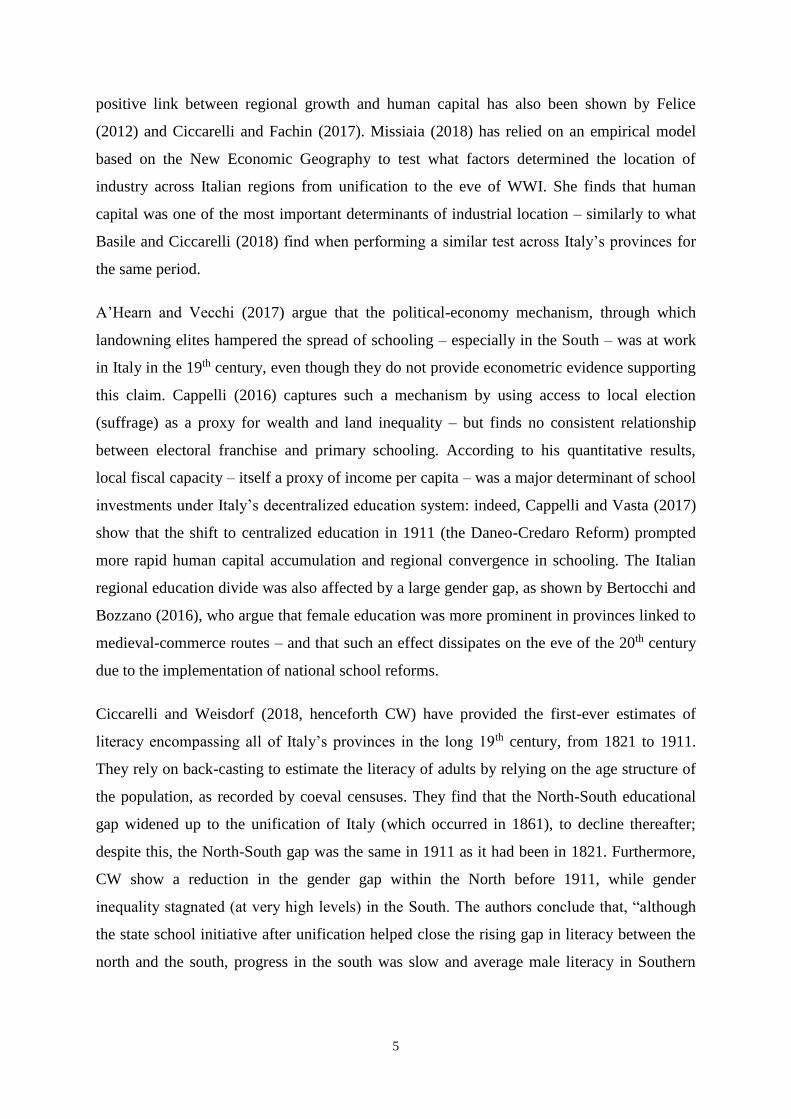
considerably throughout time, reaching 71 percent in 1911.14 Figure 3 shows a map plotting
provincial literacy rates for youngsters aged 15 to 19 in 1871, where darker areas are
characterized by high literacy: as seen in Section 2, literacy rates of people aged 15 to 19
show strong regional inequality, with very low level of human capital in the South of the
peninsula.
14 In 1871, among children aged 6 to 10, only 18 percent were literate.

14
Figure 3: Literacy rates for youngsters (age 15-19) in 1871.
Source: own elaboration from census data. See text.
Like literacy, the share of primary-school-age children who were enrolled (GER) increased
from an average of 63 percent in 1871 to 110 percent by 1911.15 We rely on the cohort
dimension of our dataset to compare enrolment rates (while in schooling) and literacy rates
for the same cohort ten years later. 63 children in primary-school age (6 to 10) out of 100
were enrolled in 1871, but only 43 of them were literate ten years later. This observation
clearly shows that the efficiency of the schooling system in producing literacy is a dimension
of Liberal Italy’s education system that is worth exploring more in depth.
Expenditures per pupil and the density of municipal schools increase through time as
expected. Finally, the pupil-teacher ratio (henceforth class size), which is seen in the
literature as a measure of quality of education, also shows growing values through time.
Although this may seem odd at first (at least from priors in development economics),
Johannes Westberg and Cappelli (2019) show that class size in c. 1881 was positively related
to enrolment rates across Italian provinces, while there was no correlation with expenditure
per school-age children. The authors argue that expenditure (and thus teachers) was just
increased to allow for a slow expansion of enrolments, in a very adaptive way: indeed, there
is no correlation between expenditure per school-age child and class size, whereas the same
15 A gross enrolment rate greater than 100 percent is generally due to a high incidence of early or late enrolment
with respect to the school age being considered, in our case the class of age 6-10.

15
study shows that the relationship between expenditure and class size was clear and strong in
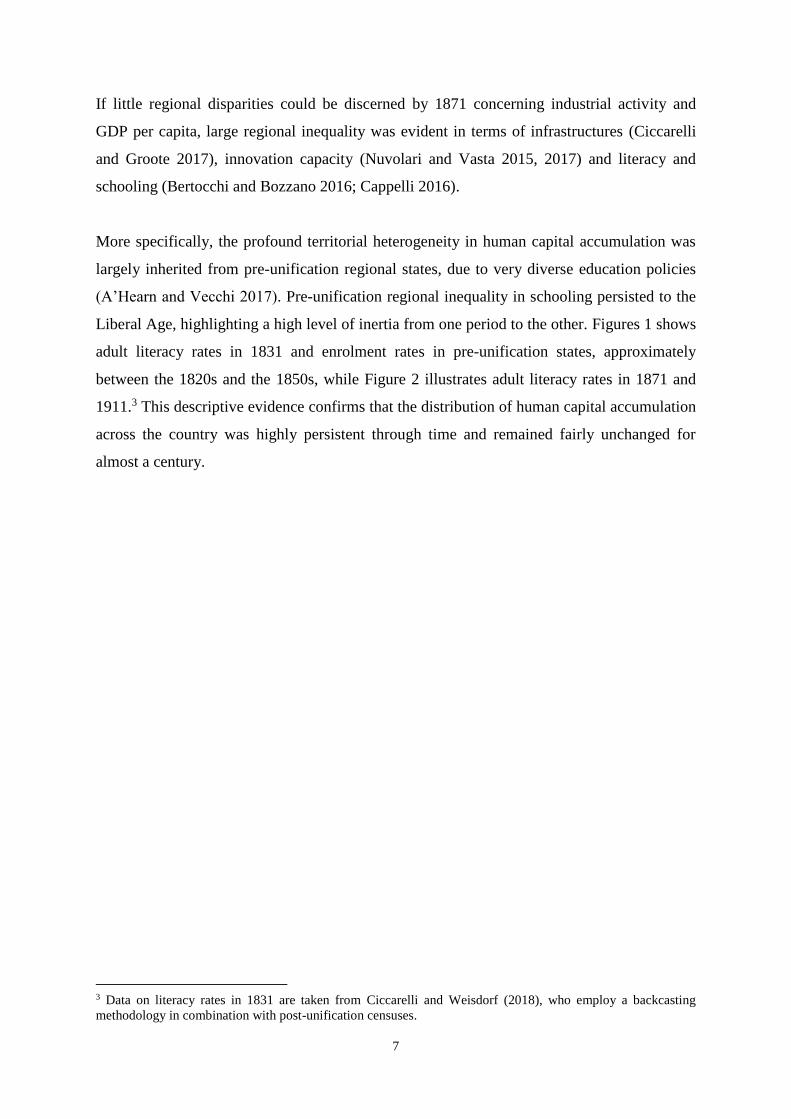
Sweden. Figure 4, which is aimed at capturing the supply of primary schooling, plots the
child-teacher ratio and municipal expenditure per child in 1871. Here, the denominator of
both indices is based on all school-age children, not just those enrolled.
Figure 4: Supply of public schooling: child-teacher ratio and expenditure per child, 1871.
a) Child-teacher ratio
b) Expenditure per child
Notes: the child-teacher ratio is measured as the number of children (aged 6 to 10) per primary-school (state)
teacher while expenditure per child is calculated as municipal expenditure on education per child aged 6 to 10.
Source: see text.
Despite large differences in the supply of public education, the regional distribution of inputs
into schooling appears to have been far more homogeneous – partly because of the mediating
effect of a lower demand for education in the poorer regions of the country. Figure 5 shows
the pupil-teacher ratio (class size) and the expenditure per pupil. For this reason, it is crucial
to control for demand-side aspects when estimating the provincial EPFs. It is also very
important to explore school efficiency since a relatively high expenditure per pupil in e.g.
Sicily is associated to low literacy rates. By the same token, even though the average class
size was similar across the country’s provinces, educational outcomes varied greatly.

16
Figure 5: Territorial distribution of school inputs: class size and expenditure per pupil, 1871.
a) Class size
b) Expenditure per pupil
Notes: Class size is measured by the number of pupils enrolled in state primary schools per teacher and
expenditure per pupil is calculated as the amount of municipal expenditure on education per pupil enrolled in
primary schools. Sources: see text.
4.1. Measuring Effectiveness: Education Production Functions and the
determinants of literacy
We now define and estimate a historical aggregate EPF at the province level to explore
whether and how provincial inputs into schooling, as well as social, economic, demographic
and political factors – including historical legacies – correlate with provincial literacy rates.
Most contributions aimed to estimate EPFs rely on modern data. For example, David Card
and Alan Krueger (1992) have underlined the positive role of school quality on economic
returns to education in the US. Eric Hanushek and Lei Zhang (2006) have analysed
educational outcomes at both the individual and aggregate levels for developed and
developing countries since the 1960s. They have explored resources into schooling and
student achievements to conclude that the relationship between them is weak at best.
Hanushek and Ludger Woessmann (2010) have reviewed the economic literature on
international educational achievements granted the new availability of international cross-

17
country data. They have confirmed previous findings, which suggest that policies aimed to
put more resources into schooling are unlikely to foster educational outcomes if they are not
accompanied by complementary interventions.
There is little research investigating the relationship between school inputs and outputs in a
long-term perspective. David Mitch (1984) has estimated the return to male literacy in
Victorian England while, more recently, Ruth Schüler (2016) has explored the relationship
between school inputs and earnings by using original cross-section data on Prussian counties
between 1886 and 1891. The present paper is therefore the first study in a historical and long-
term perspective to estimate the relationship between inputs into schooling and educational
outcomes.
Following Amy Schwartz and Jeffrey Zabel (2013) our province aggregate production
function is:
Qpt = fpt (SCpt, Xpt, STpt) + , (1)
which produces the output Qpt by combining educational inputs (SCpt), province-specific
environmental characteristics (Xpt), and social or parental inputs (STpt).
We assume a simple linear specification as follows:
Qpt = 0 +1 SCpt +2 Xpt +3 STpt+ pt , (2)
where Qpt is represented in our framework by the literacy of children aged 15-19. All school
inputs, SCpt, included in the regression analysis are taken as a first lag (ten years earlier), so
that we employ school data for 1861 as well to study literacy in the 1871-1911 period.16
Educational inputs (SCpt) include the primary Gross Enrolment Rate (GER), the pupil-
teacher ratio, expenditure per pupil, and school density, while demographic and socio-
economic variables are in STpt and Xpt. We apply White-Huber standard errors to deal with
potential heteroscedasticity.
The estimation of an EPF presents several challenges from the technical point of view,
which our dataset allows to tackle. The most important concern omitted variables, as well as
selection bias and potential endogeneity issues (Hanushek and Woessmann 2010). First, we
16 We explore the potential non-linearity of inputs by including in a separate set of specifications squared terms
as well as interaction terms of input variables at our disposal. However, according to specific tests on the
significance of such non-linearities we decided not to include them in the main specification. Results are
available upon request.

18
can address the omitted variable bias by including a rich and comprehensive array of
controls. Secondly, thanks to the panel structure of our data, we can employ lagged inputs
into the EPF regressions to limit potential endogeneity and reverse causation – although the
latter cannot be completely ruled out. Thirdly, since we use provincial figures based on the
whole population, the data that we use should not be prone to selection and self-selection bias
at the individual and school level. By the same token, bias from unobservable differences in
individual ability should not be an issue in our regressions, since we focus on the aggregate
provincial-level measures (see Schwartz and Zabel 2013 for an in-depth overview).
After measuring the effectiveness in the production of literacy for each cross-section in five
benchmark years (i.e. how inputs relate to literacy), we include the pre-unification literacy
rate estimated by Ciccarelli and Weisdorf (2018) among the controls, to proxy for educational
attainment in the first half of the 19th century (1831). Another model performs the same
exercise by exploiting the panel structure of our dataset through different techniques, such
as pooled OLS (POLS) and fixed-effect estimations. Finally, we extend our analysis by
including alternative measures of pre-unitarian schooling and further relevant variables
highlighted in the literature on the expansion of mass schooling.
4.2. Results
Cross section analysis
We estimate the EPF in five separate cross-section regressions spanning the entire period
under examination. In Table 2, we regress the literacy rate of young people aged 15-19 on
school inputs (which are entered with a lag of 10 years) in a basic specification throughout
Columns 1 to 5, whereas Columns 6 to 10 include an additional set of covariates aimed to
capture geography, demography, and economic and social features.
By doing so, we aim to provide a preliminary assessment of whether getting more public
schooling was worth the financial effort, against the hypothesis that the development of
literacy was mainly driven by demand-side and other contextual factors (e.g., economic,
social, institutional, or demographic developments).
Table 2, Columns 1 to 5, shows that the literacy rate and the primary GER are strongly
correlated, mainly at the 1-percent level of significance. The magnitude of the coefficient
indicates that a 1-percentage-point increase in the enrolment rate in 1861 was associated with
a 0.34-percentage-point change in the literacy rate of the same cohort ten years later – with

19
the estimated coefficient becoming larger throughout time. In 1911, the literacy return to
schooling is equal to 62 literates for every 100 pupils enrolled ten years before. The pupil-
teacher ratio and the density of schools are also positively correlated with literacy, especially
in 1871, 1881, and 1901. The expenditure per pupil is characterized by a positive coefficient,
which is significant at the 5-percent level in the first four benchmark years. However, it is
worth noting that the latter three inputs contributed to literacy to a lesser extent than the GER.
For example, the direct impact of expenditure was rather limited, although more resources
into schooling likely affected literacy via inputs: our estimates suggest that every additional
1000 per-capita Lire spent on primary education (an immense increase) would improve the
literacy rate of youngsters ten years later by an amount always below one percentage point –
holding everything else constant. We thus observe that more resources into schooling
mattered when schooling and human capital accumulation were very limited. Generally
speaking, literacy benefitted from a better supply of schooling and higher enrolments.
When a more comprehensive set of covariates are included in Columns 6 to 10, the main
results hold true, with the main exception for the GER, the statistical significance of which is
chipped away in 1871 but remains strong in later years. The positive coefficient of the pupil-
teacher ratio may suggest that, in late-19th century Italy, class size was not linked to literacy
via the quality of schooling. As mentioned in Section 2, Westberg and Cappelli (2019) argue
that, around 1881, the best performers in schooling and human capital among Italian
provinces were those with a large class size. Based on this, and assuming that the quality of
teachers was higher there where the pupil-teacher ratio was higher (a sensible assumption
given the above), the coefficient may be indirectly capturing the quality of schooling – which
is something that we cannot include in our analysis, obviously due to the lack of historical
figures on the matter. An alternative – and possibly complementary – interpretation is that the
beginning of mass schooling was characterized by economies of scale in the provision of
education. All other factors being held constant, allocating the same teaching time to more
children may have resulted in more of them getting literate, even when the quality of teaching
does not change. To sum up, our estimates provide evidence that putting more resources into
the school system and getting more schooling was important to improve literacy.
Next, in Table 3, we add literacy rates in the early-19th century among the regressors in the
model with all the controls. Our results confirm our prior on the persistence and long-lasting
effect of past educational policies: pre-unification literacy is positively correlated with our
dependent variable in a significant way between 1871 and 1901. The effect is not negligible.

20
Keeping all else constant, a 10 percentage-point positive variation in pre-unification literacy
is associated with an increase in the literacy rate of the youngsters by 3.9 and 4.8 percentage
points in 1881 and 1901 respectively, to decrease to 2.7 percentage points in 1901. In 1911
this effect fades out, possibly due to the implementation of the reforms in the first decade of
the 20th century, as described in Section 2. This issue is scrutinized more thoroughly in the
next paragraph.

21
Table 2: Education Production Function: cross section estimates, 1871-1911
(1) (2) (3) (4) (5) (6) (7) (8) (9) (10)
1871 1881 1891 1901 1911 1871 1881 1891 1901 1911
Estimation technique: OLS Literacy Rate 15-19
GER municipal sch. 0.343*** 0.511*** 0.573*** 0.643*** 0.623*** 0.078 0.102* 0.229*** 0.204*** 0.244***
(0.032) (0.068) (0.049) (0.059) (0.053) (0.058) (0.059) (0.051) (0.056) (0.064)
Pupil-Teacher ratio (municipal) 0.005*** 0.004*** 0.002 0.004** 0.001 0.003*** 0.002* 0.002** 0.001 0.001
(0.002) (0.002) (0.002) (0.002) (0.001) (0.001) (0.001) (0.001) (0.001) (0.001)
Expenditure per pupil 0.004** 0.007** 0.003** 0.004*** 0.001 0.001 0.006*** 0.002*** 0.001 0.001
(0.002) (0.003) (0.001) (0.001) (0.001) (0.001) (0.001) (0.001) (0.001) (0.000)
School density 0.491*** 0.369 0.238 0.175 0.127** 0.310** 0.656*** 0.293* 0.133 0.091
(0.143) (0.231) (0.178) (0.113) (0.049) (0.154) (0.223) (0.173) (0.166) (0.177)
Geography No No No No No Yes Yes Yes Yes Yes
Demography No No No No No Yes Yes Yes Yes Yes
Economic and social controls No No No No No Yes Yes Yes Yes Yes
Observations 69 69 69 69 69 69 69 69 69 69
Adjusted R-squared 0.823 0.863 0.886 0.887 0.904 0.970 0.970 0.979 0.977 0.972 Notes: OLS estimates are reported with White-Huber robust standard errors in parentheses. *** p<0.01, ** p<0.05, * p<0.1. A constant is always included. All control variables when included
are latitude, longitude, average temperature, average rainfalls, population density, dependency ratio, infant mortality rate, height, share of labour force in agriculture, rate of outward migration,
industrial VA per capita, electoral franchise, parental literacy rate.

22
Table 3: Education Production Function and legacy of history: cross section estimates, 1871-1911
(11) (12) (13) (14) (15)
1871 1881 1891 1901 1911
Estimation technique: OLS Literacy Rate 15-19
GER municipal sch. 0.029 0.020 0.156*** 0.164*** 0.243***
(0.054) (0.043) (0.050) (0.053) (0.060)
Pupil-Teacher ratio (municipal) 0.003*** 0.002 0.003*** 0.002 0.001
(0.001) (0.001) (0.001) (0.001) (0.001)
Expenditure per pupil 0.000 0.005*** 0.002*** 0.001 0.001
(0.001) (0.001) (0.001) (0.001) (0.000)
School density 0.314** 0.608*** 0.331** 0.177 0.095
(0.123) (0.173) (0.149) (0.156) (0.170)
Literacy rate 1831 0.389*** 0.484*** 0.301*** 0.272*** 0.012
(0.107) (0.144) (0.081) (0.091) (0.103)
Geography Yes Yes Yes Yes Yes
Demography Yes Yes Yes Yes Yes
Economic and social controls Yes Yes Yes Yes Yes
Observations 69 69 69 69 69
Adjusted R-squared 0.975 0.977 0.982 0.980 0.971
Notes: Robust standard errors in parentheses. *** p<0.01, ** p<0.05, * p<0.1. A constant is always included. All control variables included are latitude, longitude, average
temperature, average rainfalls, population density, dependency ratio, infant mortality rate, height, share of labour force in agriculture, rate of outward migration, industrial
VA per capita, electoral franchise, parental literacy rate.

23
Panel estimates: dynamics and persistence
In Table 4, we estimate the EPF again by pooling our cross sections – i.e. by exploiting the
panel structure of our data.17 We first rely on a pooled OLS model (POLS), then we
implement a FE panel-data model; in further specifications, we explore the determinants of
schooling by including macro-regional dummies (instead of provincial FEs) to control for
common shocks and other common features of the areas concerned, but allowing for time-
invariant factors – like historical schooling – to be included in the regressions.
As the panel estimates show, the GER and the expenditure per pupil are consistently and
positively correlated with educational outcomes at the 1-percent level of significance. The
pupil-teacher ratio is positively correlated with literacy rates, while the result for school
density is mixed. Overall, the cross-section results are consistent with panel-data estimates,
meaning that school inputs can explain the variation of literacy across provinces, but also the
change in literacy rates within provinces or macro-areas over time. All in all, the results
confirm that school inputs mattered for the development of human capital in late-19th century
Italy. Among the controls, which are not reported in Table 4, we find parental literacy rates to
have been a strong determinant of the literacy of young people, the coefficients being
statistically significant at the 1-percent level; our proxy for socio-economic well-being,
height, is also positively correlated with literacy – which seems to stand as evidence backing
up the so-called modernization hypothesis, namely the claim that as a society becomes
wealthier and more industrialized, more emphasis is placed on education and human capital
accumulation. Our result is also in line with the view that good nutrition and wellbeing may
prompt better cognitive capabilities (Tollnek and Baten 2017); the share of people employed
in agriculture is also strongly and negatively correlated with literacy, providing evidence that
the opportunity cost of education was still pressing at that time; finally, electoral franchise,
i.e. the share of males entitled to vote in local elections, is positively correlated with literacy,
as expected, since the expansion of suffrage is commonly correlated with the expansion of
education.18
The macro-regional dummies, included in Columns 3-5, show that provinces located in the
Northwest of the country, the omitted reference category, were characterized by a positive
premium on literacy rates with respect to the Centre and – even more – the South, a variation
17 In POLS estimates in Table 4, standard errors are not clustered at the provincial level. However, applying
clustering does not change the significance of our results. The latter estimates are available upon request. 18 Results are unchanged when in Table 4, model 2, we introduce a lag of literacy in the previous grade, that is
the literacy rate of the youngsters when were children aged 6-10.

24
which is not explained by any of the factors included in our EPF. Interestingly, the
significance of these coefficients does not fade out completely, even when historical literacy
(1831) is included in the analysis (columns 4 and 5). This calls for a further exploration of
regional disparities in features that are normally unobservable, like school efficiency, and
need to be estimated – as we do in the second part of the paper.
Consistently with Table 3, early-19th century literacy rate has a strong long-term effect on our
education outcome. When we investigate this relationship throughout time (with the inclusion
of interactions of 1831 literacy with the year dummies) we see again that the effect fades out
only in 1911, the last period under scrutiny.

25
Table 4: Education Production Function: panel estimates, 1871-1911
(1) (2) (3) (4) (5)
Literacy rate 15-19
Estimation technique: POLS FE POLS POLS POLS
GER municipal sch. (lag 10) 0.214*** 0.129*** 0.136*** 0.113*** 0.131***
(0.019) (0.024) (0.019) (0.019) (0.018)
Pupil-Teacher ratio (lag 10) 0.002*** 0.001*** 0.003*** 0.003*** 0.002***
(0.000) (0.000) (0.000) (0.000) (0.000)
Expenditure per pupil (lag 10) 0.001*** 0.000 0.001*** 0.001*** 0.001***
(0.000) (0.000) (0.000) (0.000) (0.000)
School density (lag 10) 0.054 0.074 -0.022 0.010 -0.028
(0.045) (0.048) (0.041) (0.040) (0.041)
Northeast -0.047*** -0.035*** -0.041***
(0.009) (0.009) (0.009)
Centre -0.090*** -0.073*** -0.081***
(0.011) (0.010) (0.010)
South -0.116*** -0.097*** -0.102***
(0.019) (0.019) (0.018)
Literacy rate 1831 0.211***
(0.041)
LR1831*year1881 0.210***
(0.039)
LR1831*year1891 0.161***
(0.037)
LR1831*year1901 0.222***
(0.048)
LR1831*year1911 0.017
(0.054)
Geography yes no yes yes yes
Demography yes yes yes yes yes
Economic and social controls yes yes yes yes yes
Year dummies yes yes yes yes yes
Macro-regions no no yes yes yes
Province FE no yes no no no
Observations 345 345 345 345 345
Provinces 69 Adjusted R-squared 0.978 0.973 0.945 0.983 0.984
Notes: Robust standard errors in parentheses. *** p<0.01, ** p<0.05, * p<0.1. A constant is always included.
The omitted macro-region dummy is Northwest. All control variables are latitude, longitude, average
temperature, average rainfalls, population density, dependency ratio, infant mortality rate, height, share of
labour force in agriculture, rate of outward migration, industrial VA per capita, electoral franchise, parental
literacy rate.
Finally, starting from model 3 in Table 4 as a benchmark, we run further regressions as
robustness checks. In the first three columns of Table 5, we drop early-19th century literacy
and include three pre-unification measures of school inputs taken from Vigo (1971): the
GER, the pupil-teacher ratio and the supply of teachers (number of teachers over the total
population of the province). This is the first time that these variables are employed in

26
econometric analysis and, due to data availability, when they are included the total number of
observations declines. All the three new variables show a strong correlation with the
dependent variable at the 5-percent of significance, validating our argument.
Finally, as highlighted by Cinnirella and Hornung (2016), as well as Beltrán-Tapia and
Martinez-Galarraga (2018), education may be delayed by landed elites: we therefore include
an index of land inequality from Cappelli (2017b). As expected, model 4 shows that restricted
access to land is negatively and strongly correlated with the literacy rate yet leaving our
previous results on inputs qualitatively unchanged.

27
Table 5: Education Production Function: panel estimates, further controls, 1871-1911 (1) (2) (3) (4)
Estimation technique: POLS Literacy rate 15-19
GER municipal sch. (lag 10) 0.129*** 0.156*** 0.151*** 0.140***
(0.024) (0.024) (0.024) (0.019)
Pupil-Teacher ratio (lag 10) 0.003*** 0.003*** 0.003*** 0.002***
(0.000) (0.000) (0.000) (0.000)
Expenditure per pupil (lag 10) 0.001*** 0.001*** 0.001*** 0.001***
(0.000) (0.000) (0.000) (0.000)
School density (lag 10) -0.178* -0.140 -0.127 -0.028
(0.093) (0.092) (0.091) (0.042)
Pre-unification GER 0.001***
(0.000)
Pre-unification pupil-teacher ratio 0.001**
(0.000)
Pre-unification supply of teachers 0.001**
(0.001)
Index of land inequality -0.018**
(0.007)
Geography yes yes yes yes
Demography yes yes yes yes
Economic and social controls yes yes yes yes
Year dummies yes yes yes yes
Macro-regions yes yes yes yes
Observations 250 250 260 345
Adjusted R-squared 0.983 0.982 0.982 0.982
Notes: Robust standard errors in parentheses. *** p<0.01, ** p<0.05, * p<0.1. A constant is always included.
All control variables included are latitude, longitude, average temperature, average rainfalls, population density,
dependency ratio, infant mortality rate, height, share of labour force in agriculture, rate of outward migration,
electoral franchise, parental literacy rate.
5. Measuring efficiency: Data Envelopment Analysis (DEA) and determinants
As often emphasized by studies in the field of education economics (Hanushek 1986), the
relationship between resources and educational outcomes is not straightforward, since it
depends on the efficiency of the education system. Therefore, although exploring the
relationship between school inputs and educational outcomes in an EPF framework is crucial
to understand the factors behind the diffusion of mass education, some of the variation across
school outcomes remains unexplained by socio-economic and other environmental factors.
28
For this reason, exploring school efficiency – i.e. the degree of capability in transforming
inputs into achievements – constitutes another piece of evidence that is worth considering.
To measure efficiency, we rely on Data Envelopment Analysis (DEA), which is a non-
parametric linear programming technique elaborated by M. J. Farrell (1957) and then by A.
Charnes et al. (1978). DEA captures the relative efficiency of a set of homogenous Decision-
Making Units (in our case, provinces) and determines the efficiency in converting inputs into
outputs. In a decentralized primary-education system like Italy’s one in the late 19th century,
it is reasonable to assume that the provinces are homogeneous DMUs.
DEA analysis assumes the existence of a convex production frontier. This frontier is basically
constructed using linear programming methods, the term “envelopment” being used because
the frontier envelops the set of observations. This methodology allows the calculation of
technical efficiency measures that can be either input or output oriented.
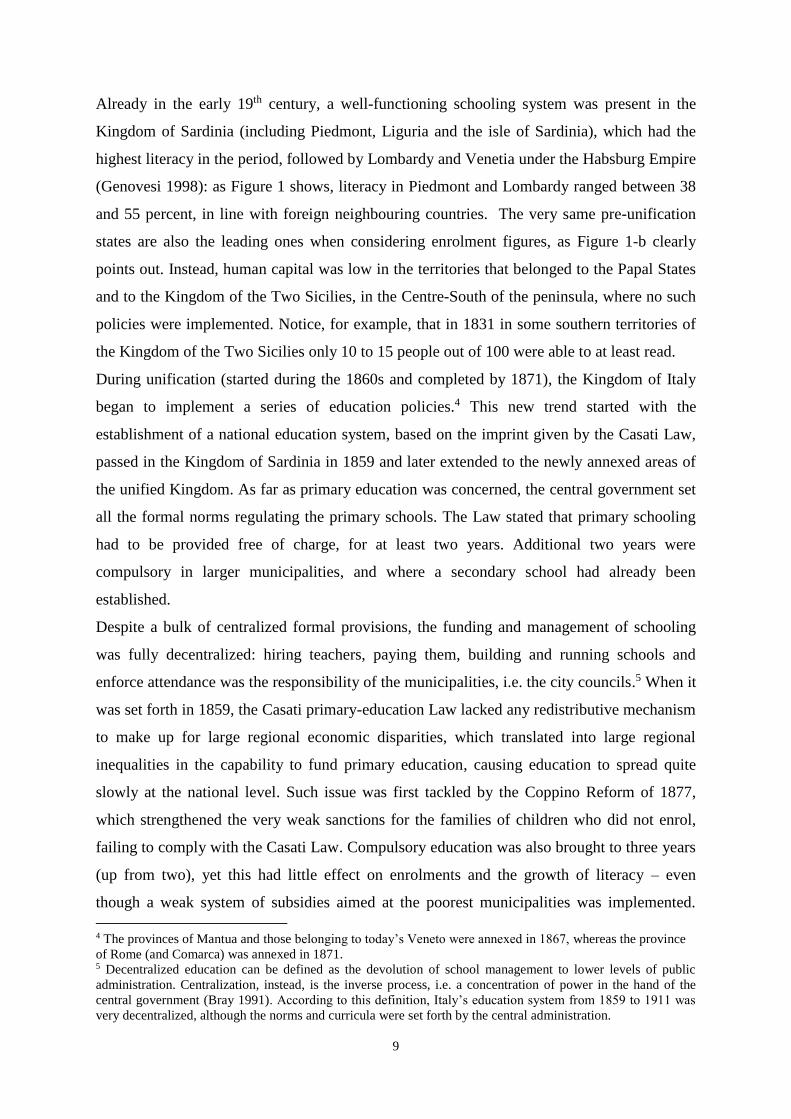
Figure 6: School efficiency for youngsters (age group 15-19): DEA efficiency scores.
1871
1911
Notes: the outcome is literacy rates for the age group 15-19. The school inputs employed in the calculations are
GER, pupil-teacher ratio, expenditures per pupil, and school density, all taken with a lag of 10 years. Source: see
text. Efficiency is measured by the Thetas, i.e. efficiency scores, ranging from 0 to 1 (1 being efficient).The
darker the shade, the higher the efficiency score.

29
Estimates of school efficiency are reported in Figure 6 in 1871 and 1911.19 A value of 1
represents provinces on the estimated efficiency frontier, while sub-efficient units are within
the 0-1 range.
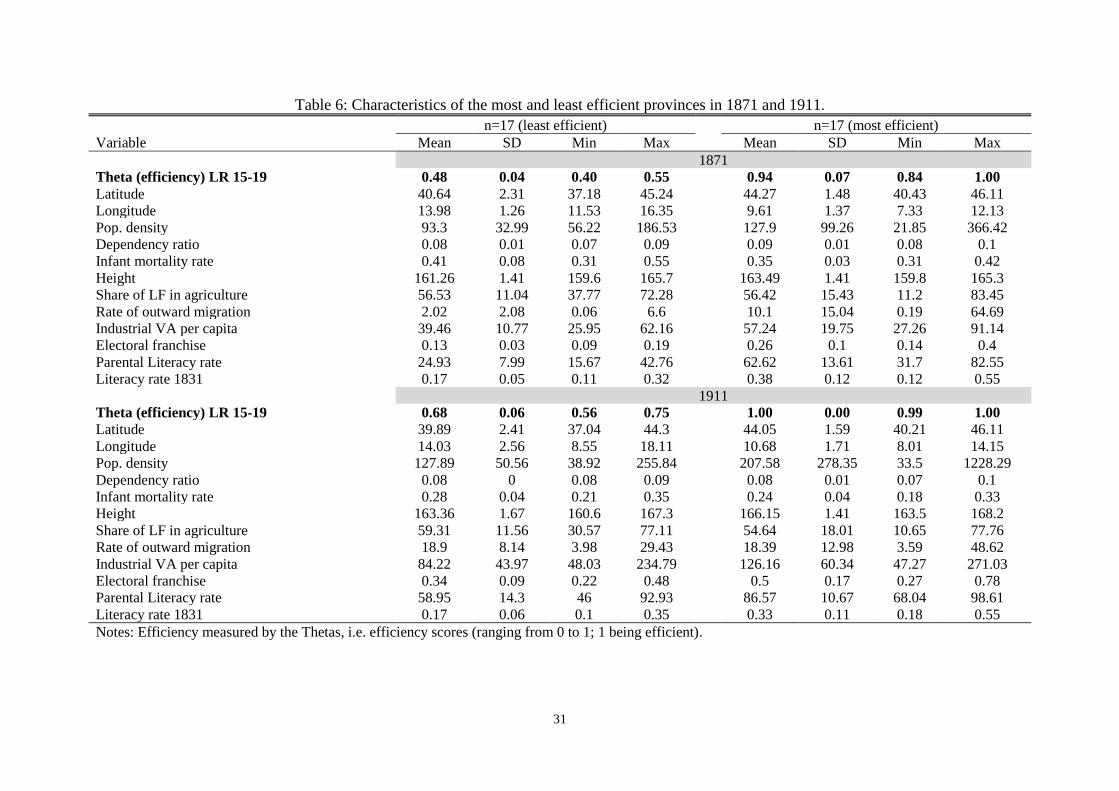
We choose the output-oriented estimates because we are interested in how much literacy is
likely to grow given the quantity of inputs observed20 and assume Constant Returns to Scale
(CRS). However, we check our results by alternatively assuming Variable Returns to Scale
(VRS) as well and find that the ranking of the provinces in terms of school efficiency remains
virtually the same: Figure A.1 in the Appendix visually explores the high correlation
between our CRS and VRS estimates. We explain this result with the fact that, assuming a
common S-shaped model for the diffusion of education in developing countries (Bloom
2006), most Italian provinces – the literacy rate of which ranged between 10 and 65 percent –
were likely to be characterized by the same constant relationship between inputs and outputs,
i.e. literacy changing by the same proportion as inputs into schooling grew over time. This
was the case across Italy’s provinces in the late 19th century because none of them had
literacy rates close to zero or to 100 percent, hence the majority of them was not affected by
increasing or decreasing returns to scale.
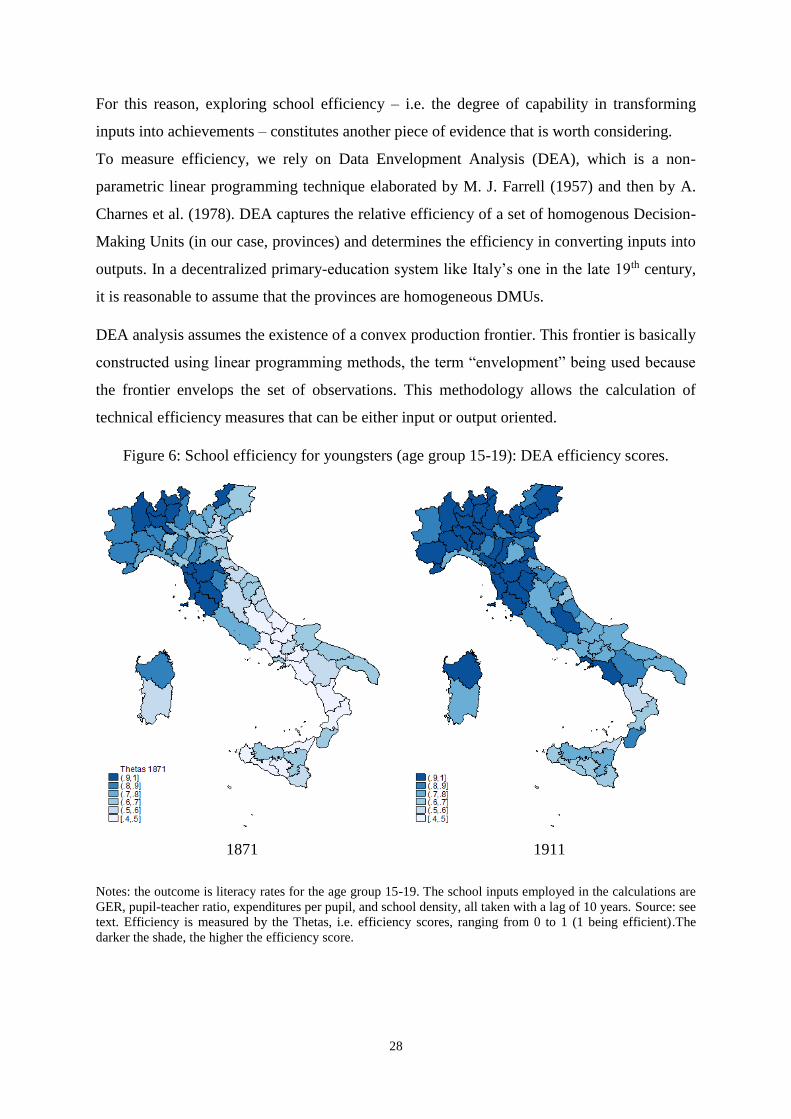
In Table 6, we present the main characteristics of the most efficient and least efficient
provinces. In 1871, among the former, we find the provinces of Belluno in the Northeast,
Como and Sondrio in the Northwest, Florence, Livorno, Lucca, and Grosseto in the Centre,
all placed on the efficiency frontier (theta=1). They are followed by a group of provinces
mostly located in the North of the country, i.e. Bergamo, Milan, and Novara. The average
score of these provinces is 0.94, very close to the estimated efficiency frontier. The least
efficient provinces are instead mostly located in the Centre and South of the country, mainly
in the territories previously belonging to the pre-unification Kingdom of the Two Sicilies:
Avellino, Benevento, Salerno (in Campania), Teramo, Chieti and Aquila (in the Abruzzi), as
well as many others located in Calabria and Sicily. Some exceptions to this regional pattern
are Padova, Pesaro Urbino, and Ascoli Piceno, which are located in the Centre-North. The
average score among the least efficient provinces is 0.48. As far as other features of these two
groups are concerned, one may notice that they differ in many more respects: the most
efficient provinces feature higher population densities and outmigration rates, more rapid
19 Provincial estimates for all benchmark years are not provided but available upon request. 20 We apply the DEA command in Stata as elaborated by Yong-Bae Ji and Choonjoo Lee (2010).

30
industrialization, as well as more solid endowment of parental human capital and historical
(pre-unification) literacy.
31
Table 6: Characteristics of the most and least efficient provinces in 1871 and 1911.
n=17 (least efficient) n=17 (most efficient)
Variable Mean SD Min Max Mean SD Min Max
1871
Theta (efficiency) LR 15-19 0.48 0.04 0.40 0.55 0.94 0.07 0.84 1.00
Latitude 40.64 2.31 37.18 45.24 44.27 1.48 40.43 46.11
Longitude 13.98 1.26 11.53 16.35 9.61 1.37 7.33 12.13
Pop. density 93.3 32.99 56.22 186.53 127.9 99.26 21.85 366.42
Dependency ratio 0.08 0.01 0.07 0.09 0.09 0.01 0.08 0.1
Infant mortality rate 0.41 0.08 0.31 0.55 0.35 0.03 0.31 0.42
Height 161.26 1.41 159.6 165.7 163.49 1.41 159.8 165.3
Share of LF in agriculture 56.53 11.04 37.77 72.28 56.42 15.43 11.2 83.45
Rate of outward migration 2.02 2.08 0.06 6.6 10.1 15.04 0.19 64.69
Industrial VA per capita 39.46 10.77 25.95 62.16 57.24 19.75 27.26 91.14
Electoral franchise 0.13 0.03 0.09 0.19 0.26 0.1 0.14 0.4
Parental Literacy rate 24.93 7.99 15.67 42.76 62.62 13.61 31.7 82.55
Literacy rate 1831 0.17 0.05 0.11 0.32 0.38 0.12 0.12 0.55
1911
Theta (efficiency) LR 15-19 0.68 0.06 0.56 0.75 1.00 0.00 0.99 1.00
Latitude 39.89 2.41 37.04 44.3 44.05 1.59 40.21 46.11
Longitude 14.03 2.56 8.55 18.11 10.68 1.71 8.01 14.15
Pop. density 127.89 50.56 38.92 255.84 207.58 278.35 33.5 1228.29
Dependency ratio 0.08 0 0.08 0.09 0.08 0.01 0.07 0.1
Infant mortality rate 0.28 0.04 0.21 0.35 0.24 0.04 0.18 0.33
Height 163.36 1.67 160.6 167.3 166.15 1.41 163.5 168.2
Share of LF in agriculture 59.31 11.56 30.57 77.11 54.64 18.01 10.65 77.76
Rate of outward migration 18.9 8.14 3.98 29.43 18.39 12.98 3.59 48.62
Industrial VA per capita 84.22 43.97 48.03 234.79 126.16 60.34 47.27 271.03
Electoral franchise 0.34 0.09 0.22 0.48 0.5 0.17 0.27 0.78
Parental Literacy rate 58.95 14.3 46 92.93 86.57 10.67 68.04 98.61
Literacy rate 1831 0.17 0.06 0.1 0.35 0.33 0.11 0.18 0.55
Notes: Efficiency measured by the Thetas, i.e. efficiency scores (ranging from 0 to 1; 1 being efficient).

32
The DEA estimates suggest that the North was clearly ahead of other regions within the
country in 1871, yet the advantage did tend to fade out in the long run. It is worth noting that,
as Figures 8 and 9 also show, more rapid convergence did not occur until the first decade of
the 20th century. This means that early (weak) education reforms that amended formal rules
but did not affect the management and the level of school autonomy in the system – like the
Coppino Law of 1877 – had little impact on Italy’s education. Instead, convergence in
efficiency accelerated remarkably when the state stepped in into matters related to primary
schooling, in the early-20th century (it did so quite mildly during the first decade of the 20th
century, and more decidedly with the Daneo-Credaro Reform of 1911). The pattern of
persistence that we find may be linked to the long shadow that pre-unification school systems
cast on post-unification Italy. We put forward the hypothesis that the North of the country –
where public compulsory schooling had been established well before 1861 – had a cognitive
and organizational advantage in the development of education under a decentralized primary-
school system, whereas the South – where public schooling had long been absent before
unification – experienced a deficit in that sense.
Figure 8: Unweighted average of DEA efficiency for ancient pre-unitarian states and polities.
Source: see text

33
Figure 9 – Unweighted average of DEA efficiency for the North and the South
of Italy,
Note: mreg = N is the efficiency trend of the North, while mreg = S represents that of the
South. Source: see text.
After measuring efficiency for each province through to the DEA methodology, we now
explore the determinants of school efficiency through a methodology devised by Simar and
Wilson (2007),21 which connects the environmental (non-discretionary) variables to the DEA
scores to give further insights into the drivers of school efficiency in Liberal Italy.22 Again,
we include early-19th-century literacy rates from pre-unification. We also include all
variables taken into account in the most complete specification when estimating the EPFs, i.e.
geography (latitude, longitude, temperature, and rainfall), demography (population density,
the proxy for the child-dependency ratio, and the infant mortality rate), and socio-economic
controls (height, industrial VA per capita, the share of LF in agriculture, the outward
migration rate, and parental literacy). Since efficiency can be thought of as a residual measure
with respect to these features – as the EPFs previously estimated suggest –, we do not expect
to find a strong correlation between them and school efficiency.
21 Simar and Wilson (2007) estimate the role of non-discretionary inputs on efficiency scores using a truncated
regression with bootstrapped robust standard errors. 22 Antonio Afonso and Miguel Aubyn (2006) apply the same approach for the measurement of efficiency in
contemporary secondary education across Europe. We are not aware of any study that employs this technique in
historical perspective.

34
Table 7 shows that school efficiency was systematically affected by historical legacies before
1901, but with a declining intensity over time. Instead, the correlation between post-school
efficiency and parental literacy is significant up to 1901, i.e. right before the primary-school
system was first changed by state intervention, not only with more funding but also with a
stronger protection of the rights of the teachers – a first institutional reform (the Nasi Law)
that somehow paved the way for increased centralization starting in 1911. The more
persistent effect of parental human capital may be due to the fact that this variable pertains to
people who had already completed some schooling, thus being not directly affected by the
changes in the education system itself.
Table 7: Determinants of school efficiency, 1871 – 1911, age group 15-19.
(1) (2) (3) (4) (5)
Dependent variable: efficiency (Thetas) Efficiency in producing literacy (age group 15-19)
1871 1881 1891 1901 1911
Height -0.007 0.0008 -0.0037 -0.0072 -0.009
(0.017) (0.016) (0.012) (0.010) (0.019)
Share of LF in agriculture -0.001 -0.0003 -0.0005 -0.0004 -0.003
(0.002) (0.001) (0.001) (0.002) (0.003)
Rate of outward migration -0.001 0.008*** 0.0014 -0.0015 -0.004*
(0.003) (0.003) (0.001) (0.002) (0.002)
Industrial VA per capita -0.001 -0.001 -0.001 -0.002** -0.001
(0.001) (0.001) (0.001) (0.001) (0.001)
Electoral franchise -0.445 -0.4918 0.0381 0.0387 0.03
(0.474) (0.398) (0.203) (0.198) (0.213)
Parental literacy rate 0.006** 0.006** 0.004** 0.005*** 0.0004
(0.002) (0.003) (0.002) (0.002) (0.003)
Literacy rate 1831 0.689** 0.636** 0.472** 0.138 -0.015
(0.326) (0.289) (0.189) (0.215) (0.309)
Geography yes yes yes yes yes
Demography yes yes yes yes yes
Sigma 0.089*** 0.083*** 0.061*** 0.061*** 0.086***
(0.008) (0.008) (0.006) (0.006) (0.010) Observations 69 69 69 69 69
Notes: Standard errors in parentheses. *** p<0.01, ** p<0.05, * p<0.1. Geographic controls include latitude,
longitude, average temperature, average rainfalls. Demographic controls include population density, dependency
ratio, infant mortality rate.

35
6. Conclusions
Italy represents an ideal case study of the relationship between historical institutions and
reforms in the long run. Thanks to a new dataset, we explore to what extent school inputs
mattered for the growth of literacy – controlling for demand-side and other environmental
factors. First, we find that school was worth getting, as more expenditure per pupil, a higher
enrolment rate and school density are generally correlated with higher human capital. This
means that, under Italy’s decentralized education system, local school inputs and resource
endowments strongly affected outcomes, pointing out the persistence of regional disparities
stemming from pre-unification states. Indeed, we also show that this pattern is partly due to
historical legacies, because literacy correlates significantly with pre-unification measures of
schooling attainment and literacy. Despite much debate on the issue, this is the first evidence
that explicitly relates local conditions and inputs into schooling to the spread of literacy at the
local level, and our findings back up claims that the decentralized schooling system set forth
by the Casati Law in 1859 did not fit well much of the regions in the new Kingdom of Italy
due to limited fiscal capacity and electoral franchise and, as a consequence, limited school
inputs (Vasta 1999; Felice and Vasta 2015; Cappelli 2017a).
Since some of the variation in literacy rates across regions of the country is not explained by
the variables considered in the EPF framework (even when including macro-regional
dummies and pre-unification education), we estimate school efficiency at the provincial level
by using Data Envelopment Analysis. The estimated school-efficiency scores show that
regional efficiency-related disparities were large, and that they did not decline up to the eve
of the 20th century. This is an important result, as one may put forward that early education
reforms that tried to make the education system more effective failed, insofar as they did not
affect the decentralized management of schooling – providing only subsidies with no change
in the institutions regulating schooling at the central and local level up to the first decade of
the 20th century (De Fort 1996).
We argue that school efficiency, too, was largely a historical legacy of pre-unification states.
The strong, positive correlation between early-19th century literacy and human capital five to
eight decades later confirms that large pre-unification regional inequality cast a long shadow.
Only when the state started to limit the choices of the municipalities and their school
autonomy, for example by limiting their discretionary power concerning hiring and layoff of
teachers and by transferring some of the administrative responsibility to the central

36
authorities, did the regions of Italy start to converge in terms of school efficiency; the fact
that the correlation between local school inputs and literacy becomes weaker in the first
decade of the 20th century is suggestive of such a change.
Our results related to the broader literature on institutional persistence, change and economic
development broadly defined. As shown by other studies, human capital accumulation is a
long-term process prone to historical legacies (Chaudhary and Garg 2015; Bertocchi and
Bozzano 2016); yet, public choices and changes – whether exogenous or driven by policy –
can affect a country’s development path (Cogneau and Moradi 2014). This study shows that
important institutional features, like the decentralized nature of the education system,
together with specific school reforms, can have important implications for long-term human
capital accumulation and, in turn, for economic performance.
References
Acemoglu, Daron, Simon Johnson, and James A. Robinson. 2001. “The Colonial Origins of
Comparative Development: An Empirical Investigation.” American Economic Review
91 (5): 1369–1401.
Afonso, Antonio, and Miguel Aubyn. 2006. “Cross-Country Efficiency of Secondary
Education Provision: A Semi-Parametric Analysis with Non-Discretionary Inputs.”
Economic Modelling 23 (3): 476–91.
A’Hearn, Brian, and Giovanni Vecchi. 2011. “Statura.” In In ricchezza e in povertà: il
benessere degli italiani dall’Unità a oggi, edited by Giovanni Vecchi, 37–72.
Bologna: Il Mulino.
———. 2017. “Education.” In Measuring Wellbeing: A History of Italian Living Standards,
edited by Giovanni Vecchi. New York: Oxford University Press.
Alston, Lee J. 2017. “Beyond Institutions: Beliefs and Leadership.” The Journal of Economic
History 77 (2): 353–72.
Andersson, Jens, and Thor Berger. 2018. “Elites and the Expansion of Education in
Nineteenth-Century Sweden.” The Economic History Review Online.
Basile, Roberto, and Carlo Ciccarelli. 2018. “The Location of the Italian Manufacturing
Industry, 1871–1911: A Sectoral Analysis.” Journal of Economic Geography 18 (3):
627–61.
Baten, Joerg, and Matthias Blum. 2014. “Why Are You Tall While Others Are Short?
Agricultural Production and Other Proximate Determinants of Global Heights.”
European Review of Economic History 18 (2): 144–65.
Baten, Joerg, and Ralph Hippe. 2018. “Geography, Land Inequality and Regional Numeracy
in Europe in Historical Perspective.” Journal of Economic Growth 23 (1): 79–109.
Baten, Joerg, and Dácil Juif. 2014. “A Story of Large Landowners and Math Skills:
Inequality and Human Capital Formation in Long-Run Development, 1820–2000.”

37
Journal of Comparative Economics, Economic Systems in the Pacific Rim Region
Symposium, 42 (2): 375–401.
Baten, Jörg, and Alexandra de Pleijt. 2018. “Female Autonomy Generates Superstars in
Long-Term Development: Evidence from 15th to 19th Century Europe.” CEPR
Discussion Papers no. 13348. CEPR.
Beltrán Tapia, Francisco J., and Julio Martinez-Galarraga. 2018. “Inequality and Education in
Pre-Industrial Economies: Evidence from Spain.” Explorations in Economic History
69: 81–101.
Bertocchi, Graziella, and Monica Bozzano. 2016. “Women, Medieval Commerce, and the
Education Gender Gap.” Journal of Comparative Economics 44 (3): 496–521.
Bozzano, Monica, and Gabriele Cappelli. 2018. “Human Capital and the School System in
Liberal Italy, 1861-1911: A Comprehensive Dataset on Inputs, Outputs, and
Outcomes.” Mimeo.
Bray, Mark. 1991. “Centralization Versus Decentralization in Educational Administration:
Regional Issues.” Educational Policy 5 (4): 371–85.
Cappelli, Gabriele. 2016. “One Size That Didn’t Fit All? Electoral Franchise, Fiscal Capacity
and the Rise of Mass Schooling across Italy’s Provinces, 1870–1911.” Cliometrica 10
(3): 311–43.
———. 2017a. “Capitale umano e crescita economica: l’evoluzione del sistema educativo
italiano.” In Ricchi per caso. La parabola dello sviluppo economico italiano, edited
by Paolo Di Martino and Michelangelo Vasta, 75–128. Bologna: Il Mulino.
———. 2017b. “Was Putnam Wrong? The Determinants of Social Capital in Italy around
1900.” Rivista Di Storia Economica, no. 3/2017: 277–314.
Cappelli, Gabriele, and Michelangelo Vasta. 2017. “Can School Centralization Foster Human
Capital Accumulation? Quasi-Experimental Evidence from Italy’s Liberal Age.”
Mimeo.
Card, David, and Alan Krueger. 1992. “Does School Quality Matter? Returns to Education
and the Characteristics of Public Schools in the United States.” Journal of Political
Economy 100 (1): 1–40.
Charnes, A., W. W. Cooper, and E. Rhodes. 1978. “Measuring the Efficiency of Decision
Making Units.” European Journal of Operational Research 2 (6): 429–44.
Chaudhary, Latika, and Manuj Garg. 2015. “Does History Matter? Colonial Education
Investments in India.” The Economic History Review 68 (3): 937–61.
Ciccarelli, Carlo, and Stefano Fachin. 2017. “Regional Growth with Spatial Dependence: A
Case Study on Early Italian Industrialization.” Papers in Regional Science 96 (4):
675–95.
Ciccarelli, Carlo, and Stefano Fenoaltea. 2013. “Through the Magnifying Glass: Provincial
Aspects of Industrial Growth in Post-Unification Italy.” Economic History Review 66
(1): 57–85.
Ciccarelli, Carlo, and Peter Groote. 2017. “Railway Endowment in Italy’s Provinces, 1839-
1913.” Rivista Di Storia Economica, no. 1/2017.: 45–88.
Ciccarelli, Carlo, and Jacob Weisdorf. 2018. “Pioneering into the Past: Regional Literacy
Developments in Italy before Italy.” European Review of Economic History Online.

38
Cinnirella, Francesco, and Erik Hornung. 2016. “Landownership Concentration and the
Expansion of Education.” Journal of Development Economics 121: 135–152.
Cogneau, Denis, and Alexander Moradi. 2014. “Borders That Divide: Education and Religion
in Ghana and Togo Since Colonial Times.” The Journal of Economic History 74 (3):
694–729.
Commissariato generale dell’emigrazione. 1926. Annuario statistico della emigrazione
italiana dal 1876 al 1925: con notizie sull’emigrazione dal 1869 al 1875. Roma:
Commissariato generale dell’emigrazione.
Cvrcek, Tomas, and Miroslav Zajicek. 2018. “The Making of a Liberal Education: Political
Economy of the Austrian School Reform, 1865 – 1880.” Explorations in Economic
History, July.
De Fort, Ester. 1996. La scuola elementare dall’Unità alla caduta del Fascismo. Il Mulino.
De Pleijt, Alexandra, and Jacob Weisdorf. 2017. “Human Capital Formation from
Occupations: The ‘deskilling Hypothesis’ Revisited.” Cliometrica 11 (1): 1–30.
De Pleijt, Alexandra, Alessandro Nuvolari, and Jacob Weisdorf. 2016. “Human Capital
Formation during the First Industrial Revolution: Evidence from the Use of Steam
Engines.” 294. CAGE Online Working Paper Series. Competitive Advantage in the
Global Economy (CAGE).
Di Martino, Paolo, and Michelangelo Vasta, eds. 2017. Ricchi per caso. La Parabola dello
sviluppo economico italiano. Bologna: Il Mulino.
Diebolt, Claude, Charlotte Le Le Chapelain, and Audrey-Rose Menard. 2017.
“Industrialization as a Deskilling Process? Steam Engines and Human Capital in
XIXth Century France.” 2017–17. Working Papers of BETA. Bureau d’Economie
Théorique et Appliquée, UDS, Strasbourg.
Direzione generale della statistica. various years. Stattistica della popolazione: movimento
dello stato civile. Roma.
Engerman, Stanley, and Kenneth Sokoloff. 2002. “Factor Endowments, Inequality, and Paths
of Development Among New World Economics.” NBER Working Paper no. 9259.
National Bureau of Economic Research.
Farrell, M. J. 1957. “The Measurement of Productive Efficiency.” Journal of the Royal
Statistical Society A 120: 253–81.
Federico, Giovanni, Alessandro Nuvolari, and Michelangelo Vasta. 2019. “The Origins of the
Italian Regional Divide: Evidence from Real Wages, 1861-1913.” The Journal of
Economic History 79 (1): 63–98.
Felice, Emanuele. 2012. “Regional Convergence in Italy, 1891–2001: Testing Human and
Social Capital.” Cliometrica 6 (3): 267–306.
———. 2013. Perché il Sud è rimasto indietro. Bologna: Il Mulino.
———. 2015. Ascesa e declino. Storia economica d’Italia. Bologna: Il Mulino.
Felice, Emanuele, and Michelangelo Vasta. 2015. “Passive Modernization? The New Human
Development Index and Its Components in Italy’s Regions.” European Review of
Economic History 19 (1): 44–66.
Franck, Raphaël, and Oded Galor. 2017. “Technology-Skill Complementarity in Early Phases
of Industrialization.” NBER Working Paper no. 23197. National Bureau of Economic
Research.

39
Galor, Oded. 2005. “From Stagnation to Growth: Unified Growth Theory.” In Handbook of
Economic Growth, edited by Philippe Aghion and Steven N. Durlauf, 1, Part A:171–
293. Elsevier.
Genovesi, Giovanni. 1998. Storia della scuola in Italia dal Settecento a oggi. Bari: Laterza.
Giffoni, Francesco, and Matteo Gomellini. 2015. “Brain Gain in the Age of Mass Migration.”
SSRN Scholarly Paper ID 2780393. Rochester, NY: Social Science Research
Network.
Go, Sun, and Peter Lindert. 2010. “The Uneven Rise of American Public Schools to 1850.”
The Journal of Economic History 70 (1): 1–26.
Gomellini, Matteo, and Cormac O’Grada. 2013. “Migrations.” In The Oxford Handbook of
the Italian Economy Since Unification, edited by Gianni Toniolo, 271–302. Oxford,
New York: Oxford University Press USA.
Goñi, Marc. 2018. “Landed Elites and Education Provision in England: Evidence from
School Boards, 1871-99.” Mimeo.
Hanushek, Eric A. 1986. “The Economics of Schooling: Production and Efficiency in Public
Schools.” Journal of Economic Literature 24 (3): 1141–77.
Hanushek, Eric A., and Ludger Woessmann. 2010. “Education and Economic Growth.” In
International Encyclopedia of Education, edited by Eva Baker, Berry McGaw, and
Penelope Peterson, 245–52. Amsterdam: Elsevier.
———. 2012. “Do Better Schools Lead to More Growth? Cognitive Skills, Economic
Outcomes, and Causation.” Journal of Economic Growth 17 (4): 267–321.
Hanushek, Eric A., and Lei Zhang. 2006. “Quality-Consistent Estimates of International
Returns to Skill.” NBER Working Papers no. 12664. National Bureau of Economic
Research.
Hippe, Ralph, and Faustine Perrin. 2017. “Gender Equality in Human Capital and Fertility in
the European Regions in the Past.” Investigaciones de Historia Económica, Economic
history of Europe: New approaches, new topics, 13 (3): 166–79.
Ji, Yong-Bae, and Choonjoo Lee. 2010. “Data Envelopment Analysis.” The Stata Journal 10
(2): 267–80.
Katz, Ori. 2016. “The Effect of Industrialization on Fertility and Human Capital: Evidence
from the United States in the 19th Century.” Mimeo.
Lindert, Peter. 2004. Growing Public: Social Spending and Economic Growth since the
Eighteenth Century. Vol. Vol. 1 The Story. 2 vols. Cambridge: Cambridge University
Press.
Lucas, Robert E. 1988. “On the Mechanics of Economic Development.” Journal of Monetary
Economics 22 (1): 3–42.
Maloney, William F., and Felipe Valencia Caicedo. 2016. “The Persistence of (Subnational)
Fortune.” The Economic Journal 126 (598): 2363–2401.
Michalopoulos, Stelios, and Elias Papaioannou. 2013. “Pre-Colonial Ethnic Institutions and
Contemporary African Development.” Econometrica 81 (1): 113–52.
Ministero di Agricoltura Industria e Commercio. various years. Bilanci Comunali. Rome.
Missiaia, Anna. 2014. “Industrial Location, Market Access and Economic Development:
Regional Patterns in Post-Unification Italy.” PhD, The London School of Economics
and Political Science (LSE).

40
———. 2018. “Market versus Endowment: Explaining Early Industrial Location in Italy
(1871–1911).” Cliometrica, May, 1–35.
Mitch, David. 1984. “Underinvestment in Literacy? The Potential Contribution of
Government Involvement in Elementary Education to Economic Growth in
Nineteenth-Century England.” The Journal of Economic History 44 (2): 557–66.
Morrisson, Christian, and Fabrice Murtin. 2009. “The Century of Education.” Journal of
Human Capital 3 (1): 1–42.
Nunn, Nathan. 2008. “The Long-Term Effects of Africa’s Slave Trades.” The Quarterly
Journal of Economics 123 (1): 139–76.
Nuvolari, Alessandro, and Michelangelo Vasta. 2015. “The Ghost in the Attic? The Italian
National Innovation System in Historical Perspective, 1861–2011.” Enterprise &
Society 16 (2): 270–90.
———. 2017. “The Geography of Innovation in Italy, 1861–1913: Evidence from Patent
Data.” European Review of Economic History, 1–31.
Romer, Paul M. 1990. “Endogenous Technological Change.” Journal of Political Economy
98 (5): S71–102.
Schüler, Ruth Maria. 2016. “Educational Inputs and Economic Development in End-of-
Nineteenth-Century Prussia.” 227. Ifo Working Paper Series. ifo Institute - Leibniz
Institute for Economic Research at the University of Munich.
Schwartz, Amy Ellen, and Jeffrey E. Zabel. 2013. “The Good, the Bad and the Ugly:
Measuring School Efficiency Using School Production Functions.” In Measuring
School Performance & Efficiency, edited by Leanna Steifel. Routledge.
Simar, Leopold, and Paul Wilson. 2007. “Estimation and Inference in Two-Stage, Semi-
Parametric Models of Production Processes.” Journal of Econometrics 136 (1): 31–
64.
Tollnek, Franziska, and Joerg Baten. 2017. “Farmers at the Heart of the ‘human Capital
Revolution’? Decomposing the Numeracy Increase in Early Modern Europe.” The
Economic History Review 70 (3): 779–809.
Valencia Caicedo, Felipe. 2019. “The Mission: Human Capital Transmission, Economic
Persistence, and Culture in South America.” The Quarterly Journal of Economics 134
(1): 507–56.
Vasta, Michelangelo. 1999. Innovazione tecnologica e capitale umano in Italia (1880-1914).
Le traiettorie della Seconda Rivoluzione Industriale. Bologna: Il Mulino.
Vigo, Giovanni. 1971. Istruzione e sviluppo economico in Italia nel Secolo XIX. Torino:
ILTE.
Waldinger, Maria. 2017. “The Long-Run Effects of Missionary Orders in Mexico.” Journal
of Development Economics 127 (July): 355–78.
Westberg, Johannes, and Gabriele Cappelli. 2019. “Divergent Paths to Mass Schooling at
Europe’s Poles? Regional Differences in Italy and Sweden, 1840–1900.” IJHE –
Bildungsgeschichte – International Journal for the Historiography of Education.

41
8. Appendix
A.1 Variable definitions and Sources
Variable Description Main source
Literacy Rate 15-19 Youngsters aged 15-19 able to read
(at least) over total youngsters of the
same age.
National censuses
Gross enrolment rate
(GER)
Pupils enrolled in primary
school/population of primary school
age (6–10)
Inquiries on primary
education and national
censuses
Pupil-Teacher ratio Number of children (males and
females) in primary school age
divided by the total number of
primary school teachers.
Inquiries on primary
education and national
censuses
Educational expenditure
per pupil
Total municipal expenditure on
education per pupil enrolled. Total
expenditure includes teachers’
salaries,
maintenance, the construction of new
buildings and other, minor
items. Figure are in Lire, at current
prices.
Municipalities’ balance
sheets (Bilanci Comunali)
School density Number of municipal schools per
squared km
Inquiries on primary
education
Latitude Latitude of the main city of the
province in decimal degrees
Passim
Longitude Longitude of the main city of the
province in decimal degrees.
Passim
Temperature Provincial averages obtained from yearly
data concerning the period 2000-2009, in
Celsius degrees.
Passim
Rainfalls Provincial averages obtained from yearly
data concerning the period 2000-2009, in
mm.
Population density Number of residents divided by the
territory of each province (squared
kilometres).
National censuses
Child-dependency ratio Children in primary school age (6–
10) divided by the total number of
residents.
National censuses
Infant mortality rate the number of dead children aged 0-5
over the total number of live births in
the same year. Data for 1891 refer to
1890.
Data for 1901 and 1911 are estimated
by interpolation with data on 1921
from regional figures.
National censuses and
annual issues of vital
statistics, Movimento della
popolazione
Height Average height at age 20 of military
conscripts
A’Hearn and Vecchi (2017b)

42
Share of labour force in
agriculture
Number of people employed in
agriculture divided by total labour
force.
Missiaia (2014)
Rate of outward
migration
Emigrants as a share of total residents Yearbook on Italian
Migration, Annuario della
emigrazione italiana dal
1876 al 1925, and Carpi
(1874)
Industrial VA per capita Industrial value added (constant
prices 1911)/total population
(residents)
Our elaboration on Ciccarelli
and Fenoaltea (2013)
Electoral franchise
Ratio between the total number of
local electors and total males older
than 21. Local electors are those
entitled to vote in provincial and
municipal elections
Cappelli (2016)
Parental literacy rate percentage of spouses who were able
to sign wedding acts (smoothed on
three years and centred at the years of
the censuses to avoid potential short-
run measurement distortions)
Marriage registries reported
in vital statistics
Literacy rate 1831 Literacy rate of adult aged 30-40 in
1831
Ciccarelli and Weisdorf
(2018)
Pre-unitary schooling
measures
GER, pupil-teacher ratio, and supply
of teachers (number of teachers over
total population)
Vigo (1971); Genovesi
(1998)
Index of Land Inequality The share of large landowners on the
total number of landowners.
Cappelli (2017b)
Further methodological notes
Rate of outward migration: Emigration rates are smoothed by considering a ten-year average
centred on the year concerned. For example, for 1911, we relied on an average pertaining to
1906-1915. For 1871, we relied on the period 1869-1873, as pre-1876 data are only available
for those years. Data are from Carpi (1874).
Pre-unification schooling variables: the GER, the pupil-to-teacher ratio, and the supply of
teachers (here as the number of teachers over total population) are available at the province
level but for a reduced number of provinces, because of missing observations. Data are
mainly taken from Vigo (1971) and relate to various years over the pre-unification period
ranging from 1824 to 1858. More specifically: 1850 for the Kingdom of Sardinia, 1830 for
Lombardy, 1824 for Venetia, 1841 for the Granduchy of Tuscany, 1835-36 for the
Continental Kingdom of Two Sicilies, 1858 for the Papal States, 1835 for the Duchy of
Lucca and 1833 for the Duchy of Parma. For the variable supply of teachers, we calculate the
values referring to Lucca and Parma from Genovesi (1998).

43
A.2 Descriptive statistics (full).
Table A1-a: Descriptive Statistics, 1871-1911
1871 1881 1891 1901 1911
Mean St.Dev. Mean St.Dev. Mean St.Dev. Mean St.Dev. Mean St.Dev.
Literacy Rate 6-10 0.183 0.109 0.292 0.162 0.399 0.189 0.507 0.218 0.565 0.168
Literacy Rate 15-19 0.343 0.195 0.428 0.222 0.514 0.224 0.601 0.231 0.719 0.202
GER 6-10 0.626 0.360 0.810 0.348 0.840 0.313 0.934 0.288 1.087 0.254
Pupil-teacher ratio 41.710 9.436 44.308 9.834 45.068 9.090 47.841 7.955 51.591 8.126
Expenditure per pupil 18.333 6.977 30.019 11.238 32.446 10.038 38.555 13.379 44.986 22.086
Municipal schools (sq. Km) 0.141 0.103 0.177 0.131 0.2013 0.1526 0.238 0.189 0.282 0.237
Population Density 118.406 107.11 126.666 115.674 134.88 124.348 143.089 133.260 157.076 154.35
Dependency ratio 0.085 0.006 0.081 0.005 0.083 0.005 0.087 0.006 0.083 0.007
Infant mortality rate 0.391 0.065 0.332 0.055 0.341 0.057 0.271 0.049 0.253 0.046
Height 162.782 1.817 163.406 1.867 163.67 1.899 163.980 1.998 165.040 2.026
Share of LF in agriculture 54.916 12.627 53.295 12.729 57.87 12.462 62.444 13.322 58.452 13.350
Rate of outward migration 5.243 9.664 4.379 7.660 8.19 12.2150 14.114 14.430 17.909 10.706
Industrial VA p.c. 48.880 15.570 55.725 19.277 64.966 26.138 74.208 33.565 103.268 51.491
Electoral franchise 0.178 0.084 0.205 0.085 0.293 0.117 0.367 0.133 0.433 0.140
Parental literacy rate 40.949 18.413 52.832 19.275 58.836 19.820 67.108 18.963 75.564 16.859
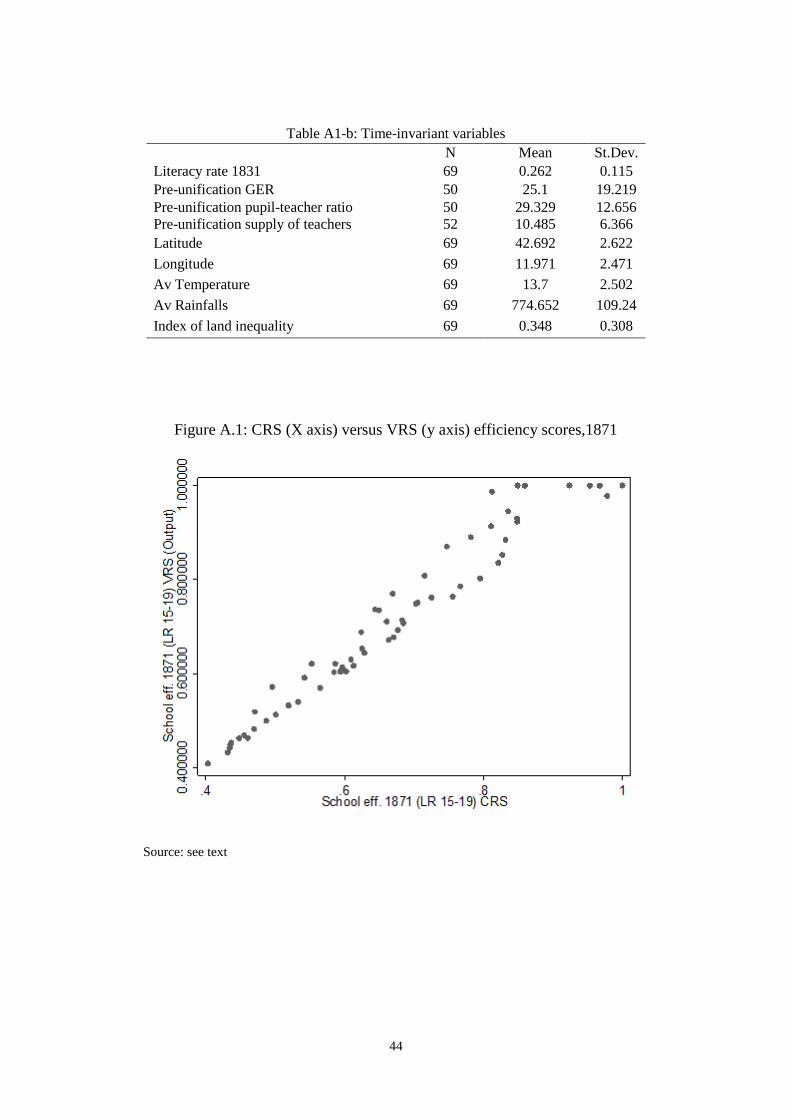
44
Table A1-b: Time-invariant variables
N Mean St.Dev.
Literacy rate 1831 69 0.262 0.115
Pre-unification GER 50 25.1 19.219
Pre-unification pupil-teacher ratio 50 29.329 12.656
Pre-unification supply of teachers 52 10.485 6.366
Latitude 69 42.692 2.622
Longitude 69 11.971 2.471
Av Temperature 69 13.7 2.502
Av Rainfalls 69 774.652 109.24
Index of land inequality 69 0.348 0.308
Figure A.1: CRS (X axis) versus VRS (y axis) efficiency scores,1871
Source: see text