Embed Size (px)
Citation preview
QUANTITATIVE NMR
Cynthia K. Larive & Albert K. KorirUniversity of California, Riverside & Drury University
niversity of California, Riverside & DruryUniversity
Quantitative NMR
Cynthia K. Larive & Albert K. Korir
Conten
tsRe
adab
ility
Reso
urce
sLibraries
Tools
Commun
ityDev
elop
ers
This text is disseminated via the Open Education Resource (OER) LibreTexts Project (https://LibreTexts.org) and like thehundreds of other texts available within this powerful platform, it is freely available for reading, printing and"consuming." Most, but not all, pages in the library have licenses that may allow individuals to make changes, save, andprint this book. Carefully consult the applicable license(s) before pursuing such effects.
Instructors can adopt existing LibreTexts texts or Remix them to quickly build course-specific resources to meet the needsof their students. Unlike traditional textbooks, LibreTexts’ web based origins allow powerful integration of advancedfeatures and new technologies to support learning.
The LibreTexts mission is to unite students, faculty and scholars in a cooperative effort to develop an easy-to-use onlineplatform for the construction, customization, and dissemination of OER content to reduce the burdens of unreasonabletextbook costs to our students and society. The LibreTexts project is a multi-institutional collaborative venture to developthe next generation of open-access texts to improve postsecondary education at all levels of higher learning by developingan Open Access Resource environment. The project currently consists of 14 independently operating and interconnectedlibraries that are constantly being optimized by students, faculty, and outside experts to supplant conventional paper-basedbooks. These free textbook alternatives are organized within a central environment that is both vertically (from advance tobasic level) and horizontally (across different fields) integrated.
The LibreTexts libraries are Powered by MindTouch and are supported by the Department of Education Open TextbookPilot Project, the UC Davis Office of the Provost, the UC Davis Library, the California State University AffordableLearning Solutions Program, and Merlot. This material is based upon work supported by the National Science Foundationunder Grant No. 1246120, 1525057, and 1413739. Unless otherwise noted, LibreTexts content is licensed by CC BY-NC-SA 3.0.
Any opinions, findings, and conclusions or recommendations expressed in this material are those of the author(s) and donot necessarily reflect the views of the National Science Foundation nor the US Department of Education.
Have questions or comments? For information about adoptions or adaptions contact [email protected]. Moreinformation on our activities can be found via Facebook (https://facebook.com/Libretexts), Twitter(https://twitter.com/libretexts), or our blog (http://Blog.Libretexts.org).
This text was compiled on 12/05/2021
®
1 11/7/2021 https://chem.libretexts.org/@go/page/281019
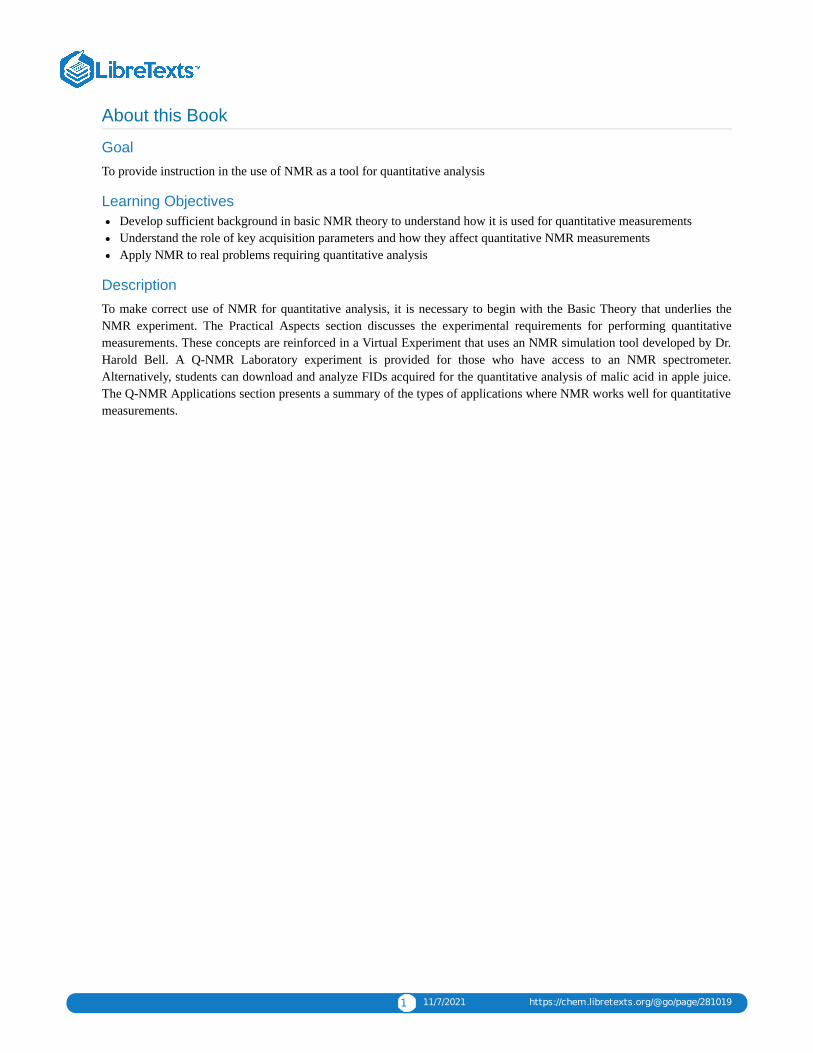
About this Book
Goal
To provide instruction in the use of NMR as a tool for quantitative analysis
Learning Objectives Develop sufficient background in basic NMR theory to understand how it is used for quantitative measurementsUnderstand the role of key acquisition parameters and how they affect quantitative NMR measurementsApply NMR to real problems requiring quantitative analysis
Description
To make correct use of NMR for quantitative analysis, it is necessary to begin with the Basic Theory that underlies theNMR experiment. The Practical Aspects section discusses the experimental requirements for performing quantitativemeasurements. These concepts are reinforced in a Virtual Experiment that uses an NMR simulation tool developed by Dr.Harold Bell. A Q-NMR Laboratory experiment is provided for those who have access to an NMR spectrometer.Alternatively, students can download and analyze FIDs acquired for the quantitative analysis of malic acid in apple juice.The Q-NMR Applications section presents a summary of the types of applications where NMR works well for quantitativemeasurements.
1 12/5/2021
TABLE OF CONTENTSQuantitative nuclear magnetic resonance (Q-NMR) measurements are especially useful for analysis of complex samples where highspecificity is needed or when a pure standard of the analyte is not available. This text provides a brief overview of basic NMR theory, atutorial discussing the practical aspects of Q-NMR, a virtual experiment utilizing an NMR simulator, an exercise that makes use of realNMR data you can download and analyze, and a Q-NMR lab experiments.
ABOUT THIS BOOK
1: BASIC NMR THEORYThis section presents a basic overview of the theory of modern NMR. Readers interested in more in-depth treatments of this subject areencouraged to utilize the resources listed in the reference page at the end of this section.
1.1: WHAT IS SPIN?1.2: HOW DOES ABSORPTION OF ENERGY GENERATE AN NMR SPECTRUM?1.3: HOW DOES THE POPULATION DIFFERENCE IN NMR COMPARE TO THE DIFFERENCE BETWEENELECTRONIC GROUND AND EXCITED STATES?1.4: WHAT IS CHEMICAL SHIFT AND HOW DOES IT RELATE TO RESONANCE FREQUENCY?1.5: WHAT IS PRECESSION?1.6: HOW DOES PRECESSION GENERATE THE MACROSCOPIC MAGNETIZATION (MO)?1.7: HOW CAN THE NUCLEAR SPINS BE MANIPULATED TO GENERATE THE NMR SPECTRUM?1.8: WHAT IS THE TIP ANGLE?1.9: WHAT IS THE FREE INDUCTION DECAY?1.10: HOW DO T₁ AND T₂ RELAXATION AFFECT NMR SPECTRA?1.11: WHERE SHOULD I LOOK TO LEARN MORE ABOUT NMR?
2: PRACTICAL ASPECTS OF Q-NMRThis discussion presumes that you already have an understanding of the basic theory of NMR. There are a number of issues that shouldbe considered when measuring NMR spectra for quantitative analysis. Many of these issues pertain to the way that the NMR signal isacquired and processed. It is usually necessary to perform Q-NMR measurements with care to obtain accurate and precise quantitativeresults.
2.1: HOW DO I CHOOSE A REFERENCE STANDARD FOR MY Q-NMR ANALYSIS?2.2: HOW IS THE INTERNAL STANDARD USED TO QUANTIFY THE CONCENTRATION OF MY ANALYTE?2.3: WHAT SAMPLE CONSIDERATIONS ARE IMPORTANT?2.4: HOW DO I CHOOSE THE RIGHT ACQUISITION PARAMETERS FOR A QUANTITATIVE NMR MEASUREMENT?2.5: EFFECTS OF TIP ANGLE IN QUANTITATIVE NMR EXPERIMENTS2.6: WHAT DATA PROCESSING CONSIDERATIONS ARE IMPORTANT FOR OBTAINING ACCURATE AND PRECISERESULTS?2.7: REFERENCES
3: VIRTUAL EXPERIMENTThis experiment uses an FTNMR simulation program to explore the effects of the parameters discussed in the Practical Aspects sectionon the results of simulated NMR data.
3.1: VIRTUAL LABORATORY
4: Q-NMR EXPERIMENTDetermination of Malic Acid Content in Apple Juice by NMR
4.1: PRELAB EXERCISES4.2: BACKGROUND4.3: DRY LAB4.4: WET LAB
2 12/5/2021
5: Q-NMR APPLICATIONSQ-NMR is widely used for both purity and impurity analyses. Q-NMR finds extensive use in the food and beverage industry, where it isused to detect adulteration and to follow the progression of processes such as fermentation. A relatively recent application of Q-NMR isin the area of metabonomics.
5.1: Q-NMR FOR PURITY DETERMINATION OF MACROLIDE ANTIBIOTIC REFERENCE STANDARDS-COMPARISON WITH THE MASS BALANCE METHOD5.2: DETERMINING ENANTIOMERIC OR ISOMERIC PURITY OF ACTIVE PHARMACEUTICAL INGREDIENTS5.3: Q-NMR FOR ANALYSIS AND CHARACTERIZATION IN VACCINE PREPARATIONS5.4: Q-NMR-BASED METABONOMICS OF BLOOD SAMPLES5.5: Q-NMR FOR TIME COURSE EVOLUTION OF MALIC AND LACTIC ACID
6: INSTRUCTOR'S GUIDEThis guide is intended to assist instructors in the utilization of the q-NMR learning module.
6.1: BASIC THEORY CONCEPT QUESTIONS6.2: ANSWERS TO QUESTIONS IN THE BASIC THEORY SECTION6.3: PRACTICAL ASPECTS CONCEPT QUESTIONS6.4: ANSWERS TO QUESTIONS IN THE PRACTICAL ASPECTS SECTION6.5: Q-NMR DRYLAB
BACK MATTERINDEX6: ADVANCED THEORYGLOSSARY
1 12/5/2021
CHAPTER OVERVIEW1: BASIC NMR THEORYThis section presents a basic overview of the theory of modern NMR. Readers interested in more in-depth treatments of this subject areencouraged to utilize the resources listed in the reference page at the end of this section.
1.1: WHAT IS SPIN?The fundamentals of NMR begin with the understanding that a nucleus belonging to an element with an odd atomic or mass numberhas a nuclear spin that can be observed. Examples of nuclei with spin include 1H, 3H, 13C, 15N, 19F, 31P and 29Si. All of thesenuclei have a spin of ½. Other nuclei like 2H or 14N have a spin of 1. Nuclei with even atomic and mass numbers like 12C and 16Ohave spin of 0 and cannot be studied by NMR. The following introductory discussion of NMR is limited to spin ½ nuclei
1.2: HOW DOES ABSORPTION OF ENERGY GENERATE AN NMR SPECTRUM?1.3: HOW DOES THE POPULATION DIFFERENCE IN NMR COMPARE TO THE DIFFERENCE BETWEENELECTRONIC GROUND AND EXCITED STATES?1.4: WHAT IS CHEMICAL SHIFT AND HOW DOES IT RELATE TO RESONANCE FREQUENCY?1.5: WHAT IS PRECESSION?1.6: HOW DOES PRECESSION GENERATE THE MACROSCOPIC MAGNETIZATION (MO)?1.7: HOW CAN THE NUCLEAR SPINS BE MANIPULATED TO GENERATE THE NMR SPECTRUM?1.8: WHAT IS THE TIP ANGLE?1.9: WHAT IS THE FREE INDUCTION DECAY?The signal we detect is called a Free Induction Decay and is produced by the macroscopic magnetization after the pulse. Themagnetization will undergo several processes as it returns to equilibrium. First immediately after the pulse, the transverse componentof the macroscopic magnetization will begin to precess at its Larmor frequency. This precessing magnetization will induce analternating current in a coil (the same one used to generate the rf pulse) wound round the sample.
1.10: HOW DO T₁ AND T₂ RELAXATION AFFECT NMR SPECTRA?The decay of the FID corresponds to the loss of intensity of the macroscopic magnetization vector in the xy plane (called thetransverse plane) by a process called spin-spin relaxation (or transverse or T2) relaxation. The recovery of magnetization along the z(longitudinal) axis to its equilibrium position occurs by a process called spin lattice (or longitudinal or T1 relaxation). T1 relaxationoccurs through interactions of the nuclei with the lattice.
1.11: WHERE SHOULD I LOOK TO LEARN MORE ABOUT NMR?
Cynthia K. Larive & Albert K. Korir 1.1.1 11/28/2021 https://chem.libretexts.org/@go/page/77736
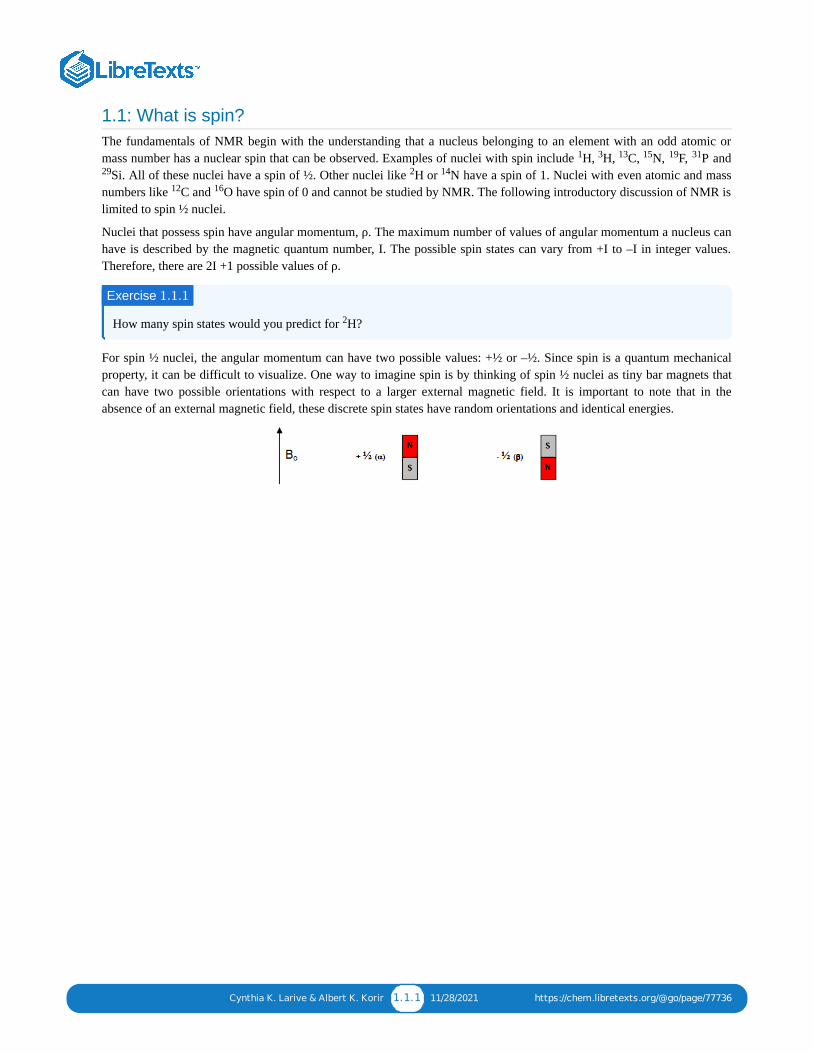
1.1: What is spin?The fundamentals of NMR begin with the understanding that a nucleus belonging to an element with an odd atomic ormass number has a nuclear spin that can be observed. Examples of nuclei with spin include H, H, C, N, F, P and
Si. All of these nuclei have a spin of ½. Other nuclei like H or N have a spin of 1. Nuclei with even atomic and massnumbers like C and O have spin of 0 and cannot be studied by NMR. The following introductory discussion of NMR islimited to spin ½ nuclei.
Nuclei that possess spin have angular momentum, ρ. The maximum number of values of angular momentum a nucleus canhave is described by the magnetic quantum number, Ι. The possible spin states can vary from +Ι to –Ι in integer values.Therefore, there are 2Ι +1 possible values of ρ.
How many spin states would you predict for H?
For spin ½ nuclei, the angular momentum can have two possible values: +½ or –½. Since spin is a quantum mechanicalproperty, it can be difficult to visualize. One way to imagine spin is by thinking of spin ½ nuclei as tiny bar magnets thatcan have two possible orientations with respect to a larger external magnetic field. It is important to note that in theabsence of an external magnetic field, these discrete spin states have random orientations and identical energies.
1 3 13 15 19 31
29 2 14
12 16
Exercise 1.1.1
2
Cynthia K. Larive & Albert K. Korir 1.2.1 10/31/2021 https://chem.libretexts.org/@go/page/77738
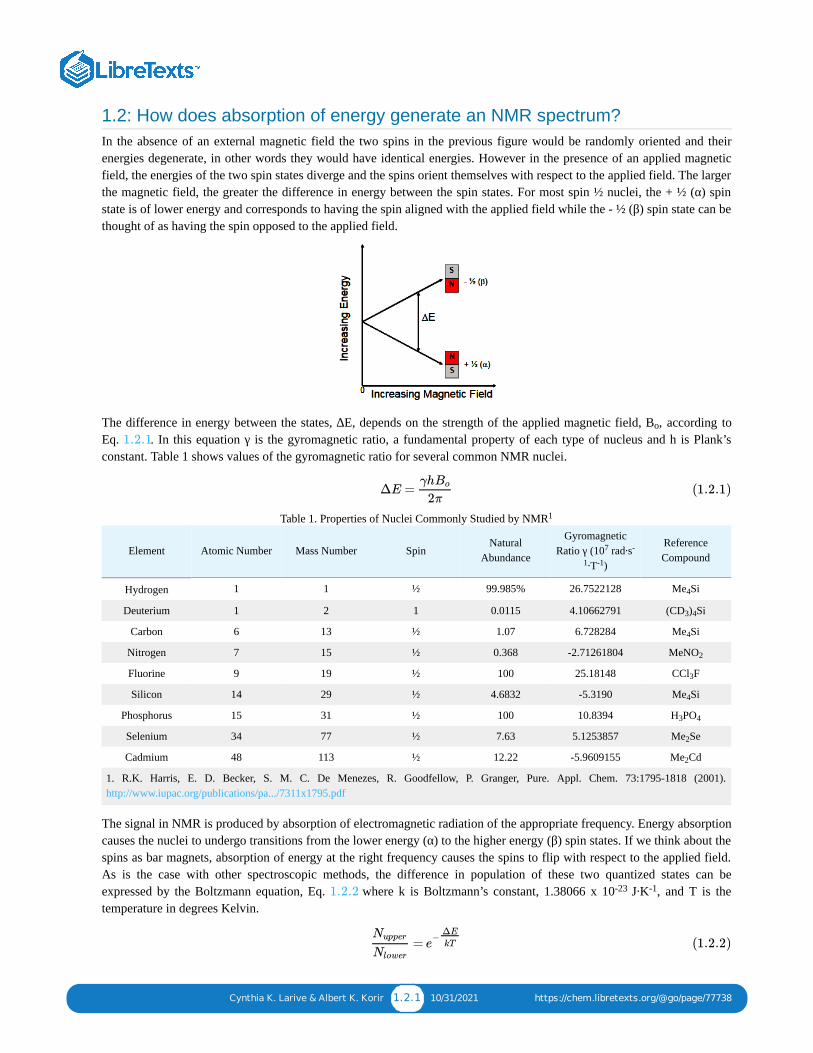
1.2: How does absorption of energy generate an NMR spectrum?In the absence of an external magnetic field the two spins in the previous figure would be randomly oriented and theirenergies degenerate, in other words they would have identical energies. However in the presence of an applied magneticfield, the energies of the two spin states diverge and the spins orient themselves with respect to the applied field. The largerthe magnetic field, the greater the difference in energy between the spin states. For most spin ½ nuclei, the + ½ (α) spinstate is of lower energy and corresponds to having the spin aligned with the applied field while the - ½ (β) spin state can bethought of as having the spin opposed to the applied field.
The difference in energy between the states, ∆E, depends on the strength of the applied magnetic field, B , according toEq. . In this equation γ is the gyromagnetic ratio, a fundamental property of each type of nucleus and h is Plank’sconstant. Table 1 shows values of the gyromagnetic ratio for several common NMR nuclei.
Table 1. Properties of Nuclei Commonly Studied by NMR
Element Atomic Number Mass Number SpinNatural
Abundance
GyromagneticRatio γ (10 rad·s
·T )
ReferenceCompound
Hydrogen 1 1 ½ 99.985% 26.7522128 Me Si
Deuterium 1 2 1 0.0115 4.10662791 (CD ) Si
Carbon 6 13 ½ 1.07 6.728284 Me Si
Nitrogen 7 15 ½ 0.368 -2.71261804 MeNO
Fluorine 9 19 ½ 100 25.18148 CCl F
Silicon 14 29 ½ 4.6832 -5.3190 Me Si
Phosphorus 15 31 ½ 100 10.8394 H PO
Selenium 34 77 ½ 7.63 5.1253857 Me Se
Cadmium 48 113 ½ 12.22 -5.9609155 Me Cd
1. R.K. Harris, E. D. Becker, S. M. C. De Menezes, R. Goodfellow, P. Granger, Pure. Appl. Chem. 73:1795-1818 (2001).http://www.iupac.org/publications/pa.../7311x1795.pdf
The signal in NMR is produced by absorption of electromagnetic radiation of the appropriate frequency. Energy absorptioncauses the nuclei to undergo transitions from the lower energy (α) to the higher energy (β) spin states. If we think about thespins as bar magnets, absorption of energy at the right frequency causes the spins to flip with respect to the applied field.As is the case with other spectroscopic methods, the difference in population of these two quantized states can beexpressed by the Boltzmann equation, Eq. where k is Boltzmann’s constant, 1.38066 x 10 J·K , and T is thetemperature in degrees Kelvin.
o1.2.1
ΔE =γhBo
2π(1.2.1)
1
7 -
1 -1
4
3 4
4
2
3
4
3 4
2
2
1.2.2 -23 -1
=Nupper
Nlower
e−
ΔE
kT (1.2.2)
Cynthia K. Larive & Albert K. Korir 1.2.2 10/31/2021 https://chem.libretexts.org/@go/page/77738
Equation relates the ratio of the number of nuclei in the upper (higher energy) spin state and the lower energy spinstate to the energy difference between the spin states, ∆E, and therefore, the magnitude of the applied magnetic field, B(Eq. ). In NMR the difference in energy in the two spin states is very small therefore the population difference is alsosmall (about 1 in 10,000 for H in an 11.74 T magnetic field). Because this population difference is the source of oursignal, NMR is inherently a less sensitive technique than many other spectroscopic methods.
Given the same magnetic field and temperature, how would the difference in population for H and P compare?
1.2.2
o1.2.1
1
Exercise 1.2.2
1 31
Cynthia K. Larive & Albert K. Korir 1.3.1 10/24/2021 https://chem.libretexts.org/@go/page/77741
1.3: How does the population difference in NMR compare to the differencebetween electronic ground and excited states?Up to this point in our discussion, the theory of NMR seems similar to that for other common spectroscopic methods.However there are some differences that should be considered. For example in UV-visible absorption spectroscopy, whichoccurs as a result of electronic transitions, at room temperature essentially all of the molecules will be in the groundelectronic state because the energy difference between the ground and excited states is large. However, in NMR thedifference in energy in the two spin states is very small, therefore the population difference is also small (about 1 in 10,000for H in an 11.74 T magnetic field). Because this population difference is the source of our signal, NMR is inherently aless sensitive technique than many other spectroscopic methods.
Let’s think now about the energy difference between the nuclear spin states in NMR. Do you recall the relationshipbetween energy and frequency? Say we are interested in a compound with an absorption maximum at a wavelength, λ, of600 nm. What would be the frequency, ν, of the light absorbed?
The frequency of light absorbed is inversely proportional to the wavelength as shown in the equation below, where c is thespeed of light, 3.0 x 10 m/s.
Therefore, light with a wavelength of 600 nm has a frequency of 5 x 10 Hz (cycles per second). The energy, E, of thislight is directly proportional to the product of its frequency and Planck’s constant (h), 6.626 x 10 J·s.
Our 600 nm light has an energy of 3.31 x 10 J. The energy of the light absorbed by our molecule roughly corresponds tothe energy difference between the ground and excited electronic states of our molecule. How does the energy absorbed inNMR compare with this value? We already indicated that we expect the energy difference between the ground and excitedspin states in NMR to be much less than for absorption of visible light. We can calculate the energy of the NMR transitionusing Equation for a particular nucleus in a given magnetic field strength. Let’s do this calculation for the protons(hydrogen nuclei) in a sample placed in an 11.74 T magnet, using the value of γ for hydrogen (normally referred to asproton) in Table 1. We can now calculate the energy difference of the spin states, as in Equation .
This energy may not seem like it is that much less than the energy of our visible absorption transition at 600 nm, after allthe numbers only differ by a factor of 10 . However, if we think about the thermal energy of our sample in terms of kT(1.38066 x 10 J·K x 298 K = 4.11 x 10 J) we can see that the thermal energy of our sample is about 100 fold lessthan the energy of the visible absorption of 600 nm light but is about 10,000 times greater than the energy of our protonNMR transition. This is why there is only a very small difference in population between the ground and excited states inNMR.
Having compared the energies of these two spectroscopic methods we might now ask how do the frequency andwavelength in NMR compare with our 600 nm light? We can calculate the NMR frequency, known as the Larmorfrequency, using Equation
For our example of protons in an 11.74 T magnetic field, ν is 500 x 10 Hz or 500 MHz. This is in the radio frequencyrange of the electromagnetic spectrum. It is common to refer to NMR instruments by the frequency of protons in themagnetic field associated with a given spectrometer, therefore a spectrometer with an 11.74 T magnet is referred to as a500 MHz instrument.
1
8
ν =c
λ(1.3.1)
14
-34
E = hν (1.3.2)
-19
2.1
1.3.3
ΔE = = 1.054 × J26.75222127 × rad ⋅ ×6.626 × J −s×11.74T107 s−1T −1 10−34
2π10−25 (1.3.3)
6
-23 -1 -21
1.3.4
υ = =ΔE
h
γBo
2π(1.3.4)
6
☰
Cynthia K. Larive & Albert K. Korir 1.3.2 10/24/2021 https://chem.libretexts.org/@go/page/77741
Calculate the wavelength of electromagnetic radiation corresponding to a frequency of 500 MHz.
Exercise 1.3.3☰
Cynthia K. Larive & Albert K. Korir 1.4.1 11/28/2021 https://chem.libretexts.org/@go/page/77747
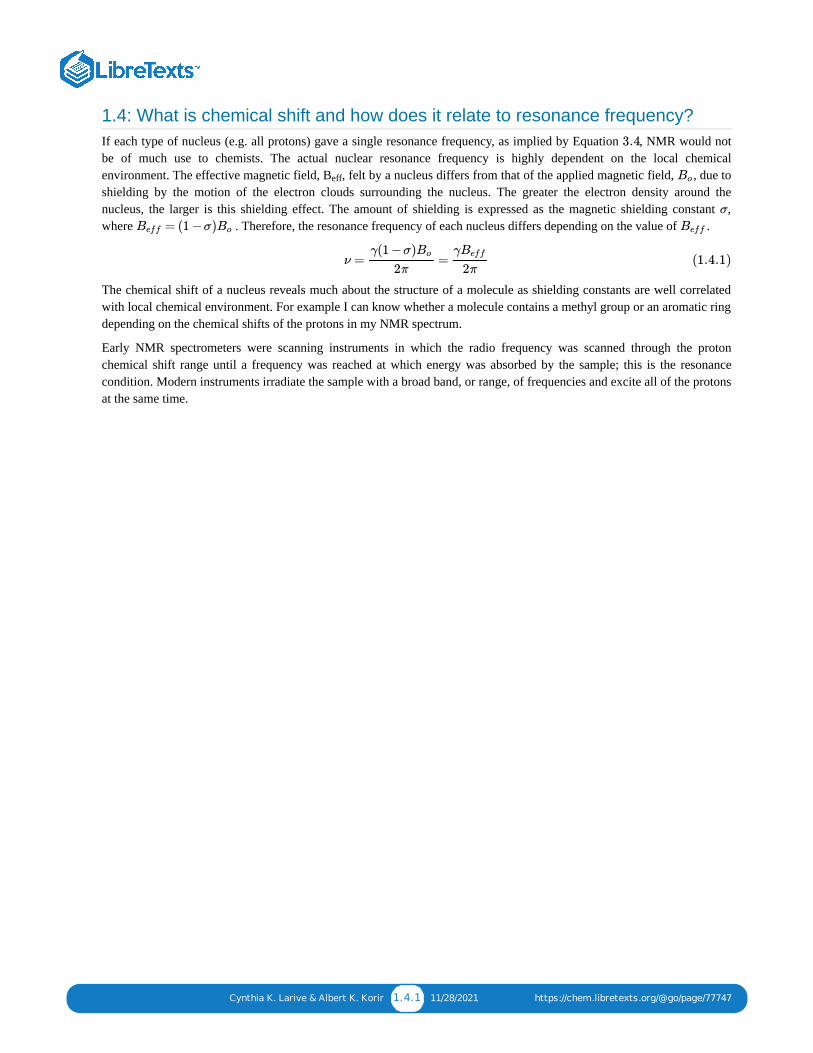
1.4: What is chemical shift and how does it relate to resonance frequency?If each type of nucleus (e.g. all protons) gave a single resonance frequency, as implied by Equation , NMR would notbe of much use to chemists. The actual nuclear resonance frequency is highly dependent on the local chemicalenvironment. The effective magnetic field, B , felt by a nucleus differs from that of the applied magnetic field, , due toshielding by the motion of the electron clouds surrounding the nucleus. The greater the electron density around thenucleus, the larger is this shielding effect. The amount of shielding is expressed as the magnetic shielding constant ,where . Therefore, the resonance frequency of each nucleus differs depending on the value of .
The chemical shift of a nucleus reveals much about the structure of a molecule as shielding constants are well correlatedwith local chemical environment. For example I can know whether a molecule contains a methyl group or an aromatic ringdepending on the chemical shifts of the protons in my NMR spectrum.
Early NMR spectrometers were scanning instruments in which the radio frequency was scanned through the protonchemical shift range until a frequency was reached at which energy was absorbed by the sample; this is the resonancecondition. Modern instruments irradiate the sample with a broad band, or range, of frequencies and excite all of the protonsat the same time.
3.4
eff Bo
σ
= (1 −σ)Beff Bo Beff
ν = =γ(1 −σ)Bo
2π
γBeff
2π(1.4.1)
Cynthia K. Larive & Albert K. Korir 1.5.1 12/5/2021 https://chem.libretexts.org/@go/page/77749
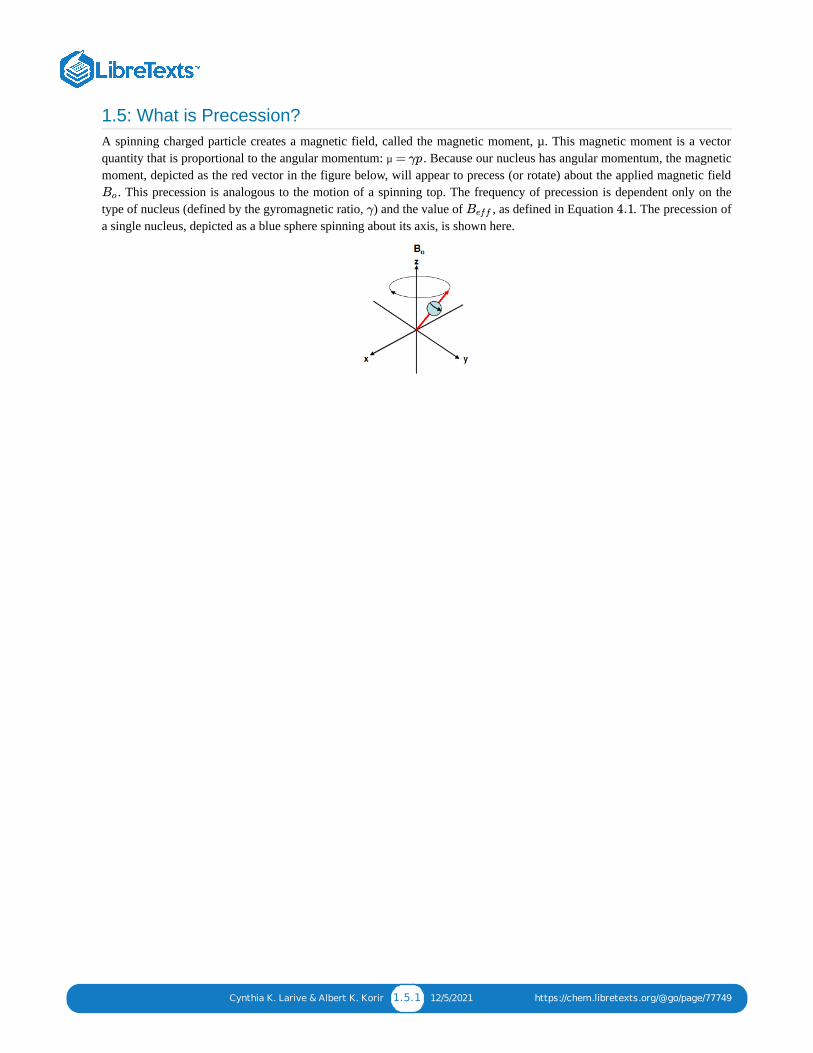
1.5: What is Precession?A spinning charged particle creates a magnetic field, called the magnetic moment, µ. This magnetic moment is a vectorquantity that is proportional to the angular momentum: . Because our nucleus has angular momentum, the magneticmoment, depicted as the red vector in the figure below, will appear to precess (or rotate) about the applied magnetic field
. This precession is analogous to the motion of a spinning top. The frequency of precession is dependent only on thetype of nucleus (defined by the gyromagnetic ratio, ) and the value of , as defined in Equation . The precession ofa single nucleus, depicted as a blue sphere spinning about its axis, is shown here.
µ = γp
Bo
γ Beff 4.1
Cynthia K. Larive & Albert K. Korir 1.6.1 11/21/2021 https://chem.libretexts.org/@go/page/77751
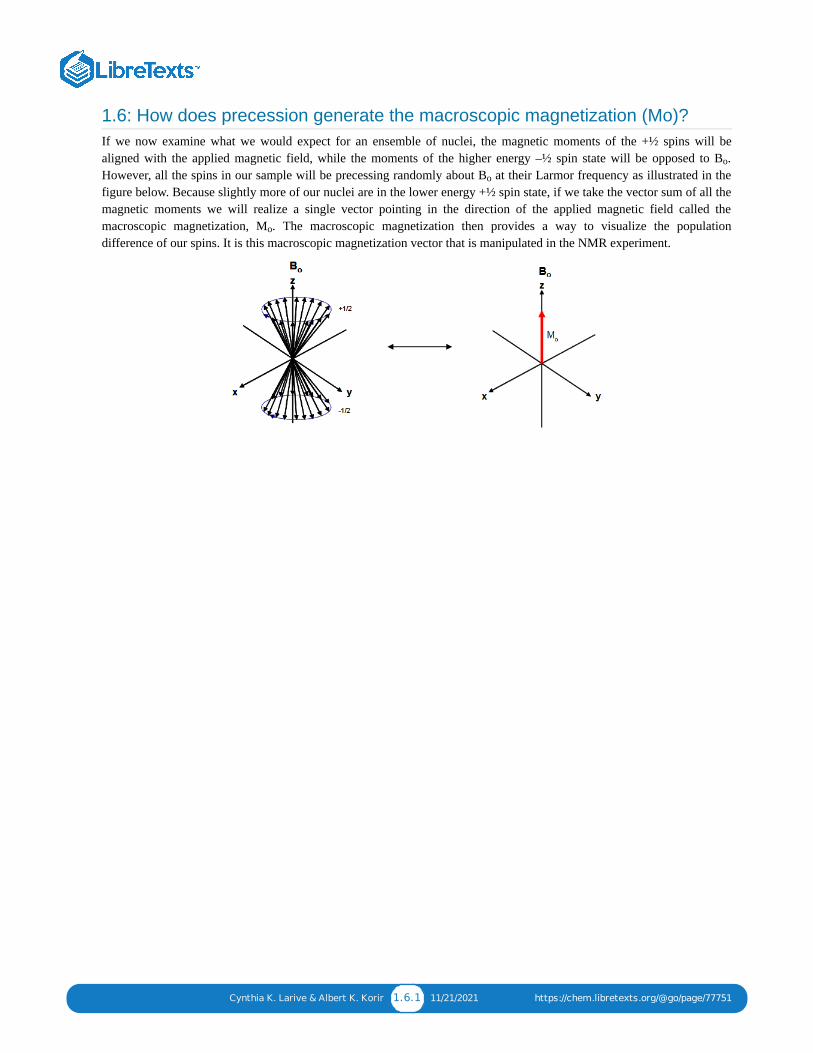
1.6: How does precession generate the macroscopic magnetization (Mo)?If we now examine what we would expect for an ensemble of nuclei, the magnetic moments of the +½ spins will bealigned with the applied magnetic field, while the moments of the higher energy –½ spin state will be opposed to B .However, all the spins in our sample will be precessing randomly about B at their Larmor frequency as illustrated in thefigure below. Because slightly more of our nuclei are in the lower energy +½ spin state, if we take the vector sum of all themagnetic moments we will realize a single vector pointing in the direction of the applied magnetic field called themacroscopic magnetization, M . The macroscopic magnetization then provides a way to visualize the populationdifference of our spins. It is this macroscopic magnetization vector that is manipulated in the NMR experiment.
o
o
o
Cynthia K. Larive & Albert K. Korir 1.7.1 11/7/2021 https://chem.libretexts.org/@go/page/77761
1.7: How can the nuclear spins be manipulated to generate the NMRspectrum?The previous figure shows the system at equilibrium. In order to generate a NMR signal, we must do something to perturbthe populations of our spin states. As in other spectroscopic measurements, this is done through the absorption of radiantenergy (light) of the appropriate frequency. In NMR, this transition is in the radio frequency (rf) range, corresponding tothe Larmor frequency of the nucleus we are interested in. We cause this transition by irradiating our sample at a singleradio frequency. An AC current oscillating at the desired rf frequency is applied to a coil wound around our sample. Thisoscillating current creates an additional magnetic field (called the B field) that acts upon our macroscopic magnetizationvector and tips it away from its equilibrium position aligned with B . This B pulse creates the signal that we detect inNMR. In order to excite all of the different types of a single nucleus in our sample (e.g. all of the different types of protonsor carbons), this pulse of rf radiation is kept short (typically ~10 µs). By the Heisenberg uncertainty principle, a short pulsewill excite a broad range of frequencies; ∆f = 1/∆t.
What range of frequencies would be excited by a 10 µs rf pulse?
1
o 1
Exercise 1.7.4
Cynthia K. Larive & Albert K. Korir 1.8.1 11/28/2021 https://chem.libretexts.org/@go/page/77763
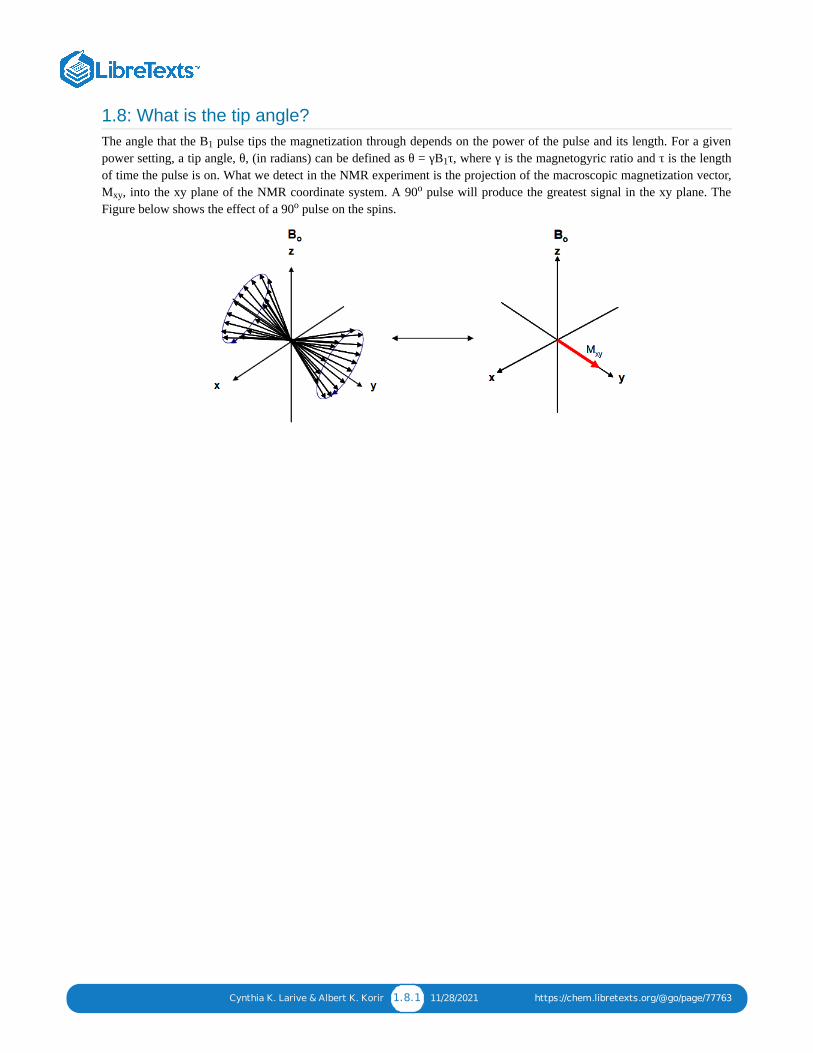
1.8: What is the tip angle?The angle that the B pulse tips the magnetization through depends on the power of the pulse and its length. For a givenpower setting, a tip angle, θ, (in radians) can be defined as θ = γB τ, where γ is the magnetogyric ratio and τ is the lengthof time the pulse is on. What we detect in the NMR experiment is the projection of the macroscopic magnetization vector,M , into the xy plane of the NMR coordinate system. A 90 pulse will produce the greatest signal in the xy plane. TheFigure below shows the effect of a 90 pulse on the spins.
1
1
xyo
o
Cynthia K. Larive & Albert K. Korir 1.9.1 11/21/2021 https://chem.libretexts.org/@go/page/77765
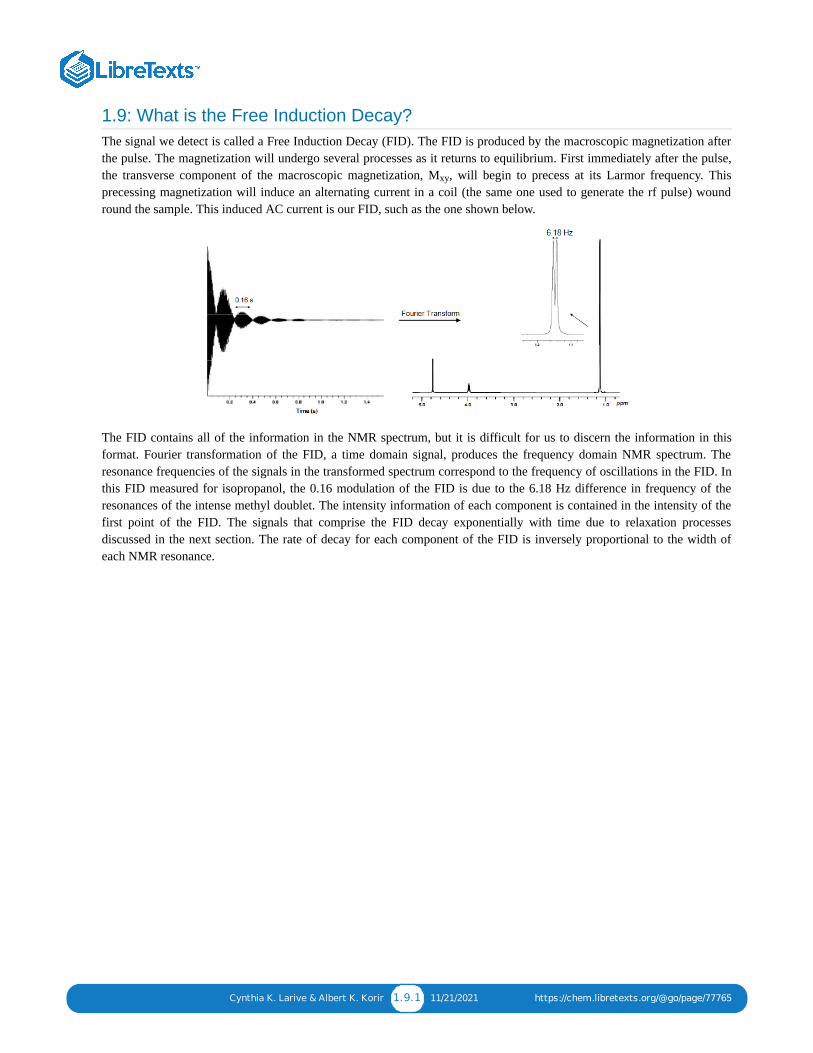
1.9: What is the Free Induction Decay?The signal we detect is called a Free Induction Decay (FID). The FID is produced by the macroscopic magnetization afterthe pulse. The magnetization will undergo several processes as it returns to equilibrium. First immediately after the pulse,the transverse component of the macroscopic magnetization, M , will begin to precess at its Larmor frequency. Thisprecessing magnetization will induce an alternating current in a coil (the same one used to generate the rf pulse) woundround the sample. This induced AC current is our FID, such as the one shown below.
The FID contains all of the information in the NMR spectrum, but it is difficult for us to discern the information in thisformat. Fourier transformation of the FID, a time domain signal, produces the frequency domain NMR spectrum. Theresonance frequencies of the signals in the transformed spectrum correspond to the frequency of oscillations in the FID. Inthis FID measured for isopropanol, the 0.16 modulation of the FID is due to the 6.18 Hz difference in frequency of theresonances of the intense methyl doublet. The intensity information of each component is contained in the intensity of thefirst point of the FID. The signals that comprise the FID decay exponentially with time due to relaxation processesdiscussed in the next section. The rate of decay for each component of the FID is inversely proportional to the width ofeach NMR resonance.
xy
Cynthia K. Larive & Albert K. Korir 1.10.1 11/18/2021 https://chem.libretexts.org/@go/page/77767
1.10: How do T₁ and T₂ relaxation affect NMR spectra?The decay of the FID corresponds to the loss of intensity of the macroscopic magnetization vector in the xy plane (calledthe transverse plane) by a process called spin-spin relaxation (or transverse or T ) relaxation. T relaxation occurs when anucleus in a –½ spin state transfers its spin to a nearby nucleus in a + ½ spin state, and vice versa. Since T relaxationoccurs through mutual spin flips, the energy of the system is unaffected, it is an entropic process. In terms of our vectormodel, T relaxation corresponds to a loss of coherence or dephasing of the magnetization vector. The recovery ofmagnetization along the z (longitudinal) axis (aligned with B ) to its equilibrium position occurs by a process called spinlattice (or longitudinal or T relaxation). T relaxation occurs through interactions of the nuclei with the lattice (or thenuclei that surround our sample). Lattice motions at the same frequency as the Larmor frequency stimulate themagnetization in the higher energy – ½ spin states to lose this excess energy by transferring it to the lattice via a processcalled radiationless decay. Since T relaxation involves a loss of energy by the system as the spins return to theirequilibrium populations, it is an enthalpic process. These relaxation processes are first order processes characterized by therelaxation time constants T and T . The width at half-height of a resonance is inversely related to the T relaxation time ofthe nucleus, w = (πT ) . Because the magnets we use are not perfectly homogeneous, there is a secondary contributionto the line width that comes from magnetic field inhomogeneity. Therefore, the apparent spin-spin relaxation time constantor T * observed in the FID includes both the natural T relaxation time of the nucleus as well as the effect of magneticfield inhomogeneity, w = (πT *) . If you want to know the real T value for a nucleus, a special experiment, called thespin echo can be used.
What are the resonance line widths of nuclei that have apparent T relaxation times (i.e.T * values) of 1 and 2 sec.
The effects of T relaxation are more difficult to observe directly, because it corresponds to the return to equilibriumpopulations following the pulse. However, if several FIDs are coadded, as is usually the case in NMR, and if the timebetween successive pulse and acquire steps is insufficient for complete T relaxation, the resonances in the resulting NMRspectrum will be less intense than they would otherwise appear. Because quantitative NMR measurements rely onresonance intensity, understanding the effects of T relaxation is very important for obtaining accurate qNMR results.Therefore this subject is treated in greater depth in the Practical Aspects section of this module.
2 2
2
2
o
1 1
1
1 2 2
1/2 2-1
2 2
1/2 2-1
2
Exercise 1.10.5
2 2
1
1
1
Cynthia K. Larive & Albert K. Korir 1.11.1 11/7/2021 https://chem.libretexts.org/@go/page/77737
1.11: Where should I look to learn more about NMR?It is hoped that this brief tutorial has provided sufficient background for you to understand the next section, focusing onpractical aspects of quantitative NMR measurements. For further insights into NMR, the following websites and books arerecommended. Many students find the e-book written by Professor Joseph Hornak at RIT to be especially useful since itcontains embedded animations that illustrate many of the concepts introduced here.
“The Basics of NMR” by Joseph P. Hornak, http://www.cis.rit.edu/htbooks/nmr/
“Georgetown Graduate Course on NMR Spectroscopy” by Angel de Dios,http://bouman.chem.georgetown.edu/nmr/syllabus.htm
"2D NMR Spectroscopy” by Marc Bria, Pierre Watkin and Yves Plancke, http://rmn2d.univ-lille1.fr/rmn2d_en..._RMN2D_en.html
“Understanding NMR Spectroscopy” by James Keeler, John Wiley & Sons, 2005
“High-Resolution NMR Techniques in Organic Chemistry” by Timothy D. W. Claridge, Pergamon, Oxford, 1999.
“Spin Choreography: Basic Steps in High Resolution NMR” by Ray Freeman, Oxford University Press (1999).
“Modern NMR Spectroscopy: A Guide for Chemists”, 2 Edition, by Jeremy K. M. Sanders and Brian K. Hunter, OxfordUniversity Press, 1993.
"200 and More NMR Experiments: a Practical Course” by Stephan Berger and Siegmar Braun, Wiley-VCH, 2004.
“Basic One- and Two-Dimensional NMR Spectroscopy" by Horst Friebolin, Wiley-VCH, 2004.
"Experimental Pulse NMR: A Nuts and Bolts Approach" by Eiichi Fukushima and Stephen B. W. Roeder, PerseusPublishing, 1993.
nd
1 12/5/2021
CHAPTER OVERVIEW2: PRACTICAL ASPECTS OF Q-NMRThis discussion presumes that you already have an understanding of the basic theory of NMR. There are a number of issues that shouldbe considered when measuring NMR spectra for quantitative analysis. Many of these issues pertain to the way that the NMR signal isacquired and processed. It is usually necessary to perform Q-NMR measurements with care to obtain accurate and precise quantitativeresults.
2.1: HOW DO I CHOOSE A REFERENCE STANDARD FOR MY Q-NMR ANALYSIS?2.2: HOW IS THE INTERNAL STANDARD USED TO QUANTIFY THE CONCENTRATION OF MY ANALYTE?2.3: WHAT SAMPLE CONSIDERATIONS ARE IMPORTANT?2.4: HOW DO I CHOOSE THE RIGHT ACQUISITION PARAMETERS FOR A QUANTITATIVE NMR MEASUREMENT?2.5: EFFECTS OF TIP ANGLE IN QUANTITATIVE NMR EXPERIMENTS2.6: WHAT DATA PROCESSING CONSIDERATIONS ARE IMPORTANT FOR OBTAINING ACCURATE AND PRECISERESULTS?2.7: REFERENCES
Cynthia K. Larive & Albert K. Korir 2.1.1 11/21/2021 https://chem.libretexts.org/@go/page/77769
2.1: How do I choose a reference standard for my Q-NMR analysis?With NMR, we need only to have available any pure standard compound (which can be structurally unrelated to ouranalyte) that contains the nucleus of interest and has a resonance that does not overlap those of our analyte. The analyteconcentration can then be determined relative to this standard compound. The requirement for lack of overlap means thatmost standards have simple NMR spectra, often producing only singlet resonances. Additional requirements for standardsto be used for quantitative analysis are that they:
are chemically inerthave low volatilityhave similar solubility characteristics as the analytehave reasonable T relaxation times
The structures of several common NMR chemical shift and quantitation standards are shown in the figure below.
TMS and dioxane are chemical shift reference compounds commonly used in organic solvents. However they do not makegood quantitation standards because they suffer from high volatility. Therefore it is difficult to prepare a standard solutionfor which the concentration is known with high accuracy. TMSP is a water soluble chemical shift reference. While it hasimproved performance as a quantitation standard compared with TMS or dioxane, it has been shown to absorb to glass sostock solutions may have stability problems. In addition to the criteria listed above, it is helpful for quantitation purposesif the compound selected as the standard also has the properties of a primary analytical standard, for example potassiumhydrogen phthalate (KHP), which is available in pure form, is a crystalline solid at room temperature and can be dried toremove waters of hydration.
1
1
Cynthia K. Larive & Albert K. Korir 2.2.1 11/21/2021 https://chem.libretexts.org/@go/page/77771
2.2: How is the internal standard used to quantify the concentration of myanalyte?If an NMR spectrum is measured with care, the integrated intensity of a resonance due to the analyte nuclei is directlyproportional to its molar concentration and to the number of nuclei that give rise to that resonance.
For example the H NMR resonance of a methyl group would have 3 times the intensity of a peak resulting from a singleproton. In the spectrum below for isopropanol, the 2 methyl groups give rise to a resonance at 1.45 ppm that is 6 timesgreater than the integrated intensity of the CH resonance at 3.99 ppm. Since this spectrum was measured in D O solution,only the resonances of the carbon-bound protons were detected. The OH proton of isopropanol is in fast exchange with theresidual water (HOD) resonance at 4.78 ppm, therefore a separate resonance is not observed for this proton.
In this example we compared the relative integrals of the proton resonances of isopropanol. This information can be veryuseful for structure elucidation. If we instead compare the integral of an analyte resonance to that of a standard compoundof known concentration, we can determine the analyte concentration.
The direct proportionality of the analytical response and molar concentration is a major advantage of NMR over otherspectroscopic measurements for quantitative analysis. For example with UV-visible spectroscopy measurements based theBeer-Lambert Law, absorbance can be related to concentration only if a response factor can be determined for the analyte.The response factor, called the molar absorptivity in UV-visible spectroscopy, is different for each molecule therefore, wemust be able to look up the absorptivity or have access to a pure standard of each compound of interest so that a calibrationcurve can be prepared. With NMR we have a wide choice of standard compounds and a single standard can be used toquantify many components of the same solution.
Question 1. A quantitative NMR experiment is performed to quantify the amount of isopropyl alcohol in a D Osolution. Sodium maleate (0.01021 M) is used as an internal standard. The integral obtained for the maleate resonanceis 46.978. The isopropanol doublet at 1.45 ppm produces an integral of 104.43. What would you predict for theintegral of the isopropanol CH resonance as 3.99 ppm. What is the concentration of isopropanol in this solution?
∝ ConcentrationIntegral Area
Number of Nuclei(2.2.1)
1
2
Analyte Concentration =Normalized Area Analyte ×Standard Concentration
Normalized Area Standard(2.2.2)
Exercise 2.2.1
2
Cynthia K. Larive & Albert K. Korir 2.3.1 10/24/2021 https://chem.libretexts.org/@go/page/77773
2.3: What sample considerations are important?
What nucleus should I detect?
Just as you might make a choice between measuring a UV or an IR spectrum, in NMR we often have a choice in thenucleus we can use for the measurement. A wide range of nuclei can be measured, with the spin ½ nuclei H, P, C, N,
F, Si, and P among the most common. However, most quantitative NMR experiments make use of H, because of theinherent sensitivity of this nucleus and its high relative abundance (nearly 100%). In addition, as we will see in the nextsection, the relaxation properties of nuclei are also important to consider in quantitative NMR experiments, and comparedwith many other nuclei like C, H nuclei have more favorable T relaxation times. The choice of the observe nucleus candepend on whether one seeks universal detection (for organic compounds H and C fall into this category) or selectivedetection. For example fluoride ions can be easily detected in fluorinated water at the sub-ppm level, in large part becauseof the selectivity of the measurement – one expects to find very few other sources of fluorine in water. Similarlyphosphorous containing compounds like ATP, ADP, and inorganic phosphate can be detected and even quantified in livecells, tissue or organisms.
How concentrated is my sample? In the Beer-Lambert law you are probably familiar with from UV-visible spectroscopy, absorbance is directly related to theconcentration of the analyte. Similarly, in NMR the signal we detect scales linearly with concentration. Since NMR is not avery sensitive method, you would ideally like to work with reasonably concentrated samples, for protons this meansanalyte concentrations typically in the millimolar to molar range, depending on the instrument you will be using. Othernuclei are less sensitive than protons. The sensitivity issue has two components, the inherent sensitivity, which depends onthe magnetogyric ratio (γ), and the relative abundance of the nucleus (for example F is 100% abundant, but C is only1.1% of all carbon atoms)
What other practical issues do I need to consider? The sensitivity of an NMR experiment can also be affected by the homogeneity of the magnetic field that the sample feels.It is normal to adjust the field homogeneity through a process known as shimming. NMR samples should be free ofparticulate matter, because particles can make it difficult to achieve good line shape by shimming. You will also havebetter luck with shimming if you have a sample volume sufficient to meet or exceed the minimum volume recommendedby your instrument manufacturer.
1 31 13 15
19 29 31 1
13 11
1 13
19 13
☰
Cynthia K. Larive & Albert K. Korir 2.4.1 11/29/2021 https://chem.libretexts.org/@go/page/77775
2.4: How do I choose the right acquisition parameters for a quantitative NMRmeasurement?This may not be a big consideration in measuring a UV-visible or IR spectrum; you generally just walk up to theinstrument, place your sample in a sample holder and make a measurement. However, with NMR there are severalparameters, summarized below, that can have a huge impact on the quality of your results and whether or not your resultscan be interpreted quantitatively.
Number of ScansAn important consideration is the number of FIDs that are coadded. Especially for quantitative measurements it isimportant to generate spectra that have a high signal-to-noise ratio to improve the precision of the determination. Becausethe primary noise source in NMR is thermal noise in the detection circuits, the signal-to-noise ratio (S/N) scales as thesquare root of the number of scans coadded. To be 99% certain that the measured integral falls within + 1% of the truevalue, a signal-to-noise ratio of 250 is required. Acquisition of high quality spectra for dilute solutions can be very timeconsuming. However, even when solutions have a sufficiently high concentration that signal averaging is not necessary toimprove the S/N, a minimum number of FIDs (typically 8) are coadded to reduce spectral artifacts arising from pulseimperfections or receiver mismatch.
A solution prepared for quantitative analysis using NMR was acquired by coaddition of 8 FIDs produces a spectrumwith an S/N of 62.5 for the analyte signals. How many FIDs would have to be coadded to produce a spectrum with anS/N of 250?
Acquisition TimeThe acquisition time (AT) is the time after the pulse for which the signal is detected. Because the FID is a decaying signal,there is not much point in acquiring the FID for longer than 3 x T because at that point 95% of the signal will havedecayed away into noise. Typical acquisition times in H NMR experiments are 1 – 5 sec.
An interesting feature in choosing an acquisition time is the relationship between the number of data points collected andthe spectral width, or the range of frequencies detected. Although the initial FID detected in the coil is an analog signal, itneeds to be digitized for computer storage and Fourier transformation. According to Nyquist theory, the minimumsampling frequency is at least twice the highest frequency detected. The dwell time (DW) or time between data pointsampling is a parameter that is not typically set by the user, but determined by the spectral width (SW) and the number ofdata points (NP).
Another feature of the acquisition parameters that is important for quantitative measurements is the digital resolution (DR).
Almost all spectrometers are designed with quadrature phase detection, which in effect splits the data points into real andimaginary datasets that serve as inputs for a complex Fourier transform. It is important to have sufficient digital resolutionto accurately define the peak. Since a typical H NMR resonance has a width at half height (w ) of 0.5 to 1.0 Hz, 8-10data points are required to accurately define the peak. The total number of data points used in the Fourier transformationand contributing to the digital resolution can be increased by zero-filling, as described in the section on data processing.
Exercise 2.4.1
21
DW =1
2SW(2.4.1)
AT = DW ×NP (2.4.2)
DR =SW
NP (real)(2.4.3)
11/2
Cynthia K. Larive & Albert K. Korir 2.4.2 11/29/2021 https://chem.libretexts.org/@go/page/77775
A H NMR spectrum was measured using a 400 MHz instrument by acquisition of 16,384 total data points (8192 realpoints) and a spectral width of 12 ppm. What was the acquisition time? Calculate the digital resolution of the resultingspectrum? Is this digital resolution sufficient to accurately define a peak with a width at half height of 0.5 Hz?
Receiver GainThe receiver includes the coil and amplifier circuitry that detects and amplifies the signal prior to digitization by theanalog-to-digital converter (ADC). It is important to set the receiver gain properly so that the ADC is mostly filled, withoutoverflowing. ADC’s used in NMR typically have limited dynamic range of 16 -18 bits. If the receiver gain is set too low,only a few bits of the ADC are filled and digitization error can contribute to poor S/N. If the receiver gain is set too high,(called clipping the FID) the initial portions of the FID will overflow the ADC and will not be properly digitized. In thiscase, resonance intensity can no longer be interpreted in a quantitative manner. In addition, a lot of spurious signals willappear in the spectrum. For most experiments the autogain routine supplied by the NMR manufacturer will work well forthe initial setup of the experiment.
Repetition Time
The repetition time is the total time between the start of acquisition of the first FID and the start of acquisition of thesecond FID. The repetition time is the sum of the acquisition time and any additional relaxation delay inserted prior to therf pulse. Recall that there are two relaxation times in NMR, T and T (with T ≥ T ). If a pulse width of 90 is used tosignal average multiple FIDs to improve S/N or reduce artifacts, we generally need to wait 5 x T between each acquisitionso that the magnetization can relax essentially completely (by at least 99%) to its equilibrium state. If the repetition time isless than 5T , the resonances in the spectrum cannot be simply interpreted in a quantitative manner and resonance intensityis scaled according to T .
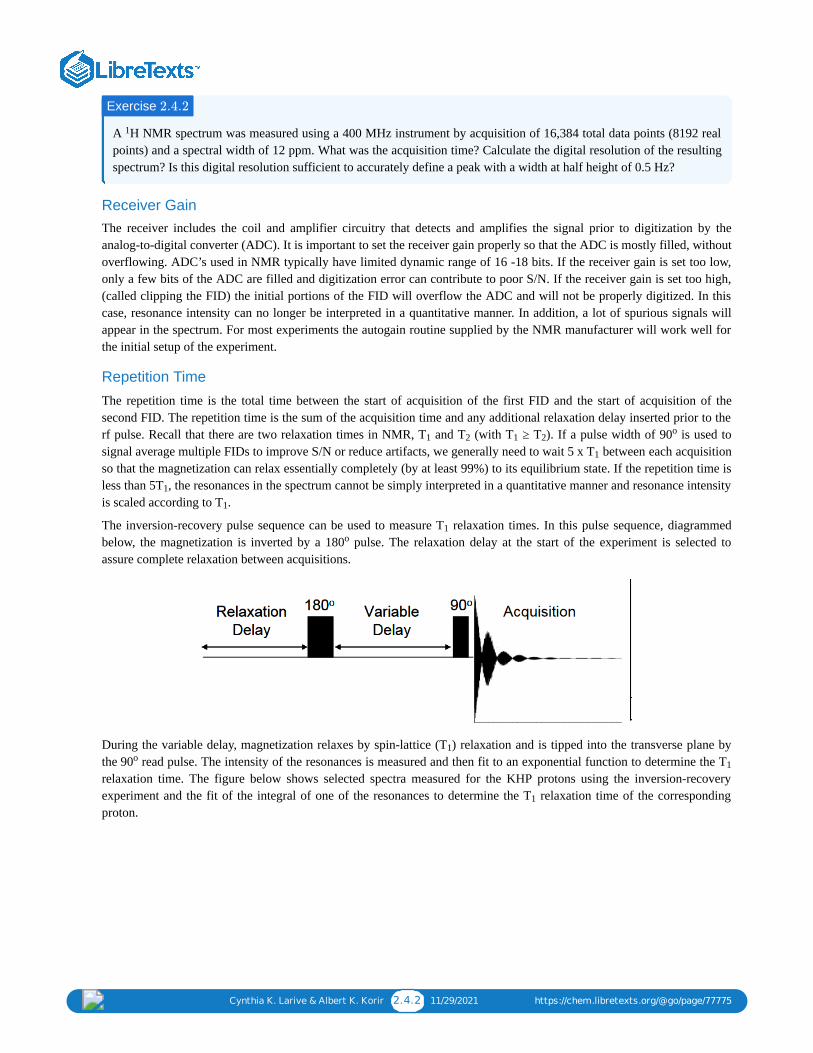
The inversion-recovery pulse sequence can be used to measure T relaxation times. In this pulse sequence, diagrammedbelow, the magnetization is inverted by a 180 pulse. The relaxation delay at the start of the experiment is selected toassure complete relaxation between acquisitions.
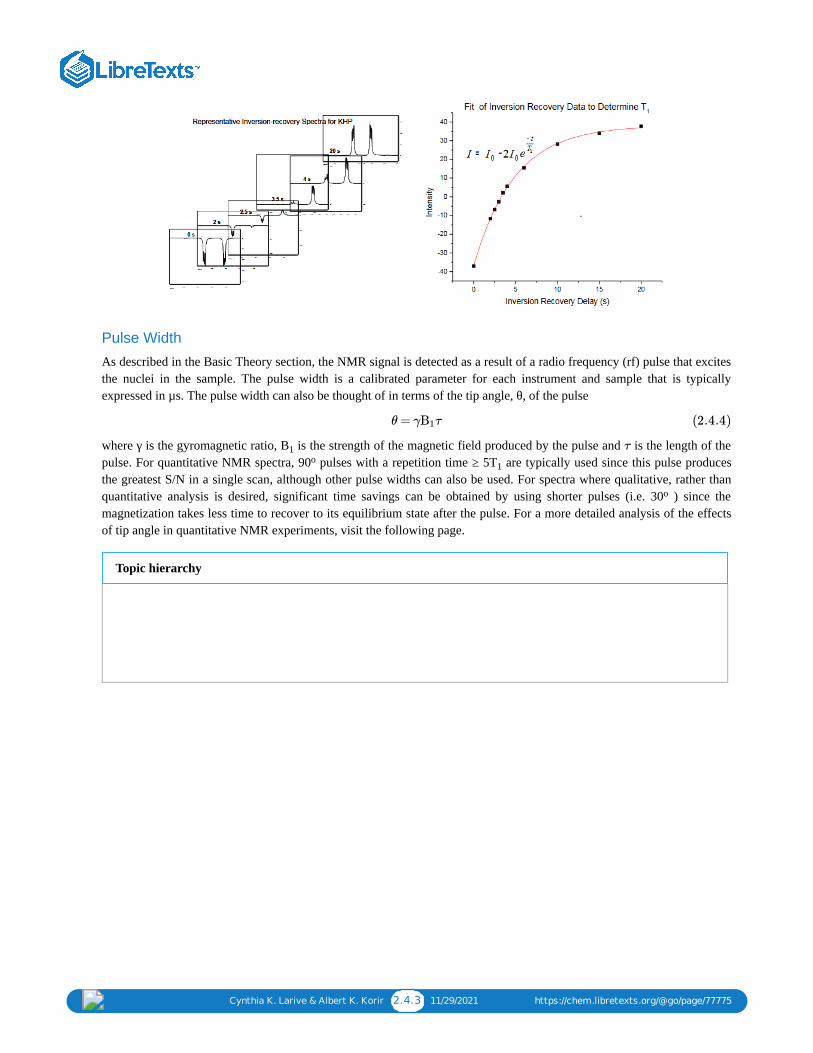
During the variable delay, magnetization relaxes by spin-lattice (T ) relaxation and is tipped into the transverse plane bythe 90 read pulse. The intensity of the resonances is measured and then fit to an exponential function to determine the Trelaxation time. The figure below shows selected spectra measured for the KHP protons using the inversion-recoveryexperiment and the fit of the integral of one of the resonances to determine the T relaxation time of the correspondingproton.
Exercise 2.4.2
1
1 2 1 2o
1
1
1
1o
1o
1
1
Cynthia K. Larive & Albert K. Korir 2.4.3 11/29/2021 https://chem.libretexts.org/@go/page/77775
Pulse Width
As described in the Basic Theory section, the NMR signal is detected as a result of a radio frequency (rf) pulse that excitesthe nuclei in the sample. The pulse width is a calibrated parameter for each instrument and sample that is typicallyexpressed in µs. The pulse width can also be thought of in terms of the tip angle, θ, of the pulse
where γ is the gyromagnetic ratio, B is the strength of the magnetic field produced by the pulse and is the length of thepulse. For quantitative NMR spectra, 90 pulses with a repetition time ≥ 5T are typically used since this pulse producesthe greatest S/N in a single scan, although other pulse widths can also be used. For spectra where qualitative, rather thanquantitative analysis is desired, significant time savings can be obtained by using shorter pulses (i.e. 30 ) since themagnetization takes less time to recover to its equilibrium state after the pulse. For a more detailed analysis of the effectsof tip angle in quantitative NMR experiments, visit the following page.
θ = γ τB1 (2.4.4)
1 τo
1
o
Topic hierarchy
Cynthia K. Larive & Albert K. Korir 2.5.1 10/1/2021 https://chem.libretexts.org/@go/page/77965
2.5: Effects of Tip Angle in Quantitative NMR ExperimentsIn experiments where the goal is qualitative analysis, it is not necessary to acquire the spectra in a manner that produces fullyrelaxed spectra. In this case, one can use the Ernst Angle relationship to calculate the tip angle that will maximize S/N for agiven repetition time. In such experiments, it is typically most efficient to eliminate the relaxation delay and use a repetitiontime equivalent to the acquisition period. Typically the acquisition time is set to allow the FID to decay to noise. This is oftenapproximated by setting the acquisition time to about 3 x T *, which will allow the magnetization to decay by 95% of itsinitial value.
In the Ernst angle equation, ϕ is the tip angle, T is the repetition time and T is the spin-lattice relaxation time of theresonance of interest. For example, with a repetition time of 3 sec and a T relaxation time of 5 sec, we calculate an Ernstangle of 56.7 . While this repetition time and tip angle maximizes S/N, it will not give us integrals that can be interpretedquantitatively in a straight forward way. It is possible to correct for incomplete T relaxation, however this introduces greatererror in the result and is not always practical, since analyte solutions.
Where quantitative integrals are desired there is generally not that great of time savings by using a tip angle less than 90 . Tosee why, let’s look at a concrete example. Assume that for an analyte resonance with a T relaxation time of 5 sec, we have tocoadd 100 FIDs to achieve a S/N of 250:1 using a 90 pulse. In this experiment, the shortest repetition time we should use is 5x T , or 25 sec, which will allow the magnetization to relax to 99% of its initial value. This means that it would take 2500 sec(or 0.694 hr) to complete this experiment.
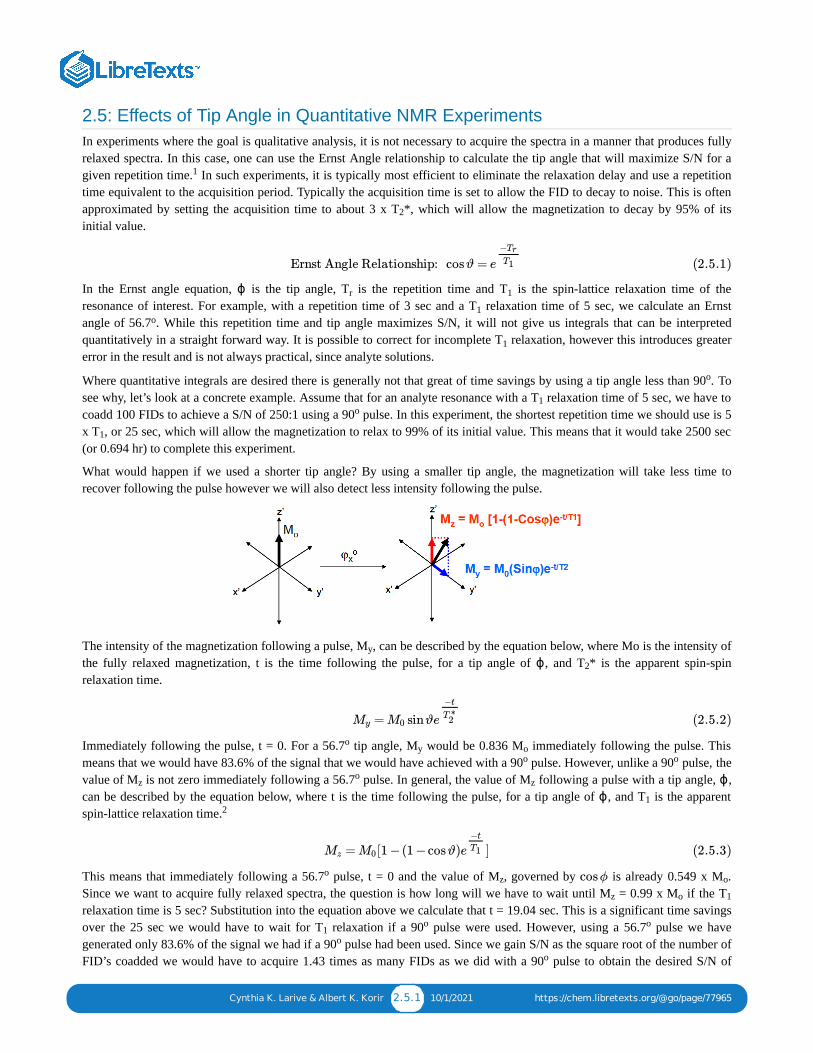
What would happen if we used a shorter tip angle? By using a smaller tip angle, the magnetization will take less time torecover following the pulse however we will also detect less intensity following the pulse.
The intensity of the magnetization following a pulse, M , can be described by the equation below, where Mo is the intensity ofthe fully relaxed magnetization, t is the time following the pulse, for a tip angle of ϕ, and T * is the apparent spin-spinrelaxation time.
Immediately following the pulse, t = 0. For a 56.7 tip angle, M would be 0.836 M immediately following the pulse. Thismeans that we would have 83.6% of the signal that we would have achieved with a 90 pulse. However, unlike a 90 pulse, thevalue of M is not zero immediately following a 56.7 pulse. In general, the value of M following a pulse with a tip angle, ϕ,can be described by the equation below, where t is the time following the pulse, for a tip angle of ϕ, and T is the apparentspin-lattice relaxation time.
This means that immediately following a 56.7 pulse, t = 0 and the value of M , governed by is already 0.549 x M .Since we want to acquire fully relaxed spectra, the question is how long will we have to wait until M = 0.99 x M if the Trelaxation time is 5 sec? Substitution into the equation above we calculate that t = 19.04 sec. This is a significant time savingsover the 25 sec we would have to wait for T relaxation if a 90 pulse were used. However, using a 56.7 pulse we havegenerated only 83.6% of the signal we had if a 90 pulse had been used. Since we gain S/N as the square root of the number ofFID’s coadded we would have to acquire 1.43 times as many FIDs as we did with a 90 pulse to obtain the desired S/N of
1
2
Ernst Angle Relationship: cos ϑ = e
−Tr
T1 (2.5.1)
r 1
1o
1
o
1o
1
y
2
= sinϑMy M0 e
−t
T ∗2 (2.5.2)
oy o
o o
zo
z
12
= [1 −(1 −cos ϑ) ]Mz M0 e
−t
T1 (2.5.3)
oz cos ϕ o
z o 1
1o o
o
o
Cynthia K. Larive & Albert K. Korir 2.5.2 10/1/2021 https://chem.libretexts.org/@go/page/77965
250:1. Therefore, the total experiment time using a 56.7 pulse would be 19.04 sec x 143 or 2723 sec or 0.756 hr, a slightlylonger total acquisition time than was required using a 90 pulse. For this reason, most NMR spectroscopists simply use a 90pulse and with a repetition time of at least 5 x T for quantitative NMR experiments.
References 1. R. R. Ernst and W. A. Anderson “Application of Fourier Transform Spectroscopy to Magnetic Resonance” Rev. Sci. Inst.
(1966) 37:93-102.2. D. L. Rabenstein “Sensitivity Enhancement by Signal Averaging in Pulsed/Fourier Transform NMR Spectroscopy” J.
Chem. Ed. (1984) 61:909-913.
o
o o
1
Cynthia K. Larive & Albert K. Korir 2.6.1 10/31/2021 https://chem.libretexts.org/@go/page/77777
2.6: What data processing considerations are important for obtaining accurateand precise results?Data processing describes operations that are performed to improve spectral quality after the data has been acquired andsaved to disk.
Zero-Filling Zero-filling is the addition of zeros to the end of the FID to increase the spectral resolution. Because zeros are added, notadditional real data points carrying with them an overlay of noise, zero-filling can improve digital resolution withoutdecreasing S/N. Another option is to use linear prediction to add data points calculated from the beginning of the FIDwhere S/N is at its highest.
Apodization
Apodization is the multiplication of the FID by a mathematical function. Apodization can serve several purposes. Spectralresolution can be improved by emphasizing the data points at the end of the FID. S/N can be improved by multiplying theFID by a function that emphasizes the beginning of the FID relative to the later data points where S/N is poorer. Forquantitative NMR experiments, the most common apodization function is an exponential decay that matches the decay ofthe FID (a matched filter) and forces the data to zero intensity at the end of the FID. This function is often referred to a linebroadening, since it broadens the signals based on the time constant of the exponential decay. This trade-off between S/Nand spectral resolution is not restricted to NMR and is common to many instrumental methods of analysis.
Integration Regions
Because NMR signals are Lorentzians, the resonances have long tails that can carry with them significant amounts ofresonance intensity. This is especially problematic when the sample is complex containing many closely spaced oroverlapped signals, or when the homogeneity of the magnetic field around the sample has not been properly corrected byshimming. For a Lorentzian peak with a width at half-height of 0.5 Hz, integration regions set at 3.2 Hz or 16 Hz on eitherside of the resonance would include approximately 95% or 99% of the peak area, respectively. Note that this analysis doesnot include the C satellites which account for an additional 1.1% of the intensity of carbon-bound protons in samplescontaining C at natural abundance. In cases where resonances are highly overlapped, more accurate quantitative analysiscan often be achieved by peak fitting rather than by integration.
An alternative approach utilizes C decoupling during the acquisition of the proton spectrum to collapse the C satellitesso that this signal is coincident with the primary H- C resonance. This relatively simple approach requires only thatthe user has access to a probe (for example a broadband inverse or triple resonance probe) that permits C decoupling.
Baseline Correction
NMR integrals are calculated by summation of the intensities of the data points within the defined integration region.Therefore, a flat spectral baseline with near zero intensity is required. This can be achieved in several ways; the mostcommon is selecting regions across the spectrum where no signals appear, defining these as baseline and fitting them to apolynomial function that is then subtracted from the spectrum.
13
13
13 13
1 12 2, 3
13
Cynthia K. Larive & Albert K. Korir 2.7.1 10/24/2021 https://chem.libretexts.org/@go/page/77779
2.7: References1. D.A. Jayawickrama, C.K. Larive, Anal. Chem. 71:2117-2112 (1999).2. The Quantitative NMR Portal, http://tigger.uic.edu/~gfp/qnmr/3. G. F. Pauli, B. U. Jaki, D. C. Lankin “A Routine Experimental Protocol for qHNMR Illustrated with Taxol“ J. Nat.
Prod. 70:589-595 (2007).
☰
Cynthia K. Larive & Albert K. Korir 3.1 11/21/2021 https://chem.libretexts.org/@go/page/77724
3: Virtual ExperimentThis experiment, available in pdf format, uses FTNMR Simulator, a program written by Dr. Harold Bell, professoremeritus at Virginia Tech to simulate an NMR experiment. Instrument parameters such as spectral width, number of datapoints, pulse width, noise, etc., are selected by the user. Once the FID is displayed, it can be treated by exponentialsmoothing or resolution enhancement. After the Fourier transform, phase corrections and baseline flattening may beapplied. Spectra may be printed, or saved as Windows metafiles.
To download the software, you can access the following website and download the FTNMR Simulator, newfid.zip(2.9mBytes). http://www.asdlib.org/onlineArticles...retextpage.htm
The program is also available in Spanish, fidsp.zip, and French, fidwinfr.zip. A tutorial, wintutor.pdf (255 kBytes), toaccompany this software is also available. It contains more than 20 exercises selected to help novices learn about FTNMR.
3.1: Virtual Laboratory
Topic hierarchy
Cynthia K. Larive & Albert K. Korir 3.1.1 11/7/2021 https://chem.libretexts.org/@go/page/77784
3.1: Virtual LaboratoryThis virtual laboratory makes use of the FTNMR simulation program written by Harold Bell to explore the effects of theparameters discussed in the Practical Aspects section of this module on the results of simulated NMR data. Although youare encouraged to explore this program more fully, the focus here is on the effects of applied magnetic field strength, signalaveraging, relaxation times, repetition times, the number of data points and the receiver gain.
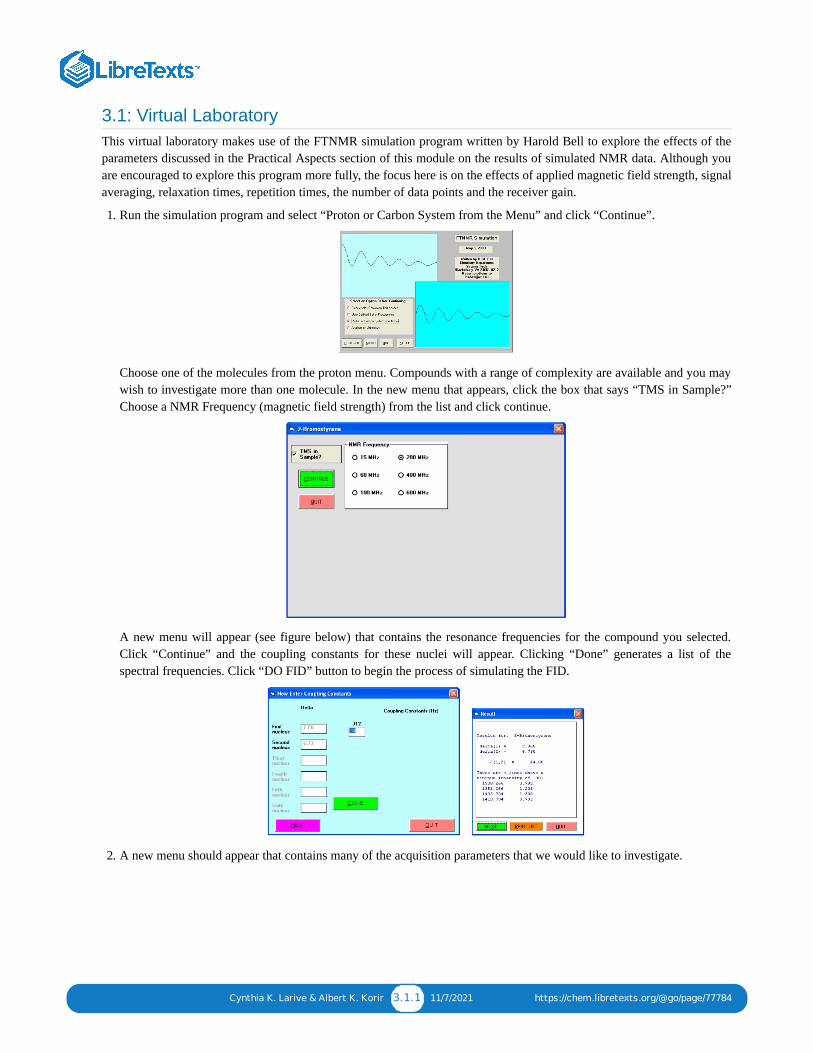
1. Run the simulation program and select “Proton or Carbon System from the Menu” and click “Continue”.
Choose one of the molecules from the proton menu. Compounds with a range of complexity are available and you maywish to investigate more than one molecule. In the new menu that appears, click the box that says “TMS in Sample?”Choose a NMR Frequency (magnetic field strength) from the list and click continue.
A new menu will appear (see figure below) that contains the resonance frequencies for the compound you selected.Click “Continue” and the coupling constants for these nuclei will appear. Clicking “Done” generates a list of thespectral frequencies. Click “DO FID” button to begin the process of simulating the FID.
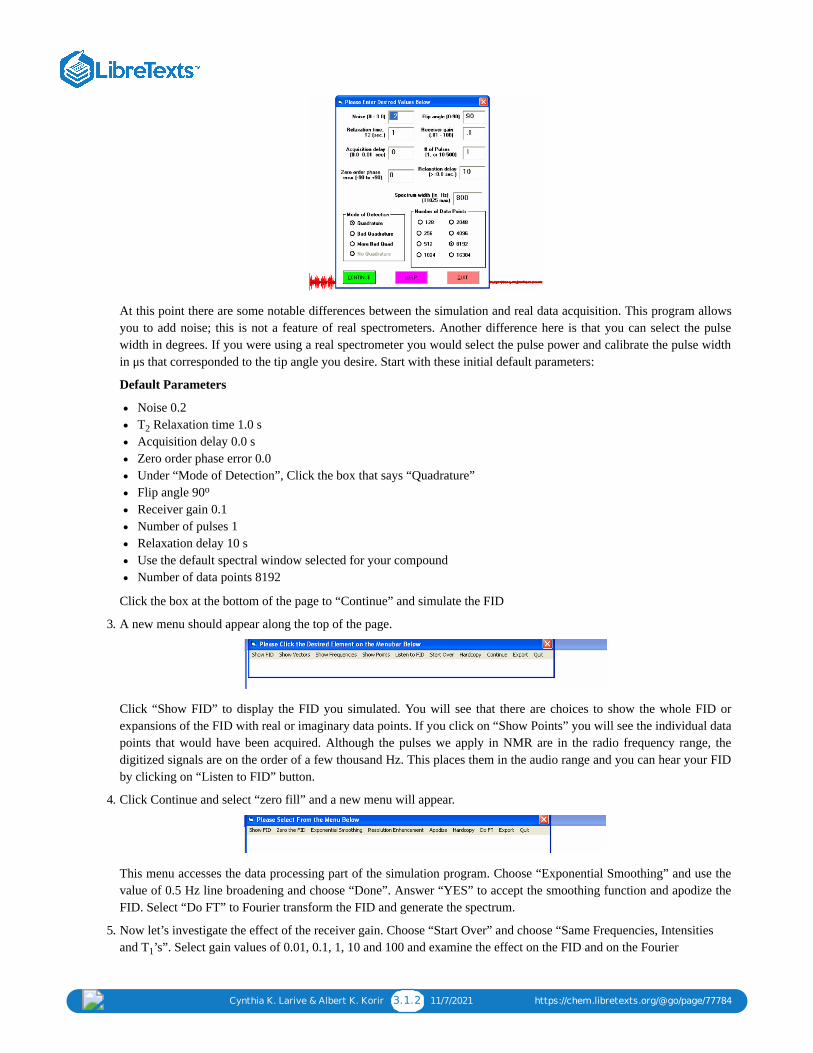
2. A new menu should appear that contains many of the acquisition parameters that we would like to investigate.
Cynthia K. Larive & Albert K. Korir 3.1.2 11/7/2021 https://chem.libretexts.org/@go/page/77784
At this point there are some notable differences between the simulation and real data acquisition. This program allowsyou to add noise; this is not a feature of real spectrometers. Another difference here is that you can select the pulsewidth in degrees. If you were using a real spectrometer you would select the pulse power and calibrate the pulse widthin μs that corresponded to the tip angle you desire. Start with these initial default parameters:
Default Parameters
Noise 0.2T Relaxation time 1.0 sAcquisition delay 0.0 sZero order phase error 0.0Under “Mode of Detection”, Click the box that says “Quadrature”Flip angle 90Receiver gain 0.1Number of pulses 1Relaxation delay 10 sUse the default spectral window selected for your compoundNumber of data points 8192
Click the box at the bottom of the page to “Continue” and simulate the FID
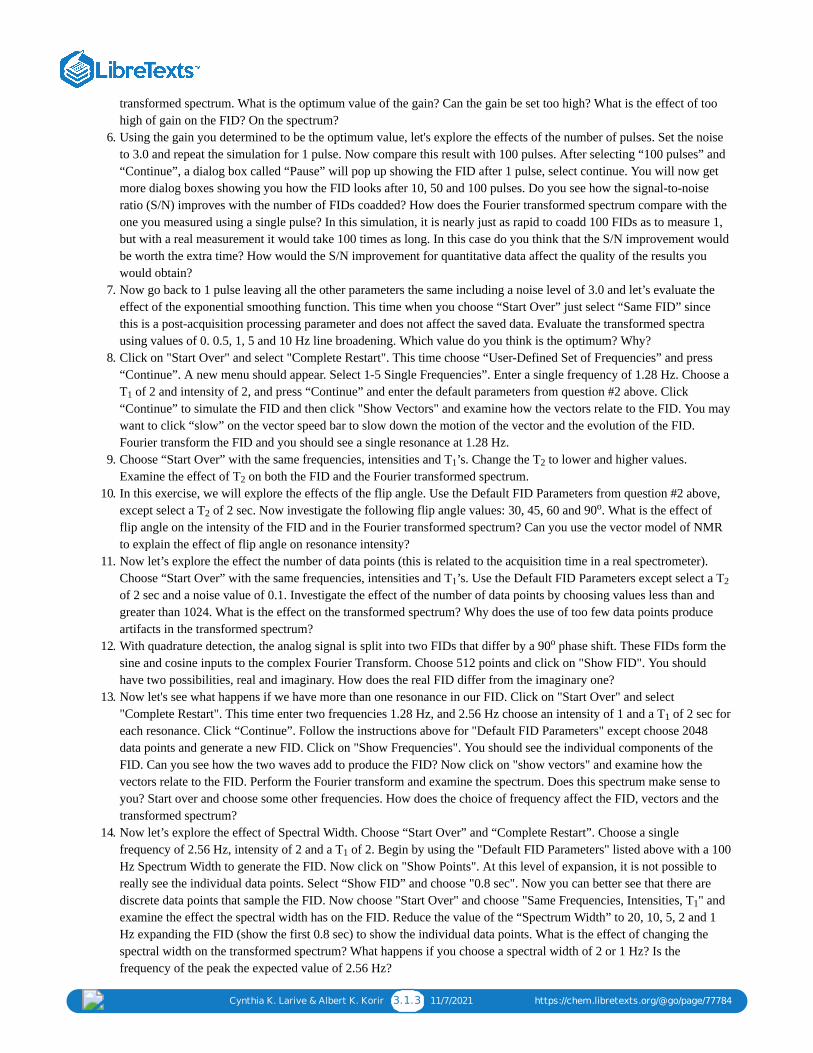
3. A new menu should appear along the top of the page.
Click “Show FID” to display the FID you simulated. You will see that there are choices to show the whole FID orexpansions of the FID with real or imaginary data points. If you click on “Show Points” you will see the individual datapoints that would have been acquired. Although the pulses we apply in NMR are in the radio frequency range, thedigitized signals are on the order of a few thousand Hz. This places them in the audio range and you can hear your FIDby clicking on “Listen to FID” button.
4. Click Continue and select “zero fill” and a new menu will appear.
This menu accesses the data processing part of the simulation program. Choose “Exponential Smoothing” and use thevalue of 0.5 Hz line broadening and choose “Done”. Answer “YES” to accept the smoothing function and apodize theFID. Select “Do FT” to Fourier transform the FID and generate the spectrum.
5. Now let’s investigate the effect of the receiver gain. Choose “Start Over” and choose “Same Frequencies, Intensitiesand T ’s”. Select gain values of 0.01, 0.1, 1, 10 and 100 and examine the effect on the FID and on the Fourier
2
o
1
Cynthia K. Larive & Albert K. Korir 3.1.3 11/7/2021 https://chem.libretexts.org/@go/page/77784
transformed spectrum. What is the optimum value of the gain? Can the gain be set too high? What is the effect of toohigh of gain on the FID? On the spectrum?
6. Using the gain you determined to be the optimum value, let's explore the effects of the number of pulses. Set the noiseto 3.0 and repeat the simulation for 1 pulse. Now compare this result with 100 pulses. After selecting “100 pulses” and“Continue”, a dialog box called “Pause” will pop up showing the FID after 1 pulse, select continue. You will now getmore dialog boxes showing you how the FID looks after 10, 50 and 100 pulses. Do you see how the signal-to-noiseratio (S/N) improves with the number of FIDs coadded? How does the Fourier transformed spectrum compare with theone you measured using a single pulse? In this simulation, it is nearly just as rapid to coadd 100 FIDs as to measure 1,but with a real measurement it would take 100 times as long. In this case do you think that the S/N improvement wouldbe worth the extra time? How would the S/N improvement for quantitative data affect the quality of the results youwould obtain?
7. Now go back to 1 pulse leaving all the other parameters the same including a noise level of 3.0 and let’s evaluate theeffect of the exponential smoothing function. This time when you choose “Start Over” just select “Same FID” sincethis is a post-acquisition processing parameter and does not affect the saved data. Evaluate the transformed spectrausing values of 0. 0.5, 1, 5 and 10 Hz line broadening. Which value do you think is the optimum? Why?
8. Click on "Start Over" and select "Complete Restart". This time choose “User-Defined Set of Frequencies” and press“Continue”. A new menu should appear. Select 1-5 Single Frequencies”. Enter a single frequency of 1.28 Hz. Choose aT of 2 and intensity of 2, and press “Continue” and enter the default parameters from question #2 above. Click“Continue” to simulate the FID and then click "Show Vectors" and examine how the vectors relate to the FID. You maywant to click “slow” on the vector speed bar to slow down the motion of the vector and the evolution of the FID.Fourier transform the FID and you should see a single resonance at 1.28 Hz.
9. Choose “Start Over” with the same frequencies, intensities and T ’s. Change the T to lower and higher values.Examine the effect of T on both the FID and the Fourier transformed spectrum.
10. In this exercise, we will explore the effects of the flip angle. Use the Default FID Parameters from question #2 above,except select a T of 2 sec. Now investigate the following flip angle values: 30, 45, 60 and 90 . What is the effect offlip angle on the intensity of the FID and in the Fourier transformed spectrum? Can you use the vector model of NMRto explain the effect of flip angle on resonance intensity?
11. Now let’s explore the effect the number of data points (this is related to the acquisition time in a real spectrometer).Choose “Start Over” with the same frequencies, intensities and T ’s. Use the Default FID Parameters except select a Tof 2 sec and a noise value of 0.1. Investigate the effect of the number of data points by choosing values less than andgreater than 1024. What is the effect on the transformed spectrum? Why does the use of too few data points produceartifacts in the transformed spectrum?
12. With quadrature detection, the analog signal is split into two FIDs that differ by a 90 phase shift. These FIDs form thesine and cosine inputs to the complex Fourier Transform. Choose 512 points and click on "Show FID". You shouldhave two possibilities, real and imaginary. How does the real FID differ from the imaginary one?
13. Now let's see what happens if we have more than one resonance in our FID. Click on "Start Over" and select"Complete Restart". This time enter two frequencies 1.28 Hz, and 2.56 Hz choose an intensity of 1 and a T of 2 sec foreach resonance. Click “Continue”. Follow the instructions above for "Default FID Parameters" except choose 2048data points and generate a new FID. Click on "Show Frequencies". You should see the individual components of theFID. Can you see how the two waves add to produce the FID? Now click on "show vectors" and examine how thevectors relate to the FID. Perform the Fourier transform and examine the spectrum. Does this spectrum make sense toyou? Start over and choose some other frequencies. How does the choice of frequency affect the FID, vectors and thetransformed spectrum?
14. Now let’s explore the effect of Spectral Width. Choose “Start Over” and “Complete Restart”. Choose a singlefrequency of 2.56 Hz, intensity of 2 and a T of 2. Begin by using the "Default FID Parameters" listed above with a 100Hz Spectrum Width to generate the FID. Now click on "Show Points". At this level of expansion, it is not possible toreally see the individual data points. Select “Show FID” and choose "0.8 sec". Now you can better see that there arediscrete data points that sample the FID. Now choose "Start Over" and choose "Same Frequencies, Intensities, T " andexamine the effect the spectral width has on the FID. Reduce the value of the “Spectrum Width” to 20, 10, 5, 2 and 1Hz expanding the FID (show the first 0.8 sec) to show the individual data points. What is the effect of changing thespectral width on the transformed spectrum? What happens if you choose a spectral width of 2 or 1 Hz? Is thefrequency of the peak the expected value of 2.56 Hz?
1
1 2
2
2o
1 2
o
1
1
1
Cynthia K. Larive & Albert K. Korir 3.1.4 11/7/2021 https://chem.libretexts.org/@go/page/77784
15. Now let’s examine what happens if our acquisition parameters do not allow for complete relaxation of themagnetization. Start completely over and again let's use 3 resonances with frequencies of 0 Hz (20sec), 5 Hz (5sec),and 10 Hz (1sec) all with intensities of 0.5 and with the T values given in parentheses after the frequency. Use the"Default FID Parameters" except choose a relaxation delay of 100 sec, 10 pulses, a T of 0.3, a spectrum width of 100Hz and 1024 points. Fourier transform the FID to examine the relative intensities of the resonances in the NMRspectrum. Choose “Start Over” selecting the “Same Frequencies, Intensities and T1’s” and examine the effect of signalaveraging on the intensity of the resonances by reducing the relaxation delay to 20, 10, 5, 2, and 0 sec, and Fouriertransforming each FID (remember that in each case, the magnetization does relax during the acquisition time). What isthe effect of reducing the relaxation delay on the relative intensities and on the overall S/N ratio.
1
2
1 12/5/2021
CHAPTER OVERVIEW4: Q-NMR EXPERIMENTDetermination of Malic Acid Content in Apple Juice by NMR
4.1: PRELAB EXERCISES4.2: BACKGROUND4.3: DRY LAB4.4: WET LAB
Cynthia K. Larive & Albert K. Korir 4.1.1 11/7/2021 https://chem.libretexts.org/@go/page/77785
4.1: Prelab Exercises1. Malic acid is a diprotic acid containing 2 carboxylate groups. Draw the structures of malic acid.2. What other analytical methods might be used for quantitative analysis of malic acid in fruit juices?3. What properties would you consider in choosing a reference standard for quantitative analysis by NMR?4. How will changing pH affect the chemical shifts of malic acid? What potential problems might arise from these pH
effects?
Follow the instructions provided in the Virtual Lab to help answer questions 5 and 6.
5. What acquisition parameters are important for a quantitative NMR measurement? How do you select the values ofthese parameters?
6. What data processing considerations are important for obtaining accurate and precise results?
Cynthia K. Larive & Albert K. Korir 4.2.1 11/7/2021 https://chem.libretexts.org/@go/page/77790
4.2: BackgroundThere are a number of issues that should be considered when measuring NMR spectra for purposes of quantitativeanalysis. Many of these issues pertain to the way that the NMR data is acquired and processed. It is usually necessary toperform quantitative NMR measurements with care to obtain accurate and precise quantitative results. The advantages ofNMR over other spectroscopic methods are that no response factor is needed and all the resonances generated by aparticular nucleus (for example H, P or F) have an integrated intensity directly proportional to the molar concentrationof the analyte and to the number of nuclei that give rise to that resonance.
The H NMR resonance of a methyl group would have 3 times the intensity of a peak resulting from a single proton. Forexample, sodium 3-(trimethylsilyl)tetrapropionate TSP, has a methyl resonance equivalent to 9 protons (from the threemethyl groups) and therefore would give rise to a resonance that is 9 times greater than the intensity resulting from a singleproton.
For this experiment, KHP (potassium hydrogen phthalate) will be used as an internal quantitation standard. KHP has theadvantage of being a primary standard, meaning that after drying, its solution concentration can be calculated directly fromits mass. You may also wish you use an internal chemical shift reference, like TSP-d in the preparation of your solutions.TSP is not a primary standard, and is known to adsorb to glass surfaces which can change its solution concentration overtime, therefore it is not a useful quantitation standard. As a chemical shift reference, TSP-d has the advantage ofproducing a single sharp resonance with a defined chemical shift of 0.00 ppm.
Malic acid and citric acids are the major organic acids in fruits. Q-NMR is a valuable technique for determining thequantities of major and minor compounds in fruit juices. By comparing the resonance integral of an analyte to that of astandard compound of known concentration, we can determine the analyte concentration according to the equation below:
where C is the analyte concentration, C is the quantitation standard concentration, and I and I are the areasof the resonances of the analyte and the standard, respectively, normalized to the number of protons giving rise to eachresonance.
The accuracy and precision of the integral measurements are affected by the following experimental factors.
spectral S/Nline shapequality of shimmingbaselineapodization window functionsphasing, baseline-, and drift -corrections
Resonance overlap is a potential problem in accurate quantitation by NMR. This problem can sometimes be solved bycareful selection of pH, using a different solvent, or adding a reagent to change the analyte chemical shift (i.e. lanthanideshift reagents). In some cases, the H NMR spectrum may be too crowded for accurate quantitation, but another nucleus,for example F or C, that has a larger chemical shift window might produce well-separated resonances of the mixturecomponents.
Field-frequency lock
The fields of superconducting magnets tend to drift over a period of minutes to hours causing loss of resolution. Mostmodern spectrometers are equipped with a lock channel that regulates the spectrometer field by monitoring the chemicalshift of a deuterium resonance of the solvent. As the magnetic field drifts, the change in the deuterium resonance frequencygenerates an error signal that indicates both the magnitude and the direction of the field change, allowing compensation bya feedback circuit. Non-viscous deuterated solvents provide the best field-frequency lock because of their sharp andintense resonances. In H NMR experiments an additional advantage of preparing samples in deuterated solvents is that the
1 31 19
∝ ConcentrationIntegral Area
Number of Nuclei(4.2.1)
1
4
4
=Canalyte
×Ianalyte Cstd
Istd(4.2.2)
analyte std analyte std
1
19 13
1
Cynthia K. Larive & Albert K. Korir 4.2.2 11/7/2021 https://chem.libretexts.org/@go/page/77790
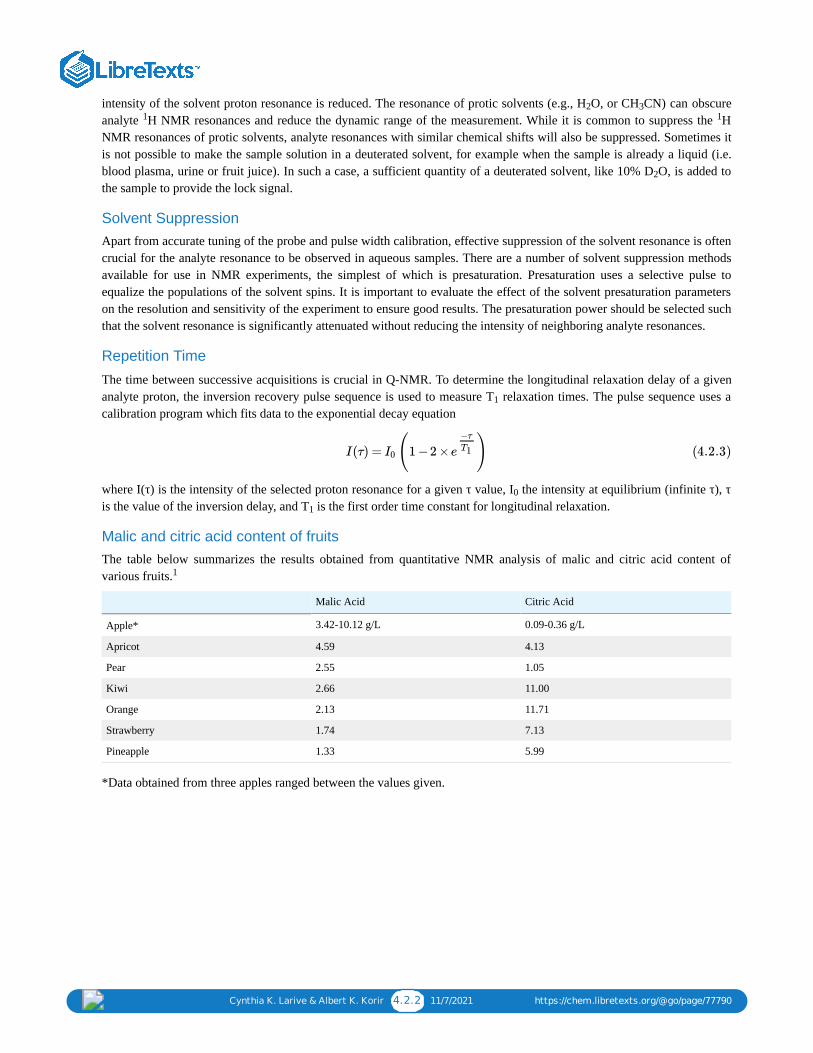
intensity of the solvent proton resonance is reduced. The resonance of protic solvents (e.g., H O, or CH CN) can obscureanalyte H NMR resonances and reduce the dynamic range of the measurement. While it is common to suppress the HNMR resonances of protic solvents, analyte resonances with similar chemical shifts will also be suppressed. Sometimes itis not possible to make the sample solution in a deuterated solvent, for example when the sample is already a liquid (i.e.blood plasma, urine or fruit juice). In such a case, a sufficient quantity of a deuterated solvent, like 10% D O, is added tothe sample to provide the lock signal.
Solvent SuppressionApart from accurate tuning of the probe and pulse width calibration, effective suppression of the solvent resonance is oftencrucial for the analyte resonance to be observed in aqueous samples. There are a number of solvent suppression methodsavailable for use in NMR experiments, the simplest of which is presaturation. Presaturation uses a selective pulse toequalize the populations of the solvent spins. It is important to evaluate the effect of the solvent presaturation parameterson the resolution and sensitivity of the experiment to ensure good results. The presaturation power should be selected suchthat the solvent resonance is significantly attenuated without reducing the intensity of neighboring analyte resonances.
Repetition Time
The time between successive acquisitions is crucial in Q-NMR. To determine the longitudinal relaxation delay of a givenanalyte proton, the inversion recovery pulse sequence is used to measure T relaxation times. The pulse sequence uses acalibration program which fits data to the exponential decay equation
where I(τ) is the intensity of the selected proton resonance for a given τ value, I the intensity at equilibrium (infinite τ), τis the value of the inversion delay, and T is the first order time constant for longitudinal relaxation.
Malic and citric acid content of fruitsThe table below summarizes the results obtained from quantitative NMR analysis of malic and citric acid content ofvarious fruits.
Malic Acid Citric Acid
Apple* 3.42-10.12 g/L 0.09-0.36 g/L
Apricot 4.59 4.13
Pear 2.55 1.05
Kiwi 2.66 11.00
Orange 2.13 11.71
Strawberry 1.74 7.13
Pineapple 1.33 5.99
*Data obtained from three apples ranged between the values given.
2 31 1
2
1
I(τ) = (1 −2 × )I0 e
−τ
T1 (4.2.3)
0
1
1
Cynthia K. Larive & Albert K. Korir 4.3.1 11/7/2021 https://chem.libretexts.org/@go/page/77793
4.3: Dry Lab
Drylab Procedure:
This section contains FIDs measured using a 600 MHz Bruker Avance spectrometer. The FIDs can be downloaded andprocessed to quantify the concentration of malic acid in a D O solution and in apple juice. Inversion-recovery spectrameasured for KHP are provided so that you can calculate the T relaxation time using the resonance intensity. The FIDsare provided in JCAMP format which can be processed using most modern vendor software programs. If you do not haveaccess to an NMR spectrometer, a free NMR processing software package wxNUTS can be downloaded to use with MacOSX and Windows:
http://www.acornnmr.com/nuts.htm
A. Preparation of KHP solution and determination of the T relaxation times of the KHP protons
A small amount of potassium hydrogen phthalate (KHP) was placed a beaker put into an oven at 110 ºC for 4 hrs. Thebeaker was then removed, covered in aluminum foil and placed in a dessicator to cool. The KHP was weighed using ananalytical balance, transferred to a 5 mL volumetric flask and diluted with to the mark with D O to prepare a stocksolution.
Mass of weighing paper = 0.2219 g
Mass of weighing paper + KHP = 0.3533 g
To measure the T relaxation times of the KHP protons, a 600 μL aliquot of this stock solution was transferred to an NMRtube. A series of inversion recovery spectra were acquired as a function of the variable delay between the 180 and 90pulses. The spectrometer frequency was 599.923 MHz. This experiment used an acquisition time of 2 sec, and anadditional relaxation delay of 35 sec. 8 FIDs were coadded for each of the following spectra. Download and analyze thesespectra to determine the T relaxation times of the KHP protons.
To download a file click the file name and once the text window opens go to File and Save As to save the file as a text file.To process the downloaded file using NUTS, open the wxNUTS program and under the File menu click Import and thenselect the file to process.
Variable delay JCAMP File
0.005 (s) T1-measurement-KHP-051708_0s.dx
2 T1-measurement-KHP-051708_2s.dx
2.5 T1-measurement-KHP-051708_2p5s.dx
3 T1-measurement-KHP-051708_3s.dx
3.5 T1-measurement-KHP-051708_3p5s.dx
4 T1-measurement-KHP-051708_4s.dx
6 T1-measurement-KHP-051708_6s.dx
10 T1-measurement-KHP-051708_10s.dx
15 T1-measurement-KHP-051708_15s.dx
20 T1-measurement-KHP-051708_20s.dx
B. Determination of the malic acid concentration in a D O stock solution
To test our ability to quantitatively measure the malic acid concentration in an unknown apple juice sample using KHP asan internal standard, a solution containing a known malic acid concentration was prepared by transferring a known mass ofmalic acid to a 5 mL volumetric flask and diluting to the mark with D O.
Mass of paper = 0.1897 g
Mass of paper + Malic acid = 0.3324 g
2
1
1
2
1o o
1
2
2
Cynthia K. Larive & Albert K. Korir 4.3.2 11/7/2021 https://chem.libretexts.org/@go/page/77793
The solution for Q-NMR was prepared by combining 1.00 mL of the KHP stock solution and 1.00 mL of the malic acidstock solution. The solution was mixed well and a 600 μL aliquot transferred to an NMR tube for analysis. The frequencyof the spectrometer was 599.923 MHz. The spectrum was measured using a 2 s acquisition time and an additional 35 srelaxation delay. 64 FIDs were coadded.
The FID below was acquired for the quantitative analysis of the malic acid standard solution using KHP as an internalstandard. Download and analyze this spectrum to determine the concentration of the malic acid in this stock solution.
Q-NMR-Malic-JHP-061108_Run2.dx
C. Determination of the malic acid concentration in a fruit juice solution
The KHP stock solution was diluted by mixing 1.00 mL of the stock solution prepared in part A with 1.00 mL of D O.After mixing, a pipettor was used to add 100 μL of the diluted KHP solution to 900 μL of apple juice obtained from thegrocery store (note that better accuracy and precision would have been achieved if a 1 mL glass pipette were used insteadof a pipettor). The pH of the solution was adjusted to approximately 1.35 using HCl. A 600 μL aliquot of this solution wastransferred to an NMR tube and the spectrum recorded at a frequency of 599.923 MHz. The spectrum was measured usinga 2 s acquisition time and an additional 35 s relaxation delay. The solvent resonance was suppressed by saturation duringthe relaxation delay. 480 FIDs were coadded.
The FID below was acquired for the quantitative analysis of the malic acid in apple juice using KHP as an internalstandard. Download and analyze this spectrum to determine the concentration of the malic acid in the apple juice sample.
Q-NMR-Apple-JHP-061108A_Run1.dx
Dry Lab Report:1. Using the mass and volume used to make the stock solution in part A, calculate the KHP concentration.2. Using the inversion-recovery data, determine the T relaxation times of the two KHP resonances.3. Using the mass and volume used to make the stock solution in part B, calculate the malic acid concentration.4. What is the concentration of malic acid determined from the Q-NMR experiment using KHP as an internal standard?5. What is the concentration of the malic acid in the apple juice?
2
1
Cynthia K. Larive & Albert K. Korir 4.4.1 12/5/2021 https://chem.libretexts.org/@go/page/77795
4.4: Wet Lab
Wet Lab Procedure:
Part A. Preparation of standard solutions1. Prepare a solution of the reference standard by weighing dry KHP and dissolving in an appropriate volume of
deionized water or D O (Your instructor will indicate which solvent should be used in your experiments). Exactknowledge of the mass and volume of the KHP solution is important because the concentration of this solution controlsthe accuracy of the analysis.
2. Prepare a stock solution of malic acid by weighing dry malic acid and dissolving in an appropriate volume of deionizedwater or D O (Your instructor will indicate which solvent should be used in your experiments). Adjust these stocksolutions to around pH 1 with HCl
Note: if deionized water is used as the solvent you will need to add some D O (usually around 10%) as a lock solvent.You also may want to consider using a chemical shift reference standard.
Part B. NMR parameters and quantitative analysis of standard solutions1. Combine aliquots of the malic acid and KHP solutions you made in part A.2. Determine and record the values for the each parameter listed below. Be prepared to justify your choice in each case.
Obtain an NMR spectrum of the solutions you prepared in part B1.
Acquisition time =
Relaxation delay* =
Pulse width =
Spectral width =
Receiver gain =
Temperature =
Number of scans =
* The appropriate value of the relaxation delay can be determined from an inversion recovery experiment. If this is notfeasible, your instructor may help you decide on the appropriate value of this parameter.
3. After the experiment is completed, process the spectra using appropriate line broadening, zero filling, phasing, andbaseline correction.
4. Assign the KHP and malic acid resonances.5. Calculate the S/N for this measurement by dividing the integrals measured for resolved malic acid resonances by the
rms (root mean square) noise over a region of the spectrum that free of resonances and has a flat baseline.6. Determine the concentrations of malic acid in your stock solution relative to KHP. How does the concentration you
determined by Q-NMR compare with the value you would calculate from the mass and volume used in the preparationof the stock solutions?
Part C. Determination of the malic acid content of unknown fruit juice samples1. If necessary clarify the juice sample by centrifugation. Prepare a 5-fold dilution of the juice sample with deionized
water, adjusting the pH to around 1 with HCl.2. Prepare at least 3 replicate solutions for quantitative analysis using KHP as an internal standard.3. Acquire NMR spectra for the juice solutions starting from the optimized parameters used for the standard solutions in
part B.4. Process the spectra and calculate the average concentration of malic acid in the fruit juice. Determine the relative
standard deviation of your measurements.
2
2
2
Cynthia K. Larive & Albert K. Korir 4.4.2 12/5/2021 https://chem.libretexts.org/@go/page/77795
Wet Lab Report:1. Report the amount of malic acid in your sample along with the relative standard deviation. How does the amount of
malic acid you determined in the juice sample compare with the amount reported in the table in the background sectionof this lab experiment?
2. Using the S/N values calculated for the standard malic acid solution, estimate the limit of quantitation and detection.3. Is the splitting pattern for any of the resonances of the compounds studied different than what you might predict from
the simple rules you learned in organic chemistry? To what do you attribute these differences?
Referencedel Campo, G.; Berregi, I.; Caracena, R.; Santos, J. I. Analytica Chimica Acta. 2006, 556, 462-468.
1 12/5/2021
CHAPTER OVERVIEW5: Q-NMR APPLICATIONSQ-NMR is widely used for both purity and impurity analyses. Q-NMR finds extensive use in the food and beverage industry, where it isused to detect adulteration and to follow the progression of processes such as fermentation. A relatively recent application of Q-NMR isin the area of metabonomics.
5.1: Q-NMR FOR PURITY DETERMINATION OF MACROLIDE ANTIBIOTIC REFERENCE STANDARDS-COMPARISON WITH THE MASS BALANCE METHOD5.2: DETERMINING ENANTIOMERIC OR ISOMERIC PURITY OF ACTIVE PHARMACEUTICAL INGREDIENTS5.3: Q-NMR FOR ANALYSIS AND CHARACTERIZATION IN VACCINE PREPARATIONS5.4: Q-NMR-BASED METABONOMICS OF BLOOD SAMPLES5.5: Q-NMR FOR TIME COURSE EVOLUTION OF MALIC AND LACTIC ACID
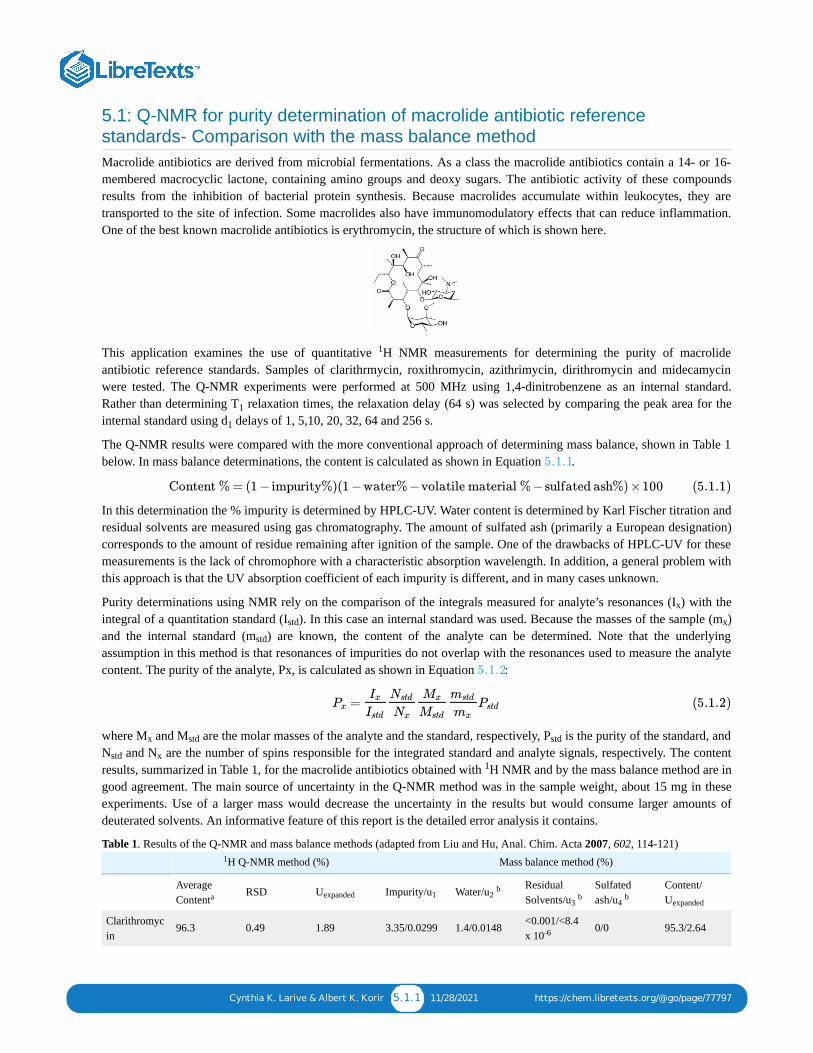
Cynthia K. Larive & Albert K. Korir 5.1.1 11/28/2021 https://chem.libretexts.org/@go/page/77797
5.1: Q-NMR for purity determination of macrolide antibiotic referencestandards- Comparison with the mass balance methodMacrolide antibiotics are derived from microbial fermentations. As a class the macrolide antibiotics contain a 14- or 16-membered macrocyclic lactone, containing amino groups and deoxy sugars. The antibiotic activity of these compoundsresults from the inhibition of bacterial protein synthesis. Because macrolides accumulate within leukocytes, they aretransported to the site of infection. Some macrolides also have immunomodulatory effects that can reduce inflammation.One of the best known macrolide antibiotics is erythromycin, the structure of which is shown here.
This application examines the use of quantitative H NMR measurements for determining the purity of macrolideantibiotic reference standards. Samples of clarithrmycin, roxithromycin, azithrimycin, dirithromycin and midecamycinwere tested. The Q-NMR experiments were performed at 500 MHz using 1,4-dinitrobenzene as an internal standard.Rather than determining T relaxation times, the relaxation delay (64 s) was selected by comparing the peak area for theinternal standard using d delays of 1, 5,10, 20, 32, 64 and 256 s.
The Q-NMR results were compared with the more conventional approach of determining mass balance, shown in Table 1below. In mass balance determinations, the content is calculated as shown in Equation .
In this determination the % impurity is determined by HPLC-UV. Water content is determined by Karl Fischer titration andresidual solvents are measured using gas chromatography. The amount of sulfated ash (primarily a European designation)corresponds to the amount of residue remaining after ignition of the sample. One of the drawbacks of HPLC-UV for thesemeasurements is the lack of chromophore with a characteristic absorption wavelength. In addition, a general problem withthis approach is that the UV absorption coefficient of each impurity is different, and in many cases unknown.
Purity determinations using NMR rely on the comparison of the integrals measured for analyte’s resonances (I ) with theintegral of a quantitation standard (I ). In this case an internal standard was used. Because the masses of the sample (m )and the internal standard (m ) are known, the content of the analyte can be determined. Note that the underlyingassumption in this method is that resonances of impurities do not overlap with the resonances used to measure the analytecontent. The purity of the analyte, Px, is calculated as shown in Equation :
where M and M are the molar masses of the analyte and the standard, respectively, P is the purity of the standard, andN and N are the number of spins responsible for the integrated standard and analyte signals, respectively. The contentresults, summarized in Table 1, for the macrolide antibiotics obtained with H NMR and by the mass balance method are ingood agreement. The main source of uncertainty in the Q-NMR method was in the sample weight, about 15 mg in theseexperiments. Use of a larger mass would decrease the uncertainty in the results but would consume larger amounts ofdeuterated solvents. An informative feature of this report is the detailed error analysis it contains.
Table 1. Results of the Q-NMR and mass balance methods (adapted from Liu and Hu, Anal. Chim. Acta 2007, 602, 114-121)H Q-NMR method (%) Mass balance method (%)
AverageContent
RSD U Impurity/u Water/u ResidualSolvents/u
Sulfatedash/u
Content/U
Clarithromycin
96.3 0.49 1.89 3.35/0.0299 1.4/0.0148 <0.001/<8.4x 10
0/0 95.3/2.64
1
1
1
5.1.1
Content % = (1 −impurity%)(1 −water% −volatile material % −sulfated ash%) ×100 (5.1.1)
x
std x
std
5.1.2
=Px
Ix
Istd
Nstd
Nx
Mx
Mstd
mstd
mx
Pstd (5.1.2)
x std std
std x1
1
a expanded 1 2b
3b
4b
expanded
-6
Cynthia K. Larive & Albert K. Korir 5.1.2 11/28/2021 https://chem.libretexts.org/@go/page/77797
H Q-NMR method (%) Mass balance method (%)
Roxithromycin
95.7 0.44 1.82 2.50/0.0223 2.2/0.0233 <0.001/<8.4x 10
0/0 95.4/2.64
Azithromycin 94.3 0.50 1.36 1.59/0.0142 4.5/0.0486 <0.001/<8.4x 10
0.02/0.0198 94.0/2.75
Dirithromycin
96.9 0 1.81 3.30/0.0295 0.6/0.00636 <0.001/<8.4x 10
0/0 96.1/2.67
Midecamycin 97.1 2.0 1.96 3.94/0.0352 0.16/0.000035
0/0 95.9/1.71
a. Calculated using 4 NMR signalsb. u is the uncertainty in the impurity, u is the uncertainty in water, u is the uncertainty in residual solvents and u is the uncertainty in the
sulfated ashc. The content of water and residual solvents were not determined for midecamycin. Total volatile materials of midecamycin were
determined by the method of loss on drying
Reference
Liu, S.-Y.; Hu, C.-Q. “A comparative uncertainty study of the calibration of macrolide antibiotic reference standards usingquantitative nuclear magnetic resonance and mass balance methods” Anal. Chim. Acta 2007, 602, 114-121.
1
-6
-6
-6
c
1 2 3 4
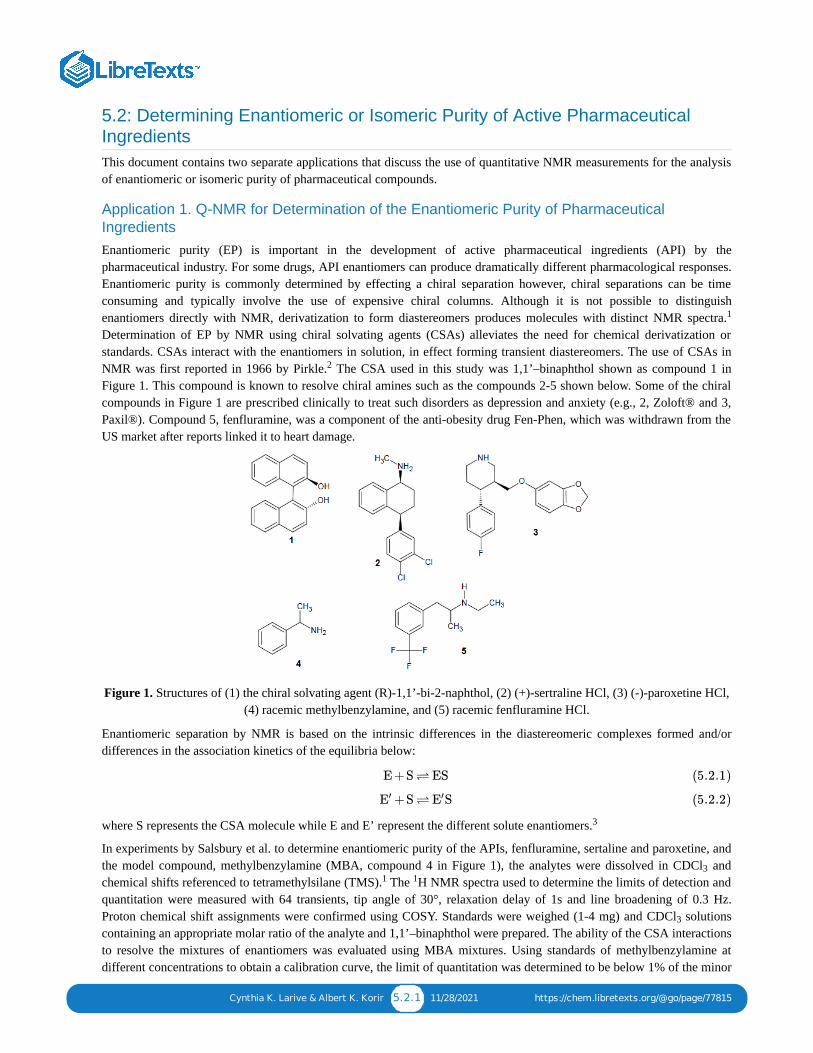
Cynthia K. Larive & Albert K. Korir 5.2.1 11/28/2021 https://chem.libretexts.org/@go/page/77815
5.2: Determining Enantiomeric or Isomeric Purity of Active PharmaceuticalIngredientsThis document contains two separate applications that discuss the use of quantitative NMR measurements for the analysisof enantiomeric or isomeric purity of pharmaceutical compounds.
Application 1. Q-NMR for Determination of the Enantiomeric Purity of PharmaceuticalIngredientsEnantiomeric purity (EP) is important in the development of active pharmaceutical ingredients (API) by thepharmaceutical industry. For some drugs, API enantiomers can produce dramatically different pharmacological responses.Enantiomeric purity is commonly determined by effecting a chiral separation however, chiral separations can be timeconsuming and typically involve the use of expensive chiral columns. Although it is not possible to distinguishenantiomers directly with NMR, derivatization to form diastereomers produces molecules with distinct NMR spectra.Determination of EP by NMR using chiral solvating agents (CSAs) alleviates the need for chemical derivatization orstandards. CSAs interact with the enantiomers in solution, in effect forming transient diastereomers. The use of CSAs inNMR was first reported in 1966 by Pirkle. The CSA used in this study was 1,1’–binaphthol shown as compound 1 inFigure 1. This compound is known to resolve chiral amines such as the compounds 2-5 shown below. Some of the chiralcompounds in Figure 1 are prescribed clinically to treat such disorders as depression and anxiety (e.g., 2, Zoloft® and 3,Paxil®). Compound 5, fenfluramine, was a component of the anti-obesity drug Fen-Phen, which was withdrawn from theUS market after reports linked it to heart damage.
Figure 1. Structures of (1) the chiral solvating agent (R)-1,1’-bi-2-naphthol, (2) (+)-sertraline HCl, (3) (-)-paroxetine HCl,(4) racemic methylbenzylamine, and (5) racemic fenfluramine HCl.
Enantiomeric separation by NMR is based on the intrinsic differences in the diastereomeric complexes formed and/ordifferences in the association kinetics of the equilibria below:
where S represents the CSA molecule while E and E’ represent the different solute enantiomers.
In experiments by Salsbury et al. to determine enantiomeric purity of the APIs, fenfluramine, sertaline and paroxetine, andthe model compound, methylbenzylamine (MBA, compound 4 in Figure 1), the analytes were dissolved in CDCl andchemical shifts referenced to tetramethylsilane (TMS). The H NMR spectra used to determine the limits of detection andquantitation were measured with 64 transients, tip angle of 30°, relaxation delay of 1s and line broadening of 0.3 Hz.Proton chemical shift assignments were confirmed using COSY. Standards were weighed (1-4 mg) and CDCl solutionscontaining an appropriate molar ratio of the analyte and 1,1’–binaphthol were prepared. The ability of the CSA interactionsto resolve the mixtures of enantiomers was evaluated using MBA mixtures. Using standards of methylbenzylamine atdifferent concentrations to obtain a calibration curve, the limit of quantitation was determined to be below 1% of the minor
1
2
E +S ⇌ ES (5.2.1)
+S ⇌ SE′ E′ (5.2.2)
3
31 1
3
Cynthia K. Larive & Albert K. Korir 5.2.2 11/28/2021 https://chem.libretexts.org/@go/page/77815
component. Analysis of racemic fenfluramine revealed that it contained 50.2 ± 0.4% the S-enantiomer. Although chiralHPLC could not be performed for fenfluramine or sertraline without derivatization, the analysis of paroxetine enantiomerswas carried out by both NMR and HPLC yielding results of 7.5 ± 0.3% and 8.5%, respectively.
References1. Salsbury, J. S. and Isbester, P. K. Magn. Reson. Chem. 2005, 43, 910-9172. Pirkle, W. H. J. Am. Chem. Soc. 1966, 88, 18373. Pirkle, W. H. and Hoover, D. J. Top. Sterochem. 1982, 13, 263
Application 2. Q-NMR for the Quantitation of the E/Z Isomer content of Fluvoxamine
Fluvoxamine is an antidepressant with two possible isomeric structures as shown in Figure 1 below. The activity offluvoxamine resides in the E-isomer (Figure 1A). However, the Z-isomer (Figure 1B) occurs in all the synthesis pathways.Transport proteins can discriminate between the E- and Z-isomers. The British Pharmacopeia limits the content of Z-isomer to 0.5%. The QNMR method described measures the Z-isomer to the 0.2% level in 15 mg of the drug substance.
Figure 1. Structures of (A) (E)-fluvoxamine and (B) (Z)-fluvoxamine. The pharmaceutical formulation is available as themaleate salt of fluvoxamine. The numbering of the atoms correlates with the NMR spectrum reported in the reference.
An advantage of Q-NMR for determining the Z-isomer content is the minimum sample preparation required. In thisexample, 15 mg of material was dissolved in deuterated methanol which was also used as the H (3.31 ppm) chemical shiftreference. H NMR spectra were acquired by coaddition of 128 transients over a spectral width of 4595 Hz. FIDs wereapodized by multiplication with an exponential function equivalent to 0.3 Hz line broadening. For quantitation, the C-2proton resonances of the Z- (2.62 ppm) and E- (2.90 ppm) fluvoxamine isomers were manually integrated and the valuescompared.
Before performing quantitative measurements, it was necessary to determine the limits of quantification and detection foreach isomer. Although the pure E-isomer was commercially available, the pure Z-isomer was not. Instead the authors hadaccess only to a 1:1 (E/Z) mixture. Therefore a stock solution containing 5.13% (Z) fluvoxamine was prepared by mixingappropriate amounts of the pure E and E/Z mixture. Serial dilutions were made from this stock solution for NMR analysis.With each dilution, the concentrations of the E- and Z-isomers decreased, but the %Z content remained at 5.13%. For thespectrum measured at each concentration, manual integration of the C-2(Z) and C-2(E) proton resonances was performedthree times. The difference between calculated and determined values of the Z-isomer content was less than 5% atconcentrations down to 0.07 mg/L. Greater deviation from calculated values was observed at lower Z-isomerconcentrations. Based on these experiments, the limits of quantitation and detection were determined to be 0.07 mg/L and0.018 mg/L, respectively. To determine linearity, a set of mixtures containing 0-10% Z-isomer were measured in triplicate.The correlation coefficient of the calibration plot was found to be 0.9999 with a coefficient slope of 0.9923. Since theBritish Pharmacopeia tests requires the content of Z to be less than 0.5%, solutions were prepared containing 0.15-1.01%of the Z-isomer. NMR spectra were measured in triplicate and each spectrum integrated three times. Linear regressionanalysis yielded a correlation coefficient of 0.994 with a slope of 1.042, indicating that the Q-NMR assay is linear over thisconcentration. The Q-NMR method was found to be an accurate, sensitive, and timesaving method for the determination ofZ- fluvoxamine content.
Reference1. Deubner, R. and Holzgrabe, U. Magn. Reson. Chem. 2002, 40, 762-766
1
1 1
Cynthia K. Larive & Albert K. Korir 5.3.1 12/5/2021 https://chem.libretexts.org/@go/page/77818
5.3: Q-NMR for Analysis and Characterization in Vaccine PreparationsPedvaxHIB is a vaccine that is made by chemically conjugating the capsular polysaccharide of Haemophilius influenzaetype b (Hib) to an outer membrane protein from Neisseria meningitidis to form a protein-conjugated vaccine that is veryeffective in preventing invasive Hib infection in infants and young children. This example shows the utility of NMR forboth the characterization of the derivatized polysaccharide and its quantitative analysis. The advantages of NMR includeits nondestructive nature and its ability to detect molecules that do not contain a UV-visible chromophore.
To obtain an accurate determination of the solution temperature, a linear calibration of the HDO chemical shift was carriedout. Shimming of the magnet was performed using the DMSO peak and the proton 90° pulse was calibrated for eachsolution to compensate for differences in solution ionic strength. The DMSO was also used as the internal reference. Thespectral width was 10.5 ppm with a digital resolution of 0.3 Hz. Spectra were measured with 16 transients with a totalrecycle time of 60 s. The total data acquisition time was 20 min.
Figure 1. H NMR spectrum of the derivatized capsular polysaccharide. Inset is the sidechain structure of the PRPdervativzed with butanediamine bromoacetyl chloride (PRPBuA2). Reprinted from Anal. Biochem. 337, Q. Xu, J. Klees,
J. Teyral, R. Capen, M. Huang, A. W. Sturgess, J. P. Hennessey, Jr., M. Washabaugh, R. Sitrin, C. Abegunawardana,Quantitative nuclear magnetic resonance analysis and characterization of the derivatized Haemophilus influenzae type b
polysaccharide intermediate for PedvaxHIB, 234-245, Copyright (2005), with permission from Elsevier.
Figure 1 shows the H NMR spectrum of an intermediate in the synthesis of the capsular polyribosylribitol phosphate(PRP) – outer membrane protein complex. PRP is first activated with 1,1’=carbonyldiimidazole and then reacted with anexcess of butanediamine. The resonances of the derivatized PRP are well resolved in this spectrum. Quantitation wasperformed using an internal reference because it alleviates the need for a standard calibration curve. In determining thepercentage of the various forms, neither the molecular weight of the polysaccharide nor the degree of polymerization wasneeded for calculation. The Q-NMR assay developed in this paper can find application in product release or processmonitoring in the pharmaceutical industry and can potentially replace tedious chromatographic and colorimetric methods.
Reference
Xu, Q.; Klees, J.; Teyral, J.; Capen, R.; Huang, M.; Sturgess, A. W.; Hennessy, J.P.; Washabaugh, M.; Sitrin, R.;Abeygunawardana, C. Anal. Biochem. 2005, 337, 235-245
1
1
Cynthia K. Larive & Albert K. Korir 5.4.1 10/17/2021 https://chem.libretexts.org/@go/page/77821
5.4: Q-NMR-Based Metabonomics of Blood SamplesCyclosporine A (CsA) is a potent calcineurin inhibitor used in transplantation medicine. It is potentially nephrotoxic. Theuse of CsA in combination with other immunosuppresants, such as sirolimus (SRL) or everolimus (RAD), has beenreported to produce a beneficial synergistic effect. In this study, blood samples were collected from rats treated with CsA(10 mg/kg), CsA(10 mg/kg) + SRL(3 mg/kg), and CsA(10 mg/kg) + RAD (3mg/kg). Whole blood samples were collectedand processed by dual chloroform/methanol extraction to yield water- and lipidsoluble extracts. The extracts were analyzedby Q-NMR to predict the metabolic toxicity, and to identify and quantify metabolic biomarkers. A 600 MHz NMRspectrometer was used and the proton NMR spectra obtained by coaddition of 40 transients, using a relaxation delay of 12s and a tip angle of 90°. The water resonance was suppressed by selective saturation. A solution of trimethylsilylpropionicacid-d (TMSP-d , 0.00 ppm) was placed in a capillary and inserted into the NMR tube for use as an external standard. Allspectra were normalized to the intensity of the TMSP-d singlet resonance.
To obtain accurate and meaningful information, NMR spectral data must be carefully processed prior to attemptingstatistical analysis of the results. In this experiment, Fourier transformation, phase correction and baseline correction wereperformed. For multivariate statistical analysis, all spectra were normalized to the TSP-d intensity and the full spectrumwas bucketed into 0.04 ppm intervals, except the regions containing the solvent resonances of water and methanol whichwere excluded from the statistical analysis. Principal component analysis (PCA) was performed using the AMIX 3.1software to classify the NMR spectra obtained from animals subjected to different experimental treatments. For metabolitequantification, each H peak of identified metabolites was integrated. Absolute concentrations of the identified metaboliteswere calculated using the equation shown below:
where C = metabolite concentration; I = integral of the metabolite H NMR resonance; N = number of protons givingrise to the metabolite H peak (from CH, CH , CH , etc); C = TMSP concentration; I = integral of TMSP Hresonance at 0 ppm; N = 9 because this resonance is produced by the 9 equivalent protons of the 3 methyl groups; V =volume of the extract; and M = volume of the blood sample.
In the results obtained by PCA from the PC1 vs PC2 scores plot, spectral results for all 5 placebo-treated control animalsclustered together and were overlapped with the samples for the CsA+RAD treated animals. The results for the CsAtreated animals were well-separated from the control animals. The spectral results that were most different from thecontrols were those of the CSA+SRL treated animals, which clustered as their own group distinct from the CsA-onlytreated animals. The PCA loadings plot indicated that the intensities of the following metabolites differed among theCsA+SRL, CsA, and placebo groups: hydroxybutyrate, lactate, total glutathione, creatine + creatinine, trimethylamine-N-oxide (TMAO), and glucose. The only metabolite that increased in all 3 treatment groups was cholesterol. QNMRmeasurements of individual metabolite levels showed that CsA administration significantly increased the bloodconcentrations of glucose, hydroxybutyrate and creatine + creatinine. However the levels of glutathione dropped in bothCsA and CsA+SRL treated animals. The blood levels of these metabolites were not significantly different for theCsA+NAD treated animals and the placebotreated controls.
The increase in blood glucose and hydroxybutyrate confirmed the ability of CS to induce hyperglycemia andhyperketonemia. The decreased levels of glutathione were thought to be related to CS-induced oxidative stress. Theincreased concentrations of metabolites such as creatine and creatinine could reflect decreased renal clearance of thesesubstances. While coadministration with SRL enhanced the metabolic changes indicative of toxicity, combinationtreatment with RAD partially alleviated these effects. This example illustrates the utility of metabolic profiling by Q-NMRand the need to monitor the toxicodynamic effects of immunosuppressant combinations.
Reference Serkova, N. J. and Christians, U. Ther. Drug. Monit. 2005, 27, 733-737
4 4
4
4
1
= ×Cx
×Ix
Nx
CT MSP
IT MSP
NT MSP
V
M(5.4.1)
x x1
x1
2 3 TMSP TMSP1
TMSP
☰
Cynthia K. Larive & Albert K. Korir 5.5.1 10/24/2021 https://chem.libretexts.org/@go/page/77823
5.5: Q-NMR for Time Course Evolution of Malic and Lactic Acid
Figure 1. Structures of malic acid and lactic acid. Conversion of malic acid to lactic acid can take place during malolacticor alcoholic fermentation.
Wines consist of various components present at different concentrations. The major components are ethanol, water,glycerol, sugars and organic acids such as malic and lactic acid shown in the figure above. Low levels of malic acid (0.4-0.5 g/L) are a prerequisite for the commercial production of some red wines. In addition, the regulation of this acid isessential in the elaboration of other types of wines such as white and rosé. The levels of malic acid can be controlled byallowing the spontaneous growth of lactic acid bacteria which carry out the malolactic fermentation as shown in Figure 1above. Q-NMR is useful in evaluating wine quality with respect to age, origin, and effects of adulteration. Control of thefermentation process is essential in determining the desired wine quality. This example illustrates the use of Q-NMR tomonitor the fermentation process by measuring levels of malic and lactic acid over the concentration range of 1-3.2 mM.The effectiveness of Q-NMR analysis is compared with the results of enzymatic measurements.
In this experiment, wine samples were collected from various tanks containing grapes of different varietals. Samples werecollected directly and preserved at -25 °C. Prior to recording NMR spectra, sample pH was adjusted to 3.0. Succinic acidwas used as an external standard. Matrix effects were evaluated by spiking the wine with malic and lactic acid. NMRspectra were obtained by coaddition of 128 transients using a 90° pulse, a spectral width of 10 ppm and a relaxation delayof 60 s. The water resonance was suppressed by irradiation with a selective presaturation pulse.
In order to evaluate the effectiveness of Q-NMR for this analysis, the results were compared with those obtained from anenzymatic assay which consumes malate and produces NADH (Boehringer test). In this test the UV absorption of NADHat 340 nm is used for quantitation. The results of the enzymatic assay were in good agreement with the correspondingmeasurements by Q-NMR. The major advantages of Q-NMR in this example include minimal sample preparation andrapid analysis.
Reference Avenoza, A.; Busto, J. H.; Canal, N.; Peregrina, J. M. J. Agric. Food Chem. 2006, 54, 4715-4720
☰
1 12/5/2021
CHAPTER OVERVIEW6: INSTRUCTOR'S GUIDEThis guide is intended to assist instructors in the utilization of the q-NMR learning module.
6.1: BASIC THEORY CONCEPT QUESTIONS6.2: ANSWERS TO QUESTIONS IN THE BASIC THEORY SECTION6.3: PRACTICAL ASPECTS CONCEPT QUESTIONS6.4: ANSWERS TO QUESTIONS IN THE PRACTICAL ASPECTS SECTION6.5: Q-NMR DRYLAB
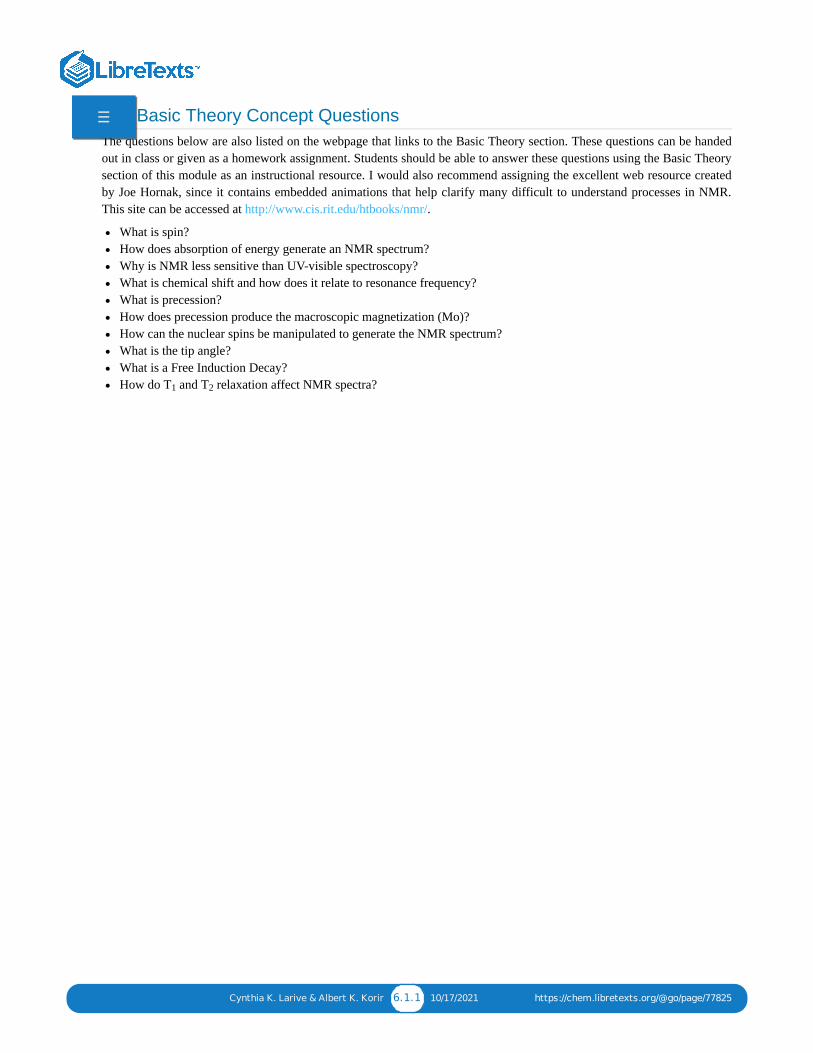
Cynthia K. Larive & Albert K. Korir 6.1.1 10/17/2021 https://chem.libretexts.org/@go/page/77825
6.1: Basic Theory Concept QuestionsThe questions below are also listed on the webpage that links to the Basic Theory section. These questions can be handedout in class or given as a homework assignment. Students should be able to answer these questions using the Basic Theorysection of this module as an instructional resource. I would also recommend assigning the excellent web resource createdby Joe Hornak, since it contains embedded animations that help clarify many difficult to understand processes in NMR.This site can be accessed at http://www.cis.rit.edu/htbooks/nmr/.
What is spin?How does absorption of energy generate an NMR spectrum?Why is NMR less sensitive than UV-visible spectroscopy?What is chemical shift and how does it relate to resonance frequency?What is precession?How does precession produce the macroscopic magnetization (Mo)?How can the nuclear spins be manipulated to generate the NMR spectrum?What is the tip angle?What is a Free Induction Decay?How do T and T relaxation affect NMR spectra?1 2
☰
Cynthia K. Larive & Albert K. Korir 6.2.1 11/28/2021 https://chem.libretexts.org/@go/page/77827
6.2: Answers to Questions in the Basic Theory sectionIn addition to the conceptual questions, the Basic Theory section also contains a series of simple quantitative questions, theanswers of which are provided below.
Question 1How many spin states would you predict for H?
Solution
Deuterium has a spin of 1. Therefore there should be 3 possible spin states: +1, 0 and -1.
Question 2Given the same magnetic field and temperature, how would the difference in population for H and P compare?
Solution
For this problem we will use the following equation:
The difference in population for H and P will be related to the differences in their ∆E values. Since ∆E=γhB /2π, for afixed magnetic field the only differences between H and P is in their magnetogyric ratios.
The ratio of the N /N for H is e or =11.80 times larger than the ratio of N /N for P.
Question 3Calculate the wavelength of electromagnetic radiation corresponding to a frequency of 500 MHz.
Solution
The wavelength of electromagnetic radiation corresponding to a frequency of 500 MHz is 0.6 m.
Question 4What range of frequencies would be excited by a 10 µs rf pulse?
Solution
A 10 µs rf pulse would excite a range of frequencies covering 100,000 Hz.
Question 5What are the resonance line widths of nuclei that have apparent T relaxation times (i.e.T * values) of 1 and 2 sec.
Solution
Therefore, the two resonances have line widths of 0.32 and 0.16 Hz.
2
1 31
=Nupper
Nlower
e−ΔE
kT (6.2.1)
1 31o
1 31
= = 2.468ΔE H)(1
ΔE P )(31
26.752
10.84(6.2.2)
upper lower1 2.468
upper lower31
2 2
=w 1
2
1
πT ∗2
(6.2.3)
Cynthia K. Larive & Albert K. Korir 6.3.1 11/21/2021 https://chem.libretexts.org/@go/page/77830
6.3: Practical Aspects Concept QuestionsThe questions below are also listed on the webpage that links to the Practical Aspects section. These questions can behanded out in class or given as a homework assignment. Students should be able to answer these questions using thePractical Aspects section of this module as an instructional resource.
How do I choose a reference standard for my Q-NMR analysis?How is the internal standard used to quantify the concentration of my analyte?What sample considerations are important in Q-NMR analysis?How do I choose the right acquisition parameters for a quantitative NMR measurement?What data processing considerations are important for obtaining accurate and precise results?
Cynthia K. Larive & Albert K. Korir 6.4.1 12/5/2021 https://chem.libretexts.org/@go/page/77832
6.4: Answers to Questions in the Practical Aspects section
Question 1
A quantitative NMR experiment is performed to quantify the amount of isopropyl alcohol in a solution. Sodiummaleate (0.01021 M) is used as an internal standard. The integral obtained for the maleate resonance is 46.978. Theisopropanol doublet at 1.45 ppm produces an integral of 104.43. What would you predict for the integral of the isopropanolCH resonance as 3.99 ppm. What is the concentration of isopropanol in this solution?
Solution
The isopropanol CH resonance is produced by a single proton whereas the doublet is produced by the 6 methyl protons.Therefore, the CH integral should be 1/6 that of the methyl doublet, or 17.405.
To find the isopropanol concentration we first have to calculate normalized areas for isopropanol and our standard,maleate. The isopropanol(IP) doublet is comprised of 6 protons due to the two equivalent methyl groups of this compound.
Similarly, the normalized area for maleate (MA) is:
The concentration of the isopropanol can be calculated using the known the maleate concentration.
Because the accuracy of the determination depends on how well the maleate concentration is known, the standard solutionshould be prepared with care, using dried sodium maleate of high purity, weighing carefully a mass that is known to anappropriate number of significant figures (in this case 4), transferring the maleate quantitatively to a volumetric flask andfinally dilution to the mark. Again, an appropriate solution volume must be selected to produce the desired number ofsignificant figures given the manufacturer specifications for the glassware used.
Question 2
A solution prepared for quantitative analysis using NMR was acquired by coaddition of 8 FIDs produces a spectrum withan S/N of 62.5 for the analyte signals. How many FIDs would have to be coadded to produce a spectrum with an S/N of250?
Solution
S/N increases in NMR experiments as the square root of the number of scans coadded.
To increase the S/N from 62.5 to 250 (a factor of 4 increase in S/N) would require coaddition of 16 times as many FIDs aswas used to produce a spectrum with S/N of 62.5. The answer is that coaddition of 128 FIDs (8 x 16) would be required toachieve an S/N of 250.
Question 3A H NMR spectrum was measured using a 400.0 MHz instrument by acquisition of 8192 total data points (8192 realpoints) and a spectral width of 12.00 ppm. What was the acquisition time? Calculate the digital resolution of the resultingspectrum? Is this digital resolution sufficient to accurately define a peak with a width at half height of 0.5 Hz?
Solution
OD2
th
Normalized Area (IP) = = 17.405104.43
6(6.4.1)
Normalized Area (MA) = = 23.48946.978
2(6.4.2)
[IP] =[MA] ×Normalized Area (IP)
Normalized Area (MA)(6.4.3)
[IP] = = 0.007565 M0.01021 M ×17.405
23.489(6.4.4)
S/N ∝ (n)0.5 (6.4.5)
1
Cynthia K. Larive & Albert K. Korir 6.4.2 12/5/2021 https://chem.libretexts.org/@go/page/77832
We can calculate the acquisition time knowing the spectral width and the total number of data points.
This would not be adequate digital resolution to accurately define a peak with a 0.5 Hz width at half height. A longeracquisition time would allow for collection of more points. Also, zero-filling could also be used to help increase the digitalresolution.
AT = = = 1.707 secNP
2 SW
16384
2 ×400 ×12(6.4.6)
DR = = = 1.172 Hz/ptSW
NP(real)
2 ×400 ×12
8192(6.4.7)
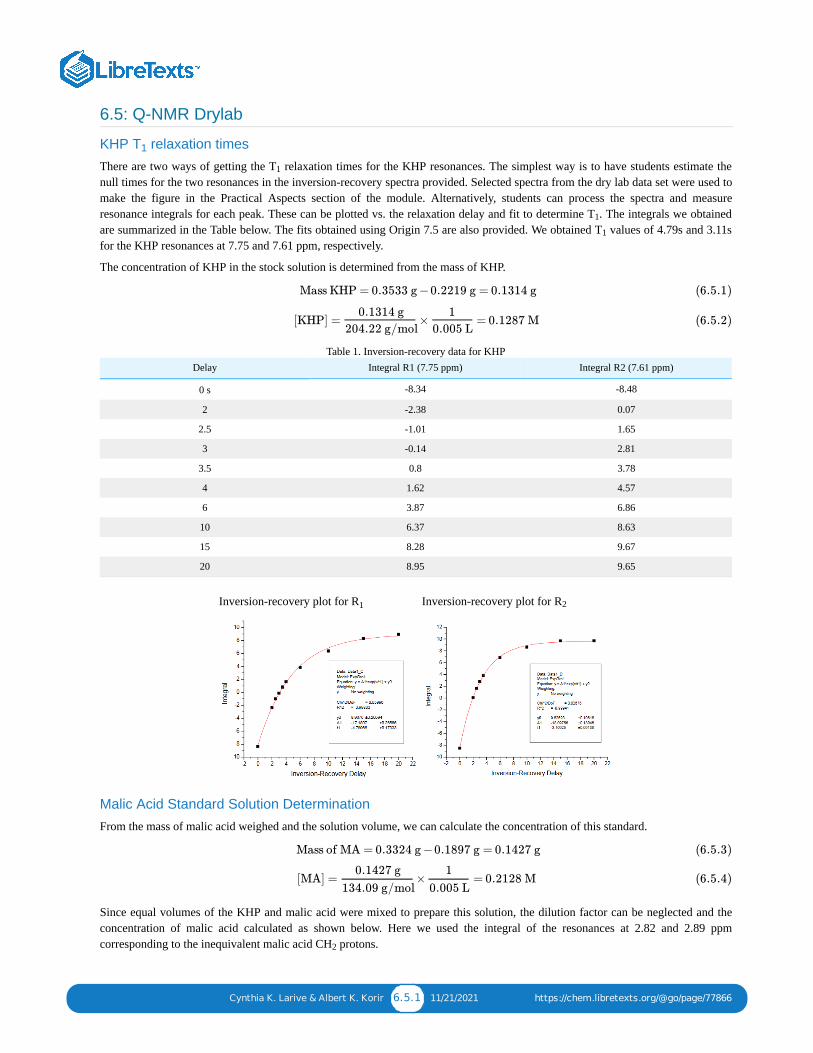
Cynthia K. Larive & Albert K. Korir 6.5.1 11/21/2021 https://chem.libretexts.org/@go/page/77866
6.5: Q-NMR Drylab
KHP T relaxation times
There are two ways of getting the T relaxation times for the KHP resonances. The simplest way is to have students estimate thenull times for the two resonances in the inversion-recovery spectra provided. Selected spectra from the dry lab data set were used tomake the figure in the Practical Aspects section of the module. Alternatively, students can process the spectra and measureresonance integrals for each peak. These can be plotted vs. the relaxation delay and fit to determine T . The integrals we obtainedare summarized in the Table below. The fits obtained using Origin 7.5 are also provided. We obtained T values of 4.79s and 3.11sfor the KHP resonances at 7.75 and 7.61 ppm, respectively.
The concentration of KHP in the stock solution is determined from the mass of KHP.
Table 1. Inversion-recovery data for KHPDelay Integral R1 (7.75 ppm) Integral R2 (7.61 ppm)
0 s -8.34 -8.48
2 -2.38 0.07
2.5 -1.01 1.65
3 -0.14 2.81
3.5 0.8 3.78
4 1.62 4.57
6 3.87 6.86
10 6.37 8.63
15 8.28 9.67
20 8.95 9.65
Inversion-recovery plot for R
Inversion-recovery plot for R
Malic Acid Standard Solution Determination
From the mass of malic acid weighed and the solution volume, we can calculate the concentration of this standard.
Since equal volumes of the KHP and malic acid were mixed to prepare this solution, the dilution factor can be neglected and theconcentration of malic acid calculated as shown below. Here we used the integral of the resonances at 2.82 and 2.89 ppmcorresponding to the inequivalent malic acid CH protons.
1
1
1
1
Mass KHP = 0.3533 g −0.2219 g = 0.1314 g (6.5.1)
[KHP] = × = 0.1287 M0.1314 g
204.22 g/mol
1
0.005 L(6.5.2)
1 2
Mass of MA = 0.3324 g −0.1897 g = 0.1427 g (6.5.3)
[MA] = × = 0.2128 M0.1427 g
134.09 g/mol
1
0.005 L(6.5.4)
2
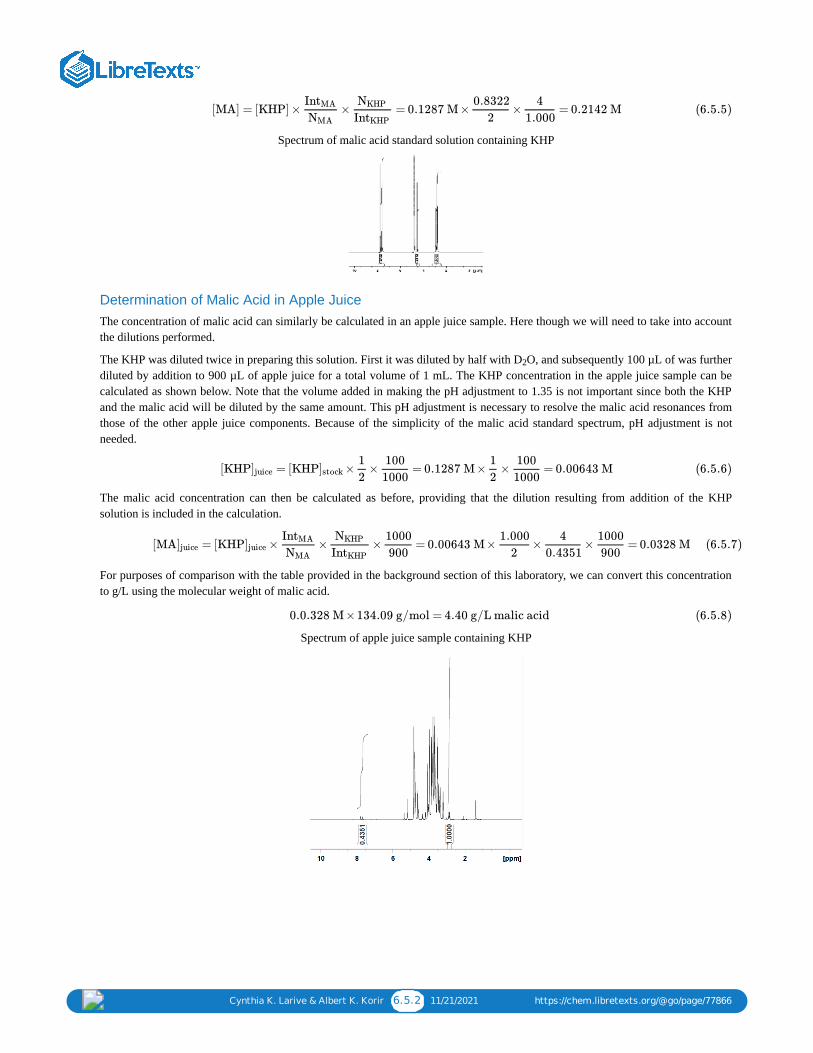
Cynthia K. Larive & Albert K. Korir 6.5.2 11/21/2021 https://chem.libretexts.org/@go/page/77866
Spectrum of malic acid standard solution containing KHP
Determination of Malic Acid in Apple JuiceThe concentration of malic acid can similarly be calculated in an apple juice sample. Here though we will need to take into accountthe dilutions performed.
The KHP was diluted twice in preparing this solution. First it was diluted by half with D O, and subsequently 100 µL of was furtherdiluted by addition to 900 µL of apple juice for a total volume of 1 mL. The KHP concentration in the apple juice sample can becalculated as shown below. Note that the volume added in making the pH adjustment to 1.35 is not important since both the KHPand the malic acid will be diluted by the same amount. This pH adjustment is necessary to resolve the malic acid resonances fromthose of the other apple juice components. Because of the simplicity of the malic acid standard spectrum, pH adjustment is notneeded.
The malic acid concentration can then be calculated as before, providing that the dilution resulting from addition of the KHPsolution is included in the calculation.
For purposes of comparison with the table provided in the background section of this laboratory, we can convert this concentrationto g/L using the molecular weight of malic acid.
Spectrum of apple juice sample containing KHP
[MA] = [KHP] × × = 0.1287 M × × = 0.2142 MIntMA
NMA
NKHP
IntKHP
0.8322
2
4
1.000(6.5.5)
2
[KHP = [KHP × × = 0.1287 M × × = 0.00643 M]juice ]stock1
2
100
1000
1
2
100
1000(6.5.6)
[MA = [KHP × × × = 0.00643 M × × × = 0.0328 M]juice ]juiceIntMA
NMA
NKHP
IntKHP
1000
900
1.000
2
4
0.4351
1000
900(6.5.7)
0.0.328 M ×134.09 g/mol = 4.40 g/L malic acid (6.5.8)

Index
Cchemical shift
1.4: What is chemical shift and how does it relateto resonance frequency?
FFree Induction Decay
1.9: What is the Free Induction Decay?
Pprecession
1.5: What is Precession?
Rresonance frequency
1.4: What is chemical shift and how does it relateto resonance frequency?
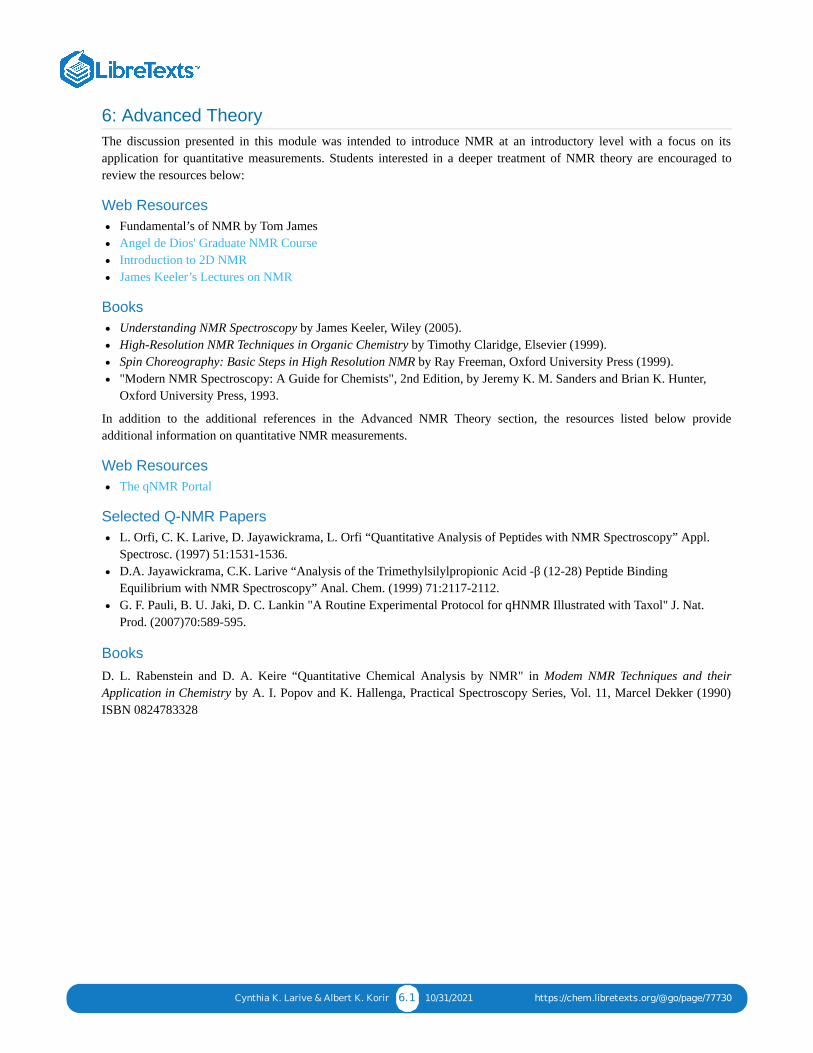
Cynthia K. Larive & Albert K. Korir 6.1 10/31/2021 https://chem.libretexts.org/@go/page/77730
6: Advanced TheoryThe discussion presented in this module was intended to introduce NMR at an introductory level with a focus on itsapplication for quantitative measurements. Students interested in a deeper treatment of NMR theory are encouraged toreview the resources below:
Web Resources Fundamental’s of NMR by Tom JamesAngel de Dios' Graduate NMR CourseIntroduction to 2D NMRJames Keeler’s Lectures on NMR
Books Understanding NMR Spectroscopy by James Keeler, Wiley (2005).High-Resolution NMR Techniques in Organic Chemistry by Timothy Claridge, Elsevier (1999).Spin Choreography: Basic Steps in High Resolution NMR by Ray Freeman, Oxford University Press (1999)."Modern NMR Spectroscopy: A Guide for Chemists", 2nd Edition, by Jeremy K. M. Sanders and Brian K. Hunter,Oxford University Press, 1993.
In addition to the additional references in the Advanced NMR Theory section, the resources listed below provideadditional information on quantitative NMR measurements.
Web Resources The qNMR Portal
Selected Q-NMR Papers L. Orfi, C. K. Larive, D. Jayawickrama, L. Orfi “Quantitative Analysis of Peptides with NMR Spectroscopy” Appl.Spectrosc. (1997) 51:1531-1536.D.A. Jayawickrama, C.K. Larive “Analysis of the Trimethylsilylpropionic Acid -β (12-28) Peptide BindingEquilibrium with NMR Spectroscopy” Anal. Chem. (1999) 71:2117-2112.G. F. Pauli, B. U. Jaki, D. C. Lankin "A Routine Experimental Protocol for qHNMR Illustrated with Taxol" J. Nat.Prod. (2007)70:589-595.
Books D. L. Rabenstein and D. A. Keire “Quantitative Chemical Analysis by NMR" in Modem NMR Techniques and theirApplication in Chemistry by A. I. Popov and K. Hallenga, Practical Spectroscopy Series, Vol. 11, Marcel Dekker (1990)ISBN 0824783328

Glossary
Sample Word 1 | Sample Definition 1