Embed Size (px)
Citation preview

qPSMA: Semiautomatic Software for Whole-Body TumorBurden Assessment in Prostate Cancer Using 68Ga-PSMA11PET/CT
Andrei Gafita1, Marie Bieth1,2, Markus Kronke1, Giles Tetteh2, Fernando Navarro2, Hui Wang1, Elisabeth Gunther1,Bjoern Menze2, Wolfgang A. Weber1, and Matthias Eiber1
1Department of Nuclear Medicine, Klinikum rechts der Isar, Technical University Munich, Munich, Germany; and 2Department ofInformatics, Technical University Munich, Munich, Germany
Our aim was to introduce and validate qPSMA, a semiautomatic
software package for whole-body tumor burden assessment inprostate cancer patients using 68Ga-prostate-specific membrane
antigen (PSMA) 11 PET/CT. Methods: qPSMA reads hybrid PET/
CT images in DICOM format. Its pipeline was written using Python
and C11 languages. A bone mask based on CT and a normal-uptake mask including organs with physiologic 68Ga-PSMA11
uptake are automatically computed. An SUV threshold of 3 and a
liver-based threshold are used to segment bone and soft-tissuelesions, respectively. Manual corrections can be applied using dif-
ferent tools. Multiple output parameters are computed, that is,
PSMA ligand–positive tumor volume (PSMA-TV), PSMA ligand–pos-
itive total lesion (PSMA-TL), PSMA SUVmean, and PSMA SUVmax.Twenty 68Ga-PSMA11 PET/CT data sets were used to validate
and evaluate the performance characteristics of qPSMA. Four analy-
ses were performed: validation of the semiautomatic algorithm for liver
background activity determination, assessment of intra- and interob-server variability, validation of data from qPSMA by comparison with
Syngo.via, and assessment of computational time and comparison
of PSMA PET–derived parameters with serum prostate-specific an-tigen. Results: Automatic liver background calculation resulted in a
mean relative difference of 0.74% (intraclass correlation coefficient
[ICC], 0.996; 95%CI, 0.989;0.998) compared with METAVOL. Intra-
and interobserver variability analyses showed high agreement (allICCs . 0.990). Quantitative output parameters were compared for
68 lesions. Paired t testing showed no significant differences be-
tween the values obtained with the 2 software packages. The ICC
estimates obtained for PSMA-TV, PSMA-TL, SUVmean, and SUVmax
were 1.000 (95%CI, 1.000;1.000), 1.000 (95%CI, 1.000;1.000),
0.995 (95%CI, 0.992;0.997), and 0.999 (95%CI, 0.999;1.000), re-
spectively. The first and second reads for intraobserver variability
resulted in mean computational times of 13.63 min (range, 8.22–25.45 min) and 9.27 min (range, 8.10–12.15 min), respectively (P 50.001). Highly significant correlations were found between serum
prostate-specific antigen value and both PSMA-TV (r 5 0.72, P ,0.001) and PSMA-TL (r 5 0.66, P 5 0.002). Conclusion: Semiau-
tomatic analyses of whole-body tumor burden in 68Ga-PSMA11
PET/CT is feasible. qPSMA is a robust software package that can
help physicians quantify tumor load in heavily metastasized prostatecancer patients.
Key Words: PSMA; tumor segmentation; qPSMA; PET/CT
J Nucl Med 2019; 60:1277–1283DOI: 10.2967/jnumed.118.224055
Prostate cancer is a significant health problem, being the lead-ing malignancy diagnosed in men and the second-to-third leading
cause of cancer death in men (1,2). In the locoregional stage, the
relative 5-y survival rate is 99%, whereas in patients with meta-
static prostate cancer the survival rate dramatically decreases to
29% (3). Therefore, metastatic disease has become an important
entity in the diagnosis and treatment of prostate cancer. PET im-
aging plays an important role in evaluating disease extent and
treatment response. The Prostate Cancer Working group 3 (4)
recommends determining radiographic response to treatment us-
ing RECIST 1.1 (5) for extraskeletal disease evaluation and qual-
itative interpretation of bone scans as the standard for bone lesion
assessment. The development of a quantitative image-derived bio-
marker exploiting recent advances in PET imaging to assess tumor
burden based on tumor activity is an unmet clinical need in pros-
tate cancer. Such a biomarker is expected to be crucial for accurate
evaluation of therapy response.Prostate-specific membrane antigen (PSMA), also known as
glutamate carboxypeptidase II, is a nonsecreted transmembrane
glycoprotein (6,7) that is weakly expressed in healthy prostate
tissue but strongly upregulated in prostate cancer cells (7). In
the last few years, molecular imaging targeting PSMA has become
of great interest in prostate cancer diagnostics (8). 68Ga-PSMA11
PET/CT is a novel imaging technique that showed enhanced ac-
curacy compared with conventional imaging modalities in detect-
ing prostate cancer lesions (9–11). Consequently, it is a promising
technique to allow tumor load quantification as a candidate image-
based biomarker in prostate cancer. However, in patients with a
high tumor load, manual quantification is time-consuming and a
semiautomatic tool would considerably reduce the segmentation
time. A first step toward a semiautomatic tumor burden assess-
ment in prostate cancer was described by Bieth et al. (12), who
proposed a tool that quantifies involvement of the skeleton in
prostate cancer inspired by the bone scan index using 68Ga-PSMA11
PET/CT.We introduce qPSMA as a further development of this first
approach into a software that allows whole-body semiautomatic
Received Nov. 27, 2018; revision accepted Feb. 7, 2019.For correspondence or reprints contact: Andrei Gafita, Department of
Nuclear Medicine, Klinikum rechts der Isar, Technical University Munich,Ismaninger Straße 22, 81675 Munich, Germany.E-mail: [email protected] online Mar. 8, 2019.COPYRIGHT© 2019 by the Society of Nuclear Medicine and Molecular Imaging.
QPSMA SEMIAUTOMATIC SOFTWARE • Gafita et al. 1277
by on June 4, 2020. For personal use only. jnm.snmjournals.org Downloaded from

tumor burden assessment, that is, skeletal, lymph node, and visceralmetastases. We aimed to describe and validate its use in metastaticprostate cancer.
MATERIALS AND METHODS
General Description
qPSMA reads images in DICOM format. PET and CT are co-
registered automatically using the information contained in DICOMheaders. The pipeline was written using Python and C11 languages.
The software runs on Ubuntu and can be installed via a virtual ma-chine on Windows (Microsoft) or Macintosh (Apple) operating sys-
tems. After the computation is finished, the entire work, including thePET, the CT, and the labels, can be saved into a single MATLAB file
(.mat). Considering the intra- and intervariability in reconstructingdifferent types of PET/CT data sets, an image interpolation algorithm
using cubic B-spline curves was implemented (13). Because of a lackof standardization in protocol scanning, anatomic segments (i.e., head,
arms, and legs) are not always entirely contained in the field of view ofPET/CT images. To allow for intra- and interpatient comparison, the
reader can define a specific volume between certain slices to be in-cluded in the final statistics. At the end of computation, the maximum-
intensity projection PET image, including the segmentation labels, canbe displayed. The software includes the possibility of using different
SUV thresholds for skeleton and soft-tissue lesions. This thresholdingis based on the observation that bone metastases reveal lower PSMA
expression than lymph nodes metastases (14). Accordingly, 68Ga-PSMA11 PET imaging showed higher PSMA uptake for lymph node
metastases than skeleton lesions (15).
Software Workflow
Figure 1 displays the proposed 6-step workflow of qPSMA for whole-body tumor segmentation.
Bone Mask. The bone mask incorporates the skeleton, which is firstsegmented on the CT scan. The segmentation method relies on pixel
intensities and different morphologic operations, as described pre-viously (12,16). When necessary, manual corrections can subse-
quently be applied. Because the CT and PET are coregistered, thebone mask is automatically transposed to PET images to determine
the location of the skeleton.Normal-Uptake Mask. The normal-uptake mask includes the organs
that typically exhibit high physiologic PSMA uptake, namely thesalivary glands, liver, spleen, kidneys, and urinary bladder. AVantage
Point Forest algorithm was trained to automatically compute the
normal uptake mask, as described previously (16).Liver Background Activity. In accordance with PERCIST 1.0 (17),
the SUVmean within a 3-cm spheric volume of interest (VOI) withinthe right liver lobe is used to obtain the liver background activity.
To minimize intra- and interuser variability, this 3-cm VOI is semi-automatically placed using an algorithm that showed high reliability
and reproducibility in evaluating liver background activity (18).Bone Lesion Segmentation. 68Ga-PSMA11 does not usually lead
to relevant unspecific uptake within the skeleton. Bieth et al. (12),described a separate fixed SUV threshold for soft-tissue lesions
(SUVthr_st) of 3 as useful for bone lesion segmentation to omit lowbackground uptake. Application of this threshold is restricted to vox-
els within the transposed bone mask from CT. Because of the spillovereffect and frequent misalignment between the CT and PET images
(e.g., because of breathing), some of the bone lesions may be locatedoutside the bone mask and consequently will be improperly seg-
mented as soft-tissue lesions. To overcome this issue, an automatedalgorithm adds uptake outside the bone mask, but in conjunction with
a bone lesion, to this bone lesion. Supplemental Figure 1 displays anexample of a bone lesion located partially outside the bone mask,
FIGURE 1. The 6-step workflow of qPSMA. First, bone mask (A) and
normal-uptake mask (B) are automatically computed. Then, SUVthr_st is
semiautomatically computed from liver background activity (C). Bone le-
sions are segmented using SUVthr_bone (D), whereas soft-tissue lesions are
segmented using SUVthr_st, previously calculated at third step (E). Finally,
output parameters are obtained by performing general statistics (F).
1278 THE JOURNAL OF NUCLEAR MEDICINE • Vol. 60 • No. 9 • September 2019
by on June 4, 2020. For personal use only. jnm.snmjournals.org Downloaded from
before and after application of the ‘‘extend bone lesion’’ algorithm
(supplemental materials are available at http://jnm.snmjournals.org).Soft-Tissue Lesion Segmentation. An SUVthr_st can be applied.
The software automatically displays the measured liver backgroundactivity (SUVmean 1 SD) to assist the user in choosing the SUVthr_st.
The rationale for choosing a liver-based threshold parallels therecommendation of liver uptake as background as established in
the PROMISE criteria (19) and its physiologic 68Ga-PSMA11 up-take, with no detectable PSMA expression by immunohistochem-
istry (7).This approach allows use of a patient- and scan-individualized
threshold. To obtain an accurate value taking into account the so-called tumor sink effect, the following formula is recommended. The
value 4.30 represent the average liver SUVmean obtained in 80 con-secutive patients.
SUVthr_st 54:30
SUVmean· ðSUVmean 1 SDÞ:
After determination of SUVthr_st, all voxels that show an SUV greaterthan SUVthr_st and located outside bone and normal-uptake masks are
automatically segmented as soft-tissue lesions.Manual Corrections. Usually, manual corrections are necessary to
delineate the intestine from abdominal PSMA ligand–positive lymphnodes and to remove false-positive uptake within structures with un-
specific uptake, such as the aorta, esophagus, ureter, and rectum.Typical pitfalls in PSMA ligand PET imaging (e.g., celiac and other
ganglia, adrenal glands) should be considered (20). Different tools,
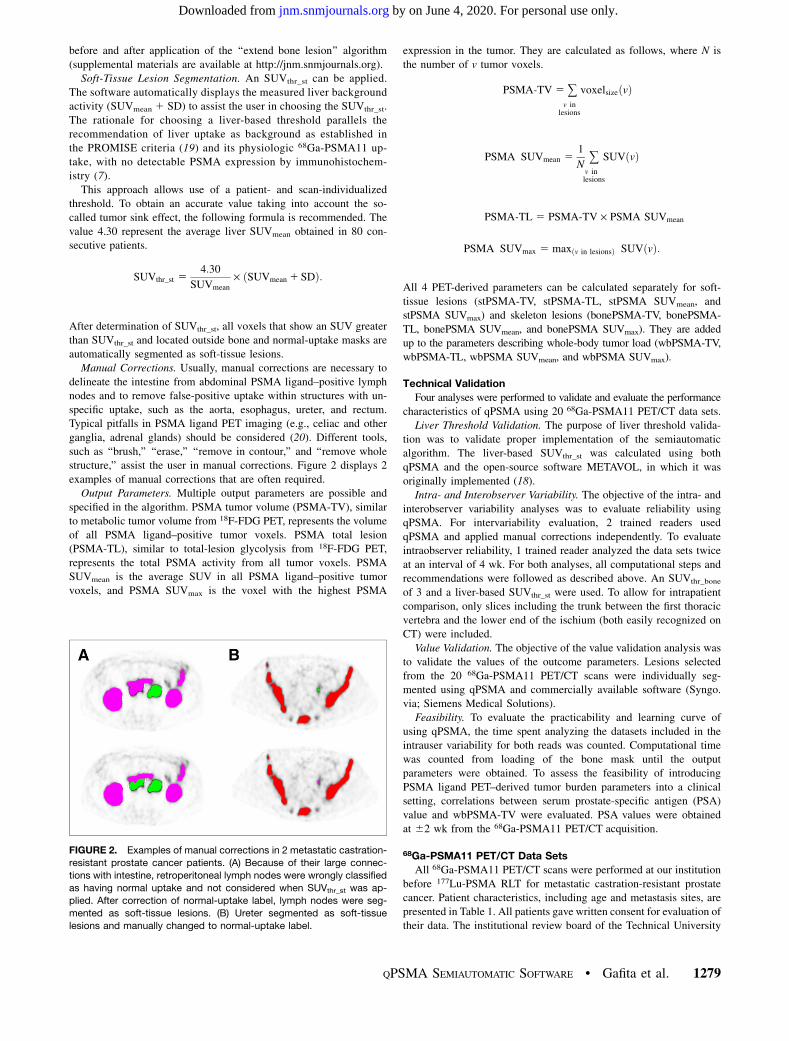
such as ‘‘brush,’’ ‘‘erase,’’ ‘‘remove in contour,’’ and ‘‘remove wholestructure,’’ assist the user in manual corrections. Figure 2 displays 2
examples of manual corrections that are often required.Output Parameters. Multiple output parameters are possible and
specified in the algorithm. PSMA tumor volume (PSMA-TV), similarto metabolic tumor volume from 18F-FDG PET, represents the volume
of all PSMA ligand–positive tumor voxels. PSMA total lesion(PSMA-TL), similar to total-lesion glycolysis from 18F-FDG PET,
represents the total PSMA activity from all tumor voxels. PSMASUVmean is the average SUV in all PSMA ligand–positive tumor
voxels, and PSMA SUVmax is the voxel with the highest PSMA
expression in the tumor. They are calculated as follows, where N is
the number of v tumor voxels.
PSMA-TV 5 +v in
lesions
voxelsizeðvÞ
PSMA SUVmean 51
N+
v inlesions
SUVðvÞ
PSMA-TL 5 PSMA-TV · PSMA SUVmean
PSMA SUVmax 5 maxðv in lesionsÞ SUVðvÞ:
All 4 PET-derived parameters can be calculated separately for soft-
tissue lesions (stPSMA-TV, stPSMA-TL, stPSMA SUVmean, andstPSMA SUVmax) and skeleton lesions (bonePSMA-TV, bonePSMA-
TL, bonePSMA SUVmean, and bonePSMA SUVmax). They are addedup to the parameters describing whole-body tumor load (wbPSMA-TV,
wbPSMA-TL, wbPSMA SUVmean, and wbPSMA SUVmax).
Technical Validation
Four analyses were performed to validate and evaluate the performance
characteristics of qPSMA using 20 68Ga-PSMA11 PET/CT data sets.Liver Threshold Validation. The purpose of liver threshold valida-
tion was to validate proper implementation of the semiautomaticalgorithm. The liver-based SUVthr_st was calculated using both
qPSMA and the open-source software METAVOL, in which it was
originally implemented (18).Intra- and Interobserver Variability. The objective of the intra- and
interobserver variability analyses was to evaluate reliability usingqPSMA. For intervariability evaluation, 2 trained readers used
qPSMA and applied manual corrections independently. To evaluateintraobserver reliability, 1 trained reader analyzed the data sets twice
at an interval of 4 wk. For both analyses, all computational steps andrecommendations were followed as described above. An SUVthr_bone
of 3 and a liver-based SUVthr_st were used. To allow for intrapatientcomparison, only slices including the trunk between the first thoracic
vertebra and the lower end of the ischium (both easily recognized onCT) were included.
Value Validation. The objective of the value validation analysis wasto validate the values of the outcome parameters. Lesions selected
from the 20 68Ga-PSMA11 PET/CT scans were individually seg-mented using qPSMA and commercially available software (Syngo.
via; Siemens Medical Solutions).Feasibility. To evaluate the practicability and learning curve of
using qPSMA, the time spent analyzing the datasets included in theintrauser variability for both reads was counted. Computational time
was counted from loading of the bone mask until the outputparameters were obtained. To assess the feasibility of introducing
PSMA ligand PET–derived tumor burden parameters into a clinicalsetting, correlations between serum prostate-specific antigen (PSA)
value and wbPSMA-TV were evaluated. PSA values were obtainedat 62 wk from the 68Ga-PSMA11 PET/CT acquisition.
68Ga-PSMA11 PET/CT Data Sets
All 68Ga-PSMA11 PET/CT scans were performed at our institution
before 177Lu-PSMA RLT for metastatic castration-resistant prostatecancer. Patient characteristics, including age and metastasis sites, are
presented in Table 1. All patients gave written consent for evaluation oftheir data. The institutional review board of the Technical University
FIGURE 2. Examples of manual corrections in 2 metastatic castration-
resistant prostate cancer patients. (A) Because of their large connec-
tions with intestine, retroperitoneal lymph nodes were wrongly classified
as having normal uptake and not considered when SUVthr_st was ap-
plied. After correction of normal-uptake label, lymph nodes were seg-
mented as soft-tissue lesions. (B) Ureter segmented as soft-tissue
lesions and manually changed to normal-uptake label.
QPSMA SEMIAUTOMATIC SOFTWARE • Gafita et al. 1279
by on June 4, 2020. For personal use only. jnm.snmjournals.org Downloaded from

Munich approved this retrospective analysis (permit 5665/13). 68Ga-
PSMA11 was administered in compliance with the German MedicinalProducts Act, AMG x13(2b), and in accordance with the responsible
regulatory body (Government of Oberbayern). 68Ga-PSMA11 wassynthesized and PET/CT images obtained as described previously
(9). The transaxial pixel size was 4.07 mm for PET and 1.52 mmfor CT, with a 5-mm slice thickness for both.
Statistical Analysis
Values are reported as mean and range. Percentage relative differ-
ences were calculated by dividing the absolute value of the differenceswithin the measurements by the average of the 2 measurements, all
multiplied by 100. Means and 95% confidence intervals (95%CIs) ofthe relative differences are reported. Paired t testing was used when
the values were considered paired. Intraclass correlation coefficient(ICC) estimates and 95%CI were calculated on the basis of a single
rater, absolute agreement, and 2-way mixed-effect model (21). Spear-man rank correlations were performed to assess the correlations be-
tween tumor burden parameters. In each analysis, a P value of lessthan 0.05 was considered statistically significant. All statistical anal-
yses were performed using IBM SPSS Statistics, version 22.0 (IBMCorp.).
RESULTS
Liver Threshold Validation
The mean of SUVthr_st computed with METAVOL and qPSMAwas 5.18 and 5.14, respectively. Paired t testing did not show asignificant difference (P 5 0.14). The mean relative differencewas 0.74% (95%CI, 20.22%;1.72%). The ICC estimate was0.996 (95%CI, 0.989;0.998). Figure 3 illustrates the Bland–Alt-man plot of the differences between SUVthr_st obtained with bothsoftware packages.
Intra- and Interobserver Variability
The absolute mean values, the mean and 95%CI of the dif-ferences, and the ICC and 95%CI in PSMA-TV, PSMA-TL, PSMASUVmean, and PSMA SUVmax for bone and soft tissue are presentedin Table 2.
Value Validation
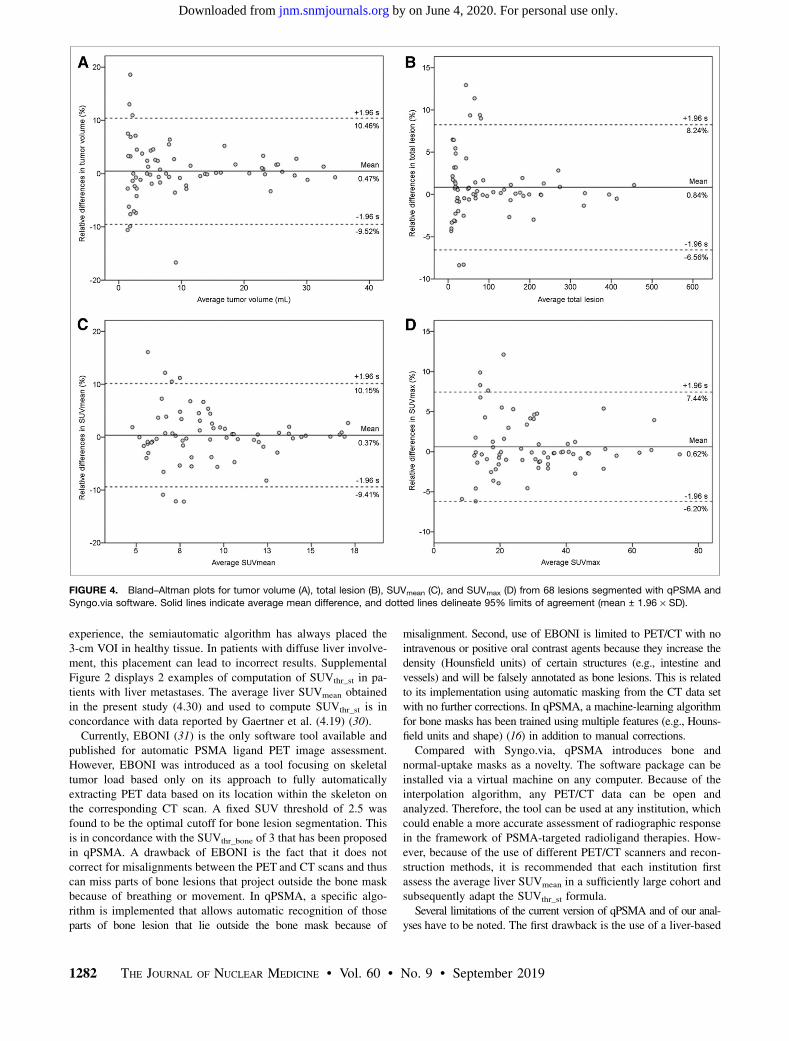
Sixty-eight representative lesions were segmented using bothqPSMA and Syngo.via software. The mean values obtained forPSMA-TV, PSMA-TL, SUVmean, and SUVmax were 10.27 versus10.23 mL, 108.4 versus 107.8, 9.33 versus 9.31, and 30.03 versus29.87, respectively. Paired t testing did not show significant dif-ferences (P . 0.05). Mean relative differences were 0.47% (95%CI, 20.78%;1.72%), 0.84% (95%CI, 20.07%;1.75%), 0.37%(95%CI, 20.83%;1.57%), and 0.62% (95%CI, 20.21%;1.47%)for PSMA-TV, PSMA-TL, SUVmean, and SUVmax, respectively.ICC estimates were 1.000 (95%CI, 0.999;1.000), 1.000 (95%CI,1.000;1.000), 0.997 (95%CI, 0.994;0.998), and 0.999 (95%CI,0.999;1.000), respectively. Figure 4 illustrates the Bland–Altmanplots of the differences between values obtained with both soft-ware packages.
Feasibility
The mean computational time was 13.63 min (range, 8.22–25.45 min) and 9.27 min (range, 8.10–12.15 min) for the firstand second reads, respectively. The differences in computationaltime were significantly different (P 5 0.001). For the hardwareused (Intel Core i7, 4.2-GHz, 32-GB random-access memory), thetime loading masks and liver threshold was approximatively6 min. At baseline, the mean serum PSA, wbPSMA-TV, andwbPSMA-TL were 369 ng/mL (range, 1–2,222 ng/mL), 827 mL(range, 7–3,076 mL), and 7,005 (range, 62–26,304), respectively.Highly significant correlations were found between PSA and bothwbPSMA-TV (r 5 0.72, P , 0.001) and wbPSMA-TL (r 5 0.66,P 5 0.002).
DISCUSSION
To the best of our knowledge, the introduction of qPSMA as asoftware tool for whole-body tumor segmentation is a novelapproach toward semiautomatic analysis of PET data in prostatecancer. Basically, qPSMA integrates various segmentation proce-dures and PET quantification into a single package to facilitate
FIGURE 3. Bland–Altman plot of qPSMA and METAVOL agreement on
semiautomatic computation of SUVthr_st. Solid line indicates average
mean difference, and dotted lines delineate 95% limits of agreement
(mean ± 1.96 · SD). No systematic difference between the 2 software
programs was found.
TABLE 1Patient Characteristics
Characteristic Data
Patients (n) 20
Age (y)
Mean 73
Range 65–84
PSA (ng/mL)
Mean 369
Range 1–2,222
Site of metastasis (n)
Lymph node, overall 12
Lymph node only 1
Bone, overall 19
Bone only 1
Bone and lymph node 12
Local recurrence 4
Visceral, overall 3
1280 THE JOURNAL OF NUCLEAR MEDICINE • Vol. 60 • No. 9 • September 2019
by on June 4, 2020. For personal use only. jnm.snmjournals.org Downloaded from

PSMA ligand assessment of PET tumor burden. In detail, thesoftware uses a fixed SUV threshold having liver backgroundactivity as a reference for physiologic PSMA ligand uptake, asrecommended in PROMISE (19), and computed using a 3-cm VOI,as recommended in PERCIST (17). To minimize interuser variabil-ity, a semiautomatic algorithm was incorporated to place the VOIwithin the right liver lobe (18). As a novelty, we introduced 2different thresholds for bone and soft-tissue lesion segmentationthat consider their different PSMA ligand uptake levels (14,15).The results of our investigation indicate that semiautomatic
evaluation of bone, soft-tissue, and whole-body tumor load inheavily metastasized prostate cancer patients is feasible. qPSMAis a robust software package with a considerable training effect forthe user. Values obtained with our in-house–developed tool agreestrongly with commercial software. Its application is of high in-terest in the setting of PSMA theranostics, in which PSMA ligandPET imaging is typically used for pretreatment evaluation as wellas treatment response assessment.There is increasing use of 18F-FDG PET imaging quantification
applying metabolic tumor volume and total-lesion glycolysis aspredictor parameters for treatment outcome (22,23).A first approach in whole-body tumor burden assessment using
68Ga-PSMA11 PET/CT was introduced by Schmuck et al. (24)using an isocontour SUV threshold method. Because the processwas time-consuming, only patients with a low tumor load (,10lesions) were manually analyzed. This resulted in a relatively lowmean PSMA-TV and PSMA-TL of 3.4 mL and 33.2 per patient,respectively. Schmidkonz et al. (25) extended the work by analyz-ing patients with a higher tumor burden (PSMA-TV and PSMA-TL of 7.4 mL and 73.8, respectively). No segmentation time wasreported in either work. Nevertheless, such manual segmentationmethods are time-consuming, making whole-body tumor burdenassessment in heavily metastasized patients not feasible. There-fore, a semiautomatic method would pave the way toward awhole-body tumor load quantification in prostate cancer patients.In the present study, the mean analyzed PSMA-TV and PSMA-TLwere 823 mL and 7,273, respectively, indicating that our patientcohort was much more advanced than previous reports in theliterature using manual segmentation (24,25). Furthermore, thisfactor could also explain why we obtained stronger correlationsbetween serum PSA and PSMA ligand PET–derived parametersthan those previously described in 2 reports (24,25). However,
those 2 reports analyzed patients with biochemical recurrence, andour study investigated patients with metastatic castration-resistantprostate cancer.Our data indicate that a certain amount of training can reduce
the time needed for manual correction; for the second analysis ofthe same data set, the time was significantly reduced (13.63 vs.9.27 min). Though further improvements are warranted, thecurrent time needed to analyze each patient is likely to representa strong advantage over manual approaches. Notably, as qPSMAuses fully automatic steps as well as manual correction, the timeneeded to process a data set also depends on the specific hardware.The technical validation of qPSMA resulted in reliable and
reproducible data for different items. The implementation of auto-matic liver background calculation for our data exhibited excellentagreement (ICC of 0.996) with METAVOL as a first tool for thistask and only a minimal deviation of 0.74% using a Bland–Altmanplot. Quantitative data produced by qPSMA are in strong concor-dance (all ICC . 0.997) with output from a commercial system(Syngo.via). In data shown using Bland–Altman plots, a bias be-low 1% was found in all 4 parameters. Interestingly, by increasinglesion volume and uptake, the bias decreases, which shows thatlesions with high volumes and high SUVs had a stronger concor-dance. This finding confirms that small lesions exhibit higher SUVvariability (26). For SUVmax, we found a mean difference of 0.6%,which is in concordance with a mean difference of up to 0.5%obtained in a comparison among 4 commercial software packages(27). In terms of reliability, qPSMA offers high intra- and inter-observer agreement, with superb ICC estimates and no significantdifferences between users.No segmentation method has been yet established for PET as
the gold standard. Fixed threshold and isocontour relativethreshold have been largely used in PET quantification (22–24).However, it has been shown that despite different results usingvarious segmentation methods or partial-volume effect correction,no significant impact on the predictive or prognostic power ofPET-derived parameters could be found (28,29). As a conse-quence, we focused more on developing a semiautomatic algo-rithm that allows for whole-body tumor burden assessment inheavily metastasized patients than on deeply analyzing differencesbetween segmentation methods.We are aware that the presence of liver metastases can interfere
with the liver-based threshold because, on the basis of our
TABLE 2Intra- and Interobserver Analyses
Intraobserver analysis Interobserver analysis
Output parameter Read 1 vs. 2 Difference (%) ICC User 1 vs. 2 Difference (%) ICC
bPSMA-TV (mL) 801.9 vs. 800.4 −2.22 (−5.72;1.25) 1.000 (0.999;1.000) 801.9 vs. 800.1 2.53 (−2.60;7.68) 1.000 (1.000;1.000)
bPSMA-TL 6397 vs. 6393 −2.94 (−7.75;1.86) 1.000 (0.999;1.000) 61397 vs. 6392 2.37 (−1.93;6.68) 1.000 (1.000;1.000)
bPSMA SUVmean 7.34 vs. 7.39 −0.73 (−2.24;0.77) 0.998 (0.998;1.000) 7.34 vs. 7.33 −0.16 (−1.99;1.67) 0.998 (0.996;0.999)
bPSMA SUVmax 38.43 vs. 38.45 −0.07 (−0.38;0.22) 1.000 (0.999;1.000) 38.43 vs. 38.43 0.05 (−0.20;0.31) 1.000 (1.000;1.000)
stPSMA-TV (mL) 67.8 vs. 68.6 3.10 (−8.24;14.45) 1.000 (0.999;1.000) 67.8 vs. 67.1 9.05 (−1.49;19.61) 0.999 (0.998;1.000)
stPSMA-TL 1026 vs. 1033 5.22 (−4.87;15.31) 1.000 (0.999;1.000) 1026 vs. 1016 8.70 (−1.37;18.77) 1.000 (0.999;1.000)
stPSMA SUVmean 9.95 vs. 9.96 −0.43 (−1.86;0.98) 1.000 (0.999;1.000) 9.95 vs.9.92 −0.49 (−1.88;0.90) 0.999 (0.996;0.999)
stPSMA SUVmax 31.23 vs. 31.20 0.18 (−0.15;0.53) 1.000 (1.000;1.000) 31.23 vs. 33.21 0.32 (−0.25;0.89) 1.000 (1.000;1.000)
Data are mean; 95%CIs are in parentheses. P values on paired t testing are all .0.05
QPSMA SEMIAUTOMATIC SOFTWARE • Gafita et al. 1281
by on June 4, 2020. For personal use only. jnm.snmjournals.org Downloaded from
experience, the semiautomatic algorithm has always placed the3-cm VOI in healthy tissue. In patients with diffuse liver involve-ment, this placement can lead to incorrect results. SupplementalFigure 2 displays 2 examples of computation of SUVthr_st in pa-tients with liver metastases. The average liver SUVmean obtainedin the present study (4.30) and used to compute SUVthr_st is inconcordance with data reported by Gaertner et al. (4.19) (30).Currently, EBONI (31) is the only software tool available and
published for automatic PSMA ligand PET image assessment.However, EBONI was introduced as a tool focusing on skeletaltumor load based only on its approach to fully automaticallyextracting PET data based on its location within the skeleton onthe corresponding CT scan. A fixed SUV threshold of 2.5 wasfound to be the optimal cutoff for bone lesion segmentation. Thisis in concordance with the SUVthr_bone of 3 that has been proposedin qPSMA. A drawback of EBONI is the fact that it does notcorrect for misalignments between the PET and CT scans and thuscan miss parts of bone lesions that project outside the bone maskbecause of breathing or movement. In qPSMA, a specific algo-rithm is implemented that allows automatic recognition of thoseparts of bone lesion that lie outside the bone mask because of
misalignment. Second, use of EBONI is limited to PET/CT with nointravenous or positive oral contrast agents because they increase thedensity (Hounsfield units) of certain structures (e.g., intestine andvessels) and will be falsely annotated as bone lesions. This is relatedto its implementation using automatic masking from the CT data setwith no further corrections. In qPSMA, a machine-learning algorithmfor bone masks has been trained using multiple features (e.g., Houns-field units and shape) (16) in addition to manual corrections.Compared with Syngo.via, qPSMA introduces bone and
normal-uptake masks as a novelty. The software package can beinstalled via a virtual machine on any computer. Because of theinterpolation algorithm, any PET/CT data can be open andanalyzed. Therefore, the tool can be used at any institution, whichcould enable a more accurate assessment of radiographic responsein the framework of PSMA-targeted radioligand therapies. How-ever, because of the use of different PET/CT scanners and recon-struction methods, it is recommended that each institution firstassess the average liver SUVmean in a sufficiently large cohort andsubsequently adapt the SUVthr_st formula.Several limitations of the current version of qPSMA and of our anal-
yses have to be noted. The first drawback is the use of a liver-based
FIGURE 4. Bland–Altman plots for tumor volume (A), total lesion (B), SUVmean (C), and SUVmax (D) from 68 lesions segmented with qPSMA and
Syngo.via software. Solid lines indicate average mean difference, and dotted lines delineate 95% limits of agreement (mean ± 1.96 · SD).
1282 THE JOURNAL OF NUCLEAR MEDICINE • Vol. 60 • No. 9 • September 2019
by on June 4, 2020. For personal use only. jnm.snmjournals.org Downloaded from

threshold, which limits its use in diffuse liver involvement. Addi-tionally, adaptions might be necessary for PSMA ligands that aremainly liver-excreted (e.g., PSMA-1007). Second, lesions with alower PSMA uptake than liver background activity are missed bythe algorithm. Even though the SUV-based threshold is currentlythe state of the art in PET segmentation, SUV is susceptible to theuse of different scanners and reconstruction methods (32). To over-come these issues, for the next version of the software we will focuson shifting from thresholding to convolutional neural networks,which have already shown enhanced accuracy in PET segmentation,as compared with conventional methods (33).
CONCLUSION
qPSMA is a user-friendly and reliable semiautomatic softwaretool that allows assessment of bone, soft-tissue, and whole-bodytumor burden in prostate cancer. Its application to 68Ga-PSMA11PET/CT is feasible and robust and can help physicians quantifywhole-body tumor load in heavily metastasized patients within anacceptable time frame. It is the first step toward further analyses ofPSMA ligand PET imaging as a potential image-derived biomarker inprostate cancer, especially within the PSMA theranostics framework.
DISCLOSURE
Matthias Eiber received funding from the SFB 824 (DFGSonderforschungsbereich 824, project B11) from the DeutscheForschungsgemeinschaft, Bonn, Germany. Siemens Medical Solutions(Erlangen, Germany) provided the continuous bed motion option forthe Biograph mCT as part of an academic collaboration. No otherpotential conflict of interest relevant to this article was reported.
KEY POINTS
QUESTION: Is it possible to develop a semiautomatic tool that
allows for whole-body tumor burden assessment in prostate
cancer using PSMA PET imaging?
PERTINENT FINDINGS: Using a retrospective cohort of 20 pa-
tients with prostate cancer, we showed that semiautomatic
quantification of PSMA PET is feasible. The output values
obtained using qPSMA were in high correlation with that obtained
with a commercial software, while whole-body PSMA-avid tumor
volume was significantly correlated with PSA levels.
IMPLICATIONS FOR PATIENT CARE: Whole-body tumor bur-
den assessment using PSMA PET is feasible and might allow for
patient outcome prediction or therapeutic response evaluation.
REFERENCES
1. Ferlay J, Steliarova-Foucher E, Lortet-Tieulent J, et al. Cancer incidence and
mortality patterns in Europe: estimates for 40 countries in 2012. Eur J Cancer.
2013;49:1374–1403.
2. Key Statistics for Prostate Cancer. American Cancer Society website. https://
www.cancer.org/cancer/prostate-cancer/about/key-statistics.html. Accessed April 26,
2019.
3. Survival rates for prostate cancer. American Cancer Society website. https://www.
cancer.org/cancer/prostate-cancer/detection-diagnosis-staging/survival-rates.html.
Revised February 7, 2019. Accessed April 26, 2019.
4. Scher HI, Morris MJ, Stadler WM, et al. Trial design and objectives for castra-
tion-resistant prostate cancer: updated recommendations from the prostate cancer
clinical trials working group 3. J Clin Oncol. 2016;34:1402–1418.
5. Schwartz LH, Litiere S, de Vries E, et al. RECIST 1.1: update and clarification—
from the RECIST committee. Eur J Cancer. 2016;62:132–137.
6. Israeli RS, Powell CT, Corr JG, Fair WR, Heston WD. Expression of the pros-
tate-specific membrane antigen. Cancer Res. 1994;54:1807–1811.
7. Silver DA, Pellicer I, Fair WR, Heston WD, Cordon-Cardo C. Prostate-specific
membrane antigen expression in normal and malignant human tissues. Clin Cancer
Res. 1997;3:81–85.
8. Eiber M, Fendler WP, Rowe SP, et al. Prostate-specific membrane antigen li-
gands for imaging and therapy. J Nucl Med. 2017;58(suppl):67S–76S.
9. Eiber M, Maurer T, Souvatzoglou M, et al. Evaluation of hybrid 68Ga-PSMA
ligand PET/CT in 248 patients with biochemical recurrence after radical pros-
tatectomy. J Nucl Med. 2015;56:668–674.
10. Afshar-Oromieh A, Avtzi E, Giesel FL, et al. The diagnostic value of PET/CT
imaging with the 68Ga-labelled PSMA ligand HBED-CC in the diagnosis of
recurrent prostate cancer. Eur J Nucl Med Mol Imaging. 2015;42:197–209.
11. Rahbar K, Weckesser M, Huss S, et al. Correlation of intraprostatic tumor extent with68Ga-PSMA distribution in patients with prostate cancer. J Nucl Med. 2016;57:563–567.
12. Bieth M, Kronke M, Tauber R, et al. Exploring new multimodal quantitative
imaging indices for the assessment of osseous tumor burden in prostate cancer
using 68Ga-PSMA PET/CT. J Nucl Med. 2017;58:1632–1637.
13. Pan J. Image interpolation using spline curves. CiteSeerX website. http://citeseerx.ist.psu.
edu/viewdoc/summary?doi510.1.1.517.3701. Published 2003. Accessed April 26, 2019.
14. Schmittgen TD, Teske S, Vessella RL, True LD, Zakrajsek BA. Expression of
prostate specific membrane antigen and three alternatively spliced variants of
PSMA in prostate cancer patients. Int J Cancer. 2003;107:323–329.
15. Freitag MT, Radtke JP, Hadaschik BA, et al. Comparison of hybrid 68Ga-PSMA
PET/MRI and 68Ga-PSMA PET/CT in the evaluation of lymph node and bone
metastases of prostate cancer. Eur J Nucl Med Mol Imaging. 2016;43:70–83.
16. Bieth M, Peter L, Nekolla SG, et al. Segmentation of skeleton and organs in whole-body
CT images via iterative trilateration. IEEE Trans Med Imaging. 2017;36:2276–2286.
17. Wahl RL, Jacene H, Kasamon Y, Lodge MA. From RECIST to PERCIST:
evolving considerations for PET response criteria in solid tumors. J Nucl Med.
2009;50(suppl 1):122S–150S.
18. Hirata K, Kobayashi K, Wong KP, et al. A semi-automated technique determin-
ing the liver standardized uptake value reference for tumor delineation in FDG
PET-CT. PLoS One. 2014;9:e105682.
19. Eiber M, Herrmann K, Calais J, et al. Prostate cancer molecular imaging stan-
dardized evaluation (PROMISE): proposed miTNM classification for the inter-
pretation of PSMA-ligand PET/CT. J Nucl Med. 2018;59:469–478.
20. Hofman MS, Hicks RJ, Maurer T, Eiber M. Prostate-specific membrane antigen
PET: clinical utility in prostate cancer, normal patterns, pearls, and pitfalls.
Radiographics. 2018;38:200–217.
21. Koo TK, Li MY. A guideline of selecting and reporting intraclass correlation
coefficients for reliability research. J Chiropr Med. 2016;15:155–163.
22. Rogasch JMM, Hundsdoerfer P, Hofheinz F, et al. Pretherapeutic FDG-PET total
metabolic tumor volume predicts response to induction therapy in pediatric
Hodgkin’s lymphoma. BMC Cancer. 2018;18:521.
23. Mikhaeel NG, Smith D, Dunn JT, et al. Combination of baseline metabolic
tumour volume and early response on PET/CT improves progression-free sur-
vival prediction in DLBCL. Eur J Nucl Med Mol Imaging. 2016;43:1209–1219.
24. Schmuck S, von Klot CA, Henkenberens C, et al. Initial experience with volu-
metric 68Ga-PSMA I&T PET/CT for assessment of whole-body tumor burden as
a quantitative imaging biomarker in patients with prostate cancer. J Nucl Med.
2017;58:1962–1968.
25. Schmidkonz C, Cordes M, Schmidt D, et al. 68Ga-PSMA-11 PET/CT-derived
metabolic parameters for determination of whole-body tumor burden and treatment
response in prostate cancer. Eur J Nucl Med Mol Imaging. 2018;45:1862–1872.
26. Brendle C, Kupferschlager J, Nikolaou K, la Fougere C, Gatidis S, Pfannenberg C.
Is the standard uptake value (SUV) appropriate for quantification in clinical PET
imaging? Variability induced by different SUV measurements and varying recon-
struction methods. Eur J Radiol. 2015;84:158–162.
27. Arain Z, Lodge M, Wahl R. A comparison of SUV parameters across four
commercial software platforms [abstract]. J Nucl Med. 2015;56(suppl):580.
28. Kanoun S, Tal I, Berriolo-Riedinger A, et al. Influence of software tool and meth-
odological aspects of total metabolic tumor volume calculation on baseline [18F]FDG
PET to predict survival in Hodgkin lymphoma. PLoS One. 2015;10:e0140830.
29. Hatt M, Le Pogam A, Visvikis D, Pradier O, Cheze Le Rest C. Impact of partial-
volume effect correction on the predictive and prognostic value of baseline 18F-
FDG PET images in esophageal cancer. J Nucl Med. 2012;53:12–20.
30. Gaertner FC, Halabi K, Ahmadzadehfar H, et al. Uptake of PSMA-ligands in
normal tissues is dependent on tumor load in patients with prostate cancer. Oncotarget.
2017;8:55094–55103.
31. Hammes J, Tager P, Drzezga A. EBONI: a tool for automated quantification of
bone metastasis load in PSMA PET/CT. J Nucl Med. 2018;59:1070–1075.
32. Adams MC, Turkington TG, Wilson JM, Wong TZ. A systematic review of the
factors affecting accuracy of SUV measurements. AJR. 2010;195:310–320.
33. Hatt M, Laurent B, Ouahabi A, et al. The first MICCAI challenge on PET tumor
segmentation. Med Image Anal. 2018;44:177–195.
QPSMA SEMIAUTOMATIC SOFTWARE • Gafita et al. 1283
by on June 4, 2020. For personal use only. jnm.snmjournals.org Downloaded from
Doi: 10.2967/jnumed.118.224055Published online: March 8, 2019.
2019;60:1277-1283.J Nucl Med. Menze, Wolfgang A. Weber and Matthias EiberAndrei Gafita, Marie Bieth, Markus Krönke, Giles Tetteh, Fernando Navarro, Hui Wang, Elisabeth Günther, Bjoern
Ga-PSMA11 PET/CT68Prostate Cancer Using qPSMA: Semiautomatic Software for Whole-Body Tumor Burden Assessment in
http://jnm.snmjournals.org/content/60/9/1277This article and updated information are available at:
http://jnm.snmjournals.org/site/subscriptions/online.xhtml
Information about subscriptions to JNM can be found at:
http://jnm.snmjournals.org/site/misc/permission.xhtmlInformation about reproducing figures, tables, or other portions of this article can be found online at:
(Print ISSN: 0161-5505, Online ISSN: 2159-662X)1850 Samuel Morse Drive, Reston, VA 20190.SNMMI | Society of Nuclear Medicine and Molecular Imaging
is published monthly.The Journal of Nuclear Medicine
© Copyright 2019 SNMMI; all rights reserved.
by on June 4, 2020. For personal use only. jnm.snmjournals.org Downloaded from