Embed Size (px)
Citation preview

qPCR, ELISA, and the HAB Workflow
Andrew Bair
Laboratory Scientist,
Ohio Environmental Protection Agency
Implementation of common techniques into the regulatory framework

HAB Overview Harmful Algal Blooms (HABs) are caused by the
unchecked proliferation of algae, some of which can produce harmful toxins.
Primarily driven by bioavailable phosphorus, HABs have been on the uptick for over a decade.
Source: NOAA Bulletin, June 2016

HAB Overview
the production of neurotoxins (MYC, STX, CYN)
human illness or death via consumption of seafood contaminated by toxic algae
mechanical damage to other organisms, such as disruption of epithelial gill tissues in fish
oxygen depletion of the water column (hypoxia or anoxia)

HAB Overview In 2013, DES analyzed 421 HAB samples. In 2015, DES analyzed 2,511 HAB samples, an almost 6x
increase in two years.
Satellite image of Lake Erie exhibiting a cyanobacterial (‘blue green algae’) bloom.

HAB Overview
With an ever-increasing sample load, OEPA requires an efficient workflow; one which cuts down on unnecessary analysis and focuses on problem areas.
Consequently, OEPA has settled on a two-pronged approach: qPCR for routine screening and prediction of potential toxin-producing blooms, and ELISA for confirmation quantification.

qPCR Quantitative Real-Time Polymerase Chain Reaction
It (PCR) is one of the most powerful technologies in molecular biology. It can be used to amplify target DNA millions of times.

qPCR
Three Steps of the PCR Cycle:
1) Denaturation95°
2) Annealing60°
3) Extension60°

qPCR1) Denaturation - In this step the hydrogen bonds which hold together the complementary strands of DNA are broken by heat.

qPCR2) Annealing - The primers are annealed, or attached, to the denatured DNA template.

Primer 101
DNA Polymerase, the enzyme used to amplify DNA in PCR, cannot bind to single-stranded DNA.A primer is a short strand of nucleic acid sequences (generally about 10 base pairs) that serves as a starting point for DNA synthesis.
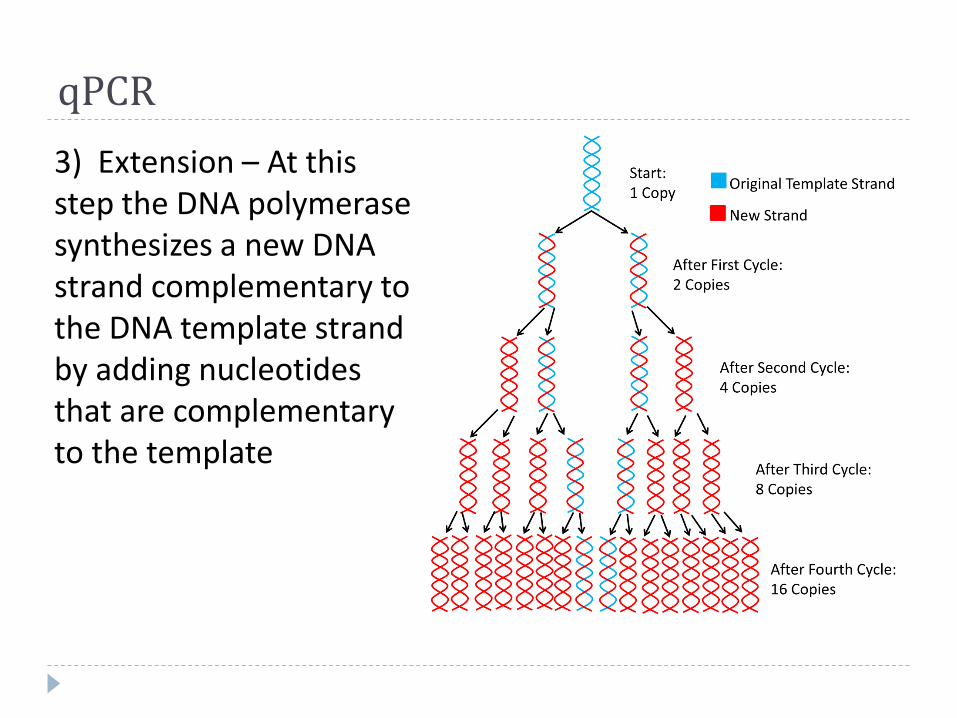
qPCR3) Extension – At this step the DNA polymerase synthesizes a new DNA strand complementary to the DNA template strand by adding nucleotides that are complementary to the template

250 mL Sample
Vacuum filtration manifold, 50mL of sample
Vacuum filtrate and keep the filter
Fold filter up, aseptically and place into a Bead Lysis Tube
1.5mL Bead Lysis Tube
Bead Beat for 120 seconds, then centrifuge for 60 seconds
Transfer supernatant to microcentrifuge tube. Sample is ready for storage or for plating.
96-well Optical PlateThermocycler
How Do We Prepare Samples?

qPCR
Two different Master Mixes
Total Cyanobacteria Assay (16s) Determines the gene copies of
total Cyanobateria Contains IAC
Total Cyanotoxin Assay Microcystins/Nodularin Cylidrospermopsin Saxitoxin

qPCR
In typical PCR, the result is a ‘band’ of genetic material on a gel. Comparison of the intensity of this band to a known standard can give ‘semi-quantitative’ results
qPCR entails data collection during amplification, as opposed to after the reaction is complete.
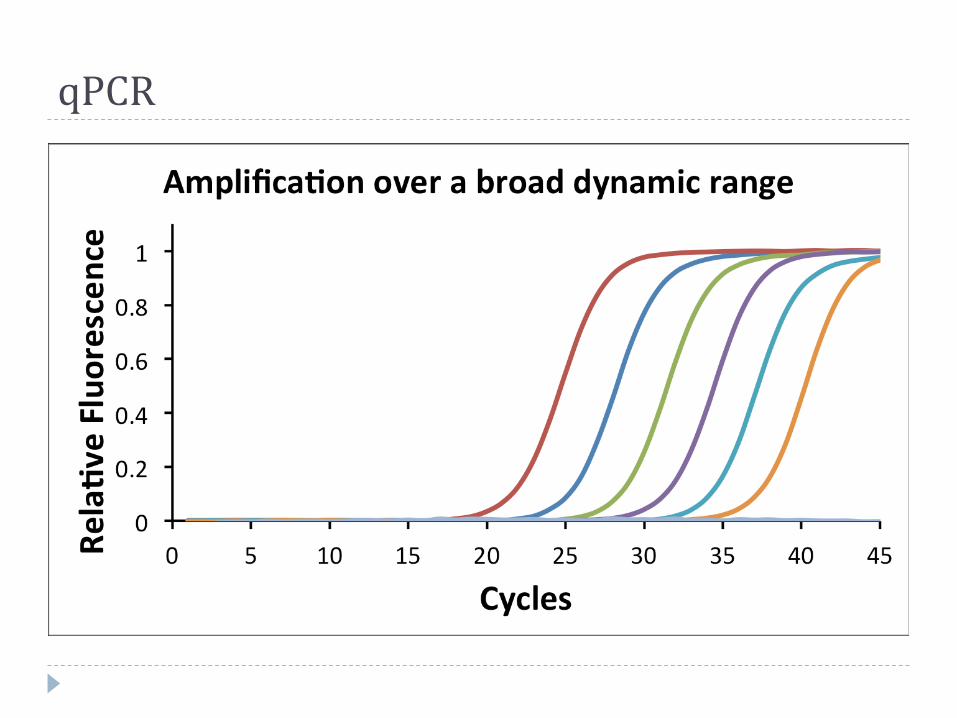
qPCR
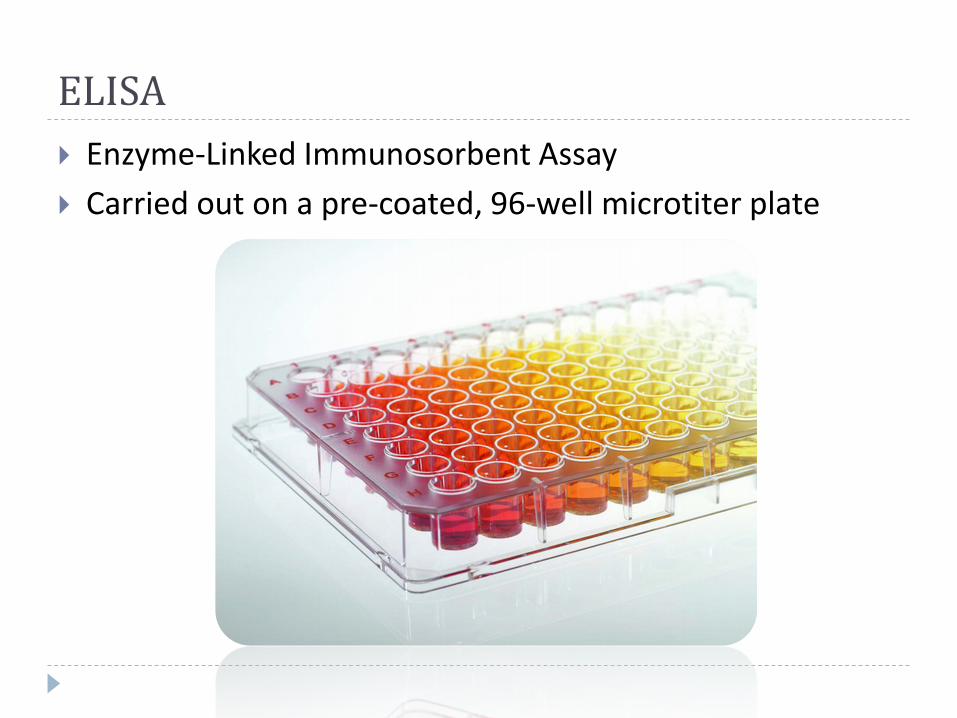
ELISA Enzyme-Linked Immunosorbent Assay Carried out on a pre-coated, 96-well microtiter plate

ELISA Samples are frozen and thawed in a dry ice/ethanol bath
three times Cells are lysed, toxin is released Samples are filtered to remove any detritus

ELISA Several different types Direct Indirect Sandwich (Direct or Indirect) Competitive – can be combined with any of the other three

ELISA Focus on direct/competitive – used
for Saxitoxin, Cylindrospermopsin Wells are pre-coated with
secondary antibody (anti-rabbit) Sample, CYN-HRP conjugate, and
Rabbit-anti-CYN antibody are added
Sample and CYN-HRP conjugate compete to bind with Rabbit-anti-CYN antibody
These newly formed complexes bind to secondary antibody coating
Color solution is added; only creates signal with CYN-HRP Conjugate complexes

ELISA
As the color solution creates a signal only with the HRP-Conjugate complex, wells which contain samples high in CYN will not exhibit color
Signal is inversely proportional to sample CYN concentration

Advantages of ELISA Specific, quantitative results Does not require
radioisotopes Relatively inexpensive
equipment when compared to LC-MS/MS
Requires analyst expertise Time-Consuming

Advantages of qPCR
Allows us to quantify four parameters simultaneously
Can be used to determine the ability of a bloom to produce actual cyanotoxin
Less expensive than running ELISA for 4 parameters
Less time-consuming: 5 to 6 hr. for 20 samples at 4 parameters

Data Implementation Ohio Public Water Systems are required to routinely
sample source water
1 qPCR sample every 2 weeks
125 PWS ≈ 62 samples/week
More data is better

Data Implementation Therefore, qPCR is used as a screening procedure, and to
determine a baseline for each PWS This will give us an idea of typical gene counts found in
each reservoir and help us react accordingly

Data Implementation
When a toxin-producing gene is found in significant numbers, this triggers a sampling event for said parameter. (CYN, STX, MCY)
This prevents unnecessary ELISA , yet allows us to stay ahead of potential blooms – gene quantification is often a precursor to toxin production

Summary qPCR quantifies gene copies/µL and is used as a routine
monitoring and screening procedure Cheaper, less time consuming, predictive power Any positive result triggers a sampling for the positive
parameter (CYN, MYC) ELISA is then used to confirm and quantify toxin
production

THANK YOU!
To the OEPA, OAWWA, and you.