Embed Size (px)
Citation preview

qlb
NASA Contractor Report 182007
Final Report:
Design of an Integrated Airframe/
Propulsion Control System Architecture
G. C. Cohen
Boeing Advanced Systems
Seattle, Washington
C. W. Lee
Boeing Advanced Systems
Seattle, Washington
M. J. Strickland
Boeing Advanced Systems
Seattle, Washington
7". C. Torkelson
Boeing Advanced Systems
Seattle, Washington
NASA Contract NAS1-18099
March 1990
lYBSANational Aeronautics and
Space Administration
Langley Research CenterHampton, Virginia 23665
Date for general release
AN INTEGRATE(]
SYSTEM
March 31, 1992
(NASA-CR-ISZO07) DESIGN OF
AIRFRAMEIPROPULSION CONTROL
ARCHITECTURE Final Report (_oeing Advanced
Systems Co.) 253 p CSCL I2B(;3166
N92-22044
Uncl as
0085747
https://ntrs.nasa.gov/search.jsp?R=19920013401 2018-06-12T04:01:52+00:00Z


|
FREFACE
This report describes the design of an embedded architecture for an
integrated flight/propulsion control system. The design procedure is based
on a prevalidation methodology. In addition, the report gives a detailed
account of the testing associated with a subset of the AIPS system. This
work has been supported under NASA contract NAS1-10899, Integrated
Airframe/Propulslon Control System Architecture (IAPSA II).
The NASA technical monitor for this work is Daniel L. Palumbo of the
NASA Langley Research Center, Hampton, Virginia.
The work was accomplished by the Flight Controls Technology
organization at Boeing Advanced Systems in Seattle, Vashington and by our
"subcontractor, The Charles Stark Draper Laboratory in Cambridge,
Massachusetts. Personnel responsible for the work performed include:
D. Gangsaas
T. M. Richardson
G. C. Cohen
C. N. Lee
M. J. Strlckland
T. C. Torkelson
J. J. Deyst
J. H. Lala
L. D. Brock
Responsible manager
Program manager
Principal investigator
System design and reliability analysis
Performance analysis
Small-scale system
C. S. Draper Lab
C. S. Draper Lab
C. S. Draper Lab

I

SECTION
1.0 SUMMARY
TABI_ OF CONTENTS
PACE
2.0 INTRODUCTION
3.0 PREVALIDATION METHODOLOGY AND CANDIDATE SELECTION
3.1 Prevalidation Methodology
3.1.1 IAPSA II Aircraft
3.1.2 Prevalidation Methodology Overview
3.2 Reliability Tool Evaluation
3.2.1 Fllght-Critlcal System Example
3.2.2 Evaluation Results
3.3 Performance Tool Evaluation
3.4 Mission Requirements and System Functions
3.4.1 Mission Analysis
3.4.2 Control System Functional Grouping
3.4.3 Control System Computational Sizing
Esti_tes
3.5 Architecture Candidate Selection
3.5.1
3.5.2
3.5.3
3.5.4
3.5.5
AIPS System Description
Processing Alternatives for IAPSA
Input�Output Architecture Tradeoffs
Selected AIPS Candidate Description
Single-Englne Fighter Considerations
7
7
8
I0
18
18
19
23
24
24
26
26
34
38
45
51
52
54

TABLE OF CONTENTS (Continued)
SECTION PAGE
4.0 CANDIDATE ARCHITECTURE EVALUATION
4.1 Candidate Architecture Details
4.1.1 Failure Protection Details
4.2 Reliability Evaluation of Candidate
4.2.1 Failure Analysis
4.2.2 Reliability Results
4.3 Candidate Performance Evaluation
4.3.1 Development of Timing Model
4.3.2 Critical Performance Issues
4.3.3 Simulation Experiments
4.3.4 Simulation Model
4.3.5 Simulation Results
4.3.6 Experiment Observations
4.4 Refined Architecture
4.4.1 Refined System Changes
4.4.2 Reliability Evaluatlon
4.4.3 Timln E Prediction
57
60
67
71
73
81
86
86
91
94
97
i00
III
113
114
125
135
5.0 SMALL-SCALE SYSTEM
5.1 Testing Objectives
5.1.1 System Characterization: Normal Conditions
5.1.2 System Timing Characterization: Fault
Conditions
139
139
140
142
iii

TABLEOF CONTENTS(Continued)
SECTI ON
5.2 Experiment Test Configuration
5.2.1 System-Under-Test Elements
5.2.2 Test Facility Elements
5.3 Test Control Strategy
5.4 Data Collection and Analysis
5.4.1 Standard Statistical Data
5.4.2 Event Summary Data
5.5 Experimental Results
5.5.1 Experiment 10:
Characterization
5.5.2 Experiment 11:
5.5.3 Experiment 12:
5.5.4 Experiment 13:
5.5.5 Experiment 14:
5.5.6 Experiment 15:
FTP Execution Environment
System Overhead Characterization
CPIIOP FDIR Phasing Investigation
IIO Netvork Faults
FTP Faults
Transaction Selection
5.6 Small Scale System Observations
PAGE
143
I_5
145
148
149
150
151
151
153
155
162
168
198
212
212
6.0 CONCLUSIONS
6.1 Methodology
6.1.1 System Evaluation Tools
6.1.2 Performance Tool
6.1.3 Reliability Tool
221
222
224
225
227
iv

TABLE OF' CONTENTS (Continued)
SECTION
6.2 Architecture
6.2.1AIPS Building Blocks
6.2.2 Concepts Needing Attention
PAGE
228
229
232
REFERENCES
REPORT DOCUMENTATION PAGE
237
239

FIGUKES
3.1-1
LIST OF FIGURES
IAPSA II ADVANCED FIGHTER
PAGE
3.1-2 SYSTEM LIFE CYCLE PHASES 11
3.1-3 PREVALIDATION METHODOLOGY 13
3.1-4 METHODOLOGY IN ANALYZING MISSION SEGMENTS 14
3.2-1 FLIGHT-CRITICAL SYSTEM EXAMPLE 2O
3.4-1 BATTLEFIELD INTRODUCTION MISSION (BASELINE) 25
3.5-1 AIPS FAULT-TOLERANT BUILDING BLOCKS 42
3.5-2 CONFIGURATION I: QUADRUPLE FTP 47
3.5-3 CONFIGURATION 2: SINGLE FTMP 47
3.5-4 CONFIGURATION 3: MULTIPLE PTP OPTIONS 48
3.5-5 CONFIGURATION 5: FTMP AND TWO TRIPLEX FTPs 5O
4.1-1 REFERENCE CONFIGURATION OVERVIEW 61
4.1-2 FLIGHT CONTROL I/O NETVORK I LAYOUT 62
4.1-3 LEFT ENGINE I/O NETWORK LAYOUT 65
4.1.1-1 SiM%FACE ACTUATION---REFERENCE CONFIGURATION 70
4.1.1-2 PROPULSION ACTUATION 72
vi

FIGIRES
LIST OF FIGURES (Continued)
PAGE
4.2.1-1 FLIGHT CONTROL FUNCTIONS 74
4.2.1-2 PROPULSION CONTROL FUNCTIONS 74
4.3-1 PERFORMANCE EVALUATION METHODOLOGY 87
4.3-2 EXAMPLE APPLICATION---UPDATE RATE 100 Hz 88
4.3.1-1 FLIGHT CONTROL COMPUTER REVISED AIPS
APPLICATION TIMING
92
4.3.1-2 FLIGHT CONTROL COMPUTER REVISED AIPS
APPLICATION--TIMING RATE VALUES
93
4.3.1-3 FLIGHT CONTROL COMPUTER REVISED AIPS
APPLICATION TIMING
93
4.3.4-1 I/O SERVICE ACCESS CONTENTION 99
4.3.5-1 FLIGHT CONTROL COMPUTER PHASE 0 TIMELINE 103
4.4-1 REFINED CONFIGURATION OVERVIEW 115
4.4.1-1 MESH NETWORK AND LINEAR BUS OPTIONS 118
4.4.1-2 GROUP A I/O NETWORK LAYOUT 121
4.4.1-3 GROUP B I/O NETWORK LAYOUT 122
4.4.1-4 BODY MOTION SENSOR CROSS CONNECTION 123
vii
FIGURES
4.4.2-i
LIST OF FIGURES (Continued)
SAFETY MODEL TRUNCATION
PAGE
127
4.4.2-2 SIMPLIFIED MODEL 134
4.4.2-3 TRANSIENT RATIO SENSITIVITY 136
4.4.2-4 RELATIVE SCRUB RATE SENSITIVITY 136
4.4.2-5 SOFT FAULT DISABLE RATE SENSITIVITY 136
5.2-1 EXPERIMENT TEST CONFIGURATION 144
5.5-1 APPLICATION COMPUTING AND APPLICATION
I/0 ORGANIZATIONS
152
5.5.2-1 APPLICATION CYCLE 156
5.5.3-1 EXPERIMENT 12 APPLICATION PERFORMANCE PARAMETERS
OF SELECTED CONFIGURATION
166
5.5.3-2 SELECTED CONFIGURATION---ON-DEMAND I/O
SMALL-SCALE SYSTEM
167
5.5.4-1 NETWORK I AS GROWN FROM FCI, SMALL-SCALE SYSTEM 170
5.5.4-2 PROCESS REALIGNMENT--Tm%EE TRANSACTIONS 174
5.4.4-3 PROCESS REALIGNMENT---EIGHT TRANSACTIONS 178
5.5.5-1 LOSS OF SYNCHRONIZATION EXAMPLE 200
.o.
Viii


LIST OF TABLES
TABLES PAGE
3.2-1 MODEL STATUS 21
3.4-1 ANALYSIS OF BASELINE MISSION SEGMENTS 27
3.4-2 ANALYSIS OF ALTERNATIVE MISSION SEGMENTS 29
3.4-3 PFCS CONTROL EFFECTORS 3O
3.4-4 PFCS CONTROL SENSORS 31
3.4-5 SCALE FACTORS FOR SIZING ESTIMATES 33
3.4-6 MEMORY REQUIREMENTS FOR PFCS MODULES 35
3.4-7 THROUGHPUT REQUIREMENTS FOR PFCS MODULES 36
3.4-8 MEMORY AND THROUGHPUT REQUIREMENTS FOR FMS MODULES 37
3.5-1 ADJUSTED THROUGHPUT REQUIREMENTS FOR AIPS 39
3.5-2 ADJUSTED MEMORY REQUIREMENTS FOR AIPS 40
4.0-1 IAPSA II MAJOR CONTROL FUNCTIONS 58
4.0-2 COMPUTING ALLOCATION--FLIGHT CONTROL 58
4.0-3 COMPUTING ALLOCATION_GINE CONTROL 59
4.1-1 SENSOR/ACTUATOR CONNECTION--FLIGHT CONTROL NETWORKS 63
ix

LIST OF TABLES (Continued)
TABLES PAGE
4.1-2 SENSOR/ACTUATOR CONNECTION--ENGINE CONTROL NETWORKS 66
4.2.1-1 FUNCTION FAILURE ANALYSIS--FLIGHT CONTROL 76
4.2.1-2 EFFECT OF PROPULSION SYSTEM CAPABILITY ON
AIRCRAFT STATE
76
4.2.1-3 FUNCTION FAILURE ANALYSIS--PROPULSION
CONTROL LOSS EFFECT
79
4.2.1-4 COMMUNICATION DEVICE FAILURE SUMMARY 8O
4.2.2-1 SAFETY RELIABILITY 83
4.2.2-2 MISSION CAPABILITY RELIABILITY 85
4.3.3-1 EXPERIMENT CONFIGURATION 96
4.3.5-1 EXPERIMENT 4 CONFIGURATION 6 SUMMARY---FLIGHT
CONTROL GROUP
102
4.3.5-2 EXPERIMENT 4 CONFIGURATION 14 SUMMARY 104
4.3.5-3 EXPERIMENT 4 CONFIGURATION 15 SUMMARY 105
4.3.5-4 EXPERIMENT 4 CONFIGURATION 16 SUMMARY 106
4.3.5-5
4.3.5-6
EXPERIMENT 2 CONFIGURATION II SUMMARY
EXPERIMENT 2 CONFIGURATION 13 SUMMARY
108
109

LIST OF TABLES (Continued)
TABLES PAGE
4.3.5-7 EXPERIMENT 2 CONFIGURATION i0 SUMMARY 110
4.3.5-8 EXPERIMENT 2 CONFIGURATION 13 SUMMARY 112
4.4.1-1 SENSOR/ACTUATOR COMPUTER CONNECTION---GROUP A 119
4.4.1-2 SENSOR/ACTUATOR COMPUTER CONNECTION---GROUP B 120
4.4.2-1 SAFETY MODEL RESULTS (xl0-7) , "3-Hr FLIGHT 129
4.4.2-2 MISSION MODEL RESULTS (x10-4), l-Hr FLIGHT 131
4.4.2-3 SUSTAINED CAPABILITY RESULTS (xlO-2), 50 Hr 132
4.4.3-1 REFINED CONFIGURATION TIMING DATA 138
4.4.3-2 GROWTH FACTOR ESTIMATE 138
5.5.2-1 SYSTEM FUNCTION EXECUTION TIME COMPARISON--IO0
-llz RATE
157
5.5.2-1 SYSTEM FUNCTION EXECUTION TIME--NORMAL OPERATION 159
5.5.2-3 TIME TO EXECUTE SYSTEM FUNCTIONS FOR ERROR
PROCESSING---SMALL-SCALE SYSTEM
160
5.5.3-I EXPERIMENT 12 ON-DEMAND I/0 SUMMARY 164
5.5.4-1 SSS I/O NETVORK FAULTS 171
xi

LTST OF TABLES (Continued)
TABLES PACE
5.5.4-2 EXPERIMENT 13--PASSIVE INBOARD AND OUTBOARD
INTERNODE LINE FAILURE SUMMARY
173
5.5.4-3 EXPERIMENT 13---PASSIVE INBOARD AND OUTBOARD
INTERNODE LINK FAULT REPAIR TIMES
175
5.5.4-4 EXPERIMENT 13---ACTIVE INBOARD INTERNODE LINK
FAILURE SUMMARY
177
5.5.4-5 EXPERIMENT 13---ACTIVE INBOARD INTERNODE LINK
FAULT REPAIR TIMES
179
5.5.4-6 EXPERIMENT 13---ACTIVE OUTBOARD LINK FAILURE SUMMARY 180
5.5.4-7 EXPERIMENT 13---OUTBOARD ACTIVE INTERNODE LINK FAULT
REPAIR TIMES
182
5.5.4-8 EXPERIMENT 13---PASSIVE INBOARD AND OUTBOARD NODE
FAILURE SUMMARY
183
5.5.4-9 EXPERIMENT 13---PASSIVE INBOARD AND OUTBOARD NODE
FAILURE FAULT REPAIRS TIMES
185
5.5.4.10 EXPERIMENT 13--ACTIVE OUTBOARD NODE FAILURE SUMMARY 187
5.5.4-11 EXPERIMENT 13---ACTIVE OUTBOARD NODE FAILURE
FAULT SUMMARY
188
5.5.4-12 EXPERIMENT 13---PASSIVE INBOARD AND OUTBOARD, AND
ACTIVE INBOARD ROOT LINK FAILURE SUMMARY
189
xii

LIST OF TABLES (Continued)
TABLES PAGE
5.5.4-13 EXPERIMENT 13--PASSIVE INBOARD AND OUTBOARD, AND
ACTIVE INBOARD ROOT LINK FAILURE FAULT REPAIR TIMES
190
5.5.4-14 EXPERIMENT 13---ACTIVE OUTBOARD ROOT LINK FAILURE
SUMMARY
191
5.5.4-15 EXPERIMENT 13---ACTIVE OUTBOARD ROOT LINK FAULT
REPAIR TIME
192
5.5.4-16 EXPERIMENT 13--PASSIVE INBOARD DIU LINK FAILURES
NUISANCE TRIP TIME
194
5.5.4-17 EXPERIMENT 13--PASSIVE INBOARD DIU LINK FAILURE
SUMMARY
195
5.5.4-18 EXPERIMENT 13---ACTIVE INBOARD DIU LINK FAILURE
SUMMARY
196
5.5.4-19 EXPERIMENT 13---ACTIVE INBOARD DIU LINK FAULT
REPAIR TIMES
197
5.5.5-1 EXPERIMENT 14--CP LOSS OF SYNCHRONIZATION SUMMARY 202
5.5.5-2 EXPERIMENT 14--CP LOSS OF SYNCHRONIZATION FAULT
REPAIR TIMES
204
5.5.5-3 IOP LOSS OF SYNCHRONIZATION SUMMARY 205
5.5.5-4 EXPERIMENT 14--IOP LOSS OF SYNCHRONIZATION FAULT
REPAIR TIMES
206
°o,
Xlil

LIST OF TABLES (Continued)
TABLES PACE
5.5.5-5 EXPERIMENT 14--OUTPUT DISAGREEMENT SUMMARY 208
5.5.5-6 EXPERIMENT 14--_UTPUT DISAGREEMENT FAULT
REPAIR TIMES
209
5.5.5-7 EXPERIMENT 14---CHANNEL LOSS OF POWER SUMMARY 210
5.5.5-8 EXPERIMENT 14---CHANNEL PONER FAILURE
FAULT REPAIR TIMES
211
5.5.6-1 EXPERIMENT 15--TRANSACTION DESELECTION/SELECTION
SUMMARY
213
6.1-1 METHODOLOGY ELEMENTS FOR TOTAL DEVELOPMENT CYCLE 223
xiv

GLOSSARY
AIPS
AIRLAB
ATF
BIU
CAME
CARE
CP
CSDL
DENET
DEVM
DIU
DIUOTP
DPM
DX
ELMC
EPU
FDIR
FMC
FMS
FTC
FTEP
FTMP
FTP
FTPOTP
GPC
Advanced Information Processing System
Avionics Integration Research Laboratory
advanced tactical fighter
bus interface unit
Computer-Aided Markov Evaluator
Computer-Aided Reliability Estimator
computational processor
Charles Stark Draper Laboratory
Discrete Event Network
discrete event modules
device interface units
device interface units operational test program
dual-port memory
data exchange
electric load management center
emergency power unit
failure detection, identification, and reconfiguration
f_lly mission capable
flight management system
fault-tolerant clock
fault-tolerant electric power
fault-tolerant multl-processor
fault-tolerant processor
fault-tolerant processor operational test program
general-purpose computerXV

GLOSSARY (Continued)
HARP
IAPSA
IC
I/0
I0P
I0R
I0S
IOSS
PFCS
RAM
RM
SFL
SSS
SURE
SUT
VME
VMEOTP
VMS
VI_IP
VULTURE
Hybrid Automated Reliability Predictor
Integrated Airframe/Propulsion Control System Architecture
intercomputer
input/ouput
input/output processor
input/output request
input/output sequencer
input/output systems services
primary flight control system
random access memory
redundancy management
safe flight and landing
small-scale system
Semi-Markov Unreliability Range Evaluator
system-under-test
virtual memory extension
virtual memory extension operational test progran
virtual memory storage
uVAX Resident FTP Interface Program
VME Ultimate User Environment
xvi

1.0 SUM_LRY
During the detailed design effort for the IAPSA II contract, a
candidate architecture design based on AIPS fault-tolerant system building
blocks was evaluated for Its ability to meet the demanding performance and
reliability requirements of a flight-critical system. This effort was
conducted in accordance with the IAPSA II prevalidation methodology. This
methodology was defined and an advanced fighter configuration was selected
during an earlier phase of this contract. A mission analysis of the high-
performance, multirole, twin-engine fighter was conducted to define a set
of flight-critical requirements for this study during the earlier effort.
The preliminary evaluations showed that the candidate needed some
refinements to meet the system requirements. It is significant that
several weaknesses in the candidate architecture became apparent that were
not evident in the initial rough performance and reliability calculations.
This effort shows that it is both possible and preferable to perform
detailed evaluation of concepts based on specifications before committing a
project to a hardware and software design.
A refined configuration was evaluated for reliability using improved
Markov modeling techniques. Although this proved to be superior to earlier
evaluation techniques, improvements are needed in the handling of very
large systems with a hlgh degree of interdependency.
A set of objectives and experiments was defined for testing critical
performance characteristics of the architecture. A scaled down version of
the architecture (small-scale system) was built using existing proof-of-
concept AZPS building-block hardware and software components. It embodies
key features of the IAPSA II design and was used to explore critical issues
identified as a result of the performance and reliability modeling effort.
Experimental data were obtained and correlated with the performance
estimates obtained during the preliminary simulation effort.


2.0 33q'rRODUCTLON
This is the fourth and final contractor report associated with the
IAPSA II effort. This report summarizes the prevalidation methodology and
the evaluation of the candidate architecture and refined configuration in
terms of reliability and performance. The report concludes with a
discussion of the detailed experimental results obtained with a small-scale
system that was developed to capture the fundamental characteristics of the
IAPSA II design.
The IAPSA II analysis and design effort is the continuation of a
research and technology program investigating the benefits of integrated
system architectures and demonstrating the properties of promising
architectures by experimentation in the NASA Langley Avionics Integration
Research Laboratory (AIRLAB). Work under previous contracts achieved the
following: (1) defined major characteristics of an Integrated Airframe
Propulsion Control System Architecture, (2) proposed several candidate
system configurations, and (3) selected one of the configurations as a
basis for a preliminary system design.
The overall objectives of the IAPSA II program are (1) analysis and
detailed design of an integrated control system architecture that satisfies
stringent performance and reliability requirements, (2) an analytical and
experimental approach for evaluating the architecture, and (3) installation
and limited experimentation on a small-scale system test specimen in
AIRLAB.
The first phase of this contract defined an advanced fighter
configuration for analysis, a prevalidatlon methodology, and a candidate
architecture based on the use of fault-tolerant system building blocks.
The advanced fighter is a twin-engine design with a high degree of coupling
between the propulslon system and the airframe. A mission analysis was
conducted on mission scenarios for this fighter to derive the control
system requirements. These requirements formed the basis for the design of
a control system architecture.
The methods used to design and validate the control system architecture
are as important to the IAPSA II contract as the architecture itself. The
PRECED',NG PACE CL;",.,:]( _'_;OT FILMED

prevalidation methodology emphasizes the early evaluation of key
performance and reliability characteristics of system concepts using models
of system behavior. This early evaluation ensures that the system design
is capable of meeting critical requirements. System concept changes needed
to meet these requirements can then be made early when they have the
greatest performance benefit and the least Impact on schedule and cost.
Key performance and reliability assumptions identified by the modeling
effort will be tied to activities to validate the implemented system.
A candidate system architecture defined by our subcontractor, Charles
Stark Draper Laboratory (CSDL), was evaluated to exercise the methodology.
An overview of the definition of the candidate system is presented in
section 3.5. Reliability and performance issues were the main attributes
used in evaluating the candidate architecture. The reliability evaluation
effort was accomplished in four parts: (1) system operating details and
key reliability assumptions were defined to support system modeling; (2) a
failure analysis was conducted, based on the key reliability measures
(safety, mission success, etc.), to define how the system fails; (3) the
ASSIST program was used to create a corresponding failure model; and (4)
the Semi-Markov Unreliability Range Evaluator (SURE) model was executed and
its results used to indicate the candidate's strengths and weaknesses. The
reliability effort is covered in section 4.2.
The performance characteristics of the candidate architecture were
evaluated in normal and failure situations as required by the prevalidation
methodology. The evaluation effort consisted of four major parts: (i) the
key application sequencing and control options in the candidate system were
defined; (2) critical performance issues and simulation experiments were
defined for the candidate configuration; (3) a model of the critical
system workload and its use of the configuration elements was built using
the Discrete Event Network (DF_/ET) tool; and (4) the DENET experiments were
executed and the results analyzed. This performance evaluation effort is
described In section 4.3 of this report.
The candidate system evaluation shoved that it was not capable of
meeting the system requirements. The predicted safety and mission
unreliability values exceeded the system constraints. Additionally, the
4

predicted timing needs of the major control functions executed on the
concept system did not leave adequate growth capability. The flight
control group application workload strained the system capacity in both
computing and II0 activity. As a result, the IAPSA II system concept was
refined to improve its performance and reliability. The refined candidate
architecture is described in section 4.4.
Section 5.0 presents the results of experiments with the small-scale
system. The small-scale system embodies key features of the IAPSA II
design that were evaluated in a limited experimentation effort. The
limited effort explored a set of critical aspects of the IAPSA II candidate
architecture that was identified as a result of the performance and
reliability modeling effort. The small-scale system consists of existing
proof-of-concept AIPS buildlng-block hardware and software components. Two
kinds of experimental data were obtained. First, certain performance
assumptions used during the preliminary simulation effort were evaluated.
Second, certain timing characteristics critical to successful operation in
normal and faulted situations were measured experimentally. Several
observations made during the small-scale system integration and testing
effort are discussed in section 5.6. Hardware and software difficulties
exposed durin E the integration testing are included.
Section 6.0 covers general conclusions based on the IAPSA II design and
validation effort in its entirety. Our experience with the prevalidation
methodology and the use of fault-tolerant building blocks in system design
are covered.
5


3.0 PREVALIDATION METHODOLOGY AND CANDIDATE SELECTION
3.1 FREVALIDATION METHODOLOGY
Advanced vehicle management systems incorporating integrated flight and
propulsion control, flight trajectory management, control surface
reconfiguration, air-data measurement, inertial measurement, electrical and
hydraulic power control, and utility management must offer significant
improvements in life cycle cost while exhibiting operational characteristics
that enhance utility and safety. These systems must provide aircraft
availability, must be reliable, maintainable, supportable, and affordable, and
must furnish improvements in both capability and survivability. In
particular, integrated airframe and propulsion control systems will allow
significantly improved performance through better integration of the control
functions associated with aerodynamic surfaces, inlets, engines, and vectoring
and reversing nozzles.
The functions being implemented are flight critical; if the system fails,
there is a high probability of loss of aircraft. To achieve high reliability,
the hardware and software must be fault tolerant. Fault tolerance requires
protective redundancy combined with fault detection, isolation, and system
reconfiguration. Rapid advances in microelectronics and software technology
offer the system architect many implementation alternatives. However, as
demonstrated by recent military aircraft experience, the resulting hardware
and software architectures are extremely complex and are very difficult to
validate in terms of reliability and performance. Current design approaches
are inadequate for this task and limit the performance and cost effectiveness
that can be achieved. Methodologies and supporting tools must be available
for the system architect to evaluate candidate systems during the development
cycle.
For most present-day embedded computer systems with high reliability, the
hardware and software resources for achieving fault tolerance have greatly
exceeded those dedicated to the application function. This has led to
excessive system cost. Failures in the systems have been very complex because
of the technical approach used. As the reliability requirements become even
F_ _ .... INltNTK)NN_.V _t.ltNIK

more stringent, the increase in system complexity due to fault tolerance must
be minimized and the system reliability and performance validated with
acceptable cost and on a predictable schedule.
Of central importance to these advanced systems is how well the systems
perform under failure conditions. The availability of the control functions
is critical to safe flight and mission success. Failure conditions that
prevent safe flight must be highly unlikely, and failure conditions that cause
mission abort or adversely affect the aircraft's ability to survive in a high-
threat environment must be unlikely. Finally, the overall system design must
accommodate the improvements, changes, or growth in capabilities that
experience has shown to be typical during the operational life of weapon
systems.
To address these issues, a prevalidation methodology has been developed
under the IAPSA II program as a formal procedure that allows the designer to
proceed logically through the development cycle with supporting tools for each
phase of the cycle. The methodology allows the designer to address
performance and reliability questions early in the design process by modeling
the integrated system behavior. The control law requirements are derived by
analyzing the intended operational use of the system in representative mission
scenarios. Once control laws have been defined to satisfy the system
operational needs, concepts that implement the system functions are developed.
These implementation concepts are then analyzed in terms of meeting
performance and reliability requirements.
The defined prevalidatlon methodology was used to design the IAPSA II
integrated flight and propulsion control system architecture.
3.1.1 IAPSA II Aircraft
An advanced fighter configuration (an internal Boeing study configuration,
ref. 1), shown in figure 3.1-1, was selected as the application aircraft for
the current study. The aircraft is a high-performance twin-engine design with
a high degree of coupling between the propulsion system and the airframe.
This aircraft uses multiple redundant control surfaces, variable geometry
inlets, and 2D-vectored thrust nozzles. The configuration is capable of
multiple advanced air-to-ground and air-to-air missions and uses advanced

Maneuvering tlaps must be cordinatedwith thrust to initiate and sustain
high-g turns without energy loss
Canards are
used to balance
vectored
2-D nozzles provide
Jnflight thrust reversing
and vectoring
Vehicle maneuvers
affect inlet operation
Inlet/engine compatibility is dynamically
adjusted to achieve best cruise
performance and maneuver capability
Nozzle/airframe
integration producesthrust-dependent
lift and pitching
moment and
deflection-dependent
axial force
Figure 3.1-1. IAPSA II Advanced Fighter
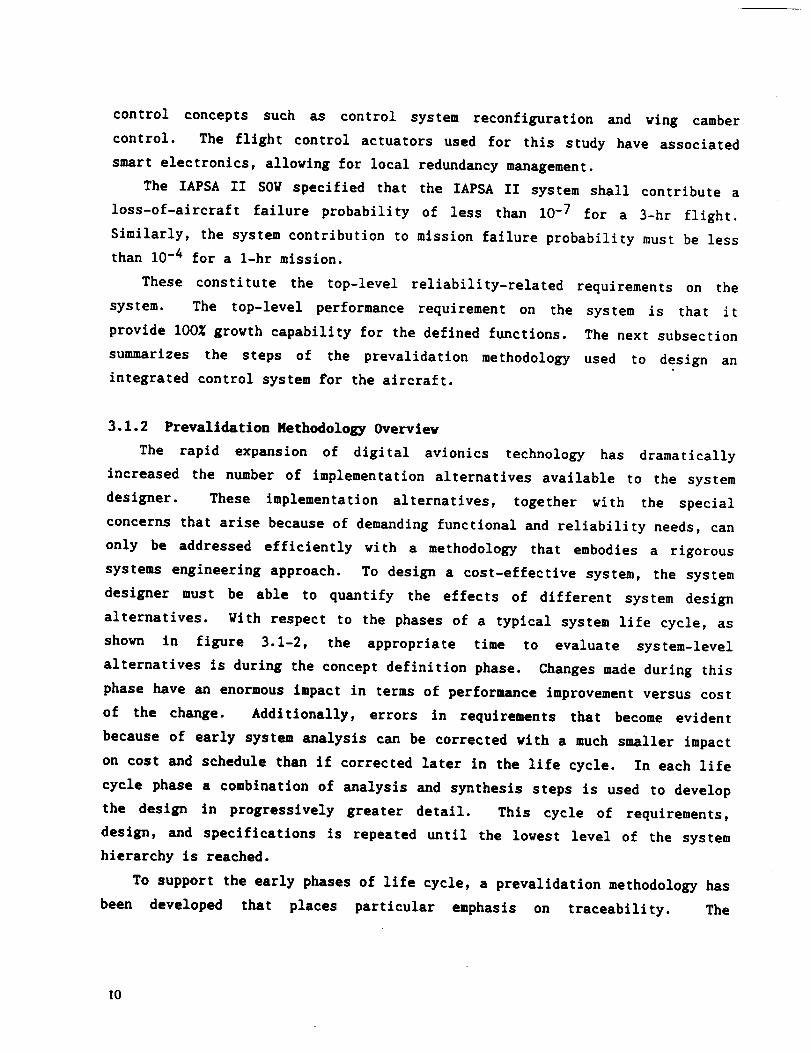
control concepts such as control system reconflguratlon and wing camber
control. The flight control actuators used for this study have associated
smart electronics, allowing for local redundancy management.
The IAPSA II SOW specified that the IAPSA II system shall contribute a
loss-of-aircraft failure probability of less than 10-7 for a 3-hr flight.
Similarly, the system contribution to mission failure probability must be less
than 10-4 for a l-hr mission.
These constitute the top-level reliability-related requirements on the
system. The top-level performance requirement on the system is that it
provide 100% growth capability for the defined functions. The next subsection
summarizes the steps of the prevalidation methodology used to design an
integrated control system for the aircraft.
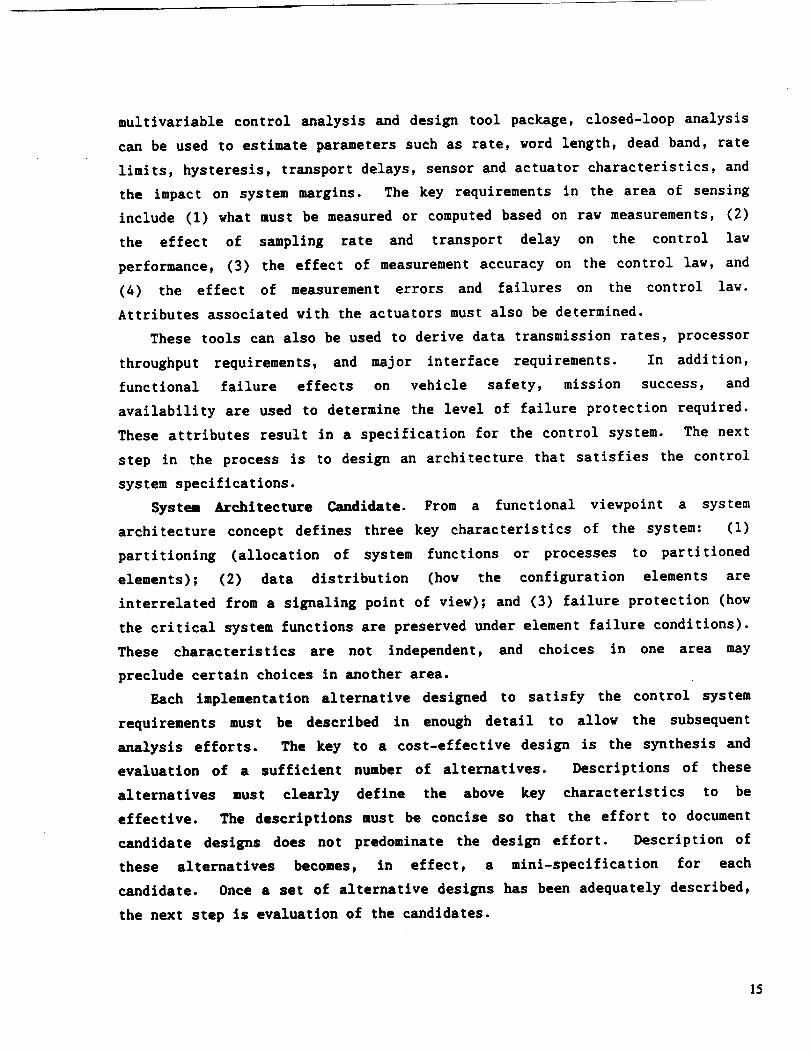
3.1.2 Prevalldation Methodology Overview
The rapid expansion of digital avionics technology has dramatically
increased the number of implementation alternatives available to the system
designer. These implementation alternatives, together with the special
concerns that arise because of demanding functional and reliability needs, can
only be addressed efficiently with a methodology that embodies a rigorous
systems engineering approach. To design a cost-effectlve system, the system
designer must be able to quantify the effects of different system design
alternatives. With respect to the phases of a typical system life cycle, as
shown in figure 3.1-2, the appropriate time to evaluate system-level
alternatives is during the concept definition phase. Changes made during this
phase have an enormous impact in terms of performance improvement versus cost
of the change. Additionally, errors in requirements that become evident
because of early system analysis can be corrected with a much smaller impact
on cost and schedule than if corrected later in the life cycle. In each life
cycle phase a combination of analysis and synthesis steps is used to develop
the design in progressively greater detail. This cycle of requirements,
design, and specifications is repeated until the lowest level of the system
hierarchy is reached.
To support the early phases of life cycle, a prevalidation methodology has
been developed that places particular emphasis on traceability. The
I0

Operational requirements analysis
tConcept definition
tDemonstration and validation
Detailed design
tProduction and deployment
tMaintenance
Figure 3. I-2. System Life Cycle Phases
]1

prevalidation methodology shown in figure 3.1-3 illustrates the iterative way
a system design typically evolves. The approach addresses performance and
reliability questions early in the design process by modeling the integrated
system behavior.
The top-down approach ensures that the system requirements drive the
resulting design. First, the functional alternatives are defined based on the
mission requirements. Second, system implementation alternatives are
developed that perform the required system functions. Third, the resultin E
candidate architectures are evaluated using performance and reliability tools
to analyze their behavior in normal and failed situations. The evaluation
effort leads to concept refinement and, ultimately, to selection and
specification of a system design.
A brief discussion of the various phases of the methodology follows.
Mission Requirements. Figure 3.1-4 illustrates how a mission scenario is
decomposed into mission segments and how drivers are formulated for these
segments. These drivers bridge the gap between the mission and the resulting
control system requirements. They also serve to explain, relate, expand, or
constrain the functional requirement. The information is organized into a
matrix, as shown in figure 3.1-4, with all the control system requirements
listed in the right column. A typical entry for the matrix might be the
following:
Mission event Driver S_stem requirement
Climbout Improve ride quality
Reduce structural
fatigue
Actively reduce airplane
dynamic loads due to gust
At this phase in the design methodology, a control system is desiEned to
satisfy the control system requirements.
System Functions. The control system functional requirements and drivers
guide the organization of the various control functions. These control
functions are separately described in terms of sensors and effectors used,
accompanied by requirements for cyclic rate of execution. With a general
12

Mission
requirements
Validation offunctior_al
requirements
Redundancy
management _
algorithms
Control law
development
System functionsrequirements
System candidatearchitecture
I_ Performance criteriaCriticality criteria
_Cost
C_inn_:_ta rne_inement
Candidate analysisusing reliability tools
Candidate analysisusing performance tools
Figure 3.1-3. Prevalidation Methodology
Modifyconceptualdetinition
13

Mission Event Sequence
Takeoff
Q Climbout
®:
Matrix Development
Mission event Driver System requirement
Detailed
Mission Control
segment actionreferences involved
Serves to bridgeevent to requirement:• Identify
pertinentrequirementsconstraints
• Identity designgoals
Iterate by function• Takeoff control
• Terrain following/terrain avoidance
Figure 3.1-4. Methodology in Analyzing Mission Segments
I.__'_Ordered by:
2.__ •Event3._ •Oriver
14
multivariable control analysis and design tool package, closed-loop analysis
can be used to estimate parameters such as rate, word length, dead band, rate
limits, hysteresis, transport delays, sensor and actuator characteristics, and
the impact on system margins. The key requirements in the area of sensing
include (1) what must be measured or computed based on raw measurements, (2)
the effect of sampling rate and transport delay on the control law
performance, (3) the effect of measurement accuracy on the control law, and
(4) the effect of measurement errors and failures on the control law.
Attributes associated with the actuators must also be determined.
These tools can also be used to derive data transmission rates, processor
throughput requirements, and major interface requirements. In addition,
functional failure effects on vehicle safety, mission success, and
availability are used to determine the level of failure protection required.
These attributes result in a specification for the control system. The next
step in the process is to design an architecture that satisfies the control
system specifications.
System Architecture Candidate. From a functional viewpoint a system
architecture concept defines three key characteristics of the system: (1)
partitioning (allocation of system functions or processes to partitioned
elements); (2) data distribution (how the configuration elements are
interrelated from a signaling point of view); and (3) failure protection (how
the critical system functions are preserved under element failure conditions).
These characteristics are not independent, and choices in one area may
preclude certain choices in another area.
Each implementation alternative designed to satisfy the control system
requirements must be described in enough detail to allow the subsequent
analysis efforts. The key to a cost-effective design is the synthesis and
evaluation of a sufficient number of alternatives. Descriptions of these
alternatives must clearly define the above key characteristics to be
effective. The descriptions must be concise so that the effort to document
candidate designs does not predominate the design effort. Description of
these alternatives becomes, in effect, a mlnl-specification for each
candidate. Once a set of alternative designs has been adequately described,
the next step is evaluation of the candidates.
15

Performance and Reliability Analysis. The performance and reliability
evaluation of the design concept is the key step in the approach. The goal is
to identify weaknesses and strengths in the alternative configurations. These
early evaluations involve tools that use high-level system behavior models to
ensure that the system design can satisfy the requirements. The modeling
effort has several benefits. Creation of the models focuses the design team's
attention on specific aspects of the system operation. This exposes missing
requirements and implicit design assumptions. (The system concept
descriptions must contain enough detail to ensure that the performance and
reliability models can be defined.) The evaluation will demonstrate that the
design meets the critical system performance requirements before the more
detailed development phase begins. The following paragraphs describe the
performance and reliability evaluation effort in greater detail.
Performance Analysis. The first step in this analysis is to characterize
the workload demands on the control system. The allocation of processing
functions to computing sites and the allocation of sensors and actuators to
input/output networks allows definition of the system workload. The workload
is defined in terms of a sequence of subfunctions arranged in prerequisite
order necessary to implement each control function. The focus is the
processing workload required for control law computation and the data transfer
demands necessary for sensor sampling and commanding actuator movement. This
workload has many associated timing constraints, including control cycle
frequency and transport delay limits from each sensed parameter to each
control actuation. There are also requirements for the jitter allowed in the
periodic execution of control cycles.
The IAPSA II system, for example, has several control functions, each
requiring cyclic execution at a different rate. From the application
perspective, the various control functions appear to compete for use of system
resources to accomplish their function. The system-level mechanism for
allocating the system's shared resources (for processing, data transfer, etc.)
is therefore of fundamental interest in real-tlme performance analysis. In
most computers, any centralized sequencing and control actions involve
hardware and special software, usually organized as part of the system
executive or operating system; this must be included in the performance
analysis.
16
The use of performance tools is relatively new to the field of flight
system analysis. Discrete event simulations are generally used for simulating
those systems for which time is not an explicit variable in the simulation
equations, such as bus contention, word length considerations, operating
system design, and reconfiguration strategies for fault-tolerant systems. As
part of the IAPSA II study, various performance tools were evaluated and one
selected to support the prevalidation methodology. This effort is described
later in this section.
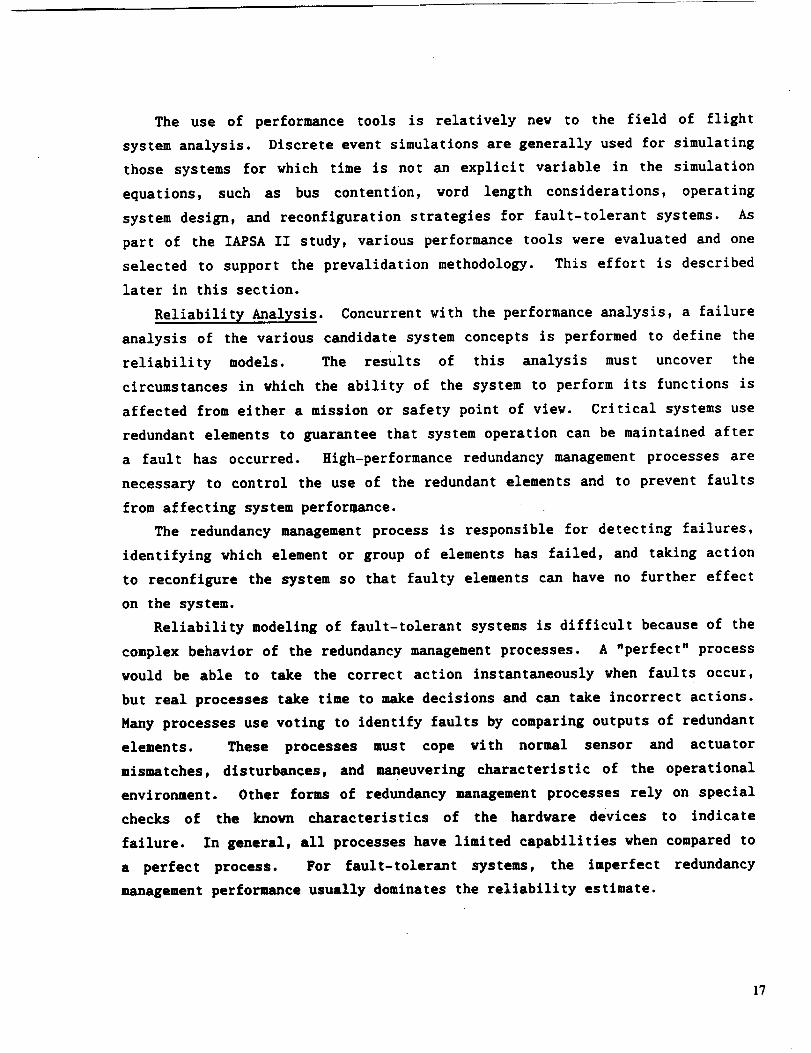
Reliability Analysis. Concurrent with the performance analysis, a failure
analysis of the various candidate system concepts is performed to define the
reliability models. The results of this analysis must uncover the
circumstances in which the ability of the system to perform its functions is
affected from either a mission or safety point of view. Critical systems use
redundant elements to guarantee that system operation can be maintained after
a fault has occurred. High-performance redundancy management processes are
necessary to control the use of the redundant elements and to prevent faults
from affecting system performance.
The redundancy management process is responsible for detecting failures,
identifying which element or group of elements has failed, and taking action
to reconflgure the system so that faulty elements can have no further effect
on the system.
Reliability modeling of fault-tolerant systems is difficult because of the
complex behavior of the redundancy management processes. A "perfect" process
would be able to take the correct action instantaneously when faults occur,
but real processes take time to make decisions and can take incorrect actions.
Many processes use voting to identify faults by comparing outputs of redundant
elements. These processes must cope with normal sensor and actuator
mismatches, disturbances, and maneuvering characteristic of the operational
environment. Other forms of redundancy management processes rely on special
checks of the known characteristics of the hardware devices to indicate
failure. In general, all processes have limited capabilities when compared to
a perfect process. For fault-tolerant systems, the imperfect redundancy
management performance usually dominates the reliability estimate.
17

Additionally, the sequence and timing aspects of the faults are important
when redundancy management behavior is modeled. For this reason most
reliability tools designed for fault-tolerant systems use Markov model
approaches. As part of the IAPSA II study, reliability tools were evaluated
to support the prevalidation methodology. This evaluation is described next.
3.2 REIJABILIT_TOOL E_ALOATION
A special task was performed early in this study to evaluate two
reliability prediction tools that had been developed for analysis of fault
tolerant systems. These tools are the Computer Aided Reliability Estimator,
CARE III (ref. 2), and the Semi-Markov Unreliability Range Evaluator, SURE
(ref. 3). Both tools were sponsored by NASA Langley Research Center. An
attempt was made to evaluate the Hybrid Automated Reliability Predictor, HARP
(ref. 4), but the version available in late 1985 could not support the
evaluation study.
The screening task approach was to analyze a single representative system
architecture using both tools. The purpose was to determine the relative
strengths and weaknesses of the tools in an analysis environment.
During the concept definition phase of a design a system architecture is
defined primarily in functional terms. From a functional standpoint, a system
architecture defines three key characteristics: function partitioning, data
distribution, and failure protection. These aspects are not independent;
changes in an architecture viii affect more than one area. There are many
alternatives used by system designers in these three areas. Therefore, a
general purpose rellabiilty tool must be able to model the effect of these
alternatives. Since failure protection is central to flight-critical
architectures, the tool evaluation effort emphasized the analysis of a wide
range of redundancy management strategies.
3.2.1 Flight-Critical SyatmEx_ple
As stated previously, the approach used in selecting a reliability tool was to
apply the tools to a fllght-crltlcal architecture example. Although the
example concept was representative, it contained a mixture of lower level
concepts that would not typically appear in a single system. (For example,
18¸

the sensor computers are based on a self-checking-pair philosophy while the
control law computers are redundancy managed by downstream elements.) In this
way the example architecture provided a more thorough exercise of reliability
tool capabilities.
The flight-critical system example implemented a pitch control function
that provided pitch maneuvering capabilities over the normal flight envelope
for a relaxed stability aircraft. It is therefore critical to flight safety
at all times. To limit the scope of the study, the stabilizer control
function was not included and the fault analysis effort was restricted to the
flight safety condition for the normal control function. A backup control
system was not modeled.
Figure 3.2-I shows the resulting system and includes nomenclature for the
system elements. A more detailed description of the system, its various
redundancy management concepts, and the system failure analysis is presented
in reference 5.
3.2.2 Evaluation Results
SURE and CARE III reliability models were created for the flight-critical
system example. Details of this effort are discussed in reference 5. The
tool evaluation did not cover certain aspects of a typical design effort, such
as design iterations, different failure conditions or sensitivity studies.
Similarly, certain aspects of fault-tolerant systems were not modeled, such as
transient or intermittent faults. However, as a result of the evaluation some
key differences in the programs became clear.
Characteristics of the tool evaluation reliability models are shown in
table 3.2-i. The table shows that the SURE program was able to model more
kinds of failure vulnerability than the CARE III program. It was noted,
however, that the SURE modeling effort was very time consuming. The
flexibility that alloys capture of widely varied behavior causes a
corresponding additional effort to validate the resulting _custom _ model. By
comparison, behaviors that areemulated by proper selection of parameters in
the more rigidly defined CARE III fault-handling model should result in a
validated model.
19

Legend:
ISA
ADS
IRADC
PCS
CLC
ECE
ESA
EAS
IRADC
PCS
,t 'IESA
I
"_=IECE _l EAS J._
I EAS-I
Inertial sensor assembly (contains body motion sensors BMS)Air data sensors
Inertial reference air data computer
Pilot control sensors
Control law computersElevator control electronics
Elevator surface actuator
Elevator actuation sensors
Figure 3.2-1. Flight-Critical System Example
20

Table 3.2-1. Mode/Status
Modeling SURE CARE IIIi
ADS• Sensor exhaustion
• Nearly simultaneous faults
• Self-monitor failure sequencedependence
• Self-monitor second failure
coverage
• False sensor isolation
/
,f
/
Modeled as constant fractional
parameter
BMS
• Sensor exhaustion
• Gyro and accelerometerdependency on data link
• Nearly simultaneous faults
• False sensor isolation
IRADC• Element exhaustion
• Dependence on VS bus
• Dependence on CLC bus terminal
PCS• sensor exhaustion
• Nearly simultaneous faults
• Self-monitor failure sequencedependence
• Self-monitor second failure
coverage
• False sensor isolation
• Dependence on I/S bus
• Dependence on computer busterminal
/
/
/
Simultaneous sensor faults
Lumped failure rate of all serieselements
,f
Not modeled
/
/
Modeled as constant fractional
parameter
,t"
/
Not modeled
/
/
Not modeled
Not modeled
Not modeled
Sensor exhaustion dependence ondata link sequence not modeled
Result approximated by usingindependent set of links for gyrosand accelerometers
Results must be adjusted clue tomodeling data link faults as seperatefault type
Not modeled
!Same as SURE
,(
/
/
,f
Not modeled
Not modeled
Not modeled
,r
21

Table 3.2-I. Model Status (Continued)
Modeling SURE CARE III
CLC• Element exhaustion
• Nearly simultaneous faults
Surface control•Actuation channel exhaustion
• Two-channel failure due to
disengage device failure
• Two-channel failures due toundetected actuation faults
• Dependence on I/S bus
• Dependence on CLC bus terminals
/
/
,{
.f
/
/
Not modeled
"Cold spare" modeled with samefailure rate as active element
/
/
/
Not modeled
/
/
22
Both programs had some problems handling the dependency aspects of the
flight-critical system example. The full dependency was much easier to model
using the CARE III fault tree and multiply occurring event capability. A
problem was that it was necessary to decompose the stages of replicated
elements into individual modules. In the SURE effort, dependency was handled
by building a large combined model out of the small section models. This step
caused the number of states and program execution time to increase
geometrically.
The SURE tool was selected for use during the detailed design phase of the
IAPSA II study, primarily based on the flexibility shown during the tool
evaluation effort. The ability to handle novel redundancy management
strafegies was considered valuable enough to justify any additional model
validation effort. Development of practical modeling techniques to minimize
this additional effort then became a priority during the architecture
evaluation effort.
3.3 PERFOP_CE TOOL EVALUATION
Another key aspect of the prevalidation methodology is the evaluation of
the critical performance aspects of candidate architectures. The ability of a
flight critical system to meet the critical application timing needs during
normal operation and during special situations such as mode changes or fault
recovery must be evaluated.
Functional simulations which represent the key characteristics of the
system candidate were investigated for this purpose. Methods based on
discrete event simulations where the key system actions are represented as a
sequence of events appeared most promising. Eight available discrete event
performance tools were evaluated to support the methodology. The key
requirements in evaluating the tools were (1) ability to implement key
algorithms, (2) flexibility of representation, (3) modularity, and (4) ease
and flexibility of data collection and data analysis.
Test case evaluations were made of the Adas, Network 2.5, T-Prolog, and
Discrete Event Network (DENET) performance tools. The test case covered the
operation of a small portion of a reconflgurable network. As a result of the
evaluation, the DENET simulation language developed at the University of
23

Visconsin was chosen as the IAPSA II analysis tool. This selection was based
on its capability to include algorithms vithln a flexible simulation
environment.
The next section describes the first step in applying the prevalidation
methodology to the IAPSA II aircraft.
3.4 NISSIONREOUII_S AND SYSTEM FUNCTIONS
The IAPSA II control System design was derived through a top-down method
that develops control system requirements from mission requirements. A
representative control system was chosen to meet the derived requirements.
Representative control system modules and flight management system (FM$)
modules were defined and requirements were allocated to them. Analytic
methods were derived and used to estimate memory and throughput requirements
for the representative control system modules.
3.4.1 Mission analysis
The mission requirements for an advanced fighter are best expressed with a
set of possible mission scenarios. These scenarios describe the intended use
of the advanced fighter and its operational environment. The mission
scenarios were examined by individual segments to determine common or related
elements.
As discussed earlier, the IAPSA II study aircraft is capable of multiple
advanced missions. The missions include supersonic, low-level penetration;
subsonic weapon delivery; subsonic alr-to-alr combat; various air-to-ground
scenarios; and supersonic, hlgh-level cruise and weapon delivery.
Our mission analysis experience indicates that there is a great deal of
overlap in mission requirements derived from the multiple missions of an
advanced fighter aircraft. The baseline mission shown in figure 3.4-i is
based on a battlefield interdiction mission. The segments of this baseline
mission cover most of the segments of the multiple missions with a few
exceptions. Two alternative missions to the baseline, a counterair mission
and a high supersonic alr-to-ground mission, provide additional mission
segments which completely cover the mission requirements.
24

@ ®A
TakeoffClimbCruiseDescent
Penetration ingressCombat
EgressClimbCruiseDescent
Landing
®9
Lv
®
A115 nmi
Taxi, takeoff, establish climbClimb on course, intermediate power, to 34,000 1t,Mach 0.85Cruise at Mach 0.85 at 34,000 ftDescend and accelerate to Math 1.2Penetrate at sea level at Mach 1.2
Drop ordnance, rail power at Mach 0.8, 3,000 ftMath 1.2 at sea levelClimb and decelerate to Mach 0.85 at 34,000 ftCruise back Mach 0.85 at 34,000 ft
Descend to landing approachLand, usable runway is 1,500 to 2,000 !tTotal mission time = 0.75 hr
Figure 3.4-1. Battlefield Interdiction Mission (Baseline)
50 nmiA
25
The mission segments were analyzed to derive the control system
requirements. Figure 3.1-4 shows how the mission segments are examined
individually and how drivers are formulated for these segments. These drivers
bridge the gap between the mission event and the resulting control system
requirement. The information is organized into a matrix as shown in
figure 3.1-4 with all the control system requirements listed in the right-hand
column.
Table 3.4-1 presents the analysis results for the baseline mission. The
numbered segments correspond to the numbers of the segments in figure 3.4-1.
Table 3.4-2 shows the analysis of the alternative mission-unique segments.
These matrices summarize the control system requirements that are necessary to
satisfy the mission requirements.
3.4.2 Control System Functional Grouping
The control system functions were grouped in either the primary flight
control system (PFCS) or the FMS. The PFCS functions provide inner loop
stability and control and follow manual or automatically generated trajectory
commands. The FMS functions are limited to generating the trajectories that
are then used to provide commands to the PFCS. The PFCS functions are divided
into eight representative control modules. These modules use the actuators
and sensors shown in tables 3.4-3 and 3.4-4.
The FMS functions are organized into four main parts. These partitions
are 3D and 4D trajectory generation, autoland trajectory generation, flight
envelope generation, and combat trajectory generation.
3.4.3 Control System Computational Sizing gstimtes
Computer sizing estimates were generated based on the representative
flight control modules. An important aspect in estimating computer workloads
for future systems is the uncertainty involved vlth implementation of the
control systems. To reflect this uncertainty, scale factors were included as
multipliers to the memory and throughput estimates.
The scale factors listed in table 3.4-5 represent high and low multipliers
for the three categories of data memory, code memory, and throughput. These
scale factors are generated for the PFCS and FMS estimates and are discussed
in more detail in reference 5.
Z6

Table 3.4-1. Analysis of Baseline Mission Segments
Mission segment Control action Driver Control system requirements
QTakeoff
Q and {_Climb
Q and QCruise
Q and QDescent
Accelerate to
takeoff speedand departrunway
Ascend tocruise altitude
and speed
Cruise_olter
Descend to
penetrationlevel andaccelerate to
required speed
Short ground roll (less than1,500 ft)Battle damage to runwayLow maintenance airfield
Narrow runwayCrosswind conditions
Ride qualityEase pilot workloadTime constraints
Fuel consumption
Ease pilot workloadFuel consumptionTotal temperature limitationsRide qualityMinimize drag
Fast descent
Ease pilot workloadRapid change in specific energyRide qualitySpiral approachControl engine stall margins
Engine power settingNosewheel steeringSet T/O trim
Envelope limitingSet runway centerlineSet envelope limits
Engine power settingManual trim
Speed controlEnvelope limitingGust alleviation
Trajectory controlAuto trim
Generate envelope limitsClimbout speed settingTrajectory generationCompute minimum time climbTarget altitude
Generate trajectories
Speed controlFlutter suppressionRange/endurance/time optimizationManual trimAutomatic trim
Envelope limitingControl liftGust alleviation
Trajectory control
Cruise speed settingTarget attitudeGenerate BVR trajectoriesGenerate envelope limits
Speed controlControl liftGust alleviation
Flutter suppressionTrajectory generationGenerate envelope limitsManual trimAutomatic trim
Envelope limitingTrajectory control
Engine power settingTarget altitudeBlended engine/inlet control
27

Table 3.4-1. Analysis of Baseline Mission Segments (Continued)
Mission segment Control action Driver Control system requirements
TF/TNOAQ and 0Low level
ingress/egress
®Combat
Pop up/storesrelease/damageassessment
Final approachand touch down
with roll to stop
Stay at minimum altitudeSupersonic speedsPrecise trackingLateral maneuvering throughterrain
Ease pilot workload for missionpreparationThreat evasionSurvivable controls
Quick. hard maneuversStructural limitationsFuel constraints
Total temperature limitsRide qualityRapid speed changesTight path following
High maneuverabilityHigh-g maneuversGust control
Night and all-weather operationAccuracy of stdkePrecise maneuveringRapid maneuveringGust control at releaseFlutter at store releaseSurvivable controls
Ease pilot workloadRapid maneuveringRide qualityAccuracy of strikeTight path following
All weather approachesSTOL operation
Accurate placement on runwayEase pilotworkloadWave off from any altitudeCrosswind condition
Damaged narrow runwayShort roliout (1,500 to 2,000 ft)
Rapid speed changesTight path following
Trajectory generationRapid-maneuver controlTrajectory controlReconfigurable control systemEnvelope limiting
Maneuver load limitingTF/TA/OA trajectory generationThreat evasion trajectory generationAutomatic and manual trim
Blended inlet/engine controlEnvelope limit generationControl liftGust alleviationControl lift
Flutter suppressionNozzle control
Speed control
Speed controlTrajectory controlRapid-maneuver controlBlended inlet/engine controlManeuver load limitingFlat tumDirect forceGust alleviation
Flutter suppressionVelocity vector controlAttitude nulling
Position nullingEnvelope limitingReconfigurable control systemManual and automatic trim
Weapon trajectory generationThreat evasion trajectory generationEnvelope limit generationFire/flight/trajectory integrationNozzle control
Fuselage pointing
Speed controlEnvelope limit generationVelocity vector controlDirect forceAutomatic trim
Attitude nullingTrajectory controlManual trim
Approach trajectory generationGust alleviation
Flare trajectory generationRunway centedine trajectory generationEnvelope limiting
28

Table 3.4-2. Analysis of Alternative Mission Segments
Mission segment Control action Driver Control system requirements
®Air-to-aircombat
(_and (_
High levelingress/egress
@High-levelweapondelivery
Maximize on-target timeRapid maneuversReduced time to get back to firing
positionHigh-g maneuversExpanded missile firing envelopefor large a, p maneuversReduced flutter when missile,is
released
Total temperature limitationsQuick transition to/from pointingcontrol
Control engine stall margin
Air combatmaneuvers
Supersonic speedsEase pilot workload for missionpreparationFuel constraints
High-altitudepenetration
Stores release
Total temperature limitsThreat evasion
Ride quality
Supersonic speedsAccuracy of stdkePilot aidingGust control at releaseFlutter as store is released
Varying cg
Fuselage pointingRapid-maneuver controlFlutter suppressionGust alleviation
Blended engine/inlet controlBVR trajectory generationWeapon trajectory generationFlat turn
Speed controlDirect force
Generate envelope limitsManeuver load limitingEnvelope limitingNozzle control
Trajectory generationTrajectory control
Range/endurance/time optimizationGenerate envelope limitsManual trim
Trajectory controlBlended engine/inlet control
Envelope limitingFlutter suppressionGust alleviationAutomatic trim
Generate envelope limitsVelocity vector controlBlended engine/inlet controlFlutter suppressionGust alleviation
Weapon trajectory generationEnvelope limitingTrajectory control
29

PFCS module
Table 3.4-3. PFCS Control Effectors
Surfaces Inlets Engine Nozzle
A
_ -- _ 0 _ _ ._ =
¢M u) v • "10 •A
. __ __ ° o _ _. ° o o o0 ._ u_ u. n" Z _= m u. _ u. Z
1. Flutter suppression
2. Trim controller
3. Trajectory following
4. Wing camber control
5. Manual control
6. Inlet control (2)
7. Engine control (2)
8. Nozzle control (2)
X
X
X
X X
X X X
X X X
X X
X X X
X
X
X
X
X
X X X
X"
X
X X
30

Table 3.4-4. PFCS Control Sensors
PFCS module
Flutter Trim Trajectory Inlet Engine NozzlePFCS sensors suppres- control control control
sion controller follow!ng (2) (2) (2)
Inertial data• Normal acceleration• Normal acceleration
resolved to verticalcoordinates
• Pitch rate• Pitch rate resolved
to vertical coordinates
• Pitch angle• Rate of climb• Forward acceleration• Altitude• Lateral acceleration
• Roll angle• Roll rate• Yaw rate
• Heading angle
Air data
• Angle of attack• Sideslip angle• Total airspeed• Mach
• Dynamic pressure• Static pressure
• Flutter
accelerometers (6)• LEF positions (6)• Flaperon positions (4)• Flap positions (2)• Canard positions (2)
• Rudder positions (2)• Pitch axis stick
position• Roll axis stick
position• Rudder pedal
positions
• Power level angle• Nose wheel position
Inlets'. Normal shock static
pressure (2)• Normal shock total
pressure (2)• Local Mach (2)• Ramp positions (4)• Bypass door
positions (2)
X
X
XX
XX
XX
XX
X
XXXXX
XX
X
XX
X
X
Wing Manualcamber controlcontrol
X X
X
X
XX
X
X
XX
X
X
X
X XX X
XXX
X
X
X
XX
X
XX
X
X
XXX
XX
X
X
3]

Table 3.4-4. PFCS Control Sensors (Continued)
PFCS module
PFCS sensors Flutter Trim Trajectory Inlet Engine Nozzlesuppres- controller following control control controlsion (2) (2) (2)
Engines• Gas generator fuel
flow (2)• A/B fuel flow (2)• Burner pressure (2)• A/B pressure (2)• Fan face pressure (2)• Fan face
temperature (2)• Turbine
temperature (2)• Low pressure rotor
speed (2)
• High pressure rotorspeed (2)
• Fan vane
position (2)• Compressor vane
position (2)
Nozzles
• Convergent flapposition (2)
• Upper divergentflap position (2)
• Lower divergentflap position (2)
X
X
X
Wing Manualcamber
controlcontrol
X
X
X
X
XXX
XX
X
X
X
X
X
X
X
X
X
X
X
32

Table 3.4-5. Scale Factors for Sizing Estimates
Scale factor Low High
Memory
• Data storage• Growth potential• Ada (from RATFOR)• Double-preoision data• Order reduction of controller
• Product
• Code storage• Growth potential• Ada
• Logic, redundancy management, and reconliguration logic(from base control law)
• Product-
Throughput• Growth potential
• Ada
• Logic, redundancy management, and reconliguration logic(from base control law)
• Order reduction of controller• Product
2.01.01.0
O40.8
2.01.0
1.6
3.2
2.0
1.2
2.0
..E.52.4
2.01.51.5
1.._554.5
2.02.03.5
m
14.0
2.0
1.6
5.0
1.016.0
Note: Reconfiguration data memory requirements are satisfied by system mass memory.
33
The data storage requirements for the PFCS control functions were
estimated based on a generic modern controller structure, reorganized for
storage efficiency. The number of non-zero controller variables was derived
in reference 5 based on the number of estimated inputs, outputs, and states.
Additionally, the number was adjusted for controller order reduction. The
results, reflecting the effect of the uncertainty scale factor, are presented
in the data memory columns of table 3.4-6.
The code storage requirements for the PFCS modules are based on the
estimated number of lines of code for each module. This estimate is
extrapolated from existing digital control system software (ref. 6), which
implements a longitudinal augmentation system. The ratio of lines of code to
storage is used to compute the memory requirements listed in the code memory
columns in table 3.4-6. These columns reflect the scale factors discussed
earlier.
The PFCS function throughput requirements were derived using the generic
modern controller structure. Thenumber of arithmetic and logic operations
needed was determined and the uncertainty scale factor applied. The detailed
derivation is presented in reference 5. The resulting throughput needs are
shown in table 3.4-7.
The sizing of the FMS system was estimated based on flight management
software developed at Boeing (ref. 7). Some slightly different techniques
were used in the derivation based on the nature of FMS functions. These were
reflected in the throughput equation and scale factors. The results are
presented in table 3.4-8.
3.5 AR(_CANDIDATE SELECTION
This section describes the selection of an architecture concept to satisfy
the requirement given in section 3.3 and 3.4. A principal guideline was that
the embedded system architecture must be consistent with the validation
methodology development goals of this study. Another guideline was that the
computer system use the fault-tolerant concepts developed by the Advanced
Information Processing System (AIPS) project and that it use basic AIPS
building blocks. Since the AIPS architecture is inherently flexible and must
34

co
Q)
0
E0
E
r-
¢D
EE
"_ 00 .-J
0
cD
0
E
0
_D "J
n"
o ®
c/)
"5
o.o
00e-
Od
0 0 0 0 0 0 0 q"
_- 0,1 CO U') 0.1 _ 0,1 U')
0_. U')
_O CO
Od 0
0 0 0 0 0 0 0 00 0 0 0 0 0 CO
• - _- C'_ _" CO _"
O4 e_ 0 C_I CO OJ 0 '_
C_
c_(D(M
C_
c-
O
e"
t-O
"0
C_
U)
0
_n o
II U)
.p,,.
E_
_E
4- ®
+ E -'_
m o.
•-_ _ o o
- _o_
i i --,_ _ -__;7", I-- " UJ "_ ,_ ,_
_. _--o o =E
35

e_
r-
Eo_
¢,n
=P,
oa_
!__ "i_ "
o° _ _ _ _
c ¢
_ o
_ •II
0 _
I! e'_
_ 3_ 5
_ 0
4- 0
e_ "2K __.+ _E
o.uo¢
36

E
.J
• . °
.o0 0 0 0
Q
2u
U _e-
_ -_ _i"_ .
_ E. _-- _'_ _
I" _ _ ¢) _m _
3?

be tailored for a particular application, the selection effort concentrated
on assembling the particular AIPS building blocks into an architecture that
best satisfied the IAPSA control system requirements.
It is expected that if the AIP$ architecture is used on a new aircraft, it
will be the basic architecture for the electronic system of the entire
aircraft. The approach taken in this study however, was to define an AIPS
system architecture that meets only the IAPSA requirements with the assumption
that the resulting system represents a segment of the total system. The
segment of the system thus defined will meet all IAPSA requirements as a
standalone system.
The selection of a candidate architecture for IAPSA was guided by
considerations of reliability, availability, maintainability, and damage
tolerance. Design guidelines ensured that the selected architecture was
properly representative of an integrated digital flight control system for a
1990s advanced tactical fighter (ATF) and supported the validation
investigation goals of this study. Finally, the AIPS configuration physical
dispersion features were used to minimize susceptibility to battle damage.
The throughput and memory estimates for mode logic and software-
implemented fault tolerance were adjusted for an AIPS implementation in
reference 5. Fault tolerance in AIPS is an inherent feature of the
architecture. A large percentage of the processing power required to provide
fault tolerance is supplied with dedicated hardware and does not need to be
included as a part of the processing load. The resulting adjusted estimates
for throughput are given in table 3.5-1.
A similar adjustment was made for the memory requirements of the control
modules. The resulting estimates are presented in table 3.5-2.
3.5.1 *TPS Systes Description
AIPS is designed to provide a fault- and damage-tolerant data processing
architecture that meets aeronautical and space vehicle application
requirements. The requirements for seven different applications are described
in the AIPS system requirements (ref. 8). The requirements can be divided
into two categories: quantitative and qualitative. Examples of the former are
processor throughput, memory size, transport lag, mission success probability,
38
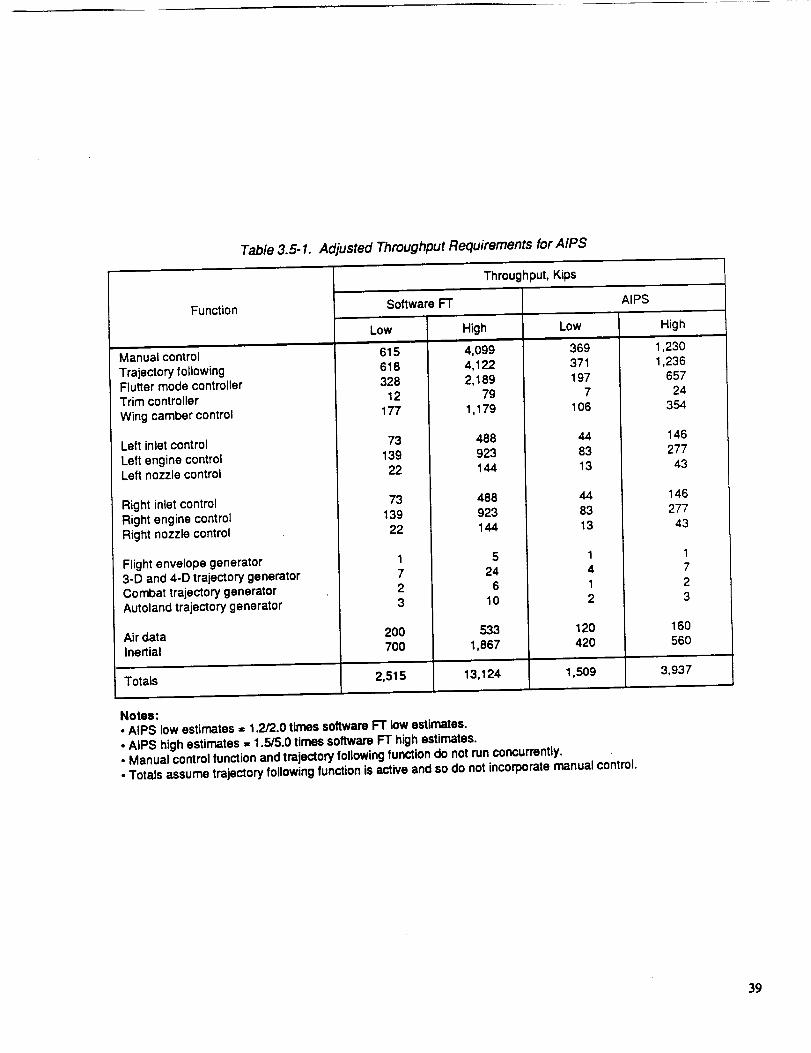
Table 3.5-1. Adjusted Throughput Requirements for AIPS
Function
Manual control
Trajectory followingFlutter mode controllerTrim controller
Wing camber control
Left inlet control
Left engine controlLeft nozzle control
Right inlet controlRight engine controlRight nozzle control
Flight envelope generator3-D and 4-D trajectory generatorCombat trajectory generatorAutoland trajectory generator
Air dataInertial
Throughput, Kips
Software FT AIPS
Low High Low High
615
618328
12177
7313922
7313922
200700
4,0994,1222,189
79
1,179
488923144
488923144
524
610
533
1,867
369371
1977
106
448313
44
8313
120420
1,2301,236
65724
354
146277
43
146
27743
160560
Totals 2,515 13,124 1,509 3,937
Notes:• AIPS low estimates = 1.2/2.0 times software FT low estimates.
• AIPS high estimates = 1.5/5.0 times software FT high estimates.
• Manual control function and trajectory following function do not run concurrently.• Totals assume trajectory following function is active and so do not incorporate manual control.
39

Table 3.5-2. Adjusted Memory Requirements for AIPS
Function
Manual control
Trajectory followingFlutter mode controller
Trim controller
Wing camber control
Left inlet control
Left engine controlLeft nozzle control
Right inlet controlRight engine controlRight nozzle control
Flight envelope generator3-D and 4-D trajectory generatorCombat trajectory generatorAutoland trajectory generatorFMS library routinesAir dataInertial
Totals
Memory, KB
Data Memory Totals
Low High Low High
7192
12
37
4O107
94
12
2152
2152
2O8
Low High
38 9658 14419 485 12
10 24
7 1838 96
9 22
7 1838 96
9 22
14 3672 18096 24058 144
72 18016 3240 80
606 1,487
467721
612
841
9
841
9
1472965872164O
643
Notes:
• AIPS data memory estimates = software FT data memory estimates.• AIPS low code estimates = 1.2/1.6 times software FT low code estimates.
• AIPS high code estimates = 1.5/3.5 times software FT high code estimates.
136251
571636
20
11124
2011124
361802401441803280
1,695
40

and so on. Examples of the latter are graceful degradation, growth and change
tolerance, integratibility, and so on. The AIPS architecture is intended to
satisfy the quantitative requirements and also have attributes that make it
responsive to the qualitative requirements.
The system is composed of hardware building blocks, as shown in
figure 3.5-1. These are fault-tolerant processing elements, a fault- and
damage-tolerant intercomputer network, an input/output (I/0) network, and a
fault-tolerant power distribution system. A network operating system ties
these elements together in a coherent system.
The system is managed by a global computer that allocates functions to
individual processing sites, performs system level redundancy management (RM)
and reconfiguration, and maintains knowledge of the system state for
distribution to the component elements. Redundancy management, task
scheduling, and other local services at individual processing sites are
handled by local operating systems. The network operating system links local
operating systems together for such functions as intertask communications.
The AIPS architecture permits application designers to select an
appropriate set of the building blocks and system services and configure a
specific processing system for their application. The number and type of
building blocks and their configuration will be determined by the specific
applications requirements. The application designer need not include all the
building blocks that have been identified as a part of the AIPS system.
A system overview is presented in reference 5; highlights are discussed in
the following paragraphs.
Overview. AIPS consists of a number of computers that may be physically
dispersed throughout the vehicle. These processing sites are linked together
by a reliable and damage tolerant data communication bus called the
intercomputer (IC) bus.
A computer at a given processing site may have access to varying numbers
and types of IlO buses. The IlO buses may be global, regional, or local.
Input/output devices on the global IlO bus are available to all, or at least a
majority, of the AIPS computers. Regional buses connect If0 devices in a
given region to the processing sites located in their vicinity. Local buses
connect a computer to the IlO devices dedicated to that computer.
41

I/O
FTP (3)
Add-on
FTP (3)
VO
FI"P(3)
FTP(3)
Legend:FTPNl/O
F'rP(2)
Gateway
Fault-tolerant processorNetwork node
Input-output network to sensors-actuators
Figure 3.5-1. AIPS Fault-Tolerant Building Blocks
42

General-purpose computers (GPC) at various AIPS processing sites may have
varying capabilities in terms of processing throughput, memory, reliability,
fault tolerance, and damage tolerance. A triple redundant GPC is available
for those functions requiring fault masking. GPCs can be made damage-tolerant
by physically dispersing redundant GPC elements and providing secure and
damage-tolerant communications between these elements. Vithin AIPS, computers
of varying levels of fault tolerance can coexist so that less reliable
computers are not a detriment to more reliable computers.
Fault Tolerance. A considerable amount of hardware redundancy and
complexity is associated with each of the elements shown in figure 3.5-1.
This redundancy allows each hardware element to be reliable, fault tolerant,
and damage tolerant. From a software viewpoint, however, the underlying
complexity of the system is transparent.
Hardware redundancy in the AIPS is implemented at a fairly high level,
typically at the processor, memory, and bus level. The redundant elements are
always operated in tight synchronism, which results in exact replication of
computations and data. Fault detection coverage with this approach is 100%
once a fault is manifested. To uncover latent faults, temporal and diagnostic
checks are employed.
Fault detection and masking are implemented in hardware, while fault
isolation and reconflguration are largely performed in software with some help
from the hardware. This approach has flexibility in reassigning resources
after failures are encountered, and yet it is not burdensome since isolation
and reconfiguration procedures are rarely invoked.
I)aLage Tolerance. One of the AIPS survlvability-related requirements is
that the information processing system must be able to tolerate those damage
events that do not otherwise impair the inherent capability of the vehicle to
fly, whether it is an aircraft or a spacecraft.
The internal architecture of the redundant computers supports the damage
tolerance requirement in several ways. First, the links between redundant
channels of a computer are point-to-point. Second, these dedicated links can
be several meters long. This makes it possible to physically disperse
redundant channels in the vehicle. The channel interface hardware is such
that long links do not pose a problem in synchronizing widely dispersed
processors.
43

For comnunication between GPCs and between a GPC and I/O devices, a
damage- and fault-tolerant network is employed. The network consists of a
number of full duplex links that are interconnected by circuit switched nodes
to form a conventional multiplex bus. The normal network configuration is
static, and the circuit switched nodes pass information through them without
the delays associated with packet switched networks. The protocols and
operation of the network are identical to a multiplex bus. Every transmission
by any subscriber on a node is heard by all the subscribers on all the nodes.
Although the network is operated as a virtual bus, the network concept has
many advantages over a bus. First, a single fault can permanently disable
only a small fraction of the virtual bus, typically a node or a link
connecting two nodes. The network is able to tolerate such faults due to the
richness of interconnectlons between nodes. The nodes are sufficiently smart
to recognize reconflguratlon commands from the network manager_ which is one
of the GPCs. By reconflguring the network around the faulty element, a new
virtual bus is constructed. Except for such reconfigurations, the structure"
of the virtual bus remains static.
Second, weapons effect damage or other damage caused by electrical shorts,
overheating, or localized fire would affect only subscribers in the damaged
portion of the vehicle. If the sensors and effectors are physically dispersed
and the damage event does not affect the inherent capability of the vehicle to
fly, then the control system could continue to function as determined by
sensor/effector availability. The network itself would not be a reliability
bottleneck.
Third, fault isolation is much easier in the network than in multiplex
buses. For example, a remote terminal transmitting out of turn (a rather
common failure mode) can be easily isolated in the network through a
systematic search where one terminal is disabled at a time.
AIPS Element Capabilities. The IAPSA architecture study assumed that the
processor throughput would be 2 to 4 Mips. Technology with this level of
performance should be reasonably mature at the projected time of its flight-
critical application in IAPSA II.
Currently available memory capabilities are such that the memory
requlrements for the IAPSA, which are measured in terms of a few megabytes,
were not considered to be a design issue.
44

Each channel of an AIPS fault-tolerant processor (FTP) has an input/output
processor (IOP) and a computational processor (CP). All of the I/O and IC
network management functions are allocated to the IOP. The CP is dedicated to
the processing of application algorithms. An operating system overhead of 30%
is assumed so that only 70% of the CP's throughput is available for the
application algorithms. This translates to 1.4 to 2.8 Mips of available
throughput for the FTP using the 2 to 4 Mips technology projection discussed
previously.
Reliability data from previous studies were used for initial candidate
selection. Rough figures of merit for the reliability of the FTP processing
sites yere extrapolated from a study that assumed a commercial transport
environment. The resulting estimates were 10-7 probability of failure for a
triplex FTP and I0-I0 for a quadruple FTP.
Similarly, to evaluate the effectiveness of the AIPS FTMP, data from a
study made during the first generation FTMP development effort were used. The
resulting l-hr failure likelihood was 2x10 -I0. Finally, a triplex IC network
study had indicated an unreliability on the order of 10-13 . For this reason
the IC network was not considered a reliability driver in the candidate
selection.
These rough data were used to guide the synthesis of viable AIPS-based
candidate architecture alternatives documented in reference 5. The resulting
choices will be described next.
3.5.2 ProeesslngAlternatives for IAPSA
The alternative AIPS building block configurations considered for this
study were (I) a single quadruple FTP, (2) a single fault-tolerant multi-
processor (FTMP), (3) multiple FTPs, (4) two FTMPs, and (5) a combination of
one FTMP and multiple FTPs. In all cases, the processing equipment would be
dispersed to provide damage tolerance. The key considerations that went into
selecting these alternatives included (1) the reliability, availability, and
maintainability requirements, (2) the IAPSA processing resource requirements,
and (3) the validation goals of this study.
45

Configuration 1: A Single Quadruple FIT. This configuration, shown in
figure 3.5-2, consists of a four-channel FTP physically dispersed within the
ATF equipment bay(s). This configuration requires the least hardware and is
the simplest of all the alternatives. It has a number of simplifying
properties associated with its single GPC architecture. These are: (i) there
is no intercomputer communication, (2) there is no requirement for inter-GPC
crossbarring of the sensor and effector I/0, (3) the flight program can
consist of one software load module, and (4) there is no requirement for
function migration.
Configuration 2: A Single FTMP. This configuration consists of a single
FTMP and is depicted in figure 3.5-3. The FTMP is designed so that each
processor and memory module used in a triad _may be physically separated. In
addition, the common memory modules may also be physically separated. This
distribution allows the FTMP configuration to meet the damage tolerance
requirement.
The throughput requirements can be met with a sufficient number of triads.
Two to four triads will be required to meet the IAPSA requirements. The
number of spare processors and memory modules can be tailored to meet the
reliability, availability, and maintainability goals.
Configuration 3: Multiple FTPs. Multiple FTPs, which communicate over a
fault-tolerant IC network and are physically dispersed, may be used to meet
the IAPSA processing requirements. Several configurations that use multiple
FTPs were considered. Figure 3.5-4 indicates some of these alternatives.
They are considered to be representative and indicative of the advantages and
disadvantages associated with multiple FTP configurations. These alternatives
are referred to here as options i, 2, and 3.
Option I partitions the control functions along natural lines into three
FTPs. An FTP is allocated to each of the following control systems: the left
propulsion control system, the right propulsion control system, and the
integrated flight control system. This option has problems in terms of
balancing the throughput. The integrated flight control system could saturate
an FTP and each propulsion control system underutillzes its FTP. Option 2
solves the possible saturation problem by using an additional FTP and
46
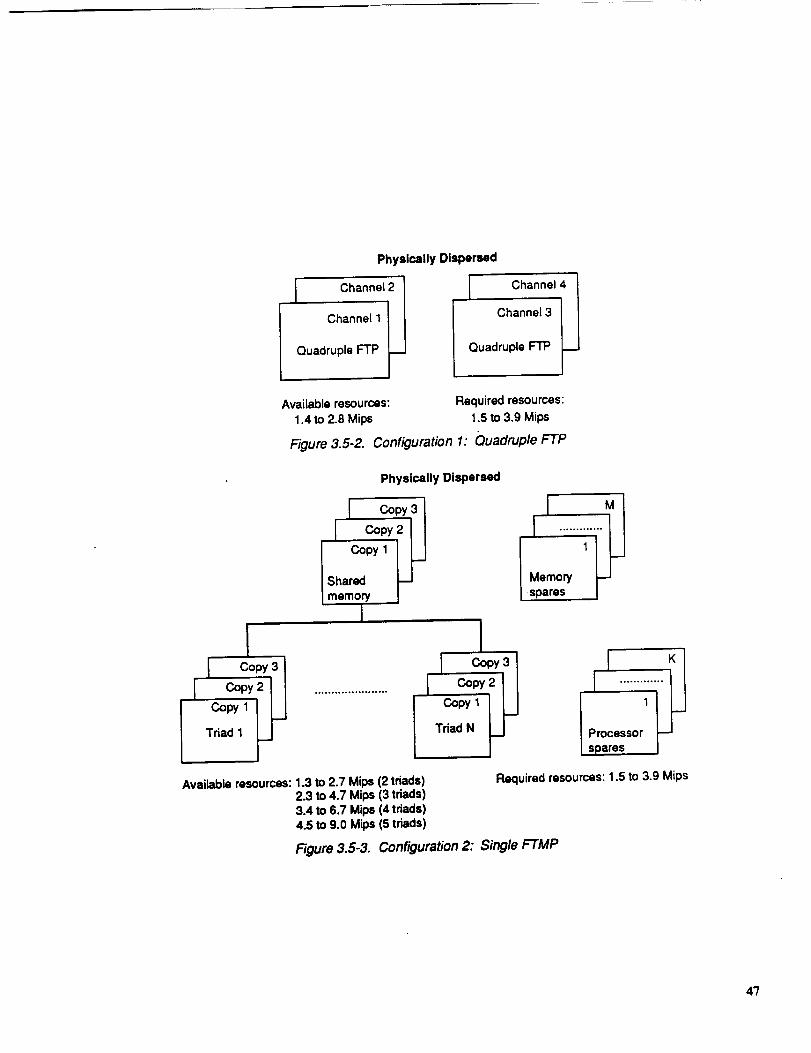
Physically Dispersed
I Channel 2 I
Channel1 I I
Quadruple FTP J.,._J
IQ Chann.._._eJ4 ]
Channel3 1 I
uadruple F'I'P J._J
Available resources: Required resources:
1.4 to 2.8 Mips 1.5 to 3.9 Mips
Figure 3.5-2. Configuration 1: Quadruple FTP
Physically Dispersed
I Copy 3 I
Shared _--Jmemory l
II I
I oopy31 I _opy3I] _o_y2( I ......................I _opy21I
Triad 1 I I TriadN
i jl .......i r_Memory _-Jspares |
t i ....... ¸Processor _-Jspares /
Available resources: 1.3 to 2.7 Mips (2 triads) Required resources: 1.5 to 3.9 Mips2.3 to 4.7 Mips (3 triads)3.4 to 6.7 Mips (4 triads)4.5 to 9.0 Mips (5 triads)
Figure 3.5-3. Con#guration 2: Single FTMP
47

TriplexFTPLeftpropulsioncontrolsystem
Option1
Triplex FTPRight propulsioncontrol system
Quadruple FTPIntegrated flightcontrol system
Triplex FTPLeft propulsioncontrol system
Quadruple FTPHalf of integrated
flight control system
Option 2
Triplex FTPRight propulsioncontrol system
Quadruple FTPOther half of integrated
flight control system
Option 3
Quadruple F'rPIntegrated propulsioncontrol system
Quadruple FTPIntegrated flightcontrol system
Figure 3.5-4. Configuration 3: Multiple FTP Options
48
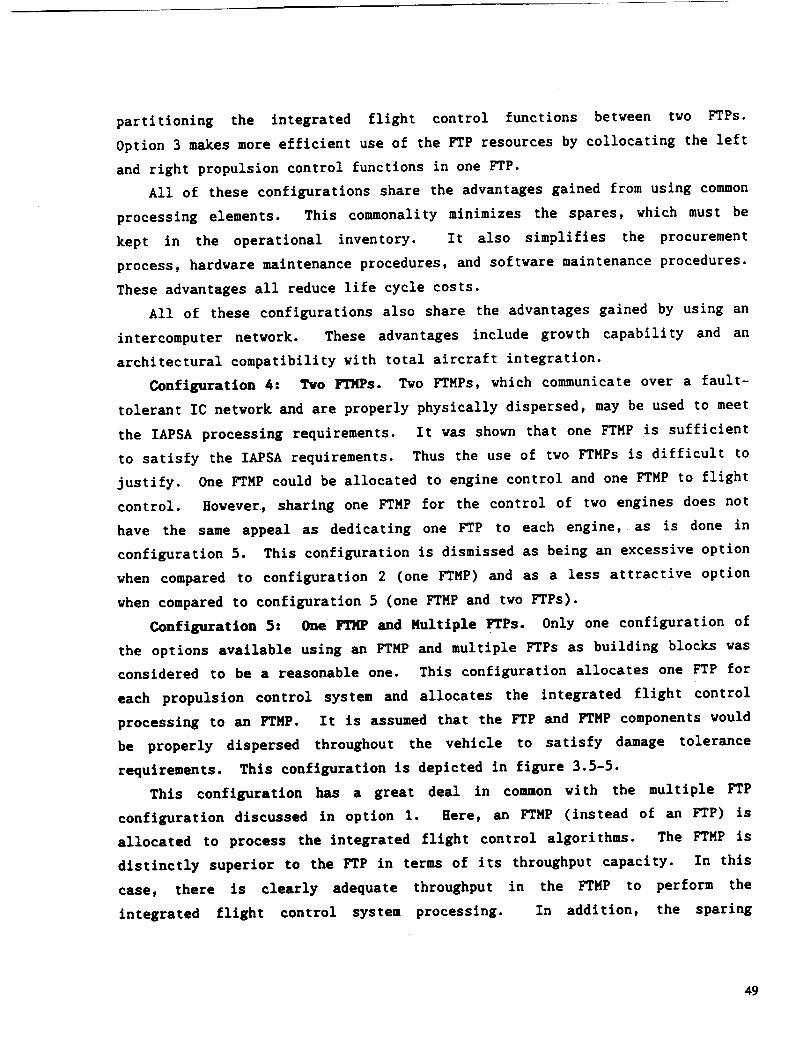
partitioning the integrated flight control functions between two FTPs.
Option 3 makes more efficient use of the FTP resources by collocating the left
and right propulsion control functions in one FTP.
All of these configurations share the advantages gained from using common
processing elements. This commonality minimizes the spares, which must be
kept in the operational inventory. It also simplifies the procurement
process, hardware maintenance procedures, and software maintenance procedures.
These advantages all reduce life cycle costs.
All of these configurations also share the advantages gained by using an
intercomputer network. These advantages include growth capability and an
architectural compatibility with total aircraft integration.
Configuration 4: Two FTMPs. Two FTMPs, which communicate over a fault-
tolerant IC network and are properly physically dispersed, may be used to meet
the IAPSA processing requirements. It was shown that one FTMP is sufficient
to satisfy the IAPSA requirements. Thus the use of two FTMPs is difficult to
justify. One FTMP could be allocated to engine control and one FTMP to flight
control. However, sharing one FTMP for the control of two engines does not
have the same appeal as dedicating one FTP to each engine, as is done in
configuration 5. This configuration is dismissed as being an excessive option
when compared to configuration 2 (one FTMP) and as a less attractive option
when compared to configuration 5 (one FTMP and two FTPs).
Configuration 5= One FTMP and Multiple FTPs. Only one configuration of
the options available using an FTMP and multiple FTPs as building blocks was
considered to be a reasonable one. This configuration allocates one FTP for
each propulsion control system and allocates the integrated flight control
processing to an FTMP. It is assumed that the FTP and FTMP components would
be properly dispersed throughout the vehicle to satisfy damage tolerance
requirements. This configuration is depicted in figure 3.5-5.
This configuration has a great deal in common with the multiple FTP
configuration discussed in option 1. Here, an FTMP (instead of an FTP) is
allocated to process the integrated flight control algorithms. The FTMP is
distinctly superior to the FTP in terms of its throughput capacity. In this
case, there is clearly adequate throughput in the FTMP to perform the
integrated flight control system processing. In addition, the sparing
49
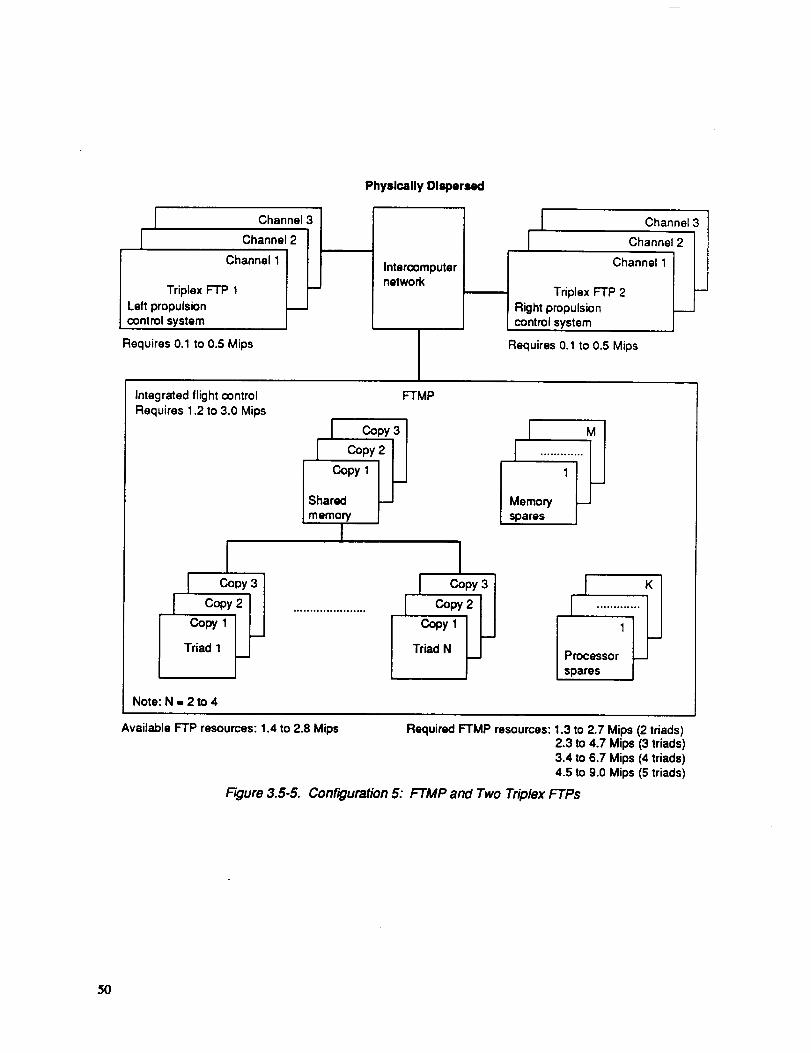
Channel 3
F Channel 2
I Channel 1
Triplex FTP 1
Left propulsioncontrol system
Requires 0.1 to 0.5 Mips
Physically Dispersed
Intercomputernetwork
i_ Channel 3 ]
Channel-----K]I
| o.a°o.,;] tl_'_ Triplex FTP 2 I
I Right propulsion I_._JI control system j
Requires 0.1 to 0.5 Mips
Integrated flight controlRequires 1.2 to 3.0 Mips
FTMP
I copy3 I IJ Copy 2 .........
co_,, _ r iShared -- I Memory _lmemory spares |
I
I cooy3 I cop_2c°PY31II I I .........
I _ ......................i iiJ i iTriad 1 _ Triad N __J Processor }_.1
spares j
Note: N - 2 to 4
Available FTP resources: 1.4 to 2.8 Mips Required FTMP resources: 1.3 to 2.7 Mips (2 triads)2.3 to 4.7 Mips (3 triads)3.4 to 6.7 Mips (4 triads)4.5 to 9.0 Mips (5 triads)
/:;gum 3.5-5. Configuration 5: FTMP and Two Triplex FTPs
5O

capability of the FTMP permits much more freedom in specifying the degree of
OSsparing for this processing site. To a large degree, this configuration has
all of the advantages discussed in option 1 and solves its possible
disadvantages.
The one significant disadvantage here is the relative implementation risk
associated with the FTMP. As indicated previously, the FTP has a maturity
that is roughly an order of magnitude greater than that associated with the
FTMP. In addition, the AIPS proof-of-concept FTMP is not likely to be
developed in the timeframe of the IAPSA schedule. In the absence of this
relative FTMP implementation risk, this configuration would be viewed as
preferable to the option 1 multiple FTP configuration.
3.5.3 Input/Output Architecture Tradeoffs
One of the major issues that affect the nature of the I/0 architecture is
the physical location of the electronics that are directly associated with
sensors and effectors. Traditionally, most sensors and effectors have been
either located in controlled areas with other electronics or, if they are
mounted remotely, are supported by electronics in the electronics area.
Sensors that are typically located in avionics areas are inertial sensors and
air data sensors. A typical example of the electronics supporting remote
devices are the servo electronics within the flight control computers that
control the actuators located at the control surfaces. Electronic technology
is leading to a gradual trend toward distributed electronics. The advantages
offered by advanced electronic technology motivates the use of embedded
electronics to enhance the performance of sensors. In addition, some actuator
manufacturers are proposing embedded servo electronics. Engine fuel controls
are being implemented by electronics and located directly on the engine.
Progress in making electronics for severe environments is making these changes
feasible. There remains, however, a relative environmental penalty for these
locations.
The other major issue that determines the nature of the IlO architecture
is whether sensor and effector devices are directly connected to particular
processor channels or whether an IlO bus is used. Directly connected IlO has
several characteristics that are superior to network-connected I/O. Directly
51

connected I/O will likely be the most simple and straightforward in design.
Also, the I/0 throughput is constrained only by the characteristics of the
sensor/effector device on one hand and the computer channel on the other.
The use of an I/0 network will necessitate additional hardware and
software. The I/O network will thus limit the total throughput available and
contribute to transport delay. On the other hand, network-connected I/O has
several other advantages. Network I/O will be considerably more flexible in
its ability to adapt to corrections, modifications, and expansions in the
system architecture than directly connected I/O. I/O that is connected
through a standardized bus can be modified without directly affecting the
processing hardware. The changes in the I/O configuration are handled through
the network service software and the application software. It must be
recognized, however, that this flexibility advantage can be nullified if the
supporting software is not truly flexible.
The most important advantage of a network-connected I/O is the
contribution to an effective fault-tolerant design. Network I/O minimizes the
effects of failures and allows greater flexibility for recovery from detected
failures. When I/O is directly connected to a particular computer channel,
the use of those I/O devices can be lost if that computer channel fails and if
no additional provision is made to cross strap the device to another channel.
By providing a standardized interface between peripheral devices, an
intelligent redundancy management system can have greater freedom to combine
unfailed equipment into a system that continues to perform critical functions
after many failure and damage events.
3.5.4 Selected AIPS Candidate Description
The multiple FTP configuration, which allocates an FTP to the left
propulsion control system, the right propulsion control, and the integrated
flight control system, was selected as the configuration for IAPSA. The
recommended system configuration is assembled from the following basic AIPS
building blocks: (I) two triplex FTPs, (2) one quadruple FTP, (3) nine
intercomputer network nodes, and (4) 52 I/O network nodes.
The recommended configuration consists of multiple modular processors
selectively distributed in the aircraft equipment bay(s) so as to not be
52

vulnerable to a single hit. The functional distribution in the recommended
configuration is consistent with the traditional partitioning of engine
control and flight control functions used in the past.
The three computer sites are connected through a three-layer IC network.
This network provides the transfer of application data between computers to
implement the integrated airframe/propulsion control strategies. This network
allows for the high integrity management of the total system that makes it
possible to reconfigure the system to continue all critical tasks after a
total failure of any one processing site.
The IlO architecture consists of one interconnected network. An I/0
network is selected primarily because of the contribution to fault tolerance.
This architecture contributes to a design that can more effectively meet the
flight safety requirements and increase mission reliability and availability.
Even though the network is completely interconnected, it is normally operated
as six independent virtual buses. There are two buses controlled by the
flight control FTP to provide I/O for all of the integrated flight control
functions. There are, in addition, two buses for each engine controlled by
the engine FTPs. Two buses are used for the flight control and for each
engine to supply nearly simultaneous commands to the two channels of the dual
actuators and also to provide for continuous control in spite of any failure
that might disrupt communication on any one bus. The use of the two buses to
the dual actuators prevents any interruption in the control commands due to
network failure recovery.
There are 52 nodes in the total I/O network. One node is assigned to each
channel of each redundant actuator. This assignment is made both for
reliability and for physical location reasons. It would obviously be
inappropriate to connect both redundant channels of an actuator to one node
since the failure of that node would cause the loss of the entire actuator.
It would be reasonable, however, to connect one channel from two or more
actuators to one node if there were appropriate physical proximity.
Nodes are assigned to sensor systems according to physical location and
the redundancy level of the sensors. It is assumed that the air data sensors
and inertial sensors are located in the electronics compartment and can share
53

four nodes. There are also four nodes in the cockpit to provide interface for
the pilot stick, pedal, and throttle positions. In addition, there are four
nodes associated with four channels of the flight control FTP.
One node is assigned for each set of redundant actuator channels for each
section of the propulsion system: the inlets, the engines, and the nozzles.
This gives a total of 12 nodes for the propulsion system. Using one node for
three or four actuators does not reduce reliability because it is assumed that
all actuators work together as a set for the control of the engine.
The resulting data communication load was estimated based on the number of
actuator commands and sensor samples sent over the network to satisfy the
requirements for each major control function. Data words sent to or from a
particular device interface unit were combined into messages. Using an
overhead estimate of 100 bits per message resulted in an I/O bus loading that
lies within bus throughput limits. A similar calculation for the IC network
showed a greater throughput margin.
3.5.5 Single-Engine Pighter Considerations
The previously described candidate architecture was defined to meet the
requirements of a high-performance multimission twin-engine fighter. A twin-
and single-engine fighter differ in the effect of permanent loss of thrust
from one engine. This situation does not prevent the continued safe flight
and landing of a twin-engine fighter, while it leads to loss of the single-
engine aircraft. For the integrated control system, the result is that
certain failure situations may be tolerated in a twin-engine case that are
unacceptable in the single-englne case. This leads to a greater level of
failure protection necessary for the control system elements associated with
thrust control for the slngle-englne aircraft.
The modifications to the candidate architecture for application to a
single engine aircraft are fairly straightforward. They involve using only
one FTP for propulsion control and dedicating it to the one engine. In this
case, the propulsion control FTP should be a quadruple FTP, as opposed to the
triplex FTPs recommended for the two-englne ATF. In the two-engine
configuration, the left and right propulsion control systems with triplex FTPs
back each other up. For the slngle-engine configuration, a quadruple FTP,
54

with its associated I0-I0 failure likelihood, is required to meet the IAPSA
flight safety goal. This configuration is very similar to the multiple FTP
configuration discussed in Option 3.
Another aspect of a single-engine aircraft is the secondary power system
design. Since the integrated control system requires an uninterruptible
source of hydraulic and electrical power for its continued operation, an
immediately available emergency power source must be provided. Thus the
secondary power design will have to contend with a much higher probability of
emergency operation. This can have many implications for the integrated
control system reliability depending on the details of the secondary power
system design. With a well-proven emergency powe_ unit (EPU), the reliability
effect may be small. However, in a single-engine aircraft the temporary loss
of thrust also places the aircraft in an emergency restart situation. During
this condition, the emergency power system must provide both hydraulic and
electrical power sufficient to control the airplane, as well as cranking power
to restart the engine.
55

56

4.0 CANDIDATE ARCHITECTURE EVALUATION
The candidate IAPSA II system architecture was evaluated using the
prevalidation methodology and associated tools. As previously discussed,
the system performs control functions that are critical to the flight
safety and mission effectiveness of an advanced fighter, imposing demanding
performance and reliability requirements on the system. In addition, the
designed system must have the capacity to handle the workload of these
control functions during normal operation as well as in fault recovery
situations.
Table 4.0-1 summarizes the high-level capability provided by each major
control function (see ref. 9 for details). Two of the major functions,
manual control and engine control, are needed to allow continued flight to
a safe landing. The remaining functions are needed to provide full mission
capability. No attempt was made in the reliability study to distinguish
intermediate levels of mission capability. The effects of system element
failures and combinations of failures were categorized in terms of the
three system failure conditions: fully mission capable (FMC), safe flight
and landing (SFL), and unsafe.
The control functions listed in the table have specific sensing and
actuation requirements as well as required cyclic execution rates derived
during the control law definition effort. The functional design was
developed in more detail by decomposing the major control functions into
subfunctlons. At the subfunction level, the design identifies the sensor
and actuator redundancy management processes. The detailed development was
based on several ground rules, one of which is the sharing of sensors and
computing processes between the major functions. A discussion of the
ground rules and the resulting subfunction definition and data transfer
details are presented in reference 9.
The candidate architecture definition allocated the IAPSA II computing
functions to the flight control computing site and to an engine control
computing site for each engine. The resulting straightforward allocation
of computing subfunctions and associated update rates are shown in
tables 4.0-2 and 4.0-3.
PRECEDING PAGE BLAr-,'X NOT FILMED
57
Table 4.0-1. IAPSA II Major Control Functions
System functions
Manual control
Capabilities
Basic flight path control
Flutter control High speed ingress with stores FMC
TraJectory following Track optimized flight paths FMC
Wing camber control Optimized wing performance for FMCm,ss_on segment
Trim control FMC
Inlet control Full supersonic capabdity FMC
Engine control SFL
Nozzle control Thrust vectoring/reversing FMC
Needed for:
SFL
Notes:
SFL: Safe flight and landingFMC: Full mission capability
Table 4.0-2.
100 Hz
Wing accelerometer SM
Flutter law
Body rate SM
Fast a,r data SM 1
Fast air data calculation 1
Computing Allocation - Right Control
50 Hz
Pilot command SM
25 Hz
Trajectory law 1
12.5 Hz
Trim command SM
Manual law Slow air data SM 1 Trim law
Camber law Slow air data calculation 1
LE flap AM
Body accelerometer SM
Flaperon AM Inertial calculataon
TE flap AM Pitch coordination
Canard AM
Rudder AM
Nosewheel AM
SM. - Sensor managementAM - Actuator management1 I Reference configuration
Flap command SM
58
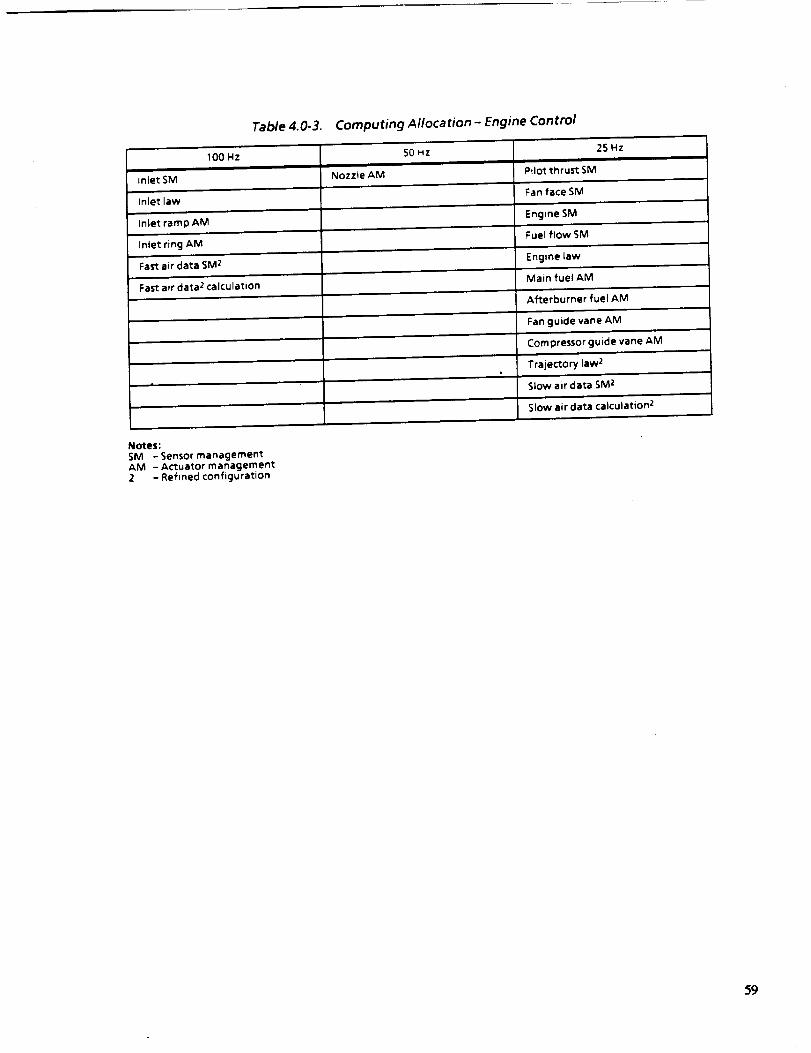
Table 4.0-3. Computing Allocation - Engine Control
100 Hz 50 Hz 2S Hzi
Inlet SM Nozzte AM Pdot thrust SM
Inlet law Fan face SM
Inlet ramp AM Engine SM
Inlet ring AM Fuel flow SM
Fas_ air data SM 2 Engine law
Fast air data 2 calculation Main fuel AM
Afterburner fuel AM
Fan guide vane AM
Compressor guide vane AM
Trajectory law 2
StOW air data SM z
Slow air data calculation 2
Notes:
SM - Sensor managementAM - Actuator management2 - Refined configuration
59

4.1 CANDIDATE AR_T_-r_ DETAILS
The physical configuration of the IAPSA II candidate architecture is
shown in figure 4.1-1. The components are arranged in three major groups:
(1) a flight control group, (2) a right engine control group, and (3) a
left engine control group. To support the subsequent system modeling,
three key aspects of the system required
aspects included (I) function partitioning,
interconnection, and (3) failure protection.
section 3.5.
further elaboration. These
(2) physical and functional
Major details were covered in
One of the two flight control I/O networks is shown in figure 4.1-2.
Half of the flight control sensors and actuators are connected to
network I, and the other half are connected to network 2. The sensors and
actuators interface to the network via device interface units (DIU). The
DIU provides signal conditioning/conversion for the devices and handles the
network communication protocol. Each DIU connects to a single network
node.
The flight control IlO network consists of a mesh of 18 nodes that are
connected to the FTP with three root links. The redundant flight control
sensors and actuators are spread evenly across the two networks and the
redundant DIUs. The specific assignment of these elements is shown in
table 4.1-1. The safety-critlcal flight control sensors are primarily
quadruple redundant, except for the skewed body motion sensors. The
mission-critical flight control sensors are triple redundant. The flight
control surface actuators have a dual redundant control channel
arrangement. Each actuator channel is connected to a different network.
The two I/O networks for one propulsion system are shown in
figure 4.1-3. Like the flight control arrangement, the propulsion control
sensors and actuators are connected half to one network and half to the
other network. Each network contains four nodes, connected to the FTP via
two root links. Since the network is a system building block entity, its
operation is identical to that of the flight control networks.
The specific assignment of the redundant sensors and actuators for one
propulsion system is presented in table 4.1-2. Most propulsion system
sensors are dual redundant except the engine core sensors, which are
6O

I Sensors/actuators ]I/Onetworks
J Sensors/actuators J
Sensors/ Iactuators networks
CH 1
CH 2
CH 3
CH 4
CH 1CH 1 ICCH 2 network CH 2
CH 3 CH 3
Flight ]control F'I"P
networks Sensors/ 1actuators
2
Figure 4.1-1. Reference Configuration Overview
5]

62
v_v
.Q..I.
c_
c_
_J
C_
.q...i
c
.t..,
i....

Table 4. I- 1.
C)evtce$
Body accelerometers
Body gyros
Angle of attack
Angle of sideslip
Static pressure
Sensor/Actuator Connection - Flight Control Networks
Redundancy
2
222
, DIUInocle,, , ID51S253S4
$1S2
S3$4
SlS2
S3$4
SIS2S3S4
$1
S2S3$4
Total pressure 1 S 1 11 $2 11 S3 21 $4 2
Total tern Derature 1 S1 11 $3 2
Pitch stick 1 CP1 11 CP2 11 CP3 2I CP4 2
ROll stick 1 CP1 11 CP2 11 CP3 2
1 CP4 2
Rudder pedal 1 CP 1 11 CP2 11 CP3 21 CP4 2
Left throttle 1 CP2 I1 CP3 2
i
Right throttle 1 CP1 11 CP4 2
Flap lever
Pitch trim
Roll trim
Yaw trim
CP1CP2CP3
cP2 1
CP3 2CP4 2
CP1 1CP3 2CP4 2
CP1 1CP2 1CP4 2
NW
63
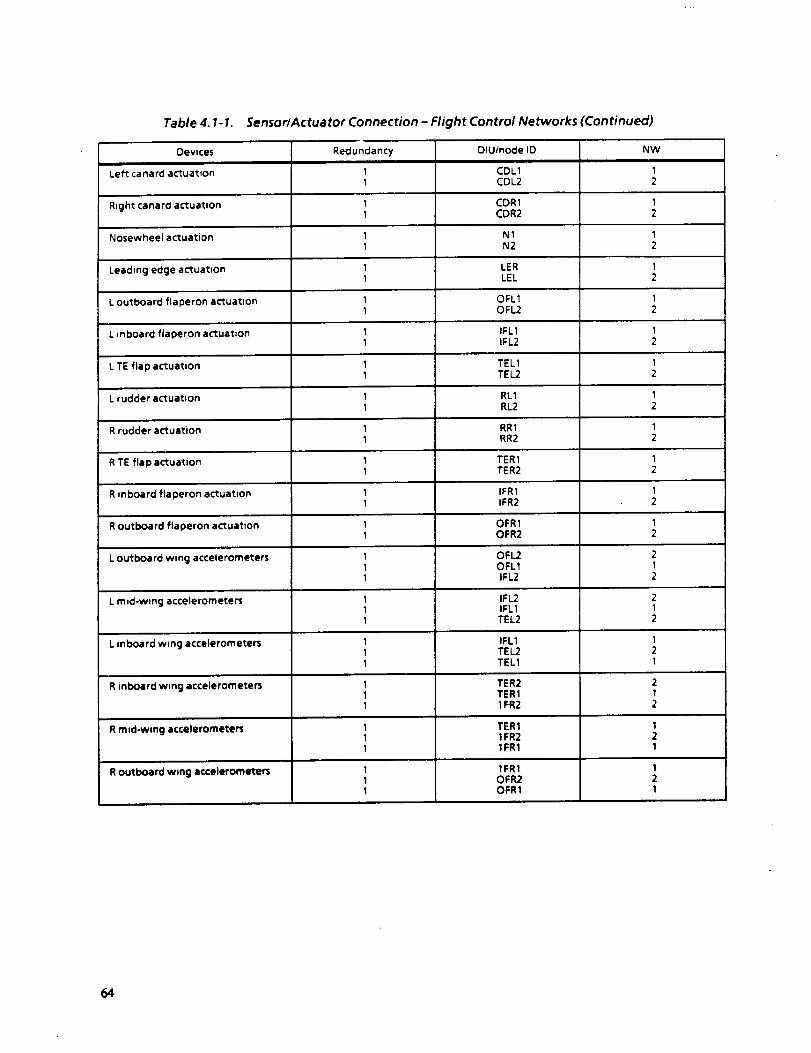
Table 4. I- 1. Sensor�Actuator Connection - Flight Control Networks (Continued)
Devices
Left canard actuation
Right canard actuation
Nosewheel actuation
Leading edge actuation
L outboard flaperon actuataon
L inboard flaDeron actuation
L TE flap actuation
L rudder actuation
R rudder actuation
R TE flap actuation
R inboard flaperon actuation
R outboard flaperon actuation
L outboard wing accelerometers
L m _d-wing accelerometers
L |nboard wig acceterometers
R inboard wing acceterometers
R mid-wing accelerometers
R outboard wing accelerometer3
Redundancy
I
I
DIU/node ID
CDLI
CDL2
NW
12
IFL1IFL2
1 CDR1 11 CDR2 2
1 N1 11 N2 2
1 LER 11 LEL 2
1 OFL1 11 OFL2 2
12
11
1 TEL11 TE L2
1 RL11 RL2
RR1RR2
1 TER11 TER2
1 IFR11 IFR2
1 OFR11 OFR2
OFL2OFL1IFL2
IFL1TEL,?.TEL1
1 IFL2 21 IFL1 11 TEL2 2
121
TER2TER11FR2
TER11FR21FR1
1 1FR1 11 OFR2 21 OFR1 1
64

Network 2
CH1
CH 2Inlet Engine Nozzle
CH 3
Left engine
control FTP
Network 1
©Device interface unit (DIU)
Node
Figure 4.1-3. Left Engine I/0 Network Layout
65

Table 4. I-2. Sensor�Actuator Connection - Engine Control Networks
Devices Redundancy
Upper ramp actuation
1Inner ramp actuation 1
1Bypass ring actuation 1
1Duct static pressure 1
1Normal shock total pressure 1
DIU/node ID
INL1tNL2
INL1INL2
INL1INL2
INL1tNL2
tNL1
INL2
1 INL1Normal shock static pressure 1 INL2
1 NOZ1Convergent nozzle acl:uat=on 1 NOZ2
1 NOZ1Upper nozzle flap actuation 1 NOZ2
NOZlNOZ2Lower nozzle flap actuation
1 ENG1Fan face pressure 1 ENG2
1 ENG1Fan face tern peratu re 1 E NG2
1 ENG1Fan speed 1 ENG2
Corn pressor speed 1 E NG 1
FuelflowmeterENG1ENG2
Burner pressure 1 E NG 2
1 ENG1Fan turbine inlet temperature 1 ENG2
1 ENG1Afterburner pressure 1 ENG2
1 ENG1Fan guide vane actuation 1 ENG2
1 ENG1Compressor guide vane actuat,on 1 ENG2
1 ENG1Fuel meter,ng valve actuatmon 1 ENG2
1 ENG1Afterburner fuel metering velve actuation (each of 5) 1 ENG2
1 E NG 1Afterburner light off detector 1 ENG2
1 ENGIMain fuel S/O device 1 E NG2
1 ENG1Afterburner zone fuel S/O device (1 of 5) 1 ENG2
66
covered by an analytic redundancy management scheme. The propulsion system
actuators are dual channel. Each actuator channel is connected to a
different I/O network, like the flight control actuators.
4.1.1 Failure Protection Details
Failure protection is the central consideration in the design of
flight-critical systems. Redundancy management processes are responsible
for the detection and identification of system element faults and any
necessary reconfiguration of functions to maintain safety or mission
capability. Failure protection assumptions made for the candidate system
are discussed by functional category in reference 9. Some of the key
capabilities of the assumed candidate system are presented in this section.
A key failure protection issue for the candidate architecture is
function migration, which provides failure protection for the computing
functions. In an AIPS system, function migration is a nonroutine change of
computing site assignments for the different system computers. An early
design decision was made not to implement this capability for failure
protection in the candidate architecture. The capability was judged to be
relatively immature for the timeframe of the IAPSA II application.
A key feature of the AIPS system is that application computing
functions can be written as if they execute on a perfectly reliable single-
channel computer. The AIPS building block hardware and software elements
provide protection from computing element failure. FTP redundant channels
execute exactly the same software in instruction synchronism. All of the
computed outputs are voted to ensure bit-for-bit agreement. An
unsuccessful vote points out a faulty channel. All inputs and outputs go
through a byzantine fault tolerant data exchange process to ensure that
each good channel is operating with exactly the same data. Special fault-
tolerant clock (FTC) hardware keeps each channel in sync, and special data
exchange (DX) hardware allows for fast, reliable exchange of interchannel
data.
The AIPS system
reconflguratlon (FDIR)
redundancy management.
software failure detection, identification, and
process has the overall responsibility for FTP
The Fast FDIR process checks for indications ofD
67

output disagreement and ensures that all channels are in instruction
synchronism. _lhen necessary, processor interlock hardware is used to
disable a faulty channel's outputs. FDIR programs running in background
perform self-tests on the channel hardware. A watchdog timer monitors the
periodicity of the channel cyclic execution. More detailed information
about the FTP failure protection is provided in reference 5.
Two good FTP channels are needed for operation when a guaranteed
shutdown is required for a subsequent channel fault. Therefore, the
quadruple flight control computer provides fail-op/fail-op/fail-off failure
protection capability for the safety-critical functions. Similarly, the
engine computer provides f.ail-op/fail-off capability for each propulsion
system.
Sensor/actuator data transfer takes place on the I/O networks.
Responsibility for maintaining a communication path to all good devices
rests with the I/O redundancy management process, which is a software
building block element of the /tIPS system services software. Most network
repair actions command nodes to enable or disable network links using
special command messages over the I/O network. The repair strategy
fundamentally consists of turning links on and off to isolate faulty
network elements and to provide an alternate data path to the affected
DIU(s). Certain candidate architecture faults, such as DIUs or nodes, will
permmently disable the directly connected sensors and actuators because no
alternative path is possible.
Flight Control Devices. Most of the safety-critical sensors listed in
table 4.1-1 were quadruple redundant to provide full operation after two
llke sensor failures. Mission-critlcal sensors are triple redundant to
provide fail-op/fail-off failure protection for the mission-crltical
control functions. Voting processes executing in the FTP compare redundant
sensor readings to detect and identify sensor failures. Since a comparison
process is used, only failure detection can be accomplished when two
sensors remain operational.
The skewed axis sensor readings are processed to provide estimates of
the three axis rates and accelerations. A sophisticated process compares
the readings for consistency in order to detect and identify sensor
68

failures. In this situation four sensors are needed for the process to
provide failure detection capability. Five are needed to identify the
failed sensor.
The sensor redundancy management processes can use communication status
information to aid fault identification. When data are unavailable to a
comparison process because of a known communication fault, operation can be
continued with a single remaining sensor (or three skewed sensors).
However, in this situation the voting process is unable to detect a
subsequent sensor fault.
Eight primary surfaces provide basic flightpath control. At least two
of the surfaces contribute most of the control moment for each axis. Pitch
axis control is provided by two canards. Two flaperons on each wing
control roll axis motion. Similarly, two rudders control motion around the
yaw axis. Secondary surfaces and devices include leading edge flaps,
trailing edge flaps and nosewheel steerlng. Each surface or device is
moved by a dual actuator. The actuator is based on a dual coil/dual
monitored valve approach. Figure 4.1.1-1 shows the configuration of the
standard actuator.
Local redundancy management is used to react to most failures. Special
monitor hardware detects most failures of the actuator position and valve
position sensors. When failures are detected, the other actuator processor
can take control. The actuator processor computes a model of the control
valve dynamics to detect valve failure. Valve failure will lead to bypass
of that side of the dual tandem ram and continued operation using the other
valve. A self-test process and watchdog timer hardware detect failures of
the actuator processor hardware. Detected failures result in control of
the surface by the other processor.
Propulsion Control Devices. As previously described, most of the
propulsion sensors are dual redundant. For the candidate system, model-
based redundancy management processes were assumed to allow fail-op /fail-
off failure protection capability. Details of the assumed processes are
presented in reference 9. Highlights are outlined below.
An inlet flow model identifies failures among the inlet pressure
sensors, fan face sensors and inlet device position sensors. Throttle
69

PROC
VLV VLV
IBYI
DTR
M Monitor HYD Hydraulic systemPROC Processor VLV Control valve
$D Servo drive BYP Bypass device.CO Coil DTR Dual tandem ram
POS Position sensor
Figure 4.1. I- 1. Surface Actuation - Reference Configuration
7O

command sensor management uses the throttle setting of the other engine to
help identify sensor failures. A fuel flow model identifies metering valve
position sensor failures and fuel flovmeter failures. The models execute
on the engine control FTP.
Redundancy management for the engine core sensors employs a
sophisticated algorithm described in detail in reference 10. The core
sensors include fan speed, compressor speed, burner pressure, fan turbine
inlet temperature, and afterburner pressure. The analytic redundancy
method detects and identifies failures among the five sensor types to
provide fail-op /fail-off capability.
All propulsion devices employ the same general actuation control
concept, shown in figure 4.1.1-2. A propulsion actuator is basically a
dual-channel device incorporating fail-passive electronics. Generally,
propulsion actuation element failures are detected using self-test methods.
Failures detected in th_ electronic elements cause one channel to fail
passive. When both sides fail passive, disengagement causes the device to
move to a preferred fixed position, causing the propulsion system to
operate at a degraded performance level.
The fuel-handling portion of the system includes special fuel shutoff
devices vhere needed for additional safety. This capability is used as a
last resort to protect against hazardous overspeed or overtemperature
situations.
4.2 RRLIABI_KqALUATION OF CANDIDATg
Two key measures were used to evaluate the system reliability. The
first, safe flight and landing, is a measure of the safety implications of
the system design. Safe flight and landing capability means that the
aircraft can fly to a recovery airfield and land safely. Aircraft
operation may require the use of emergency procedures and diversion to an
emergency base. This reliability measure is based on a 3-hr period, which
is representative of a long deployment mission.
The second measure, full mission capability, indicates the ability of
the aircraft to complete its mission. Full mission capability means that
the aircraft can continue to fly any of its possible missions after the
71

Dewce interface units
BYP
DTR
Devices (per actuator)
FPE Fail passive electronics 2CO Coil 2
VLV" Control valve 2
BYP Bypass device 1
SOL Engage solenoid 2
POS Position sensor 2
DTR* Dual tandem ram 1
HYD Hydraulic system 2• Active failure mode
Figure 4.1.1-2. Propulsion Actuation
72
failure of a system element. The applicable redundancy management process
must allow continued operation with no special procedures and no
significant performance degradation. A l-hr time period consistent with a
combat mission is used for numerical evaluation.
The reliability evaluation process was accomplished in three phases.
The first step was a functional failure analysis, undertaken to define how
the system fails. Next, an abstract model of the resulting failure
behavior was formulated for a reliability tool. Finally the system loss
probabilities were computed and evaluated to understand the system
concept's strengths and weaknesses.
4.2.1 Failure Analysis
The flight control functions were organized into the functional blocks
illustrated in figure 4.2.1-1. Similarly, the functional blocks for one of
the two propulsion control systems are presented in figure 4.2.1-2.
Significant operational states of these functional blocks were determined
by relating system performance after failures within the blocks to the two
system failure conditions of interest. The goal was to identify those
functional block states that by themselves or in combination with the
states of other blocks lead to a loss of system capability. A detailed
failure analysis is presented in reference 9, with some of the analysis
highlights given in the following paragraphs.
Flight Control. The failure analysis for elements in the flight
control sensing functional blocks was based on some standard assumptions
and ground rules. The voting processes used for sensor redundancy
management were assumed to operate perfectly. This means that no false
alarms, missed alarms or incorrect identifications occur as long as good
sensors outnumber bad sensors. When only two sensors remain (four for
skewed sensors), it is assumed that the process can detect that a failure
has occurred but cannot identify which of the remaining sensors is bad.
A known loss of communications can be used by redundancy management to
extend operations in certain situations. The assumptions used in the
different situations are presented in reference 9.
73

I Pilot tcommand
sensing
J tsensing
J Airflow tsensing
I Wing tacceleration
sensing
J Inletsensing
Fan facesensing
Engine coresensing
Throttlecommand
sensing
__11 Flight control ] _computingw
Figure 4.2.1-1 Flight Control Functions
_]1Pr°pulsi°n _._computingI==
FTgure 4.,.o. 1-2. Propulsion Control Functions
Canardcontrol
Flaperon Jcontrol
Rudder Jcontrol
TE flapcontrol
Nosewheel Jcontrol
LE flap Jcontrol
Inletcontrol
Vane
control
Core fuelcontrol
A/B fuelcontrol
Nozzlecontrol
"/4

Redundancy management processes require time to identify a failed
sensor and reconfigure the algorithm accordingly. A possible hazard exists
if, during a sensor failure recovery period, another sensor from the
redundant set fails. This situation wlll be referred to as nearly
coincident sensor failure. In the case of a quadruple set of sensors, it
means that two good sensor values will be processed with two bad values.
The resulting inability to "outvote" the bad data is assumed to be
catastrophic.
The results of the failure analysis by functional block is presented in
table 4.2.1-1 for the flight control group of elements.
A major analysis assumption was that the flutter control law provides a
minimum safe level of performance when sensing at a single site or
actuation of a single surface is lost. The resulting degraded performance
was assumed to be adequate to allow safe flight out of the critical flutter
envelope.
With this assumption, flutter sensing needs can be met with triple
redundant sensors at each site, providing fail-oplfail-off capability. The
operating assumption is that the aircraft will slow down out of critical
envelope before flutter control is deactivated.
For actuation the assumption is that the control law is designed with
the capability to fly out of the critical flutter envelope with a single
passive flutter control surface. Fault reaction will take place if a
fiaperon or trailing edge flap fails passive for any reason during flutter
operation.
The flight control devices include the primary surfaces used inbaslc
fllghtpath control, canards, flaperons, and rudders. Flight control
secondary devices include the nosevheel and the leading and trailing edge
flaps. The primary control surfaces are used by the safety-critical manual
control function. A key failure analysis assumption is that continued safe
flight and landing is possible if a single primary surface fails passively.
For roll axis control, it is assumed that symmetrical pairs of flaperons
can be lost. In these situations, the performance reduction caused by the
loss of a single surface eliminates full mission capability. Another key
75

Table 4.2. 1-1. Function Failure Analysis - Flight Contro!
Function
Pilot command
Total losseffect
Acbve failure mode considerattons
i
Pitch. roll, yaw, sensing Unsafe
Tr_m command sensing SFL
Flap lever SFL
Body motion sensmg
Rate sensing Unsafe
Acceleratton sensmg Unsafe
Air flow sensing
Angle of attack Unsafe
Angle of sideslip Unsafe
Statac pressu re SFL
Total pressure SFL
Total temperature
Total loss of capabdity during crittcal phase of flight isWing acceleration sensmg SFL catastrophic
Flight control computing Unsafe
Loss of single surface - SFL (if all primary surfacesCanard control Unsafe operational)
Surface stuck/jammed - Unsafe
Loss of single surface or two symmetrtcal surfaces - SFLFlaperon control Unsafe (if other primary surfaces operational)
Surfaced stuck/jammed - Unsafe
LOSSof stogie surface - SFL (if all primary surfacesRudder control Unsafe operational)
Surface stuck/jammed - Unsafe
TE flap control SFL Loss of stogie surface - SFL
Nosewheel control SFL
LE flap control SFL
Table 4.2. I-2. Effect of Propulsion System Capability on Aircraft State
Propulsion system capabdity combmation Resulting aircraft state
Full - full Fully mission caloable
Full - normal Safe flight and landing
Full - low Safe flight and landing
Normal - normal Safe flight and landing
Normal - low Safe flight and landing
Low - low Unsafe
76
assumption is that failures that leave any primary control surface "stuck"
or hard over cause loss of safety.
Most actuator control element failures are handled by the local
redundancy management processes. One assumption is that control valve and
hydraulic power failures are perfectly identified by the local process,
resulting in an operational surface using the redundant devices. The
remaining actuation elements have uncovered failure modes that cause the
central actuator management process to command passive operation of the
device. Worst case surface control failures are considered to be those
that cause a jammed or stuck device.
Generally, passive device operation eliminates FMC capability, but safe
flight and landing is still possible. Therefore, covered actuation element
failures will result in full operational capability, while uncovered
failures will lead to central saflng action and a corresponding loss of FMC
capability.
Propulsion Group. The most critical propulsion system capability is
control of thrust adequate to support safe flight and landing. For the
candidate twin-engine aircraft, a certain level of single-engine
performance was assumed to be necessary. The additional propulsion system
capabilities primarily support the advanced fighter missions. For example,
the vectoring/reversing nozzles support short takeoff and landing, enhanced
supersonic maneuvering and other mission capabilities.
The capability of each propulsion system after failures was divided
into three major performance categories. Full capability means that all
functions are fully operational (full supersonic inlet control, full
afterburner thrust control, and full thrust vector and thrust reverse
capability). The normal capability category allows some degradation from
the full performance level. As a mlnlmua requirement the engine must be
capable of providing the full unaugmented thrust range. The nozzle and/or
the inlet can be operating in a fixed position mode. In the for-capability
category, the system cannot meet the normal category minimum requirements.
The engine has either suffered a serious malfunction and cannot be operated
or it can only run at a fixed thrust level.
77

The performance levels of both propulsion systems must be considered
together to determine vehicle capability. A summary of the effects of
engine capability on aircraft capability is provided in table 4.2.1-2.
Table 4.2.1-3 presents the results of the failure analysis of the
propulsion control elements for a single engine.
For the most part, the propulsion sensing redundancy management is
assumed to allow fail-operational and fail-safe failure protection. This
includes the engine core sensing covered by the analytic redundancy
techniques.
Propulsion computing operates like flight-control computing in failure
situations. All computing functions are fully operational until the
failure of one of a remaining pair of FTP channels, at which time
performance is reduced below the normal capability level.
Some standard assumptions and ground rules were used in the failure
analysis for the propulsion actuation functional blocks. A common
propulsion actuator was used for all devices. All but a fraction of the
propulsion actuation element failures are detected by the self-test
processes. These covered failures result in the disengagement of one
actuator channel, but the device still has full operational capability via
the remaining channel. If the remaining channel then suffers a covered
failure, disengagement causes the device to move to the preferred fixed
position.
Failures not detected by the self-test processes cause the central
actuator management process to command the propulsion device to the
preferred fixed position. The consequences of the rare mechanical jam of
the main actuator ram are Included In the special considerations column of
table 4.2.1-3.
Communications. All of the major control functions depend on data
transfer provided by network operation. Communication device failures
primarily affect sensing and actuation functional blocks. That is, their
primary function of sensing the environment or moving actuators for the
control function is interrupted by the communication failures.
Table 4.2.1-4 summarizes a hlgh-level failure effect study for the
elements making up an I/O network. Two general failure modes were
78

Table 4.2. 1-3.
Function
Inlet sensing
Function Failure Analysis- Propulsion Control Loss Effect
Propulsionsystem
(Vehicle) Special considerations
Duct static pressure Normal (SFL)
Normal shock static pressure Normal (SFL)
Normal shock static pressure Normal (SFL)
Fan face sensing
Fan face pressure LOW (SFL)
Fan face temperature Low (SFL)
Full operation with 4 of 5 sensor types Run/off ifEngine core sensing only 3 sensor types available m engine core
Fan speed Full (FMC)
Compressor speed Full (FMC)
Burner pressure Full (FMC)
Fan turbine inlet temperature Full (FMC)
Afterburner pressure Full (FMC)
Pilot shut down of engine if failure detectionThrottle command sensing LOW (SFL) process doesn't detect last sensor failure
L
Propulsion corn puting Low (SFL)
Active failure mode may cause reduced thrustInlet control operation at subsonic speed
Upper ramp Normal (SFL)
Inner ramp Normal ($FL)
Bypass ring Normal (SFL)
Vane control
Fan guide vane
Compressor guide vane
Main fuel control
Metering valve
Flowmeter
Low (SFL)
Low (SFL)
Low (SFL)
Low (SFL)
Normal (SFL)
Normal (SFL)
Normal (SFL)
Normal (SFL)
Normal (SFL)
Normal (SFL)
Fuel shutoff
A/B fuel control
Zone metering valve-
Zone fuel shutoff
Light off detector
Nozzle control
Lower flap
Upper flap
Convergent nozzle
Active failure mode may cause flameout orcompressor stall
i
Passive fadure unsafe in conjunction wtth activemetering valve fadureActive failure mode may causeoverspeed/overtemp or flameout
Active failure mode requires engine shutdown
Active failure mode requires engine shutdown
Active failure mode may cause overspeed orcorn pressor stall
79

Table 4.2. 1-4. Communication Device Failure Summary
Device type
Network node
Fault type
Passive
Fault effect
Loss of comm to all downstreamdevices
Nw unusable
Node does not obeyreconfiguration command
Actwe
Loss of corn m to/from allNetwork link Passive downstream devices
NW unusable or loss of comm toActwe all downstream devices
Root link Passive NW unusable
Active NW unusable
Network _nterface Passive NW unusable
Active
Passive
Active
Passive
Active
DIU Link
DIU
NW unusable
Loss of comm to DIU and all
serviced devices
NW unusable
Loss of comm to DIU and allserviced devices
NW unusableACtuatorCommand values corruptedSensor values corrupted
Repair action
Rebuild network around failednode
Rebuild network around failednode
Rebuild path around failed link
Rebuild path around failed link
Switch to alternate root link
Switch to alternate root
linklreconfigure old root nodeto disable old root link
Switch to alternate root link
Switch to alternate rootlink/disable old root link at oldroot node
Disable DIU hnk at servicingnode
Disable DIU link at servicingnode
8O

considered, passive and active. The postulated active mode was considered
to have a worst case effect on network operation. Communications device
failures can affect sensors and actuators on one DIU, a subset of the DIUs,
or all the DIUs on a network. This depends on the device failure mode and
the location of the failure in the active network.
Network operation during failure recovery can cause system failure in
several ways. The three most significant have been termed temporary
exhaustion, nearly coincident network - sensor/actuator recovery, and
nearly coincident dual network recovery.
Temporary exhaustion failures occur when device failures leave the
system without enough good devices to safely fly during a subsequent
network repair activity.
In a nearly coincident network recovery, a voting process is
temporarily without enough good devices to outvote the faulty device. Bad
output is assumed to propagate to the control function, causing loss of
safety.
Nearly coincident dual network recovery is a straightforward case in
which both networks undergo repair at the same time. Since there are only
two networks, all affected redundant sensing and actuation is lost during
the mutual repair period. All three of these network operation situations
are assumed to lead to loss of safety because of the effect on safety-
critical sensing and actuation.
4.2.2 Reliability Results
The functional block organization of the system elements used for
failure analysis was also used for reliability modeling. Each of the
reliability models covers a section of the system containing the sensing,
actuating, or computing elements needed for a system control function.
Data transfer elements were included in the section models where their
failure had a permanent effect.
The reliability models were used to estimate the likelihood of the
failure situations identified during the failure analysis. Each section
model includes the local effect of hydraulic system, electrical power
81

system, and network failures. The element failure rates and other related
information used in the evaluation are listed in reference 9.
To indicate potential problems with the network operation, some
conservative assumptions were made about the temporary effects of network
element failures. All network element failures, regardless of failure mode,
were assumed to cause loss of all devices on the entire network during the
repair period. To scope the hazard it was initially assumed that all
repair periods are 1 sec long.
Similarly, a special concern was the hazard associated with active DIU
failure modes. To assess the potential problem, a fixed fraction of all
DIU faults were assumed to be active failures.
The contribution to loss of safety from the propulsion system wa_ based
on situations where failures cause one system to have less than normal
performance capability. This value was then used to estimate the
likelihood of the unsafe situation in which both systems have less than
normal performance.
The model results for the loss of safe flight and landing capability
are shown in table 4.2.2-1. The results are divided into functional
cateEories to show how the loss of specific categories contribute to the
loss of safety. Details of the results are presented in reference 9, some
hiEhliEhts are reviewed below.
A few failure sequences dominated the safety unreliability for the
candidate architecture, preventing it from meetinE the system requirement.
The predominant sequence was loss of body motion sensin E in a temporary
exhaustion failure. This two-failure situation occurs when a node or DIU
fails, leavlnE the system vulnerable to subsequent repair activity on the
other network. _Jhen the second failure causes the other network to shut
down for repair, only two rood sensors are accessible instead of the
minimum set of three required for safety. Key assunptlons in the temporary
exhaustion failure analysis are that the network repair exceeds the time
the system can tolerate loss of control and that all network element
failures lead to a long repair period.
The other dominant loss of safety sequences are associated with surface
control. The first situation is a Jammed or stuck sinEle surface. The
82
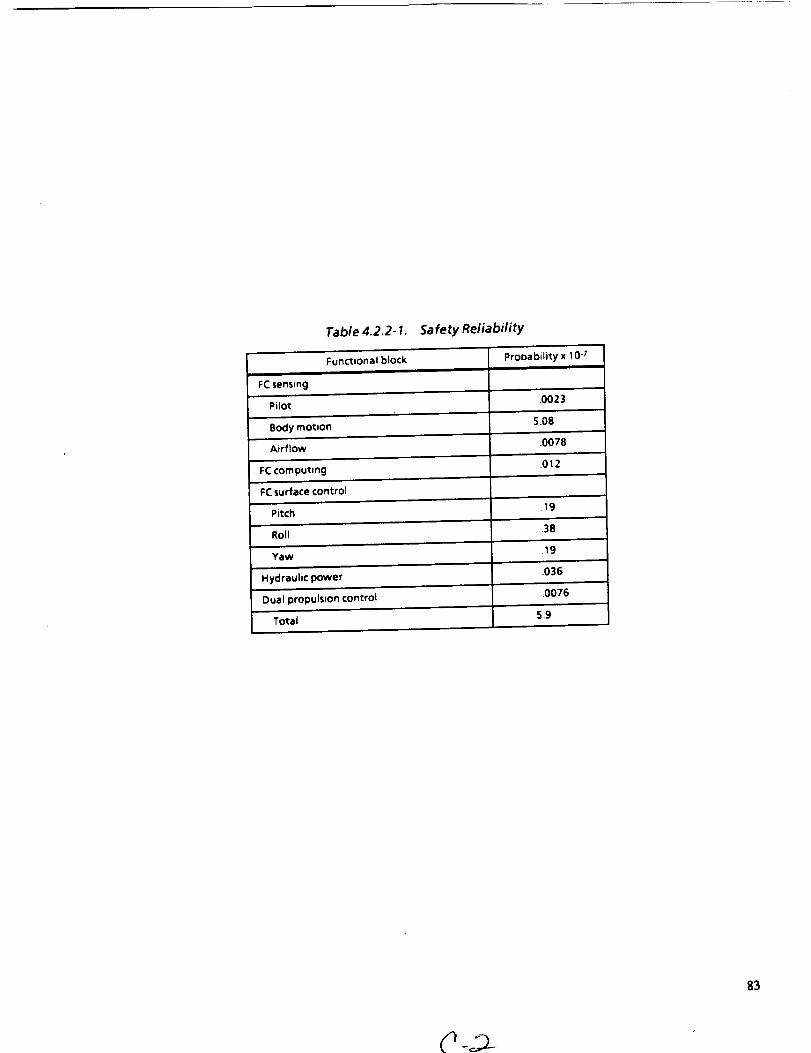
Table 4.2.2-1. Safety Reliability
Functional block Probability x 10 .7
FC sensing
Pilot ,0023
Body motion 5,08
Airflow .0078
FC corn put=ng .012
FC surface control
Pitch .19
Roll .38
Yaw 19
Hydraulic power .036
Dual propulsion control .0076
=
Total 5.9
83
/Q _-h

second dominant surface control situation is a pair of critical surfaces
failing passive.
The element failure modes that take part most often in surface control
failure sequences are undetected actuator channel failures and mechanical
jam failures. Undetected failures include actuator processor or position
sensor faults not covered by the local redundancy management, as well as
active DIU faults. It should be noted that there is a large uncertainty
associated with the probability of these failures. For the nominal values
used in this analysis, the surface control failure sequences were
significant to aircraft safety.
The full mission capability unreliability for the system is shown in
table 4.2.2-2. Details are presented in reference 9, and a short summary
is covered below.
Early evaluation results showed that sequences with one- and two-
element failures dominated the loss of mission capability for the candidate
architecture. The only flight control section models that could affect
mission capability at this failure level were those that evaluate the
conditions which lead to a single passive surface. For this reason many
flight control sections were not used in the mission capability evaluation.
The mission success likelihood was unsatisfactory for the candidate
architecture. The major area of weakness was failures leading to central
actuator management action to deactivate actuation devices. These are all
cases in which full mission capability is lost at first failure. The
specific failures consisted of active DIU failures, undetected actuator
controller faults, and propulsion actuator control valve jams. The
parameters associated with all of these failures have a large uncertainty.
The reliability aspects of the candidate architecture were not
completely modeled. However, the results were carried far enough to show
the need to change the design concept to better meet the reliability
requirements. The key safety concern is that certain two-failure sequences
cause loss of capability. Certain single failures could also cause loss of
mission capability.
84

Table 4.2.2-2. Mission Capability Reliability
Functional block
FC surface control
Pitch
Roll
Yaw
Propulsion system (per engine)
Fixed inlet
Fixed guide vanes
Engine core sensing
Core fuel metering .016
Afterburner metering .076
Fixed nozzle
Engine computation
Propulsion DIU active fault _
Aircraft total
*NOt in models
Probability x 10 "4
.18
.36
.18
.046
.031
.00066
.045
.0015
.11
1A
85

4.3 CANDIDATEPEEFORMANCEEVALIIATION
The steps in the performance analysis carried out on the IAPSA II
candidate system architecture are shown in figure 4.3-1. These steps are
described in reference Ii.
The control law design effort defined the necessary application timing
requirements. The design effort defines the update rate needed for
satisfactory performance of each control function. The fundamental
performance requirement is to perform all the computing and I/O activity
defined by the design effort in the available update period.
Control law performance is affected by the end-to-end time delay
between the reading of a sensor and the start of the resulting actuator
movement. This time delay interval is illustrated in figure 4.3-2 for a
specific sensor/actuator pair. The effect of time delay on control law
performance ranges from imperceptible to rough handling characteristics to
loss of control in extreme cases. A time delay value of one control cycle
period or frame was assumed to be the criterion for satisfactory IAPSA II
performance. The figure also illustrates deadline margin, which measures
how close the control cycle activity is to exceeding the cycle completion
deadline.
The control law design is usually based on a sampled data approach that
implicitly assumes uniform sampling periods or regularity in the control
cycle repetition rate. The important control cycle actions with respect to
lack of regularity or jitter are the reading of sensors and commanding of
actuators.
4.3.1 Development of Tining Model
The performance model was developed in three distinct, sequential
phases. In these phases the application timing data was built up and
organized manually using simple timing charts. Situations involving
variable timing needs or contention for shared resources were not
considered until development of the simulation model. Details of the
timing model development are presented in reference 9; highlights are
discussed below.
86

Synthesizecandidate
architecture
-[Identify criticalissues forvalidation
tDefine
experiments
Build model 1_
Collect data
Reasons for
rejection _C .andidate_
rejected
Candidate
accepted
I Specify systemarchitecture
Figure 4.3-1.
Refinearchitecture
Performance Evaluation Methodology
8"7

Appli- Ication
vo !r/i//Asystem
0 ms
Legend:
_7_ Input
/ Output
H!viiiA !VliiA
10 ms 20 ms
_Time delay
F--t Oo,_,,n,_,_,nFigure 4.3-2. Example Application--Update Rate 100 Hz
iVIIIA .__30 ms
88

The application activity vas organized according to the computing
subfunctlon allocation defined earlier. All functions vlth the same update
rate were combined into a single rate group. That is, the computing and
I/0 activity for all the functions in the same rate group were handled
together. Therefore, if more than one function needs to communicate with
the same DIU, the DIU is accessed only once, reading all sensors or
commanding all actuators needed by the functions in that rate group. This
consolidation of message traffic reduced the I/0 demands of the
application.
The initial timing phase assumption was that the control cycle for each
application rate group starts with the input I/O activity needed by the
rate group, followed by the compute activity, and finally by all output I/O
activity. This particular organization of the I/0 activity is referred to
as separated I/O.
I/O activity was assumed to be nonpreemptable; once started it runs to
completion. A sequencing and control function controls access to the
single I/O network, vhlch is shared by all rate groups. Activity from each
rate group is executed in order of priority, with the fastest rate first.
In contrast to the single shared I/O network, the computing for each
application rate group was assumed to have its own dedicated processor.
The computing duration was based on execution of the allocated control
subfunctlons on a 3 Hips processor. The mean computing workload for each
control function (less the allowance for growth) was based on section 3
data.
The remaining initial model assumptions dealt with the I/O activity
duration. The two major elements are DIU processing and the duration of the
command and response messages. The DIU requires some overhead processing
time to decode, verify, and act on command messages and prepare the
response message. Times were assumed for all of these operations and used
in the timing buildups.
The second major I/0 activity element is the duration of the command
and response messages sent on the I/0 network. A primitive format was
initially assumed for these messages, vhlch together with the network
transmission rate of 2 Hb/s was used to estimate the timing elements.
89

There were two conclusions at the end of this initial timing
development phase. First, the flight control application computing rate
groups would contend for the computing processor. Second, it was clear
that the engine control group was very lightly loaded by the application
when compared to the flight control group.
The second phase in the performance model development added more detail
to the I/O activity modeling. One important characteristic of AIPS
operation is the exact voting of output data and the source-congruent voted
exchange of input data across FTP channels. The model of I/O activity
duration was expanded to include this voting process, which is accomplished
by the IOP using the data exchange.
Before sending actuator command frames, the IOP votes all of the
associated data while loading the IOS. Similarly, after receiving all
sensor response frames, the IOP distributes data to all FTP channels via
the data exchange. The speed of the data exchange used to calculate the
duration nf IOP involvement in the IlO activity was 6 Us per word for
Bloading the IOS and 8 Us per word for unloading the IOS.
In the second phase, each rate group was assumed to have its own CP and
IOP. The application rate group computing was explicitly allocated to the
CP. Also, the command/response message formats were updated to the actual
AIFS network protocol. The format also defines the amount of data that
must pass through the data exchange for each actuator command frame and
sensor response frame.
The result of these changes was additional contention for the processor
in the flight control group. The engine control group continued to exhibit
no apparent timing problems.
In the third phase of the performance model development the overall I/O
activity vas reorganized by grouping the input I/0 activity and output I/0
activity into a single network activity per rate group. This II0
organization is referred to as grouped I/O. The transmission of the
actuator commands from the previous control cycle is combined with the
transmission of the sensor read commands for the current control cycle.
This reduces the loading on the I/O network because VIUs that have both
sensors and actuators are now onlY accessed once per application cycle.
90
A control cycle begins with the grouped I/O activity that transmits the
commands from the previous cycle and requests sensor data for the current
cycle. The final change to the model was the assumption of a single CP and
IOP, which must be shared by the different rate groups. The control
function allocates the CP or the I0P to the fastest rate group needing
service.
The data showing the status of the developed timing model at the end of
the third phase are shown in figures 4.3.1-I through 4.3.1-3. The effect
of the change to grouped I/O is to reduce somewhat the network utilization
and to increase the system time delay. As a result of the change, the time
delay was approximately one update period.
The performance data developed at this point formed the basis for the
simulation model. Certain key interactions due to resource contention,
fault processing, etc., were to be evaluated via simulation.
4.3.2 Critical Performance Issues
High-level performance-related validation issues were defined for the
candidate architecture. These critical issues involve ways that timing
performance can prevent safe operation. Because special situations or
operating circumstances can be a key factor, these issues were identified
in time to drive the development of the simulation model. Thus, they can
be studied early in the design cycle when the cost benefit ratio for
improvements is very favorable.
Two performance-related issues were identified for this effort. The
first is the effect on performance of the relative phasing of the
application activity and the system FDIR activity. The second is the
effect on the application activity of the IlO network repair actions.
The first concern is whether certain phaslngs between scheduled
application executlon and the FDIR process can significantly degrade
performance. If so, a mechanism to control the relative phasing will be
required.
The second concern deals with the effect of network repair actions.
Each major group in the reference configuration has two reconfigurable I/0
networks. The sensors and actuators are distributed between these networks
91

Rate
DIU operaUons
SR AC ASC AS
100Hz
$1 6
$2 6
OFL 1 1 1 1
OFR 1 1 1 1
IFL 2 1 1 1
IFR 2 1 1 1
TEL 1 1 1 1
TER 2 1 1 1
Totals 21 6 6 6
50Hz
$1 2
$2 2
CP1 3
CP2 3
CDL 1 1 1
CDR 1 1 1
RL 1 1 1
RR 1 1 1
N 1 1 1
LER 3 3 3
Totals 10 8 8 8
25Hz
$1 1
CP1 1
Totals 2
Sensor command
frame (words)
AP Overhead Data
5
5
1 5 2
1 5 2
1 5 2
1 5 2
1 5 2
1 5 2
6 40 12
5
5
5
5
1 5 2
1 5 2
1 5 2
1 5 2
1 5 2
3 5 6
8 50 16
5
5
10
Data
exchange
of outputcommand
data (words)
5
5-1/2
5-1/2
5-1/2
5-1/2
5-1/2
33-1/2
5
5-1/2
5-1/2
5-1/2
5-1/2
9-1/2
37-1/2
Sensor response
frame (words)
Overhead Data
Data
exchange
of response
data (words)
5 6 11-1/2
5 6 11-1/2
5 3 8-1/2
5 3 8-1/2
5 4 9-1/2
5 4 9-1/2
5 3 8-1/2
5 4 9-1/2
40 12 77
5 2 7-1/2
5 2 7-1/2
5 3 8-1/2
5 3 8-1/2
5 2 7-1/2
5 2 7-1/2
5 2 7-1/2
5 2 7-1/2
5 2 7-1/2
5 6 1!-1/2
50 16 81
5
5
10
SR Sensor read
AC Actuator command
ASC Actuator safe command
AS Actuator status
AP Actuator position
Figure 4.3.1-1. Flight Control Computer Revised AIPS Application Timing
4-1/2
4-1/2
9
92

Rate
100
5O
25
Loadcommand
396
444
Networkcommand
1,735
1,842
266
Unload
response
1,232
1,296
144
Compute
1,723
3,016
7,100
Resulting utilization:
CP 50.06%
lOP 25.34%
Network 27.23%
Figure 4.3.1-2. Flight Control Compute[ Revised AIPS Application---Timing Rate Values
CP I' ' ' I II I '''' I'' I
0 ms 10 ms 20 ms 30 ms 40 ms
K_P i , , Ii i , , i , i s i i i , w , , , , , , 'I ..... ''''I
._,=n=A,,,, ,n,!,,,,,,,n=I-I,,,,,n,, ,,,, ,,''''''1'''''''''1'' ''''''1'''''''''1
Legend:
c DDFDIR 100Hz 50Hz 25Hz
Figure 4.3.1-3. Right Control Computer Revised AIPS Application Timing
93

for fault-tolerant operation. When a failure brings down one network the
application continues using the sensors and actuators accessible via the
other network. If a fault occurs on the second network before completion
of first network repair the result is loss of control. Thus the network
repair duration is a critical issue.
Another major concern is the interaction between the repair activity
and the application activity. The repair algorithms involve many
processing and IlO activity steps using the IOP and the network. Timely
execution of repair is affected by the application's need to communicate
over the unfaulted network, which also involves IOP processing. The timing
performance of the application must be acceptable during the repair
activity. Because of the compl4xity of the interaction of the repair
activity and the application, the duration and effect of the repair
activity is addressed most effectively with simulation techniques.
Two IlO network repair strategies were evaluated: one-shot and full
regrow. The one-shot strategy is characterized by rapid diagnosis and
specific repair actions. Full regrow is the same process used to grow the
I/O network at power on. It uses a robust sequence of steps to grow a path
to all good devices reachable with the unfailed network elements.
4.3.3 Simulation Experiments
This section describes the experiments performed with the IAPSA II
simulation model. The experiments involved two separate models: a model
of the flight control group and a model of the engine control group. This
allowed comparison between a large, heavily loaded system and a relatively
small, lightly loaded system. Details of the experimental procedure are
presented in reference 9.
IlO Net-,,orkRepair Time (Experiment 2). The objective of experiment 2
was to measure the time needed to successfully return a network to service
after it experienced a network fault. This experiment also evaluated the
effect of the additional network repair processing on the timing
performance of the application. Each active link in both the flight
control and engine control networks was failed passively in this
experiment.
94

I/O Scheduling (Experiment 3). The purpose of experiment 3 was to
evaluate the effect of the I/O scheduling mechanism on the performance of
the application during normal operation. The system services software
provides two mechanisms for scheduling the application I/O activity.
During the performance simulation activity, we referred to these two
alternatives as on-demand I/O and scheduled I/O. In our simulations of the
on-demand I/O capability, the application process makes an I/0 request at
the beginning of each cycle and then suspends itself. When the I/O has
completed, the application process resumes. In our simulations of the
scheduled I/0 alternative, the system software executing in the IOP makes
the I/O request periodically. The CP application computing is scheduled by
the completion of the I/O activity each cycle.
The two I/0 activity organization schemes, separated I/O and grouped
I/O, were also simulated. Experiment runs were made for each I/O
scheduling mechanism and I/0 activity organization combination.
FDIR/Application Phasing (Experiment 4). The objective of experiment 4
was to evaluate the effect of the relative phasing of the application
activity and the system FDIR process. The FDIR and application demands
were evaluated during normal operation. The system time scheduler assumed
for this study has a Eranularity of 1 ms. That is, time-scheduled tasks
can only be specified to the nearest even millisecond. The ten specific
relative phasing situations possible because of the 10-ms minor frame
period were simulated.
CP, IOP, I/O System, I/O Network Utilization (Experiment 5). The
purpose of experiment 5 was to estimate the utilization of the key
candidate system resources during normal operation. Major areas of
resource contention were modeled for this experiment. This includes
contention between the different application rate groups, as well as the
previously described contention between the application rate groups and the
time-critical FDIR function. A preemptive priority sequencing and control
algorithm was modeled to control processor allocation.
The experiment identification data are shown in table 4.3.3-1.
Because application demands will not necessarily grow uniformly across
all the system resources, growth capability was assessed by instrumenting
95

ExperimentTable 4.3.3-1. Experiment Configuration
Configuration ID Layout FDIR coordination I/O scheduling I/O grouping
4 Flight control No On demand Grouped
4 5 Flight control No On demand Separated6 Flight control No Scheduled Grouped
10
11
12
13
141516
Flight control regrowrepair strategyFlight control one-shotrepair strategyEngine control regrowrepair strategyEngine control one-shotrepair strategy
Engine controlEngine controlEngine control
Yes
Yes
Yes
Yes
NoNoNo
Scheduled
Scheduled
On demand
On demand
On demand
On demand
Scheduled
Grouped
Grouped
Grouped
Grouped
Grouped
SeparatedGrouped
96

four key resources: CP, IOP, I/O system and the I/O network. It should be
noted that I/O system utilization starts when an application I/O request is
made, and ends when all application activity is complete and the system can
immediately respond to a new request. Deadline margin is a figure of merit
used to indicate how well the system was meeting its periodic control cycle
requirements; that is, how close the system was to missing a time-critical
action. The time delay figure of merit is an overall indicator of time
delay for a particular rate group. Deadline margin and time delay were
described in section 4.3 and illustrated in figure 4.3-2.
4.3.4 Simulation Model
Boeing selected the Discrete Event Network (DENET) simulation
language to develop the simulation model for the IAPSA II reference
configuration. DENET was developed at the University of Wisconsin Computer
Science department by Dr. Miron Livny. It is a discrete event simulation
language based on the Discrete Event System Specification modeling
methodology. This methodology is complemented with the MODULA II
programming language, which alloys the DENET tool to incorporate
algorithms.
DENET simulations are composed of discrete event modules (DEVM) and
arcs, which connect outputs of one DEVM to inputs of another. Each DEVM
models some function of the system; the function can be either a high-
level abstraction or a very detailed emulation. DEVMs receive input and
generate output through ports. A simulation model consists of a group of
DEVMS connected wlth arcs. Each instance of a DEVM is characterized with
input parameters. The input parameters allow the modular to parameterize
the specific DEVM behavior so that modular building blocks can be
supported. The DENET language is described in reference 12.
The DENET simulation is set up vlth a topology file that defines DEVMs,
their parameter values, and their interconnections. By implementing key
functions in DEVMs and defining appropriate arc definitions, a complete
simulation of the reference configuration was developed. Details of the
resulting IAPSA II DENET model are provided in reference 9. An overview of
the key DEVMs is presented next.
97

The Processor DEVM models the sequencing and control functions that
execute on either the CP or lOP. This sequencing is based on a preemptive
priority scheme in vhlch the highest priority process acquires the
Processor until it completes or until a higher priority process becomes
ready. The Processor maintains a priority queue of processes waiting to
use the Processor. When a process completes, the first element of this
queue acquires the Processor. If a process makes a request to use the
Processor it is either inserted into the priority queue or it acquires the
Processor and preempts the currently running process, depending on relative
priority.
Overhead processing is necessary to accomplish the task sequencing and
control. This overhead can dominate a processor's activity, depending on
the sequence in which processes become ready to execute and the amount of
time needed to switch processes. A value of 0.300 ms was used to model the
time needed for sequencing and control overhead in the Processor DEVM. A
process switch was assumed to be an uninterruptible operation; once begun a
new request is not recognized until the completion of the first.
The I0 Service DEVM models the software functions that execute
primarily in the IOP. This DEVM interfaces with the input/output sequencer
(IOS) DEVM and the Application DEVM. The model focuses on the software
that performs the processing in response to an I/O request or the
completion of I/O activity. The complex IO Service process model resulting
from the initial simulation efforts is described in detail in reference 9.
Key operating features are indicated in figure 4.3.4-1.
The Application DEVM is a generic DEVM that models the functionality of
a single application rate group. The Application DEVM can be configured to
perform the workload of any flight control or engine rate group. Its
execution sequence can be configured for either on-demand or scheduled I/O.
The DEVM models data-dependent processing requirements using a normally
distributed workload distribution for the needs of each application cycle.
The IOS DEVN executes chains requested by the I0 Service DEVM and
collects data resulting from chain execution, t/hen commanded to start a
chain, the IOS DEVM sends command frames to the adjacent node and waits for
the response frames as needed until the I/0 activity is finished.
98

v_L
99

The AIPSNODE DEVM models the I/0 network node that is used to construct
the mesh reconfigurable network. During normal operation, the AIPSNODE
DEVM acts as a rebroadcast element. Any activity received on an enabled
port is immediately retransmitted to all the other enabled ports. The
AIPSNODE responds to reconfiguration commands addressed to it by changing
its port configuration and then sending a response frame that contains the
node's status. This allows detailed modeling of the network repair
activity directed by the network manager.
The DIU DEVM simulates the network device to which the application
sensors and actuators are connected. The DIU DEVM models receipt of
messages from the application. The DIU model schedules the transmission of
a response message at a time consistent with the required DIU overhead
processing time. The DIU DEVM models the statistical variation of the DIU
processing time.
The Network Manager DEVM is responsible for maintaining Communications
between the application process and the DIUs. The IO Service DEVM notifies
the Network Manager DEVM when the application process encounters a
communication fault. From this point on, the IO Service does not execute
any application chains on the faulty IlO network until the Network Manager
notifies it that the repair is complete.
Prototype algorithms for the one-shot and regrow repair strategies are
implemented in the DEVM. A configuration item in the IO Service DEVM
dictates which type of strategy will be used in the current experiment to
repair the IlO network. This allows a common DEVM to be used for both sets
of experiments.
The simulation timing input parameters and listings of the DEVMs are
presented in reference 9.
4.3.5 SimulatlonResults
Experiment runs to satisfy the objectives of experiments 3, 4, and 5,
aimed at measuring performance during normal operation, were conducted
first. Later, experiment 2 runs were performed to evaluate performance
under certain network failure conditions.
lO0

Experiments 3, 4, and 5. The purpose of experiment 3 was to evaluate
the effect of different I/O activity scheduling and grouping options while
experiment 4 evaluated the effect of the relative phasing of the high-
priority system FDIR process and the application activity and experiment 5
measured utilization of key resources during normal operation. Instead of
making separate sets of runs for each experiment, the utilization of four
key resources, the CP, IOP, I/O system, and the I/O network, was measured
during experiment 4 runs. Additionally, all experiment 3 alternatives were
evaluated in the experiment 4 runs. In this way a single set of
experiment 4 tests satisfied the objectives of experiments 3, 4, and 5.
For two of the flight control configurations (4, on-demand, grouped and
5, on-demand, separated), the application was unable to meet any control
cycle deadlines. The simulation result showed that the flight control
group was overloaded to the point that the application could not perform
its function using either of these organization options. Consequently,
configuration 4 and configuration 5 were eliminated as possible candidates.
A summary of the experimental data for confi&,uration 6 (scheduled -
grouped I/O organization) is presented in table 4.3.5-1. Details of the
comparison between phasing alternatives are discussed in reference 9. A
timing chart for the phase 0 configuration timing usin E Bean values is
shown In figure 4.3.5-1.
The workload on the engine control group is substantially less
demandln E than that on the flight control functions. Consequently, the
engine control computer is able to meet the deadlines of the engine control
functions in all of the I/O scheduling and I/O groupings alternatives.
The deadline marElns and utilization values for configurations 14, 15,
and 16 are illustrated in tables 4.3.5-2 through 4.3.5-4. No data are
available for phases 1, 2, 3, 7, and 8 of confiEuratlon 15 because a
simulation error prevented correct modeling of the overrun policy.
Experiment 4 showed that the phasln E of the FDIR and the application is
critical, especially in heavily loaded cases. A means must be provided to
control the relative execution phasing of the FDIR process and the
application. Additionally, the simulation showed that the system loading
I01

Table 4.3.5-1. Experiment 4 Configuration 6 Summary--Flight Control Group
Phase/ID
100-Hzminimumdeadline
margin, ms
2.934
2.704
2.704
50-Hzminimumdeadline
margin, ms
7.007
Missedsevendeadlines
Missedseven_l?AdlinesMissedsevendeadlines
25-Hzminimumdeadline
margin, ms
15.538
10.188
10.188
CP
utilization, %
86
86
86
lOP
utilization, %
72
72
72
I/0 systemutilization, %
80
93
88
VO networkI ., ,
iutilization, %
28
28
28
3 2.704 10.188 86 72 83 28
4 3.370 0.319 10.320 86 75 78 28
5 0.508 1.287 10.267 86 75 84 28
6 0.653 7.848 9.896 86 75 79 28
Missed7 0.551 seven 10.188 86 75 92 28
deadlines
8 0.851 10.188 86 72 91 28Missedseven
de_n_l_!ines
0.6251.9059 11.529 86 73 87 28
tO2

CP
I JMajor frame r 1
_-'--Minorframel _ Minorframe2@ Minorframe3@ Minorframe4-_
0 ms 10 ms 20 ms 30 ms 40 ms
lOPtn, r rl,,rl , rq,,1,,In, nl],
+ l-l,,,n,,,l,,,,,n,,,network i , + J , + i + , + J + + , + + i i + + + + + I + I I J J J J I _ , J = I
Legend:
= DFDIR 100Hz 50Hz 25 Hz
Figure 4.3.5-1. Flight Contro/ Computer Phase 0 Time/ine
103

Table 4.3.5-2. Experiment 4 Configuration 14 Summary
Phase/ID
100-Hzminimumdeadline
margin, ms
5.657
8.440
6.440
6.440
7.140
7.140
7,140
7,140
4.540
4.840
50-Hzminimumdeadline
margin, ms
13.598
14.898
14.898
14.898
15.560
15.560
12.998
13.298
14.041
25-Hzminimumdeadline
margin, ms
31.941
33.241
33.241
33.241
33.241
31.341
31.341
31.641
32.384
CP
utilization, %
51
48
48
48
51
51
51
51
51
lOP
utilization, %
53
58
58
58
58
58
58
56
56
12.598 30.941 51 55
1/Osystemutilization, %
57
46
46
46
39
39
39
56
5O
67
I/O networkutilization, %
[04

Table 4.3.5-3. Experiment 4 Configuration 15 Summary
Phase/ID
100 Hzminimum
deadline
margin(ms)
50 Hzminimumdeadline
margin(ms)
25 Hzminimumdeadline
margin(ms)
CPutilization
lOPutilization
I/0 systemutilization
I/0 networkutilization
0 4.134 9.996 19.867 51 84 96 7
No data available
4 5.146 9.889 29.037 50 87 93 7
5 6.144 11.647 28.612 51 86 94 7
6 6.144 11.998 29.337 51 86 95 7
7
8No data available
4.743 12.300 30.680 51 87 97 79
]O5

Phase/ID
100-Hzminimumdeadline
matin, ms
5.841
7.440
7.441
Table 4.3. 5-4.
50-Hzminimumdeadline
matin, ms
13.815
16.115
16.115
Experiment 4 Configuration 16 Summary
25-Hzminimum
deadline
matin, ms
32.192
34.492
34.492
CP
utilization, %
42
42
42
lOP
utilization, %!
53
55
55
I/0 systemutilization, %
60
62
52
3 7.141 16.115 34.492 42 55 42 7
4 7.140 15.815 34.192 42 58 42 7
5 7.140 15.815 31.592 42 58 42 7
6 7.140 13.215 31.592 42 58 42 7
7.140 42
42%
42
13.515
14.258
31.892
32.635
56
56
5531.19212.815
4.540
4.840
59
54
7O
I/O network
utilization, %
106

was more severe than indicated by the manual estimates; this was primarily
due to resource contention and task sequencing and control overhead.
Experiment 2. The purpose of experiment 2 was to measure the time
needed to successfully return a faulty network to service. In addition,
the experiment evaluated the affect of the repair processing on
application performance. Experiment 2 faults were inserted at a random
time relative to the major frame for each run. For each link the
experiment was repeated 50 times.
The first set of runs (configuration 11 and configuration 13)
incorporated the one-shot repair strategy. The IlO network mean out-of-
service times for the flight control group are shown in table 4.3.5-5. A
summary of _he application performance measures for each link failure
sequence is also illustrated in the table. The CP utilization is not
included in the summary because it is not affected by the network repair
activity. In addition, the IlO network utilization is not included because
it is not affected on the "good" network, while the repair activity has
exclusive use of the failed network. A discussion of some of the
differences observed when comparing table 4.3.5-5 to the normal flight
control group results in table 4.3.5-1 are presented in reference 9.
The I/O network out-of-service times for the engine control
configuration are shown in table 4.3.5-6. These times are faster than the
flight control configuration because there is more idle IOP capacity to
perform repair activity. A summary of the deadline margin and utilization
data for each link failure is also shown in the table.
The one-shot repair strategy is able to diagnose and repair only a few
active network failures. The duration of network repair activity when a
full regrow strategy is invoked was measured with the next set of runs.
This provides a reasonable approximation of the repair time for active
failures, because a more time-consuming regrow action must be used to
guarantee a working network when the other strategy fails.
The I/O network out-of-service times for the flight control group
(configuration 10) are shown in table 4.3.5-7. The significant difference
between this repair strategy and the one-shot strategy is that the out-of-
107

Failedlink
Table 4.3.5-5. Exper_rnent 2 Configuration 11 Summary
Out-of-service time
mean, ms
100-Hzminimumdeadline
margin, ms
50-Hzminimumdeadline
margin, ms
28-70 17.1 O0 2.927 2.549
70-71 35.034 2.959 2.523
70-79 35.204 2.897 2.618
70-87 34.961 2.835 2.531
71-72 37.562 3.003 2.286
71-75 35.174 2.914 2.531
79-78 2.94534.903
79-80 35.474 2.851
87-83 34.338 2.972
87-86 36.071 2.930
72-73 37.562 2.689
75-74 37.562 2.884
2.559
2.488
2.607
2.556
25-Hzminimumdeadline
margin, ms
lOP
utilization, %
11.355 78
11.561 78
11.189 78
11.387 78
11.153 78
11.267 78
11.134 78
11.146 78
79
i0 systemutilization, %
68
68
68
68
68
68
68
68
11.418 68
11.167 78 68
10.946 78 692.570
2.577 10.946 78 69
11.164 78 6875-76 34.160 2.950 2.410
78-77 34.140 2.948 2.471 11.309 78 68
80-81 34.140 2.948 2.471 11.309 79 68
80-64 34.562 2.967
83-82 34.160 2.950
37.562 2.92586-85
2.485 10.946 78 68
2.410 11.164 79 68
2.649 10.946 78 68
108

Failed link
Table 4.3.5-6. E:_
Out-of-service
time mean, ms
100-Hzminimum
deadline
margin, ms
Jefiment 2 Configuration 13 Summary
50-Hzminimum
deadline
margin, ms
25-Hzminimum
deadline
margin, ms
lOP
utilization, %I/O systemutilization, %
• i i
28-70 7.507 7.141 15.598 34.022 59% 39%
70-71 26.000 7.040 14.749 33.078 63% 38%
70-72 22.802 7.142 15.595 33.989 64% 38%
70-73 23.301 7.147 15.448 33.996 63% 39%
I09

Failedlink
28-70
70-71
70-79
70-87
71-72
71-75
79-78
79-80
87-83
87-86
72-73
75-74
75-76
78-77
80-81
80-84
Table 4.3.5-7. Experiment 2 Configuration 10 Summary
Out-of-service time
mean, sec
1.0889
100-Hzminimumdeadline
margin, ms
2.995
50-Hzminimumdeadline
margin, ms
2.582
25-Hzminimumdeadline
margin, ms
11.124
lOPutilization, %
79
I/0 systemutilization, %
68
1.0853 2.691 2.703 10.914 78 68
1.0834 2.893 2.584 11.206 78 68
1.0831 2.928 2.560 11.257 78 68
1.0808 2.905 2.603 11.328 78 68
2.742 2.723
2.342
2.667
1.0878 10.887
10.964
11.291
2.965
2.868
1.0778
1.0838
2.916
1.0732 2.928 2.597 11.571
1.0981 2.779 2.561 10.930
1.0934 2.977 2.432 11.167
1.0808 2.456 11.103
2.9631.0802
78
78
78
79
78
78
78
782.371 11.548
68
68
68
68
68
69
69
68
1.0919 2.974 2.641 11.526 78 68
1.0710 2.765 2.539 11.787 79 68
1.0872 2.935 2.754 10.914 78 68
83-82 1.0808 2.880 2.454 10.944
86-65 1.0949 2.954 2.192 11.052
79
78
68
68
110
service times are substantially larger. Some application performance
measures for this experiment are also summarized in table 4.3.5-7.
The out-of-service times for the engine control group (configuration
12) are shown in table 4.3.5-8. The full regrov strategy requires
significantly more time than the one-shot repair strategy for the engine
control group. The table also summarizes the application performance
parameters.
4.3.6 Experiment Observations
The simulation results presented an optimistic picture of the candidate
architecture performance. The system was assumed to operate near certain
hardware limits. When more realistic values for the system overhead
functions are available from proof-of-concept testing, the performance
measures will probably suffer. Furthermore, some key performance
interactions were not modeled in the performance simulation. These include
IC network operation and the operation of the shared bus in each FTP
channel.
The application sends time-critical data across the IC network. One
concern is the ability of the IC network to meet the tlme-critical end-to-
end data transfer requirements of the application during normal operation.
Since the IC network operates with unsolicited messages, it must be
periodically polled to determine whether any communication has been
received. This IC communications process executes on the IOP, which is
also responsible for the application IlO operation. Therefore, another
concern is the effect of IC network communications on the application I/O
activity.
For the application to complete its I/O and IC activity, it must
transfer data from the CP to the lOP through a shared bus. The shared bus
has tvo states, locked and unlocked. I/hen the shared bus is locked, access
to other users is blocked. A major concern is whether a lack of
coordination between the system processes in the CP and lOP can lead to
shared bus utilization problems. Thls is another potential cause of
serious degradation in the application performance. (Overall observations
111

Table 4.3.5-8. Experiment 2 Configuration 13 Summary
Failed link
Out-ofservice time
mean, ms
100-Hzminimumdeadline
margin, ms
50-Hzminimumdeadline
margin, ms
25-Hzminimumdeadline
margin, ms
lOPutUizatJon,%
I/0 systemutilization, %
28-70 170.261 7.141 15.598 34.022 59 39
70-71 161.781 7.040 " 14.749 33.078 63 38
70°72 160.137 7.142 15.595 33.989 64 38
70-73 166.640 7.147 15.448 33.996 63 39
112

about the use of a performance tool to evaluate the candidate architecture
are discussed in section 6.)
4.4 REFINED ARCIHTECTURE
The candidate system evaluation effort described in section 4.2 and 4.3
demonstrated that the candidate was not capable of meeting the system
requirements. The predicted safety and mission unreliability values
exceeded the system constraints. Furthermore, the predicted timing needs
of the major control functions did not leave adequate growth capability.
The flight control group workload strained the system capacity in both
computing and IlO activity. As a result, the IAPSA II.candidate system
concept was refined to improve its performance and reliability.
Three approaches were taken to refine the candidate architecture to
better match the system needs. The first approach was to balance the
computing and I/O workload between the engine and flight control groups.
The preliminary timing estimates showed that the flight control group was
heavily loaded, whereas the opposite was true for the engine control group.
Shifting the system workload from the flight control group to the engine
control groups suggested an improved growth situation.
The second approach was to improve the system failure protection. A
goal for the refined configuration is to maintain flight safety with all
two-failure sequences and to maintain full mission capability with all
single failures. Steps taken to achieve these goals will be discussed later
in this section.
The final approach for refining the architecture was to reduce the
number of communication elements in the system. Large networks have
several disadvantages when compared to small networks. The preliminary
DENET simulation experiments showed how the size of the individual networks
dramatically affected the time needed to regrow a network. Another
negative characteristic of large networks is that the probability of
network repair action increases vlth the number of elements. Finally, from
a performance standpoint, when a fixed number of sensors and actuators are
spread across fewer interface devices, the number of transactions needed to
access them are reduced. Since the transaction overhead time is a big
113
contributor to I/O activity duration, reducing the number will decrease the
I/O workload. In summary, reducing the number of communication elements
should improve both the performance and reliability aspects of the system
concept.
The resulting refined configuration is shown in figure 4.4-1. The most
significant change is the organization of system components into two major
groups organized around two computing sites, A and B, instead of three.
This configuration is physically similar to one of the options considered
for the candidate architecture in section 3.5. The two engine control
groups of the candidate architecture are collapsed into one. Functions are
reallocated to better balance the system.
4.4.1 Refined System Changes
The application computing functions were reallocated because the
performance analysis shoved that the flight control site was overloaded,
while the engine control sites were underutilized. Rather than change the
redundancy level of one of the two engine control sites, the refined
configuration was given two quadruple redundant computing sites. This
means that each site is suitable for safety-critical functions and that the
function reallocatlon process can be relatively unconstrained.
Furthermore, this new configuration will be more adaptable to a single-
engine vehicle.
The first step in changing the computing allocation was to combine the
control for both propulsion systems in site B. Next, the high-workload
trajectory-follovlng function was allocated to site B. Finally, the air
data functions were moved to site B, since the inlet control function uses
the highest air data rates and, in addition, this move helps reduce the
congestion on the group A IlO network.
The configuration and functlonallty of the candidate propulsion system
were reevaluated during the refined configuration effort. Some changes
were made as a result of this study. The changes ranged from device
nomenclature adjustments to revised ground rules for the mission capability
and safety effects of propulsion subsystem failure conditions. An overview
114

I/0network
Rightsensors/actuators
1Sensors/actuators
ICnetwork
FTPA FTPB
I/0 network
Figure 4.4-1. Refined Configuration Overview
Leftsensors/actualors
115
of the differences in the refined propulsion system definition is provided
in reference 9.
Data Distribution. There were many possible alternatives to the
candidate architecture data distribution approach. 0nly two data
distribution options were looked at in detail during the refinement effort.
One of these incorporated a minimum change to the candidate data
distribution concept, and the other replaced the mesh network with a set of
buses. Even in the bus option, the data distribution interface changes
were minor.
The first data distribution problem is that the I/O system growth
capability for the flight control group is inadequate. The I/0 activity
overload problem was addressed by reducing the number of transactions on
the flight control network. The first step, moving the air data sensors
off the flight control network, has already been mentioned. The next step,
consolidating the system DIUs, will have several beneficial effects. From
a performance standpoint, fewer DIUs means that fewer transactions are
needed to communicate with the system sensors and actuators. The amount of
data transferred that is directly associated with the devices is not
changed. However, the total amount of transaction overhead data, which is
proportional to the total number of transactions, is reduced. This change
reduces the amount of data passing through the data exchange and
transmitted over the bus.
There are reasons other than performance for reducing the number of
communication elements in the system. Large networks have more elements to
fail and require longer regrov repair times. Additionally, larger networks
can add to repair computation complexity and time. For these reasons,
reducing network size also provides a reliability benefit.
The candidate architecture uses two I/0 networks per group with the
redundant elements divided between them. Having two networks allows the
application to continue operating while one of the networks is being
repaired. As the number of networks increases, further dividing the
redundant system devices, there is eventually no need for inflight repair.
The aircraft can suffer the loss of an entire set of redundant devices and
still meet short-term reliability requirements.
116

For this reason, only two options for data distribution were considered
in the refined configuration study. These two options are shown in
figure 4.4.1-1. The natural redundancy in the system tends to separate the
sensors and actuators into four groups. This figure shows how two sets of
quadruple redundant enclosures would be connected with either two mesh
networks or four linear buses. The assignment of devices to enclosures for
these options is presented in tables 4.4.1-1 and 4.4.1-2.
I/O Network Option. The mesh network data distribution option is very
similar to the candidate architecture. The key changes are the
consolidation of network nodes and DIUs and the reallocation of system
devices. There are still two networks per major group. Figure 4.4.1-2
shows the layout of one of the group A I/0 networks. There are no
dedicated root nodes in this option; all root links are connected to nodes
that service DIUs.
The group B IlO network layout is shown in figure 4.4.1-3. Each group
B network is connected to elements on both engines. The air data sensors
and the throttle command sensors have been moved from the flight control
networks to group B. As with group A, there are no dedicated root nodes in
group B.
One big change in the network configuration is due to the dominant
reliability problem found in the candidate architecture. The reliability
evaluation of the candidate showed that this simple "brickwalled" scheme
easily satisfied system requirements, with the exception of the body motion
sensors. In the refined I/0 network option, the critical body motion
sensors are connected to both group A networks via dual-port DIUs. This is
shown conceptually in figure 4.4.1-4. A critical design requirement
generated by the cross connection approach in the refined configuration is
that no single failure in the dual-port DIU can cause simultaneous repair
activities on both networks. Note that the cross connection is only used
for the MID DIUs, where the reliability analysis showed it was required.
There are several alternatives for system operation with this cross-
connected configuration. These are discussed in reference 9.
Redundant Bus Option. An alternative data transfer system consists of
four nonreconfigurable linear buses. The number and arrangement of
117

\\
\\
\\\
\\
)
Figure 4.4.1-1.
LMesh Network and Linear Bus Options
118

Table 4.4.1-1. Sensor/Actuator Computer Connection-Group A
Node/DIU assignments
Device
Body accelerometersBody gyrosPitch stickRoll stick
Rudder pedalFlap leverPitch trimRoll trimYaw trimLeft canard
Right canardNosewheel
Leading edgeL outboard flaperonR outboard flaperon
L inboard flaperonR inboard flaperonL TE flapR TE flapL rudderR rudder
L outboard wing accelR outboard wing aecelL midwing accelR midwing accelL inboard wing accelR inboard wing accelFTP channels
(group A)
Forward
I I 1 1
1 I I I
I I I I
I I I
I I I
I I I
I I I
1 1 1 1
Mid
2 2 2 2
2 2 2 2
1 11 1
1 11 1
Right wing
I I
I I
1 I
1 1 1
1 1 1
1 1 1
Left wing
I I
I I
I I
I I I
I 1 I
1 I I
Tail
1 11 1
119

Table 4.4.1.2. Sensor/Actuator Computer Connection--Group B
Device
Angle of attack
Angle of sideslipStatic pressureTotal pressureTotal temperatureLeft throttle
Right throttleForward rampAft rampInlet bypass doorForward ramp 3 static pressureNormal shock total pressureNormal shock static pressureNozzle area
Thrust reversing vaneThrust vectoring flapFan face static pressureFan face temperatureFan speedCompressor speedBurner pressureFan turbine inlet temperatureAfterburner pressureFan guide vaneCompressor vaneFuel metering valveAfterburner oore metering v_veAfterburner duct metering valveAfterburner segment sequencerAfterburner light off detectorMain fuel shutoff
NodelDIU assignments
Air
I 1 I I
1 1 1 11 1 1 1
1 1 1 11 11 1
1 1
Inlet
I I I I
I I 1 I
I I I iI 1 1 I
I I I I
1 1 I I
Engine
1 1 1 1
1 1 1 11 1 1 11 1 1 1
1 1 1 11 1 1 11 1 1 11 1 1 11 1 1 1
1 1 1 11 1 1 11 1 1 1
1 1 1 11 1 1 1
1 1 1 1
Nozzle
I I I I
I I 1 I
I 1 I I
120

Deviceinterfaceunit
Abbreviations:F forwardareaM midareaRWrightwingLW leftwingT tailarea
Figure 4.4.1-2. Group A VO Network Layout
Legend:
Node
channel
121

Abbreviation=:A airdataRI rightinletRE rightengineRN rightnozzleLI left inlet
LE left engineLN left nozzle
Figure 4.4.1-3. Group B I/0 Network Layout
Legend:Deviceinterfaceunit
Q Node
_7_FTP channel
122

DualportDIU Nodes
2)Network 1\ /
_\x,,_\ -
/ \ Network 2
Figure 4.4.1-4. Body Motion Sensor Cross Connection
123

enclosures, DIUs, and devices is unchanged. All of the redundant devices
are divided evenly across the four buses. Since the bus is not
reconfigurable, there are no network nodes in the system. Communication
over the bus system is carried out just as it is over the mesh network.
The same command/response protocol is assumed for the bus option. The data
distribution interface and the IO system services are therefore assumed to
be identical in this comparison.
The bus option illustrates the limiting case where the number of
networks in a system is increased to the point that reconfiguration after
communication faults is not necessary. A major benefit of this step is the
elimination of the complex I/O redundancy management software. Typically,
validation of large, complex software processes is difficult and costly.
Since the bus option does not include any of the network reconfiguration
functionality, it sidesteps any associated validation issue.
To allow a more straightforward comparison between the mesh network and
bus options, some configuration details were kept constant in both. These
are described in detail in reference 9.
Electric Power Distribution. The fault-tolerant electric power (FTEP)
system study configuration (ref. 13) was used as a baseline for the IAPSA
II refined configuration. FTEP used four distributed load centers
(electric load management centers (ELMC)) to provide electric power to the
critical users. Main aircraft power buses are connected to the ELMCs,
which monitor the airplane source and switch when necessary. Each load
center has an unlnterruptible battery bus for dc users that is tied to one
of two aircraft batteries.
The simplest connection alternative for a system that is primarily
quadruple redundant is one ELMC source per enclosure. This alternative was
broadly evaluated with satisfactory results in the candidate architecture
reliability study. Each enclosure has a single local power supply that
satisfies the bulk of all enclosure needs. Nith this single connection
organization, care must be taken when assigning electrical connections.
All elements that have a dependency relationship (devices, DIUs, buses, FTP
channels) must be connected to the same ELMC source. This guarantees that
when a single source is lost only one level of redundancy for any device is
124

affected. Otherwise, loss of a single source could bring down more than
one redundant device via a dependency relationship.
The single power source alternative presented some special concerns for
the mesh network option that were not evaluated in the candidate
architecture analysis. Details of these concerns and their resolution are
provided in reference 9.
Actuation Changes. One area of concern in the candidate architecture
reliability study was surface actuation. The problems included two failure
situations resulting in a loss of safety and single failure cases that
caused loss of mission capability. Two major contributors were undetected
actuation channel failures and active DIU failures.
The first contributor, undetected channel faults, was addressed by
increasing the redundancy of the actuator processor and associated position
sensor. The operating concept was changed to require two-processor
agreement to drive the surface. Active DIU faults were addressed by
changing the actuator communication concept so that the actuator processor
verifies the command message that contains its position command. This end-
to-end check guarantees that a good actuator channel will not use a
corrupted command. These changes are discussed further in reference 9.
4.4.2 Reliability Evaluation
The two data distribution options for the refined configuration, mesh
network and bus, were evaluated to verify that the changes allow the system
to meet its reliability requirements. The reliability measures evaluated
included safe flight and landing, full mission capability, and sustained
operational capability. The first tvo measures vere used in the
reliability evaluation of the candidate system described earlier. The
sustained operational capability measure was used to compare the two
options, emphasizing their ability to operate with failures.
Some different reliability modeling techniques were used in the refined
system evaluation. The first technique was explicit truncation of the
models at a specified number of failures. Truncation, which greatly
simplifies the reliability models, is based on the fact that the dominant
system failure sequences involve a small number of element failures.
125

Contributions to system unreliability from sequences with a greater number
of failures are less likely and therefore not as significant. All system
states having more than a certain number of element failures are modeled in
an approximate manner. For our study, safety model truncation at the third
failure level captured the dominant system failure sequences. The mission
and sustained capability models were truncated at the second failure level.
The baseline truncation technique is shown in figure 4.4.2-1. The
technique is based on the CSDL approach described in reference 14 and used
for the Computer-Aided 8arkov Evaluator (CAME) program. The system states
are categorized by how many failures have occurred in the system and
whether the system is operational or failed. In the example shown in the
figure, the dominant system failure sequences involve three or fewer
element failures.
Further simplifying techniques were used that amounted to modification
of this baseline truncation technique. The justification for these
techniques is that the relative likelihood of certain key system failure
sequences is important to the evaluation of a system's strengths and
weaknesses. Therefore it is not usually necessary to know the specific
failure situation probability with more than one- or two-digit accuracy.
One simplification ignores some sequences that contribute to the system's
dominant failure situations when they contain more than a certain number of
failures. Another simplifying technique includes only the most damaging
transitions possible when modeling common element failures. Details of the
considerations and consequences of these modeling techniques are presented
in reference 9.
Critical Assumptions. The refined configuration models covered some
new situations not modeled in the candidate architecture. One difference
in the mesh network option was the greater likelihood of system failures
involving slngle-network operation. Once an entire network becomes
inoperative, failure of a critical sensor or a communication device on the
remaining network causes a loss of safety. In the first case, the two
remaining sensors disagree, and in the second case no critical sensors or
actuators are accessible during the subsequent network repair.
126

Failurelevel
0 1 2 3 4
-0
....Figure 4.4.2-1. Safety Model Truncation
127

Another new modeling situation was operation of the mesh network system
with MID enclosures cross-connected to each network. The purpose of the
cross connection is to allow the skewed sensors to be accessed from the
other network to eliminate vulnerability to temporary exhaustion. The few
special situations that leave the system vulnerable to temporary exhaustion
required explicit modeling.
Because of the changes in the surface actuator configuration and
operation the controller and communication device failures cannot affect
safety until the fourth failure level, except for temporary exhaustion
situations. Similarly, these failures can't affect mission capability
until the second failure level. The refined configuration modeling effort
assumed that the associated redundancy management was perfect and took
advantage of model truncation at the appropriate failure level to greatly
simplify the resulting models.
Propulsion system device criticality assumptions were different for the
refined configuration. Some of the differences were due to the
configuration changes between the candidate system and the refined
configuration, while other differences were due to the operational changes
defined during the propulsion system review effort. The major differences
are outlined in reference 9.
Results. The results of the safety model evaluation are summarized in
table 4.4.2-1. The loss of safety probability is dominated by group A
device failures. Elements in group B have a smaller effect on safety. For
this reason bus option versions were not created for several group B safety
models. The table shows that both refined option configurations meet the
system safety requirement. Failure situations involving rare mechanical
actuator Jams and loss of both hydraulic systems are the largest
contributors to unreliability. These results differ from those of the
candidate architecture because of the absence of the special surface
control failure sequences and a large reduction in the likelihood of body
motion sensor temporary exhaustion. This was expected since the system
changes were directed at precisely those problems. Details of these results
are discussed in reference 9. Highlights are presented below.
128

Table 4.4.2-1. Safety Model Results (x 10.7), 3-hr Flight
Sequence
Exhaustion
• Forward sensors• Mid sensors,FTP
• Surface jam• Hydraulic supply• Air sensors
• Engine-out throttle• Both engines• Surface pair safe
Neady coincident
• Like sensor,FTP• Sensor network• Dual network
Temporary exhaustion
• Forward sensors• Mid sensors• Surface controllers• Air sensom
Single network
Two network
0.000340.000400.0340.24
0.180.00120.00720.00160.00014
' 0.000270.0001440.00580.0034
0,000830.000120.0130.0012
0.0112
Total 0.501 •
Not calculated
Four bus
0.00320.029
0.0340.240.18
0.00014
0.000270.000144
129
The unreconfigurable bus introduces a new central dependency aspect to
the bus system. However, even though the unreliability of some functional
groups is worse in the bus option, the system requirement is still easily
satisfied. It should be noted that adding bus interfaces to the other FTP
channels would greatly reduce the likelihood of central bus failures.
The DIUs, or bus interface units (BIU), connect the devices to the
central bus. An active DIU failure mode was modeled for the bus option,
which causes the loss of all devices connected over that bus. To assess
the resulting hazard, a nominal value of 10% active DIU failures was
assumed in the models. A sensitivity study showed that the table 4.4.2-1
results were not significantly affected when the active fault percentage
was varied from I% to 50%.
The results of the full mission capability evaluation are presented in
table 4.4.2-2. Details are discussed in reference 9. Unlike the loss of
safety situation, the mission unreliability is dominated by the group B
elements. Comparison of the mesh network and bus options show that the
network does better in mission reliability terms, but both systems meet the
system requirements. A key assumption in this evaluation is that the
mission can be continued after one of the two hydraulic systems fails. If
loss of a single hydraulic system is a mlssion-abort condition, hydraulic
supply failures would dominate the mission criterion.
The predominant mission failures were special slngle-failure situations
involving the propulsion actuators. Specific causes were control valve
jams and uncovered position sensor and valve drive failures. These
failures prevent device control and result in the loss of full performance
capability for its propulsion system.
Table 4.4.2-3 summarizes the results of the sustained operational
capability evaluation for the refined configuration options. Details are
presented in reference 9. The network option also has the advantage in
this comparison. The dominant failure sequence, given the assumed
operational rules, is loss of a single hydraulic system. This single
failure situation masks somewhat the effects of other system failure
sequences.
130

Table 4.4.2-2. Mission Model Results (:<10.4), 1-hr Flight
Sequence Two network Four bus
Forward sensingMid actuationTail actuation
Wing actuation/sensingAir sensingInlet actuationNozzle actuation
Engine devicesElectric power supply
Hydraulic power supplySingle networkCentral bus failure*
0.000220.00090.00150.00760.000160.0990.099
0.2050.000150.00002
0,0015u
0.0OO590.00380.00270.0140.000380.1000.100
0.212
0.00002
0.0061
Total 0.415 0.440
* Includes electric power and FTP channel
131

Table 4.4.2-3. Sustained Capability Results (x10"2), 50 hr
Sequence Two network Four bus
Forwan:l sensingFTP
Mid sensing/actuationWing sensing/actuationTail actuationAir sensorsInlet actuationNozzle actuation
Engine devicesHydraulic power supplySingle networkCentral bus failure
(A only)
0.0190.1840.0220.1900.0370.0330.1020.1020.3040.4500.015
0.0530.1840.1080.3500.066
NCNCNCNC
0.450
0.024
Total 1.46 NC
132
The ground rules for dispatch in this sustained capability model make
the safety-critical sensors and FTP channels play a direct role. Unlike
the mission model, failure of either two FTP channels or two safety-
critical sensors is a system failure condition.
Sensitivity Study. A limited study was performed to assess the
sensitivity of the reliability evaluation results to the model parameters.
The dominant failure sequences in the safety models and the mission models
were examined to see how model parameters such as component failure rates,
active failure fractions, uncovered failure fractions, and so on entered
into the system unreliability. The limited assessment made use of the fact
that the group A elements dominate the safety unreliability and the group B
elements are most important to mission capability.
Two critical parameters for safety were the fraction of surface
actuation failures leading to a jammed surface and the failure rate of the
hydraulic power system. An analysis of the most likely mission failure
sequences also pointed out two propulsion system critical parameters. The
first parameter was the fraction of propulsion actuator control valve
failures leading to a jammed valve. The second critical mission parameter
was coverage of the actuator elements. Details of this sensitivity
assessment are described in reference 9.
Transient Threat. The baseline reliability evaluation deals only with
the effects of permanent faults. Another concern for highly reliable
systems is the effect of transient failures. A limited, parametric
evaluation of the transient threat was performed during the refined
configuration study. This kind of transient study can evaluate the
effectiveness of the redundancy management processes, including the effect
of certain internal process parameters. Details of the study are presented
in reference 9. Some highlights are shown below.
The evaluation used the transient fault-FDIR interaction model shown in
figure 4.4.2-2. The transient event modeled in this study causes an error
that does not disappear by itself, b transient event that changes a memory
value corresponding to a program constant would cause this kind of
behavior.
133

1
Scrub
.... E.,,.e.n.t....
Scrub and retry
Recover II _
III
Di,able=-_ )1
Legend:
1 Vulnerable to nearly coincident2 Vulnerable to transtent exhaustion
tVote outputs(part of I/0)activity
L_ {__I FD,RIICo,'np,.,tellBa_groun.I Ivotell FD,RIlco,',',p,.,tallB='ckgroun_Ilvotell FD,R)
+ t tApplication Synch check Self-testscomputing Vote check Detailed error
Reconfigure analysis(if needed)
Figure 4.4.2-2. Simplified Mode/
134

Three possible results of a transient event were modeled. The
transition marked "scrub" indicates return-to-normal operation, which
occurs if the periodic background FDIR process corrects the error before
its use in the system computation. There are two possible outcomes if the
error is used by the computation before this "memory scrub." One
transition models the case in which the affected channel produces an output
that disagrees with the other channels, and the other transition models a
loss of synchronization by the affected channel.
Loss of synchronization is critical for the IAPSA system because of the
intensely time-critical workload. Because a major fraction of the IAPSA II
minor frame is required for channel resync, it was assumed to be impossible
in the available time. Loss of channel synchronization thus has the same
short-term effect as a permanent channel fault.
The sensitivity to the rate of transient faults is shown in
figure 4.4.2-3. The figure shows that transients having the characteristics
of our model can become the dominating failure sequence if their rate of
occurrence is high.
The effectiveness of the modeled memory scrub process is shown in
figure 4.4.2-4. This process corrects the faulty data before it is used in
the system computation. The results imply that the process is not very
effective until its cycle rate approaches the cycle rate of the using
process.
Based on the nominal conditions assumed for the study, figure 4.4.2-5
shows that the increased likelihood of nearly coincident failures does not
significantly affect overall unreliability until recovery times exceed
about I sec.
4.4.3 TimlnE Prediction
A simplified performance estimate was also made for the refined
configuration. This estimate allows a rough evaluation of the success of
the changes made to the candidate architecture to improve growth
capability. Details of the prediction are presented in reference 9.
The candidate system organization ground rules were also used for the
refined configuration. Key timing data for this configuration are shown in
135

°--
,=¢.-
IE-6
1E-7
1E-8
IE-9
Conditions:• Mean use time: 5 ms• Smub ratio: 8
• Synch: 0.5• Mean recovery time: 20 ms
I I I I I0.125 0.25 0.5 1.0 2.0 4.0
Transient fault rate/permanent fault rate
Figure 4.4.2-3. Transient Ratio Sensitivity
8.0
1E-7
1E-7
1E-8
1E-9 I I I I I0.0156 0.0625 0.25 1.00 4.00 16.0 64.0
Memory use rate/scrub rate
Figure 4.4.2-4. Relative Scrub Rate Sensitivity
JOm
Q
1E-8
0.32
I I I I0.64 1.28 2.56 5.12 10.2
Mean disable time, sic
F_Jure 4.4_?-5. Soft Fault Disable Rate Sensitivity
136

table 4.4.3-1. Changes compared to the candidate architecture are due to
(1) fewer DIUs, (2) the reallocation of computing and I/O activity between
groups, (3) minor modifications of the assumed command and response frame
formats, and (4) the DIU time required for sensor and actuator interface
functions. The results of these changes are shown in table 4.4.3-2.
Comparison of these results with the candidate architecture shows that
the changes were successful. For comparison, the candidate growth factor
values were 59% for computing and 76% for I/O activity. It should be noted
that these timing results are based on the same simplifying assumptions
used in the candidate system estimate. Key assumptions are (I) no chain
completion delay, (2) slower rate processes can be evenly split into
independent separate processes, and (3) growth capability measures how much
the activity can expand uniformly before timing constraints are violated.
The DENET simulation experience showed that when the task switching
overhead was modeled the growth capability decreased significantly. The
timing estimates were therefore adjusted in a simple way for the overhead
resulting if the system utilization was increased to near 100%. The
results shown in parentheses in table 4.4.3-2 are obtained when a fixed
time of 0.3 ms is allowed for this task switching.
The refined system does not meet the growth requirement when the
overhead time is accounted for. Also, the current AIPS hardware and
software testing results show that the fixed 0.3 ms value is far too
optimistic. This indicates that the system design requires further changes
to meet the growth requirement.
137

Table 4.4.3-1. Refined Configuration Timing Data
Group
A
B
Rate, Hz
100.050.012.5
100.0
50.025.0
Number oftransactions
66
424
Computing time,!
9904,793 1
267
1,05094
9,687 2
Organization ground rules same as reference configuration
1Manual control fully active
2 Trajectory following active
Tab/e 4.4.3-2. Growth Factor Estimate
Group Computing I/O activity
A
B
133% (89)
127% (80)
111% (68)
140% (76)
Notes:
• Simplifying assumptions same as reference configuration• Value in parentheses includes allowance for task switching,
0.3 ms
138

5.0 stqALL-SCALE SYSTEM
A subset of the architecture defined in section 3.0 was developed to
evaluate the key attributes of the IAPSA II architecture while minimizing
the cost associated with this laboratory testing. This subset, called the
small-scale system, was carefully chosen to embody key features of the
IAPSA II architecture. This section outlines the objectives and
definitions of the experiments performed on the small-scale system and
concludes with the results of the testing.
The small-scale system effort was feasible because of the availability
of AIPS hardware and software fault-tolerant building blocks: FTPs, network
nodes, interconnecting links, and System Services software. The small-
scale system consists of a triple-channel FTP interfacing with two local
I/O networks. A goal of this effort was to ensure that validation issues
defined in the "Design/Validation Concept Report" and uncovered during the
detailed design effort were evaluated to the maximum extent possible. In
particular, experimental data were obtained for two purposes: (I) to
evaluate key performance assumptions used during the detailed design
effort, and (2) to determine if the system possesses timing characteristics
critical to successful operation in normal and faulted situations. The
small-scale system configuration could not test communication between the
flight control group and the engine group.
The section is organized into six parts: (I) a discussion of the
small-scale system testing objectives, (2) a description of the test
configuration, (3) the test control strategy definition, (4) a description
of the data collection and analysis strategy, (5) the experiment
description and results of the testing effort, and (6) observations and
lessons learned during the small-scale system testing.
5.I TESTINC OBJECTIVES
The general objectives of the small-scale system experiments vere to
characterize application performance under normal and faulted conditions
and to examine the interaction of system repair actions with application
task execution. The resulting measurements and observations, together with
139

timing values for low-level system functions provided by the building block
developer, C. $. Draper Lab, allowed evaluation of the performance
capability of the IAPSA II reference configuration.
Simulated workload and frame rates were used to represent the IlO and
computational requirements of the IAPSA II flight control configuration.
This approach required only a representative test input-output environment;
the test facility did not need to provide a high-fidelity aircraft
simulation for the experiments. This greatly reduced test facility
software development/support requirements while allowing the evaluation of
key system characteristics.
The experimental objectives were divided into two major categories:
(I) characterization of system behavior under normal operating conditions,
and (2) characterization of operation under fault conditions. Detailed
objectives of the experiments are presented in the following subsections.
5.1.1 System Characterization: Normal Conditions
The timing characteristics of the small-scale system were measured
while executing the application workload that corresponded to the flight
control configuration of the IAPSA II reference configuration.
Experimental measurements were taken to characterize the performance of
specific system service operations, and to assess end-to-end application
timing requirements. The first set of tests characterized the application
execution environment, specifically the I/0 request timing, control cycle
overhead timing and laboratory environment errors.
I/O Request Ti_InE. The time needed to execute the application I/0
activity is a key component of a control cycle. Estimates used for the
performance model were optimistic because they were based on operation at
or near the hardware theoretical limit. Small-scale system measurements
provided a more realistic end-to-end time for this activity. These I/0
request measurements included the system overhead time required to transfer
output data in preparation for an I/0 request and to transfer input data
obtained as a result of an I/0 request. The amount of data transferred
corresponded to the flight control reference configuration I/0 traffic.
140

Control Cycle Overhead. The total end-to-end system processing time
needed to support cyclic application task execution was measured using a
controlled execution environment to determine allowable frame rates for
slow time testing. The key services operations that contribute to end-to-
end time are processing of IlO requests, task scheduling and dispatch
actions, and fast FDIR processing. The If0 request timing components
discussed previously are included in these measurements. Measurements were
made for two cases: (I) when the application task did no detailed error
checking, and (2) when the application task checked the error status of
every transaction.
Laboratory Environment Errors. Random errors occurring during
operation of the small-scale system will interfere with testing results. A
series of experimental runs were made to characterize the laboratory
environment. The critical issue of naturally occurring errors or
transients in the flight environment can only be addressed by actual flight
testing.
The second set of tests measured the performance of the application
workload executing on the small-scale system with no faults. The three
measurements made were execution variability, time delay, and deadline
margin.
Execution Variability. Execution variability measurements were taken
to characterize the frame-to-frame regularity of computing and I/O activity
events. These measurements allowed evaluation of the regular timing
performance of system scheduling and dispatch functions and I/O system
services processes.
Time Delay. The end-to-end time delay was measured to characterize the
overall timing performance of the application. The performance of each
major application function was affected by the overall time delay involved
in one control cycle. Times representative of the sensor read and actuator
write events (at the DIU) were recorded for each of the different
application rate groups.
Deadline Margin. Deadline margin data were collected to indicate how
well the system kept up with the periodic demands of the different
application rate groups. The deadline was the latest time that the
141

activity in one control cycle can complete and still satisfy the control
cycle timin E requirement. The time from the end-of-control-cycle activity
in one frame to the start-of-control-cycle activity in the next frame
markin E the deadline was measured.
5.1.2 Syste_ TildnE Characterization: Fault Conditions
The measurement of system performance under fault conditions was a key
part of small-scale system testing. Both I/0 network and FTP faults were
simulated to evaluate the system failure response and to ensure that the
application performance durinE recovery was satisfactory. The key elements
involved in fault insertion were the I/0 network link fault insertion
panel, the VME operational test program, and the FTP operational test
proEram.
I/O Network Faults. Faults were inserted in the I/0 network to measure
the fault recovery time. The recovery was considered complete when the
network was back in service. Rapid recovery is important because while a
network is out of service the system is vulnerable to faults in devices on
the remaininE Eood network. In addition to the passive link failures
modeled durin E the performance simulation effort, active link failures and
active and passive node failures were investiEated.
FTP Faults. FTP fault behavior was simulated in the FTP to assess the
fault recovery behavior. Special failure simulation code was used to cause
the fault reaction from the AIPS FDIR process. Loss of synchronization
faults, output disaEreement faults, and loss of channel power faults were
inserted.
Rapid reconfiEuration from FTP faults is important for two reasons.
First, an FTP is vulnerable to a nearly coincident fault on another channel
durinE an FTP channel fault recovery period; a second channel fault before
the first is reconfiEured may cause a system failure that otherwise would
have been survivable.
Second, certain patholoEical channel failures can cause erroneous data
to be sent over a network. A faulty channel may cause all actuators to
"freeze" near their last commanded position. It is important for FDIR to
disable the faulty channel's outputs as soon as possible. Measurements
142

were therefore made to determine how long it takes the system to disable
faulty channel outputs. Results were used to determine if a bad channel is
disabled and if comunication responsibility is transferred to a good
channel within a "few" application cycles.
Application Tiling Requlrenents. In addition to the fault recovery
time, the application timing measurements described earlier were taken
during the fault experiments to see if the additional demands made on the
system due to fault recovery adversely affected application execution.
Additionally, the number of control cycles in which the application tasks
operated without access to the full complement of sensors and actuators
were recorded. Each application frame without full data because of repair
actions was marked.
Transaction Selection. The time required to complete transaction
deselection and selection was measured. As a means of minimizing the
vulnerability of the IAPSA II refined system configuration to the temporary
exhaustion failure situation (see sec. 4), an application task must
determine the presence of an error in a chain, then deselect and select
alternative transactions. For this to be a viable option, the task must be
completed in a reasonable amount of time.
5.2 EXPEEIMENTTEST CONFIGt_ATION
The test configuration for the small-scale system experiments is shown
in figure 5.2-1. The hardware and software elements of the test
configuration are organized into two categories, the system-under-test
(SUT) and the test facility. The system-under-test elements represent
components that would ultimately be part of the flight system. The test
facility elements are the hardware and software that enabled the $UT
operation to be simulated in the laboratory and provided the development
and analysis capabilities necessary to support testing. An overview of
these elements is provided in the following sections. Details are found in
references 9 and 15.
143

Simulation host
VME simulation
computer
VME DIU simulators
, lFau"insent°nJ
LIFailure simulation links
II
I Network and synchro- Inization adapters
I_ links
ITest control links
I I_VAX experirnentl---_host j
Ethernet
._VAX station
development
host
FTPOTP
AIPS I/O networks
F:lootlinks
FTP
System under test Test facility
Figure 5.2-1. Experiment Test Configuration
t44

5.2.1 System-_der-Test Elements
Fault-Tolerant Processor. The FTP is an AIPS triplex GPC. Each
channel of the FTP used in the small-scale system uses two Motorola 68010
microprocessors running at 8 MHz, one used as an IOP, the other as a CP.
The CP is primarily used for application software execution while the IOP
is used for control of communications over the I/0 networks. The CP and
I0P communicate using a shared bus and memory. Special data exchange
interface hardware is used to transfer data between the separate channels
of the triplex FTP while precluding Byzantine faults. Operation of the FTP
during experiment activities was controlled through the FTP test port,
which was interfaced with the uVAX Experiment Host.
FTP Operational Test Pro&ram (FTPOTP). The FTPOTP consisted of two
major elements, the pseudo-appllcation software and the AIPS software. The
pseudo-applicatlon software had the responsibility for providing
computational and I/O activity workload simulation, collecting data in the
FTP execution environment, and implementing the FTP test control functions
during experiment runs. The AIPS services building block elements are
linked with the pseudo-application elements to form the loadable FTPOTP.
KIPS I/O Network. Two AIPS serial I/O networks were used to provide
communications between the FTP and the simulated sensor and actuator
interfaces (device interface units or DIUs). The networks were composed of
prototype reconfiEurable nodes and datalinks, which support full duplex
HDLC protocol communications. The FTPs were configured to model the flight
control group of the IAPSA II reference eonflguratlon. Network I was fully
configured with all nodes and simulated DIUs used in the reference flight
control confiEuratlon. All I/O network faults were simulated on Network 1.
Network 2 was simulated vlth two nodes interfacing with a full complement
of DIU simulators. During operation it behaved llke a fully configured
network supporting a full I/O traffic load.
5.2.2 Test Facility Elements
The test facility was required to (1) provide an environment that would
support the particular test conditions in the system-under-test elements,
145

(2) provide a representative input-output environment to the small-scale
system during experimental runs, and (3) support collection of experimental
data during execution. In addition to these runtlme activities, the test
facility was also required to support downloading of software into the
system-under-test, checkout of the experimental setup, and analysis of the
experimental data.
Simulation Host. The simulation host is a virtual memory extension
(VME) bus based system containing a 16.7 MHz 68020 CPU, referred to as the
VME simulation computer, 16 MB of random access memory (RAM) for data
storage, several intelligent VMEbus serial I/O boards modified with custom
I/O network interface boards for use as DIU simulators, a parallel I/O
interface board for communications, and a fault insertion panel. During
experiment runs, the simulation host is responsible for (I) maintaining an
experiment time reference, (2) providing real-time DIU simulation
capability, (3) controlling I/O network fault injection hardware, and (4)
data collection from I/O network activity.
VME Operational Test ProEran (VMEOTP). A VMEOTP running on the VME
simulation computer handles the test setup, initialization, test control,
and runtime data collection functions for the simulation host. The VMEOTP
fault control function commands the state of the I/O network fault
insertion panel during experiment runs in accordance with a predefined
fault script. This capability allows a wide range of network faults to be
simulated. In cooperation with the DIU simulators, it manages the
temporary storage of I/O network activity data collected during experiment
runs. Finally, in its test control function role, it coordinates the start
and orderly termination of an experiment run with the FTP and other
simulation host elements.
DIU SimLlator Operational Test ProEran (DilIOTP). In an actual system,
DIUs connected to the I/O network provide an interface between application
software executing in an FTP and aircraft sensors and actuators. The
small-scale system uses DIU simulators to support the I/O network
transaction load representative of an actual system. The transactions
contain dummy data that are used for test purposes and do not have values
representative of actual sensors or actuators. The DIUOTP is responsible
146

for initializing the DIU simulator hardware, checking the command frames
received, collecting command frame data, generating any necessary response
frames, and starting and stopping DIU operation during experiments.
uVAX Experiment Host. The uVAX Experiment Host computer controlled
both the VMEbus simulation computer and the FTP. The VHEbus simulation
computer is controlled using the VME Ultimate User Environment (VULTURE)
program; the FTP is controlled using the uVAX Resident FTP Interface
Program (VRIP) and the FTP resident AIPSDEBUG program. During experiment
operations the Experiment Host is responsible for (I) downloading FTP
operational test programs before experiment runs; (2) downloading VME and
DIU operation test programs before experiment runs; (3) setup of the run-
peculiar data configuration in the FTP before experiment runs;
(4) initiation of an experiment run.
The Experiment Host is also responsible for uploading and temporary
storage of the raw data collected in the VMEbus simulation host and the FTP
after experiment run termination. It is capable of converting the raw
experiment data from the VME simulalion host and the FTP to a common data
analysis format. It also supports data analysis and archiving of processed
experiment data.
VAXstatlon Development Host. The VAXstation 2000 is primarily used to
develop the software and firmware targeted for the VME Simulation Host
elements including the VMEOTP and the DIUOTPs. The software elements are
transferred to the Experiment Host for downloading into the simulation
computer.
The VAXstatlon Development Host is also used to develop, compile, and
llnk the FTP operational test program. The host contained the AIPS
services software library, b'hen the pseudo-application software is ready,
this machine compiled and linked the loadable FTP operational test program.
The loadable programs are then transferred to the Experiment Host for
downloading to the FTP.
Laboratory Communication Links (Non-runtime). An Ethernet link
provides a connection betveen the uVAX Experiment Host and the VAXstatlon
Development Host. The link is used to transfer developed VME, DIU, and FTP
operational test programs during software development.
147

A custom link connects the FTP test port and the test port controller
in the uVAX Experiment Host. This link is used to dovnload the FTP
operational test program before experiment runs, to start the operational
test program in the FTP, and to upload ray experiment data after experiment
runs.
A custom parallel interface connects the Experiment Host and Simulation
Host. It is used to douload programs to the Simulation Host and to upload
ray data after experiment runs.
Test Control Links. Three discrete links connect the FTP and the
Simulation Host. Tvo links are used to coordinate the tvo main simulation
elements at the start of the experiment run. The links also alloy the time
references in the Simulation Host to be synchronized at the start of the
experiment in the FrP. A fault-tolerant clock link is used to ensure the
use of a comon-time reference in the _P and the Simulation Host elements.
I/O Netvork Fault Insertion Panel. Patch cables to the I/0 netvork
fault insertion panel provide the capability of inserting stuck logic 0 or
stuck logic i signals into an I/0 network link. The Simulation Host
controls the introduction of I/0 netvork faults through the I/0 netvork
fault insertion panel. The _EOTP commands the fault insertion panel to
initiate and terminate fault behavior.
Kxperiment Dependent Omfi_arations. The configuration of the elements
used in the experiment test series vas standard vlth the exception of the
operational test programs in the _rP and the VMEbus simulation computer.
These programs vere different from experiment to experiment because of the
different fault simulation, data collection, and simulated computing
wor_oad requirements. The hardware configuration for the experiments
differed only in the netvork connections required to support fault
insertion.
5.3 TKSTCONTROL STRATEGY
A command file on the Experiment Host containing detailed experiment
setup requirements was executed to run the small-scale system experiments.
These command procedures control the actual execution of the experiments at
the test facility, including program loading, special condition
initialization, experiment start synchronization, and data collection.
148

Each experiment run is coordinated through two test control discretes
that synchronize the operational test programs in the FTP and the
Simulation Host. I/hile either machine is set up for a run, the two sync
discretes are set to the STOP state. Vhen the Simulation Host is ready for
an experiment and the runtlme software is started, the VME sync discrete is
set to the RUN state. The Simulation Host then waits for the FTP test
control discrete to change to the RUN state.
When preparations for an experiment run were completed, the FTPOTP was
started via the VAX Resident Interface Program (VRIP). On completion of
FTP initialization, the FTP samples the VME sync discrete. Vhen the VME
sync discrete is in the RUN state, the test control function in the FTPOTP
schedules the start of application tasks and its synchronization task.
After a" fixed delay, the synchronization task is activated to change the
FTP discrete to the RUN state. Approximately 1 sec after signalling RUN,
the application tasks begins cyclic operation.
The Simulation Host time reference measures time from when the FTP sync
discrete changes to the RUN state. On completion of an experiment run, the
FTP sync discrete is set to STOP. The Simulation Host responds by
terminating data collection and recording the experiment run completion
time. When data are stored in the VME system, the VME sync discrete is set
to STOP. Both computers are then free to transfer experiment raw data
and/or set up for the next experiment.
The real-tlme clock in the FTP, the VME simulation computer time-
reference clock, and the VME DIU simulator time-reference clocks are
synchronized at the start of an experiment by the transition of the FTP
sync llne. The FTP fault-tolerant clock, which operates with a 4.125 _s
period, drives all the timekeeping functions in the system.
5.4 DATA COM.ECTIONAI_ANALTSIS
The DIU simulator collects I/0 network transaction data in real time.
The raw data contain the DIU address, HDLC frame identifier, and the
application task frame count sent by the FTP plus the time of receipt of
the transaction, number of bytes received, number of residual bits, and
frame error status information.
149

Data regarding FTP operation are collected during experiment runs by
the pseudo-appllcation program and stored in CP local memory. After run
completion, data are extracted from the FTP using the VRIP software
interface and stored as raw data files on the uVAX Experiment Host. Data
collected by the pseudo-appllcation included the real-time clock value at
significant application events, indicators for certain I/O system and FTP
errors, and the background program workload count at the beginning of each
minor frame.
Some data, needed to complete experiment documentation, are available
in the system services logs, which can be accessed by a CRT connected to
the CP or IOP. These logs are printed out using a CRT screen-dump printer
at the completion of each run.
The raw data generated after each experiment run are available for
analysis on the uVAX Experiment Host. The raw data are converted to a
common format before use by the Data Analysis Program. FTP data recorded
on experiment log printouts are entered manually for use by the data
analysis program.
5.4.1 Standard Statistical Data
The data analysis program performs a standard analysis of many
experimental data sets including mean, standard deviation, and extreme
values. The package also generates histogram displays of certain dataset
values whose range and number of intervals are based on their extreme
values and the number of samples. Histogram limits can also be manually
set by the data analyst.
Execution Variability Data. Statistics in this category indicate the
frame-to-frame variability of an application event based on its time of
occurrence relative to the ideal frame start time for each application
frame (frame relative time). The ideal frame start time is based on the
ideal start time of the very first frame and the frame repetition period.
Duration Data. Statistics in this category are based on the difference
in the time of occurrence of two application events in raw application
event database. Two examples are deadline margin and time delay, which
were described earlier.
150

5.4.2 Event S,,=,,-ry Data
Summary information about certain special situations occurring during
the run(s) being evaluated is presented by the analysis program. The
summary data is organized in chronological order of event occurrence. When
an event is listed, associated data recorded with the event are presented.
The event summary for each run includes a run start entry and a run
termination entry. An entry for the FTP fault insertion event and the VME
fault insertion event is included as appropriate.
There are also entries for each application frame that experienced
communication errors during ZI0 activity. These errors include "chain
error," "all transactions bad," "chain not complete," "chain did not
execute," or "network out of service." Any command frame received at a DIU
with errors appears in the summary. The command frame identifier, time,
frame count, and error code are presented.
The partial data summary shows the number of frames in which
communications with the complete set of DIUs was interrupted because a
network was out of service. The summary shows the number of frames in each
run in which each application rate group used a partial set of
sensor/actuator data because a network was taken out of service.
The abnormal DIU data summary indicates when a DIU did not receive the
expected periodic update from the application task. This occurs when a DIU
command frame is repeated or skipped.
The abnormal frame entries document the occurrence of an incorrect
application cycle. The three specific situations are missed I/0 update,
computing overrun, or 10R overrun.
5.5 EXPERIMENTAL RESlP.,TS
This section presents the results of the small-scale system testing.
The small-scale system experiment numbering convention begins with
experiment i0 to avoid confusion with the performance model experiments.
As discussed in section 3.0, the AIPS system supports two application
IlO organizations, periodic and on-demand. These two organizations are
illustrated in figure 5.5-I(a) and 5.5-1(b). Recall that the performance
model demonstrated that the on-demand I/0 organization could not meet the
151
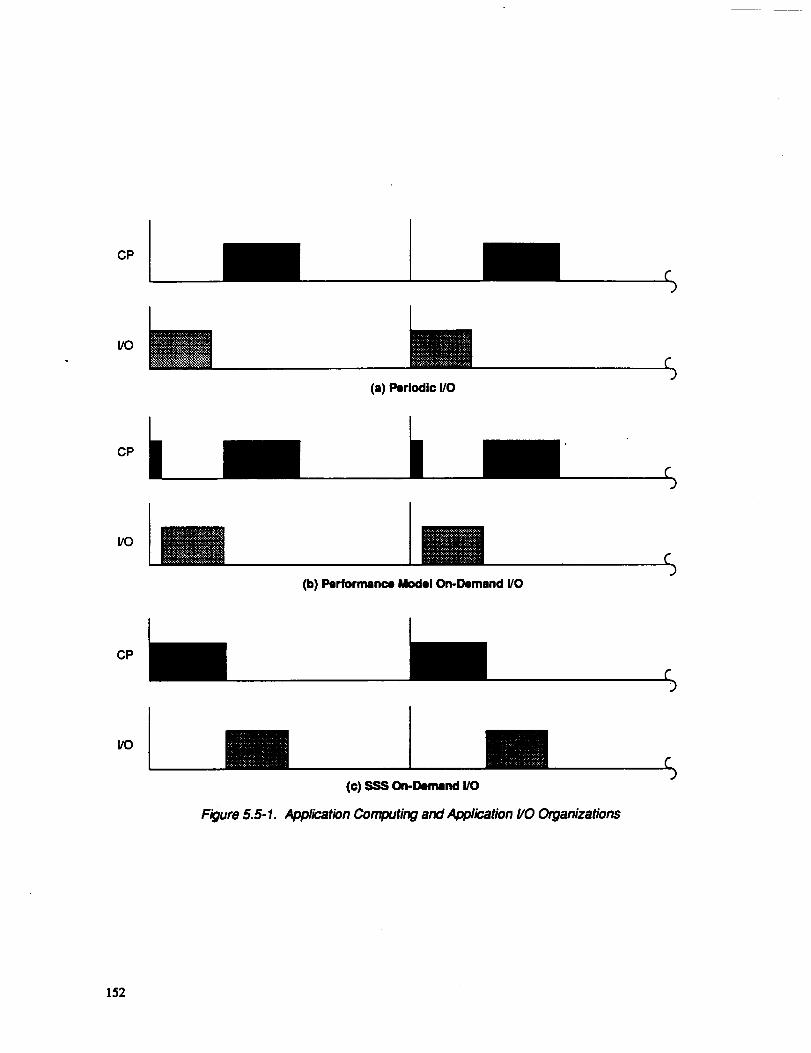
CP
VO
L/O
m(a) Periodic I/0
(b) Performance Model On-DememdI/0
C".)
.)
CP
PC)
(c) SSS On-DorMnd I/0
Figure 5.5- I. Application Compuling and Application I/0 Organizations
152

IAPSA II performance requirements. However, both I/O organizations were
evaluated in the small-scale system to investigate the concurrent
developments of AIPS and IAPSA II.
The structure of the on-demand I/O organization used in the small-scale
system differed from that of the performance model. These two
organizations are contrasted in figure 5.5-1(b) and 5.5-1(c). The
performance model was based on minimizing the jitter in the I/O request
execution by requesting the I/O execution at the start of the frame and
then suspending processing until the completion of the I/0 request. While
minimizing the I/O jitter, this organization incurs one additional system
overhead call per application cycle. The small-scale system organization
performs the application computing at the beginning of the frame and
concludes by requesting I/O. This organization is susceptible to I/0
jitter due to variations in the computing duration, but requires one fewer
system call per application cycle. A potential problem with this
organization is that the application has much less control over the
execution of the I/0 requests. Because I/O execution is nonpreemptable, a
lower rate I/O request can block a higher rate I/O request by starting a
long nonpreemptable segment immediately before the arrival of a higher rate
I/O request. This can potentially lead to missed I/O updates.
5.5.1 Experiment I0: _ Rxecution Environment Characterization
Experiment i0 was defined to measure how small-scale system testing
would effect the FTP execution environment. These measurements included
(I) the time required to read and store a real-time clock value, (2) the
time required for background self-test loop execution, (3) application
workload loop timing, and (4) idle loop timing. The special application
program was the sole process in the FTP (i.e., no FDIR and no background
self-test) and was configured with no I/0 activity.
Real-Time Clock Read. This special application program characterized
the overhead required to make timing measurements from within application
programs for data collection purposes. The process was executed 1,500
times.
153

The data collected from this test indicates that reading the real-time
clock and storing the value is completed in less than 15 _s. In general,
reading the real-time clock for data collection purposes will not
significantly impact the execution of the application processes.
Background Self-Test Timing. The second test measured the time of
execution for one cycle of the background self-test process. Again, this
test was run as the only active task in the FTP.
This test was motivated by the transient fault reliability model
analysis completed during the detailed design phase. The analysis
indicated that the background self-test contributed significantly to
overall system reliability when its cycle time is comparable to the cycle
time of the application. That is, to be effective against transient faults
that cause a loss of synchronization, the background self-test must scrub
memory nearly as fast as it isused by the application. The results of the
test indicate that with exclusive use of the CP, the background self-test
.program takes 369 sec to execute 1 cycle when configured to test 64 KB of
RAM. This clearly indicates that the background self-test function is
inadequate for protection against transient faults that cause a loss of
synchronization.
Workload Loop Timing. This test was defined to determine the execution
time of a program used to simulate variable application computing workload.
On analyzing the data, the execution time of the workload loop as a
function of the number of loop iterations is described by the following
equation:
time(ms) := k * 0.0143055 + 0.041245
where k is the number of vorkload loop iterations.
Idle Loop Tining. This test was defined to develop a program to
measure idle time between any two points in time in the CP. Idle time is
the time not allocated to application processing or FDIR. The program is
based on a simple loop and a counter variable. Analysis of the assembly
code for this program indicated an execution time of 18.82 _s per loop.
154
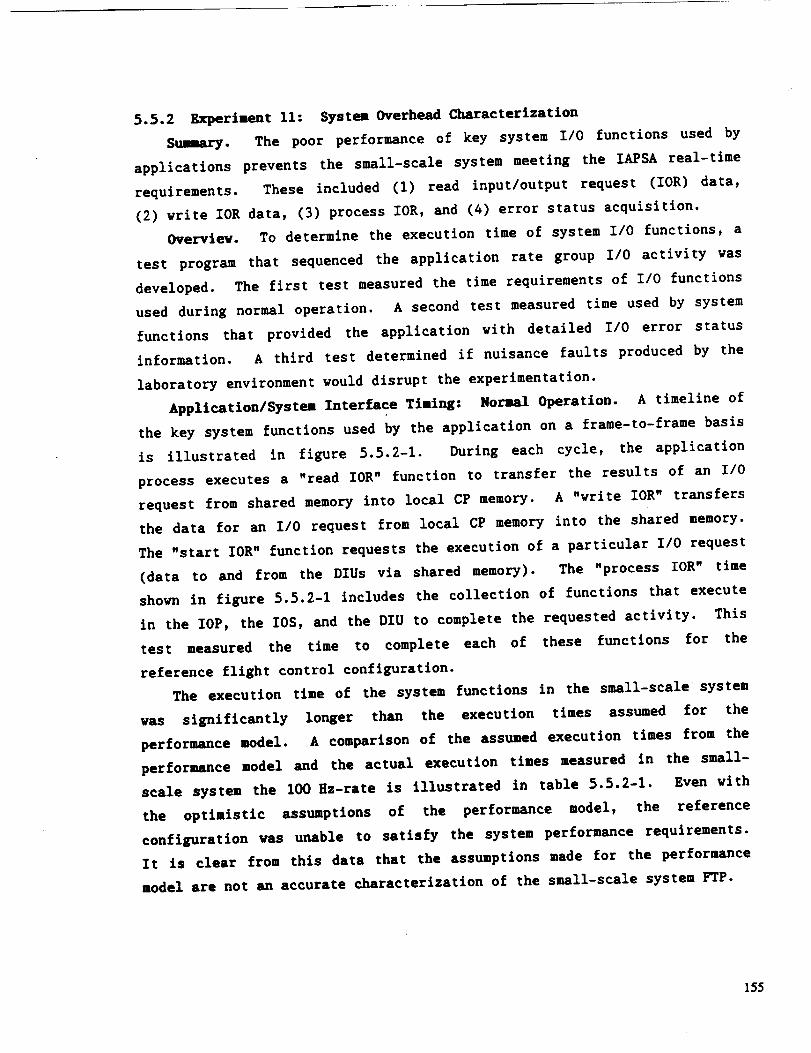
5.5.2 Experiment 11: System Overhead Characterization
Smmary. The poor performance of key system I/O functions used by
applications prevents the small-scale system meeting the IAPSA real-time
requirements. These included (1) read input/output request (IOR) data,
(2) write IOR data, (3) process IOR, and (4) error status acquisition.
Overvlev. To determine the execution time of system I/O functions, a
test program that sequenced the application rate group If0 activity was
developed. The first test measured the time requirements of I/O functions
used during normal operation. A second test measured time used by system
functions that provided the application with detailed If0 error status
information. A third test determined if nuisance faults produced by the
laboratory environment would disrupt the experimentation.
Application/System Interface Timing: Normal Operation. A timeline of
the key system functions used by the application on a frame-to-frame basis
is illustrated in figure 5.5.2-1. During each cycle, the application
process executes a "read IOR" function to transfer the results of an I/O
request from shared memory into local CP memory. A "write IOR" transfers
the data for an I/O request from local CP memory into the shared memory.
The "start IOR" function requests the execution of a particular IlO request
(data to and from the DIUs via shared memory). The "process IOR" time
shown in figure 5.5.2-1 includes the collection of functions that execute
in the IOP, the IOS, and the DIU to complete the requested activity. This
test measured the time to complete each of these functions for the
reference flight control configuration.
The execution time of the system functions in the small-scale system
was significantly longer than the execution times assumed for the
performance model. A comparison of the assumed execution times from the
performance model and the actual execution times measured in the small-
scale system the 100 Hz-rate is illustrated in table 5.5.2-1. Even with
the optimistic assumptions of the performance model, the reference
configuration was unable to satisfy the system performance requirements.
It is clear from this data that the assumptions made for the performance
model are not an accurate characterization of the small-scale system FTP.
155
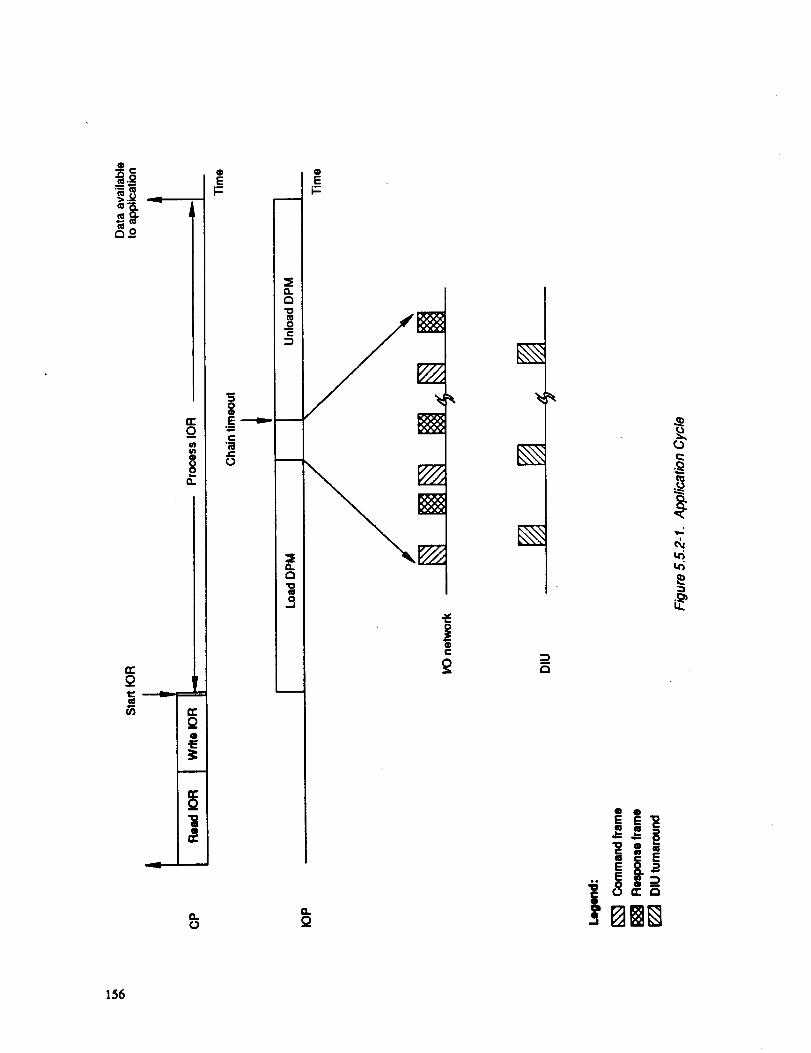
0
t:3_o
tr
¢0
rr
mm
a.
c
(
t
t
it
___L_
G.
oEV-
gE
e-"iet-
t2.
t3
a.
r,.,
0
E)...
o
t3
EE,
ui
156

Table 5.5.2-1. System Function Execution Time Comparison _ lO0-Hz Rate
Model
Reference model
(assumed values)
SSS FTP
(actual values)
Read IOR.
% of frame
0.0
96.96
WrJte JOR.
% of frame
0.0
74.88
Start IOR,
% of frame
OO
4.47
Process IOR, % of frame
Load DPM
5.11
221.57
Chain timeout
interval
20.0
45.0
Unload DPM
13.57
208.11
157

As illustrated in table 5.5.2-2, the execution of key system functions
during normal operation precludes the small-scale system from maintaining
the cyclical rates required by the IAPSA reference configuration.
Technology insertion (processor and memory upgrades that affect processor
speed) alone will not realize the performance improvements necessary to
match even the performance model. The hardware design of AIPS, which
provides inherent AIPS characteristics such as byzantine fault resilience,
minimum overhead voting, and rigid fault containment regions, places a
limitation on performance improvements possible with technology insertion.
For example, one limitation stems from the interrelationship between the
fault-tolerant clock and data exchange element.
Application/Systea Interface TiminE - I/O Error Processing. This test
measured the time to execute system functions related to error checking
with respect to application I/O activity. The test was configured to
measure the worse case situation when nearly all transactions experience
errors.
The results of the test, that is the time needed for the application
process to acquire the I/0 error status for each transaction, is
illustrated in table 5.5.2-3. These values indicate that the incremental
time to acquire the transaction error status is unacceptable for the 100-Hz
and 50-Hz rates. The error status functions must be efficient since they
allow the application to take appropriate action when there is an error
status indication.
Laboratory Environment Noise. The final test determined if excessive
noise was present in the I/O system, which would interfere with the normal
operation of the small-scale system. System logs were studied to ensure
that errors were not reported by the FDIR or the I/0 network manager. No
erroneous or missing I/O frames were detected and no FDIR actions
indicative of data exchange errors were observed.
However, some problems were experienced during the initialization of
the system. Two types of errors occurred: errors that resulted in a
configuration other than that required to complete the experiment run, and
errors that did not affect system configuration (e.g., an error encountered
in testing the spare root link). Experiment runs that experienced errors
158

Rate
100 Hzmean of 412
samples
50 Hzmean of 206
samples
mean of 103samples
Bytes %offrame
212 96.96
204 55.09
28 8.42
Table 5.5.2-2. System Function Execution Time - Normal Operation
Read IOR Write IOR Start IOR,
% of frame Transactions/
Bytes % of frame network
96 ,74.88 4.47 8
124 45.72 2.25 10
12 16.27 1.12 2
End start IORto IOR completion flag set
Chain timeout values: 100 Hz, 45 %50 Hz, 26.5%
25 Hz. 2.3%
ProcesslOR=-'_""_
% offrame
490.68
272.11
65.20
I/0 cycletotal,
% of frame
666 99
375.17
81.01
159

Table 5.5.2-3. Time to Execute System Functions for Error Processing- Small-Scale System
Activity 100-Hz, % of frame 50-Hz, % of frame 25-Hz, % of frame
Error processing 59.98 36.48 5.92
]6O

affecting system configuration were rerun. No errors, other than those
intentionally inserted, were observed after the system had been initialized
to its test configuration.
Application Workload Scaling. The performance model analysis concluded
that the reference configuration could not meet the IAPSA II performance
requirements (i.e., growth margin and on-demand I/O). This conclusion was
based in part on the FTP being a 3-Mips processor and some optimistic
assumptions for system function execution time. Data from this experiment
indicate that a 3-Mips FTP would not improve the execution time of the
system functions sufficiently to match the performance model.
To complete the small-scale system experiments, the IAPSA real-time
workload was scaled to slower than real time. This shifted the focus of
the experiments to interactions between the application and the system
elements. The scaling strategy was to set the frame rate to approximate
the percent system loading of the performance model. The cyclic frame
rates were scaled to 14.5 times slower than real-tlme based on the I/O
activity data. This produced an I/0 system utilization comparable to the
performance model input. The 100-Hz frame period was scaled to 145 ms, the
50-Hz frame period was scaled to 290 ms, and the 25-Hz frame period was
scaled to 580 ms. The workload loop function was adjusted so that the end-
to-end time of the processing workloads in the CP (read IOR, simulated
computing, write IOR, and start IOR) for the I00 Hz, 50 Hz, and 25 Hz were
30.7 ms, 54.1 ms, and 130.3 ms.
Unfortunately, the components of the scaled small-scale system loading
do not have the same relative magnitudes as those components in the
performance model for several reasons. First, the I/O activity values that
were used in the performance model did not include system overhead values,
vhlch were included in the small-scale system workload. Second, the speed
of the critical hardware yam not changed (e.g., data exchange and IlO
network transmission rate). Thirdly, the execution speed of the small-
scale system functions was not altered. Finally, experience with the
performance model indicated that a small difference in system loading could
cause it to overload when it was operating near capacity. To avoid this
problem during testing, the small-scale system workload scaling (14.5) yam
adjusted to produce a less heavily loaded system.
161

5.5.3 Experiment 12: CP/IOP FDIR Phasing Investigation
Sulnary. During the investigation of the CP/IOP FDIR phasings, it was
discovered that the current implementation of the periodic I/0 is
unsuitable for use in cyclic control applications. Application rates
specified as exact integer multiples do not execute at integer multiples.
The small-scale system application is not as sensitive to
application/FDIR phasing as the performance model predicted. This is
attributed to the difference in relative time requirements for application
computing and FDIR modeled in the performance simulation compared to what
was run in the small-scale system.
Overview. A limited set of CP _nd I0P FDIR phasing combinations were
tested to assess their effect on key application tining parameters. Six
specific FDIR phasing combinations were chosen. For all tests in this
experiment, the starting time of the application activity with respect to
the major frame was the sane. FDIR execution times were selected based on
performance model experiment results. The specific phasing combination is
identified by the frame relative time that the FDIR in each processor is
scheduled to start. For example, CPI40, IOP20 means that the FDIR in the
CP is scheduled to begin 140 Ms after minor frame start and the IOP FDIR is
scheduled 20 Ms after frame start. The selected combinations included
cases in which one or both FDIR processes preempted application computing
or I/O activity, and cases in which both were scheduled during idle
periods.
A figure of merit, deadline margin (sec. 5.3.1), was used to evaluate
FDIR/application phasing in the performance model. To measure deadline
margin in the small-scale system intrusive instrumentation would be
required of the AIPS services softvare. To avoid this, yet obtain the
necessary data, an event closely related to the actual deadline or final
activity vas used. This introduced a bias in the processed deadline margin
values. The deadline margin for the on-demand I/O organization is the time
between the completion of the application data being transferred from the
DPM to the shared memory and the beginning of the next computing cycle in
the CP. To mark the end of the transfer of application data from the dual
port memory (DPM) to the shared memory, the final DIU transaction in a
162

chain was used. The deadline margin for the periodic I/O organization is
the time between the completion of computing in the CP and the input/output
systems services (IOSS) starting the execution of the I/0 request for the
next frame. No event was available to mark the beginning of execution for
an I/O request, consequently, the ideal frame start time was used.
The deadline margin data is used in this report only to compare
experiment runs.
On-Demand I/O. A summary of the application data for the on-demand I/O
scheduling is illustrated in table 5.5.3-I. These data indicate that the
change in minimum deadline margin and idle time as the FDIR/application
phasing varies is small. The data do not indicate a compelling need to
coordinate the FDIR execution with the application activity.
This conclusion is different than the analysis of the performance model
for the flight control system. The analysis indicated that the FDIR must
be coordinated with the application activity, or computing deadlines could
be missed. The minimum deadline margins observed in the performance model
experiments varied widely as the FDIR/application phasings changed. For
example the minimum deadline margin ranged from 5.1% to 33.7% of the frame
for the lO0-Hz task; missed deadlines to 39.2% of the frame for the 50-Hz
task; and 24.7% to 38.8% of the frame for the 25-Hz task.
The deadline margin is not very sensitive to the FDIR scheduling in the
small-scale system. This is a result of the scaled application workload
and the unscaled FDIR. In the performance model, the FDIR required 20% of
a lO0-Hz frame; in the small-scale system FTP, the FDIR required only 1.5%
of the scaled lO0-Hz frame and therefore had an insignificant impact on the
application execution.
The utilization of the CP changed only a small amount as the scheduling
of the FDIR varied. This finding agrees with the performance model
experiments.
The application summary data do not indicate an obvious choice for a
preferred application/FDIR phasing. The FDIR phasing combination of CP 140
and IOP 20 was selected for use in the remainder of the testing. Some
additional application performance parameters for the selected phasing are
163

Table 5.5.3-I. Experiment 12 On Demand I/0 Summary
FDIRCP
140
000
000
110
140
140
TimelOP
O2O
000
OSS
110
110
025
100-Hz m=n.deadline
margin, %scaled of
frame
50-Hz man.deadline
margin, %scaled of
frame
25-Hz mm.deadline
margin, %scaled of
frame
Mean idletime
frame 1, %scaled of
minor frame
33.6
Mean idletime
frame 2, %scaled of
minor frame
Mean idletime
frame 3, %scaled of
mtnor frame
Mean idletime
frame 4, %scaled of
minOr frame
60.1 70.3 53.0 0 17.4 70.9
60.0 70.3 51.9 34.5 0 19.1 71.8
55.0 694 52.7 34.5 0 19.2 71.9
60.3 67.8 51.9 33.9 0 18.0 71.2
60.1 67.8 51.9 33 6 0 17.1 70.9
60.1 70.2 53.0 33.6 0 17.1 70.8
164

illustrated in figure 5.5.3-1. A timeline illustrating the application
activity is depicted in figure 5.5.3-2.
The application performance parameters are as expected with the
exception of the I/O Jitter for the 50-Hz rate. The data are evenly split
into two peaks, which are separated by roughly 2.5 ms. This even split
suggests some type of interaction with the 25-Hz rate. Comparison of the
50-Hz and 25-Hz activity in figure 5.5.3-2 provides an explanation. The
25-Hz computing completes near the end of minor frame 3 and makes its I/O
request to the I0$$. The I/O posting task for the 25-Hz rate interrupts
the IOP processing of the currently executing 50-Hz I/O request to
acknowledge the 25-Hz I/O request. This short interruption causes the
observed split in the data. By comparison, the execution of the 50-Hz I/O
request in minor frame 1 is not affected by other application activities.
The observed performance impact of processing a new I/O request,
arriving during the execution of an existing I/O request is a concern for
real-time applications. The nominal impact on the 50-Hz I/O in the third
minor frame was approximately 2.5 ms. Any application process could be
affected by the changing demands on the system during fault repair
situations or change in workload.
Periodic IlO. A major deficiency in the periodic I/O scheduling
implementation was encountered during this test. The scaled 50-Hz and
25-Hz application processes did not execute at their specified frequency.
This phenomena, known as phase drift, is unacceptable for a cyclic control
application. The numerical representation in the software program that
controls the cycle period is the cause of the phase drift. The system
software converts the representation of the desired frame period, to an
internal representation during system initialization. During this
conversion, frame periods originally specified as exact integer multiples
are converted to values that do not maintain the specified relationships.
This causes the execution sequence of the I/O requests to vary, which can
lead to missed I/O updates. The following example, observed during
testing, illustrates this problem. Because the 50-Hz cycle period is not
the exact integer multiple specified, the relationship between the lO0-Hz
and 50-Hz I/O request varies from frame to frame. Eventually, the 50-Hz
I/O begins execution before the 100-Hz I/O, blocking the higher rate IlO.
165

2OO
C
Cr
100U.
200
C
:3
O"
10014.
200
100IJ.
I/0 Jltter
% of scaled frame
Minimum value I 38.5 I
Maximum value 38.8Mean value 38.6Standard deviabon 0.0
100
113
Fi i i
100 Hz
i
% ofscaledframe
=o 5OO"
==14.
% of scaled frame
Minimum value I 39.0 IMaximum value J 39.8 I
Meanvalue t 39.3I, Standard devia_on I 0.0 1
82 82
V ooooo K | ! ! g i
50 Hz
% ofscaledframe
C
==soO"
U.
V!! !
(D r_
_D In
% of scaled frame
Ma,_mum value I 52.7 [Mean value I 52.6 IStandarddev=_n I 0.0 I
103 _ 50
120
Tlme Delay
..... % ofKakJd
25 Hz frame 25 Hz
4
i i i
so r,. m m o ¢u a_ _r %0|
_g_88888 sca_-- -- "- "- - flame
100 Hz
% of scaled frame
Minimum valueMaximum valueMean valueStandard deviation
82
: i = w
I_g'l i J
1(0:1(01
O.
% of scaled frame
Maximum value
Mean value O_Standard deviation
6__ 61
35
21 21
F , 0,0 0 0 0 0 0 0 0 0O, , , , , ,__, ,,,,, = =,.. = _ o- o, _._ _,o ,..= = % of
"_ ' "a_ "o_ o_ o; .........._=_=_===8888888888 sc_ed.......... flame
50 Hz
100l
3
I-
% of scaled frame
Maximum value I0(_.0
Mean value I0(LOStandard deviuon LO
% of
frame
Figure5.5.3-1. Experiment12 ApplicationPerformanceParametersof Selected Configuration
166

m
167

Investigation of this phenomena in the small-scale system predicted
that the 50-Hz and 100-Hz I/0 would switch execution order after more than
400 50-Hz frames. However, in four out of the five FDIR/application
phasings, the 50-Hz I/O request and the 100-Hz I/0 request switched order
after 91 50-Hz frames. Additionally, the phase drift phenomena should
result in the switched I/O request execution order persisting for at least
50 frames. However, the switched order observed only persisted for one
frame; this behavior is inconsistent with that predicted for phase drift.
The early switch of the 50-Hz and 100-Hz I/O request for a single frame is
suspected to be due to an anomaly in the IOSS logic. This phenomenon was
not further investigated.
Because of the phase drift problem, the remainder of the testing was
performed using the on-demand I/O configuration.
The on-demand I/O configuration did not suffer from phase drift. An
application executive was developed, which was driven at the fastest
application rate and dispatched the application tasks to ensure the
intended execution order, requiring the local system service to maintain
only one periodic rate.
5.5.4 Experiment 13: I/ONetwork Faults
Summary. This experiment was designed to simulate failures affecting
the I/O mesh network. The implementation of the present AIPS I/O FDIR
strategy, which manages the loss of communication with DIUs, can
potentially result in the loss of safe flight. This strategy, called
transaction bypass, results in old I/O data being transmitted to the I/O
network in valid transactions. This situation will result in a force fight
between actuators causing the loss of the IAPSA vehicle.
Processing of application transactions, containing communication
errors, takes much longer than expected and significantly alters the frame
to frame execution of the application I/O activity. This extraordinary
time for error processing may result in the application missing either
computing deadlines or I/0 updates.
Overview. The inserted faults cause fault behavior representative of
two general classes of failure modes for network nodes and links: active
168

and passive. A network link consists of two pairs of wires: the outboard
pair carries signals in a direction away from the FTP, and the inboard pair
carries signals toward the FTP. Two types of network faults were inserted:
a passive fault, which holds one pair of network links at logic 0 and an
active fault, which holds one pair of network links at logic 1.
Once the fault was inserted, the observed repair sequence for these
experiments, unless otherwise noted, is as follows: (1) the I/O network is
taken out of service for repair when an application I/O request encounters
communication errors, (2) the I/O FDIR is activated and a sequence of I/O
activity takes place on the out-of-service network, and (3) when repair is
complete, the network is returned to service and the application I/O
activity resumes on the repaired network. The failure detection time and
the time to return of a repaired I/O network to service could not be
acquired without intrusive instrumentation of the I/O FDIR logic that
executes in the IOP. Because of the difficulty in instrumenting FDIR
logic, the FTP log entries were used to approximate the time of failure
detection and the time to return the repaired I/O network to service.
Three repetitive runs were made for each failure mode for each failed
element.
I/O network i, as grown from root node FCI with no faults, is depicted
in figure 5.5.4-1. This is the Starting configuration of network 1 for all
the I/O network fault tests. The nodes are identified by the symbolic
names of the attached DIUs. The DIUs are not illustrated in this figure;
all nodes have one DIU attached to them with the exceptlon of FCI and FC3,
which have none. Each node is marked by icon(s) to indicate the
application rate group that communicates vlth the attached DIO. Network
links are classified by the elements they connect: FTP to network (root
link), network node to network node (Internode link), and network node to
DIU (DIU link).
An experiment run was configured by routing the network links to be
faulted through a fault insertion panel connected to the Simulation Host
computer. Onder software control, the simulation host computer activated
independently controlled fault channels in the fault insertion panel at the
end of the fifth major application frame (arbitrarily chosen). The faults
inserted for this experiment are illustrated in table 5.5.4-I.
169

Key:m Enabled link
Spare link100 Hz
,1= 50 Hz25 Hz
SRL Spare root linkO I/O network node
Figure 5.5.4-1. Network 1 as Grown From FC1, Small-Scale System
170

Table 5.5.4-1. SSS I/0 Network Faults
Element Identifier Fault
Intermode links
Network nodes
Root links
DIU links
FCI-S2SI-CP1$2-CP2
S1 -OFL
FCtS2CP1CP2OFL
Channel A-FC1Channel B-FC3
$2CP1CP2OFL
Passive (inboard and outboard)Active (inboard)Active (outboard)
Passive (all ports, inboard and outboard)Active (all ports, outboard)
Passive (inboard and outboard)Active (inboard)
Active (outboard)
Passive (inboard)Active (inboard)
171

Internode Links.
Passive Inboard and Outboard. The affect of I/O link repair on the
application activity is illustrated in table 5.5.4-2. The link failure
between nodes FCI and $2 resulted in the only significant effect observed
in this test.
In determining the cause for the shift in processing, it was observed
that transaction error processing consumed excess IOP time. At the end of
each I/O activity, the IOSS processes the I/O data checking for errors in
transactions that have been detected by the IOS. The time required to
process transactions containing these errors is significantly longer than
transactions without errors. Consequently, the additional error processing
delays the execution of any waiting I/0 request(s).
The impact of the transaction error processing is illustrated in
figure 5.5.4-2 with a fault (FCI-S2) that results in error processing for
three transactions in a 100-Hz chain. The nominal process alignment is
shown with solid lines; the realigned processes are shown with broken
lines. The figure illustrates that the 100-Bz error processing delays the
processing of the 50-Bz IlO. Bowever, this delay is offset because the
processing requirement for the waiting 50-Hz I/O is reduced to
approximately half nominal operation as a result of network I being taken
out of service; application data is not loaded on networks which are out of
service for repair. The net effect for this scenario is that the beginning
of the 50-Hz network 2 activity is slightly delayed by the error processing
for the 100-Bz chain. The delay of the 50-Bz I/O activity reduces the
deadline margin for that frame.
The transaction error processing for faults discovered by the 50-Hz
rate do not have the same effect on the application because the error
processing expands into an idle period.
The fault repair times for this experiment are summarized in table
5.5.4-3 as a percent of the scaled lO0-Hz frame. Each of these link faults
is repaired with a fast repair algorithm.
As observed in the performance model, the fault repair times are
directly related to the application I/O activity that encounters the fault_
and the succeeding Idle time in the IOP necessary to execute the repair
172
Table 5. 5.4-2. Experiment 13 -Passive Inboard and Outboard Internode Link Failure Summary
Link fa_led connects
Source Destination
FC1 $2
51 CP1
$2 CP2
$I OFL
IO0-Hz minimum deadlinemargin, % change from
nominal
0.0
0.0
0.0
$0-Hz minimum deadline
margin, % change fromnominal
-1.5
0.0
0,0
0.0 0.0
25oHz mlmmum deadline
margin, % change fromnominali
0.0
0.0
0.0
0,0
173
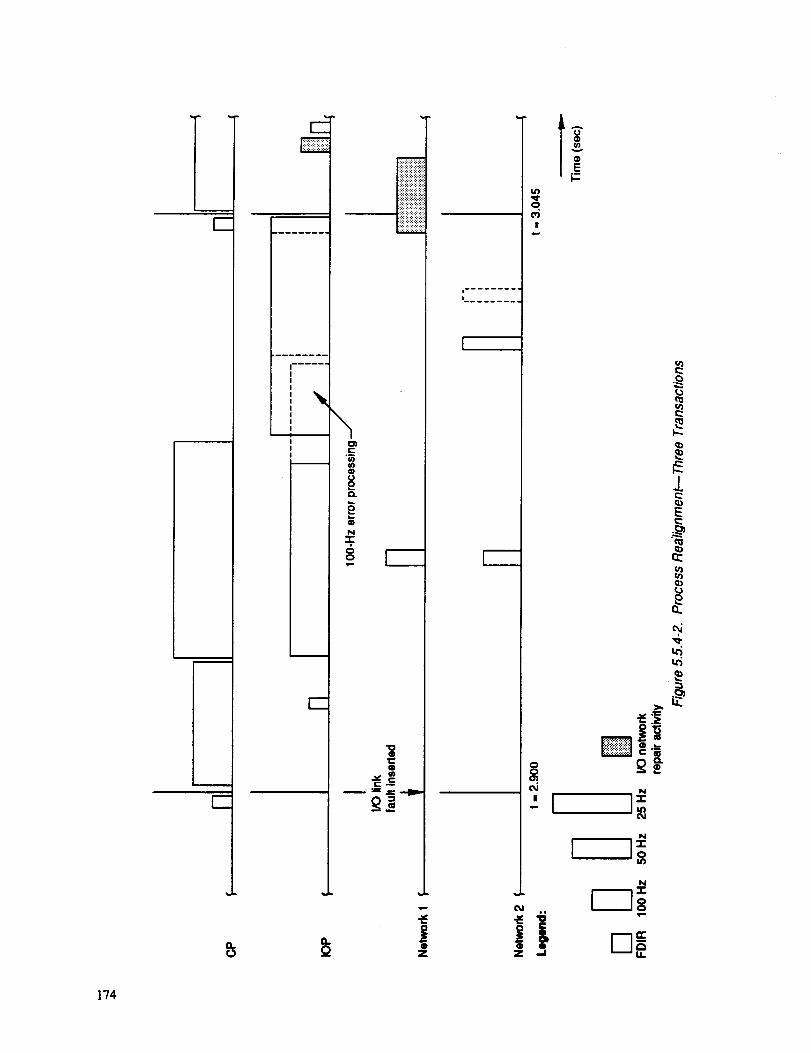
I
L[-
_____
!
F-
Q.o
|......III
I
I!
! t-
Q
N
=,OOv,-
r-
a.
o Z
!.........!.........
O
('9
|
8_4
-'I
e4
ilZ ,.J
N
I=N
I I=ON
q)
_f
E
q)
(I)
174

Table 5.5.4-3. Experiment 13 - Passive Inboard and Outboard Internode Link Fault Repair Times
Link failed connects
Source
FC1
Destination
S2
Run 1, % of scaled minor Run 2, % of scaled minorframe
441
frame
441
Run 3, % of scaled m_norframe
441
$1 CP I 400 400 400
$2 CP2 400 400 400
S1 OFL 317 317 317
175

algorithms and execute the I/0 activity. The performance model assumed
that determination of the fault by the I/O FDIR and maintenance of the data
structures related to the I/O network would not vary significantly from
fault location to fault location. This does not appear to be the situation
in the small-scale system. The differences in fault repair times for the
two different fault locations detected by the 100-Hz rate (FC1-S2 and
S1-OFL) appears to be associated with maintenance of data structures
related to the I/O network.
Active Inboard. As with the passive failures, the only application
rate impacted by I/0 link failure is the 50-Hz rate (table 5.5.4-4).
However, the impact is much greater than in the passive failure and is
caused by the transaction error" processing. Because this fault is an
active inboard failure, all the transactions in the chain contain
communication errors. The resulting transaction error processing accounts
for an additional 80 ms of IOP processing. This scenario is depicted in
figure 5.5.4-3 by the 50-Hz I/O processing being delayed by I/O error
processing on the eight transactions of the 100-Hz chain for network 1.
The fault repair times are summarized in table 5.5.4-5; these times are
significantly longer than the passive failure. Larger repair times
associated with repairing the network is because of the fast regrow
algorithm used to repair this failure.
This result is different than the performance model. The full regrow
algorithm was the recognized strategy for repairing this fault when the
performance model was developed. Since that time, the repair strategy for
this fault has been optimized; the new strategy is called fast regrow.
Fast regrow is essentially the full regrow algorithm without the detailed
diagnostic test that tends to dominate the network growth time. Another
factor influencing the difference in repair times between the performance
model and the small-scale system is the demands the application processes
place on the system. The performance model was more heavily loaded than
the small-scale system configuration, thus reducing the number and duration
of idle time slots for repair activity.
Active Outboard. The application summary for this test is illustrated
in table 5.5.4-6 and the fault repair times is illustrated in
176

Table 5.5.4-4. Experiment 13 - Active Inboard lnternode Link Failure Summary
Link failed connects
Source Destination
FC1 $2
$1 CP1
S2 CP2
$1 OFL
100-Hz ram=mum deadline
margin, % change from
SO-Hz minimum deadlinemargin, % change from
nominal nominal
-12.8
25-Hz minimum deadhne
margin, % change fromnominal
0.0 0.0
0.0 -12.8 0.0
0.0 -12.8 0.0
0.0 -12.8 0.0
177

i
O
I
.m_, r .....
¢-
o
e_
b.oN
oo
r-
0.
o
_-- ._ .-.Dm
!!.........
I
o.
II
N
--'1 I"N
I I_oN
t_
t_
¢2
Z
c_
c_
1'18
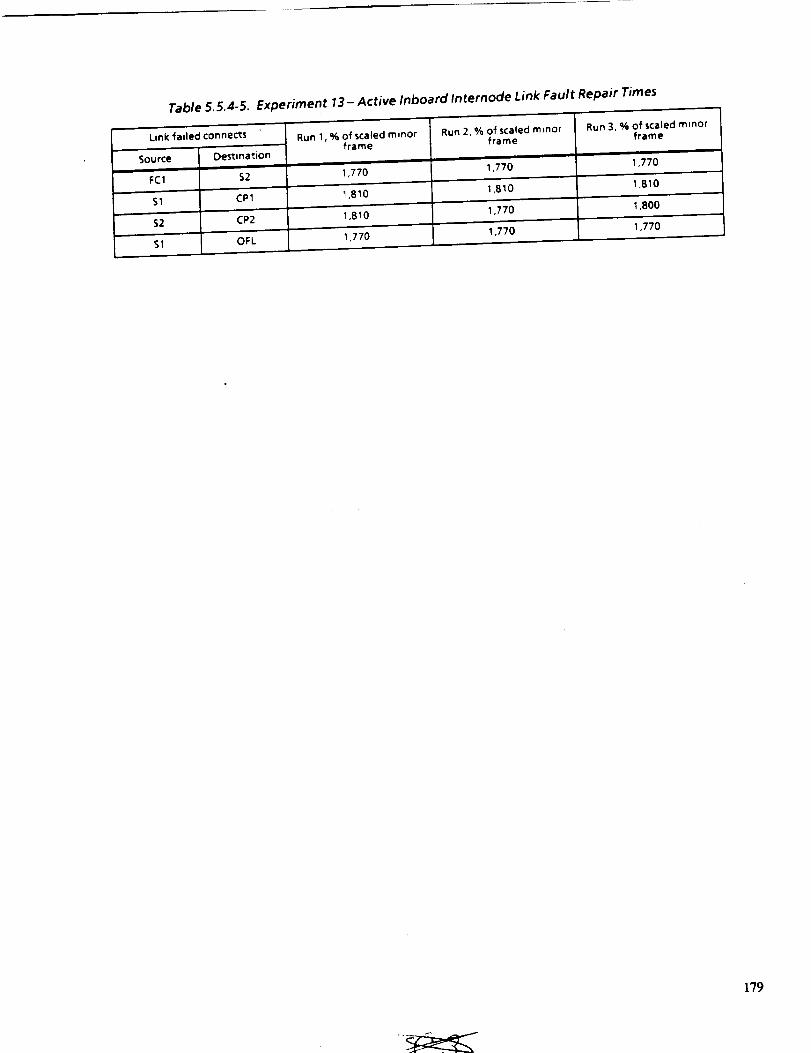
Table 5.5.4-5. Experiment 13- Active Inboard internode Link Fault Repair Times
Link failed connects
Source
FCI
Destination
Run 1, % of scaled minorframe
Run 2, % of scaled minorframe
$2 1,770 1,770
$1 CPl 1,810 1,810 1,810
L
S2 CP2 1,810 1,770 1,800
$1 OFL 1,770 1,770 1,770
Run 3, % of scaled minorframe
i
1,770
179

Table 5.5.4-6. Experiment 13 - Active Outboard Link Failure Summary
Link failed connects lO0-Hz minimum deadlinemargin, % change from
50-Hz minimum deadline
margin, % change fromSource Destination nomtnal nominal
FC1 $2 00 -1 4 0.0
S 1 C? 1 -0 1 0.0 0.0
$2 CP2 0.0 0.0 0.0
$1 OFL 0.0 0.0 0.0
25-Hz minimum deadline
margin, % change fromnominal
180

table 5.5.4-7. This fault is repaired with a one shot repair algorithm;
consequently the data are very similar to the passive link failure case.
Based on experience with the performance model I/O network repair
algorithms, this fault was expected to require the regrow algorithm.
However, a subtle modification to the one shot repair algorithm on which
the performance model was based provided the one shot repair algorithm with
the capability of repairing this fault. However, the modification slightly
extends the repair activity for passive link failures.
Nodes. For the node failures, all connecting links were routed through
the fault insertion panel. The simulation host computer simultaneously
activated all the fault channels at the fault insertion time.
Passive Inboard and Outboard Ports. The application summary depicted
in table 5.5.4-8 resembles data from the link fault experiment. As with
link failures, the transaction error processing for the chain that
encountered the failure causes a change in the application I/O activity.
The PC1 root node (fig. 5.5.4-1) failure causes communication errors in all
transactions of the 100-Sz chain that encounters the failure. The effect
on the application processing is the same as as that described earlier for
the active inboard llnk failures. The remaining node failure effect on the
application is the same as described in the passive llnk faults section.
The observed repair sequence for this experiment followed the sequence
described in the overview section until network repair was complete. In
this experiment, a communication error was indicated for transactions
associated wlth the DIU connected to the failed node for several frames
after the network was returned to service. The indications persisted for
several frames and then disappeared. What is significant in this
experiment is that the IlO FDIR did not take the I/0 network out of service
and attempt a repair although it reported these errors to the application
processes.
This benign reaction appears to be one of the strategies in the IOSS
for dealing with the loss of communication with a DIU. The I/O FDIR
recognized that communications with the DIU connected to the failed node
were impossible and discontinued sending transactions to that DIU. This
strategy for dealing with lost DIUs will be contrasted against an
unacceptable strategy in the succeeding test discussion.
181
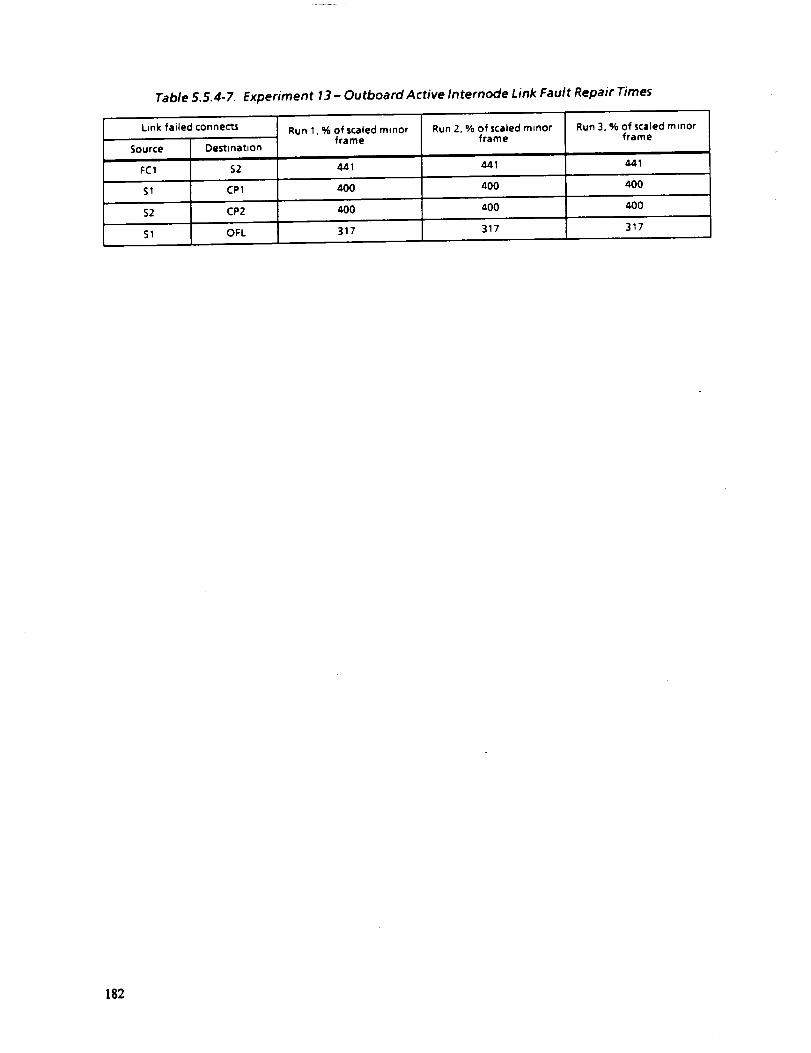
Table 5.5.4-7. Experiment 13- Outboard Active Internode Link Fault Repair Times
Lank failed connects
Source
FC1
Destinataonii
$2
Run 1, % of scaled minorframe
Run 2, % of scaled rmnorframe
441
Run 3, % of scaled minorframe
441 44.1
$1 CP1 400 400 400
S2 CP2 400 400 400
S1 OFL 317 317 317
182
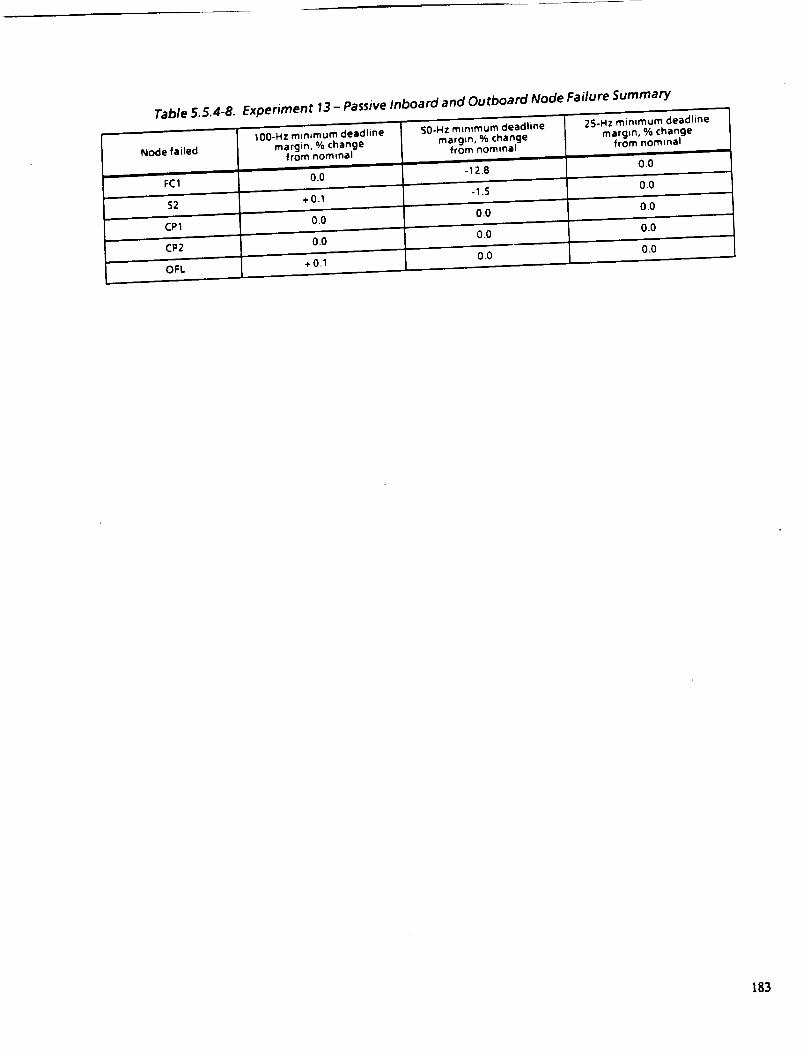
Table 5.5.4-8. Experiment 13 - Passive Inboard and Outboard Node Failure Summary
Node failed
FC1
S2
CP1
CP2
OFL
IO0-Hz minimum deadline
margin, % changefrom nominal
0.0
+0.1
0.0
0.0
+0.1
50-HZ mlnfmum deadline
margin, % changefrom nominal
-12.8
-1.5
0.0
0.0
0,0
25-Hz min_mum deadline
margin, % changefrom nominal
0.0
0.0
0,0
0.0
0.0
183

The fault repair times for this test are illustrated in table 5.5.4-9.
The repair time differences are probably attributable to the processing
differences in the repair algorithms for reconnecting lost branches of the
network.
Active Outboard Ports. In this experiment an active signal was
inserted on all links in a direction outbound with respect to the node.
The repair strategy for this failure is to fast regrow the I/O network.
The repair action removes the active node failure from the network, but the
repair logic does not account for the DIU connected to the failed node.
When service is restored on the repaired network and the application
attempts to communicate.with the unreachable DIU, a communication error
results. The communication error causes the I/O network to be taken out of
service again and activates the I/O FDIR. However, the I/O FDIR finds no
errors (taking into account the known failed node). Its response is to
increment a count against the transaction that caused the communication
error and return the I/O network to service.
The out-of-service, return-to-service nuisance trip sequence continues
until the transaction bypass limit is reached for the offending
transaction. This sequence is repeated for each transaction that
communicates with the DIU associated with the failed node. This policy
extends the vulnerability of the application by prolonging the time it must
operate with partial I/0 network data from a single failure. This repair
strategy, which results in a sequence of transient failures immediately
following a repair action, is undesirable.
Transaction bypass is the mechanism intended to prevent the I/O network
from repeatedly taking the I/O network out of service and returning it to
service when communication to a DIU is lost as a result of a DIU link
failure. The application designer specifies an error limit when the
transaction is created at initialization. When the transaction reaches the
specified limit, the I/O FDIR discontinues error processing for the
affected transactions. Subsequent errors logged against the bypassed
transaction do not result in the network being taken out of service.
Transaction bypass also causes the transmission of old data, which is
discussed in the "Passive DIU Link Failure" section.
184

Table 5.5.4-9. Experiment 13 - Passive Inboard and Outboard Node Failure Fault Repair Times
Node failed
FC1
Run 1, % of scaledminor frame
Run 2, % of scaledminor frame
717 717
$2 675 675 607
CP1 634 634 634
CP2 572 572 572
OFL 517 517 517"
Run 3 not used, data from run 4
Run 3, % of scaledminor frame
i
7i7
185
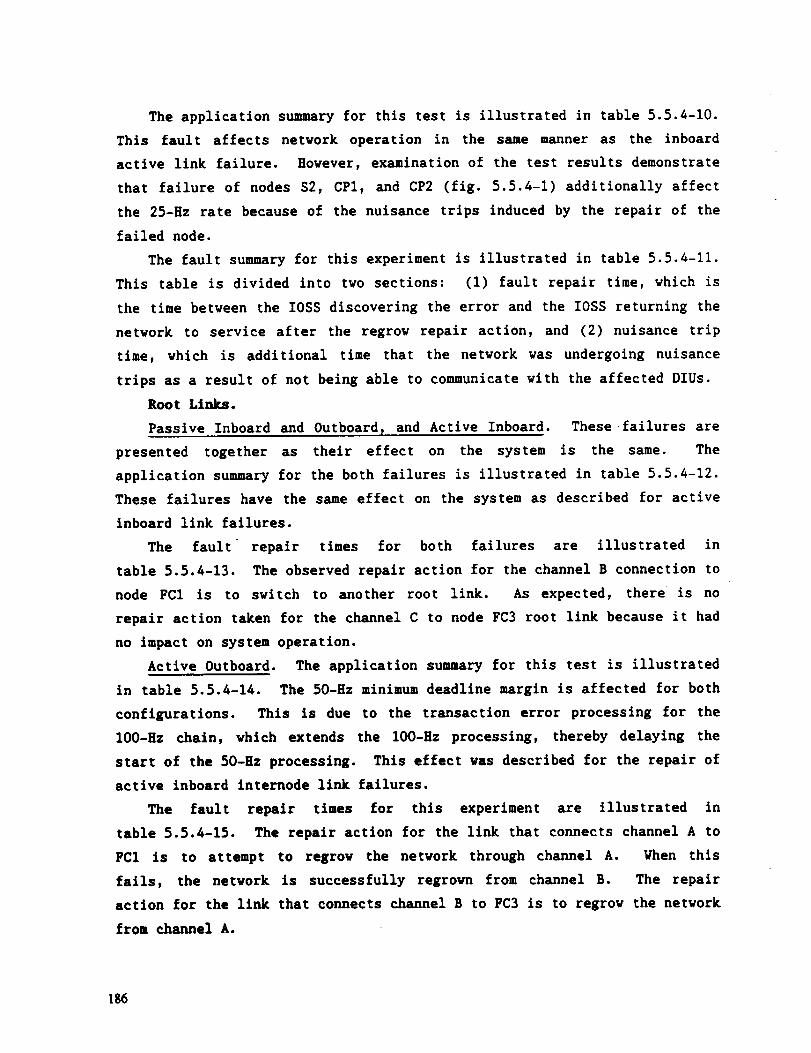
The application summary for this test is illustrated in table 5.5.4-10.
This fault affects network operation in the same manner as the inboard
active llnk failure. However, examination of the test results demonstrate
that failure of nodes S2, CPI, and CP2 (fig. 5.5.4-1) additionally affect
the 25-Hz rate because of the nuisance trips induced by the repair of the
failed node.
The fault summary for this experiment is illustrated in table 5.5.4-11.
This table is divided into two sections: (1) fault repair time, which is
the time between the IOSS discovering the error and the IOSS returning the
network to service after the regrow repair action, and (2) nuisance trip
time, which is additional time that the network was undergoing nuisance
trips as a result of not being able to communicate with the affected DIUs.
Root Links.
Passive Inboard and Outboard t and Active Inboard. These failures are
presented together as their effect on the system is the same. The
application summary for the both failures is illustrated in table 5.5.4-12.
These failures have the same effect on the system as described for active
inboard llnk failures.
The fault repair times for both failures are illustrated in
table 5.5.4-13. The observed repair action for the channel B connection to
node FC1 is to switch to another root link. As expected, there is no
repair action taken for the channel C to node FC3 root link because it had
no impact on system operation.
Active Outboard. The application summary for this test is illustrated
in table 5.5.4-14. The 50-Hz minimum deadline margin is affected for both
configurations. This is due to the transaction error processing for the
100-Hz chain, which extends the lO0-Hz processing, thereby delaying the
start of the 50-Hz processing. This effect was described for the repair of
active inboard internode link failures.
The fault repair times for this experiment are illustrated in
table 5.5.4-15. The repair action for the link that connects channel A to
FC1 is to attempt to regrow the network through channel A. When this
fails, the network is successfully regrown from channel B. The repair
action for the link that connects channel B to FC3 is to regrow the network
from channel A.
186

Table 5.5.4-10. Experiment 13 - Active Outboard Node Failure Summary
Node failed
FC1
100-Hz minimum deadline
_nargin, % change from nominal
50-Hz ram=mum deadline
margin, % change from nomina(
2S-HZ ram=mum deadhne
r_argm, % change from nominal
0.0 - 12 8 0.0
$2 + O. 1 - 12 8 -0.4L
CP1 0.0 -128 -0.5
CP2 0.0 -12.8 -0.4
OFL +0.1 -12.8 0.0
187

Table 5.5.4-1 1. Experiment 13 - Active Outboard Node Failure Fault Summary
Repair tPmes Vulnerability caused by nuJsance tnps
Node failed
i
FC1
Run I, % of
scaled m_nor
frame
Run 2, % of
scaled rn_nor
frame
i
2,0102,010
S2 1,900 1,900 1,900
CP 1 1,900 1,900 1,900
Run 3, % of
scaled minor
frame
i
2.010
Run 1, % of
scaled m_nor
frame
Run 2, % of
scaled minor
frame
Run 3, % of
scaled minor
frame
0 0 0
655 655 65S
t ,428 1,428 1,428
CP2 1,910 1.910 1,910 407 407 407
OFL 1,910 1.910 1,910 76 76 76
188
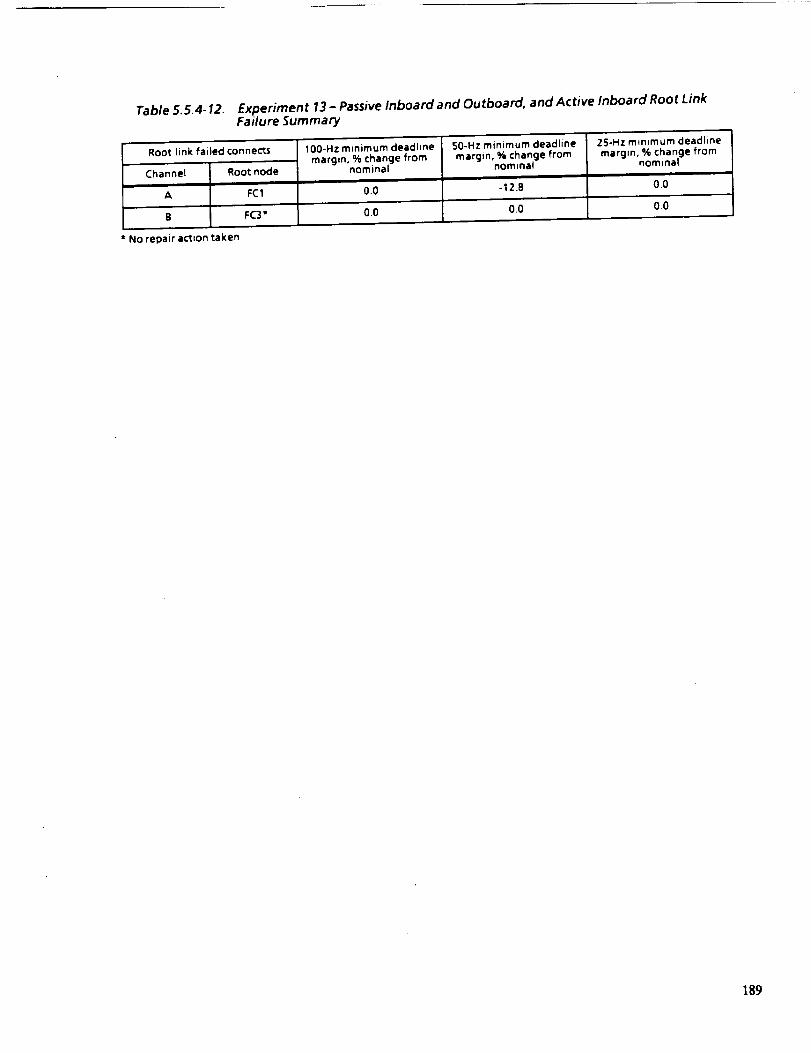
Table 5. 5.4-12. Experiment 13- Passive Inboard and Outboard, and Active Inboard Root LinkFailure Summary
Root link failed cOnnec_
Channet
A
Root node
FC1
IO0-Hz minimum deadline
margin, % change fromnominal
50-Hz minimum deadline
margin, % change fromnominal
25-Hz m_nlmum deadline
margin, % change fromnominal
0.0 - 12.8 0.0
B FC3* 0.0 0.0 0.0
No repair action taken
189

Table 5.5.4-13. Experiment 13- Passive Inboard and Outboard, and Active Inboard Root Link
Failure Fault Repair Times
Root link fatled connects
Channel
A
Rootnode
FC1
Run 1, % of scaled m_norframe
Run 2, % of scaled minorframe
Run 3, % of scated minorframe
303 303 303
B FC3*
* NO repair action taken
190

Table 5.5.4-14. Experiment 13 -Active Outboard Root Link Failure Summary
• -Hz m*nDmum_ 2S-Hz minimum deadliner .oo.,,ok,a,,.dco.._-';;_-_[,oo-..m,Cl__ _1_,n._c..og.,.omI ...,g,n._Z.,..._e,.omI ....... margin "70 L;io,,_J,_ 'nnm I I _l,J, .......' rnin'a'l_....... I .,omlnal I ..........
191

Table 5.5.4-15. Experiment 13 - Active Outboard Root Link Fault Repair Time
Root link failed connects
Channel Root node
Run 1, % of scaled minorframe
Run 2. % of scaled re,norframe
Run 3, % of scaled re,norframe
A FC1 1,810 1.810 1.810
B FC3 1,730 1,730 1,730
t92

DIU Links.
Passive Inboard. The lack of a clear boundary between the validated
AIPS building blocks and the application-specific elements causes problems
when defining network strategies for passive DIU link failures. One area
in which this is evident is the boundary between the network nodes and the
DIUs. The current implementation does not include the DIUs within the
validated AIPS boundary. Consequently, the I/O FDIR cannot distinguish
between a transient fault in the I/0 network and a passive DIU link
failure. Transaction bypass (described in the "Active Node Failure"
section) is the mechanism that addresses this issue.
All out/in service sequences observed in this experiment are considered
nuisance trips because the I/O FDIR cannot repair these failures. The time
the application is vulnerable to nuisance trips is illustrated in
table 5.5.4-16.
Also observed in this experiment is the transmission of data for the
bypassed transactions to the network. This is a problem because the IOSS
discontinues updating the transaction buffer, when a transaction is
bypassed, resultinE in old data bein E transmitted. Therefore, transmission
of bypassed transactions to the I/O network results in force fights at the
actuators.
The application summary for this test is illustrated in table 5.5.4-17.
There is a small effect on the 25-Hz rate because of the nuisance trips in
the I/O network as described in the "Active Outboard Root Link Failure"
section.
Active Inboard. The application summary for this test is illustrated
in table 5.5.4-18. This test results in the same behavior that is
described for the active node failure.
The fault repair times and vulnerability times caused by nuisance trips
are illustrated in table 5.5.4-19. The fault repair times are comparable
to repair times of active inboard llnk failures. The repair of these types
of faults is to regrov the netvork, vhlch results in a similar repair time
vhlch is almost independent of the failed element.
193

Table 5.5.4-16. Experiment 13 - PassiveInboard DIU Link Failures Nuisance Trip Time
DIU Runl,%ofscaledminorframe Run2,%ofscaledminorframe Run3,%ofscaledmmorframe
52 767 767 767
CP1 1.210 1,210 1,210
CP2 187 187 187
OFL 160 160 160
194

Table 5. 5.4-17. Experiment 13 - Passive Inboard DIU Link Failure Summary
OlU100-Hz minimum deadline
margin, % change from
50-Hz ram,mum deadline
marg,n, % change from
25-Hz minimum deadline
margin, % change fromnominal
$2 -0.4
CP1 0.0 0.0 -0,4
CP2 0.0 0.0 -0.4
OFL + 0.1 0.0 0.0
195

Table 5. 5.4-18. Experiment 13- Active Inboard DIU Link Failure Summary
DIU
$2
100-Hz minimum deadline
margin, % change fromnominal
50-Hz minimum deadline
margin, % change fromnominal
25-Hz ram=mum deadhne
margin, % change fromnominal
+0.1 -12.8 -0.4
CP1 O0 -12.8 -0.5
CP2 0.0 -12.8 -0.5
OFL +0.1 -12.8 0.0
]96

Table 5.5.4-19.
DIU
$2
CP1
CP2
OFL
Experiment 13 - Active Inboard DIU Link Fault Repair Times
Repair t_mes
Run 1. % of Run 2, % of
_caled minor scaled minor
frame frame
1,720 1,720===..=._._-=---
1,720 1,720
1,730 1.730
1,730 1,730
Run 3, % of
scaled minor
frame
1,720
1.720
1,730
1.730
Vulnerability caused by nuisance tr_ps
Run 1, % of
scaled minor
frame
821
1,607
400
166
Run 2, % of
scaled minor
frame
821
_.._._._,--.--=---,=
1,607
4O0
166
Run 3, % of
scaled minor
frame
821
1,607
400
_._._._._._.,-=-.-.
166
197

5.5.5 ExperlmP.nt 14: FTP Faults
S;mmary. This experiment resulted in a violation of a fault
containment region in the FTP. Loss of CP synchronization should result in
the monitor interlock disconnecting the outputs of the channel. However,
when inducing this failure, the monitor interlock supposedly engaged, but
application data was still observed on the network fron failed channel.
The "rogue" channel behavior persisted in the system for longer than one
minor frame. Fortunately, the I0P FDIR detected the channel failure and
terminated application activity in that channel. The reliability analysis
was based on the assumption that all rogue channels would be disconnected
in less than one minor frame.
Overview. This experlment was designed to simulate FTP channel faults.
A special fault injection task caused faulted behavior during the seventh
major application frame (arbitrarily chosen). The faults automatically
injected were (1) loss of CP synchronization, (2) loss of I0P
synchronization, and (3) CP output disagreement. In addition, a channel
power failure was manually inserted.
For all of these faults, timing for the application tasks was monitored
during the fault recovery process. The faults were repeated three times in
each of two channels; one with an active root link and one with an inactive
root link.
The fault repair times reported for this experiment are based on FTP
log data, and therefore only represents an approximation of how long the
fault was in the system. The time is the difference between the fault
insertion time and some indication from the system that the fault has been
removed. The detection of the fault by the CP FDIR was used as an
indication that the fault had been removed from the system. This
indication was used because all faults in this experiment should result in
the disconnection of the faulty channel's outputs, which is the sole
responsibility of the CP FDIR.
Detection of a fault results in extended execution of the FDIR. In the
nominal alignment of processing, the event "begin 100-Hz application
computing" is slightly delayed be the execution of the CP FDIR. When the
CP FDIR detects this failure, the "begin 100-Hz application computing" is
198
further delayed and therefore is a suitable indication that the fault has
been removed from the system.
CP Loss of Synchronization. The two versions of the test induced a
loss of synchronization in the CP 10 ms before the FDIR and 35 ms before
the FDIR of minor frame 27 (arbitrarily chosen).
This experiment exposed a serious fault containment error when the FDZR
did not disconnect the outputs of a channel that had lost synchronization
and application transactions were still transmitted by this faulty channel.
A detailed timeline demonstrating this scenario is illustrated in figure
5.5.5-I. The fault is inserted 10 ms before the CP FDIR_ when the CP FDIR
executes, it detects channel B out of synchronization. At this time, the
outputs of channel B should have been disconnected through the monitor
interlock.
At the tlme the fault is inserted in the CP, the IOPs are processing a
50-Hz IlO request. IOP channel B apparently loses synchronization soon
after CP channel B loses synchronization as a result of contention for the
shared bus. The loss of IOP synchronization is suspect in causing channels
A and C to receive corrupted 50-Hz I/O data from channel B. The corrupted
50-Hz IIO data causes channels A and C to perform transaction error
processing for the 50-Hz I/O data from network 2. However, it appears that
channel B received the correct information when it data exchanged the 50-Hz
I/O data. At this time, channel B normally completes the processing of the
50-Hz I/O while channels A and C are performing transaction error
processing.
While channels A and C continue the transaction error processing for
the 50-Hz I/O request, channel B begins execution of the pending 25-Hz I/O
request and transmits to network 2 the 25-Hz chain through the root llnk
that should have been disconnected by the monitor interlock. However, the
observation of corrupted 25-Hz I/O data on network 2 demonstrates that the
disconnection of channel B outputs by the CP FDIR was ineffective.
Channels A and C complete the 50-Hz transaction error processing and
begin executing the 1OO-Hz I/O request that arrived during the transaction
error processing. In normal operation, the 25-Hz I/O request would have
executed during the idle time consumed by transaction error processing. In
199

I
r---
o0
_D
E
m
Iim
J.n
"E _ o
_m
0,,o
r---
I|
I|
m
A
c_
m
@Ct--
o.r"c_u
r--
N
"I-
iC_4
I A
v_
I--
0_0
q
LrJ
,,r-
,T-o
ii,if
L_
c_
,,,.I
,w,,,,
L8
L_
2OO

addition to switching the execution order of the lO0-Bz I/0 request and the
25-Hz I/O request, the lO0-Hz IlO request is delayed when compared to
nominal operation. I/O network 2 returns to normal operation after the
delayed I/O activity completes in minor frame 28.
In our experiment, the loss of synchronization did not affect the
execution of the IOP FDIR in channel B. The IOP FDIR in channel B executes
on time, responds correctly to the disable command from its companion
processor, terminates appllcation-related activity and begins
resynchronization processing.
Similar behavior was encountered when the fault was inserted 35 ms
before the FDIR. The monitor interlock did not disconnect the outputs of
dhannel B when the loss of synchronization was detected. Corrupted 25-Hz
IlO data on network 2 was observed after the CP FDIR detected the loss of
synchronization in channel B.
The different fault insertion time relative to the 50-Hz I/O activity
in the IOP resulted in channels A and C deciding that the chain on network
2 had not completed. Consequently, channels A and C attempted to stop the
IOS in channel B; this action takes significantly less time than the
transaction error processing experience when the loss of synchronization
occurred at 10 ms before the FDIR. The sequence of IlO does not change
from the nominal because channels A and C continue normal processing
earlier in the frame.
Extended FDIR execution associated vlth detecting a channel out of
synchronization was the only observable effect when loss of synchronization
was induced in channel C. The fault processing delays the execution of the
event "begln 100 Hz computing n in the CP, suggesting that the fault was
detected and repaired.
The application summary for this test is illustrated in table 5.5.5-1.
The lO0-Hz deadline margin is affected in all runs, but the greatest impact
vas observed vhen the fault occurred in channel B at 10 ms before the CP
FDIR. The reduced deadline margins for this fault for the 100 Ez and 25 Ez
are a result of the error processing, vhich delays the start of the I/0
activity in minor frame 28 as described above. The impact on the deadline
margin of the scaled application is small. Eovever, this impact is
201

Table 5.5.5-1. Experiment 14 - CP Loss of Synchronization Summary
100-Hzmantmumdeadline 50-Hzmlnlmumdeadline 25-Hzm,n,mumdeadlineChannel Fault time, ms before margin, % change from margin, % change from margin, % change from
CP FDIR nominal nominal nomtnal
B 35 -1.1 -O.1 0,0
B 10 -284 -0.1 -20.1
C 35 -39 -0.1 0.0
C 10 -4.0 .0.1 -0.1
2O2
signlficant on an unscaled application and could potentially lead to missed
computing deadlines or I/O updates in the good channels.
The fault repair times for this experiment are illustrated in
table 5.5.5-2. These times are significantly less than the one minor frame
assumed in the reliability modeling of the reference configuration and are
dominated by the fault insertion time relative to FDIR execution. The
repair times for the channel B failures reflect the repair times as if the
monitor interlock had worked as expected.
IOP Loss of Synchronization. Two version of the test were run to cause
a loss of synchronization i0 ms before the FDIR and 35 ms before the FDIR
of minor frame 27 (arbitrarily chosen).
The lack of nonintrusive, detailed data collection in the IOP prevented
observation of the fault detection sequence. It is assumed that the lOP
FDIR detected the loss of synchronization. This assumption was correlated
with messages in the FTP logs.
The application summary for this test Is illustrated in table 5.5.5-3.
In all cases, the CP FDIR delays the "begin I00 Hz computing" in the minor
frame In vhlch the channel is detected out of synchronization. When the
fault is inserted 35 ms before lOP FDIR (which is I0 ms before the CP
FDIR), the CP FDIR detected the channel out of synchronization. This
indicates that the loss of IOP synchronization caused the CPs to lose
synchronization. When the fault was inserted in channel B, network 2 is
taken out of service for this minor frame. From the table, the delay of
the lO0-Hz computing causes less of a deadline margin shift than when the
fault was inserted in channel C.
In the tests where the fault was inserted 10 ms before the IOP FDIR,
the IOP FDIR detects the loss of synchronization failure. When channel B
loses synchronization, taking network 2 out of service reduces the overall
affect on deadline nargln as described above.
The fault repair times for these tests are depicted in table 5.5.5-4.
All the values are less than one minor frame. The differences are
dominated by the fault Insertlon's proximity to the CP FDIR.
Output Disagreement. The second category of faults was output
disagreement. These vere induced using a second strategy involving non-
203

Channel
B"
Btt
C
C_t
Table 5.5.5-2. Experiment 14 - CP Lossof Synchronization Fault Repair Times
Fault time, prior toCP FDIR
Run 1, % of scaled mmor frame
32.8
Run 2, % of scaled minor frame Run 3, % of scaled minor frame
35 33.3 33.3
10 16.0 16.0 16.1
35 33.3 33.3 33.3
10 16.1 16.1 16.1
" Runs 3, 5, and 6
t, Runs 1,3, and4
2O4

Table 5.5.5-3.
Channel
B
8
C
C
!
Fault time, ms beforeCP FDIR
3S
10
35
10
lOP Loss of Synchronization Summary
"_-HZ minimum deadline --_-Hz minimum deadline
margin, % change from margin, % change fromnominal nommai
-2.3 -2.0
-0.2 -0.1
-4.3 -2.0
-2.8 -0.1
25-Hz minimum deadlinemargin, % change from
nominal
-1.8
0.0
-1.8
0.0
205

Table 5.5.5-4. Experiment 14 - lOP Loss of Synchronization Fault Repair Times
Channel
B
Faulttlme, prlorto Run 1,%ofscaledminorframe Run 2,%ofscaledminorframe Run 3.%ofscaledm=norframeIOPFDIR
35 16,2 16.2 16.2
10 99,6 99,6 99.6
35 16.2 16.2 16.3
10 99.6 99.6 99.6
2O6

congruent memory. At the fault insertion time a value is copied into an
application output buffer. This value is incorrect in the "bad" channel.
When the output data is voted, error latches are set in the data exchange
hardware to indicate the data disagreement for the next FDIR cycle.
A The application summary for this experiment is illustrated in
table 5.5.5-5. The minimum deadline margin for the 100-Hz rate is slightly
reduced because of the 100-Hz computing delay when the faulted channel is
disconnected. This is the same effect observed during the other FTP
faults.
For this experiment, the IOSS event logs report a soft data exchange
error in the faulted channel. Faults in channel B resulted in the queue
manager making a request to switch root links. The fault repair times for
this test are depicted in table 5.5.5-6. These times may seem slightly
larger than expected, but are a consequence of the definition of the fault
repair time. For this fault to be detected, the application must write I/0
data into the shared memory, and then the I05$ must transfer the data into
the DPM through the data exchange, which causes error latches to be set.
The I0P FDIR then executes to read the error latches to notify the CP FDIR.
The CP FDIR discovers the output disagreement on its next execution which
completes the fault repair cycle defined for this effort.
Channel Power Loss. A channel power fault was accomplished by the
experimenter turning off power to the channel to be failed approximately
4 sec after the FTP synchronization handshake was observed. As such, the
time of the power failure fault insertion time was only approximate.
The fault effect on the application is depicted in table 5.5.5-7. The
approximate fault repair times for this test are depicted in table 5.5.5-8.
Because faults were inserted manually for these tests, the first indication
of abnormal system behavior is used to approximate the fault insertion
time. Channel B repair times are based on entries in the IOSS error logs
that indicate problems with I/O activity on network 2 and an indication in
the network 2 I/0 dat& of fault repair (interruption followed by
resumption). No such secondary indication was available to determine the
fault repair times with any accuracy for channel C.
207

Table 5.5.5-5. Experiment 14 - Output Disagreement Summary
Channel
B
C
100-Hz mmmmum deadlineimargm, % change from nominal
SO-Hz minimum deadlinemargin, % change from nominal
25-Hz minimum deadlinemargin, % change from nominal
-0.2 -0.1 0.0
-2.9 -0.1 0.0
208

Channel
B
Table 5.5.5-6. Experiment T4- Output Disagreement Fault Repair Times
Run 1,%ofscaiedm_norframe Run 2,%ofscaledminorframe Run 3,%ofscaledmlnorframe
233 233 233
233 233 233
2O9

Table 5.5.5-7. Experiment 14 - Channel Loss of Power Summary
Node failed
B
lO0-Hz ram=mum deadline
margin. % changefrom nommat
50-Hz ram=mum deadline
margm, % changefrom nominal
25-Hz minimum deadline
margin, % changefrom nominal
-0,2 -0.1 -0.3
-4.1 .1.6 -1,6
210

Table 5.5.5-8. Experiment 14 - Channel Power Failure Fault Repair Timesmlflor frame
* Not available** Runs 1,3,4
211
5.5.6 Experiment 15: Transaction Selection
This experiment explored the performance aspects of transaction
selection/deselection for application chains. Transaction selection is
requesting the IOSS to make a currently inactive transaction in a chain
active, that is execute the transaction when the chain is executed next.
Transaction deselection is the opposite. The time to perform the selection
of an inactive transaction and deselection of an active transaction during
one minor frame was determined. While no strategy has been developed for
its use, the performance aspects of this capability will guide its
application.
In this experiment, the fastest application rate task had a special
code that caused a transaction deselect/select action in minor frame 20
(arbitrarily chosen). The deselect/select system calls are processed
before the execution of the subsequent I/O request. The time to complete
transaction selection was observed by a delay in the start I/O request
event time.
The application summary for this experiment is illustrated in
table 5.5.6-1. The reduced minimum deadline margin for the 100-Hz rate is
a result of the transaction selection and deselection processing. The
processing appears to occur in the IOP on the next execution of the I/O
request after the selection and deselection. The time taken to
deselect/select one pair of transactions is 9.2Z of a scaled 100-Hz frame.
This value will probably prohibit transaction deselectlon/selection from
being used in a strategy that would require high-frequency
selectionldeselectlon of a large number of transactions.
5.6 SMAM,-SCALE SYSTEM OBSERVATIONS
Integration and testing of the small-scale system proceeded in three
phases. The problems that were encountered in all phases of the
development are to be expected in prototype, experimental, and proof-of-
concept system development projects. There are two major concerns when
integrating an application system. The first problem is getting anything
to run. It was remarkable how quickly the application was integrated into
the complex, fault-tolerant AIPS small-scale system. This is partly
212

Deselected
,i
fFL
Table 5.5.6-1. Experiment 15- Transaction Deselection/Selection Summary
100-Mzmlntmumdeadline 5(_-Hzminimumdeadiine 25-Hzmlnimumdeadline
Selected margin. % change from margin. % change from margin, % change fromnominal nominal nom,nal
i i i
IFX -92 0.0 + O. 1
213

because of the AIPS design concept of providing a simplex application
programming model. The problems discussed in this section deal with the
second, more difficult concern---validating the overall application system.
Design, production, and checkout of DIU simulators and experiment
control equipment were accomplished at Boeing Advanced Systems in Seattle,
Nashington. An AIPS I/O network node was used to test the DIU simulator
interface to the AIPS I/O network. Application Ada software was written
and compiled to ensure correct syntax. Facilities were not available to
test the logical correctness of application software before integration
with the AIPS FTP at CSDL.
Integration of the DIU simulators, experiment control equipment, and
Ada application software with the AIPS FTP and complete AIPS I/O networks
took place at CSDL in Cambridge, Massachusetts. The bulk of hardware and
software debugging and the majority of problems were discovered during this
phase of the project. Ada application software development was completed
and AIPS application environment characterization data were collected. The
characterization data were used to complete the planning of experiments to
be conducted at NASA Langley.
Experimentation with the small-scale system occurred at NASA Langley
facilities in Hampton, Virginia. A few final bugs were corrected and the
planned experiments were conducted. Preliminary analysis of data collected
at NASA Langley was used to direct the experimentation effort.
The greatest hindrances to the development of the application software
and its integration with AIPS software were 1) the lack of detailed
specifications for the AIPS services software/application software
interface; 2) the lack of a user's guide for the AIPS hardware and software
configuration; 3) AIPS software problems uncovered as a result of
attempting to run application software and I/O activity.
In addition, the lack of detailed, complete, and accurate hardware
specifications for the AIPS I/O network made the design of the DIU
simulator difficult and ultimately resulted in a major design error
requiring correction during the second phase of the project.
Application of the IAPSA design methodology was hindered by incomplete
performance and characterization data; system software performance data
214
were lacking before the DENET simulation effort, making accurate prediction
of application software performance impossible.
The intent of the small-scale system effort was to test some of the
critical characteristics of the .IAPSA architecture as implemented using
AIPS fault-tolerant system building blocks. The performance of the
prototype hardware was such that the IAPSA configuration application
software could not be run in real-time on the proof-of-concept AIPS and the
goal of testing critical features with a workload simulating real-time
demands could not be met. Rather than abandon testing altogether, "slow-
time" testing was used to focus on intersystem and application/system
functional interactions.
Several unexpected examples pointed out the fallacy of using "industry
experience" and "time in the field" as a means validating the correctness
of software and hardware: I) some code generated by the Ada compiler was
incorrect, causing the AIP$ to crash; 2) previously undetected problems
with an HDLC interface chip that had been in wide use in industry for
almost 2 years nearly prevented the successful implementation of .the DIU
simulator hardware.
Nonintrusive monitoring of small-scale system performance was
difficult. The design philosophy behind AIPS was that each of the elements
would be characterized sufficiently to preclude the need for detailed
system performance monitoring capabilities. Testing experience revealed
that a very important consideration in any embedded system must be "design
for non-lntrusive testability" from an application point of view. There
were system-applicatlon interactions that could only have been studied by
making significant alterations to both application and system software only
for the purpose of monitoring their operation. In an actual embedded
application this would not be acceptable, as any modifications to a system,
no matter how seemingly insignificant or subtle, can greatly alter its
operation.
Observations derived from significant experiences with the small-scale
system are summarized below.
215

As manyprojects have been discovered since the advent of Ada, the use
of a validated Ada compiler does not guarantee that the code generator will
be correct for a given target processor.
Application code was compiled using a derived Ada compiler. Several
problems were encountered that related to compiler code generation and the
lack of documentation regarding the compiler implementation. A later
version of the Ada compiler has been released that may correct the problems
encountered.
The immaturity of Ada as a language/operating environment for embedded
systems, the level of development of the AIPS services, and unfamiliarity
vlth the actual AIPS details contributed to the problems. Accurate and
current AIPS documentation was unavailable to aid in application software
development and integration.
Code Generation Problem 1. Code generated by the compiler caused the
68010 CPU to attempt to access a word size variable on an odd byte
boundary, causing the AIPS FTP to crash. The problem was debugged by
single-stepping through the program using disassembled Ada code as a guide.
When the cause of the problem was discovered, a patch was created to
allocate an even number of bytes for the variable. This patch was required
for each unique application program written. No attempt was made to
correct the problem at the Ada source level.
Code Generation Problem 2. The compiler-generated code incorrectly
performed aggregate assignments in a nested variant record. The problem
was corrected by using an intermediate variable to assign values to the
inner variant record.
Code Generation Problem 3. bda representation clauses were used to
control the size of components in a record. The compiler allocated extra
storage for some of the components. The use of the "size M attribute to
pass the size of the components to a procedure resulted in a value other
than that specified in the representation clause. The problem was resolved
by "hard-codlng w the size of each of the components in the procedure calls.
Ada IJaplementatlon Ambiguity. Global variables, which are initialized
in their declarations, are initialized only when the program image is
216

loaded into memory for the Ada compiler/linker options used. Subsequent
restarts of the program without reloadlng the program image causes the
global variables to have unknown values. (Local variables in functions and
procedures are initialized each rime the function or procedure Is called.)
The problem was solved by removing global variable initializations from
their declarations and explicitly assigning values to them using code that
executed during elaboration.
An alternative linking procedure was understood to be available, which
solves this problem by specifying that the code is to be ROM-resident. No
attempt was made to use this procedure as it required more time to set up
than was available.
The use of a high-level language Such as kda does not eliminate the
need for high-level debugging aids. The complexity of the target code
generated by the &da compiler is difficult to debug without access to these
high-level debugging tools.
The majority of debugging was accomplished using "visual debugging"
tools, namely carefully studying the Ada code to determine if a logical
error existed. No tools were available on the FTP that allowed high-level
debugging; all machine level debugging was done at assembly code level. A
resident monitor was present in the FTP that allowed setting breakpoints
and disassembling code.
When Ada exception problems were encountered, it was necessary to set a
break point Just before the exception address and single step up to the
point of the error. _/hen the address of the error was determined, the
program map was used to determine the package in which the error occurred.
The package was disassembled and debugging proceeded using the FTP monitor
program at the assembly code level.
Another method used for debugging was to modify the Ada software to add
calls to a procedure that placed messages in a debugging log. When the
system crashed, the resident monitor program was used to examine the
contents of the logs, tracking the operation of the program in question.
9hen the problem was fixed, the procedure calls were removed and the
program was recompiled and rellnked.
217

A slngle-channel FTP high-level Ada debugger would be helpful.
However, some of the problems that arose were a result of cross-channel
voting, data sharing, and so forth, which are inherent to the AIPS
architecture. A high-level debugger exists for this ADA compiler that
requires the development of unique drivers for each hardware environment.
Whether it can be adapted to the AIPS bit-synchronous architecture is not
known. Debugging Ada application code would be greatly enhanced by the
availability of such a tool.
In well-defined Ada embedded system environments, it is possible to
develop and debug a large portion of the code in a higher level
environment, such as on a VAX, where more sophisticated debugging tools are
present, and then recompile the code for the target embedded environment.
Extensions to the Ada operating environment in AIPS make this type of
development very difficult for functions with a strong dependence on the
extensions unless an emulation of the extensions is available in the higher
level environment.
Some means of readily integrating and debugging application code in the
embedded AIPS will still be required. Many of the obstacles encountered
with AIPS were caused by its immaturity. The system services were not
completely debugged and no accurate documentation existed to guide the
application programmer. Without the close cooperation of actual system
programmers at CSDL, it would not have been possible to get the application
to run in the AIPS environment.
Specifications for the AIPS I/0 system did not adequately describe the
I/0 network hardware interface requirements for DIUs.
The HDLC protocol, as used in the /tIPS I/0 system, was not adequately
described in the AIPS documentation. All data being sent through the HDLC
interface chip in the AIPS was inverted on output to the I/O network, while
all IIDLC protocol fields generated within the interface chip itself were
sent in noninverted form. This problem was not discovered until the system
was set up for integration during the second phase of the project at CSDL.
It required major revision to the DIU simulator software.
218

"Industry experience w and "time in the fleld u are not sufficient to
Euarantee the correct operation of a device.
Components used in flight critical applications must behave in a
predictable manner. The formal mathematical proof of device correctness is
not yet practical. As an alternative, mature technology devices are often
selected for flight critical applications based on the assumption that all
major problems will have been detected in the accumulated hours of
operation in a wide variety of applications.
The HDLC interface chip used in the DIU simulator hardware had a latent
A design error that caused incorrect operation with certain bit patterns.
The chip had been in general use in similar applications for approximately
2 years.
The manufacturer of the chip had extensively simulated its operation
before its production and release to the industry but had not uncovered
this problem. The simulation for the chip was revised to duplicate the
specific conditions encountered in the DIU simulator and the problem was
verified. A revision to the chip is now in progress, which should correct
this and other previously reported problems.
Simulation is a good technique for verifying device correctness.
However, it must be used in a manner that will maximize the coverage of
potential problems. To guarantee correct operation, a simulation must be
exhaustively applied; this is time consuming and difficult for a
manufacturer to Justify on economic grounds.
User doctmentation and application guidelines for the /kIPS FTP were not
available.
Many of the problems encountered when generating application programs
for the snail-scale systel were a result of the lack of complete
documentation or specifications for the AIPS software and a lack of
experience with AIPS. The system was still under development and problems
were encountered with system services that required revisions to the system
software.
219

For AIPS to be a fault-tolerant, building block system suitable for use
in aerospace applications, complete specifications and documentation must
be available and all the components of the system (hardware and software)
must be validated.
The ability to easily and nonintrusively instrument an embedded system
is essential to evaluate its performance and monitor software interactions.
The first experiments run using the small-scale system characterized
the operation of the system in the application configuration and pointed
out difficulties in monitoring system performance.
The design and validation concept for the IAPSA architecture (ref. 5)
assumed that the testability of the IAPSA configuration would rely on AIPS
verification and validation techniques that do not require total system
simulations. However, characterization of AIPS was not complete when
small-scale system integration planning was started. Even with total
characterization of AIPS, the interaction between AIPS software elements
and application programs is so complex that either an easily used,
nonintruslve measurement system or a high-fldelity system simulation are
required to adequately predict application performance.
Implementation of the periodic scheduler in the FI_ points to the need
for complete specification of system features so that the system softvare
designer understands the full implications and intent of a system softvare
requirement.
Use of the FTP periodic scheduler to schedule exact harmonic rate
periodic tasks resulted in nonharmonlc task execution, causing task
execution phasing to drift. Exact harmonic task scheduling is a common
practice in control system design, vhlch guarantees precise control of task
phasing and york load allocation. The facilities for periodic scheduling
were included In the FTP scheduler. However, the need for exact harmonic
operation was overlooked.
22O

6.0 CONCLUSIONS
During the IAPSA II contract, a prevalidation methodology was developed
and applied to the definition of an integrated system for an advanced fighter
aircraft. An integrated flight control/propulsion candidate architecture
concept, based on AIPS fault-tolerant system building blocks, was evaluated
for its ability to meet the demanding performance and reliability
requirements of the flight-critical functions performed by the system. This
preliminary evaluation guided refinements to the architecture design. A set
of experiments was defined for testing critical characteristics of the system
concept using a small-scale system. These characteristics were defined based
on the earlier performance and reliability" model evaluation. This effort,
particularly the application of the prevalidatlon methodology, provided
several interesting lessons described in this section.
A major result was that several weaknesses in the candidate architecture
became apparent through the use of the prevalidation methodology. These
shortcomings were not evident in the initial performance and reliability
screening performed to produce viable candidate alternatives. This is
important because concept weaknesses of this nature are usually not uncovered
until late in the system life cycle, for example at hardware and software
integration time. The IAPSA II effort shows unequivocally that it is
extremely important to perform a detailed evaluation of the specified concept
in terms of reliability and performance before committing a project to a
hardware and software design. Another IAPSA II study result is that
performance must be investigated at the same time as reliability for a fault-
tolerant system. Capability to support the application performance needs is
a key characteristic that must be proved during early development efforts.
If a system concept is incapable of meeting the performance needs of the
application, its ultrarellablllty characteristics will be of no value.
Some problems encountered during the study effort stemmed from the fact
that the AIPS system development effort paralleled the IAPSA II design and
evaluation effort. That is, the development of the application based on
building blocks suffered from too much concurrency with building-block
221

development activities. This was evident at several points in the effort.
For example, the performance simulation results were not available to guide
the refined configuration definition. Also, the schedule for small-scale
system development dictated that the candidate configuration workload be used
because the refined configuration data were not yet finalized. Similarly,
feedback of evaluation results showing strengths and weaknesses of the AIPS-
based candidate system was not available in time to aid the AIPS developers
at CSDL.
6.1 METHODOLOGY
The prevalidation methodology is aimed at the early concept development
phase of system development. The methodology calls for a greater level of
effort early in the design cycle than is typical in current effort. It is
interesting to note that the resulting front-end loaded development effort is
similar to the staffing concepts used by Japanese companies in their product
development efforts.
Some methodology elements needed during a full development cycle are
shown in table 6.1-1. Note that only a few of these elements were directly
exercised during the IAPSA II effort. Further tool and method development is
needed to address system design aspects that are less critical from a safety
standpoint but vitally important to system affordability and supportability.
For example, effective tools and methods for the evaluation of cost,
maintainability, and so forth are needed.
Our experience indicates that a hierarchy of requirements and
specifications with traceability between levels should be developed for each
design to get maximum benefits from the methodology. The performance
parameters from models that demonstrate achievement of higher level
requirements should be used to provide performance specifications for the
lover level elements. Additionally, implicit design assumptions or
evaluation assumptions that are exposed during the model development must be
expressed in the lower level specifications. Parameters critical to the
success of the design and important assumptions must be tested in the build,
integrate, and test phases of the development.
222

TABLE 6.1-I. METHODOLOGYELEMENTS FOR TOTAL DEVELOPI/ENT CYCLE
Requirements Specification Traceability
Design Guidelines
Building Blocks
Design Concept Analysis
Reliability
Performance
Cost
Availability
Survivability
Maintainability
Validation
Design for Validation
Testing Methods"
Rare Failure Modes
Redundancy Management Performance
Proof of Correctness
Laboratory Testing
Flight Testing
223

6.1.1 System Evaluatlon Tools
Our experience with the evaluation tools was instructive. The majority
of the analysis effort was spent either defining how the system works or
performing failure or timing analysis prior to system modeling. The actual
time spent using the tools to execute the models was a very small part of the
total analysis effort. The level of detail required in the high-level
performance and reliability models to evaluate the important attributes of a
flight-critical system is currently an art. Furthermore, the overall time
required to evaluate a system concept is currently too long. The
prevalldation methodology will be most effective when a large number of
alternatives can be evaluated in a relatively limited time period to produce
a nearly optimal design. Clearly, more practical and efficient analysis
techniques with supporting tools must be developed to reach this goal.
Clear and concise documentation is needed to support the prevalidation
methodology. Definition data for system building blocks or components are
needed to construct the evaluation models. Descriptions of the alternative
architecture concepts, including important design and evaluation assumptions,
are needed to distinguish between key design alternatives. The effort called
for in the prevalldation methodology is slowed down excessively when
documentation is lacking.
Performance and reliability issues were seen to be closely interrelated
during this study. This became clear when the susceptibility of the
candidate system to certain transient faults was studied. The transient
study showed that detailed modeling could point out the benefits of certain
redundancy management strategies in the face of specific transient threats.
The interaction concern was associated with transients, which can cause a
channel to go out of synchronization. With the current AIPS
resynchronlzatlon method and the heavy IAPSA II application workload, this
type of transient has the same effect as a permanent failure. That Is, the
system performance analysis shoved that not enough Idle time was available to
allow channel recovery to take place during application execution.
Another example shoving performance and reliability interaction is
associated vlth the hazard faced when an AIPS I/0 network is taken out of
service for repair after devices on the other network have failed. The
224

performance analysis shoved that the heavy application I/O workload precluded
a possible solution strategy of sending sensor and actuator data redundantly
over both networks. Without the discipline enforced by the methodology, the
reliability evaluator might be tempted to assume that the reliability problem
could be handled by redundant bus traffic. Similarly, if reliability wasn't
considered at the same time as the performance analysis, the workload needs
could be understated by ignoring requirements imposed by failure protection
or redundancy aspects. These examples emphasize that if concept problems are
to be uncovered early in the life cycle, both reliability and performance
must be analyzed as In the prevalidation methodology.
6.1.2 Performance Tool
Techniques and tools for system-level performance modeling are relatively
less developed than those for reliability modeling. Much more effort has
been put into the development of the appropriate reliability tools and much
experience has been gained applying them to fllght-critical system concepts
in the last I0 years.
By comparison, the use of a discrete event simulation tool, like DENET,
is new in the analysis of fllght-critical systems. Our conclusion is that
such tools are very promising for determining critical performance
requirements, but additional tool application experience is needed to define
practical and effective system level modeling techniques. On the other hand,
our experience indicates that complex system solution concepts involving
multiple processing sites and intensive I/O activity will possess high
technical risk unless such tools are used to verify that the application
performance needs can be met.
It should be noted that only high-level models of the appropriate
sequencing and control functions were needed to discover the critical
throughput and I/O activity performance problems in the IAPSA II study. This
suggests that the level of early modeling need not extremely detailed as long
as the behavior of the important functions is included. Of course
engineering Judgment is required to decide what is import_nt.
During the performance tool effort, special data collection and data
analysis code were required to obtain adequate visibility into the operation
225

of the modeled system. A large portion of the analysis effort was spent
examining and interpreting the output data from the performance simulations.
The amount of experiment data were overwhelming. We relied on summary
statistical data and exceptional event listings to initially screen the
experiment data. However the subsequent detailed analysis was very time
consuming and therefore an area for further development.
One interesting performance modeling observation was that the functions
that presented modeling difficulty also appeared to present implementation
difficulties. It was not always clear whether the difficulties were the
result of complexity or fuzzily defined operating concepts. What seemed
clear to us is that early modeling can provide an early indication of unclear
requirements or an unwieldy design structure leading possibly to an
unvalidatable system.
Additionally, detailed modeling provided insight into operation of the
specified system. Early simulation results provided an indication of
negative consequences of certain design features. For example, evaluation
with a model of the initial I/O request handling process showed that the
heavily loaded portion of the candidate system could not meet several time-
critical deadlines. (Implementation of a high-level model of this process
also proved to be difficult.)
Therefore, the modeled operation of the I/O request process was changed
for the rest of the performance simulation effort. The original model
handled requests from multiple rate groups on a priority basis. The
redefined model implemented a separate task for each I/O request. Each task
handled all the activity needed to perform a single I/O request. Complexity
was limited to a shared semaphore, which was used to enforce exclusive use of
the network during the limited period when messages associated wlth a single
I/O request were being transmitted over the network. Thus, the modeled
operation used the underlying preemptive priority tasking system to provide
limited preemptive priority handling of I/O requests. Unfortunately, results
of this modeling were not available in time to aid the AIPS system developers
at CSDL.
226

6.1.3 Reliability Tool
As mentioned earlier, the reliability modeling of fllght-crltieal systems
is relatively advanced compared to performance modeling. The current state
of reliability tools appropriate for highly reliable systems is due in large
part to past research efforts. However, our IAPSA II experience suggests
that methods are still needed for modeling large-scale integrated systems.
Our reliability modeling approach was based on the use of multiple
models, each of which reflected the success of a key system function.
Modeling the dependency of these system functions on the central elements
such as communication devices, electrical, and hydraulic power distribution
was difficult. It was easy to miss the reliability implications of system
interconnection alternatives, especially when the central elements were
interdependent. For example, the dependency on electric power of the AIPS
redundant I/0 network elements and the redundant surface actuation channels
caused subtle problems in the refined configuration mesh network option. A
special power connection scheme was needed to preclude certain two-failure
combinations resulting in a loss of safety.
Modeling approaches, which make these central dependencies more explicit,
generally result in an extremely large system level model. This is
unattractive because of the problems associated with developing and
validating models containing large numbers of states. In fact, most of our
progress in practical modeling methods for large-scale systems has involved
ways to reduce the model size. Unfortunately, many of the techniques used
are ad hoe. More work is needed to develop techniques to formally combine
the separate section aodel results and to ensure that potential interactions
are correctly treated. Additionally, techniques for estimating error caused
by model truncation are needed for approaches llke ours, where a problem is
split into submodels.
Methods for evaluating longer term reliability measures are also needed.
The military emphasizes operational performance capability over time, so
availability- and supportabillty-related measures should play a large role in
the evaluation of candidate architectures. Current tools and techniques take
advantage of relatively small failure rates and short exposure times
associated with highly reliable system safety assessments. It is not clear
227
how appropriate these are for availability- and supportability-related
evaluations.
The reliability evaluation experience indicated that a great deal of the
effort was spent performing system failure analysis. For this reason an
expert system approach was explored for the purpose of automating this
effort. This type of system is ultimately intended to aid in the failure
analysis of a candidate system. The tool will use a system description to
produce a reliability model. The current prototype produces a reliability
model in the ASSIST program format.
6.2 ARCHITECTURE
Our overall conclusion is that integrated systems are feasible and in
fact desirable. Such systems allow minimization of the number of sensors and
actuators in the system, support optimum control approaches and make feasible
enhanced supportability features such as function migration, pooled spares
and two-level maintenance.
On the other hand, special care is needed during the design phase to
ensure that there are no undesirable interactions between the formerly
independent functions. All interactions that might take place between
functions during normal operation as well as operation during and after
failures must be well understood and provided for. In short, more formal
system engineering approaches are needed during development to achieve the
benefits of integrated systems.
lIith regard to the specific IAPSA II study architectures, the detailed
analytical evaluation showed that the initial candidate architecture was
unable to meet either the reliability or performance requirements. The
reliability analysis showed that the concept suffered from loss-of-safety-
failure situations and several loss-of-full-mission-capability situations.
Failures not covered (i.e., detected or identified) by the redundancy
management process and potential worst case component failure modes were
critical in this evaluation.
The performance analysis showed that part of the candidate system was
overloaded, and did not possess the needed growth capability. Special
coordination was needed between the time-critical application tasks and the
228

time-critical system tasks to allow the heavy application workload to
complete in the allowable time. Possible application-system execution
phasings and alternative organizations of the application workload were
evaluated using the performance simulation. The result was that only the
most efficient organizations could fit into the allowable frame period.
However, even the optimum workload organization had inadequate growth
capability.
Evaluation of the original concept identified weaknesses, which allowed
definition of a concept more capable of meeting the specific requirements.
Reliability evaluation of the refined configuration showed that it met the
necessary safety and mission requirements although this result is dependent
on certain critical parameters and assumptions, for example, the likelihood
of a control surface Jam.
The refined configuration minimum growth factor estimate was about 7OZ.
There appear to be two performance bottlenecks. The first is the speed of
the data exchange hardware. The IAPSA II workload incorporates a large
amount of data, which must be made so.urce-congruent or voted before output.
Because of its intimacy wlth the synchronization function, the data exchange
speed will not improve dramatically with technology insertion, such as faster
processor and memory components. The second concern is that the IC network
operation was never modeled. Although the traffic is substantially lower
than I/O traffic it has unique characteristics, which will impose further
critical timing demands on the already heavily loaded IOP.
6.2.1 AIPS Building Blocks
An early IAPSA II design decision was to base the design on the AIPS
fault-tolerant building-block system. This decision was made to benefit from
certain fault tolerance concepts that formed the basis of the AIPS design.
These included transparent and efficient handling of information and voting
exchanges, inherently effective failure detection capability, and protection
against Byzantine or malicious faults.
In general, our conclusion was that the AIPS concept was very innovative,
incorporating advanced fault tolerance concepts and providing a unique
application environment in which the failure protection for the core system
229

elements is completely transparent to the application softvare. AIPS
supports distributed computation and, common system hardvare and softvare,
and alloys systems containing elements vith mixed-redundancy levels. Because
the use of building blocks is nev, it is not unexpected that system
development vith them should have unique characteristics. Our observations
in this regard follov.
First, it should be noted that the developer of a fault-tolerant
building-block system has some unique constraints. The fault-tolerant system
developer has a limited number of potential users compared to the developer
of general purpose digital systems or devices. Furthermore, each of the
specific high-reliability applications has its ovn unique set of high-level
performance and reliability requirements. Thus the building-block system
must be configurable so as to satisfy a vide range of requirements. The
system developer must consider all aspects of use of the system by the
application. Instead of one demanding user, he must satisfy several vith
sometimes conflicting needs. Features that appear inadequate to some users
may be too much for Other users.
Next, vith a mature system, the application system design team vould
start vith an application users' guide that defines the building-block
elements. Application guidelines vould be provided to guide the use of the
building-block elements in the application system. Finally, Hprevalidated"
hardvare and softvare building-block elements vould be available. The
validation aspects o£ design vith mature building blocks are the most
significant to the application design team.
The KIPS developers' validation approach takes advantage of these
prevalldated buildlng blocks. The major benefit to the application is the
reduction in the amount of validation effort needed to certify or qualify the
application system. The traditional verification and validation effort vould
be dramatlcally reduced vlth a system based on KIPS building blocks compared
to a custom system design.
The key to this reduction is the prevalidatlon effort performed by the
buildlng block developers. Thls effort consists of tvo major thrusts:
(1) design verification, vhlch shovs that each building block element follovs
the KIPS specifications, and (2) development of a set of design guidelines,
230

which implies certain AIPS attributes if followed by the application design
team. Because of the parallel IAPSA II/AIPS development, the first major
difference between Boeing's effort and the ideal use of building blocks is
that this prevalidatlon effort had not been completed.
We have concluded from our experience that the application design team
will have special needs when validating a system based on building block
elements. In the final development phases the application must be tested in
a closed-loop manner representative of operation in the flight environment.
Visibility into the internal workings of the building-block elements is
needed during this testing to verify critical application behavior. This
means that internal variables or signals must be available for testing
purposes. To complicate matters, these must be obtained on a non-
interference basis to preserve the validation integrity. Because the testing
needs of potential building block applications may differ, testability
features must be able to satisfy a broad range of users.
The visibility needs nan be very detailed. In general all design
characteristics that might affect operation of the application functions must
be understood by the application design team. In short, the building-block
developer must provide certain building-block-implementation details to the
application designer. For example, mission-eritlcal system experience has
shown that source code is often needed for the key vendor-provided operating
system or executive functions. This is not because of a need to modify the
code but to provide the necessary understanding of how the key functions
work. This experience may be exaggerated because of poor or missing
docuaentatlon, but it demonstrates how much detail the application team needs
about implementation of functions crucial to system performance.
In addition to details of key system functions, the application design
team will need data from the design verification effort carried out during
the building-block prevaltdation effort. This information is needed for two
purposes: (1) to document the validation basis of the integrated system for
the certifying or qualifying authority, and (2) to indicate if and where
application-specific validation efforts viii be required.
One side effect of the use of fault-tolerant blocks and the application
of a prevalidation methodology may be a different relationship between the

system contractor and the subsystem vendor(s). The building block vendor(s)
will need to develop a functional specification that includes detailed
reliability and performance attributes. The attributes should be quite
detailed because experience has shown that subtleties of the building-block
interrelationships are important. Two phases of interaction with vendors may
be needed during acquisition. The first phase would occur during building-
block definition to provide information to the vendor about potential
application system detailed requirements. The second phase would be during
the hardware/software bid when detailed building block characteristic data
would be provided to the system contractor for use in evaluation modeling.
6.2.2 Concepts lk-edingAttention
The AIPS development program was directed toward the production of a
proof-of-concept system. The original system requirements were derived from
a survey of application needs for a variety of aerospace vehicles.
Unfortunately, application needs were given less emphasis in the subsequent
austere development program.
The AIPS system operation underwent some changes during the IAPSA II
effort, which is to be expected. (Unfortunately, CSDL was unable to document
these in time to support the IAPSA effort.) Many changes appeared to be
required for either implementation feasibility reasons or real-time
performance reasons. When changes occur, side effects on the application
interface are common unless it is carefully controlled. One way to preclude
this is to formally define an application interface concept early in the
hardware and software development. This interface is specified by an
interface control document.
Sensor redundancy management provides an example of application interface
needs. In the KIPS, sensor redundancy management is an application function,
while communications is a system services function. The responsible
application voting processes can take advantage of the knowledge that data is
not available because of communication errors. In some cases, noise may
cause data from certain transactions to be unreliable or unavailable for just
one application cycle. The redundancy management process must operate in a
232

special mode during this period. After some communication element failures
the system services software changes the status of the application-requested
I/O traffic because the devices are no longer reachable. This is clearly
worthy of a special indication to the application. For some functions, such
as IAPSA II flutter control, a significant change in operational mode is
necessary when communication with a certain number of sensors is permanently
lost. Therefore the application has a definite need to obtain a variety of
communication error data.
In retrospect, it is clear that any building-block effort would benefit
from an application forum in which widely varying operational needs of the
application could be discussed with the system specifiers or implementors.
An inhouse application advocate might serve this purpose. From the building-
block perspective, IAPSA II represented only one of many possible sets of
requirements that the application interface concept should be designed to
handle.
Some system specification capabilities originally called out for the
candidate architecture vere not included in the proof-of-concept development.
For example, an early AIPS decision was to defer development of the system
manager and I/O system software capability needed to support function
migration until later in the development cycle. Because function migration
has such demanding timing requirements when application needs are considered,
we decided not to incorporate it in the candidate design until it could be
demonstrated. Thus function migration capability, its associated validation
issues, and its potential applications (safety enhancement, mission dispatch
enhancement) were not explored in this study.
Other capabilities appearing in early functional requirements were
apparently excluded because of hardware, software, or resource difficulties.
In such cases, it is important for the implementors to know how the
requirement affects the high-level operational capabilities. If the system
services software was specified in a manner that allowed traceability of
required software performance characteristics to the supported system level
operations or functions, the importance of the low-level functions would be
clear. With a rigidly defined and enforced requirement and specification
233

hierarchy, implementors will always be aware that certain system level
principles could be affected by the implementation of a low-level function.
Because there was no formal connection to operational aspects, the
implementation of some features prevented their use because certain implicit
timin E needs could not be met. For example, the periodic I/0 activity
scheduling capability was not usable because harmonically related application
execution rates were not achievable. The application rate groups would drift
in and out of phase during operation causing periodic overloads. Similarly,
the current capability to automatically resynchronize a channel is unusable
with the IAPSA II workload.
The functionality allocated to the AIPS building-block software in the
system specification" was very extensive. Because of the" fundamental
importance of the system services software, as much, if not more emphasis
should have been placed on the development of key software functions as on
the development of critical hardware functions. Rapid prototyping techniques
might have been used to address key feasibility and performance questions.
Modeling techniques, such as those called for in the prevalidation
methodology, could be used to identify the critical modules, functions or
operations associated with the design.
The magnitude of a software validation and verification effort is a
function of the criticality of the implemented function and the complexity of
the design. Validation of complex software, especially that involving
nondetermlnlstlc behavior, is extremely challenglnE and costly. For this
reason previous critical software efforts have emphasized reduction of the
size and complexity of the critical programs. By comparison the current
system services is large and complex. Recall, that the refined configuration
study, shoved that a set of redundant buses provided nearly the same
reliability measures as the reconflgurable I/0 mesh networks. The non-
reconflgurable buses do not require the complex system software associated
vlth the uuumgement of the reconflgurable mesh I/O networks. A direct
approach to reducing the cost of the validation effort would then be to
eliminate the I/O mesh network option from further consideration. This
decision could be reviewed after function migration capability is
incorporated in the system services and demonstrated.
234

The AIPS system specification contained overall performance goals. Early
in the IAPSA II design effort, performance calculations based on the original
AIPS performance goals were used to select viable candidate architectures.
Calculations for the selected candidate indicated that, while acceptable,
throughput might be close to the 100% growth factor constraint in part of the
system. Similarly, the early evaluation of heavy I/O workload focused on the
satisfactory ability of the bus to handle the transmitted I/O messages.
Later, however, our more detailed simulation models showed that, even with
operating speeds near the hardware limits, the system could not meet the
growth requirements in either throughput or I/O activity. This points out
that performance goals are only meaningful if they are used to derive
performance requirements for the system elements. If the performance
characteristics of the system components are carefully controlled via
performance specifications, then achievement of system goals can be
guaranteed.
It iS clear that the KIPS performance goals were not used to derive lower
level performance requirements. There are several reasons for the
traditional reluctance to specify firm performance requirements early in the
design cycle. First, there are usually design feasibility concerns until
prototype hardware and software can be developed. Certain component
performance levels may not be achievable without excessive development effort
and expense. In software, certain critical sections commonly dominate
performance. Software performance improvement efforts usually proceed only
after these critical sections are identified through prototype efforts.
Additionally, there are natural concerns about overspecification. An
overall performance requirement is often known but several satisfactory
design alternatives may exist, each with different component performance
allocations. One alternative might result in a more expensive system because
of the difficulty in meeting the requirement levied on one or more
components. An alternative that relaxes the requirement on that component
while stressing others might be cheaper. It should be noted that the
prevalidatton methodology addresses this concern by promoting the evaluation
of alternative designs with different component performance allocations.
Early modeling can quantify the level of performance needed by each component
235

in each alternative configuration, which satisfies the overall system
requirements.
In conclusion, during the 4 years of the contract, five technical papers
were presented to various organizations (IEEE, AIAA, AGARD) on the IAPSA II
results. Additionally, a patent is pending on a reliability model generator
that produces reliability models from block diagrams of an architecture. The
major benefits to industry from the execution of this contract will be the
prevalidation methodology and supporting tools_ advanced vehicle management
systems (VMS) founded on the results obtained evaluating the integrated
flight/propulsion control system architecture, which is based on CSDL's AIPS;
and the NASA concept of "design for validation." The contract has redirected
IR&D activities within The Boeing Company. Because of the problems
associated with some major aircraft activities within the industry, Boeing
management has become aware of the need for a systems approach for both
"flight controls and avionics technology. The IAPSA II prevalidation
methodology attempts to satisfy these deficiencies.
236

REFERENCES
. N. E. Gowin, Stability and Control Data for Boeing Model 908-833,
Boeing document D180-28759-I, March 1985.
. S. J. Bavuso, P.L. Petersen, and D. M. Rose, CARE III Model Overview
and User's Guide, NASA TM 85810, June 1984.
. R. W. Butler, The Semi-Markov Unreliability Range Evaluator (SURE)
Program, NASA TM 86261, July 1984.
o J. B. Dugan, K. S. Trivedi, M. K. Smotherman, and R. M. Geist, The
Hybrid Automated Reliability Predictor, Journal of Guidance, Control
and Dynamics, vol. 9, No. 3, May-June 1986.
, G. C. Cohen, et al_, DesIEn/Validatlon Concept for the Integrated
Airframe/Propulsion Control System Architecture, NASA CR-178084, June
1986.
o J. D. Blight, A. A. Nadkarni, and T. M. Richardson, Optimal ControLaw
for Relaxed Static Stability Aircraft---Full Digital Design, Boeing
document D6-52096-1TN, March 1984.
. A. Chakravarty, Engineering Description of the 4-D Optimal Algorithm,
Boeing document D6-52209TN, March 1984.
o AIPS System Requirements, C. S. Draper Laboratory, CSDL-AIPS-83-50,
August 1983.
9, G. C. Cohen, et al., Design of an Integrated Airframe�Propulsion
Control System Architecture, NASA CR-182004, March 1990.
10. J. C. De Laat, and W. C. Merrill, A Real-Time Implementation of an
Advanced Sensor Failure Detection, Isolation, and Accommodation
Algorithm, NASA TM 83553, January 1984.
237

_S (Continued)
11. M. J. Strickland, and D. L. Palumbo,
Performance Modeling, Aircraft Design,
Conference, AIAA-88-4409, September 1988.
Fault Tolerant System
Systems and Operations
12. M. Livny, DENET User's Guide, University of Wisconsin Computer
Sciences Department, July 1987.
13. Fault Tolerant Electrical Power System, Phase II: Analysis and
Preliminary Design, AFWAL-TR-86-2084, Boeing Military Airplane
Company, December 1986.
14. R. S. Schabowsky, Jr., et al., Evaluation Methodologies for an
Advanced Information Processing System, CSDL-PrI945, August 1984.
15. G. C. Cohen, et al., IAPSA II Small-Scale System Specification, NASA
NASA CR-182006, March 1990.
238


NtESA Report Documentation Page
I. Report No.
NASA CR-182007
2. Government Accessa_n No.
4, Title and Subtitle
FINAL REPORT: Design of an Integrated Airframe/
Propulsion Control System Architecture
7. Author(s)
Gerald C. Cohen
C. William Lee
Michael J. Strickland
Thomas C. Torkelson
g. Porformmg Organ,zation Name and Addreu
Boeing Advanced Systems
P.O. Box 3707, M/S 33-12
Seattle, WA 98124-2207
12. S_ns_rmg Agency Name e_ Addte_
NASA Langley Research Center
Hampton, VA 23665-5225
3. Rec¢,ent's C.ar_t_ No.
5. Report Date
March 1990
6. Pedorming Organization Code
8. Performing Organization Report No.
10. Work Unit No.
505-66-71-02
!1. Contract or Grant No.
NASI-18099
13. Type ol Reporl ana P_od Covered
Contractor Report
14. Sponsor,ng A_Incy Code
15. Supoiementary Notes
Langley Technical Monitor: Daniel L. Palumbo
16. Absuac!
This report describes the design of an integrated airframe/propulsion control
s3_tem architecture. The design is based on a prevalidation methodology that
uses both reliability and performance. The report gives a detail account of
the testing associated with a subset of the architecture and concludes with
general observations of applying the methodology to the architecture using
Charles Stark Draper Laboratories Advanced Information Processing System.
17. Key Words lSuggeltKl by Author|Ill
flight critical architecture redundancy
techniques, integrated flight/propulsion
control, ASSIST, SURE, DENET, AIPS,
small scale system
19. Security Classd. Iof Ihi$ fel_3fll
UNCI,_ST FXED
20. Secur,w ClaLul. Iof tins pagel
UNCLASSIFIED
18. Distribul/on Stotement
Subject Category 66
21. No. of _ges 22. Pt_e
255
NASA FORM lfl,26 OCT 16


W
0
OmO_Omm_o0_
C_Z_m_ Om
m _OZ m_
_Z _mOm_ _Z_
Z_
r_ _ _
_I 0 H-
m _LOOr C _
4,
0
E
0
0
o
0
_<_Z_
_ _m<_00_0 Z_
_ZO_
Z_IIIIIIIIIIIIIIII
_EZ_Z_ZO_
0 m _0
00 0
S
OOZ_O_m_
_Z Ocmmo
OK_FZ _0
IIHIIIIIIIIIIII_
_CZ Z _0
O_ 0
_mcm_ XZOm_
I/ II II _ l# II II
_mOZE_ZCZOOZm
m