Embed Size (px)
DESCRIPTION
Qatar Oil and Gas
Citation preview
Q4 2013www.businessmonitor.com
QATAROIL & GAS REPORTINCLUDES 10-YEAR FORECASTS TO 2022
ISSN 1748-4189Published by:Business Monitor International
Qatar Oil & Gas Report Q4 2013INCLUDES 10-YEAR FORECASTS TO 2022
Part of BMI’s Industry Report & Forecasts Series
Published by: Business Monitor International
Copy deadline: August 2013
Business Monitor InternationalSenator House85 Queen Victoria StreetLondonEC4V 4ABUnited KingdomTel: +44 (0) 20 7248 0468Fax: +44 (0) 20 7248 0467Email: [email protected]: http://www.businessmonitor.com
© 2013 Business Monitor InternationalAll rights reserved.
All information contained in this publication iscopyrighted in the name of Business MonitorInternational, and as such no part of thispublication may be reproduced, repackaged,redistributed, resold in whole or in any part, or usedin any form or by any means graphic, electronic ormechanical, including photocopying, recording,taping, or by information storage or retrieval, or byany other means, without the express written consentof the publisher.
DISCLAIMERAll information contained in this publication has been researched and compiled from sources believed to be accurate and reliable at the time ofpublishing. However, in view of the natural scope for human and/or mechanical error, either at source or during production, Business MonitorInternational accepts no liability whatsoever for any loss or damage resulting from errors, inaccuracies or omissions affecting any part of thepublication. All information is provided without warranty, and Business Monitor International makes no representation of warranty of any kind asto the accuracy or completeness of any information hereto contained.
CONTENTS
BMI Industry View ............................................................................................................... 7
SWOT .................................................................................................................................... 9
Industry Forecast .............................................................................................................. 10Oil And Gas Reserves ............................................................................................................................. 10
Table: Qatar Proven Oil & Gas Reserves And Total Petroleum Data, 2011-2016 . . . . . . . . . . . . . . . . . . . . . . . . . . . . . . . . . . . . . . . . . . . . . . . . . . . . . . . . . . . . . . . . . . . . 10
Table: Qatar Proven Oil & Gas Reserves And Total Petroleum Data, 2017-2022 . . . . . . . . . . . . . . . . . . . . . . . . . . . . . . . . . . . . . . . . . . . . . . . . . . . . . . . . . . . . . . . . . . . . 11
Oil Supply And Demand .......................................................................................................................... 13Table: Qatar Oil Production, Consumption And Net Exports . . . . . . . . . . . . . . . . . . . . . . . . . . . . . . . . . . . . . . . . . . . . . . . . . . . . . . . . . . . . . . . . . . . . . . . . . . . . . . . . . . . . . . . . . . 13
Table: Qatar Oil Production, Consumption And Net Exports . . . . . . . . . . . . . . . . . . . . . . . . . . . . . . . . . . . . . . . . . . . . . . . . . . . . . . . . . . . . . . . . . . . . . . . . . . . . . . . . . . . . . . . . . . 13
Gas Supply And Demand ......................................................................................................................... 16Table: Qatar Gas Production, Consumption And Net Exports . . . . . . . . . . . . . . . . . . . . . . . . . . . . . . . . . . . . . . . . . . . . . . . . . . . . . . . . . . . . . . . . . . . . . . . . . . . . . . . . . . . . . . . . . 16
Table: Qatar Gas Production, Consumption And Net Exports . . . . . . . . . . . . . . . . . . . . . . . . . . . . . . . . . . . . . . . . . . . . . . . . . . . . . . . . . . . . . . . . . . . . . . . . . . . . . . . . . . . . . . . . . 17
LNG .................................................................................................................................................... 22Table: Qatar LNG Infrastructure . . . . . . . . . . . . . . . . . . . . . . . . . . . . . . . . . . . . . . . . . . . . . . . . . . . . . . . . . . . . . . . . . . . . . . . . . . . . . . . . . . . . . . . . . . . . . . . . . . . . . . . . . . . . . . . . . . . . . . . 23
Refining And Oil Products Trade .............................................................................................................. 25Table: Qatar Refining - Production And Consumption, 2011-2016 . . . . . . . . . . . . . . . . . . . . . . . . . . . . . . . . . . . . . . . . . . . . . . . . . . . . . . . . . . . . . . . . . . . . . . . . . . . . . . . . . . . . 25
Table: Qatar Refining - Production And Consumption . . . . . . . . . . . . . . . . . . . . . . . . . . . . . . . . . . . . . . . . . . . . . . . . . . . . . . . . . . . . . . . . . . . . . . . . . . . . . . . . . . . . . . . . . . . . . . . . . 26
Revenues/Import Costs ............................................................................................................................ 27
Key Risks To BMI's Forecast Scenario ....................................................................................................... 27
Industry Risk Reward Ratings .......................................................................................... 29Middle East - Risk/Reward Ratings ............................................................................................................. 29
Table: BMI's Middle East Oil & Gas Risk/Reward Ratings . . . . . . . . . . . . . . . . . . . . . . . . . . . . . . . . . . . . . . . . . . . . . . . . . . . . . . . . . . . . . . . . . . . . . . . . . . . . . . . . . . . . . . . . . . . . 30
Table: Middle East Upstream Oil & Gas Risk/Reward Rating . . . . . . . . . . . . . . . . . . . . . . . . . . . . . . . . . . . . . . . . . . . . . . . . . . . . . . . . . . . . . . . . . . . . . . . . . . . . . . . . . . . . . . . . 32
Table: Middle East Downstream Oil & Gas Risk/Reward Rating . . . . . . . . . . . . . . . . . . . . . . . . . . . . . . . . . . . . . . . . . . . . . . . . . . . . . . . . . . . . . . . . . . . . . . . . . . . . . . . . . . . . . . 34
Qatar - Risk/Reward Ratings ..................................................................................................................... 36
Market Overview ............................................................................................................... 38Qatar Energy Market Overview .................................................................................................................. 38
Overview/State Role ............................................................................................................................... 40
Licensing And Regulation ........................................................................................................................ 40
Government Policy ................................................................................................................................. 40
International Energy Relations ................................................................................................................. 41Table: Qatar - Major Upstream Projects . . . . . . . . . . . . . . . . . . . . . . . . . . . . . . . . . . . . . . . . . . . . . . . . . . . . . . . . . . . . . . . . . . . . . . . . . . . . . . . . . . . . . . . . . . . . . . . . . . . . . . . . . . . . . . . 43
Oil And Gas Infrastructure ........................................................................................................................ 43
Oil Refineries ........................................................................................................................................ 43Table: Refineries In Qatar . . . . . . . . . . . . . . . . . . . . . . . . . . . . . . . . . . . . . . . . . . . . . . . . . . . . . . . . . . . . . . . . . . . . . . . . . . . . . . . . . . . . . . . . . . . . . . . . . . . . . . . . . . . . . . . . . . . . . . . . . . . . . 43
Table: GTL Plants In Qatar . . . . . . . . . . . . . . . . . . . . . . . . . . . . . . . . . . . . . . . . . . . . . . . . . . . . . . . . . . . . . . . . . . . . . . . . . . . . . . . . . . . . . . . . . . . . . . . . . . . . . . . . . . . . . . . . . . . . . . . . . . . . 45
LNG Terminals ...................................................................................................................................... 46Table: LNG Terminals In Qatar . . . . . . . . . . . . . . . . . . . . . . . . . . . . . . . . . . . . . . . . . . . . . . . . . . . . . . . . . . . . . . . . . . . . . . . . . . . . . . . . . . . . . . . . . . . . . . . . . . . . . . . . . . . . . . . . . . . . . . . . 46
Qatar Oil & Gas Report Q4 2013
© Business Monitor International Page 4
Gas Pipelines ........................................................................................................................................ 48
Competitive Landscape .................................................................................................... 50Executive Summary .................................................................................................................................. 50
Table: Key Domestic And Foreign Companies In The Qatari Oil And Gas Sector . . . . . . . . . . . . . . . . . . . . . . . . . . . . . . . . . . . . . . . . . . . . . . . . . . . . . . . . . . . . . . . . . . . 51
Table: Key Upstream Players . . . . . . . . . . . . . . . . . . . . . . . . . . . . . . . . . . . . . . . . . . . . . . . . . . . . . . . . . . . . . . . . . . . . . . . . . . . . . . . . . . . . . . . . . . . . . . . . . . . . . . . . . . . . . . . . . . . . . . . . . . 51
Table: Key Downstream Player . . . . . . . . . . . . . . . . . . . . . . . . . . . . . . . . . . . . . . . . . . . . . . . . . . . . . . . . . . . . . . . . . . . . . . . . . . . . . . . . . . . . . . . . . . . . . . . . . . . . . . . . . . . . . . . . . . . . . . . . 51
Company Profile ................................................................................................................ 52Qatar Petroleum ..................................................................................................................................... 52
ExxonMobil Oil Qatar .............................................................................................................................. 57
Total Qatar ............................................................................................................................................ 60
Royal Dutch Shell .................................................................................................................................... 63
Other Companies - Summary ..................................................................................................................... 66
Regional Overview ............................................................................................................ 72Middle East Energy Market Overview ......................................................................................................... 72
Consuming It All .................................................................................................................................... 80
Gas Rises, But Consumption Does Too ....................................................................................................... 82
Global Industry Overview .................................................................................................. 89Global Energy Market Overview ................................................................................................................ 89
Table: Global Oil Consumption Estimates, mn b/d . . . . . . . . . . . . . . . . . . . . . . . . . . . . . . . . . . . . . . . . . . . . . . . . . . . . . . . . . . . . . . . . . . . . . . . . . . . . . . . . . . . . . . . . . . . . . . . . . . . . . 93
Appendix ............................................................................................................................ 95Middle East - Regional Appendix ................................................................................................................ 95
Table: Oil Consumption - Historical Data & Forecasts, 2011-2018 ('000b/d) . . . . . . . . . . . . . . . . . . . . . . . . . . . . . . . . . . . . . . . . . . . . . . . . . . . . . . . . . . . . . . . . . . . . . . . 95
Table: Oil Consumption - Long-Term Forecasts, 2015-2022 ('000b/d) . . . . . . . . . . . . . . . . . . . . . . . . . . . . . . . . . . . . . . . . . . . . . . . . . . . . . . . . . . . . . . . . . . . . . . . . . . . . . . . 95
Table: Oil Production - Historical Data & Forecasts, 2011-2018 ('000b/d) . . . . . . . . . . . . . . . . . . . . . . . . . . . . . . . . . . . . . . . . . . . . . . . . . . . . . . . . . . . . . . . . . . . . . . . . . . 96
Table: Oil Production - Long-Term Forecasts, 2015-2022 ('000b/d) . . . . . . . . . . . . . . . . . . . . . . . . . . . . . . . . . . . . . . . . . . . . . . . . . . . . . . . . . . . . . . . . . . . . . . . . . . . . . . . . . 97
Table: Refining Capacity - Historical Data & Forecasts, 2011-2018 ('000b/d) . . . . . . . . . . . . . . . . . . . . . . . . . . . . . . . . . . . . . . . . . . . . . . . . . . . . . . . . . . . . . . . . . . . . . . 97
Table: Refining Capacity - Long-Term Forecasts, 2015-2022 ('000b/d) . . . . . . . . . . . . . . . . . . . . . . . . . . . . . . . . . . . . . . . . . . . . . . . . . . . . . . . . . . . . . . . . . . . . . . . . . . . . . . 98
Table: Gas Consumption - Historical Data & Forecasts, 2011-2018 (bcm) . . . . . . . . . . . . . . . . . . . . . . . . . . . . . . . . . . . . . . . . . . . . . . . . . . . . . . . . . . . . . . . . . . . . . . . . . . 98
Table: Gas Consumption, 2015-2022 (bcm) . . . . . . . . . . . . . . . . . . . . . . . . . . . . . . . . . . . . . . . . . . . . . . . . . . . . . . . . . . . . . . . . . . . . . . . . . . . . . . . . . . . . . . . . . . . . . . . . . . . . . . . . . . . 99
Table: Gas Production - Historical Data & Forecasts, 2011-2018 (bcm) . . . . . . . . . . . . . . . . . . . . . . . . . . . . . . . . . . . . . . . . . . . . . . . . . . . . . . . . . . . . . . . . . . . . . . . . . . . . . 99
Table: Gas Production - Long-Term Forecasts, 2015-2022 (bcm) . . . . . . . . . . . . . . . . . . . . . . . . . . . . . . . . . . . . . . . . . . . . . . . . . . . . . . . . . . . . . . . . . . . . . . . . . . . . . . . . . . . 100
Table: Net LNG Exports - Historical Data & Forecasts, 2011-2018 (bcm) . . . . . . . . . . . . . . . . . . . . . . . . . . . . . . . . . . . . . . . . . . . . . . . . . . . . . . . . . . . . . . . . . . . . . . . . . . 101
Table: Net LNG Exports - Long-Term Forecasts, 2015-2022 (bcm) . . . . . . . . . . . . . . . . . . . . . . . . . . . . . . . . . . . . . . . . . . . . . . . . . . . . . . . . . . . . . . . . . . . . . . . . . . . . . . . . . 101
Methodology .................................................................................................................... 102Oil & Gas Risk/Reward Ratings Methodology ........................................................................................... 102
Ratings Overview ................................................................................................................................. 102Table: BMI's Oil & Gas Risk Reward Ratings - Structure . . . . . . . . . . . . . . . . . . . . . . . . . . . . . . . . . . . . . . . . . . . . . . . . . . . . . . . . . . . . . . . . . . . . . . . . . . . . . . . . . . . . . . . . . . . . 103
Indicators ........................................................................................................................................... 103Table: BMI's Oil & Gas Business Environment Upstream Ratings - Methodology . . . . . . . . . . . . . . . . . . . . . . . . . . . . . . . . . . . . . . . . . . . . . . . . . . . . . . . . . . . . . . . . . . . 104
Oil & Gas Forecasts Methodology .......................................................................................................... 105
Energy Industry ................................................................................................................................... 106
Cross checks ....................................................................................................................................... 106
Qatar Oil & Gas Report Q4 2013
© Business Monitor International Page 5

Sources .............................................................................................................................................. 107
Qatar Oil & Gas Report Q4 2013
© Business Monitor International Page 6
BMI Industry View
BMI View: Fuelled by the world's third largest proven gas reserves, Qatar has dramatically expanded
export capacity to become the largest supplier of liquefied natural gas (LNG) globally. Rising competition,
led for now by Australia but also from East Africa and North America, will pose a challenge to Qatar's hold
on the global gas market later in the decade. Qatar is responding by making increasing efforts to protect its
revenue stream by expanding its downstream network, including additional investments in gas-to-liquids, as
well as expanding the international presence of the national oil company to offset what will likely be slow
growth in domestic oil and gas revenues given the absence of plans for an expansion of LNG export
capacity.
We highlight the following trends and developments in Qatar's oil and gas sector:
■ We expect Qatari gas production to reach nearly 180bn cubic metres (bcm) by the end of our forecastperiod in 2022; however, we expect output growth to slow compared to the gains seen in recent years.The Barzan gas project, due online from 2015, is the last major approved expansion of upstream capacitywith a self-imposed moratorium on further development of the giant North Field as the country evaluatesits oil and gas strategy.
■ There is some upside to this outlook, with an active effort to boost foreign exploration of Qatar's onshoreand offshore acreage. The recent discovery offshore Block 4 - the first new find in 42 years - hints atQatar's untapped potential. Exploration success could support future productions, but with consumptionrising and no plans to expand export capacity, any additional supplies look likely to fuel the domesticmarket. Indeed, natural gas consumption is set to rise from an estimated 32bcm in 2012 to nearly 60bcmby 2022.
■ We see Qatari proven oil and natural gas reserves declining modestly over the forecast period, with a1.9% decline in natural gas reserves expected between 2013 and 2021. Oil reserves are also due todecline gradually, but actual liquids production should grow slowly over the forecast period, namely onthe back of increased recovery operations and field redevelopment alongside growing condensate andnatural gas liquids (NGL) volumes. Plans are underway to increase production capacity from 950,000barrels per day (b/d) to 1.2mn b/d. Already OPEC's smallest oil producer, we expect growth gains inliquids production to slow toward the tail-end of our forecast period.
■ Export capacity is also set to hold steady, with no plans to increase liquefied natural gas (LNG) capacitybehind the current 77mn tonnes per annum (or around 107bcm mark) reached in 2011. However weexpect that overall LNG export levels will remain elevated, with growing demand led by Asia. Qatar isincreasingly expanding the reach of its exports, with Brazil and Argentina for example receiving LNG.According to Qatari officials, any addition to LNG send-out capacity will come from efficiency gainsrather than new trains. There is some upside to pipeline exports supplies, with proposals to add additionalcompression facility to the Dolphin Pipeline which would allow for supplies closer to full designcapacity. Growing demand in the GCC markets would support expansion, but a key sticking point will beprice with gas currently sold at a significant discount.
■ While Qatar has proven resistant to calls to rethink its oil-indexed LNG pricing mechanism, importingcountries are becoming more vocal in the de-linking of gas and crude in a bid to lower prices. With newsupplies of gas from Australia, Russia, East Africa, and North America due to come online, Qatar'sability to resist reform on pricing may be soon be under strain.
Qatar Oil & Gas Report Q4 2013
© Business Monitor International Page 7
Qatar's dependence on oil leads to high volatility in the country's export revenues. Our assumptions of
slower growth in China and persistent economic weakness in the eurozone, pose a threat to global oil
demand. At the time of writing, we are forecasting average OPEC basket oil prices to fall from US$109/bbl
in 2013 to US$101/bbl in 2014. While lower prices will result in less revenue after years of elevated prices,
large fiscal and current account surpluses, as well as a sizable foreign exchange (FX) reserves, provide the
economy with a significant buffer in the event of any short-term decline in oil prices.
Qatar Oil & Gas Report Q4 2013
© Business Monitor International Page 8
SWOT
SWOT Analysis
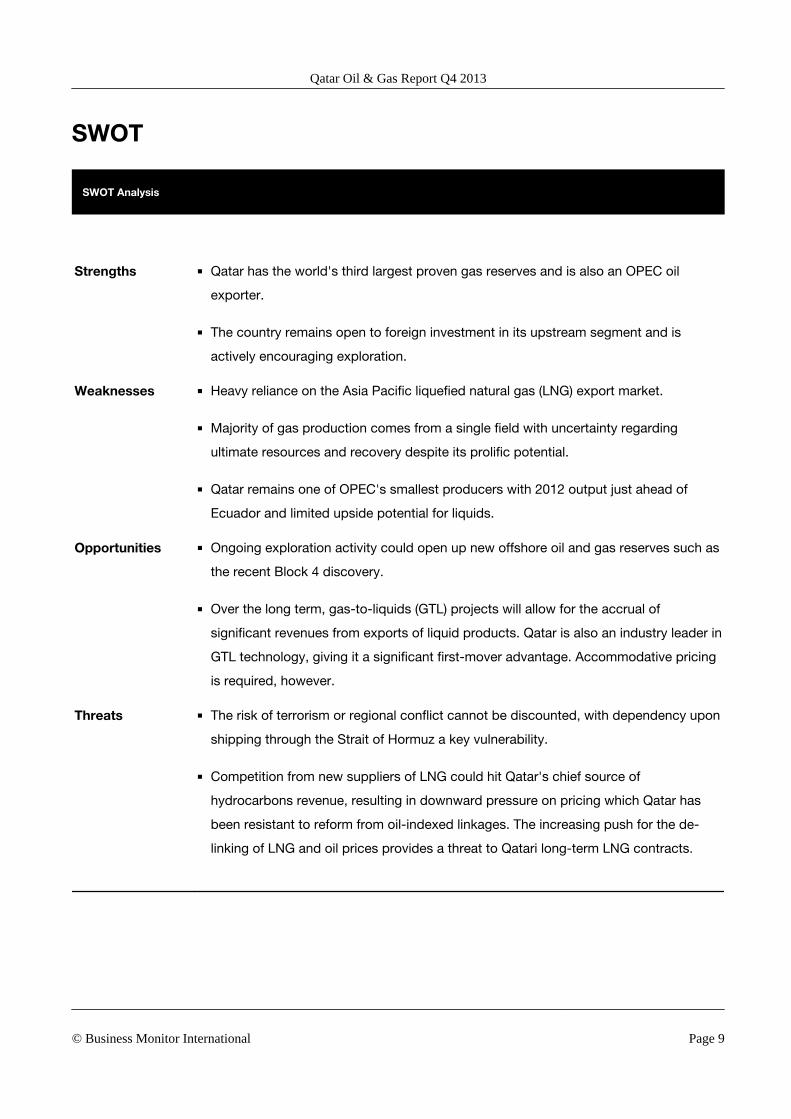
Strengths ■ Qatar has the world's third largest proven gas reserves and is also an OPEC oil
exporter.
■ The country remains open to foreign investment in its upstream segment and is
actively encouraging exploration.
Weaknesses ■ Heavy reliance on the Asia Pacific liquefied natural gas (LNG) export market.
■ Majority of gas production comes from a single field with uncertainty regarding
ultimate resources and recovery despite its prolific potential.
■ Qatar remains one of OPEC's smallest producers with 2012 output just ahead of
Ecuador and limited upside potential for liquids.
Opportunities ■ Ongoing exploration activity could open up new offshore oil and gas reserves such as
the recent Block 4 discovery.
■ Over the long term, gas-to-liquids (GTL) projects will allow for the accrual of
significant revenues from exports of liquid products. Qatar is also an industry leader in
GTL technology, giving it a significant first-mover advantage. Accommodative pricing
is required, however.
Threats ■ The risk of terrorism or regional conflict cannot be discounted, with dependency upon
shipping through the Strait of Hormuz a key vulnerability.
■ Competition from new suppliers of LNG could hit Qatar's chief source of
hydrocarbons revenue, resulting in downward pressure on pricing which Qatar has
been resistant to reform from oil-indexed linkages. The increasing push for the de-
linking of LNG and oil prices provides a threat to Qatari long-term LNG contracts.
Qatar Oil & Gas Report Q4 2013
© Business Monitor International Page 9
Industry Forecast
Oil And Gas Reserves
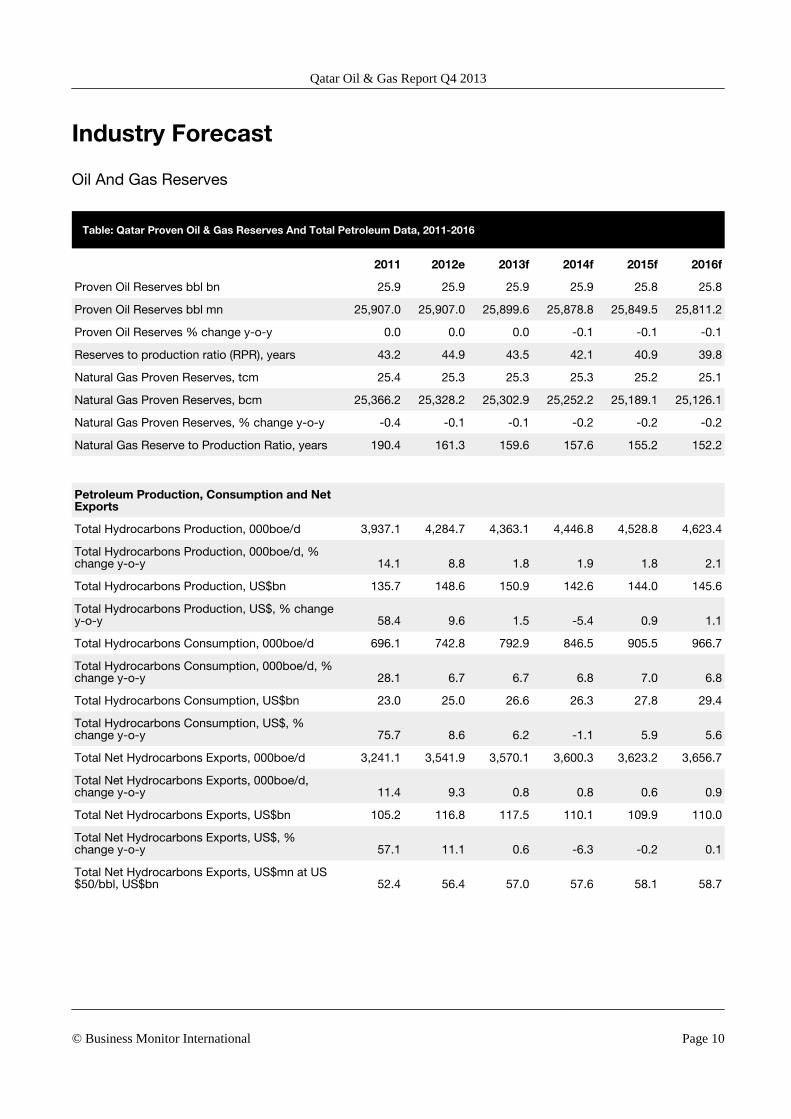
Table: Qatar Proven Oil & Gas Reserves And Total Petroleum Data, 2011-2016
2011 2012e 2013f 2014f 2015f 2016f
Proven Oil Reserves bbl bn 25.9 25.9 25.9 25.9 25.8 25.8
Proven Oil Reserves bbl mn 25,907.0 25,907.0 25,899.6 25,878.8 25,849.5 25,811.2
Proven Oil Reserves % change y-o-y 0.0 0.0 0.0 -0.1 -0.1 -0.1
Reserves to production ratio (RPR), years 43.2 44.9 43.5 42.1 40.9 39.8
Natural Gas Proven Reserves, tcm 25.4 25.3 25.3 25.3 25.2 25.1
Natural Gas Proven Reserves, bcm 25,366.2 25,328.2 25,302.9 25,252.2 25,189.1 25,126.1
Natural Gas Proven Reserves, % change y-o-y -0.4 -0.1 -0.1 -0.2 -0.2 -0.2
Natural Gas Reserve to Production Ratio, years 190.4 161.3 159.6 157.6 155.2 152.2
Petroleum Production, Consumption and NetExports
Total Hydrocarbons Production, 000boe/d 3,937.1 4,284.7 4,363.1 4,446.8 4,528.8 4,623.4
Total Hydrocarbons Production, 000boe/d, %change y-o-y 14.1 8.8 1.8 1.9 1.8 2.1
Total Hydrocarbons Production, US$bn 135.7 148.6 150.9 142.6 144.0 145.6
Total Hydrocarbons Production, US$, % changey-o-y 58.4 9.6 1.5 -5.4 0.9 1.1
Total Hydrocarbons Consumption, 000boe/d 696.1 742.8 792.9 846.5 905.5 966.7
Total Hydrocarbons Consumption, 000boe/d, %change y-o-y 28.1 6.7 6.7 6.8 7.0 6.8
Total Hydrocarbons Consumption, US$bn 23.0 25.0 26.6 26.3 27.8 29.4
Total Hydrocarbons Consumption, US$, %change y-o-y 75.7 8.6 6.2 -1.1 5.9 5.6
Total Net Hydrocarbons Exports, 000boe/d 3,241.1 3,541.9 3,570.1 3,600.3 3,623.2 3,656.7
Total Net Hydrocarbons Exports, 000boe/d,change y-o-y 11.4 9.3 0.8 0.8 0.6 0.9
Total Net Hydrocarbons Exports, US$bn 105.2 116.8 117.5 110.1 109.9 110.0
Total Net Hydrocarbons Exports, US$, %change y-o-y 57.1 11.1 0.6 -6.3 -0.2 0.1
Total Net Hydrocarbons Exports, US$mn at US$50/bbl, US$bn 52.4 56.4 57.0 57.6 58.1 58.7
Qatar Oil & Gas Report Q4 2013
© Business Monitor International Page 10
Qatar Proven Oil & Gas Reserves And Total Petroleum Data, 2011-2016 - Continued
2011 2012e 2013f 2014f 2015f 2016f
Total Net Hydrocarbons Exports, US$mn at US$100/bbl, US$bn 104.7 112.9 114.0 115.2 116.1 117.3
e/f = estimate/forecast. Source: EIA, BMI
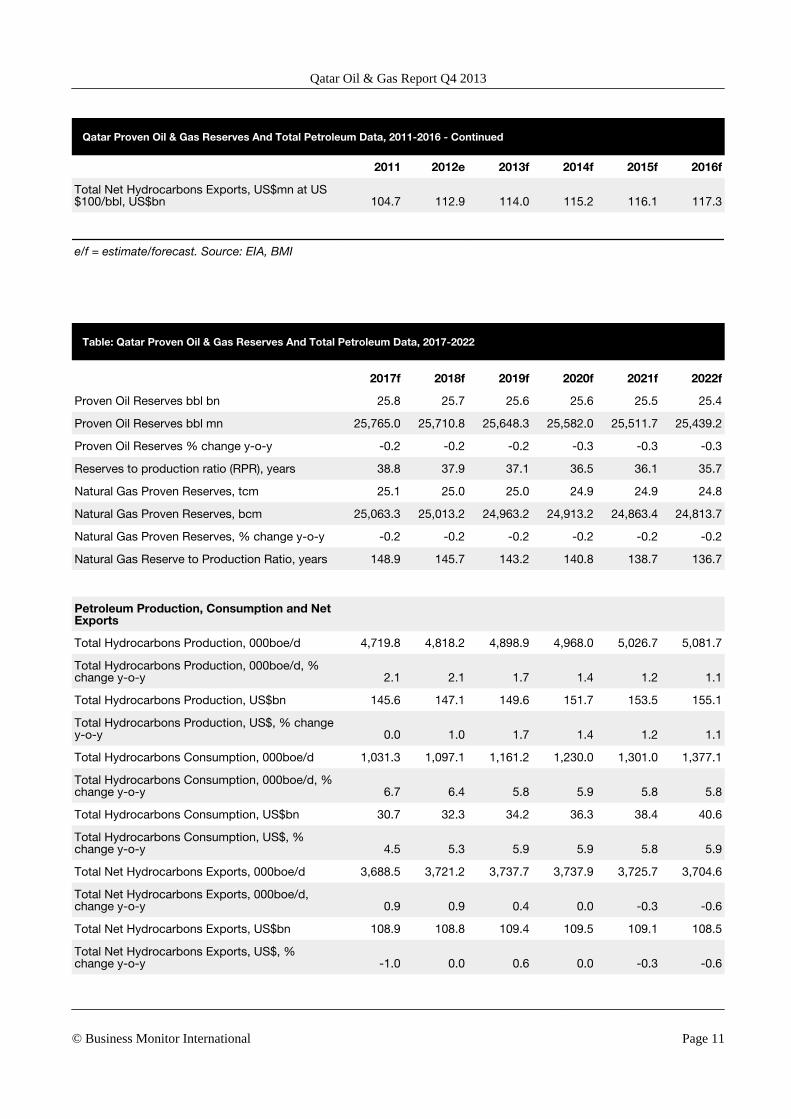
Table: Qatar Proven Oil & Gas Reserves And Total Petroleum Data, 2017-2022
2017f 2018f 2019f 2020f 2021f 2022f
Proven Oil Reserves bbl bn 25.8 25.7 25.6 25.6 25.5 25.4
Proven Oil Reserves bbl mn 25,765.0 25,710.8 25,648.3 25,582.0 25,511.7 25,439.2
Proven Oil Reserves % change y-o-y -0.2 -0.2 -0.2 -0.3 -0.3 -0.3
Reserves to production ratio (RPR), years 38.8 37.9 37.1 36.5 36.1 35.7
Natural Gas Proven Reserves, tcm 25.1 25.0 25.0 24.9 24.9 24.8
Natural Gas Proven Reserves, bcm 25,063.3 25,013.2 24,963.2 24,913.2 24,863.4 24,813.7
Natural Gas Proven Reserves, % change y-o-y -0.2 -0.2 -0.2 -0.2 -0.2 -0.2
Natural Gas Reserve to Production Ratio, years 148.9 145.7 143.2 140.8 138.7 136.7
Petroleum Production, Consumption and NetExports
Total Hydrocarbons Production, 000boe/d 4,719.8 4,818.2 4,898.9 4,968.0 5,026.7 5,081.7
Total Hydrocarbons Production, 000boe/d, %change y-o-y 2.1 2.1 1.7 1.4 1.2 1.1
Total Hydrocarbons Production, US$bn 145.6 147.1 149.6 151.7 153.5 155.1
Total Hydrocarbons Production, US$, % changey-o-y 0.0 1.0 1.7 1.4 1.2 1.1
Total Hydrocarbons Consumption, 000boe/d 1,031.3 1,097.1 1,161.2 1,230.0 1,301.0 1,377.1
Total Hydrocarbons Consumption, 000boe/d, %change y-o-y 6.7 6.4 5.8 5.9 5.8 5.8
Total Hydrocarbons Consumption, US$bn 30.7 32.3 34.2 36.3 38.4 40.6
Total Hydrocarbons Consumption, US$, %change y-o-y 4.5 5.3 5.9 5.9 5.8 5.9
Total Net Hydrocarbons Exports, 000boe/d 3,688.5 3,721.2 3,737.7 3,737.9 3,725.7 3,704.6
Total Net Hydrocarbons Exports, 000boe/d,change y-o-y 0.9 0.9 0.4 0.0 -0.3 -0.6
Total Net Hydrocarbons Exports, US$bn 108.9 108.8 109.4 109.5 109.1 108.5
Total Net Hydrocarbons Exports, US$, %change y-o-y -1.0 0.0 0.6 0.0 -0.3 -0.6
Qatar Oil & Gas Report Q4 2013
© Business Monitor International Page 11
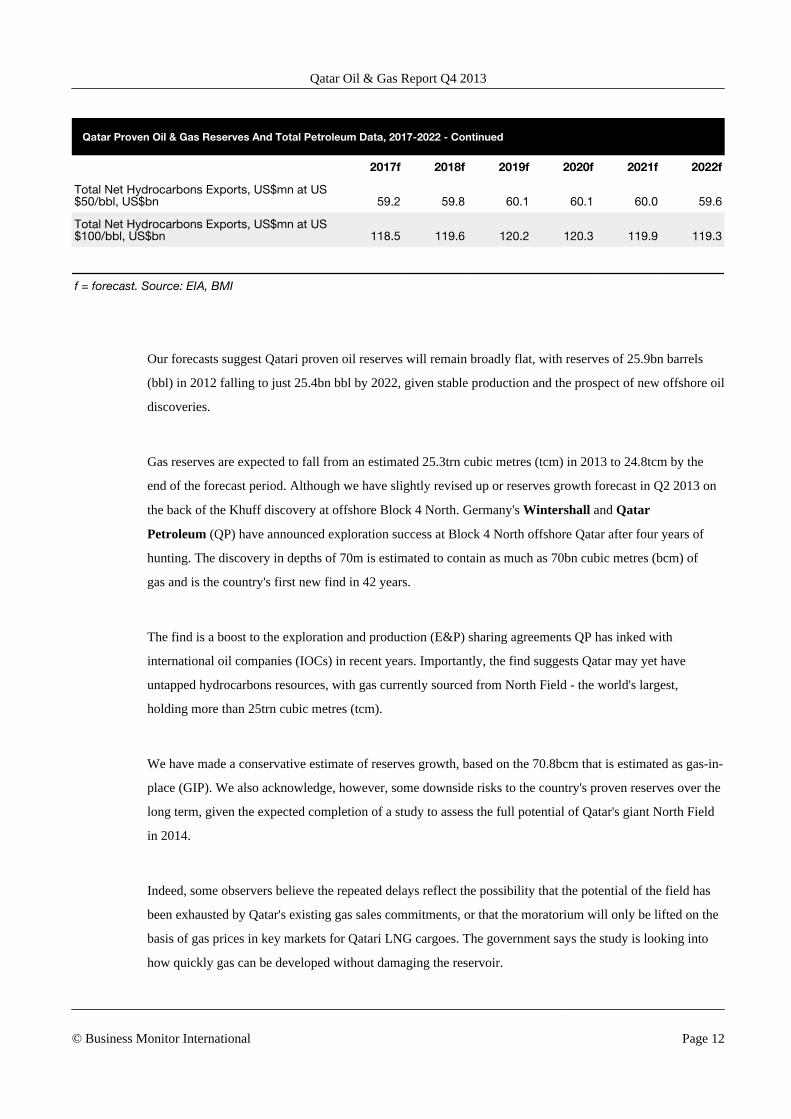
Qatar Proven Oil & Gas Reserves And Total Petroleum Data, 2017-2022 - Continued
2017f 2018f 2019f 2020f 2021f 2022f
Total Net Hydrocarbons Exports, US$mn at US$50/bbl, US$bn 59.2 59.8 60.1 60.1 60.0 59.6
Total Net Hydrocarbons Exports, US$mn at US$100/bbl, US$bn 118.5 119.6 120.2 120.3 119.9 119.3
f = forecast. Source: EIA, BMI
Our forecasts suggest Qatari proven oil reserves will remain broadly flat, with reserves of 25.9bn barrels
(bbl) in 2012 falling to just 25.4bn bbl by 2022, given stable production and the prospect of new offshore oil
discoveries.
Gas reserves are expected to fall from an estimated 25.3trn cubic metres (tcm) in 2013 to 24.8tcm by the
end of the forecast period. Although we have slightly revised up or reserves growth forecast in Q2 2013 on
the back of the Khuff discovery at offshore Block 4 North. Germany's Wintershall and Qatar
Petroleum (QP) have announced exploration success at Block 4 North offshore Qatar after four years of
hunting. The discovery in depths of 70m is estimated to contain as much as 70bn cubic metres (bcm) of
gas and is the country's first new find in 42 years.
The find is a boost to the exploration and production (E&P) sharing agreements QP has inked with
international oil companies (IOCs) in recent years. Importantly, the find suggests Qatar may yet have
untapped hydrocarbons resources, with gas currently sourced from North Field - the world's largest,
holding more than 25trn cubic metres (tcm).
We have made a conservative estimate of reserves growth, based on the 70.8bcm that is estimated as gas-in-
place (GIP). We also acknowledge, however, some downside risks to the country's proven reserves over the
long term, given the expected completion of a study to assess the full potential of Qatar's giant North Field
in 2014.
Indeed, some observers believe the repeated delays reflect the possibility that the potential of the field has
been exhausted by Qatar's existing gas sales commitments, or that the moratorium will only be lifted on the
basis of gas prices in key markets for Qatari LNG cargoes. The government says the study is looking into
how quickly gas can be developed without damaging the reservoir.
Qatar Oil & Gas Report Q4 2013
© Business Monitor International Page 12
Oil Supply And Demand
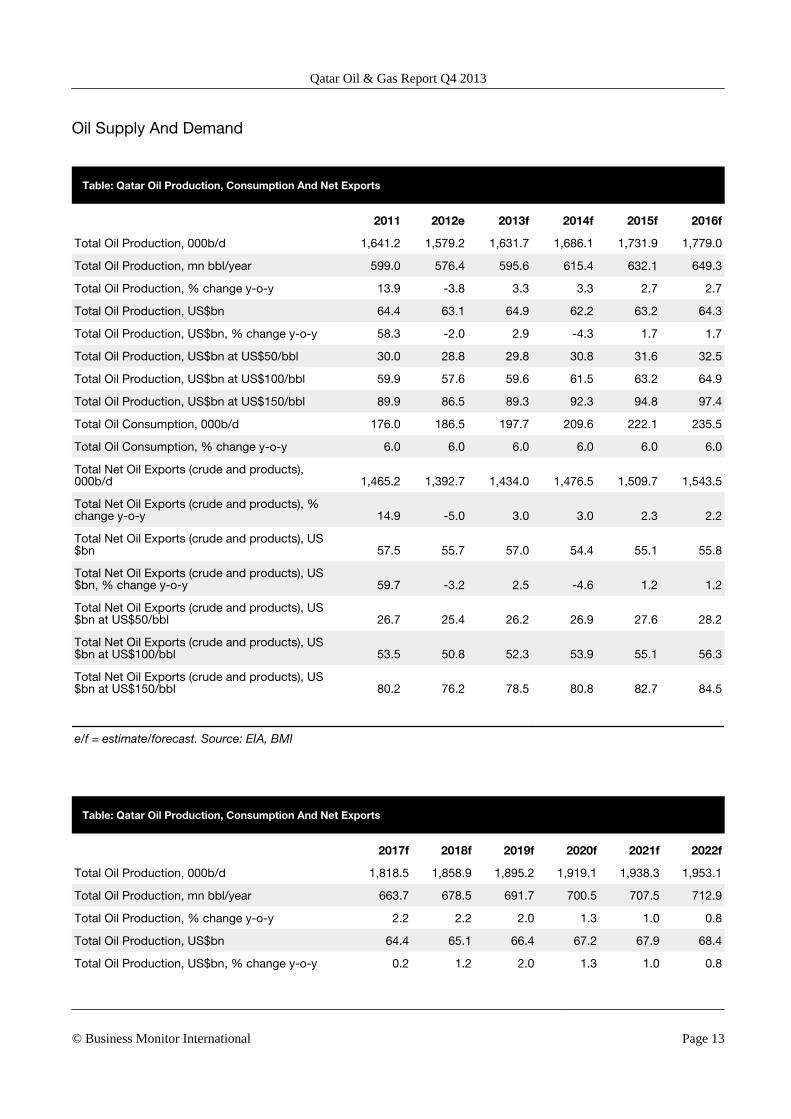
Table: Qatar Oil Production, Consumption And Net Exports
2011 2012e 2013f 2014f 2015f 2016f
Total Oil Production, 000b/d 1,641.2 1,579.2 1,631.7 1,686.1 1,731.9 1,779.0
Total Oil Production, mn bbl/year 599.0 576.4 595.6 615.4 632.1 649.3
Total Oil Production, % change y-o-y 13.9 -3.8 3.3 3.3 2.7 2.7
Total Oil Production, US$bn 64.4 63.1 64.9 62.2 63.2 64.3
Total Oil Production, US$bn, % change y-o-y 58.3 -2.0 2.9 -4.3 1.7 1.7
Total Oil Production, US$bn at US$50/bbl 30.0 28.8 29.8 30.8 31.6 32.5
Total Oil Production, US$bn at US$100/bbl 59.9 57.6 59.6 61.5 63.2 64.9
Total Oil Production, US$bn at US$150/bbl 89.9 86.5 89.3 92.3 94.8 97.4
Total Oil Consumption, 000b/d 176.0 186.5 197.7 209.6 222.1 235.5
Total Oil Consumption, % change y-o-y 6.0 6.0 6.0 6.0 6.0 6.0
Total Net Oil Exports (crude and products),000b/d 1,465.2 1,392.7 1,434.0 1,476.5 1,509.7 1,543.5
Total Net Oil Exports (crude and products), %change y-o-y 14.9 -5.0 3.0 3.0 2.3 2.2
Total Net Oil Exports (crude and products), US$bn 57.5 55.7 57.0 54.4 55.1 55.8
Total Net Oil Exports (crude and products), US$bn, % change y-o-y 59.7 -3.2 2.5 -4.6 1.2 1.2
Total Net Oil Exports (crude and products), US$bn at US$50/bbl 26.7 25.4 26.2 26.9 27.6 28.2
Total Net Oil Exports (crude and products), US$bn at US$100/bbl 53.5 50.8 52.3 53.9 55.1 56.3
Total Net Oil Exports (crude and products), US$bn at US$150/bbl 80.2 76.2 78.5 80.8 82.7 84.5
e/f = estimate/forecast. Source: EIA, BMI
Table: Qatar Oil Production, Consumption And Net Exports
2017f 2018f 2019f 2020f 2021f 2022f
Total Oil Production, 000b/d 1,818.5 1,858.9 1,895.2 1,919.1 1,938.3 1,953.1
Total Oil Production, mn bbl/year 663.7 678.5 691.7 700.5 707.5 712.9
Total Oil Production, % change y-o-y 2.2 2.2 2.0 1.3 1.0 0.8
Total Oil Production, US$bn 64.4 65.1 66.4 67.2 67.9 68.4
Total Oil Production, US$bn, % change y-o-y 0.2 1.2 2.0 1.3 1.0 0.8
Qatar Oil & Gas Report Q4 2013
© Business Monitor International Page 13
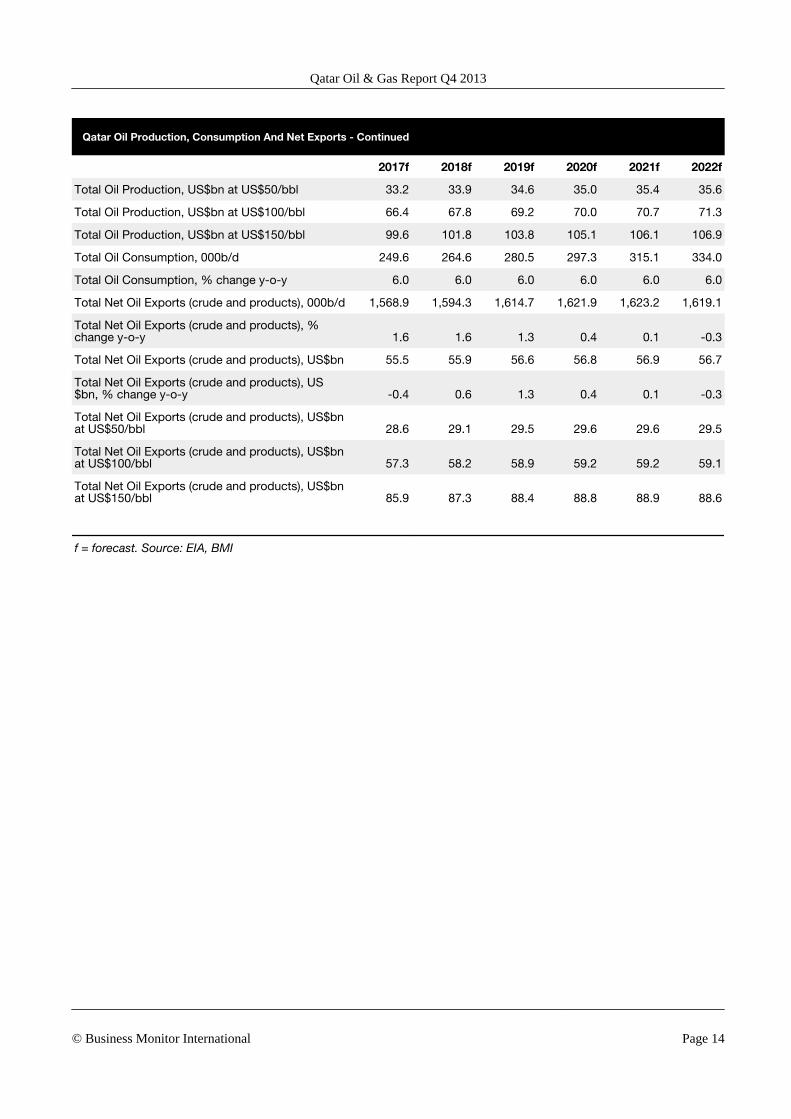
Qatar Oil Production, Consumption And Net Exports - Continued
2017f 2018f 2019f 2020f 2021f 2022f
Total Oil Production, US$bn at US$50/bbl 33.2 33.9 34.6 35.0 35.4 35.6
Total Oil Production, US$bn at US$100/bbl 66.4 67.8 69.2 70.0 70.7 71.3
Total Oil Production, US$bn at US$150/bbl 99.6 101.8 103.8 105.1 106.1 106.9
Total Oil Consumption, 000b/d 249.6 264.6 280.5 297.3 315.1 334.0
Total Oil Consumption, % change y-o-y 6.0 6.0 6.0 6.0 6.0 6.0
Total Net Oil Exports (crude and products), 000b/d 1,568.9 1,594.3 1,614.7 1,621.9 1,623.2 1,619.1
Total Net Oil Exports (crude and products), %change y-o-y 1.6 1.6 1.3 0.4 0.1 -0.3
Total Net Oil Exports (crude and products), US$bn 55.5 55.9 56.6 56.8 56.9 56.7
Total Net Oil Exports (crude and products), US$bn, % change y-o-y -0.4 0.6 1.3 0.4 0.1 -0.3
Total Net Oil Exports (crude and products), US$bnat US$50/bbl 28.6 29.1 29.5 29.6 29.6 29.5
Total Net Oil Exports (crude and products), US$bnat US$100/bbl 57.3 58.2 58.9 59.2 59.2 59.1
Total Net Oil Exports (crude and products), US$bnat US$150/bbl 85.9 87.3 88.4 88.8 88.9 88.6
f = forecast. Source: EIA, BMI
Qatar Oil & Gas Report Q4 2013
© Business Monitor International Page 14
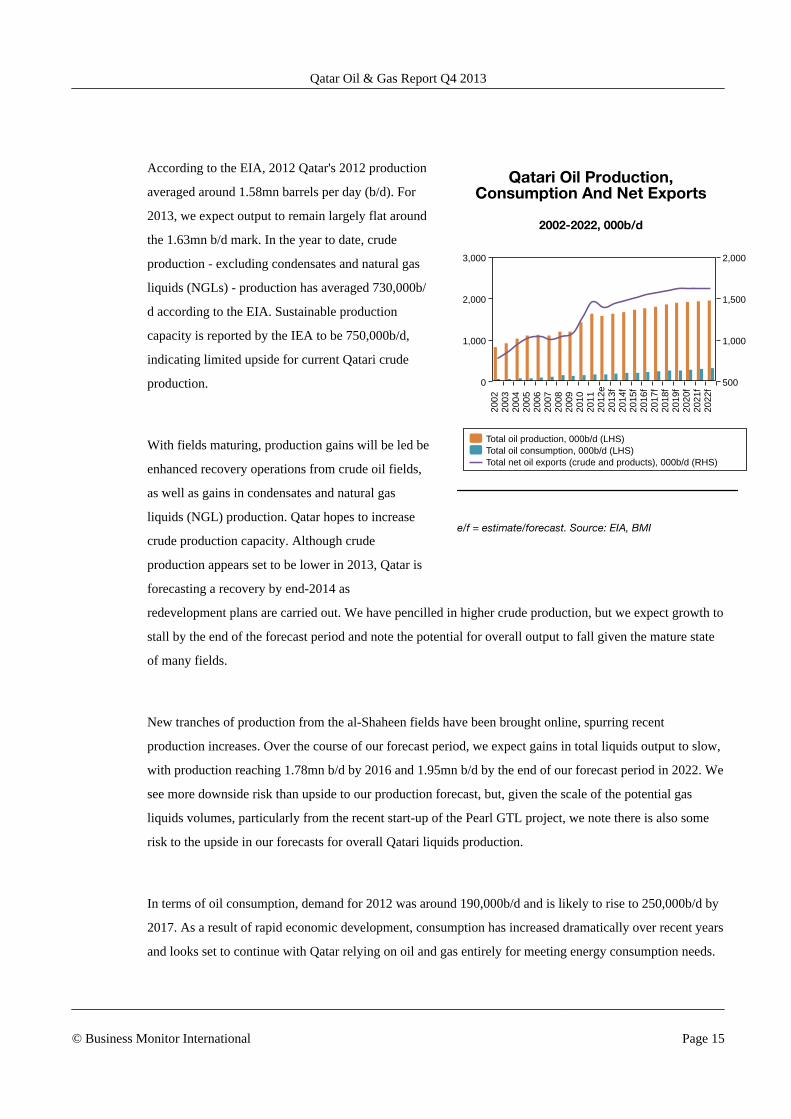
According to the EIA, 2012 Qatar's 2012 production
averaged around 1.58mn barrels per day (b/d). For
2013, we expect output to remain largely flat around
the 1.63mn b/d mark. In the year to date, crude
production - excluding condensates and natural gas
liquids (NGLs) - production has averaged 730,000b/
d according to the EIA. Sustainable production
capacity is reported by the IEA to be 750,000b/d,
indicating limited upside for current Qatari crude
production.
With fields maturing, production gains will be led be
enhanced recovery operations from crude oil fields,
as well as gains in condensates and natural gas
liquids (NGL) production. Qatar hopes to increase
crude production capacity. Although crude
production appears set to be lower in 2013, Qatar is
forecasting a recovery by end-2014 as
redevelopment plans are carried out. We have pencilled in higher crude production, but we expect growth to
stall by the end of the forecast period and note the potential for overall output to fall given the mature state
of many fields.
New tranches of production from the al-Shaheen fields have been brought online, spurring recent
production increases. Over the course of our forecast period, we expect gains in total liquids output to slow,
with production reaching 1.78mn b/d by 2016 and 1.95mn b/d by the end of our forecast period in 2022. We
see more downside risk than upside to our production forecast, but, given the scale of the potential gas
liquids volumes, particularly from the recent start-up of the Pearl GTL project, we note there is also some
risk to the upside in our forecasts for overall Qatari liquids production.
In terms of oil consumption, demand for 2012 was around 190,000b/d and is likely to rise to 250,000b/d by
2017. As a result of rapid economic development, consumption has increased dramatically over recent years
and looks set to continue with Qatar relying on oil and gas entirely for meeting energy consumption needs.
Qatari Oil Production,Consumption And Net Exports
2002-2022, 000b/d
Total oil production, 000b/d (LHS)Total oil consumption, 000b/d (LHS)Total net oil exports (crude and products), 000b/d (RHS)
2002
2003
2004
2005
2006
2007
2008
2009
2010
2011
2012
e20
13f
2014
f20
15f
2016
f20
17f
2018
f20
19f
2020
f20
21f
2022
f
0
1,000
2,000
3,000
500
1,000
1,500
2,000
e/f = estimate/forecast. Source: EIA, BMI
Qatar Oil & Gas Report Q4 2013
© Business Monitor International Page 15
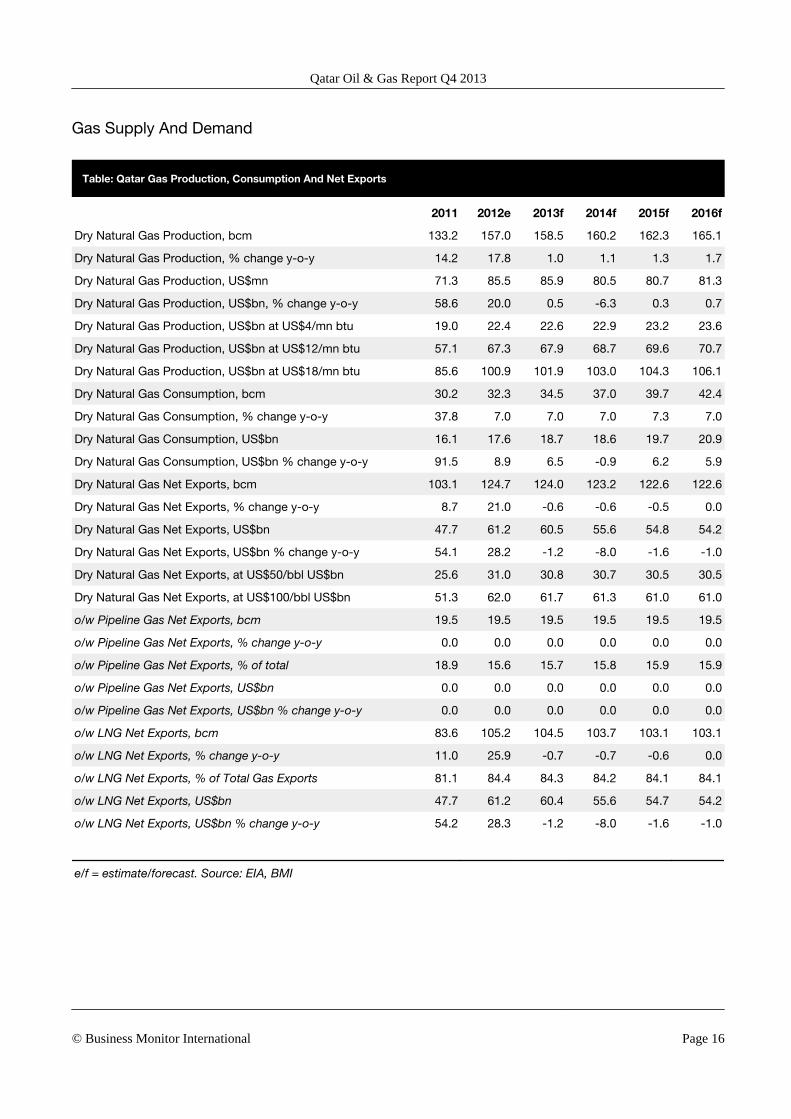
Gas Supply And Demand
Table: Qatar Gas Production, Consumption And Net Exports
2011 2012e 2013f 2014f 2015f 2016f
Dry Natural Gas Production, bcm 133.2 157.0 158.5 160.2 162.3 165.1
Dry Natural Gas Production, % change y-o-y 14.2 17.8 1.0 1.1 1.3 1.7
Dry Natural Gas Production, US$mn 71.3 85.5 85.9 80.5 80.7 81.3
Dry Natural Gas Production, US$bn, % change y-o-y 58.6 20.0 0.5 -6.3 0.3 0.7
Dry Natural Gas Production, US$bn at US$4/mn btu 19.0 22.4 22.6 22.9 23.2 23.6
Dry Natural Gas Production, US$bn at US$12/mn btu 57.1 67.3 67.9 68.7 69.6 70.7
Dry Natural Gas Production, US$bn at US$18/mn btu 85.6 100.9 101.9 103.0 104.3 106.1
Dry Natural Gas Consumption, bcm 30.2 32.3 34.5 37.0 39.7 42.4
Dry Natural Gas Consumption, % change y-o-y 37.8 7.0 7.0 7.0 7.3 7.0
Dry Natural Gas Consumption, US$bn 16.1 17.6 18.7 18.6 19.7 20.9
Dry Natural Gas Consumption, US$bn % change y-o-y 91.5 8.9 6.5 -0.9 6.2 5.9
Dry Natural Gas Net Exports, bcm 103.1 124.7 124.0 123.2 122.6 122.6
Dry Natural Gas Net Exports, % change y-o-y 8.7 21.0 -0.6 -0.6 -0.5 0.0
Dry Natural Gas Net Exports, US$bn 47.7 61.2 60.5 55.6 54.8 54.2
Dry Natural Gas Net Exports, US$bn % change y-o-y 54.1 28.2 -1.2 -8.0 -1.6 -1.0
Dry Natural Gas Net Exports, at US$50/bbl US$bn 25.6 31.0 30.8 30.7 30.5 30.5
Dry Natural Gas Net Exports, at US$100/bbl US$bn 51.3 62.0 61.7 61.3 61.0 61.0
o/w Pipeline Gas Net Exports, bcm 19.5 19.5 19.5 19.5 19.5 19.5
o/w Pipeline Gas Net Exports, % change y-o-y 0.0 0.0 0.0 0.0 0.0 0.0
o/w Pipeline Gas Net Exports, % of total 18.9 15.6 15.7 15.8 15.9 15.9
o/w Pipeline Gas Net Exports, US$bn 0.0 0.0 0.0 0.0 0.0 0.0
o/w Pipeline Gas Net Exports, US$bn % change y-o-y 0.0 0.0 0.0 0.0 0.0 0.0
o/w LNG Net Exports, bcm 83.6 105.2 104.5 103.7 103.1 103.1
o/w LNG Net Exports, % change y-o-y 11.0 25.9 -0.7 -0.7 -0.6 0.0
o/w LNG Net Exports, % of Total Gas Exports 81.1 84.4 84.3 84.2 84.1 84.1
o/w LNG Net Exports, US$bn 47.7 61.2 60.4 55.6 54.7 54.2
o/w LNG Net Exports, US$bn % change y-o-y 54.2 28.3 -1.2 -8.0 -1.6 -1.0
e/f = estimate/forecast. Source: EIA, BMI
Qatar Oil & Gas Report Q4 2013
© Business Monitor International Page 16
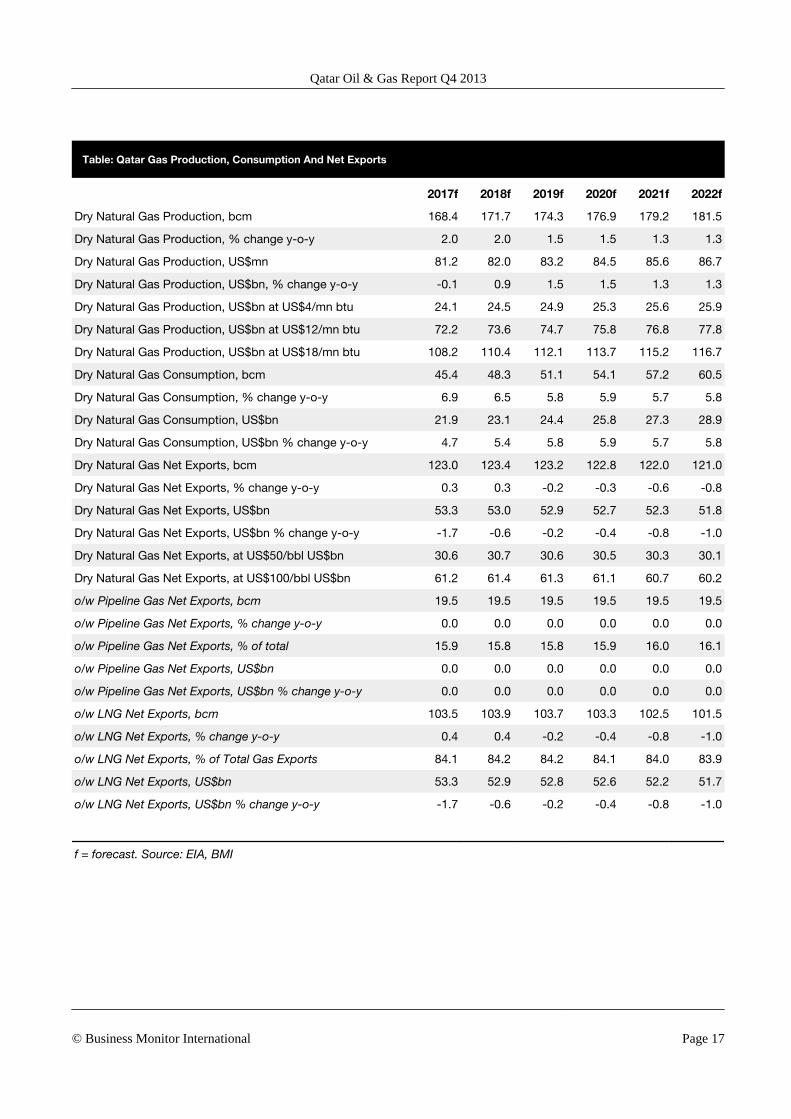
Table: Qatar Gas Production, Consumption And Net Exports
2017f 2018f 2019f 2020f 2021f 2022f
Dry Natural Gas Production, bcm 168.4 171.7 174.3 176.9 179.2 181.5
Dry Natural Gas Production, % change y-o-y 2.0 2.0 1.5 1.5 1.3 1.3
Dry Natural Gas Production, US$mn 81.2 82.0 83.2 84.5 85.6 86.7
Dry Natural Gas Production, US$bn, % change y-o-y -0.1 0.9 1.5 1.5 1.3 1.3
Dry Natural Gas Production, US$bn at US$4/mn btu 24.1 24.5 24.9 25.3 25.6 25.9
Dry Natural Gas Production, US$bn at US$12/mn btu 72.2 73.6 74.7 75.8 76.8 77.8
Dry Natural Gas Production, US$bn at US$18/mn btu 108.2 110.4 112.1 113.7 115.2 116.7
Dry Natural Gas Consumption, bcm 45.4 48.3 51.1 54.1 57.2 60.5
Dry Natural Gas Consumption, % change y-o-y 6.9 6.5 5.8 5.9 5.7 5.8
Dry Natural Gas Consumption, US$bn 21.9 23.1 24.4 25.8 27.3 28.9
Dry Natural Gas Consumption, US$bn % change y-o-y 4.7 5.4 5.8 5.9 5.7 5.8
Dry Natural Gas Net Exports, bcm 123.0 123.4 123.2 122.8 122.0 121.0
Dry Natural Gas Net Exports, % change y-o-y 0.3 0.3 -0.2 -0.3 -0.6 -0.8
Dry Natural Gas Net Exports, US$bn 53.3 53.0 52.9 52.7 52.3 51.8
Dry Natural Gas Net Exports, US$bn % change y-o-y -1.7 -0.6 -0.2 -0.4 -0.8 -1.0
Dry Natural Gas Net Exports, at US$50/bbl US$bn 30.6 30.7 30.6 30.5 30.3 30.1
Dry Natural Gas Net Exports, at US$100/bbl US$bn 61.2 61.4 61.3 61.1 60.7 60.2
o/w Pipeline Gas Net Exports, bcm 19.5 19.5 19.5 19.5 19.5 19.5
o/w Pipeline Gas Net Exports, % change y-o-y 0.0 0.0 0.0 0.0 0.0 0.0
o/w Pipeline Gas Net Exports, % of total 15.9 15.8 15.8 15.9 16.0 16.1
o/w Pipeline Gas Net Exports, US$bn 0.0 0.0 0.0 0.0 0.0 0.0
o/w Pipeline Gas Net Exports, US$bn % change y-o-y 0.0 0.0 0.0 0.0 0.0 0.0
o/w LNG Net Exports, bcm 103.5 103.9 103.7 103.3 102.5 101.5
o/w LNG Net Exports, % change y-o-y 0.4 0.4 -0.2 -0.4 -0.8 -1.0
o/w LNG Net Exports, % of Total Gas Exports 84.1 84.2 84.2 84.1 84.0 83.9
o/w LNG Net Exports, US$bn 53.3 52.9 52.8 52.6 52.2 51.7
o/w LNG Net Exports, US$bn % change y-o-y -1.7 -0.6 -0.2 -0.4 -0.8 -1.0
f = forecast. Source: EIA, BMI
Qatar Oil & Gas Report Q4 2013
© Business Monitor International Page 17
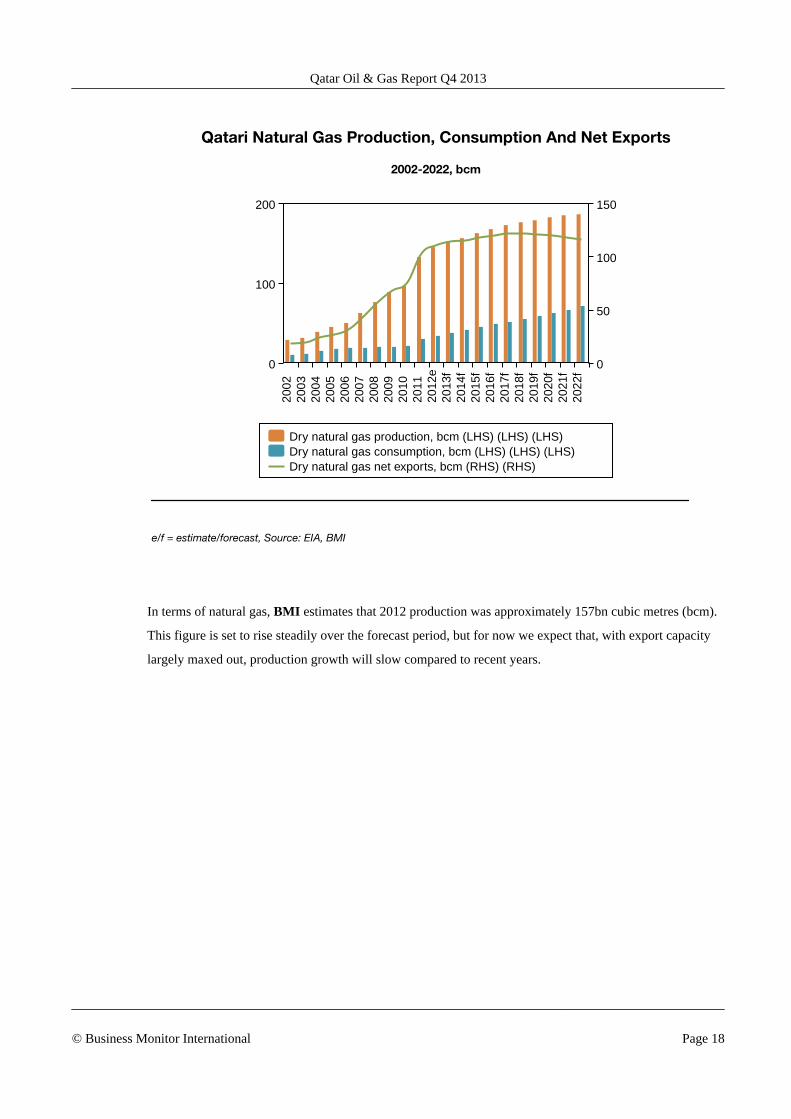
Qatari Natural Gas Production, Consumption And Net Exports
2002-2022, bcm
Dry natural gas production, bcm (LHS) (LHS) (LHS)Dry natural gas consumption, bcm (LHS) (LHS) (LHS)Dry natural gas net exports, bcm (RHS) (RHS)
2002
2003
2004
2005
2006
2007
2008
2009
2010
2011
2012
e20
13f
2014
f20
15f
2016
f20
17f
2018
f20
19f
2020
f20
21f
2022
f
0
100
200
0
50
100
150
e/f = estimate/forecast, Source: EIA, BMI
In terms of natural gas, BMI estimates that 2012 production was approximately 157bn cubic metres (bcm).
This figure is set to rise steadily over the forecast period, but for now we expect that, with export capacity
largely maxed out, production growth will slow compared to recent years.
Qatar Oil & Gas Report Q4 2013
© Business Monitor International Page 18
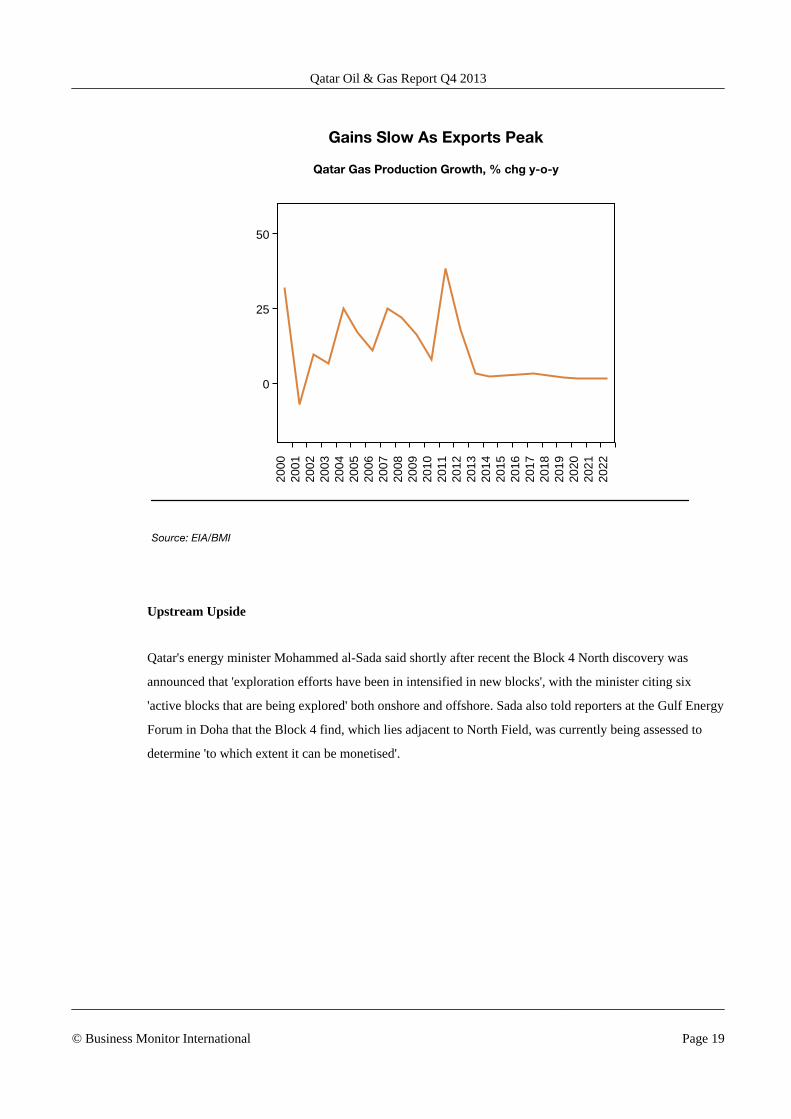
Gains Slow As Exports Peak
Qatar Gas Production Growth, % chg y-o-y
2000
2001
2002
2003
2004
2005
2006
2007
2008
2009
2010
2011
2012
2013
2014
2015
2016
2017
2018
2019
2020
2021
2022
0
25
50
Source: EIA/BMI
Upstream Upside
Qatar's energy minister Mohammed al-Sada said shortly after recent the Block 4 North discovery was
announced that 'exploration efforts have been in intensified in new blocks', with the minister citing six
'active blocks that are being explored' both onshore and offshore. Sada also told reporters at the Gulf Energy
Forum in Doha that the Block 4 find, which lies adjacent to North Field, was currently being assessed to
determine 'to which extent it can be monetised'.
Qatar Oil & Gas Report Q4 2013
© Business Monitor International Page 19
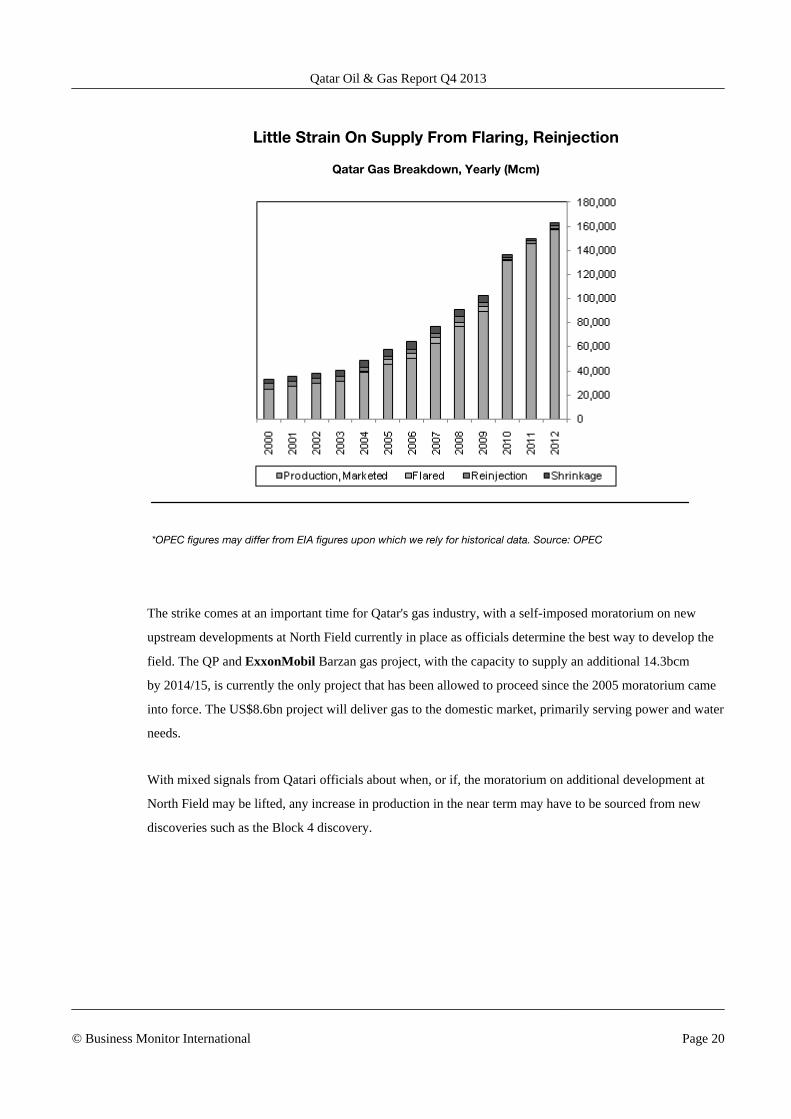
Little Strain On Supply From Flaring, Reinjection
Qatar Gas Breakdown, Yearly (Mcm)
*OPEC figures may differ from EIA figures upon which we rely for historical data. Source: OPEC
The strike comes at an important time for Qatar's gas industry, with a self-imposed moratorium on new
upstream developments at North Field currently in place as officials determine the best way to develop the
field. The QP and ExxonMobil Barzan gas project, with the capacity to supply an additional 14.3bcm
by 2014/15, is currently the only project that has been allowed to proceed since the 2005 moratorium came
into force. The US$8.6bn project will deliver gas to the domestic market, primarily serving power and water
needs.
With mixed signals from Qatari officials about when, or if, the moratorium on additional development at
North Field may be lifted, any increase in production in the near term may have to be sourced from new
discoveries such as the Block 4 discovery.
Qatar Oil & Gas Report Q4 2013
© Business Monitor International Page 20
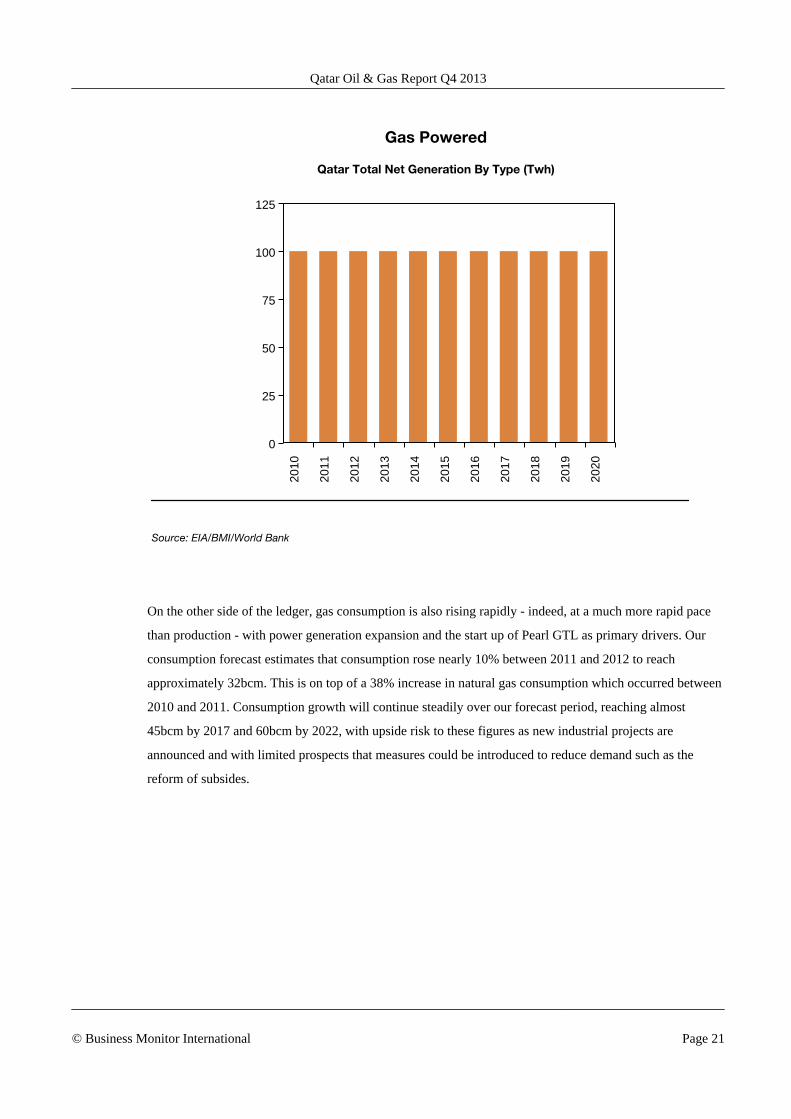
Gas Powered
Qatar Total Net Generation By Type (Twh)
2010
2011
2012
2013
2014
2015
2016
2017
2018
2019
2020
0
25
50
75
100
125
Source: EIA/BMI/World Bank
On the other side of the ledger, gas consumption is also rising rapidly - indeed, at a much more rapid pace
than production - with power generation expansion and the start up of Pearl GTL as primary drivers. Our
consumption forecast estimates that consumption rose nearly 10% between 2011 and 2012 to reach
approximately 32bcm. This is on top of a 38% increase in natural gas consumption which occurred between
2010 and 2011. Consumption growth will continue steadily over our forecast period, reaching almost
45bcm by 2017 and 60bcm by 2022, with upside risk to these figures as new industrial projects are
announced and with limited prospects that measures could be introduced to reduce demand such as the
reform of subsides.
Qatar Oil & Gas Report Q4 2013
© Business Monitor International Page 21
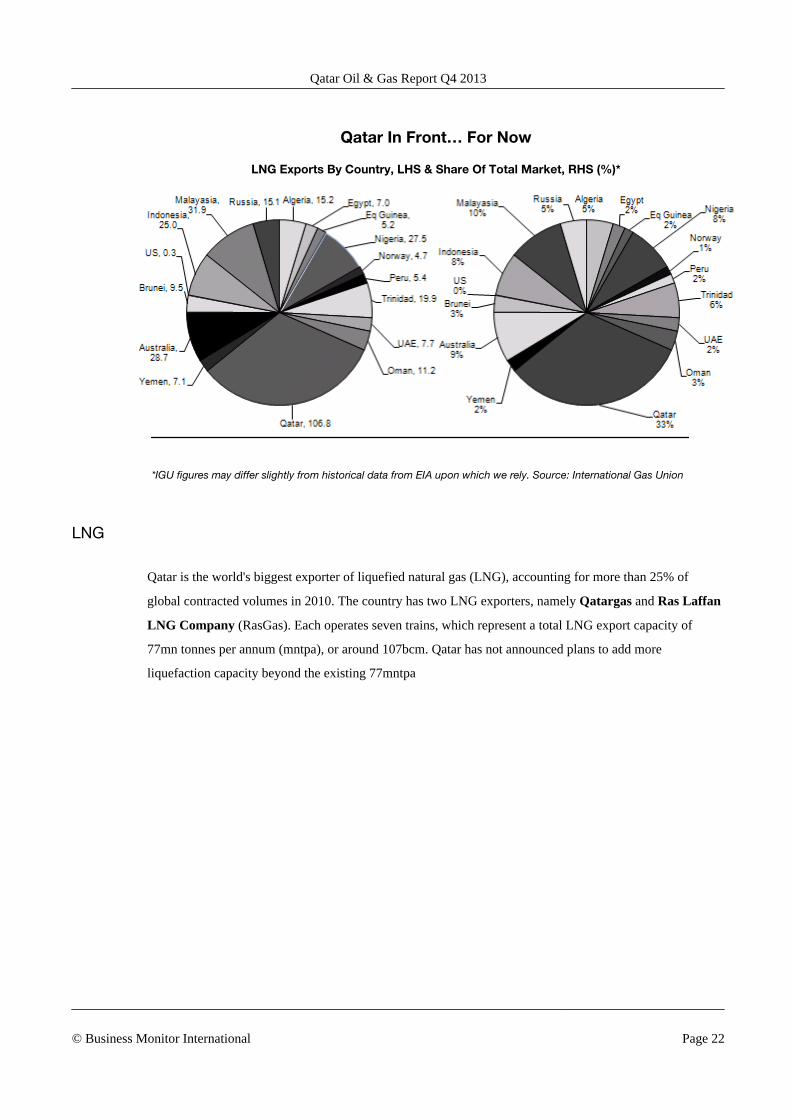
Qatar In Front… For Now
LNG Exports By Country, LHS & Share Of Total Market, RHS (%)*
*IGU figures may differ slightly from historical data from EIA upon which we rely. Source: International Gas Union
LNG
Qatar is the world's biggest exporter of liquefied natural gas (LNG), accounting for more than 25% of
global contracted volumes in 2010. The country has two LNG exporters, namely Qatargas and Ras Laffan
LNG Company (RasGas). Each operates seven trains, which represent a total LNG export capacity of
77mn tonnes per annum (mntpa), or around 107bcm. Qatar has not announced plans to add more
liquefaction capacity beyond the existing 77mntpa
Qatar Oil & Gas Report Q4 2013
© Business Monitor International Page 22
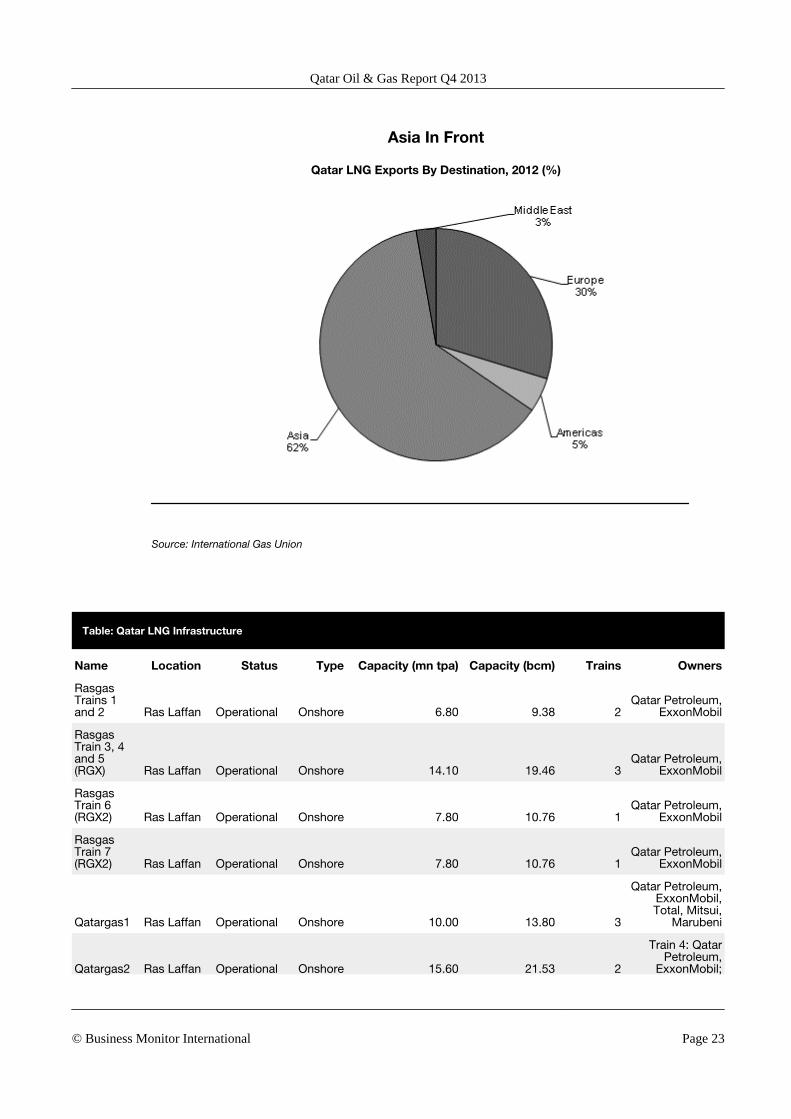
Asia In Front
Qatar LNG Exports By Destination, 2012 (%)
Source: International Gas Union
Table: Qatar LNG Infrastructure
Name Location Status Type Capacity (mn tpa) Capacity (bcm) Trains Owners
RasgasTrains 1and 2 Ras Laffan Operational Onshore 6.80 9.38 2
Qatar Petroleum,ExxonMobil
RasgasTrain 3, 4and 5(RGX) Ras Laffan Operational Onshore 14.10 19.46 3
Qatar Petroleum,ExxonMobil
RasgasTrain 6(RGX2) Ras Laffan Operational Onshore 7.80 10.76 1
Qatar Petroleum,ExxonMobil
RasgasTrain 7(RGX2) Ras Laffan Operational Onshore 7.80 10.76 1
Qatar Petroleum,ExxonMobil
Qatargas1 Ras Laffan Operational Onshore 10.00 13.80 3
Qatar Petroleum,ExxonMobil,Total, Mitsui,
Marubeni
Qatargas2 Ras Laffan Operational Onshore 15.60 21.53 2
Train 4: QatarPetroleum,
ExxonMobil;
Qatar Oil & Gas Report Q4 2013
© Business Monitor International Page 23
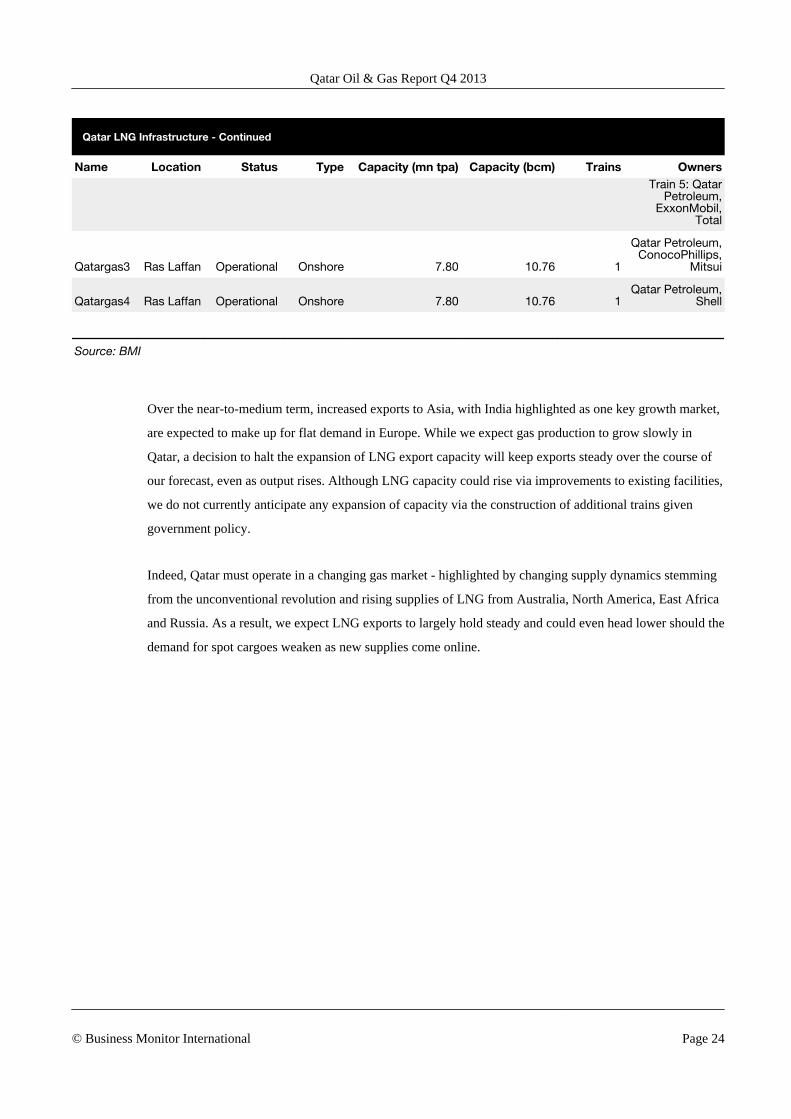
Qatar LNG Infrastructure - Continued
Name Location Status Type Capacity (mn tpa) Capacity (bcm) Trains OwnersTrain 5: Qatar
Petroleum,ExxonMobil,
Total
Qatargas3 Ras Laffan Operational Onshore 7.80 10.76 1
Qatar Petroleum,ConocoPhillips,
Mitsui
Qatargas4 Ras Laffan Operational Onshore 7.80 10.76 1Qatar Petroleum,
Shell
Source: BMI
Over the near-to-medium term, increased exports to Asia, with India highlighted as one key growth market,
are expected to make up for flat demand in Europe. While we expect gas production to grow slowly in
Qatar, a decision to halt the expansion of LNG export capacity will keep exports steady over the course of
our forecast, even as output rises. Although LNG capacity could rise via improvements to existing facilities,
we do not currently anticipate any expansion of capacity via the construction of additional trains given
government policy.
Indeed, Qatar must operate in a changing gas market - highlighted by changing supply dynamics stemming
from the unconventional revolution and rising supplies of LNG from Australia, North America, East Africa
and Russia. As a result, we expect LNG exports to largely hold steady and could even head lower should the
demand for spot cargoes weaken as new supplies come online.
Qatar Oil & Gas Report Q4 2013
© Business Monitor International Page 24
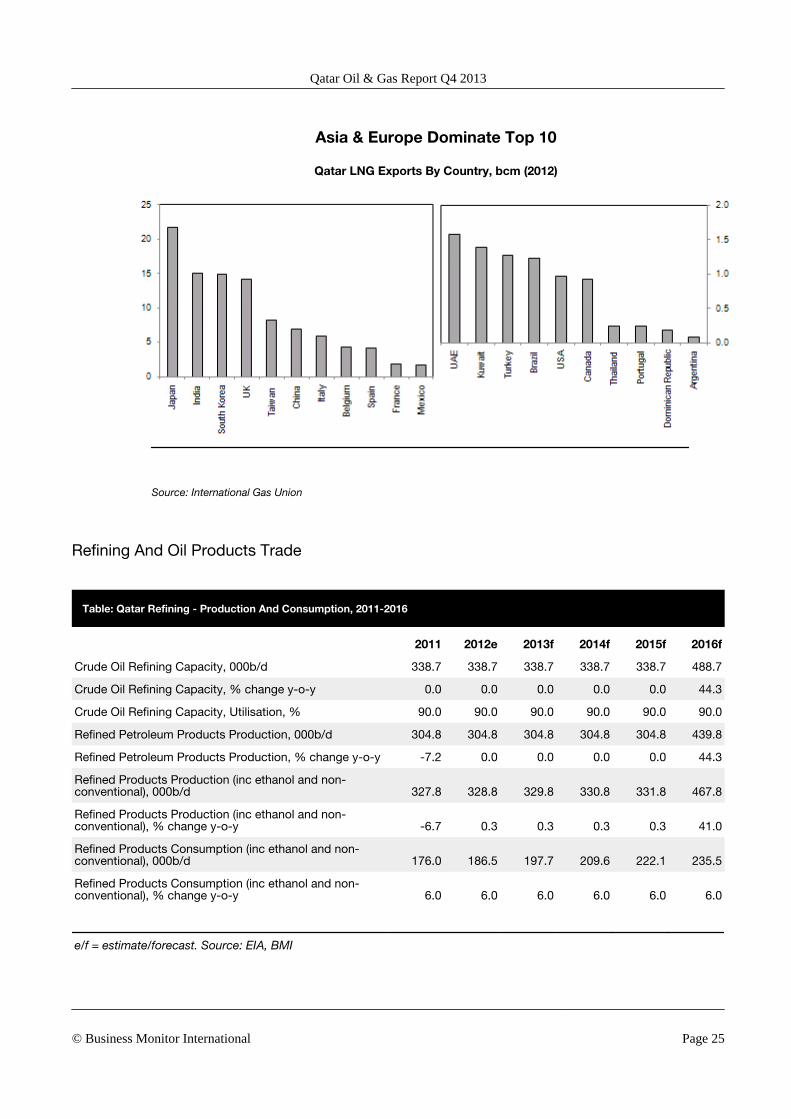
Asia & Europe Dominate Top 10
Qatar LNG Exports By Country, bcm (2012)
Source: International Gas Union
Refining And Oil Products Trade
Table: Qatar Refining - Production And Consumption, 2011-2016
2011 2012e 2013f 2014f 2015f 2016f
Crude Oil Refining Capacity, 000b/d 338.7 338.7 338.7 338.7 338.7 488.7
Crude Oil Refining Capacity, % change y-o-y 0.0 0.0 0.0 0.0 0.0 44.3
Crude Oil Refining Capacity, Utilisation, % 90.0 90.0 90.0 90.0 90.0 90.0
Refined Petroleum Products Production, 000b/d 304.8 304.8 304.8 304.8 304.8 439.8
Refined Petroleum Products Production, % change y-o-y -7.2 0.0 0.0 0.0 0.0 44.3
Refined Products Production (inc ethanol and non-conventional), 000b/d 327.8 328.8 329.8 330.8 331.8 467.8
Refined Products Production (inc ethanol and non-conventional), % change y-o-y -6.7 0.3 0.3 0.3 0.3 41.0
Refined Products Consumption (inc ethanol and non-conventional), 000b/d 176.0 186.5 197.7 209.6 222.1 235.5
Refined Products Consumption (inc ethanol and non-conventional), % change y-o-y 6.0 6.0 6.0 6.0 6.0 6.0
e/f = estimate/forecast. Source: EIA, BMI
Qatar Oil & Gas Report Q4 2013
© Business Monitor International Page 25
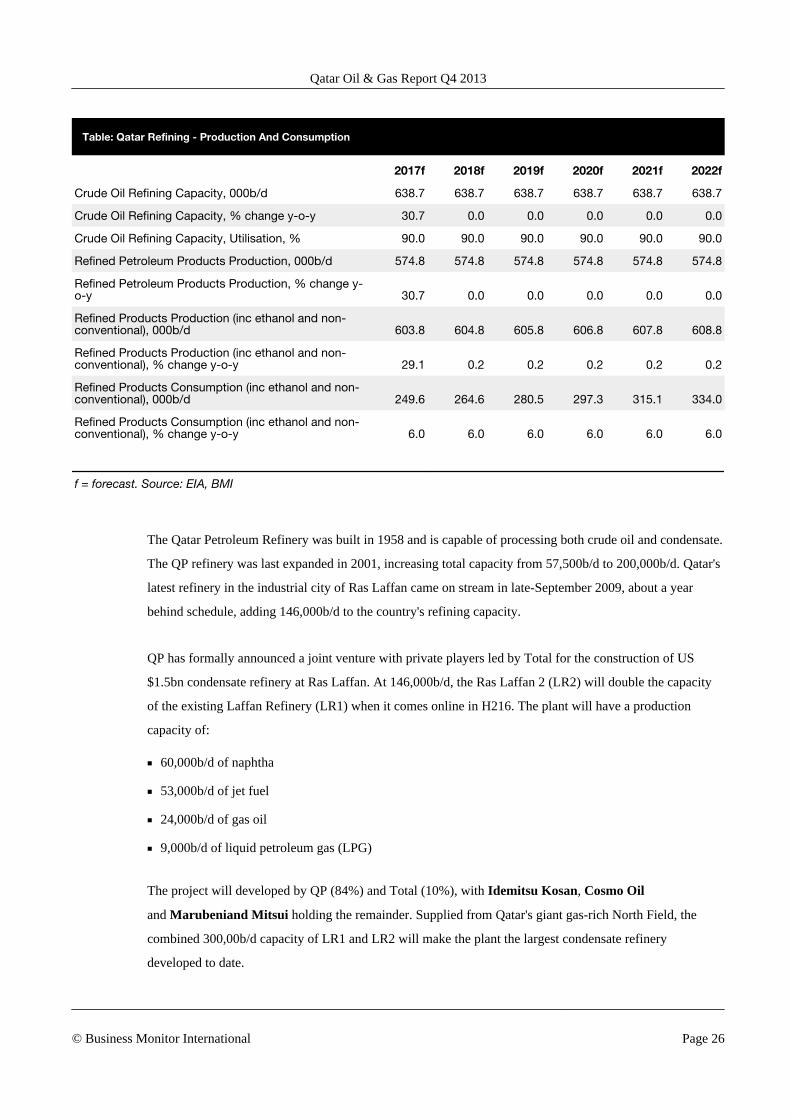
Table: Qatar Refining - Production And Consumption
2017f 2018f 2019f 2020f 2021f 2022f
Crude Oil Refining Capacity, 000b/d 638.7 638.7 638.7 638.7 638.7 638.7
Crude Oil Refining Capacity, % change y-o-y 30.7 0.0 0.0 0.0 0.0 0.0
Crude Oil Refining Capacity, Utilisation, % 90.0 90.0 90.0 90.0 90.0 90.0
Refined Petroleum Products Production, 000b/d 574.8 574.8 574.8 574.8 574.8 574.8
Refined Petroleum Products Production, % change y-o-y 30.7 0.0 0.0 0.0 0.0 0.0
Refined Products Production (inc ethanol and non-conventional), 000b/d 603.8 604.8 605.8 606.8 607.8 608.8
Refined Products Production (inc ethanol and non-conventional), % change y-o-y 29.1 0.2 0.2 0.2 0.2 0.2
Refined Products Consumption (inc ethanol and non-conventional), 000b/d 249.6 264.6 280.5 297.3 315.1 334.0
Refined Products Consumption (inc ethanol and non-conventional), % change y-o-y 6.0 6.0 6.0 6.0 6.0 6.0
f = forecast. Source: EIA, BMI
The Qatar Petroleum Refinery was built in 1958 and is capable of processing both crude oil and condensate.
The QP refinery was last expanded in 2001, increasing total capacity from 57,500b/d to 200,000b/d. Qatar's
latest refinery in the industrial city of Ras Laffan came on stream in late-September 2009, about a year
behind schedule, adding 146,000b/d to the country's refining capacity.
QP has formally announced a joint venture with private players led by Total for the construction of US
$1.5bn condensate refinery at Ras Laffan. At 146,000b/d, the Ras Laffan 2 (LR2) will double the capacity
of the existing Laffan Refinery (LR1) when it comes online in H216. The plant will have a production
capacity of:
■ 60,000b/d of naphtha
■ 53,000b/d of jet fuel
■ 24,000b/d of gas oil
■ 9,000b/d of liquid petroleum gas (LPG)
The project will developed by QP (84%) and Total (10%), with Idemitsu Kosan, Cosmo Oil
and Marubeniand Mitsui holding the remainder. Supplied from Qatar's giant gas-rich North Field, the
combined 300,00b/d capacity of LR1 and LR2 will make the plant the largest condensate refinery
developed to date.
Qatar Oil & Gas Report Q4 2013
© Business Monitor International Page 26
Gas-To-Liquids
Apart from the two conventional refineries, Qatar also has a 34,000b/d GTL plant known as Oryx, which is
operated by South African synthetic oil specialist Sasol. Sasol plans to treble the capacity of the site,
potentially taking it to more than 100,000b/d. The plan is feed by gas from the Al Khaleej field.
In addition, the larger Shell-operated Pearl GTL plant has the capacity to produce 140,000b/d of ultra-clean
diesel, naphtha etc, with the first train having started up in 2011 and reached full capacity in the end of
2012. The Pearl facility also produces some 120,000b/d worth of associated condensate and LPG volumes.
The plant is currently the world's largest GTL facility and is notable as the first GTL facility to integrate
upstream natural gas production with the downstream conversion facility.
The planned US$11bn al-Shaheen refinery was reported in February 2010 to be indefinitely delayed, with
re-scaling and re-tendering expected. The 250,000b/d facility was to be fed with heavy, sour crude from the
eponymous offshore oil field. GTL capacity is currently not included in our downstream forecast.
Revenues/Import Costs
Crude oil and liquids export revenues are set to fall slightly from an estimated US$56bn in 2012 to US
$55.5bn by 2017. The BMI oil price assumptions are US$109/bbl in 2013 (OPEC basket) and US$101/bbl
in 2014. By 2016, gas export revenues should have reached US$54bn. However, there is an expected
decline at the end of our forecast period, with gas export revenues dropping to US$52bn by 2022.
Key Risks To BMI's Forecast Scenario
Qatar is sensitive to oil price fluctuations, which would hit its crude export revenues. Although we do not
see it as a likely event, the possible emergence of an 'LNG glut' could hit Qatar's LNG export revenues hard,
while any increase in volume or price for pipeline exports to the UAE and Oman will boost gas revenues.
Certainly the potential increase in competition from emerging natural gas players, including those in East
Africa, could pose a long-term threat, although much of that new production is set to hit the market beyond
our forecast period.
Finally, there is increasing pressure from major LNG importing countries, namely Japan and South Korea,
which are pushing to de-link LNG contract pricing from oil prices. Qatar is strongly resisting this push;
however, as new export markets become available, the arbitrage opportunity may become too great, forcing
Qatar Oil & Gas Report Q4 2013
© Business Monitor International Page 27

some contract terms and pricing mechanisms to change over the medium-to-long term. This could
potentially have a significant impact on Qatar, and particularly on Qatari fiscal accounts.
Qatar Oil & Gas Report Q4 2013
© Business Monitor International Page 28
Industry Risk Reward Ratings
Middle East - Risk/Reward Ratings
BMI View: Smaller markets with strong openness to foreign investment continue to outperform those with
larger resource endowments in our overall rankings, with Israel, the UAE and Qatar outperforming
countries like Saudi Arabia. Iraq remains the country most likely to move up or down in our rankings with
both strong upside and downside risks, as the country's potential is undermined by a multitude of above-
ground woes. We also highlight Kuwait as a market at risk of continued underperformance as business
environment threats challenge both upstream and downstream performance.
The main conclusions from our Middle East Risk/Reward Ratings are:
■ Scores and rankings have remained largely unchanged in our Risk/Reward Ratings (RRRs), reflecting themature status of the majority of producers in the region. In terms of production, we currently expectsteady gains in most markets over the course of our forecast period, notwithstanding the downside risksto this view. Risks stem from the ongoing disruption to traditional trade flows as growth in non-OPECproduction displaces Middle East imports in the US, and as OPEC states increasingly compete for marketshare in demand-hungry Asia.
■ The UAE has retained its top spot in our overall oil & gas RRRs. The country's relative openness toforeign investment in both the upstream and downstream segments, as well as a major investment plantargeting a sizable expansion of production capacity are among the reasons for its outperformancerelative to its peers in the region on key metrics. Nonetheless, we highlight risks to watch on the horizonfor the UAE.
■ Firstly, reports are emerging that the UAE may miss its stated target of 3.5mn barrels per day (b/d) by2017. According to officials and industry sources, the country may not reach this production level until2020. While we had priced-in delays to our output forecast, which sees production reaching 3.6mn b/donly by 2020, further setbacks may cause us to revisit this and pencil-in slower growth that could result ina fall in the UAE's upstream scores.
Qatar Oil & Gas Report Q4 2013
© Business Monitor International Page 29
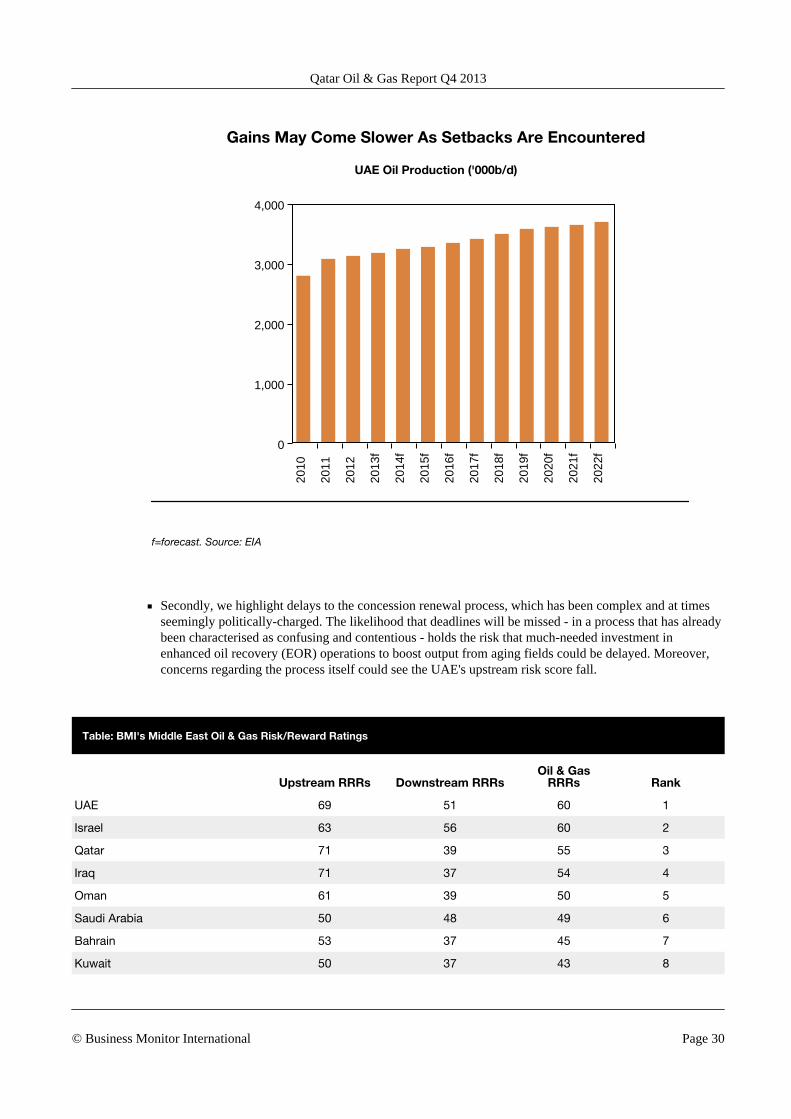
Gains May Come Slower As Setbacks Are Encountered
UAE Oil Production ('000b/d)
2010
2011
2012
2013
f
2014
f
2015
f
2016
f
2017
f
2018
f
2019
f
2020
f
2021
f
2022
f
0
1,000
2,000
3,000
4,000
f=forecast. Source: EIA
■ Secondly, we highlight delays to the concession renewal process, which has been complex and at timesseemingly politically-charged. The likelihood that deadlines will be missed - in a process that has alreadybeen characterised as confusing and contentious - holds the risk that much-needed investment inenhanced oil recovery (EOR) operations to boost output from aging fields could be delayed. Moreover,concerns regarding the process itself could see the UAE's upstream risk score fall.
Table: BMI's Middle East Oil & Gas Risk/Reward Ratings
Upstream RRRs Downstream RRRsOil & Gas
RRRs Rank
UAE 69 51 60 1
Israel 63 56 60 2
Qatar 71 39 55 3
Iraq 71 37 54 4
Oman 61 39 50 5
Saudi Arabia 50 48 49 6
Bahrain 53 37 45 7
Kuwait 50 37 43 8
Qatar Oil & Gas Report Q4 2013
© Business Monitor International Page 30
BMI's Middle East Oil & Gas Risk/Reward Ratings - Continued
Upstream RRRs Downstream RRRsOil & Gas
RRRs Rank
Regional Average 61 43 52 8
NB Scores out of 100; *Higher score = lower risks. Source: BMI
■ Kuwait and Iran have swapped spots at the bottom of our overall rankings, leaving the latter in last place.This reflects the continued deterioration our outlook for Iran, as sanctions further erode the near- andlong-term competitiveness of its oil & gas sector.
■ In the case of Kuwait, the country's long-troubled business environment remains the key obstacle to itsindustry performance. Long-running disputes between the government and opposition parties in thecountry's vocal parliament have stalled key upstream and downstream projects, while regular industrialaction has further dampened its production outlook.
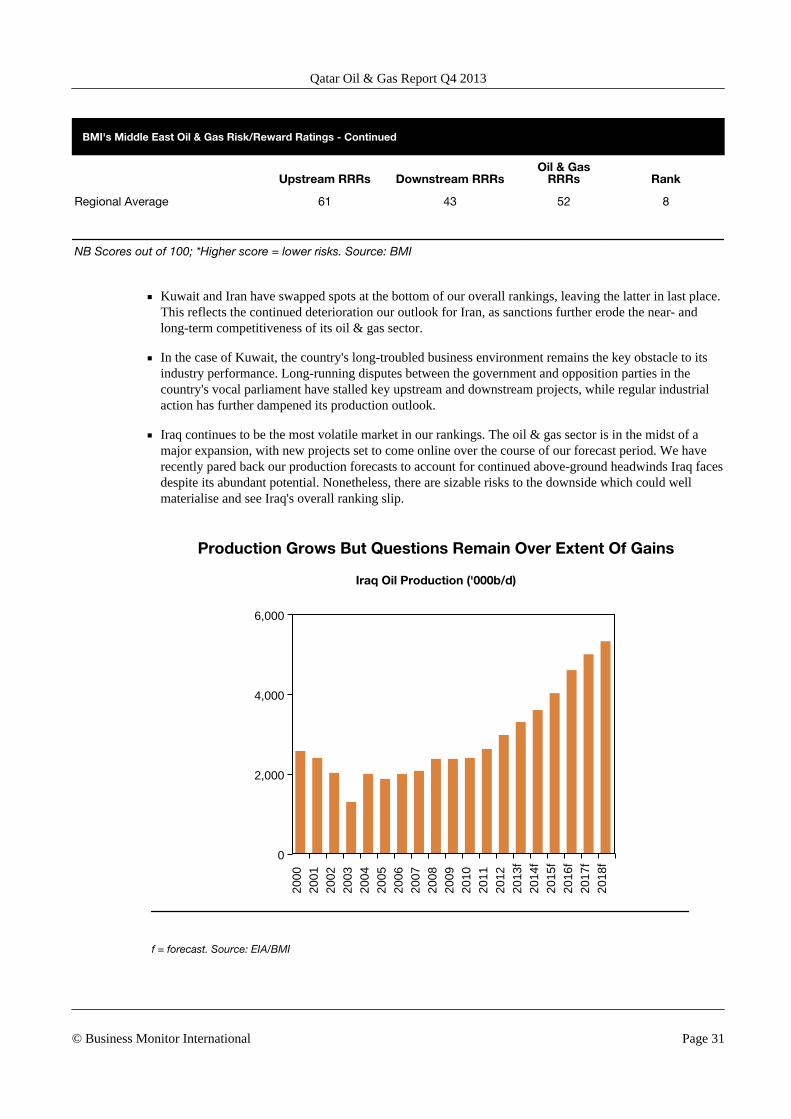
■ Iraq continues to be the most volatile market in our rankings. The oil & gas sector is in the midst of amajor expansion, with new projects set to come online over the course of our forecast period. We haverecently pared back our production forecasts to account for continued above-ground headwinds Iraq facesdespite its abundant potential. Nonetheless, there are sizable risks to the downside which could wellmaterialise and see Iraq's overall ranking slip.
Production Grows But Questions Remain Over Extent Of Gains
Iraq Oil Production ('000b/d)
2000
2001
2002
2003
2004
2005
2006
2007
2008
2009
2010
2011
2012
2013
f20
14f
2015
f20
16f
2017
f20
18f
0
2,000
4,000
6,000
f = forecast. Source: EIA/BMI
Qatar Oil & Gas Report Q4 2013
© Business Monitor International Page 31
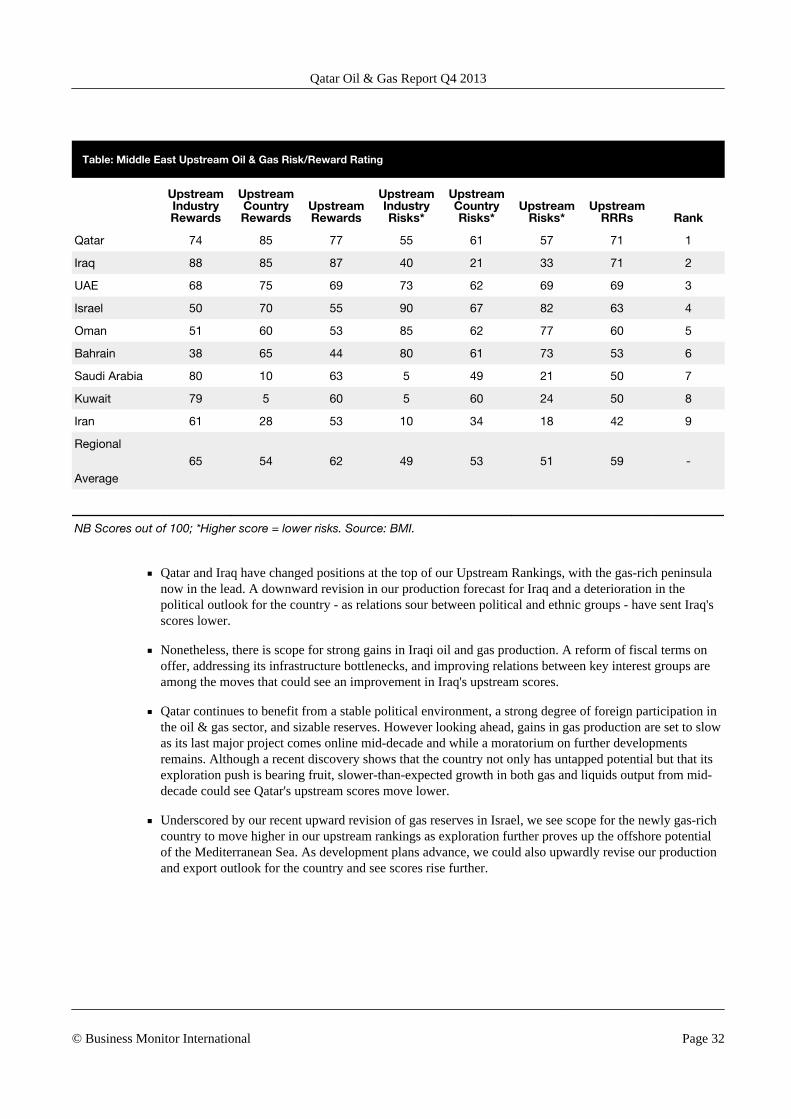
Table: Middle East Upstream Oil & Gas Risk/Reward Rating
UpstreamIndustryRewards
UpstreamCountryRewards
UpstreamRewards
UpstreamIndustryRisks*
UpstreamCountryRisks*
UpstreamRisks*
UpstreamRRRs Rank
Qatar 74 85 77 55 61 57 71 1
Iraq 88 85 87 40 21 33 71 2
UAE 68 75 69 73 62 69 69 3
Israel 50 70 55 90 67 82 63 4
Oman 51 60 53 85 62 77 60 5
Bahrain 38 65 44 80 61 73 53 6
Saudi Arabia 80 10 63 5 49 21 50 7
Kuwait 79 5 60 5 60 24 50 8
Iran 61 28 53 10 34 18 42 9
Regional
Average65 54 62 49 53 51 59 -
NB Scores out of 100; *Higher score = lower risks. Source: BMI.
■ Qatar and Iraq have changed positions at the top of our Upstream Rankings, with the gas-rich peninsulanow in the lead. A downward revision in our production forecast for Iraq and a deterioration in thepolitical outlook for the country - as relations sour between political and ethnic groups - have sent Iraq'sscores lower.
■ Nonetheless, there is scope for strong gains in Iraqi oil and gas production. A reform of fiscal terms onoffer, addressing its infrastructure bottlenecks, and improving relations between key interest groups areamong the moves that could see an improvement in Iraq's upstream scores.
■ Qatar continues to benefit from a stable political environment, a strong degree of foreign participation inthe oil & gas sector, and sizable reserves. However looking ahead, gains in gas production are set to slowas its last major project comes online mid-decade and while a moratorium on further developmentsremains. Although a recent discovery shows that the country not only has untapped potential but that itsexploration push is bearing fruit, slower-than-expected growth in both gas and liquids output from mid-decade could see Qatar's upstream scores move lower.
■ Underscored by our recent upward revision of gas reserves in Israel, we see scope for the newly gas-richcountry to move higher in our upstream rankings as exploration further proves up the offshore potentialof the Mediterranean Sea. As development plans advance, we could also upwardly revise our productionand export outlook for the country and see scores rise further.
Qatar Oil & Gas Report Q4 2013
© Business Monitor International Page 32
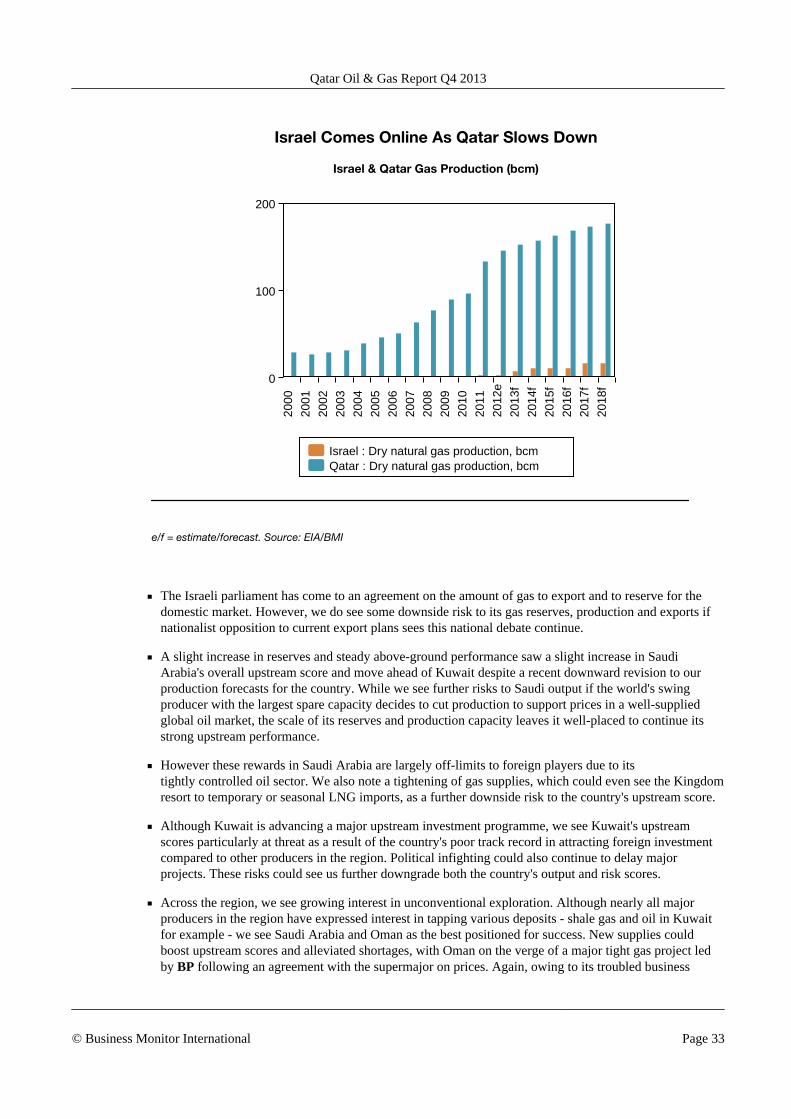
Israel Comes Online As Qatar Slows Down
Israel & Qatar Gas Production (bcm)
Israel : Dry natural gas production, bcmQatar : Dry natural gas production, bcm
2000
2001
2002
2003
2004
2005
2006
2007
2008
2009
2010
2011
2012
e
2013
f
2014
f
2015
f
2016
f
2017
f
2018
f
0
100
200
e/f = estimate/forecast. Source: EIA/BMI
■ The Israeli parliament has come to an agreement on the amount of gas to export and to reserve for thedomestic market. However, we do see some downside risk to its gas reserves, production and exports ifnationalist opposition to current export plans sees this national debate continue.
■ A slight increase in reserves and steady above-ground performance saw a slight increase in SaudiArabia's overall upstream score and move ahead of Kuwait despite a recent downward revision to ourproduction forecasts for the country. While we see further risks to Saudi output if the world's swingproducer with the largest spare capacity decides to cut production to support prices in a well-suppliedglobal oil market, the scale of its reserves and production capacity leaves it well-placed to continue itsstrong upstream performance.
■ However these rewards in Saudi Arabia are largely off-limits to foreign players due to itstightly controlled oil sector. We also note a tightening of gas supplies, which could even see the Kingdomresort to temporary or seasonal LNG imports, as a further downside risk to the country's upstream score.
■ Although Kuwait is advancing a major upstream investment programme, we see Kuwait's upstreamscores particularly at threat as a result of the country's poor track record in attracting foreign investmentcompared to other producers in the region. Political infighting could also continue to delay majorprojects. These risks could see us further downgrade both the country's output and risk scores.
■ Across the region, we see growing interest in unconventional exploration. Although nearly all majorproducers in the region have expressed interest in tapping various deposits - shale gas and oil in Kuwaitfor example - we see Saudi Arabia and Oman as the best positioned for success. New supplies couldboost upstream scores and alleviated shortages, with Oman on the verge of a major tight gas project ledby BP following an agreement with the supermajor on prices. Again, owing to its troubled business
Qatar Oil & Gas Report Q4 2013
© Business Monitor International Page 33
environment, we expect Kuwait to make the least progress in the region in tapping challenging anddifficult-to-recover deposits.
■ Despite its significant oil and gas reserves, above-ground obstacles in Iran will keep the country at thebottom of our rankings until sanctions are removed and badly-needed new investment and foreignparticipation returns to unlock the country's below-ground potential. While the recent election ofmoderate Hassan Rouhani could ease tensions, at present it remains near-impossible to determine if orwhen Iran's oil & gas sector could return to health.
■ Broadly speaking, despite strong hydrocarbons potential across much of the region which translates intostrong industry rewards, limits to foreign participation result in lower rewards scores while politicaluncertainty results in elevated risks in our proprietary upstream rankings.
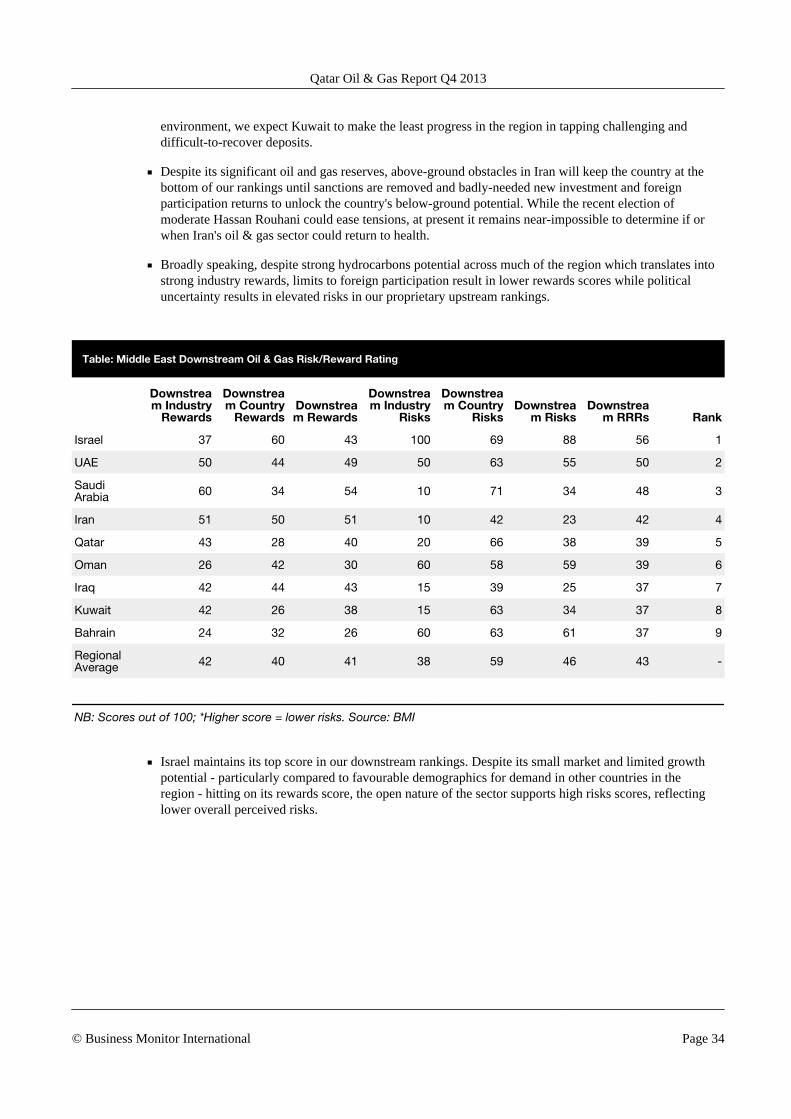
Table: Middle East Downstream Oil & Gas Risk/Reward Rating
Downstream Industry
Rewards
Downstream Country
RewardsDownstream Rewards
Downstream Industry
Risks
Downstream Country
RisksDownstrea
m RisksDownstrea
m RRRs Rank
Israel 37 60 43 100 69 88 56 1
UAE 50 44 49 50 63 55 50 2
SaudiArabia 60 34 54 10 71 34 48 3
Iran 51 50 51 10 42 23 42 4
Qatar 43 28 40 20 66 38 39 5
Oman 26 42 30 60 58 59 39 6
Iraq 42 44 43 15 39 25 37 7
Kuwait 42 26 38 15 63 34 37 8
Bahrain 24 32 26 60 63 61 37 9
RegionalAverage 42 40 41 38 59 46 43 -
NB: Scores out of 100; *Higher score = lower risks. Source: BMI
■ Israel maintains its top score in our downstream rankings. Despite its small market and limited growthpotential - particularly compared to favourable demographics for demand in other countries in theregion - hitting on its rewards score, the open nature of the sector supports high risks scores, reflectinglower overall perceived risks.
Qatar Oil & Gas Report Q4 2013
© Business Monitor International Page 34
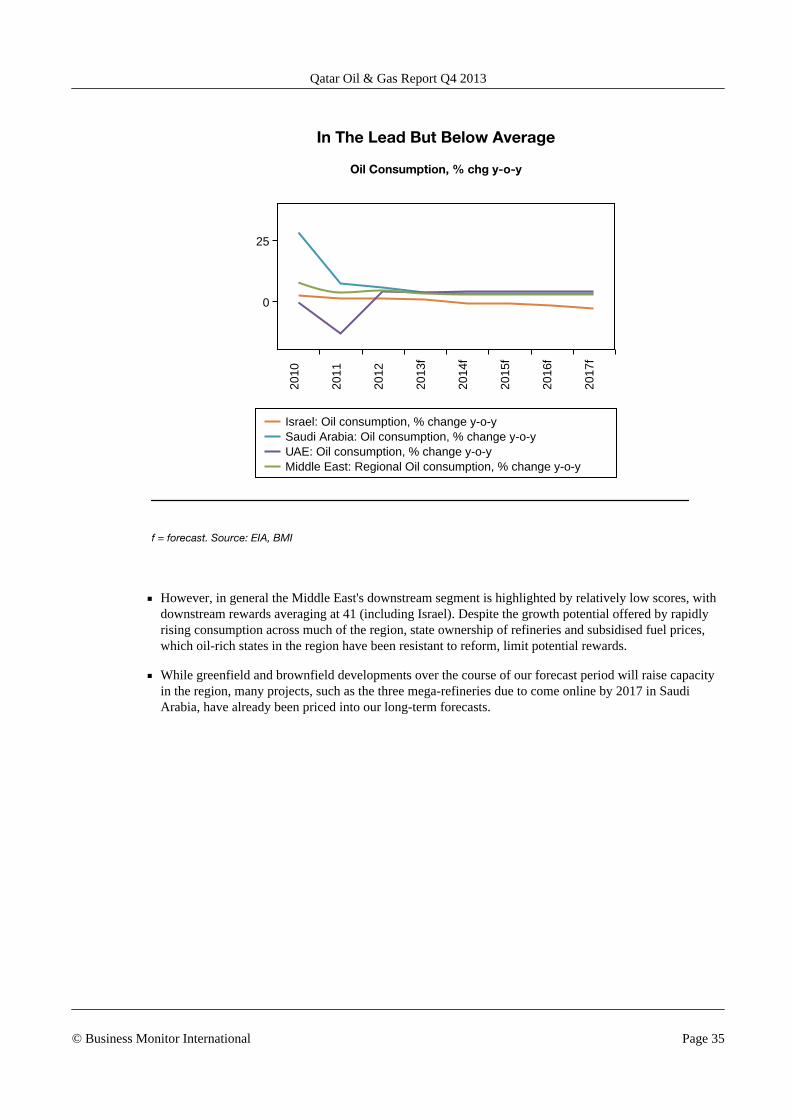
In The Lead But Below Average
Oil Consumption, % chg y-o-y
Israel: Oil consumption, % change y-o-ySaudi Arabia: Oil consumption, % change y-o-yUAE: Oil consumption, % change y-o-yMiddle East: Regional Oil consumption, % change y-o-y
2010
2011
2012
2013
f
2014
f
2015
f
2016
f
2017
f
0
25
f = forecast. Source: EIA, BMI
■ However, in general the Middle East's downstream segment is highlighted by relatively low scores, withdownstream rewards averaging at 41 (including Israel). Despite the growth potential offered by rapidlyrising consumption across much of the region, state ownership of refineries and subsidised fuel prices,which oil-rich states in the region have been resistant to reform, limit potential rewards.
■ While greenfield and brownfield developments over the course of our forecast period will raise capacityin the region, many projects, such as the three mega-refineries due to come online by 2017 in SaudiArabia, have already been priced into our long-term forecasts.
Qatar Oil & Gas Report Q4 2013
© Business Monitor International Page 35
■ Where we see further upside, is Iraq, although thecountry has struggled to advance the four majordownstream projects since awarding designcontracts in 2009. This has left Iraq dependent onimports despite its growing crude oil production.Although there are incentives, we see little near-term scope for improvement in the above-groundeconomic and regulatory risks that have deterredforeign investment in refining projects to date.One project we are optimistic may advance is the300,000b/d Nassiriya plant tied to development ofa major field, though we have not pencilled-in anycapacity increase to our current forecast.
■ Although we expect capacity increases in Kuwait,we note that previous delays to the Al-Zourrefinery project - again as result of political andbureaucratic pressures - could see downwardrevisions to our projections that currently includethe 615,000b/d greenfield development as well ascapacity expansions at existing plants.
• While investment in new refineries across theregion will lift our assessment of downstreaminfrastructure and therefore ratings for eachmarket, new capacity will do little to alter thefundamentals of a tightly-regulated downstreamsegment.
Qatar - Risk/Reward Ratings
Qatar Upstream Rating
Qatar, a member of OPEC, is also the world's largest supplier of liquefied natural gas (LNG) worldwide. It
also remains one of the world's top crude oil exporters. Its significant below-ground potential, as well as its
leadership of the natural gas industry, ensures that the country will remain a key global player for the
foreseeable future. The presence of non-state competitors and relatively stable political outlook support an
attractive business environment.
Massive proven natural gas reserves and its strong gas reserves to production ratio support Qatar's role as a
key player in the sector for the foreseeable future. Its oil reserves are significant as well, although its fields
are maturing. As such, the absence of new oil discoveries will see its proven oil reserves begin to decline
over the coming decade. However, the strong presence of foreign players and positive licensing terms also
make it an attractive investment location, making its overall outlook very positive.
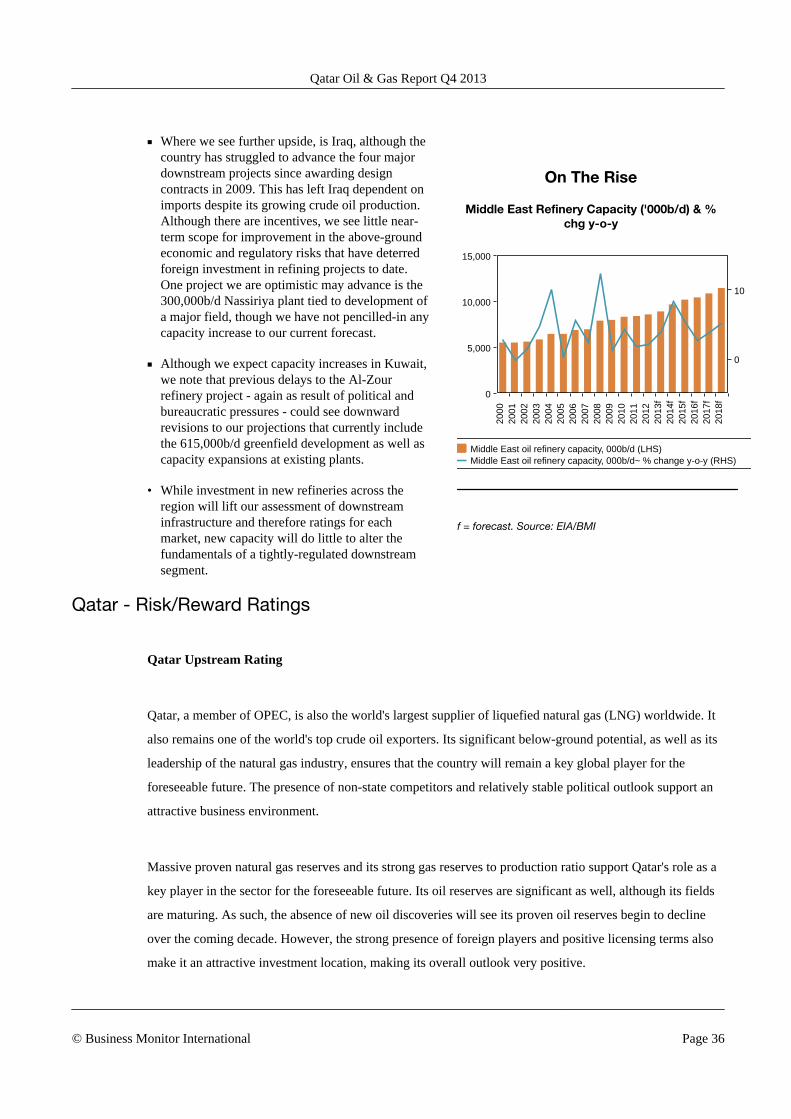
On The Rise
Middle East Refinery Capacity ('000b/d) & %chg y-o-y
Middle East oil refinery capacity, 000b/d (LHS)Middle East oil refinery capacity, 000b/d~ % change y-o-y (RHS)
2000
2001
2002
2003
2004
2005
2006
2007
2008
2009
2010
2011
2012
2013
f20
14f
2015
f20
16f
2017
f20
18f
0
5,000
10,000
15,000
0
10
f = forecast. Source: EIA/BMI
Qatar Oil & Gas Report Q4 2013
© Business Monitor International Page 36
The strong likelihood of governance and policy continuity, as well as relatively low levels of corruption,
especially for the Middle East region, reduces some of the country's political risks. The country receives an
average score for physical infrastructure, although there has been additional infrastructure investment in
recent years, particularly in support of LNG exports.
Qatar Downstream Rating
Meeting rapidly growing domestic energy demand going to be critical in the years ahead, particularly in
terms of gas production which is the primary input for the country's electricity. While oil consumption
remains low relative to production, it is rising rapidly as well. The downstream segment also remains
relatively closed off to foreign investment. Planned expansions of downstream capacity could bolster
Qatar's downstream rating.
Qatar Oil & Gas Report Q4 2013
© Business Monitor International Page 37
Market Overview
Qatar Energy Market Overview
Latest data from the Qatar Statistics Authority (QSA) show that the Qatari economy expanded by 6.2% in
real annual terms during Q113, decelerating slightly from growth of 7.5% and 6.6% in Q112 and Q412
respectively. The oil and gas sector continued the trend of weak growth seen since Q212, expanding by
0.8% year-on-year and remaining the worst performing sector of the economy. We expect the expansion of
the hydrocarbons sector to remain mild throughout Q413 and 2014, constrained by a small decline in oil
production and limited medium-term potential for liquefied natural gas (LNG) output growth. According to
data from the International Energy Agency, oil output averaged 0.73mn barrels per day (b/d) during the first
seven months of 2013, down by 3.0% from the same period of 2012.
The changing LNG market could push Qatar to shift strategies on gas. Firstly, we could see greater
investment in both petrochemicals and gas-to-liquids (GTL). These moves would diversify the revenue
stream away from gas and - if sufficient investment is made - could help offset any loss in profits as LNG
prices trend downward in lucrative Asian markets. Secondly, Qatar may seek alternative export
opportunities for gas; this could bring about an increase in existing pipeline connections within the Gulf
region, with countries such as Kuwait and the UAE set to see their gas import requirement rise over the
coming years.
Perhaps more boldly, Qatari officials at the Brooking Doha Energy Forum in April suggested the
development of a regional network that would link the Middle East with Southern Europe. Such a proposal
faces numerous geopolitical and financial hurdles, but given the financial resources of countries such as
Qatar, and Europe's interest in securing investment from the cash-rich region as well as reducing reliance on
Russian gas, the idea could enjoy a welcome reception.
With a moratorium on development of North Field, Qatar's energy strategy is in a period of transition.
Downstream expansion is consistent with that broader strategy as Qatar's role as the largest exporter of
LNG is increasingly under pressure from new suppliers. In response, Qatar has moved to boost cooperation
with foreign players for new discoveries, make new investment in petrochemicals and gas-to-liquids (GTL),
and boost investment abroad to capture a slice of emerging sources of new gas supplies.
An expansion of downstream capacity, although not a recent proposal, is consistent with Qatar's broader
aims to diversify and strengthen its energy position as it prepares for shifting realities on the LNG front.
Boosting refining capacity will allow Qatar to move up the value chain and capture higher revenues with
Qatar Oil & Gas Report Q4 2013
© Business Monitor International Page 38
export of refined products rather than unprocessed condensate alone, which already is sold at a premium on
international markets given its suitability for both refining and as feedstock for petrochemicals.
Although LNG capacity could rise via improvements to existing facilities, we do not currently anticipate
any expansion of capacity via the construction of additional trains given government policy. Indeed,
Qatar must operate in a changing gas market - highlighted by changing supply dynamics stemming from the
unconventional revolution and rising supplies of LNG from Australia, North America, East Africa and
Russia. The anticipation of rising supplies is strengthening the hand of LNG importers, who are keen to see
prices fall from recent record highs, particularly in Asia where demand for LNG is set to grow most.
In 2012, Qatar saw talks for LNG exports to India and Pakistan enter deadlock as both governments rejected
Doha's offers based on prices that were seen as too high. Qatar, which has been resistant to altering gas
prices indexed to oil, could come under pressure as alternative supplies enter the LNG market -
especially as the Asian gas market takes tentative steps toward greater liberalisation. Japan's efforts to
introduce an LNG futures market, as well as Tokyo and Seoul's joint efforts to use their combined
purchasing power to lower prices and ensure imports are indexed to alternative benchmarks such as Henry
Hub, could place further pressure on Qatari LNG pricing.
Qatar has also announced plans to boost investment in North America. The moves seek to take advantage
of the glut of low-priced gas that is likely to transform North America from an importer into a
supplier to the global market. We believe the move will benefit not only upstream and downstream
investment in North America, but will help Qatar remain a key player in the global LNG market, even as
alternative supplies start to come online.
The response may allow Qatar to weather an environment of increased supply and even to profit from the
rise of competitors in the global market. The most recent was Qatar Petroleum International (QPI)'s
announcement that it would team-up with the UK's Centrica to spend CAN1bn (US
$976mn) on acquiring Suncor Energy's conventional natural gas assets across Alberta, north-
eastern British Colombia and southern Saskatchewan. Centrica estimates proved plus probable gas reserves
at nearly 30bn cubic meters (bcm), but contingent resources may be closer to 84bcm given prospective
but undeveloped acreage.
The acquisition will help Centrica to meet local demand via its North American subsidiary, but importantly
for Qatar, will give QPI a foothold in the Canadian gas market, where the number of planned and
proposed LNG projects is growing. Indeed, in making the move, Qatar announced this play in Canada
would be the first of numerous future investments.
Qatar Oil & Gas Report Q4 2013
© Business Monitor International Page 39
Following hot on the heels of the deal between QPI and US super major ExxonMobil to 'assess jointly
unconventional gas resources in North America and global opportunities' in LNG, Qatar should be taken at
its word. Exxon, with a significant presence in the gas and LNG market in Qatar, is now deepening its
global cooperation with Doha. The duo have already partnered on the Gulf Coast-based Golden Pass LNG
terminal, with an application currently pending with US regulators to allow exports beyond those countries
with which the US has Free Trade Agreements (FTA).
Overview/State Role
The oil and gas sector is state-controlled, with Qatar Petroleum responsible for exploration and production
(E&P). NODCO is in charge of refining and distribution. Qatargas and RasGas are responsible for the
production and marketing of LNG. The state controls virtually all aspects of the energy sector, sets policy
and determines domestic pricing. Qatar Petroleum itself accounts for 50% of national oil production and
almost 40% of gas volumes.
Licensing And Regulation
Following a bloodless coup in 1995, Qatar initiated policies aimed at increasing oil production, locating
additional oil reserves and investing in advanced oil recovery systems to extend the life of existing fields.
The government also improved the terms of exploration and production (E&P) contracts and production
sharing agreements (PSAs). The aim was to encourage international oil companies (IOCs) to improve oil
recovery in producing fields and to explore for new oil deposits. There has been considerable success in the
field of natural gas, making it the world's leader in LNG, but there is less IOC involvement in oil. Major
foreign oil companies now involved in Qatar include ExxonMobil, Royal Dutch Shell, Maersk Oil &
Gas, Japan's Marubeni and Mitsui, Occidental Petroleum and Total.
Government Policy
Qatar is a member of OPEC, making it such that its oil production levels are subject to the quotas and
policies of the organization. However, because condensates and natural gas liquids (NGLs) are not
considered under the auspices of OPEC, their share of production in Qatar has been on the rise in recent
years. Indeed, according to the EIA, condensate and NGL production almost doubled from 2007 to 2010,
from 287,000 barrels per day (bbl/d) to 567,000bbl/d.
Qatar Petroleum remains the dominant player in the country's natural gas sector. Its preference for large-
scale projects with an eye to either boosting the country's exports or facilitating a deeper utilisation of the
country's natural resources by its industries allows the government to favour partnerships with the world's
Qatar Oil & Gas Report Q4 2013
© Business Monitor International Page 40
top integrated oil companies with expertise in mega-projects. QP does maintain, however, a majority share
in all of the country's projects.
International Energy Relations
While Qatar has historically tended to focus on investing in its domestic energy resources, companies such
as QP are looking to develop a higher-profile international presence. This links into a more general Qatari
policy of raising the country's international profile both economically and diplomatically. This policy was
demonstrated by developments in March 2010 when Russia and France both announced potential energy
sector cooperation with Qatar.
Qatar is looking to diversify its customer base for LNG sales, with a significant amount of new demand
coming from Asia. Indeed, in 2012 the country sold LNG to 23 countries. This represents a significant
increase from the eight countries with which Qatar did business in 2007.
Middle East
The Dolphin pipeline which currently supplies exports to Oman and the UAE from Qatar could see
investment in new infrastructure to support additional supplies. However, the current steep discount at
which gas is sold means that the actual delivery of any additional volumes will likely be dependent upon an
increase in prices as Qatar looks to shift strategies on gas in line with a changing liquefied natural
gas market. Under current plans, a new compression facility at Ras Laffan would allow Dolphin to
economically deliver volumes closer to full capacity from 2015. The cost at which any gas would be sold
will be key to determining whether a capacity expansion would be utilised. Currently, gas is sold at a
significant discount, with customers in the UAE and Oman reportedly paying just US$1.30 per mn British
thermal units (BTU), compared to the US$17/mnBTU that Qatari gas was fetching in Asia at the time of
writing.
Asia
In 2012, Qatar exported 47% of its total LNG supplies to Asia, with the leading importers being Japan,
India and South Korea, respectively. 2013 will also see the delivery of Qatar's first cargoes of LNG to
Singapore, and new sales agreements have reportedly been signed with Thailand as well. The willingness of
Asian countries to sign long-term supply contracts also supports Qatar's preferred method of supply, with an
anticipated decline in spot market supplies in the coming years as a result of new long-term agreements
absorbing an increasing amount of the country's production.
Qatar Oil & Gas Report Q4 2013
© Business Monitor International Page 41
Europe
Given the desire of many European countries to reduce their reliance on Russian gas imports, Qatar has
sensed an opportunity for new markets for its LNG cargoes. In 2009, Qatar signed a supply agreement with
Poland, and the Gulf state is also looking to build an LNG terminal on Greece's Aegean coast, for re-export
by pipeline to the Italian market. Greece received its first cargo of Qatari LNG in May 2011 at the
Revithoussa terminal. The customer was Greek public gas supply DEPA.
In 2012, Europe imported 42% of Qatari LNG production, with the UK being the largest individual
importer. In addition to having a long-term contract for 12mn tonnes per annum (tpa), Britain also
purchased additional volumes on the spot market. Italy, Spain, and France are also significant Qatari LNG
importers.
However, given the country's preference for long-term supply contracts, an increasing amount of which are
sent to Asia, there will be a reduction in LNG spot cargoes available to European importers. Indeed, in
2014, Qatar expects to reduce the sale of LNG spot cargoes by 40%.
Latin America
Qatargas has signed a 20-year LNG supply deal with Argentina's Enarsa, marking the company's first
supply deal in Latin America, Qatargas announced on June 29 2011. The deal will see Qatar start shipping
as much as 6.9bn cubic metres (bcm) of LNG to the Latin American country in 2014.
Qatar Oil & Gas Report Q4 2013
© Business Monitor International Page 42
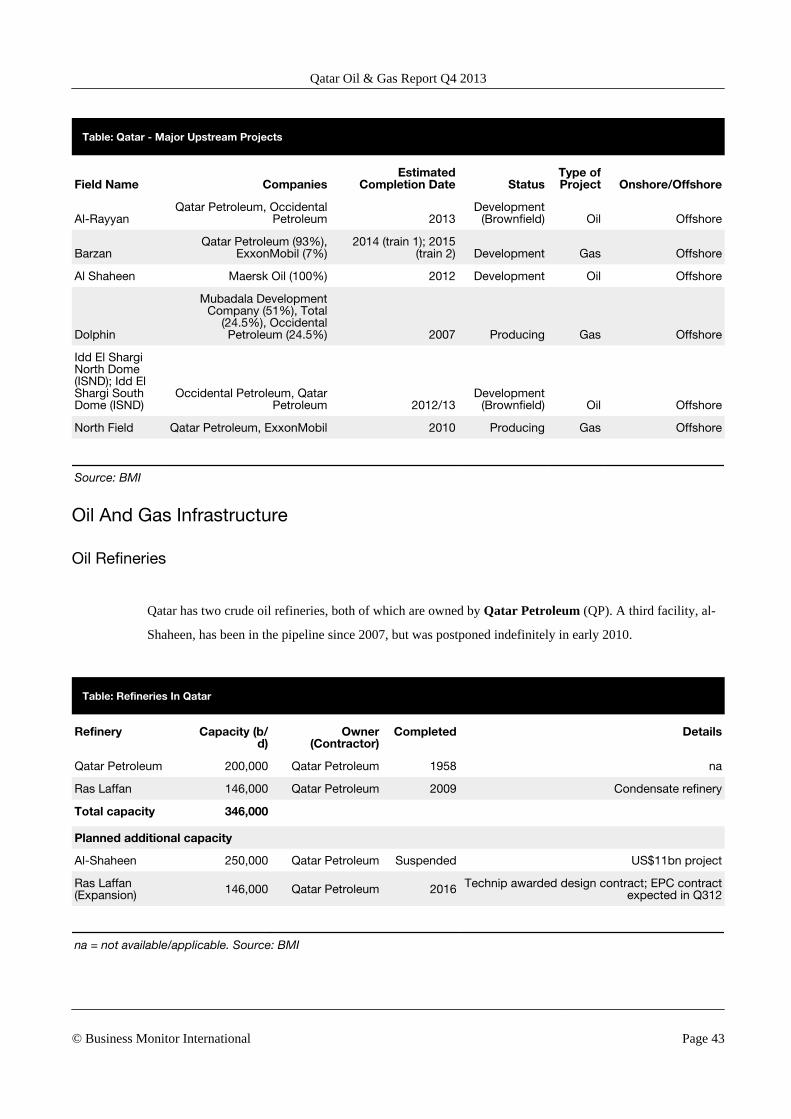
Table: Qatar - Major Upstream Projects
Field Name CompaniesEstimated
Completion Date StatusType ofProject Onshore/Offshore
Al-RayyanQatar Petroleum, Occidental
Petroleum 2013Development
(Brownfield) Oil Offshore
BarzanQatar Petroleum (93%),
ExxonMobil (7%)2014 (train 1); 2015
(train 2) Development Gas Offshore
Al Shaheen Maersk Oil (100%) 2012 Development Oil Offshore
Dolphin
Mubadala DevelopmentCompany (51%), Total
(24.5%), OccidentalPetroleum (24.5%) 2007 Producing Gas Offshore
Idd El ShargiNorth Dome(ISND); Idd ElShargi SouthDome (ISND)
Occidental Petroleum, QatarPetroleum 2012/13
Development(Brownfield) Oil Offshore
North Field Qatar Petroleum, ExxonMobil 2010 Producing Gas Offshore
Source: BMI
Oil And Gas Infrastructure
Oil Refineries
Qatar has two crude oil refineries, both of which are owned by Qatar Petroleum (QP). A third facility, al-
Shaheen, has been in the pipeline since 2007, but was postponed indefinitely in early 2010.
Table: Refineries In Qatar
Refinery Capacity (b/d)
Owner(Contractor)
Completed Details
Qatar Petroleum 200,000 Qatar Petroleum 1958 na
Ras Laffan 146,000 Qatar Petroleum 2009 Condensate refinery
Total capacity 346,000
Planned additional capacity
Al-Shaheen 250,000 Qatar Petroleum Suspended US$11bn project
Ras Laffan(Expansion) 146,000 Qatar Petroleum 2016 Technip awarded design contract; EPC contract
expected in Q312
na = not available/applicable. Source: BMI
Qatar Oil & Gas Report Q4 2013
© Business Monitor International Page 43
Qatar Petroleum Refinery
The first refinery, known as the Qatar Petroleum Refinery, was built in 1958 and is capable of processing
both crude oil and condensate. The QP refinery was last expanded in 2001, giving it a total capacity of
200,000 barrels per day (b/d). The 100%-state owned plant mainly produces liquefied petroleum gas (LPG),
premium gasoline, super gasoline, jet fuel, diesel and marine fuel oil, as well as large quantities of naphtha
for petrochemical operations. Over half of the refinery's products are supplied to the Gulf region, although
much of the jet fuel is sold to Europe and the bulk of the naphtha is exported to East Asia for further
processing.
Ras Laffan Refinery
The 146,000b/d Ras Laffan plant, which became operational in late-September 2009 (about a year behind
schedule), is the country's second refinery and the first designed exclusively to process condensate, the by-
product of Qatar's massive gas industry. The Ras Laffan condensate refinery is operated by a consortium
comprising state-run Qatar Petroleum (51%), oil majors ExxonMobil (10%) and Total (10%), and four
Japanese companies: Cosmo Oil (10%), Idemitsu Kosan (10%), Mitsui (4.5%) and Marubeni (4.5%).
The Japanese companies farmed in to the project in 2006 as Japan was expected to be one of the main
markets for Ras Laffan's oil products.
At full capacity the refinery produces 52,000b/d of kerosene and jet fuel, 24,000b/d of gas oil (heating fuel),
as well as other clean-burning middle distillates. The facility is fed from all three main Qatari upstream
projects: gas fields run by QP and RasGas and the Al-Khaleej condensate complex. The second phase of
the Ras Laffan refinery is scheduled be completed by 2016, and would boost output to 292,000b/d, with
most of the produced fuels likely destined for the Japanese market. Our forecasts see Ras Laffan's capacity
coming fully on stream by 2017.
Al-Shaheen Refinery (Proposed)
QP had been considering building a third facility, although construction has been indefinitely delayed. The
250,000b/d al-Shaheen refinery was slated for construction in the Mesaieed Industrial City in south-eastern
Qatar. The US$11bn refinery was designed to process heavy sour crude from al-Shaheen offshore oil field,
which would be supplied to the facility by a 200km pipeline. Front end engineering and design (FEED)
work was carried out by French services provider Technip between 2007 and 2009. The first phase was
expected to involve the construction of a crude distillation unit and a hydrocracker, while the second phase
Qatar Oil & Gas Report Q4 2013
© Business Monitor International Page 44
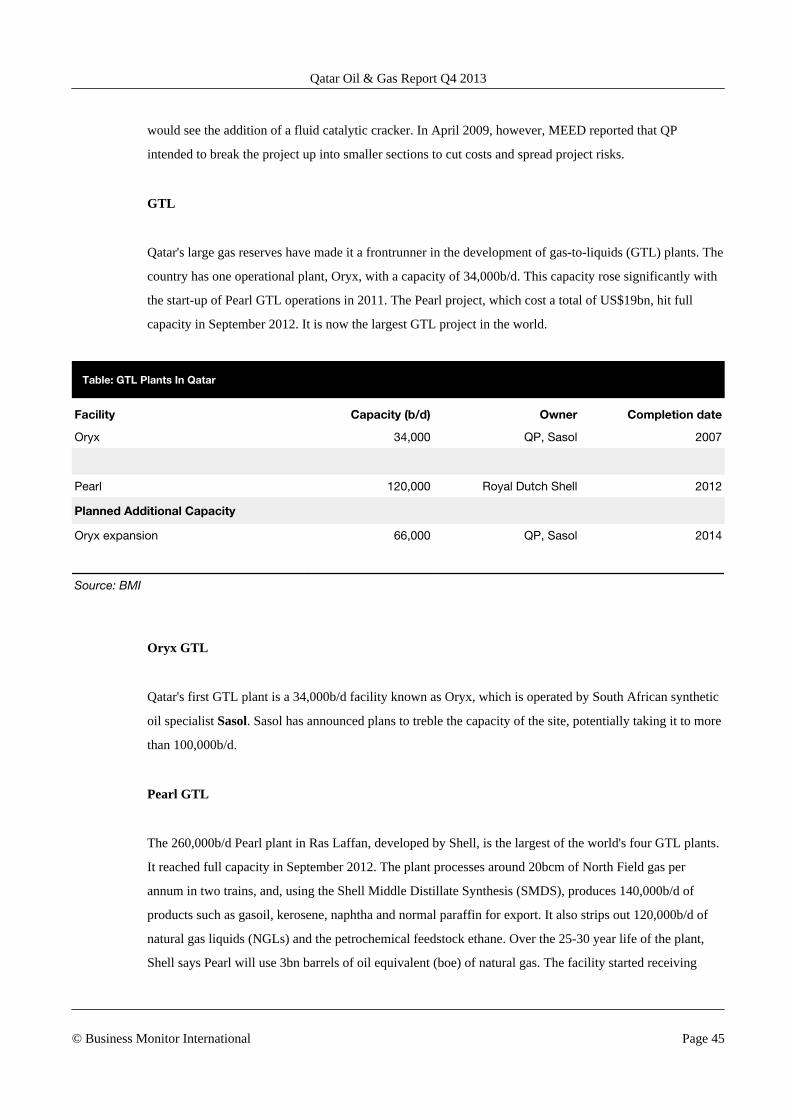
would see the addition of a fluid catalytic cracker. In April 2009, however, MEED reported that QP
intended to break the project up into smaller sections to cut costs and spread project risks.
GTL
Qatar's large gas reserves have made it a frontrunner in the development of gas-to-liquids (GTL) plants. The
country has one operational plant, Oryx, with a capacity of 34,000b/d. This capacity rose significantly with
the start-up of Pearl GTL operations in 2011. The Pearl project, which cost a total of US$19bn, hit full
capacity in September 2012. It is now the largest GTL project in the world.
Table: GTL Plants In Qatar
Facility Capacity (b/d) Owner Completion date
Oryx 34,000 QP, Sasol 2007
Pearl 120,000 Royal Dutch Shell 2012
Planned Additional Capacity
Oryx expansion 66,000 QP, Sasol 2014
Source: BMI
Oryx GTL
Qatar's first GTL plant is a 34,000b/d facility known as Oryx, which is operated by South African synthetic
oil specialist Sasol. Sasol has announced plans to treble the capacity of the site, potentially taking it to more
than 100,000b/d.
Pearl GTL
The 260,000b/d Pearl plant in Ras Laffan, developed by Shell, is the largest of the world's four GTL plants.
It reached full capacity in September 2012. The plant processes around 20bcm of North Field gas per
annum in two trains, and, using the Shell Middle Distillate Synthesis (SMDS), produces 140,000b/d of
products such as gasoil, kerosene, naphtha and normal paraffin for export. It also strips out 120,000b/d of
natural gas liquids (NGLs) and the petrochemical feedstock ethane. Over the 25-30 year life of the plant,
Shell says Pearl will use 3bn barrels of oil equivalent (boe) of natural gas. The facility started receiving
Qatar Oil & Gas Report Q4 2013
© Business Monitor International Page 45
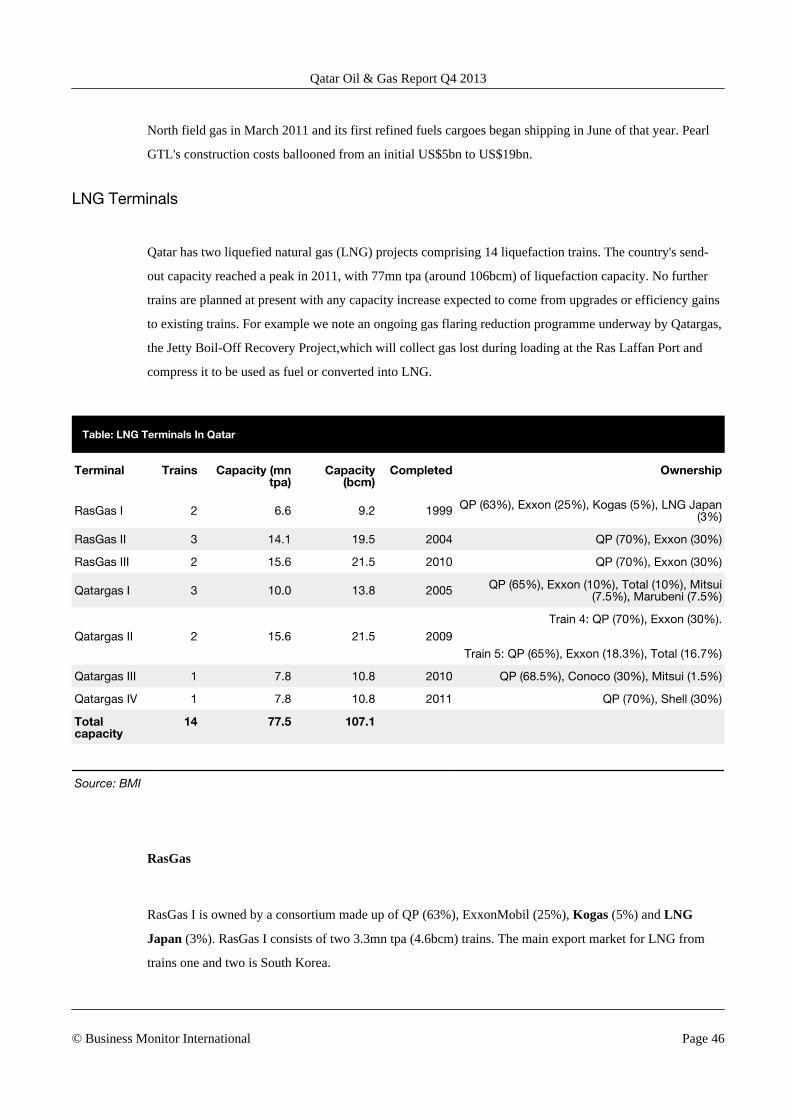
North field gas in March 2011 and its first refined fuels cargoes began shipping in June of that year. Pearl
GTL's construction costs ballooned from an initial US$5bn to US$19bn.
LNG Terminals
Qatar has two liquefied natural gas (LNG) projects comprising 14 liquefaction trains. The country's send-
out capacity reached a peak in 2011, with 77mn tpa (around 106bcm) of liquefaction capacity. No further
trains are planned at present with any capacity increase expected to come from upgrades or efficiency gains
to existing trains. For example we note an ongoing gas flaring reduction programme underway by Qatargas,
the Jetty Boil-Off Recovery Project,which will collect gas lost during loading at the Ras Laffan Port and
compress it to be used as fuel or converted into LNG.
Table: LNG Terminals In Qatar
Terminal Trains Capacity (mntpa)
Capacity(bcm)
Completed Ownership
RasGas I 2 6.6 9.2 1999 QP (63%), Exxon (25%), Kogas (5%), LNG Japan(3%)
RasGas II 3 14.1 19.5 2004 QP (70%), Exxon (30%)
RasGas III 2 15.6 21.5 2010 QP (70%), Exxon (30%)
Qatargas I 3 10.0 13.8 2005 QP (65%), Exxon (10%), Total (10%), Mitsui(7.5%), Marubeni (7.5%)
Qatargas II 2 15.6 21.5 2009Train 4: QP (70%), Exxon (30%).
Train 5: QP (65%), Exxon (18.3%), Total (16.7%)
Qatargas III 1 7.8 10.8 2010 QP (68.5%), Conoco (30%), Mitsui (1.5%)
Qatargas IV 1 7.8 10.8 2011 QP (70%), Shell (30%)
Totalcapacity
14 77.5 107.1
Source: BMI
RasGas
RasGas I is owned by a consortium made up of QP (63%), ExxonMobil (25%), Kogas (5%) and LNG
Japan (3%). RasGas I consists of two 3.3mn tpa (4.6bcm) trains. The main export market for LNG from
trains one and two is South Korea.
Qatar Oil & Gas Report Q4 2013
© Business Monitor International Page 46
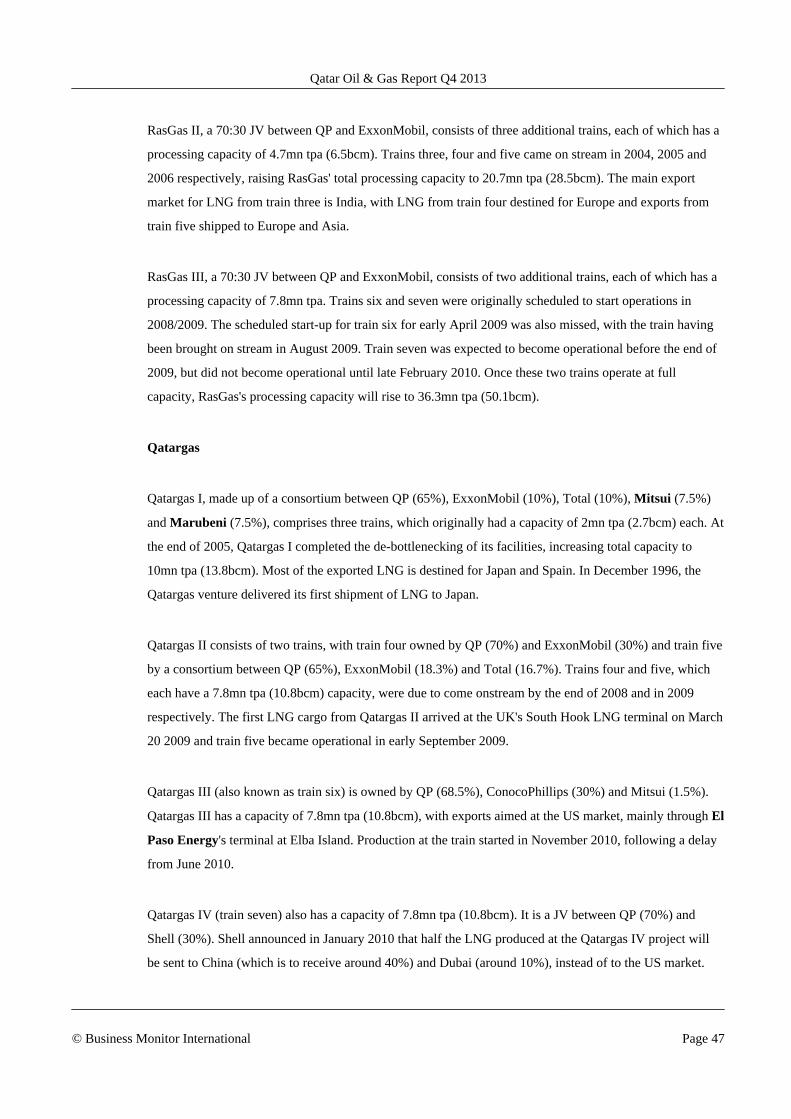
RasGas II, a 70:30 JV between QP and ExxonMobil, consists of three additional trains, each of which has a
processing capacity of 4.7mn tpa (6.5bcm). Trains three, four and five came on stream in 2004, 2005 and
2006 respectively, raising RasGas' total processing capacity to 20.7mn tpa (28.5bcm). The main export
market for LNG from train three is India, with LNG from train four destined for Europe and exports from
train five shipped to Europe and Asia.
RasGas III, a 70:30 JV between QP and ExxonMobil, consists of two additional trains, each of which has a
processing capacity of 7.8mn tpa. Trains six and seven were originally scheduled to start operations in
2008/2009. The scheduled start-up for train six for early April 2009 was also missed, with the train having
been brought on stream in August 2009. Train seven was expected to become operational before the end of
2009, but did not become operational until late February 2010. Once these two trains operate at full
capacity, RasGas's processing capacity will rise to 36.3mn tpa (50.1bcm).
Qatargas
Qatargas I, made up of a consortium between QP (65%), ExxonMobil (10%), Total (10%), Mitsui (7.5%)
and Marubeni (7.5%), comprises three trains, which originally had a capacity of 2mn tpa (2.7bcm) each. At
the end of 2005, Qatargas I completed the de-bottlenecking of its facilities, increasing total capacity to
10mn tpa (13.8bcm). Most of the exported LNG is destined for Japan and Spain. In December 1996, the
Qatargas venture delivered its first shipment of LNG to Japan.
Qatargas II consists of two trains, with train four owned by QP (70%) and ExxonMobil (30%) and train five
by a consortium between QP (65%), ExxonMobil (18.3%) and Total (16.7%). Trains four and five, which
each have a 7.8mn tpa (10.8bcm) capacity, were due to come onstream by the end of 2008 and in 2009
respectively. The first LNG cargo from Qatargas II arrived at the UK's South Hook LNG terminal on March
20 2009 and train five became operational in early September 2009.
Qatargas III (also known as train six) is owned by QP (68.5%), ConocoPhillips (30%) and Mitsui (1.5%).
Qatargas III has a capacity of 7.8mn tpa (10.8bcm), with exports aimed at the US market, mainly through El
Paso Energy's terminal at Elba Island. Production at the train started in November 2010, following a delay
from June 2010.
Qatargas IV (train seven) also has a capacity of 7.8mn tpa (10.8bcm). It is a JV between QP (70%) and
Shell (30%). Shell announced in January 2010 that half the LNG produced at the Qatargas IV project will
be sent to China (which is to receive around 40%) and Dubai (around 10%), instead of to the US market.
Qatar Oil & Gas Report Q4 2013
© Business Monitor International Page 47
Qatargas started production from Train 7 at Qatargas IV in February 2011. The train increases Qatargas'
total capacity to 42mn tpa.
Gas Pipelines
Qatar has one gas export pipeline through which it supplies the UAE and Oman. The pipeline is owned and
operated by Dolphin Energy, a JV between the state-owned Mubadala Development Company (51%),
France's Total (24.5%) and the US's Occidental Petroleum (24.5%). This is the first cross-border gas project
in the Arab Gulf region.
The Dolphin Energy gas pipeline, the Gulf Cooperation Council (GCC)'s first regional gas project, could
see a capacity expansion according to Total's senior vice president for the Middle East, Arnauld
Breuillac. The pipeline, which currently connects Qatar to Abu Dhabi and onwards to Oman has a capacity
of 90mn cubic metres per day (Mcm/d) - or 33bn cubic metres (bcm) per annum. However, current sales
agreements and existing compression facilities only support volumes of just over 60Mcm/d or 23bcm per
year. Under current plans, a new compression facility at Ras Laffan would allow Dolphin to economically
deliver volumes closer to full capacity from 2015. The pipeline has seen exports rise temporarily to meet
demand in excess of contracted capacity, but only for short periods of time
Dolphin Energy supplies the UAE with gas from Qatar via a subsea export pipeline connecting the
company's Ras Laffan gas processing plant in Qatar with the receiving facilities at Taweelah. This 48-inch
pipeline is 364km long, with a maximum underwater depth of 50m. Construction of the pipeline was
successfully completed in August 2006, with Italy's Saipem the contractor.
Dolphin started supplying the UAE with gas in February 2008 and Oman in October 2008. Most of the gas
is used to feed the UAE's burgeoning heavy industries, petrochemicals and water desalination plants as well
as to maintain production at maturing oil fields through gas injection. Around 2bcm is exported on to Oman.
The long-term customers for Dolphin gas from Qatar are ADWEA (Abu Dhabi Water & Electricity
Authority), UWEC (Union Water & Electricity Authority), DUSUP (Dubai Supply Authority) and Oman
Oil Company (OOC). Each has signed a 25-year gas supply agreement with Dolphin Energy.
Qatar is one source of gas for the proposed subsea gas export pipeline from the Middle East to India. The
South Asian Gas Enterprise (SAGE) has been working on the project, which was originally proposed in the
1990s, for over three years, according to its director Subodh Kumar Jain in August 2009. In 2008, a
technical and commercial feasibility report was undertaken by INTECSEA, which found that the project
would be technically feasible. Gas for the US$3bn project would be sourced from Qatar, Iran and possibly
Qatar Oil & Gas Report Q4 2013
© Business Monitor International Page 48
Iraq, and transported to a gas-gathering system on the eastern coast of the Arabian Peninsula from where
deepwater gas pipelines would cross the Arabian Sea to India's west coast.
The pipelines would reach a maximum depth of 3,500m with a total length of about 1,000km, according to
Jain. The pipelines would each transport 226.5bcm over a 25-year period, suggesting an annual supply per
pipeline of around 9bcm per year. According to the project timeline, FEED and detailed studies will be
ongoing through 2013, and installation will occur between 2015 and 2017. First gas, under proposed plans,
is targeted for 2017. However to date no announcements have been made that suggest the project is slated to
move forward.
Qatar Oil & Gas Report Q4 2013
© Business Monitor International Page 49
Competitive Landscape
Executive Summary
■ The main government vehicle is Qatar Petroleum (QP), which owns all downstream oil interests,negotiates exploration and production (E&P) agreements, has shares in upstream projects and is involvedin liquefied natural gas (LNG) projects, and gas-to-liquid (GTL) schemes. It is responsible for about 30%of oil and 50% of gas production.
■ International oil company (IOC) upstream involvement is extensive. Foreign groups are active in oilproduction, gas field development, LNG projects, as well as GTL and petrochemicals schemes.
■ Maersk Oil operates the al-Shaheen field in Block 5 and has a PSA for the Block 5 extension area.
■ Present in Qatar since 1936, Total has a 20% interest in the upstream part of the Qatargas 1, a 10%interest in the Qatargas 1 liquefaction plant JV, a 24.5% stake in Dolphin Energy and a 16.7% stake inQatargas 2 Train 5 JV. Total's Qatari production averaged 139,000 barrels of oil equivalent per day (boe/d) in 2012. Total has signed a new agreement with QP under which the two companies will continue todevelop the Al Khalij for the next 25 years. The existing exploration and production sharing agreement,signed in 1989, will expire in early 2014.
■ QP has formally announced a joint venture with private players, led by Total, for the construction of a US$1.5bn condensate refinery at Ras Laffan. At 146,000 barrels per day (b/d), the Ras Laffan 2 (LR2) willdouble the capacity of the existing Laffan Refinery (LR1) when it comes online in H216. The plant willhave a production capacity of 60,000b/d of naphtha; 53,000b/d of jet fuel; 24,000b/d of gas oil; and9,000b/d of liquid petroleum gas (LPG).
■ Occidental (Oxy) has expanded the ISND field development programme, which is expected to result inthe recovery of approximately 145mn additional gross barrels (bbl) of oil. It has been reported that Oxy isconsidering the sale of a 30-40% stake in its entire Middle Eastern business.
■ ExxonMobil has a 25% interest in LNG company RasGas I and 30% in RasGas II. It also has a 10%interest in Qatargas I and a 30% stake in Qatargas II. It also participates in the Al Khaleej Gas project,the first phase of which became operational in 2005 and the second in December 2009.
■ Qatargas I is a consortium of QP, Total, ExxonMobil, Mitsui and Marubeni. Train four of Qatargas IIbelongs to QP and ExxonMobil, with train five of Qatargas II being owned by QP, Exxon and Total.Qatargas III is held by QP, ConocoPhillips and Mitsui. RasGas comprises QP, ExxonMobil, Kogas,Itochu and LNG Japan.
■ Sasol, Shell, ConocoPhillips and Marathon Oil are involved in developing a series of GTL facilities,with the 34,000b/d Sasol/QP Oryx plant entering production in March 2007. Shell, in July 2007, launchedthe 140,000b/d Pearl GTL project. It reached full capacity in September 2012, and is now the largestGTL plant in the world.
■ In late-August 2009, QP signed a 25-year EPSA with Chinese explorer CNOOC Middle East, asubsidiary of CNOOC, for Block BC in the deep pre-Khuff reservoirs.
■ Japan's JX Nippon Oil and Gas Exploration (NOEX) entered Qatar's upstream segment with thesigning of a 30-year exploration and production-sharing agreement (EPSA) with QP for the 6,173 sq kmoffshore Block A.
■ Germany's Winterhsall and QP have announced exploration success at Block 4 North offshore Qatarafter four years of hunting. The discovery in depths of 70m is estimated to contain as much as 70bcm ofgas and is the country's first new find in 42 years.
Qatar Oil & Gas Report Q4 2013
© Business Monitor International Page 50
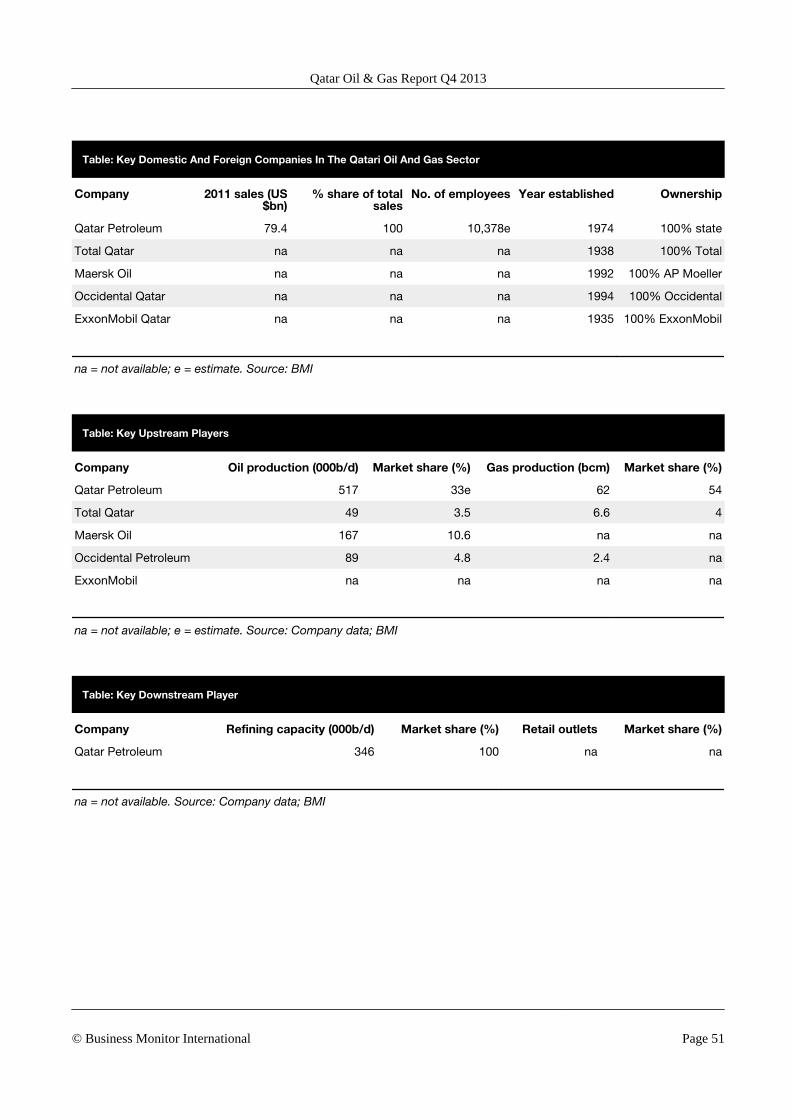
Table: Key Domestic And Foreign Companies In The Qatari Oil And Gas Sector
Company 2011 sales (US$bn)
% share of totalsales
No. of employees Year established Ownership
Qatar Petroleum 79.4 100 10,378e 1974 100% state
Total Qatar na na na 1938 100% Total
Maersk Oil na na na 1992 100% AP Moeller
Occidental Qatar na na na 1994 100% Occidental
ExxonMobil Qatar na na na 1935 100% ExxonMobil
na = not available; e = estimate. Source: BMI
Table: Key Upstream Players
Company Oil production (000b/d) Market share (%) Gas production (bcm) Market share (%)
Qatar Petroleum 517 33e 62 54
Total Qatar 49 3.5 6.6 4
Maersk Oil 167 10.6 na na
Occidental Petroleum 89 4.8 2.4 na
ExxonMobil na na na na
na = not available; e = estimate. Source: Company data; BMI
Table: Key Downstream Player
Company Refining capacity (000b/d) Market share (%) Retail outlets Market share (%)
Qatar Petroleum 346 100 na na
na = not available. Source: Company data; BMI
Qatar Oil & Gas Report Q4 2013
© Business Monitor International Page 51
Company ProfileQatar Petroleum
SWOT Analysis
Strengths ■ Major domestic oil and gas producer
■ Unrivalled access to exploration acreage
■ Well established partnerships with international oil companies (IOCs)
■ Substantial near-term volume growth
■ Rapid expansion of liquefied natural gas (LNG), gas-to-liquids (GTL) and
petrochemicals
Weaknesses ■ Limited financial or operational freedom
■ Some cost and efficiency disadvantages
■ Rising investment requirement
Opportunities ■ Considerable untapped gas export potential
■ Rising domestic energy consumption
■ Large areas of under-explored territory
Threats ■ Competition in regional LNG supply
■ Changes in OPEC/national energy policy
Company Overview QP is active in all segments of the energy chain and participates in all major oil and gas
developments. The firm's exploration and production (E&P) activities are centred on the
onshore Dukhan oil field and the offshore Bul Hanine and Maydan Mahzam oil fields.
The state firm also holds stakes in seven offshore fields that are being developed under
production sharing agreements (PSAs). Gas resources are centred on the giant North
Field. QP operates all of the country's 200,000 barrel per day (b/d) crude oil refining
capacity and brought the 146,000b/d Ras Laffan refinery on stream in 2009.
Qatar Oil & Gas Report Q4 2013
© Business Monitor International Page 52
Strategy The government is planning a massive expansion of its refinery capacity. Qatar expects
to earn more per barrel of crude oil produced if it can export refined products and
petrochemicals, as well as creating private sector jobs.
QP is looking to develop a higher-profile international presence through the
establishment of an investment arm to finance energy projects across the globe. For
starters, Qatar Petroleum International will look at investing in refineries in the energy-
hungry markets of India and China, as well as building LNG terminals in Europe and
across the Atlantic in the US.
Qatar's crude oil production will rise to 800,000b/d by 2017 due to higher investments
and development plans in the country, according to a Qatar National Bank (QNB) report.
In its 2010-14 development plan, QP budgeted US$6.6bn for investment in crude oil
projects.
The Barzan gas field is a large upstream project that has been pursued by QP. First
engineering contracts were awarded in late 2010. Output from the field is expected at
14.5bn cubic metres (bcm) per annum. QP holds a 93% stake in the project, working
alongside joint venture (JV) partner ExxonMobil with the remaining 7%.
QP has raised US$10.4bn in financing for the Barzan scheme. The company will fund
up to 30% of the project through equity, while the rest will be arranged through a
syndicated loan of around US$7.2bn. The loan includes a US$3.34bn commercial bank
facility, a US$2.55bn export credit agency financing and a US$850mn Islamic facility. In
addition, ExxonMobil will offer part of the senior debt. The first and second production
lines are scheduled to come online in 2014 and 2015 respectively.
Total of France has signed a new agreement with QP, under which the two companies
will continue to develop the Al Khalij oil field offshore Qatar for the next 25 years. The
existing exploration and PSA, signed in 1989, will expire in early 2014. The Al Khalij field
was discovered by Total in 1991 and commenced oil production in 1997. Under the
terms of the deal, QP will own a 60% stake in the oil field, with Total holding the
remaining 40%.
QP has formally announced a joint venture with private players led by Total for the
construction of US$1.5bn condensate refinery at Ras Laffan. At 146,000b/d, the Ras
Laffan 2 (LR2) will double the capacity of the existing Laffan Refinery (LR1) when it
comes online in H216. The plant will have a production capacity of 60,000b/d of
naphtha; 53,000b/d of jet fuel; 24,000b/d of gas oil; and 9,000b/d of liquid petroleum
gas (LPG).
The project will developed by QP (84%) and Total (10%), with Japanese firms Idemitsu
Kosan, Cosmo Oil, Marubeni and Mitsui holding the remainder. Supplied from the North
Field, the combined 300,00b/d capacity of LR1 and LR2 will make the plant the largest
condensate refinery developed to date.
Maersk Oil is in discussions with QP over an extension to a PSC for the al-Shaheen oil
field offshore Qatar, reports Reuters. The company is seeking a 13-year extension to
Qatar Oil & Gas Report Q4 2013
© Business Monitor International Page 53
2030. The field's crude production could increase from the current 300,000b/d to
400,000b/d in 2017, one source said. Additionally, new equipment including a floating
storage and offloading unit is likely to be deployed at the field if the contract is
extended.
QP expects to borrow heavily in 2014 in order to fund new industrial projects, according
to its head of project finance, Meshaal al-Mahmoud. The company will approach the
banking and capital markets, and will also consider conventional bonds and sukuk. The
funds will be used for a planned aromatics plant in Ras Laffan and two petrochemical
plants, al-Mahmoud added. The company plans to carry out downstream projects
worth US$25bn during the next five years.
QP and Royal Dutch Shell are targeting a 2018 completion date for the Al-Karaana
petrochemical project in Ras Laffan, Qatar, after awarding a contract for front end
design work to US Fluor Corporation, reports Zawya. The US$6.5bn project, 80%
owned by QP and 20% by Shell, will comprise a steam cracker, a mono ethylene glycol
(MEG) plant, a linear alpha olefin unit and an oxo alcohol unit.
Qatar Petroleum International (QPI) has announced that it will team-up with the UK's
Centrica to spend CAN1bn (US$976mn) on acquiring Suncor Energy's conventional
natural gas assets across Alberta, north-eastern British Colombia and southern
Saskatchewan. Centrica estimates proved plus probable gas reserves at nearly 30bcm,
but contingent resources may be closer to 84bcm given prospective but undeveloped
acreage.
ExxonMobil has signed an agreement with QPI to move forward with construction of a
US$10bn natural gas export terminal in Texas. The project will involve installing
liquefaction equipment at an existing import facility in Sabine Pass, Texas, according to
an e-mailed statement from Golden Pass Products, a subsidiary formed by the two
companies. It won permission in 2012 to export the fuel to nations with free-trade
agreements with the US and is awaiting approval to send the fuel to all other countries.
Exxon and QPI plan to ship as much as 15.6mn tpa of gas annually from the Golden
Pass facility, according to the statement. 'This agreement sets out a highly competitive
commercial blueprint for Golden Pass Products, with a commitment that builds on the
unique combined strengths of QPI and Exxon Mobil through the global downstream
LNG value chain,' Bill Collins, president of Golden Pass, said in the statement.
The country's political leaders are believed to favour more freedom for QP so that the
firm can better compete against its national oil company (NOC) peers around the world.
Plans could see QP freed from direct control by the energy ministry in an effort to allow
the company to be more reflexive and responsive amid changes at home and abroad.
Under the new structure, QP would accelerate its recent push to move beyond Qatar
and into more upstream and downstream projects outside its home market.
With no plans for an expansion of export capacity, Qatar is at risk of ceding its place as
the world's leading LNG exporter by the end of the decade. The entrance of new
Qatar Oil & Gas Report Q4 2013
© Business Monitor International Page 54
supplies of LNG to the market will increase competition and give greater bargaining
power to importers who are eager to see relief in their import bills - which Qatar has to
date proven reluctant to offer as it insists for oil-indexed long-term contracts to remain.
However, with reports that QP was considering a bid for RWE Dea - the oil and gas
division of German utility RWE - growth could accelerate under an acquisition-led
strategy. Interestingly, much of RWE Dea's most prospective acreage is in Egypt, a
country where Qatar has recently sought to cement its political influence. RWE has
struggled to offload its oil and gas business, with insiders revealing in June that that
only Wintershall had expressed serious interest but at a lower price than the EUR4.5bn
(US$5.9bn) executives had hoped to earn.
Acquiring RWE Dea would quickly give Qatar a notable global footprint as producing
and prospective upstream assets are added to its portfolio. QP may have the funds for
such a deal. However, the state-owned firm will likely lack the managerial and technical
capacity to manage a global portfolio on its own.
Occidental Petroleum (Oxy) has announced that its Qatari subsidiary has signed a co-
development agreement with QP for the development of the Idd El Shargi North Dome
oil field offshore Qatar, according to Scandinavian Oil-Gas Magazine. Work at the site
has already commenced and aims to sustain oil production levels at about 100,000b/d
through the next six years to 2019.The pair will endeavour to improve the ease of
recovery from the field's existing contract reservoirs.
Market Position QP is active in all segments of the energy chain and participates in all major oil and gas
developments. The firm's E&P activities are centred on the onshore Dukhan oil field and
the offshore Bul Hanine and Maydan Mahzam oil fields. The state firm also holds stakes
in seven offshore fields that are being developed under PSAs. Gas resources are
centred on the giant North Field. QP operates all of the country's 200,000b/d crude oil
refining capacity and brought the 146,000b/d Ras Laffan refinery on stream in 2009.
The group's key subsidiaries and affiliates include LNG companies Qatargas and
RasGas. QP has a 65% interest in the upstream portion of Qatargas. The ownership of
Qatargas' downstream component is split between QP (65%), Total (10%), ExxonMobil
(10%), Mitsui (7.5%) and Marubeni (7.5%). RasGas I and II produce 20.7mn tpa of LNG
from five trains. RasGas I is owned by QP (63%), ExxonMobil (25%), Kogas (5%), Itochu
(4%) and LNG Japan (3%). RasGas II is a 70:30 JV between QP and ExxonMobil.
QAPCO, in which QP holds an 80% stake together with Atofina, produces 525,000tpa
of ethylene, 360,000tpa of low-density polyethylene (LDPE) and 70,000tpa of sulphur.
QP has a 51% interest in Qatar Chemical Company (Q-Chem) together with
ChevronPhillips Chemical Company. Q-Chem operates a world-class petrochemical
plant producing high-density polyethylene (HDPE), medium-density polyethylene
(MDPE) and 1-hexene (alpha olefin). Other group companies include Qatar Fuel
Qatar Oil & Gas Report Q4 2013
© Business Monitor International Page 55
Additives Company (QAFAC, 50% interest), Qatar Vinyl Company (QVC, 25.5%) and
Gulf Helicopters (100%).
The Qatari government is scheduled to conclude a reservoir assessment of its North
Gas Field Development in 2013, according to the country's Energy Minister Mohamed
bin Saleh Al-Sada. He said that the study would facilitate the formulation of future
energy and gas field projects. It will also provide Qatar's energy ministry with enough
information to ensure it can exploit reserves without causing environmental damage, Al-
Sada stated. The 6,000sq km North Field's recoverable gas reserves are estimated at
more than 25,500bcm.
Germany's Wintershall and QP have announced exploration success at Block 4 North
offshore Qatar after four years of hunting. The discovery in depths of 70m is estimated
to contain as much as 70bcm of gas and is the country's first new find in 42 years.
Financial Data Net sales
■ QAR289.2bn (2011)■ QAR188.0bn (2010)■ QAR118.1bn (2009)■ QAR168.5bn (2008)■ QAR177.4bn (2007)■ QAR100.7bn (2006)
Net income
■ QAR88.9bn (2011)■ QAR54.6bn (2010)■ QAR35.2bn (2009)■ QAR55.8bn (2008)■ QAR35.0bn (2007)■ QAR31.2bn (2006)
Company Details ■ Qatar Petroleum (QP)
■ PO Box 3212Doha
Qatar
■ Tel: +974 449 1491
■ Fax: +974 483 1125
■ www.qp.com.qa
Qatar Oil & Gas Report Q4 2013
© Business Monitor International Page 56

ExxonMobil Oil Qatar
SWOT Analysis
Strengths ■ Major domestic gas producer
■ Share of key liquefied natural gas (LNG) export schemes
■ Good relationship with state energy company
■ Substantial volume growth potential
■ Potential role in gas-to-liquids (GTL) and petrochemicals capacity
Weaknesses ■ No producing oil interests
■ No downstream oil exposure
■ Rising investment requirement
Opportunities ■ Considerable untapped gas export potential
■ Substantial scope for plant expansion
■ Bazran volumes
Threats ■ Competition in regional LNG supply
■ Changes in national energy policy
Company Overview ExxonMobil has a 25% interest in RasGas I and a 30% interest in the RasGas II
development. Gas for the trains is sourced from the North Field. Total investment in the
development is estimated at US$12bn. ExxonMobil also has a 10% interest in Qatargas
I, which has been in operation since 1996. ExxonMobil and QP signed a heads of
agreement (HoA) in June 2002 for the supply of Qatari LNG to the UK and Northern
Europe. It also holds a 30% stake in train four of Qatargas II, alongside Qatar
Petroleum (QP) (70%) and ExxonMobil (30%), and an 18.3% stake in train five Qatargas
II alongside QP (65%) and Total (16.7%).
Qatar Oil & Gas Report Q4 2013
© Business Monitor International Page 57
Strategy Exxon continues to be heavily involved in the Qatar LNG sector. With significant returns
around the corner these interests will continue to grow, while the group's excellent
relations with QP should ensure its participation in any future developments in the
country.
In late-2010, Exxon launched the development of the massive Barzan gas field, which
will produce around 14.5bcm once fully online in about 2015. Exxon is the only IOC
partner in the project, holding a 7% stake, with the remainder held by QP. Barzan Gas
Project's four offshore platform topside modules, collectively weighing a total of 9,500
tonnes will be installed in the fourth quarter of 2013, RasGas has said. The topsides,
which include three wellhead platforms and an additional living quarters' module,
started their long journey by sea from Ulsan, South Korea to the North Field in
September 2013.
ExxonMobil has signed an agreement with Qatar Petroleum International (QPI) to move
forward with construction of a US$10bn natural gas export terminal in Texas. The
project will involve installing liquefaction equipment at an existing import facility in
Sabine Pass, Texas, according to an e-mailed statement from Golden Pass Products, a
subsidiary formed by the two companies. It won permission in 2012 to export the fuel to
nations with free-trade agreements with the US and is awaiting approval to send the
fuel to all other countries.
Exxon and QPI plan to ship as much as 15.6mn tpa of gas annually from the Golden
Pass facility, according to the statement. 'This agreement sets out a highly competitive
commercial blueprint for Golden Pass Products, with a commitment that builds on the
unique combined strengths of QPI and Exxon Mobil through the global downstream
LNG value chain,' Bill Collins, president of Golden Pass, said in the statement.
Market Position ExxonMobil has a major position in the LNG sector. The US oil major has a 25% interest
in RasGas I and a 30% interest in the RasGas II development. The RasGas II
development comprises three LNG trains that will supply India, Italy, Belgium and
Spain. The project, which was completed in 2004, has a contract to supply LNG to the
US for a 25-year period under an October 2003 deal. Gas for the trains is sourced from
the North Field, with the project to use 737bcm of reserves. Total investment in the
development is estimated at US$12bn.
ExxonMobil also has a 10% interest in Qatargas I, which has been in operation since
1996. ExxonMobil and QP signed a heads of agreement (HoA) in June 2002 for the
supply of Qatari LNG to the UK and Northern Europe. It also holds a 30% stake in train
four of Qatargas II, alongside QP (70%) and ExxonMobil (30%), and an 18.3% stake in
train five Qatargas II alongside QP (65%) and Total (16.7%).
ExxonMobil was involved in the US$1.1bn phase one development of the al-Khalij Gas
project (AKG-1), together with QP. In March 2003, the US major launched the first
phase development, which includes the production of gas from the North Field, the
recovery of associated condensate and natural gas liquids for sale and the marketing of
Qatar Oil & Gas Report Q4 2013
© Business Monitor International Page 58
49Mcm/d of pipeline gas for domestic and export customers. AKG was developed in
phases to meet gas sales commitments. The partners initially agreed to supply 21Mcm/
d of gas to the Oryx GTL plant, the Ras Laffan Power Plant and other domestic
industrial customers.
QP and ExxonMobil started operations at the AKG-2 project at Qatar's North Field in
December 2009, according to a press release by Exxon on February 23 2010. The
project has the capacity to produce 35.4Mcm/d, or an annualised 12.9bcm, of gas that
will be used to supply domestic industries. The AKG-2 project involved the construction
of onshore gas treating, liquids recovery and fractionation facilities, as well as two
additional offshore wellhead platforms. The onshore facilities are integrated with the
RasGas III LNG project, which has allowed the companies to share some of the
infrastructure and utilities.
Operational Data ■ LNG production (ExxonMobil - interest trains) 61mn tonnes (2012)
Company Details ■ ExxonMobil Oil Qatar Inc
■ QNNTC Building60 Al-Taameen Street
PO Box 22500
Doha
Qatar
■ Tel: +974 434 9349
■ Fax: +974 434 9217/9350
Qatar Oil & Gas Report Q4 2013
© Business Monitor International Page 59
Total Qatar
SWOT Analysis
Strengths ■ Significant domestic oil and gas producer
■ Share of major LNG export scheme
■ Substantial near-term volume growth
■ Rapid expansion of LNG and petrochemicals capacity
Weaknesses ■ No downstream oil exposure
■ Absent from GTL development consortia
■ Rising investment requirement
Opportunities ■ Considerable untapped gas export potential
■ Substantial scope for plant expansion
■ Large areas of underexplored territory
■ New condensates refinery project
Threats ■ Competition in regional LNG supply
■ Changes in OPEC/national energy policy
Company Overview Present in Qatar since 1936, Total has a 20% interest in the upstream part of Qatargas
1, a 10% interest in the Qatargas 1 liquefaction plant JV, a 24.5% stake in Dolphin
Energy and a 16.7% stake in Qatargas 2 Train 5 JV. Total's Qatari production averaged
139,000boe/d in 2012. Total is also a partner in the Laffan Refinery with a 10% interest
and in the Qapco (20%) and Qatofin (48.6%) petrochemical plants.
Strategy Total's good relationship with QP should stand it in good stead to expand its broad-
based interests in Qatar. The company was linked in late-2010 with involvement in a
large-scale petrochemicals plant in the country, and is likely to be actively interested in
Qatar Oil & Gas Report Q4 2013
© Business Monitor International Page 60
other major projects as and when they become available. Total has signed a new
agreement with QP, under which the two companies will continue to develop the Al
Khalij oil field offshore Qatar for the next 25 years.
QP has formally announced a joint venture with private players led by Total for the
construction of US$1.5bn condensate refinery at Ras Laffan. At 146,000 barrels per day
(b/d), the Ras Laffan 2 (LR2) will double the capacity of the existing Laffan Refinery
(LR1) when it comes online in H216. The plant will have a production capacity
of 60,000b/d of naphtha; 53,000b/d of jet fuel; 24,000b/d of gas oil; and 9,000b/d of
liquid petroleum gas (LPG).
The project will developed by QP (84%) and Total (10%), with Japanese firms Idemitsu
Kosan, Cosmo Oil, Marubeni and Mitsui holding the remainder. Supplied from the North
Field, the combined 300,00b/d capacity of LR1 and LR2 will make the plant the largest
condensate refinery developed to date.
The Dolphin Energy gas pipeline, the Gulf Cooperation Council (GCC)'s first regional
gas project, could see a capacity expansion according to Total's senior vice president
for the Middle East, Arnauld Breuillac. The pipeline, which currently connects Qatar to
Abu Dhabi and onwards to Oman has a capacity of 33bcm per annum. However,
current sales agreements and existing compression facilities only support volumes of
just over 23bn cubic metres (bcm) per year.
Under current plans, a new compression facility at Ras Laffan would allow Dolphin to
economically deliver volumes closer to full capacity from 2015. The pipeline has seen
exports rise temporarily to meet demand in excess of contracted capacity, but only for
short periods of time. However, rising demand for gas in the region, with the UAE set to
inaugurate a new liquefied natural gas (LNG) import terminal from 2016 in the face of
tightening supplies, provides economic rationale for a Dolphin expansion.
Market Position Total is active in the upstream and petrochemicals sectors in Qatar. The French oil
company has a 20% interest in the upstream and a 10% interest in the downstream
portions of Qatargas I, which operates three LNG trains. Further, Total also owns a
16.7% stake in train five of Qatargas II. The French major operates the offshore Al-Khalij
field, which was discovered in 1991. A new development phase launched in June 2002
boosted output to 80,000b/d by mid-2004. Total also participated in the development of
the North Field's Bravo Block designated to supply gas to the Qatargas liquefaction
plant.
Total also has a 24.5% interest in the Dolphin Energy project, which is developing gas
reserves in the North Field for sale to the UAE and other regional markets. The field
started producing at the end of June 2007, with exports to the UAE and Oman having
started in February and November 2008 respectively.
Total's chemicals subsidiary Atofina has a 20% stake in Qatar Petrochemical Company
(QAPCO), which produces ethylene and low-density polyethylene that is exported to
Asian markets and other Gulf countries. Atofina is also involved in Qatofin, a JV
Qatar Oil & Gas Report Q4 2013
© Business Monitor International Page 61
between Atofina (36%), QAPCO (63%) and QP (1%), which is planning to build a
450,000tpa linear low-density polyethylene (LDPE) unit at Mesaieed. Production is
expected to begin in 2007. Through Qatofin, Atofina will also participate in the
construction and operation of the biggest ethane cracker in the world (1.3mn tpa) in Ras
Laffan. Qatofin will have a 45.7% interest in the facility. Finally, Atofina has a 19.29%
interest in QVC, a new chloro-chemical complex commissioned in April 2001.
Total has signed a new agreement with Qatar's state-owned Qatar Petroleum, under
which the two companies will continue to develop the Al Khalij oil field offshore Qatar
for the next 25 years. The existing exploration and production sharing agreement,
signed in 1989, will expire in early 2014. The Al Khalij field was discovered by Total in
1991 and commenced oil production in 1997. Under the terms of the deal, Qatar
Petroleum will own a 60% stake in the oil field, with Total holding the remaining 40%.
Operational Data Oil production:
■ 38,000b/d (2012)■ 44,000b/d (2011)■ 49,000b/d (2010)■ 47,000b/d (2009)■ 44,000b/d (2008)
Gas production:
■ 5.8bcm (2012)■ 6.4bcm (2011)■ 6.6bcm (2010)■ 3.0bcm (2009)
Company Details ■ Total E&P Qatar
■ Total BuildingC Ring Road
Al-Muntazah Traffic Signal
Doha
Qatar
■ Tel: +974 436 4466
■ Fax: +974 430 6630
■ www.total.com
Qatar Oil & Gas Report Q4 2013
© Business Monitor International Page 62
Royal Dutch Shell
SWOT Analysis
Strengths ■ High-profile international oil company (IOC) position in Qatari gas/NGL sector
■ Recent expansion into Qatari exploration
Weaknesses ■ Relatively narrow Qatari investment portfolio
Opportunities ■ Substantial production growth potential
■ Exposure to lucrative Asia Pacific LNG market
Threats ■ Changes in national energy policy
■ Competition in regional LNG supply
Company Overview Shell's involvement in Qatar spans both the upstream and downstream sectors. The
company has developed its flagship Pearl GTL facility at Ras Laffan, which is the largest
facility of its kind in the world. Pearl GTL went into the start-up phase in 2011 and was
due to reach full capacity in 2012. First deliveries have begun from the complex. Shell is
also involved in the Qatargas IV (train seven) project, in which it holds a 30% stake (with
QP holding the majority 70%). As well as its two downstream projects, Shell is also
involved in the Qatari upstream. In May 2010, Shell and PetroChina were awarded the
Block D concession. Under the terms of the deal, Shell will operate the block with a
75% stake and PetroChina will hold the remaining 25%.
Strategy Through the twin pursuit of Qatargas IV and Pearl, Qatar is emerging as the heart of
Shell's Arab Gulf operations. Liquefied natural gas (LNG) is a key component of Shell's
growth strategy, and its Qatari investments guarantee it a slice of a growing market. A
poor outlook for US natural gas prices has led Shell to develop its Qatari gas projects
with an eye towards the Asia Pacific market. Shell is keen to develop its profile as the
leading IOC gas player in the Gulf, given its gas investments in Saudi Arabia and Iraq,
and technical assistance towards the development of Kuwait's northern gas reserves.
Although the Block D deal is Shell's first move into Qatari gas exploration, it is already
heavily involved in the emirate, both upstream and downstream. The company is
developing part of the North Field under an agreement signed in 2003, which called for
Qatar Oil & Gas Report Q4 2013
© Business Monitor International Page 63
it to produce 16.5bn cubic metres (bcm) of gas annually by 2011. Gas produced at the
field will be used to supply the Pearl GTL facility. In February 2009, Shell announced
plans to drill 22 offshore wells at a block in the North Field.
QP and Royal Dutch Shell are targeting a 2018 completion date for the Al-Karaana
petrochemical project in Ras Laffan, Qatar, after awarding a contract for front end
design work to US Fluor Corporation, according to Zawya. The US$6.5bn project, 80%
owned by QP and 20% by Shell, will comprise a steam cracker, a mono ethylene glycol
(MEG) plant, a linear alpha olefin unit and an oxo alcohol unit.
Market Position Shell's involvement in Qatar spans both the upstream and downstream sectors. The
company has developed its flagship Pearl GTL facility at Ras Laffan, which is the largest
facility of its kind in the world. Shell estimates Pearl's costs, which it will bear alone, at
US$19bn, based on its tapping 3bn boe over 25-30 years at US$6/bbl. Once at
capacity, the facility will produce 120,000b/d of NGL and ethane and 140,000b/d of
ultra-clean diesel, naphtha and other GTL products, generating around US$6bn
annually based on an oil price of US$70/bbl. Major construction was substantially
complete by the end of 2010. Pearl GTL went into the start-up phase in 2011 and
reached full capacity in 2012
In March 2011, Shell started supplying gas from the North Field to its Pearl GTL plant. In
March 2010, Shell Qatar spokesperson Andrew Brown said the project would generate
annual profits of US$6bn based on an oil price of US$70/bbl, adding that operating
costs were around US$6/bbl and that the company's production sharing contract (PSA)
with QP allows it to claim back the US$19bn project cost. He claimed that following the
start-up of deliveries from Pearl and a planned increase in output at the Qatargas LNG
project, Shell's operations in Qatar could account for as much as 10% of the
company's total hydrocarbons production..
Shell is also involved in the Qatargas IV (train seven) project, in which it holds a 30%
stake (with QP holding the majority 70%). Once fully on stream, the train will have a
capacity of 7.8mn tpa and will produce about 70,000b/d of NGL. The facility was
originally scheduled to become operational in early-2010, but was delayed. It has been
operating at full capacity in 2012. The LNG is shipped mainly to markets in North
America, China, Europe and the United Arab Emirates.
As well as its two downstream projects, Shell is also involved in the Qatari upstream. In
May 2010, Shell and PetroChina were awarded the Block D concession. Under the
terms of the deal, Shell will operate the block with a 75% stake and PetroChina will hold
the remaining 25%. The 30-year contract includes an initial five-year exploration period,
during which the two companies are obliged to carry out 2D and 3D seismic surveys,
processing and interpretation. This period will also involve the companies drilling an
unspecified number of exploration wells to target the pre-Khuff formation. According to
PetroChina, part of the concession extends beneath the offshore North Field.
Gulf Drilling International (GDI) has been awarded a drilling services contract by Qatar
Shell for offshore exploration in the North field of Qatar. Under the contract, the
Qatar Oil & Gas Report Q4 2013
© Business Monitor International Page 64
company will use its Al-Khor jack-up vessel to drill the pre-Khuff interval of block D.
This is the third contract between the two companies. The contract was signed by
Shell's Executive Vice President Wael Sawan and GDI's CEO Ibrahim J Al-Othman.
Financial Data Revenues:
■ US$481.7bn (2012)■ US$484.5bn (2011)■ US$378.2bn (2010)■ US$278.2bn (2009)■ US$458.5bn (2008)
Net profit/loss:
■ US$26.6bn (2012)■ US$30.9bn (2011)■ US$20.5bn (2010)■ US$12.7bn (2009)■ US$26.5bn (2008)
Company Details ■ Qatar Shell Svc. Co. W.L.L.
■ P.O. Box 3747Al Mirqab Tower, 1st Floor
Corniche Road
West Bay, Doha
Qatar
■ Tel: +974 44957 777
■ Fax: +974 44957 778
■ http://www.shell.com.qa/
Qatar Oil & Gas Report Q4 2013
© Business Monitor International Page 65
Other Companies - SummaryMaersk Oil Maersk Oil of Denmark operates the al-Shaheen field on Block 5, with capacity of
around 240,000 barrels per day (b/d). A production sharing contract (PSA) for the Block
5 extension area was awarded by QP in April 2004; since then, Maersk has carried out
an extensive exploration programme for fast-track development. In December 2005,
Maersk concluded an agreement about further development of al-Shaheen Field. The
plan comprises drilling of more than 160 production and water injection wells up to
2011 and establishment of a further three offshore platform locations with production
and accommodation facilities. To date, six drilling rigs have completed drilling 48 of the
planned 160 wells.
Maersk is in discussions with Qatar Petroleum (QP) over an extension to a production
sharing contract for the al-Shaheen oil field, reports Reuters. The company is seeking a
13-year extension to 2030. The field's crude production could increase from the current
300,000b/d to 400,000b/d in 2017, one source said. Additionally, new equipment
including a floating storage and offloading unit is likely to be deployed at the field if the
contract is extended.
Occidental
PetroleumOccidental Petroleum had net Qatari output of 1.7bn cubic metres (bcm) of gas and
71,000b/d of crude and natural gas liquids (NGLs) in 2012. The company operates the
Id al-Shargi North Dome (ISND) oil field. In December 1997, Occidental signed another
PSA with QP to develop the Id al-Shargi South Dome (ISSD) field that came on stream
in November 1999. Occidental's ownership interest in ISSD is 44%. In May 2007,
Occidental purchased Anadarko's 92.5% interest in blocks 12 and 13. Block 12
contains the al Rayyan Field, which represented all of Anadarko's production operations
in Qatar and had net output of around 6,000b/d. Occidental also holds a 24.5% share in
the Dolphin Energy JV, alongside Total (24.5%) and the Abu Dhabi government (51%).
Occidental Petroleum's wholly-owned Qatari subsidiary has signed a two-year contract
with Gulf Drilling International (GDI) for the al-Rayyan (Gulf-2) drilling rig. The rig will
operate along with the al-Wajbah (Gulf-3) rig in the Idd al-Sharqi field's North and South
Domes, as well as the al-Rayyan field.
Oxy will bid for six packages pertaining to the development of the Idd el-Shargi North
Dome (ISND) oilfield offshore Qatar, reports Upstream, citing unnamed industry
sources. The company is preparing to participate in an international tender for the
packages, which include processing platforms, a wellhead platform plus jacket,
pipelines, infield flowlines and modifications to the Halul Island terminal. The packages
will be tendered in Q213; however, a source believes the tender may be delayed by
about a year.
Oxy has announced that its Qatari subsidiary has signed a co-development agreement
with QP for the development of the Idd El Shargi North Dome oil field offshore Qatar,
according to Scandinavian Oil-Gas Magazine. Work at the site has already commenced
and aims to sustain oil production levels at about 100,000b/d through the next six years
Qatar Oil & Gas Report Q4 2013
© Business Monitor International Page 66
to 2019.The pair will endeavour to improve the ease of recovery from the field's existing
contract reservoirs.
Qatargas Qatargas I, made up of a consortium of QP (65%), ExxonMobil (10%), Total (10%),
Mitsui (7.5%) and Marubeni (7.5%), comprises three trains, which originally had a
capacity of 2mn tonnes per annum (tpa) (2.7bcm) each. At the end of 2005, Qatargas I
completed the debottlenecking of its facilities, increasing total capacity to 10mn tpa
(13.8bcm). Most of the exported liquefied natural gas (LNG) is destined for Japan and
Spain. In December 1996, the Qatargas venture delivered its first shipment of LNG to
Japan.
Qatargas II consists of two trains, with train four owned by QP (70%) and ExxonMobil
(30%) and train five by a consortium between QP (65%), ExxonMobil (18.3%) and Total
(16.7%). Trains four and five, which each have a 7.8mn tpa (10.8bcm) capacity came
on stream in 2009. The first LNG shipment from Qatargas II arrived at the UK's South
Hook LNG terminal on March 20 2009 and train five became operational in early
September 2009.
Qatargas III is owned by QP (68.5%), ConocoPhillips (30%) and Mitsui (1.5%). Qatargas
III has a capacity of 7.8mn tpa (10.8bcm) and began delivering gas in November 2010.
Qatargas IV has capacity of 7.8mn tpa (10.3bcm). It is a JV between QP (70%) and Shell
(30%), and came on stream in February 2011.
QatarGas agreed in April 2011 to supply UK energy firm Centrica with LNG covering an
estimated 10% of the country's gas demand. The deal covers a supply of 2.4mn tonnes
per annum over three years. Qatargas has also signed a tripartite sales and purchase
agreement with Japan's Chubu Electric Power and Shizuoka Gas for an annual delivery
of 200,000 tonnes of LNG from 2016. LNG will be supplied through Qatargas I.
Qatargas entered into a long-term LNG sale and purchase agreement with Tokyo
Electric Power Company (Tepco) in 2012, under which the Japanese firm will receive
1mn tonnes of LNG every year from Ras Laffan.
Qatar will supply 18-24 cargoes of LNG to Egypt under a swap deal from May 28 2013,
reports Middle East News Agency (MENA), citing Tarek el-Barkatawy, the first under-
secretary for agreements and exploration at the Egyptian Oil Ministry. Under the terms
of the swap deal, BG Group and Malaysia's Petronas will supply around 152.4mn cubic
metres of natural gas per day, el-Barkatawy said. Qatar Gas in turn will supply LNG
directly to the companies' overseas customers. Each cargo will be equivalent to 1.0bcm
of natural gas.
Rasgas RasGas I is owned by a consortium made up of QP (63%), ExxonMobil (25%), Kogas
(5%) and LNG Japan (3%). RasGas I consists of two 3.3mn tpa (4.6bcm) trains. The
main export market for LNG from trains one and two is South Korea.
Qatar Oil & Gas Report Q4 2013
© Business Monitor International Page 67
RasGas II, a 70:30 JV between QP and ExxonMobil, consists of three additional trains,
each of which has a processing capacity of 4.7mn tpa (6.5bcm). Trains three, four and
five came on stream in 2004, 2005 and 2006 respectively, raising RasGas' total
processing capacity to 20.7mn tpa (28.5bcm). The main export market for LNG from
train three is India, with LNG from train four destined for Europe and exports from train
five shipped to Europe and Asia.
RasGas III, a 70:30 JV between QP and ExxonMobil, consists of two additional trains,
each of which has a processing capacity of 7.8mn tpa. Trains six and seven were
originally scheduled to start operations in 2008/2009. The scheduled start-up for train
six for early April 2009 was also missed, with the train having been brought on stream in
August 2009. Train seven was expected to become operational before year-end, but did
not become operational until late-February 2010.
RasGas will supply about 11.44bcm of LNG to South Korea's state-owned Kogas in
2011, according to Qatar's minister of energy and industry (and chairman of Qatar
Petroleum and RasGas), Mohammed Bin Saleh Al Sada. He said that the quantity
supplied is equivalent to almost 25% of South Korea's total projected demand. RasGas'
annual LNG supply to South Korea exceeds 9.65bcm on a long-term basis, said Al
Sada.
Tasweeq Qatar's state-run company Qatar International Petroleum Marketing (Tasweeq) is to
discontinue term gasoil exports from 2012, owing to an expected rise in domestic
demand for the fuel, according to industry sources. Under a monthly term contract,
Tasweeq exports approximately 30,000-60,000 tonnes of 0.2% sulphur gasoil each
month, while the company sometimes offers a similar amount of gasoil on the spot
market, according to traders. Tasweeq's decision to stop exporting is likely to put a
strain on the Middle East market, with demand unlikely to register much change but a
shortage of supply.
Tasweeq also markets crude oil and GTL entitlements on behalf of QP under an agency
agreement that is termed as 'Non-Regulated Products'. It is an independent state-
owned company, created under Qatar's Emiri Decree Law Number 15 of 2007, with the
mandate of capturing maximum market value from the rapidly increasing exports of
Regulated Products from the state of Qatar, reliably and efficiently. Tasweeq delivers
products to customers and markets globally.
Sasol Sasol of South Africa has built a US$1bn GTL plant that entered production in March
2007, manufacturing high-quality diesel fuel and naphtha from gas using Sasol's
technology. Sasol expects the facility to reach full production by 2009. The facility
features QP as a partner. In March 2004, Sasol, Chevron and QP announced plans to
evaluate the expansion of the GTL project's output from 34,000b/d to 100,000b/d. In
addition, the companies have agreed to pursue the opportunity to develop a 130,000b/
d upstream/downstream integrated GTL project utilising resources from the North Field.
Qatar Oil & Gas Report Q4 2013
© Business Monitor International Page 68
Conocophillips Qatargas III is owned by QP (68.5%), ConocoPhillips (30%) and Mitsui (1.5%). Qatargas
III has a capacity of 7.8mn tpa (10.8bcm). The integrated project comprises upstream
gas production facilities to produce approximately 14.5bcm of natural gas over the 25-
year life of the project, as well as an initial average of approximately 70,000b/d gross of
LPG and condensate combined from Qatar's North Field. The first LNG cargo was
loaded in November 2010, and the Qatargas 3 Plant is now fully operational.
Cosmo Oil In April 2011, Qatar Petroleum Development (QPD), which is a subsidiary of Cosmo Oil
of Tokyo, began oil production from A-Structure South Field in offshore Qatar. QPD was
established as the project company for the purpose of petroleum development and
operation in Block 1 SE located offshore Qatar in September 1997. After the field
development and installations in Al Karkara Field and A-Structure North Field, the first
oil flowed in March 2006.
In 2007, QP approved the development plan for A-Structure South Field in the same
block. Since then, QPD has been continuing the development and on April 27 2011, oil
production from the field started and is expected to reach around 3,000b/d, bringing
the total production from the three fields in Block 1 SE to around 9,000b/d.
Wintershall Germany's Wintershall, a wholly-owned subsidiary of BASF, became the operator of the
wholly-owned Block 11 in Qatar's territorial waters in 2008. The block, which measures
544sq km and has a water depth of around 70 metres, is in close proximity to the North
Field. Wintershall was in 2007 given the go-ahead to operate Offshore Block 3, which
covers an area of 1,666sq km.
Wintershall and Qatar Petroleum (QP) have announced exploration success at Block 4
North offshore Qatar after four years of hunting. The discovery in depths of 70m is
estimated to contain as much as 70bn cubic meters (bcm) of gas and is the country's
first new find in 42 years.
Gdf Suez GDF Suez is active in Qatar, including participating in projects such as high-
performance wastewater treatment technologies for water recycling and the
construction of the power plant and desalination facility for Ras Laffan. The acquisition
of a 60% stake in Block 4 marked the company's first entry into Qatar's upstream
segment. GDF Suez announced in July 2009 that it has acquired a 60% interest in
Qatar's offshore Block 4 from Anadarko through the purchase of Anadarko Qatar Block
4 Company.
Cnooc CNOOC has sold a 25% stake in a licence to explore for hydrocarbons in Qatar to Total
as the Chinese company seeks to reduce risk. The Beijing-based producer, which
secured rights to the offshore concession in 2009, will retain a 75% stake and operate
the area called Block BC, according to a statement.
Qatar Oil & Gas Report Q4 2013
© Business Monitor International Page 69
Petrochina In May 2010, PetroChina and Shell were awarded the 8,089sq km Block D concession,
which spans an area onshore and offshore north-eastern Qatar. Under the terms of the
deal, Shell will operate the block with a 75% stake and PetroChina will hold the
remaining 25%. The 30-year contract includes an initial five-year exploration period,
during which the two companies are obliged to carry out 2D and 3D seismic surveys,
processing and interpretation. This period will also involve the companies drilling an
unspecified number of exploration wells to target the pre-Khuff formation. According to
PetroChina, part of the concession extends beneath the offshore North Field, the
largest non-associated gas field in the world.
Although PetroChina had no direct exposure to Qatar prior to the deal, it is already
contracted to receive LNG from Qatargas IV, having signed a binding SPA with
Qatargas and Shell in April 2008. The SPA is for 3mn tpa of gas (4.1bcm) over a 25-year
period, which will be shipped to PetroChina's receiving terminals. The deal for Block D
gives PetroChina its first exposure to the Qatari upstream and the company may
consider expanding its presence when new blocks are offered.
Service Companies
Petrofac: London-listed oil services company Petrofac set up an office in Qatar in 1997
and is involved in providing technology to the energy, petrochemicals, water and
construction sectors. The company counts QP, WorleyParsons, Technip and Maersk
among its clients.
In March 2010, Petrofac was awarded a US$600mn contract by QP to provide
engineering, procurement, installation and commissioning services for gas-sweetening
units at Dukhan and Messaieed. The contract covers a sulphur-recovery upgrade at
NGL-3 in Messaieed and an acid gas recovery facility at Arab-D in Dukhan. The work is
expected to be completed by May 2013.
Fluor: Although US-based engineering company Fluor does not currently maintain an
office in Qatar, the company has been an active bidder for contracts in the country. In
2009, the company completed a four-year US$1.5bn EPCM for RasGas's Common
Offplot Projects.
In April 2010, Fluor was awarded an EPCM contract by Qatargas for the Jetty Boil-Off
Gas Recovery Project at Ras Laffan in Qatar. The project is designed to minimise gas
flaring at LNG berths and is expected to be completed by the end of 2013 or early
2014. The gas will be collected for use by Qatargas and RasGas and is part of a US
$1bn project under way at Qatargas' LNG storage and loading facilities.
Fluor awarded a contract to US firm GE Oil & Gasin February 2011 to supply equipment
for the Jetty Boil-Off Gas Recovery project. The contract will include delivering six
electric-motor-driven compressors to Fluor.
Qatar Oil & Gas Report Q4 2013
© Business Monitor International Page 70
Others Engineering company Kentz was in January 2011 awarded a framework contract by
Qatar Shell GTL to provide services for the Pearl GTL facility in Ras Laffan. The
agreement will include procurement, engineering design and construction supervision
services at the facility. The services will be provided to offshore platforms, offloading
jetties and harbour tank farms, as well as linking infrastructure. The three-year contract
includes a two-year extension option.
Qatar Oil & Gas Report Q4 2013
© Business Monitor International Page 71
Regional Overview
Middle East Energy Market Overview
BMI View: While the Middle East is set to remain a key supplier of both oil and gas, rising consumption
within the region and booming production beyond its borders are putting traditional trade flows under
pressure. While we expect steady growth in supply from the region, from both mature producers such as
Saudi Arabia and rising players such as Iraq, we cannot preclude curtailment in output in response to the
global market. Similarly on gas, rising new sources of LNG globally will see Qatar cede its place at the top
of the global LNG export rankings towards 2022.
Iraq: Abundance of Risk, Abundance Of Potential
Iraq retains its position as the Middle Eastern market set to undergo the largest growth in supply. Supported
by abundant below ground potential, but facing significant headwinds from political and security concerns,
forecast for total Iraqi supply vary widely within the industry. However even factoring delays, cut-backs to
production targets, and further setbacks, our conservative forecast for Iraq still calls for growth at an
average annual rate of 8.4% per annum, putting supply at 6.7mn barrels per day (b/d) by the end of our
forecast period in 2022.
Iraq retains a number of strengths that support a bullish production growth: low production costs, large
fields and underdeveloped and underexplored acreage. However despite our conservative outlook the scale
of Iraq's resource potential is not in doubt. Indeed, oil minister Adbul Kareem Al-Luaibi reported the
country's actual reserves may be 300bn barrels, more than twice the government's official figure of 143.1bn
barrels (bbl). It was this potential which generated significant initial interest from international oil
companies (IOCs), but a number of above-ground concerns have seen recent bidding rounds attract little
interest as investment moves towards less prospective but operationally-friendlier acreage in Kurdistan.
IOCs have been critical of the technical service agreements Baghdad offers, which compensate operators on
a fee per barrel basis rather than more lucrative production sharing agreements offered by Erbil. The
concern regarding these already unattractive agreements is growing among operators as production targets
for Iraq's mega fields are cut.
Fiscal terms remain a key concern for international oil companies which have the resources necessary to
unlock Baghdad's oil riches. Indeed, Eni's chief executive Paolo Scaroni was quoted in March as expressing
concern about the slower-than-expected development of the Zubair field. According to Scaroni, 'we entered
Qatar Oil & Gas Report Q4 2013
© Business Monitor International Page 72
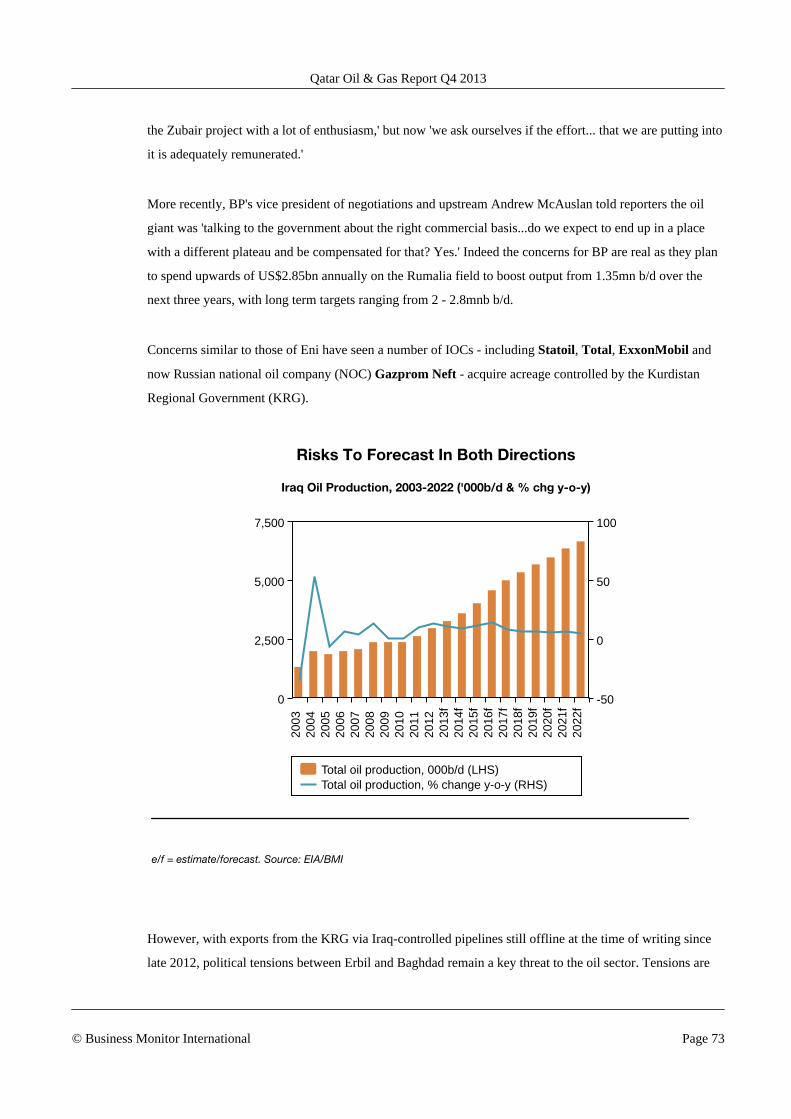
the Zubair project with a lot of enthusiasm,' but now 'we ask ourselves if the effort... that we are putting into
it is adequately remunerated.'
More recently, BP's vice president of negotiations and upstream Andrew McAuslan told reporters the oil
giant was 'talking to the government about the right commercial basis...do we expect to end up in a place
with a different plateau and be compensated for that? Yes.' Indeed the concerns for BP are real as they plan
to spend upwards of US$2.85bn annually on the Rumalia field to boost output from 1.35mn b/d over the
next three years, with long term targets ranging from 2 - 2.8mnb b/d.
Concerns similar to those of Eni have seen a number of IOCs - including Statoil, Total, ExxonMobil and
now Russian national oil company (NOC) Gazprom Neft - acquire acreage controlled by the Kurdistan
Regional Government (KRG).
Risks To Forecast In Both Directions
Iraq Oil Production, 2003-2022 ('000b/d & % chg y-o-y)
Total oil production, 000b/d (LHS)Total oil production, % change y-o-y (RHS)
2003
2004
2005
2006
2007
2008
2009
2010
2011
2012
2013
f20
14f
2015
f20
16f
2017
f20
18f
2019
f20
20f
2021
f20
22f
0
2,500
5,000
7,500
-50
0
50
100
e/f = estimate/forecast. Source: EIA/BMI
However, with exports from the KRG via Iraq-controlled pipelines still offline at the time of writing since
late 2012, political tensions between Erbil and Baghdad remain a key threat to the oil sector. Tensions are
Qatar Oil & Gas Report Q4 2013
© Business Monitor International Page 73
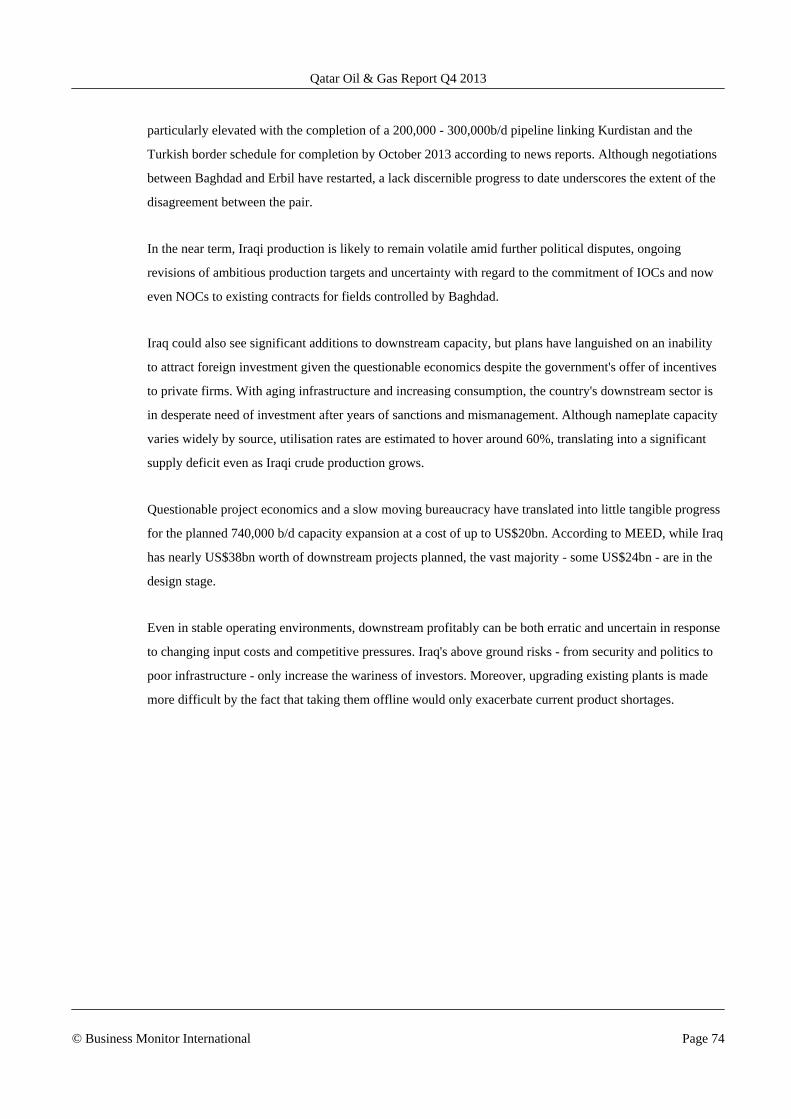
particularly elevated with the completion of a 200,000 - 300,000b/d pipeline linking Kurdistan and the
Turkish border schedule for completion by October 2013 according to news reports. Although negotiations
between Baghdad and Erbil have restarted, a lack discernible progress to date underscores the extent of the
disagreement between the pair.
In the near term, Iraqi production is likely to remain volatile amid further political disputes, ongoing
revisions of ambitious production targets and uncertainty with regard to the commitment of IOCs and now
even NOCs to existing contracts for fields controlled by Baghdad.
Iraq could also see significant additions to downstream capacity, but plans have languished on an inability
to attract foreign investment given the questionable economics despite the government's offer of incentives
to private firms. With aging infrastructure and increasing consumption, the country's downstream sector is
in desperate need of investment after years of sanctions and mismanagement. Although nameplate capacity
varies widely by source, utilisation rates are estimated to hover around 60%, translating into a significant
supply deficit even as Iraqi crude production grows.
Questionable project economics and a slow moving bureaucracy have translated into little tangible progress
for the planned 740,000 b/d capacity expansion at a cost of up to US$20bn. According to MEED, while Iraq
has nearly US$38bn worth of downstream projects planned, the vast majority - some US$24bn - are in the
design stage.
Even in stable operating environments, downstream profitably can be both erratic and uncertain in response
to changing input costs and competitive pressures. Iraq's above ground risks - from security and politics to
poor infrastructure - only increase the wariness of investors. Moreover, upgrading existing plants is made
more difficult by the fact that taking them offline would only exacerbate current product shortages.
Qatar Oil & Gas Report Q4 2013
© Business Monitor International Page 74
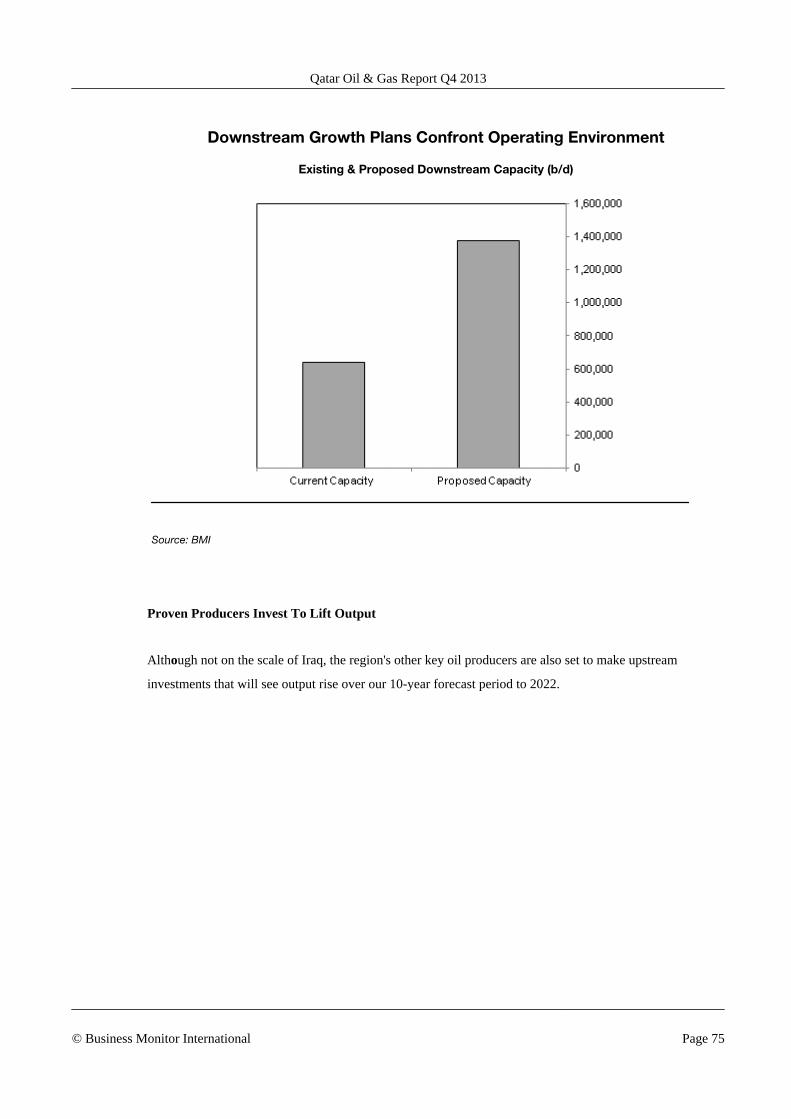
Downstream Growth Plans Confront Operating Environment
Existing & Proposed Downstream Capacity (b/d)
Source: BMI
Proven Producers Invest To Lift Output
Although not on the scale of Iraq, the region's other key oil producers are also set to make upstream
investments that will see output rise over our 10-year forecast period to 2022.
Qatar Oil & Gas Report Q4 2013
© Business Monitor International Page 75
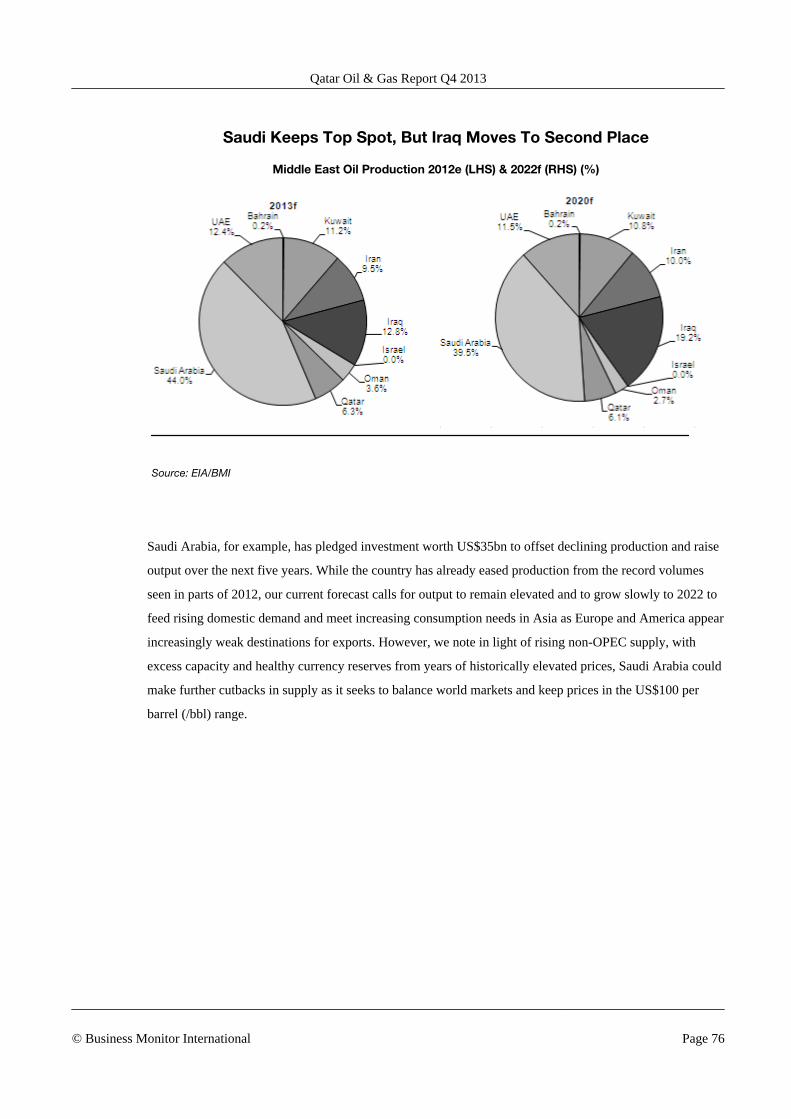
Saudi Keeps Top Spot, But Iraq Moves To Second Place
Middle East Oil Production 2012e (LHS) & 2022f (RHS) (%)
Source: EIA/BMI
Saudi Arabia, for example, has pledged investment worth US$35bn to offset declining production and raise
output over the next five years. While the country has already eased production from the record volumes
seen in parts of 2012, our current forecast calls for output to remain elevated and to grow slowly to 2022 to
feed rising domestic demand and meet increasing consumption needs in Asia as Europe and America appear
increasingly weak destinations for exports. However, we note in light of rising non-OPEC supply, with
excess capacity and healthy currency reserves from years of historically elevated prices, Saudi Arabia could
make further cutbacks in supply as it seeks to balance world markets and keep prices in the US$100 per
barrel (/bbl) range.
Qatar Oil & Gas Report Q4 2013
© Business Monitor International Page 76
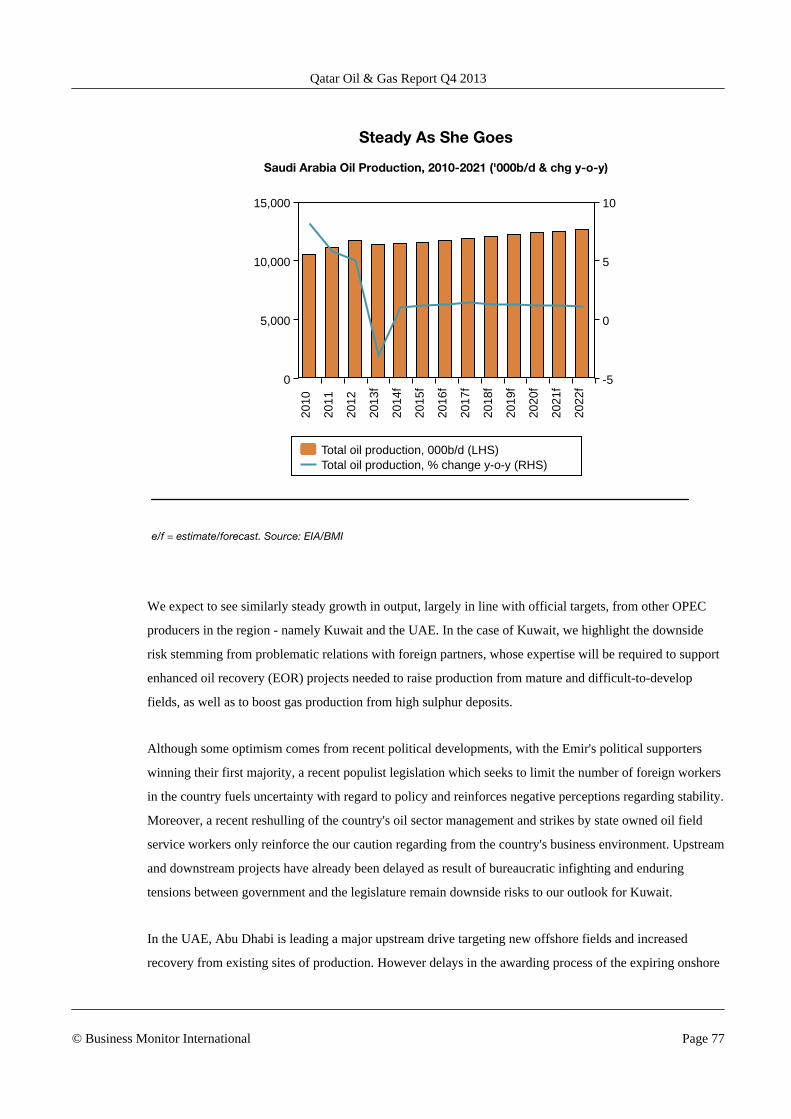
Steady As She Goes
Saudi Arabia Oil Production, 2010-2021 ('000b/d & chg y-o-y)
Total oil production, 000b/d (LHS)Total oil production, % change y-o-y (RHS)
2010
2011
2012
2013
f
2014
f
2015
f
2016
f
2017
f
2018
f
2019
f
2020
f
2021
f
2022
f
0
5,000
10,000
15,000
-5
0
5
10
e/f = estimate/forecast. Source: EIA/BMI
We expect to see similarly steady growth in output, largely in line with official targets, from other OPEC
producers in the region - namely Kuwait and the UAE. In the case of Kuwait, we highlight the downside
risk stemming from problematic relations with foreign partners, whose expertise will be required to support
enhanced oil recovery (EOR) projects needed to raise production from mature and difficult-to-develop
fields, as well as to boost gas production from high sulphur deposits.
Although some optimism comes from recent political developments, with the Emir's political supporters
winning their first majority, a recent populist legislation which seeks to limit the number of foreign workers
in the country fuels uncertainty with regard to policy and reinforces negative perceptions regarding stability.
Moreover, a recent reshulling of the country's oil sector management and strikes by state owned oil field
service workers only reinforce the our caution regarding from the country's business environment. Upstream
and downstream projects have already been delayed as result of bureaucratic infighting and enduring
tensions between government and the legislature remain downside risks to our outlook for Kuwait.
In the UAE, Abu Dhabi is leading a major upstream drive targeting new offshore fields and increased
recovery from existing sites of production. However delays in the awarding process of the expiring onshore
Qatar Oil & Gas Report Q4 2013
© Business Monitor International Page 77
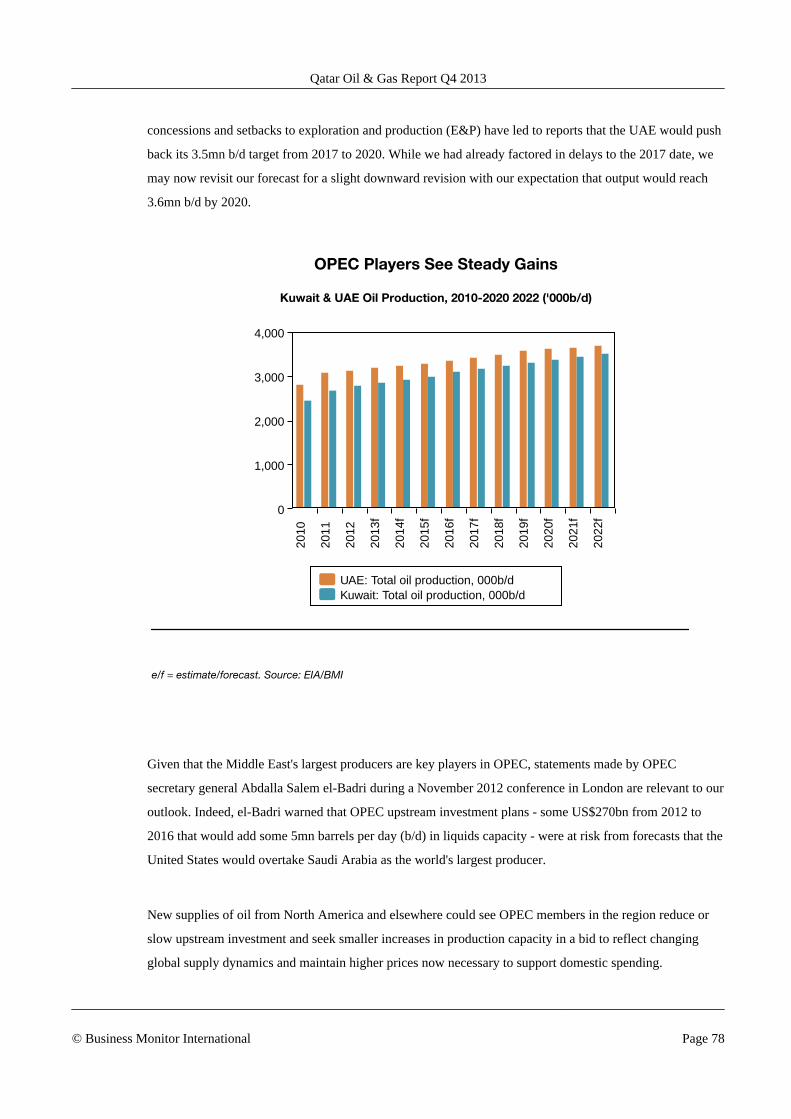
concessions and setbacks to exploration and production (E&P) have led to reports that the UAE would push
back its 3.5mn b/d target from 2017 to 2020. While we had already factored in delays to the 2017 date, we
may now revisit our forecast for a slight downward revision with our expectation that output would reach
3.6mn b/d by 2020.
OPEC Players See Steady Gains
Kuwait & UAE Oil Production, 2010-2020 2022 ('000b/d)
UAE: Total oil production, 000b/dKuwait: Total oil production, 000b/d
2010
2011
2012
2013
f
2014
f
2015
f
2016
f
2017
f
2018
f
2019
f
2020
f
2021
f
2022
f
0
1,000
2,000
3,000
4,000
e/f = estimate/forecast. Source: EIA/BMI
Given that the Middle East's largest producers are key players in OPEC, statements made by OPEC
secretary general Abdalla Salem el-Badri during a November 2012 conference in London are relevant to our
outlook. Indeed, el-Badri warned that OPEC upstream investment plans - some US$270bn from 2012 to
2016 that would add some 5mn barrels per day (b/d) in liquids capacity - were at risk from forecasts that the
United States would overtake Saudi Arabia as the world's largest producer.
New supplies of oil from North America and elsewhere could see OPEC members in the region reduce or
slow upstream investment and seek smaller increases in production capacity in a bid to reflect changing
global supply dynamics and maintain higher prices now necessary to support domestic spending.
Qatar Oil & Gas Report Q4 2013
© Business Monitor International Page 78
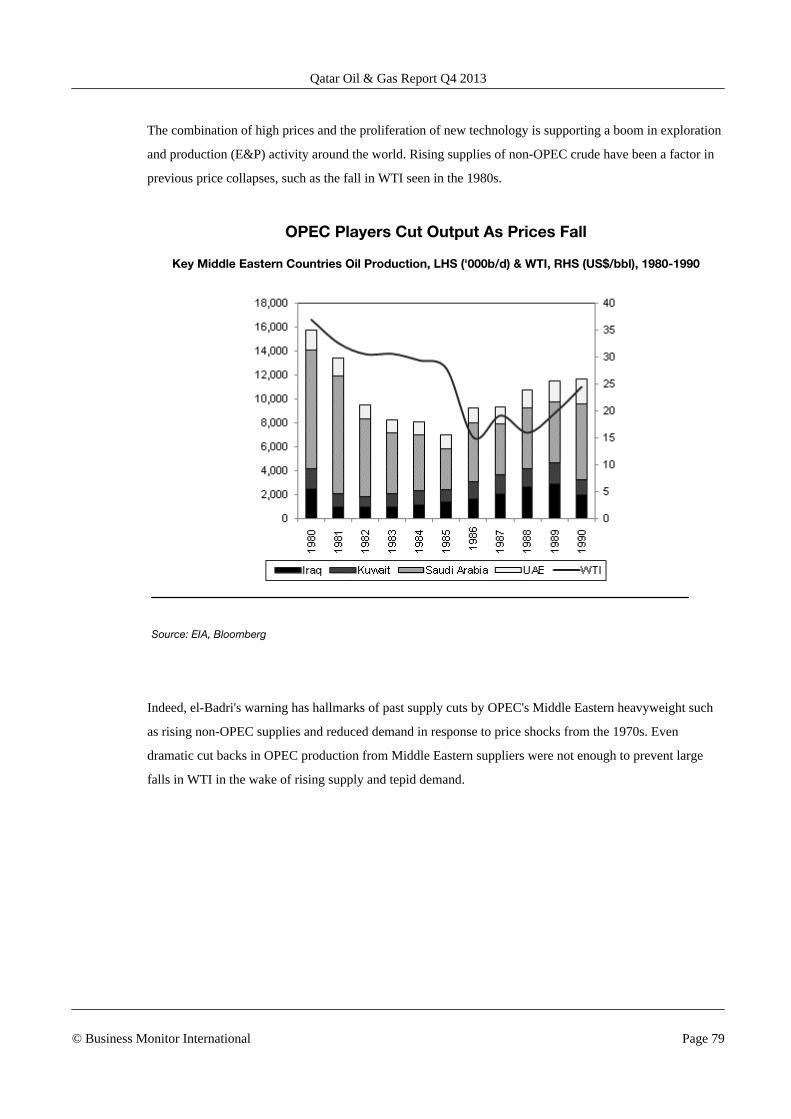
The combination of high prices and the proliferation of new technology is supporting a boom in exploration
and production (E&P) activity around the world. Rising supplies of non-OPEC crude have been a factor in
previous price collapses, such as the fall in WTI seen in the 1980s.
OPEC Players Cut Output As Prices Fall
Key Middle Eastern Countries Oil Production, LHS ('000b/d) & WTI, RHS (US$/bbl), 1980-1990
Source: EIA, Bloomberg
Indeed, el-Badri's warning has hallmarks of past supply cuts by OPEC's Middle Eastern heavyweight such
as rising non-OPEC supplies and reduced demand in response to price shocks from the 1970s. Even
dramatic cut backs in OPEC production from Middle Eastern suppliers were not enough to prevent large
falls in WTI in the wake of rising supply and tepid demand.
Qatar Oil & Gas Report Q4 2013
© Business Monitor International Page 79
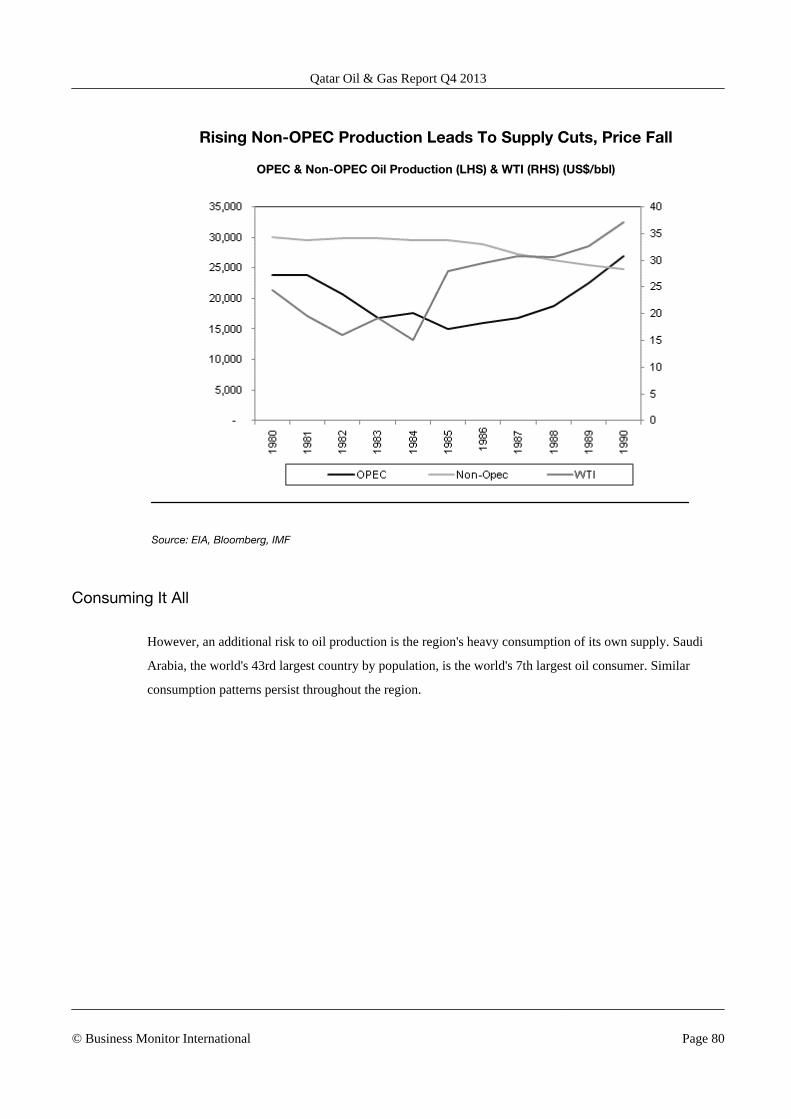
Rising Non-OPEC Production Leads To Supply Cuts, Price Fall
OPEC & Non-OPEC Oil Production (LHS) & WTI (RHS) (US$/bbl)
Source: EIA, Bloomberg, IMF
Consuming It All
However, an additional risk to oil production is the region's heavy consumption of its own supply. Saudi
Arabia, the world's 43rd largest country by population, is the world's 7th largest oil consumer. Similar
consumption patterns persist throughout the region.
Qatar Oil & Gas Report Q4 2013
© Business Monitor International Page 80
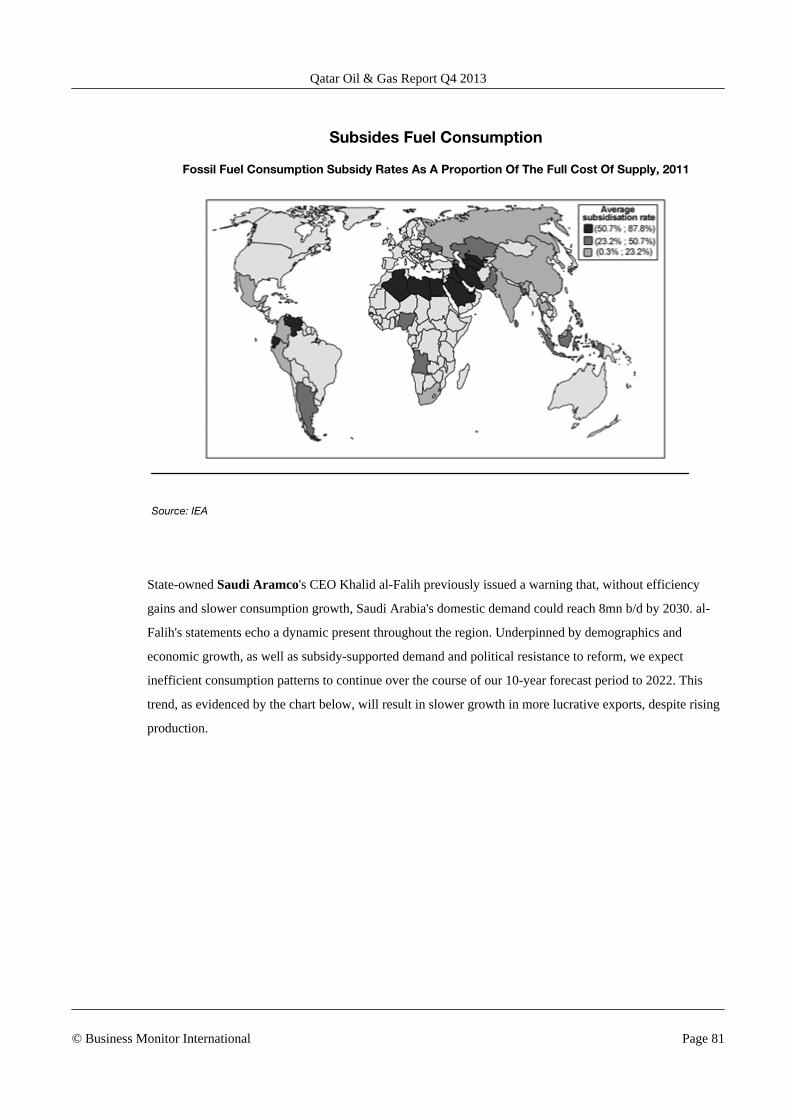
Subsides Fuel Consumption
Fossil Fuel Consumption Subsidy Rates As A Proportion Of The Full Cost Of Supply, 2011
Source: IEA
State-owned Saudi Aramco's CEO Khalid al-Falih previously issued a warning that, without efficiency
gains and slower consumption growth, Saudi Arabia's domestic demand could reach 8mn b/d by 2030. al-
Falih's statements echo a dynamic present throughout the region. Underpinned by demographics and
economic growth, as well as subsidy-supported demand and political resistance to reform, we expect
inefficient consumption patterns to continue over the course of our 10-year forecast period to 2022. This
trend, as evidenced by the chart below, will result in slower growth in more lucrative exports, despite rising
production.
Qatar Oil & Gas Report Q4 2013
© Business Monitor International Page 81
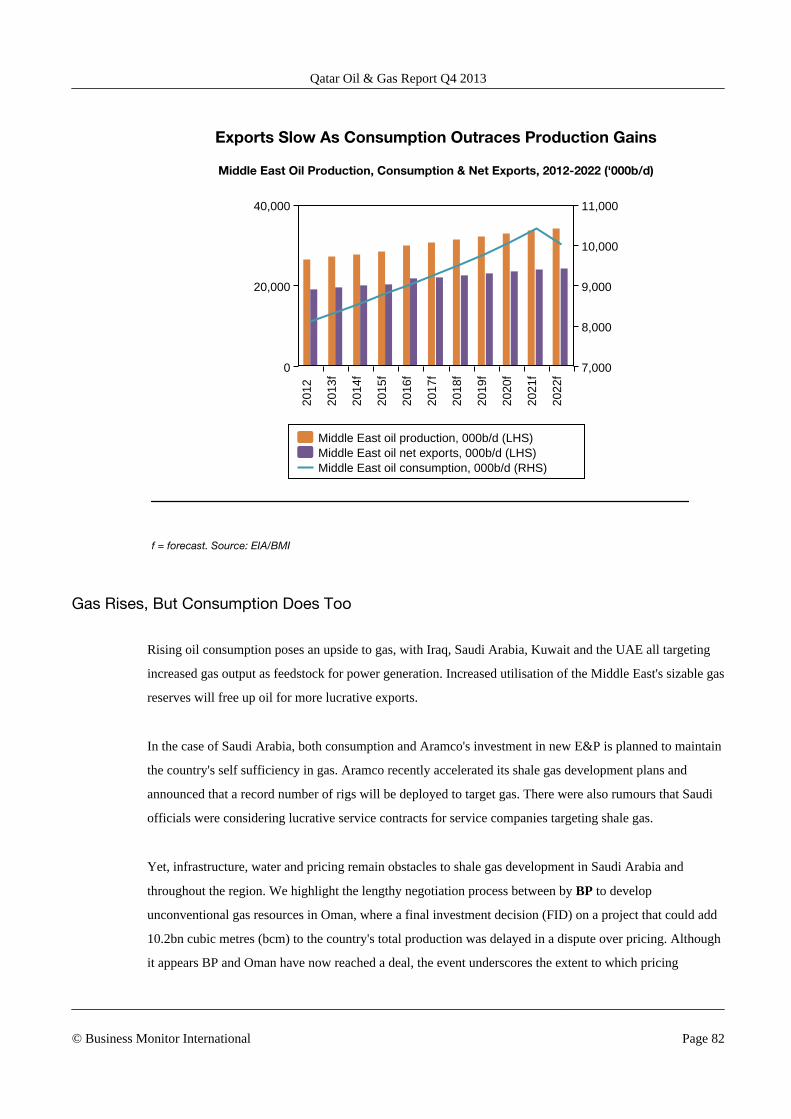
Exports Slow As Consumption Outraces Production Gains
Middle East Oil Production, Consumption & Net Exports, 2012-2022 ('000b/d)
Middle East oil production, 000b/d (LHS)Middle East oil net exports, 000b/d (LHS)Middle East oil consumption, 000b/d (RHS)
2012
2013
f
2014
f
2015
f
2016
f
2017
f
2018
f
2019
f
2020
f
2021
f
2022
f
0
20,000
40,000
8,000
9,000
10,000
11,000
7,000
f = forecast. Source: EIA/BMI
Gas Rises, But Consumption Does Too
Rising oil consumption poses an upside to gas, with Iraq, Saudi Arabia, Kuwait and the UAE all targeting
increased gas output as feedstock for power generation. Increased utilisation of the Middle East's sizable gas
reserves will free up oil for more lucrative exports.
In the case of Saudi Arabia, both consumption and Aramco's investment in new E&P is planned to maintain
the country's self sufficiency in gas. Aramco recently accelerated its shale gas development plans and
announced that a record number of rigs will be deployed to target gas. There were also rumours that Saudi
officials were considering lucrative service contracts for service companies targeting shale gas.
Yet, infrastructure, water and pricing remain obstacles to shale gas development in Saudi Arabia and
throughout the region. We highlight the lengthy negotiation process between by BP to develop
unconventional gas resources in Oman, where a final investment decision (FID) on a project that could add
10.2bn cubic metres (bcm) to the country's total production was delayed in a dispute over pricing. Although
it appears BP and Oman have now reached a deal, the event underscores the extent to which pricing
Qatar Oil & Gas Report Q4 2013
© Business Monitor International Page 82
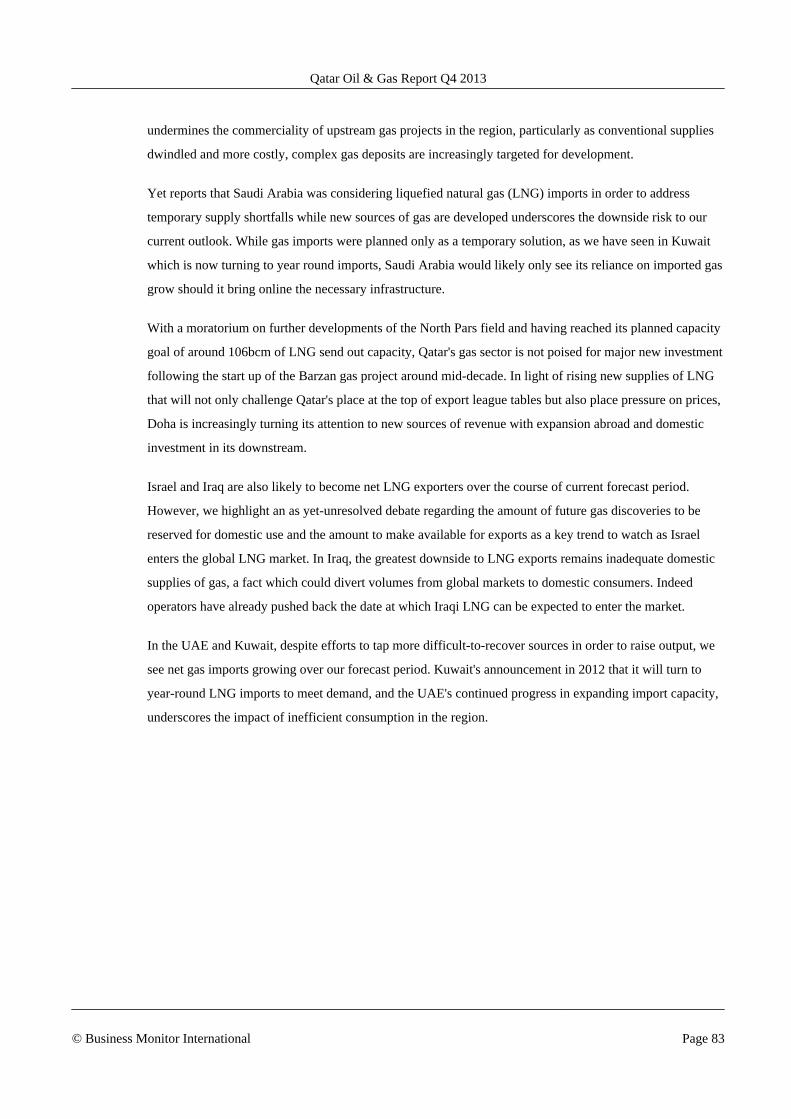
undermines the commerciality of upstream gas projects in the region, particularly as conventional supplies
dwindled and more costly, complex gas deposits are increasingly targeted for development.
Yet reports that Saudi Arabia was considering liquefied natural gas (LNG) imports in order to address
temporary supply shortfalls while new sources of gas are developed underscores the downside risk to our
current outlook. While gas imports were planned only as a temporary solution, as we have seen in Kuwait
which is now turning to year round imports, Saudi Arabia would likely only see its reliance on imported gas
grow should it bring online the necessary infrastructure.
With a moratorium on further developments of the North Pars field and having reached its planned capacity
goal of around 106bcm of LNG send out capacity, Qatar's gas sector is not poised for major new investment
following the start up of the Barzan gas project around mid-decade. In light of rising new supplies of LNG
that will not only challenge Qatar's place at the top of export league tables but also place pressure on prices,
Doha is increasingly turning its attention to new sources of revenue with expansion abroad and domestic
investment in its downstream.
Israel and Iraq are also likely to become net LNG exporters over the course of current forecast period.
However, we highlight an as yet-unresolved debate regarding the amount of future gas discoveries to be
reserved for domestic use and the amount to make available for exports as a key trend to watch as Israel
enters the global LNG market. In Iraq, the greatest downside to LNG exports remains inadequate domestic
supplies of gas, a fact which could divert volumes from global markets to domestic consumers. Indeed
operators have already pushed back the date at which Iraqi LNG can be expected to enter the market.
In the UAE and Kuwait, despite efforts to tap more difficult-to-recover sources in order to raise output, we
see net gas imports growing over our forecast period. Kuwait's announcement in 2012 that it will turn to
year-round LNG imports to meet demand, and the UAE's continued progress in expanding import capacity,
underscores the impact of inefficient consumption in the region.
Qatar Oil & Gas Report Q4 2013
© Business Monitor International Page 83
Rising Consumption
Middle East Gas Production, Consumption & Net Exports, 2010-2021 (bcm)
Middle East gas consumption, bcm (LHS)Middle East gas production, bcm (LHS)Middle East gas net exports, bcm (RHS)
2010
2011
2012
2013
f
2014
f
2015
f
2016
f
2017
f
2018
f
2019
f
2020
f
0
250
500
750
0
-50
-25
25
50
f = forecast. Source: EIA/BMI
With Iraq having overtaken Iran as OPEC's number two producer, sanctions continue to take their toll on
Iranian output despite some tentative movement on the diplomatic front. The near-term prospects for Iran's
oil sector remain dire, with sanctions crippling a sector already in need of significant investment in both
upstream and downstream capacity. With little evidence to suggest a diplomatic resolution is close at hand,
we remain bearish in our outlook for the oil sector, which remains difficult to forecast.
The latest data suggest Iranian crude exports in 2012 averaged 1.5mn b/d, a staggering fall of around 1mn b/
d from 2011 figures. New sanctions introduced in February may further damage the sector as they limit
Iran's ability to repatriate profits from oil trade. While Tehran has and continues to find novel ways to skirt
sanctions, the loss of revenue has been significant and Iran's oil and gas sector remains largely cut off from
foreign investment.
The long-term impact of sanctions is particularly worrying for Iran, as the oil and gas sector was already
struggling from underinvestment prior to the implementation of sanctions. A number of developments have
been cancelled, contractors have pulled out, and according to the IEA sustainable production capacity has
Qatar Oil & Gas Report Q4 2013
© Business Monitor International Page 84
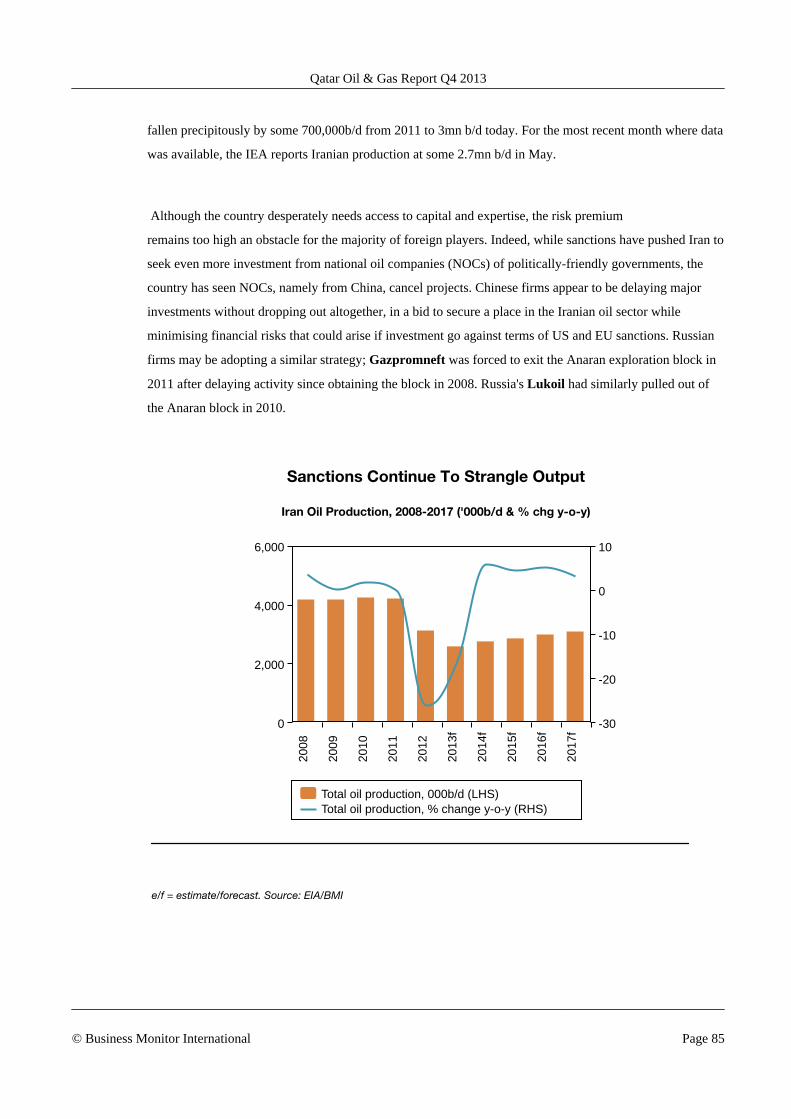
fallen precipitously by some 700,000b/d from 2011 to 3mn b/d today. For the most recent month where data
was available, the IEA reports Iranian production at some 2.7mn b/d in May.
Although the country desperately needs access to capital and expertise, the risk premium
remains too high an obstacle for the majority of foreign players. Indeed, while sanctions have pushed Iran to
seek even more investment from national oil companies (NOCs) of politically-friendly governments, the
country has seen NOCs, namely from China, cancel projects. Chinese firms appear to be delaying major
investments without dropping out altogether, in a bid to secure a place in the Iranian oil sector while
minimising financial risks that could arise if investment go against terms of US and EU sanctions. Russian
firms may be adopting a similar strategy; Gazpromneft was forced to exit the Anaran exploration block in
2011 after delaying activity since obtaining the block in 2008. Russia's Lukoil had similarly pulled out of
the Anaran block in 2010.
Sanctions Continue To Strangle Output
Iran Oil Production, 2008-2017 ('000b/d & % chg y-o-y)
Total oil production, 000b/d (LHS)Total oil production, % change y-o-y (RHS)
2008
2009
2010
2011
2012
2013
f
2014
f
2015
f
2016
f
2017
f
0
2,000
4,000
6,000
-30
-20
-10
0
10
e/f = estimate/forecast. Source: EIA/BMI
Qatar Oil & Gas Report Q4 2013
© Business Monitor International Page 85
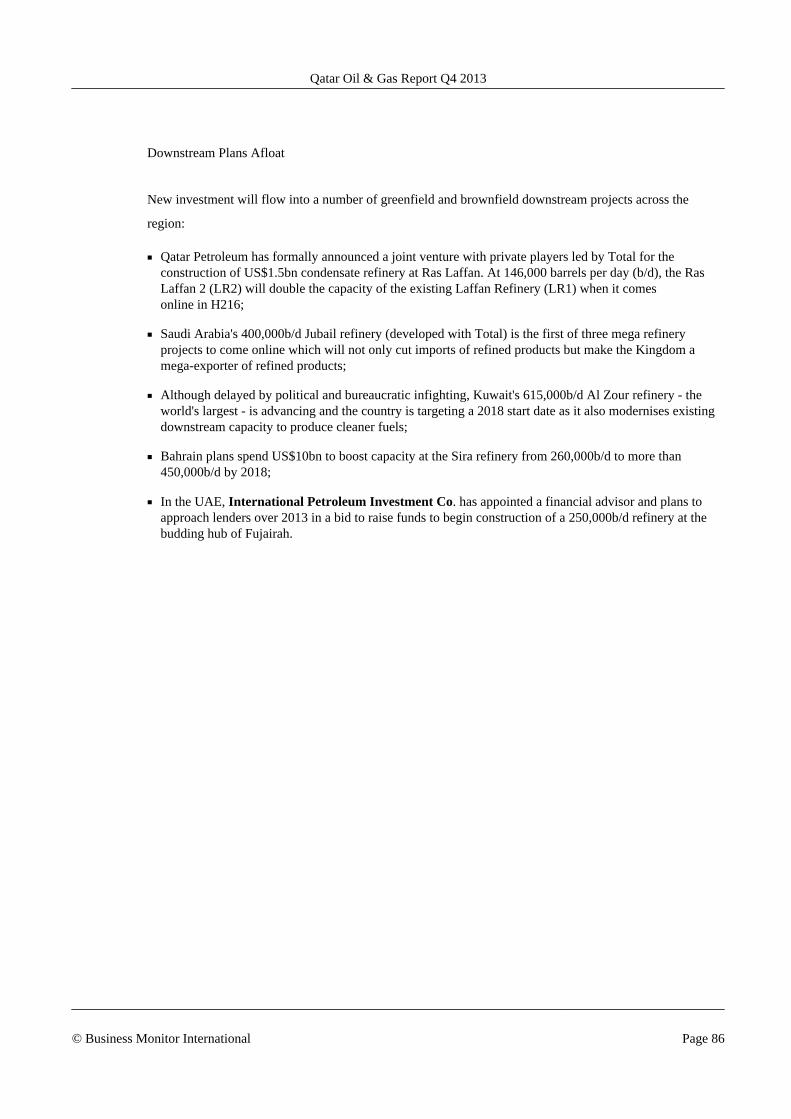
Downstream Plans Afloat
New investment will flow into a number of greenfield and brownfield downstream projects across the
region:
■ Qatar Petroleum has formally announced a joint venture with private players led by Total for theconstruction of US$1.5bn condensate refinery at Ras Laffan. At 146,000 barrels per day (b/d), the RasLaffan 2 (LR2) will double the capacity of the existing Laffan Refinery (LR1) when it comesonline in H216;
■ Saudi Arabia's 400,000b/d Jubail refinery (developed with Total) is the first of three mega refineryprojects to come online which will not only cut imports of refined products but make the Kingdom amega-exporter of refined products;
■ Although delayed by political and bureaucratic infighting, Kuwait's 615,000b/d Al Zour refinery - theworld's largest - is advancing and the country is targeting a 2018 start date as it also modernises existingdownstream capacity to produce cleaner fuels;
■ Bahrain plans spend US$10bn to boost capacity at the Sira refinery from 260,000b/d to more than450,000b/d by 2018;
■ In the UAE, International Petroleum Investment Co. has appointed a financial advisor and plans toapproach lenders over 2013 in a bid to raise funds to begin construction of a 250,000b/d refinery at thebudding hub of Fujairah.
Qatar Oil & Gas Report Q4 2013
© Business Monitor International Page 86
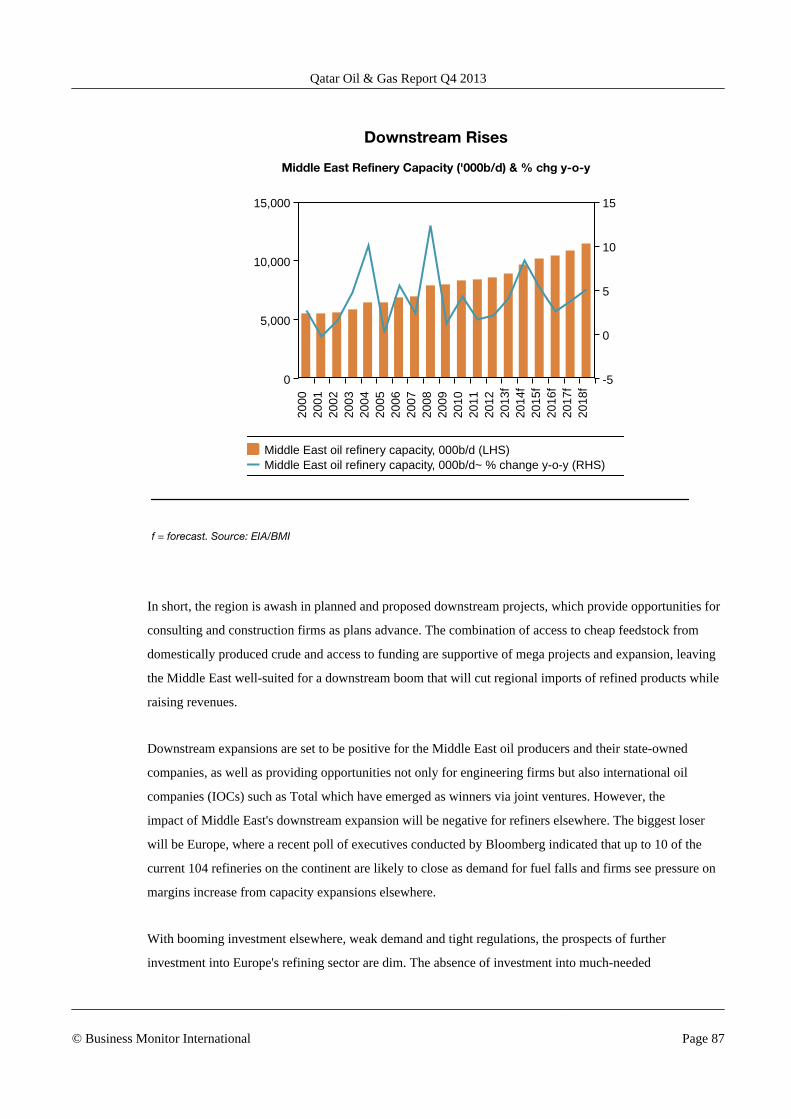
Downstream Rises
Middle East Refinery Capacity ('000b/d) & % chg y-o-y
Middle East oil refinery capacity, 000b/d (LHS)Middle East oil refinery capacity, 000b/d~ % change y-o-y (RHS)
2000
2001
2002
2003
2004
2005
2006
2007
2008
2009
2010
2011
2012
2013
f20
14f
2015
f20
16f
2017
f20
18f
0
5,000
10,000
15,000
0
5
10
15
-5
f = forecast. Source: EIA/BMI
In short, the region is awash in planned and proposed downstream projects, which provide opportunities for
consulting and construction firms as plans advance. The combination of access to cheap feedstock from
domestically produced crude and access to funding are supportive of mega projects and expansion, leaving
the Middle East well-suited for a downstream boom that will cut regional imports of refined products while
raising revenues.
Downstream expansions are set to be positive for the Middle East oil producers and their state-owned
companies, as well as providing opportunities not only for engineering firms but also international oil
companies (IOCs) such as Total which have emerged as winners via joint ventures. However, the
impact of Middle East's downstream expansion will be negative for refiners elsewhere. The biggest loser
will be Europe, where a recent poll of executives conducted by Bloomberg indicated that up to 10 of the
current 104 refineries on the continent are likely to close as demand for fuel falls and firms see pressure on
margins increase from capacity expansions elsewhere.
With booming investment elsewhere, weak demand and tight regulations, the prospects of further
investment into Europe's refining sector are dim. The absence of investment into much-needed
Qatar Oil & Gas Report Q4 2013
© Business Monitor International Page 87

modernisation will only put the region further behind its peers and increase its exposure to further capacity
rationalisations. However, Asia, which is also experiencing a boom in downstream investment, could also
face pressure from rising Middle East exports. SK Energy, the largest refiner by volume in South Korea,
told the Wall Street Journal through a spokesman in March that the firm expected new plants from the
Middle East to force margins lower. Indeed, as capacity booms in the region, particularly in China, India's
largest refiner Reliance Industries has said that it plans to reduce operational costs so that the firm can
compete with projects from the Persian Gulf.
Qatar Oil & Gas Report Q4 2013
© Business Monitor International Page 88
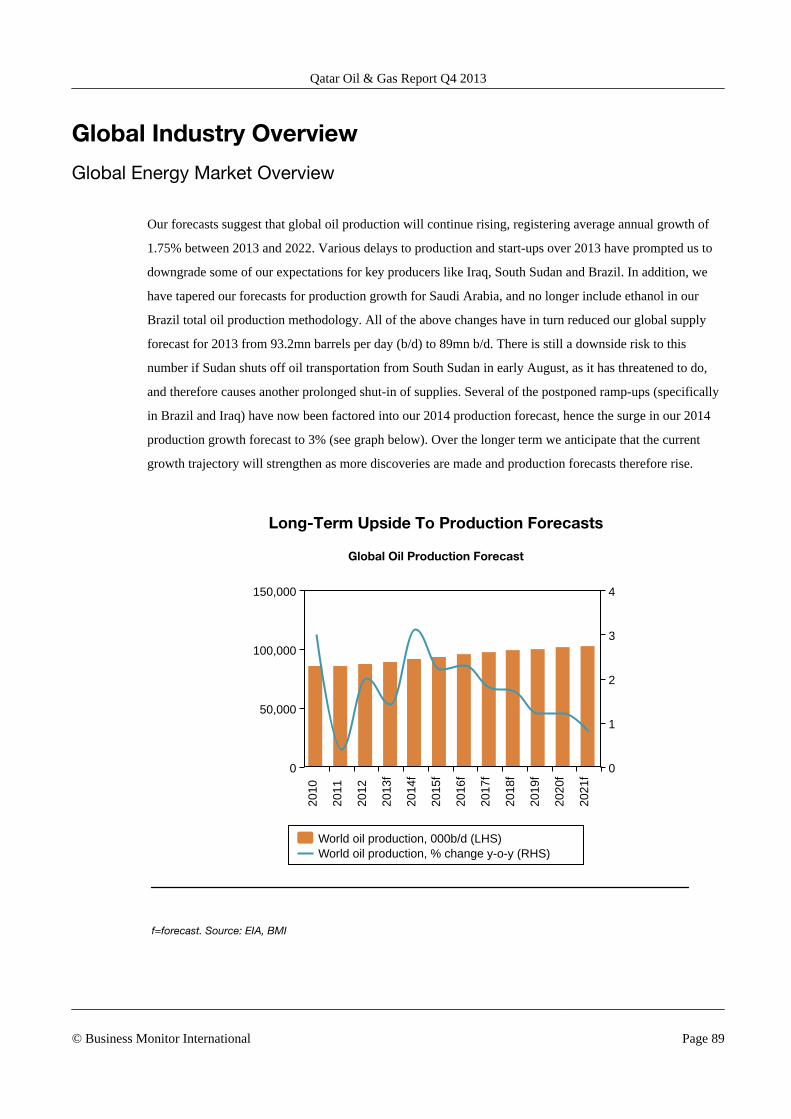
Global Industry Overview
Global Energy Market Overview
Our forecasts suggest that global oil production will continue rising, registering average annual growth of
1.75% between 2013 and 2022. Various delays to production and start-ups over 2013 have prompted us to
downgrade some of our expectations for key producers like Iraq, South Sudan and Brazil. In addition, we
have tapered our forecasts for production growth for Saudi Arabia, and no longer include ethanol in our
Brazil total oil production methodology. All of the above changes have in turn reduced our global supply
forecast for 2013 from 93.2mn barrels per day (b/d) to 89mn b/d. There is still a downside risk to this
number if Sudan shuts off oil transportation from South Sudan in early August, as it has threatened to do,
and therefore causes another prolonged shut-in of supplies. Several of the postponed ramp-ups (specifically
in Brazil and Iraq) have now been factored into our 2014 production forecast, hence the surge in our 2014
production growth forecast to 3% (see graph below). Over the longer term we anticipate that the current
growth trajectory will strengthen as more discoveries are made and production forecasts therefore rise.
Long-Term Upside To Production Forecasts
Global Oil Production Forecast
World oil production, 000b/d (LHS)World oil production, % change y-o-y (RHS)
2010
2011
2012
2013
f
2014
f
2015
f
2016
f
2017
f
2018
f
2019
f
2020
f
2021
f
0
50,000
100,000
150,000
0
1
2
3
4
f=forecast. Source: EIA, BMI
Qatar Oil & Gas Report Q4 2013
© Business Monitor International Page 89
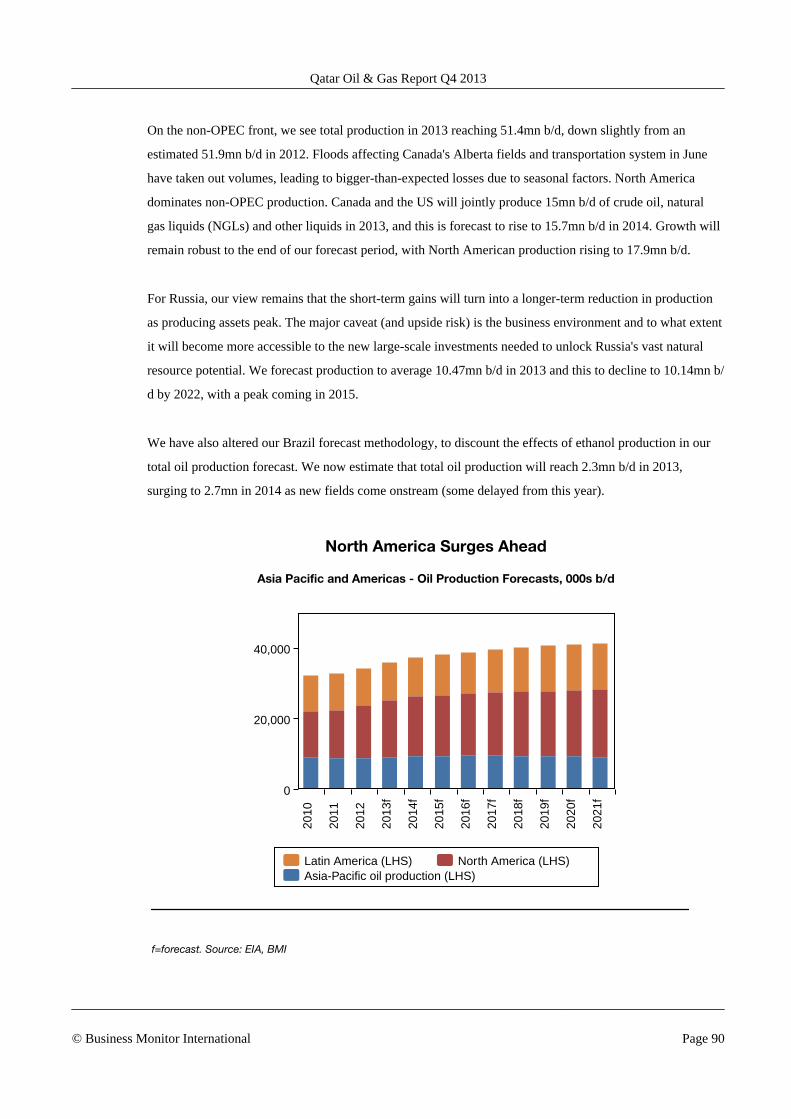
On the non-OPEC front, we see total production in 2013 reaching 51.4mn b/d, down slightly from an
estimated 51.9mn b/d in 2012. Floods affecting Canada's Alberta fields and transportation system in June
have taken out volumes, leading to bigger-than-expected losses due to seasonal factors. North America
dominates non-OPEC production. Canada and the US will jointly produce 15mn b/d of crude oil, natural
gas liquids (NGLs) and other liquids in 2013, and this is forecast to rise to 15.7mn b/d in 2014. Growth will
remain robust to the end of our forecast period, with North American production rising to 17.9mn b/d.
For Russia, our view remains that the short-term gains will turn into a longer-term reduction in production
as producing assets peak. The major caveat (and upside risk) is the business environment and to what extent
it will become more accessible to the new large-scale investments needed to unlock Russia's vast natural
resource potential. We forecast production to average 10.47mn b/d in 2013 and this to decline to 10.14mn b/
d by 2022, with a peak coming in 2015.
We have also altered our Brazil forecast methodology, to discount the effects of ethanol production in our
total oil production forecast. We now estimate that total oil production will reach 2.3mn b/d in 2013,
surging to 2.7mn in 2014 as new fields come onstream (some delayed from this year).
North America Surges Ahead
Asia Pacific and Americas - Oil Production Forecasts, 000s b/d
Latin America (LHS) North America (LHS)Asia-Pacific oil production (LHS)
2010
2011
2012
2013
f
2014
f
2015
f
2016
f
2017
f
2018
f
2019
f
2020
f
2021
f
0
20,000
40,000
f=forecast. Source: EIA, BMI
Qatar Oil & Gas Report Q4 2013
© Business Monitor International Page 90
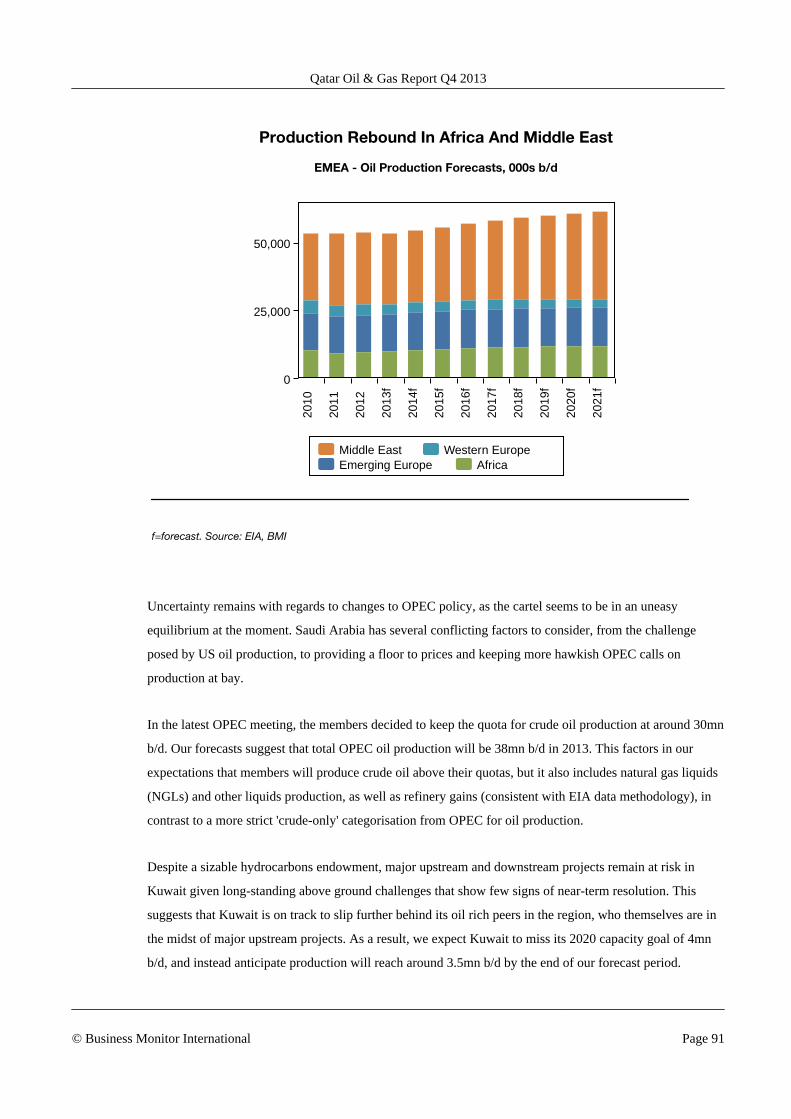
Production Rebound In Africa And Middle East
EMEA - Oil Production Forecasts, 000s b/d
Middle East Western EuropeEmerging Europe Africa
2010
2011
2012
2013
f
2014
f
2015
f
2016
f
2017
f
2018
f
2019
f
2020
f
2021
f
0
25,000
50,000
f=forecast. Source: EIA, BMI
Uncertainty remains with regards to changes to OPEC policy, as the cartel seems to be in an uneasy
equilibrium at the moment. Saudi Arabia has several conflicting factors to consider, from the challenge
posed by US oil production, to providing a floor to prices and keeping more hawkish OPEC calls on
production at bay.
In the latest OPEC meeting, the members decided to keep the quota for crude oil production at around 30mn
b/d. Our forecasts suggest that total OPEC oil production will be 38mn b/d in 2013. This factors in our
expectations that members will produce crude oil above their quotas, but it also includes natural gas liquids
(NGLs) and other liquids production, as well as refinery gains (consistent with EIA data methodology), in
contrast to a more strict 'crude-only' categorisation from OPEC for oil production.
Despite a sizable hydrocarbons endowment, major upstream and downstream projects remain at risk in
Kuwait given long-standing above ground challenges that show few signs of near-term resolution. This
suggests that Kuwait is on track to slip further behind its oil rich peers in the region, who themselves are in
the midst of major upstream projects. As a result, we expect Kuwait to miss its 2020 capacity goal of 4mn
b/d, and instead anticipate production will reach around 3.5mn b/d by the end of our forecast period.
Qatar Oil & Gas Report Q4 2013
© Business Monitor International Page 91
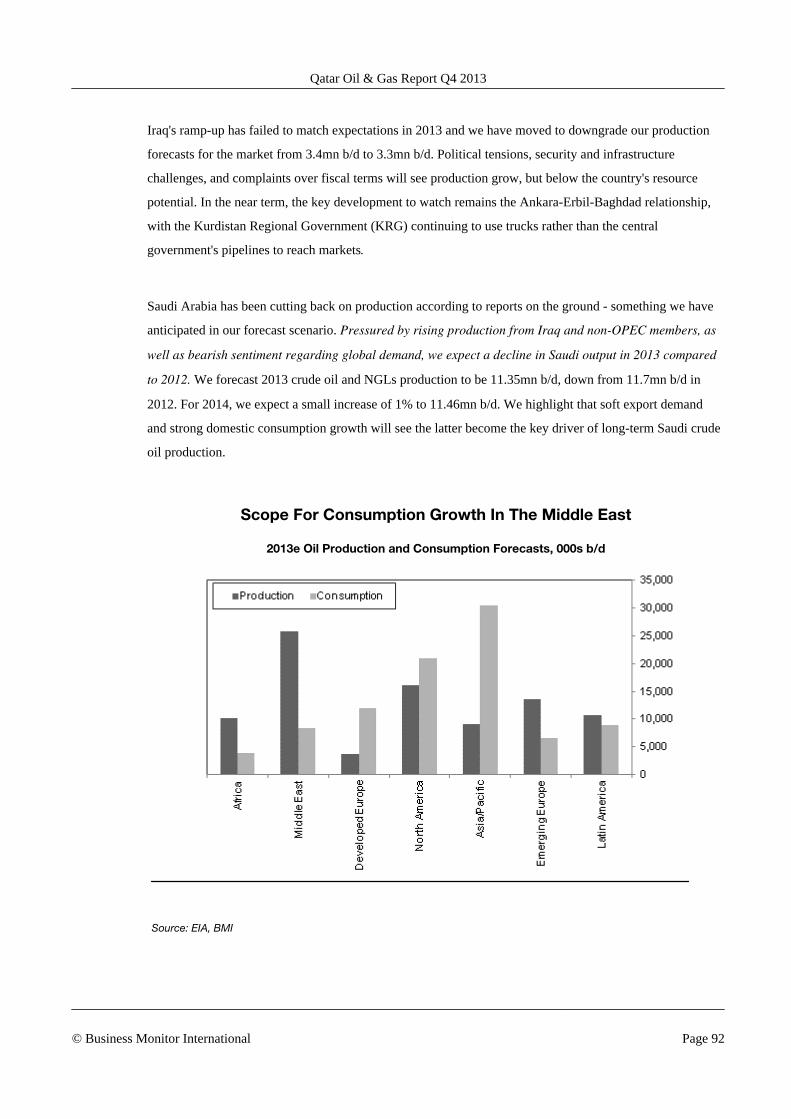
Iraq's ramp-up has failed to match expectations in 2013 and we have moved to downgrade our production
forecasts for the market from 3.4mn b/d to 3.3mn b/d. Political tensions, security and infrastructure
challenges, and complaints over fiscal terms will see production grow, but below the country's resource
potential. In the near term, the key development to watch remains the Ankara-Erbil-Baghdad relationship,
with the Kurdistan Regional Government (KRG) continuing to use trucks rather than the central
government's pipelines to reach markets.
Saudi Arabia has been cutting back on production according to reports on the ground - something we have
anticipated in our forecast scenario. Pressured by rising production from Iraq and non-OPEC members, as
well as bearish sentiment regarding global demand, we expect a decline in Saudi output in 2013 compared
to 2012. We forecast 2013 crude oil and NGLs production to be 11.35mn b/d, down from 11.7mn b/d in
2012. For 2014, we expect a small increase of 1% to 11.46mn b/d. We highlight that soft export demand
and strong domestic consumption growth will see the latter become the key driver of long-term Saudi crude
oil production.
Scope For Consumption Growth In The Middle East
2013e Oil Production and Consumption Forecasts, 000s b/d
Source: EIA, BMI
Qatar Oil & Gas Report Q4 2013
© Business Monitor International Page 92
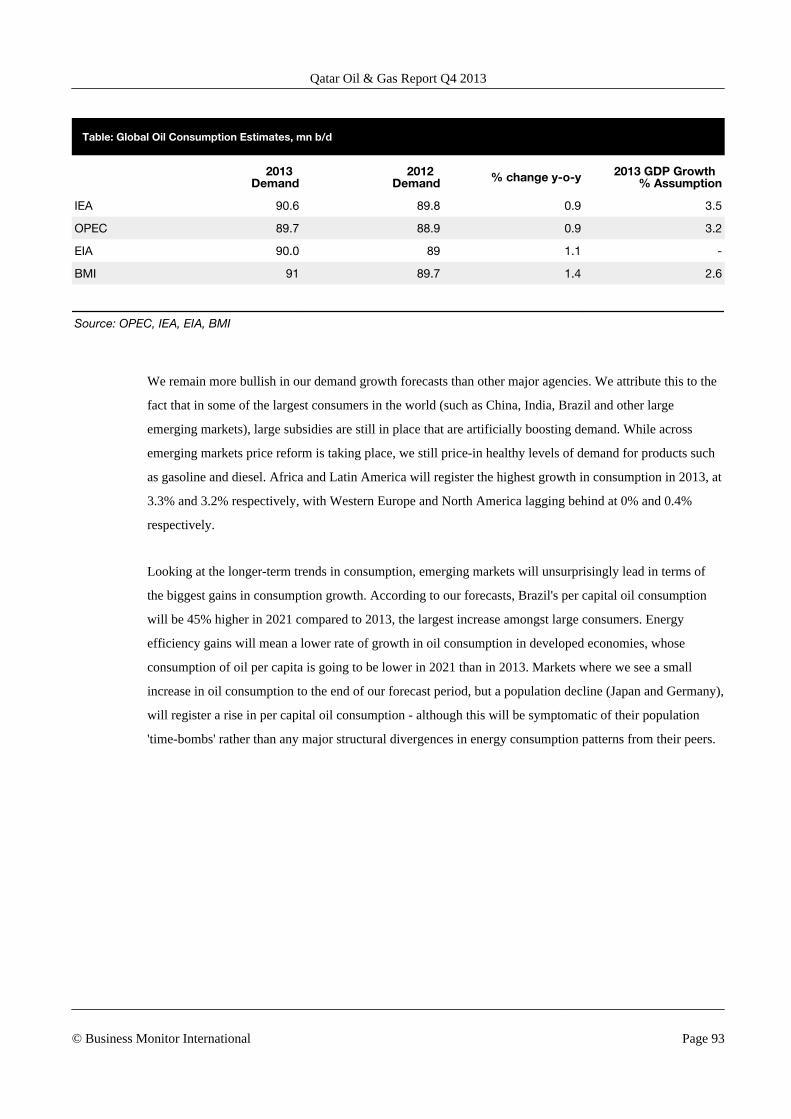
Table: Global Oil Consumption Estimates, mn b/d
2013
Demand2012
Demand % change y-o-y 2013 GDP Growth % Assumption
IEA 90.6 89.8 0.9 3.5
OPEC 89.7 88.9 0.9 3.2
EIA 90.0 89 1.1 -
BMI 91 89.7 1.4 2.6
Source: OPEC, IEA, EIA, BMI
We remain more bullish in our demand growth forecasts than other major agencies. We attribute this to the
fact that in some of the largest consumers in the world (such as China, India, Brazil and other large
emerging markets), large subsidies are still in place that are artificially boosting demand. While across
emerging markets price reform is taking place, we still price-in healthy levels of demand for products such
as gasoline and diesel. Africa and Latin America will register the highest growth in consumption in 2013, at
3.3% and 3.2% respectively, with Western Europe and North America lagging behind at 0% and 0.4%
respectively.
Looking at the longer-term trends in consumption, emerging markets will unsurprisingly lead in terms of
the biggest gains in consumption growth. According to our forecasts, Brazil's per capital oil consumption
will be 45% higher in 2021 compared to 2013, the largest increase amongst large consumers. Energy
efficiency gains will mean a lower rate of growth in oil consumption in developed economies, whose
consumption of oil per capita is going to be lower in 2021 than in 2013. Markets where we see a small
increase in oil consumption to the end of our forecast period, but a population decline (Japan and Germany),
will register a rise in per capital oil consumption - although this will be symptomatic of their population
'time-bombs' rather than any major structural divergences in energy consumption patterns from their peers.
Qatar Oil & Gas Report Q4 2013
© Business Monitor International Page 93
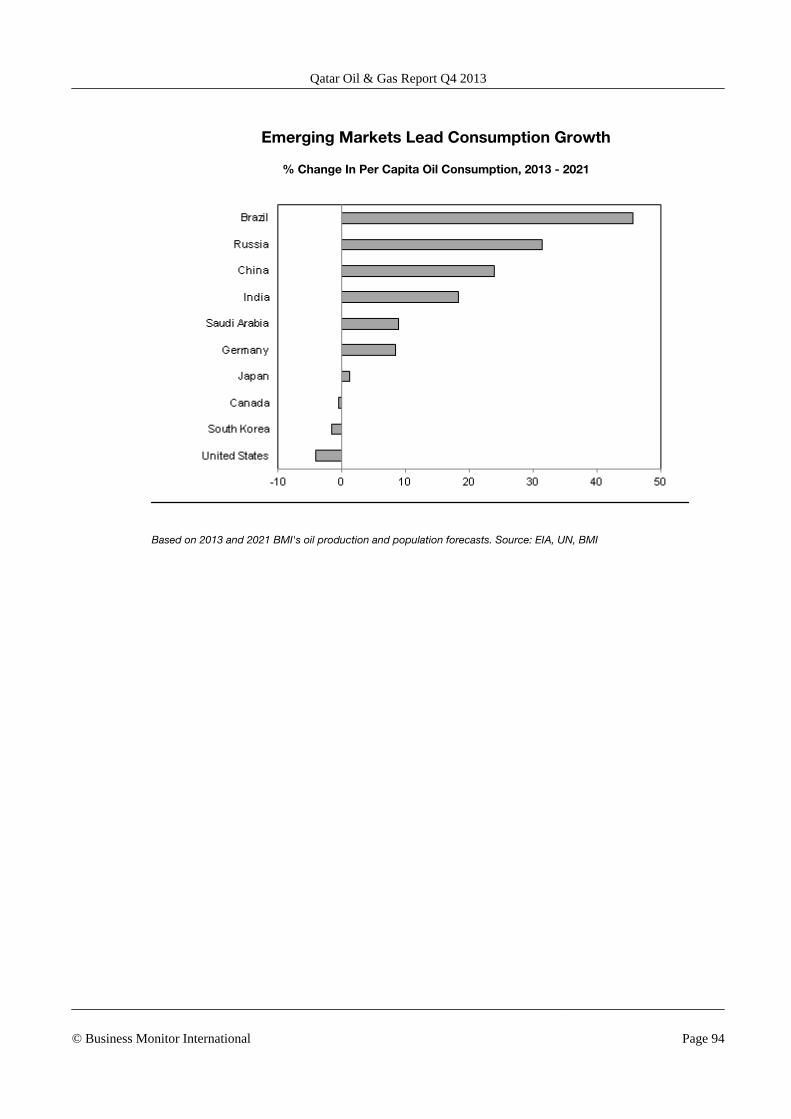
Emerging Markets Lead Consumption Growth
% Change In Per Capita Oil Consumption, 2013 - 2021
Based on 2013 and 2021 BMI's oil production and population forecasts. Source: EIA, UN, BMI
Qatar Oil & Gas Report Q4 2013
© Business Monitor International Page 94
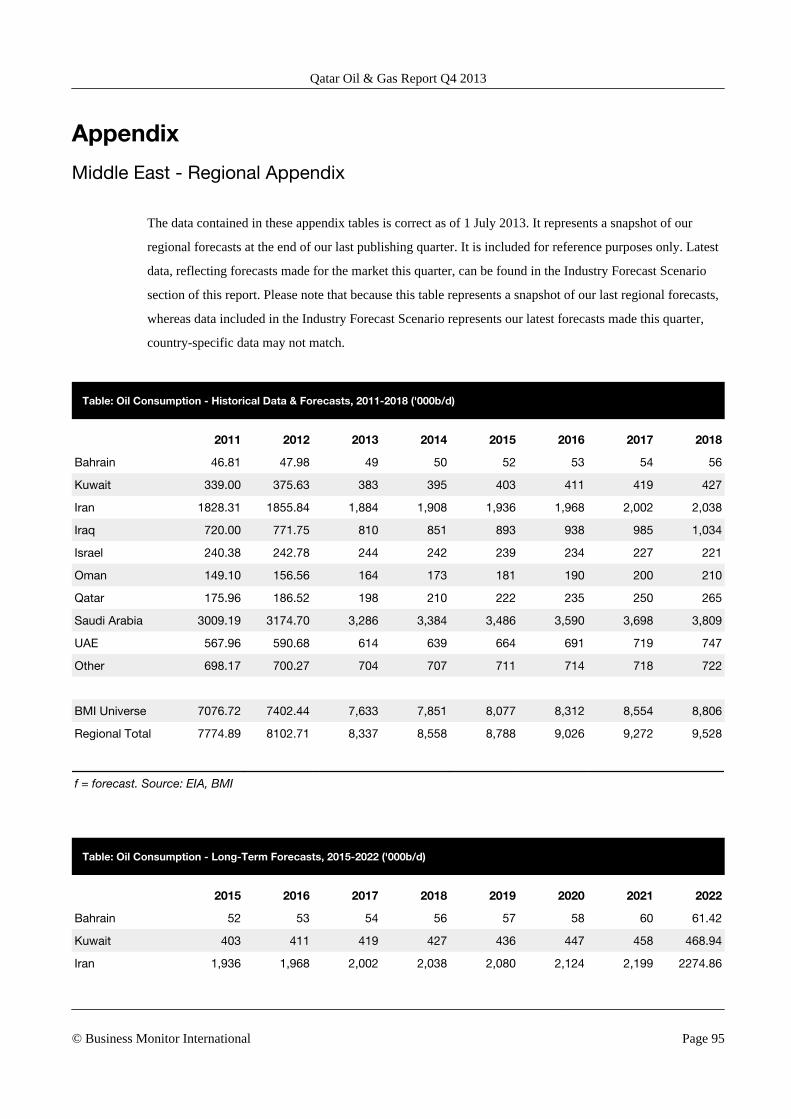
Appendix
Middle East - Regional Appendix
The data contained in these appendix tables is correct as of 1 July 2013. It represents a snapshot of our
regional forecasts at the end of our last publishing quarter. It is included for reference purposes only. Latest
data, reflecting forecasts made for the market this quarter, can be found in the Industry Forecast Scenario
section of this report. Please note that because this table represents a snapshot of our last regional forecasts,
whereas data included in the Industry Forecast Scenario represents our latest forecasts made this quarter,
country-specific data may not match.
Table: Oil Consumption - Historical Data & Forecasts, 2011-2018 ('000b/d)
2011 2012 2013 2014 2015 2016 2017 2018
Bahrain 46.81 47.98 49 50 52 53 54 56
Kuwait 339.00 375.63 383 395 403 411 419 427
Iran 1828.31 1855.84 1,884 1,908 1,936 1,968 2,002 2,038
Iraq 720.00 771.75 810 851 893 938 985 1,034
Israel 240.38 242.78 244 242 239 234 227 221
Oman 149.10 156.56 164 173 181 190 200 210
Qatar 175.96 186.52 198 210 222 235 250 265
Saudi Arabia 3009.19 3174.70 3,286 3,384 3,486 3,590 3,698 3,809
UAE 567.96 590.68 614 639 664 691 719 747
Other 698.17 700.27 704 707 711 714 718 722
BMI Universe 7076.72 7402.44 7,633 7,851 8,077 8,312 8,554 8,806
Regional Total 7774.89 8102.71 8,337 8,558 8,788 9,026 9,272 9,528
f = forecast. Source: EIA, BMI
Table: Oil Consumption - Long-Term Forecasts, 2015-2022 ('000b/d)
2015 2016 2017 2018 2019 2020 2021 2022
Bahrain 52 53 54 56 57 58 60 61.42
Kuwait 403 411 419 427 436 447 458 468.94
Iran 1,936 1,968 2,002 2,038 2,080 2,124 2,199 2274.86
Qatar Oil & Gas Report Q4 2013
© Business Monitor International Page 95
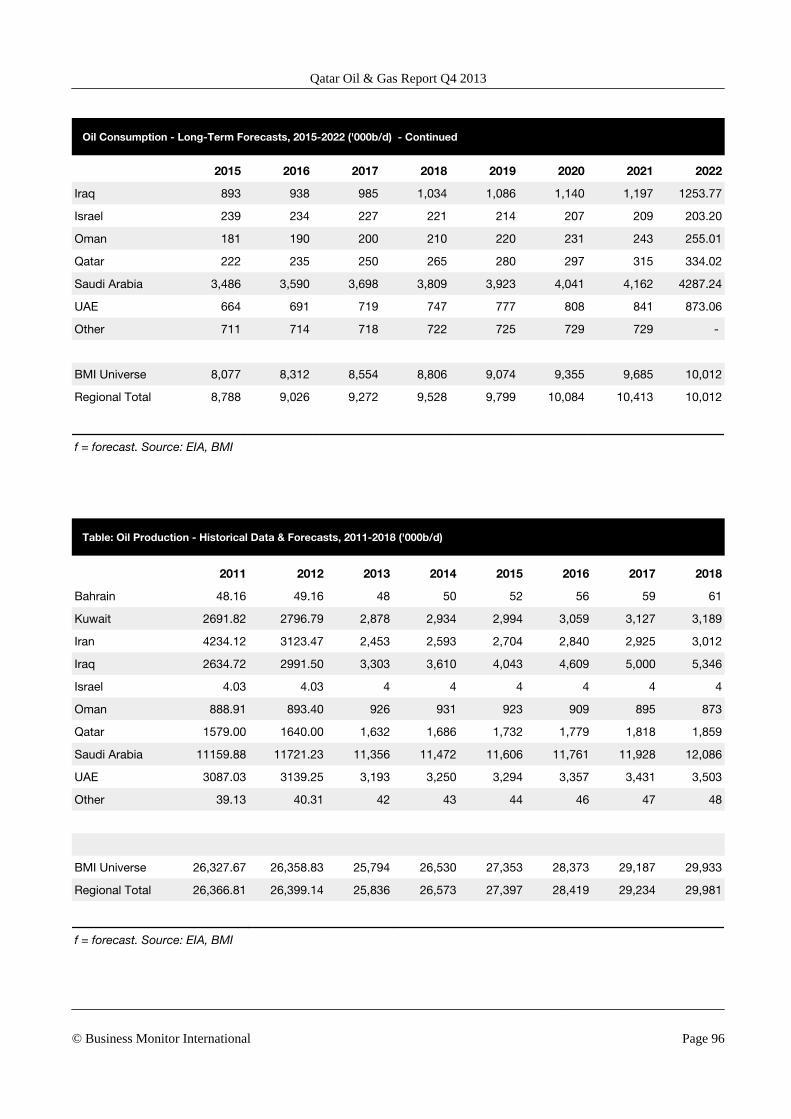
Oil Consumption - Long-Term Forecasts, 2015-2022 ('000b/d) - Continued
2015 2016 2017 2018 2019 2020 2021 2022
Iraq 893 938 985 1,034 1,086 1,140 1,197 1253.77
Israel 239 234 227 221 214 207 209 203.20
Oman 181 190 200 210 220 231 243 255.01
Qatar 222 235 250 265 280 297 315 334.02
Saudi Arabia 3,486 3,590 3,698 3,809 3,923 4,041 4,162 4287.24
UAE 664 691 719 747 777 808 841 873.06
Other 711 714 718 722 725 729 729 -
BMI Universe 8,077 8,312 8,554 8,806 9,074 9,355 9,685 10,012
Regional Total 8,788 9,026 9,272 9,528 9,799 10,084 10,413 10,012
f = forecast. Source: EIA, BMI
Table: Oil Production - Historical Data & Forecasts, 2011-2018 ('000b/d)
2011 2012 2013 2014 2015 2016 2017 2018
Bahrain 48.16 49.16 48 50 52 56 59 61
Kuwait 2691.82 2796.79 2,878 2,934 2,994 3,059 3,127 3,189
Iran 4234.12 3123.47 2,453 2,593 2,704 2,840 2,925 3,012
Iraq 2634.72 2991.50 3,303 3,610 4,043 4,609 5,000 5,346
Israel 4.03 4.03 4 4 4 4 4 4
Oman 888.91 893.40 926 931 923 909 895 873
Qatar 1579.00 1640.00 1,632 1,686 1,732 1,779 1,818 1,859
Saudi Arabia 11159.88 11721.23 11,356 11,472 11,606 11,761 11,928 12,086
UAE 3087.03 3139.25 3,193 3,250 3,294 3,357 3,431 3,503
Other 39.13 40.31 42 43 44 46 47 48
BMI Universe 26,327.67 26,358.83 25,794 26,530 27,353 28,373 29,187 29,933
Regional Total 26,366.81 26,399.14 25,836 26,573 27,397 28,419 29,234 29,981
f = forecast. Source: EIA, BMI
Qatar Oil & Gas Report Q4 2013
© Business Monitor International Page 96
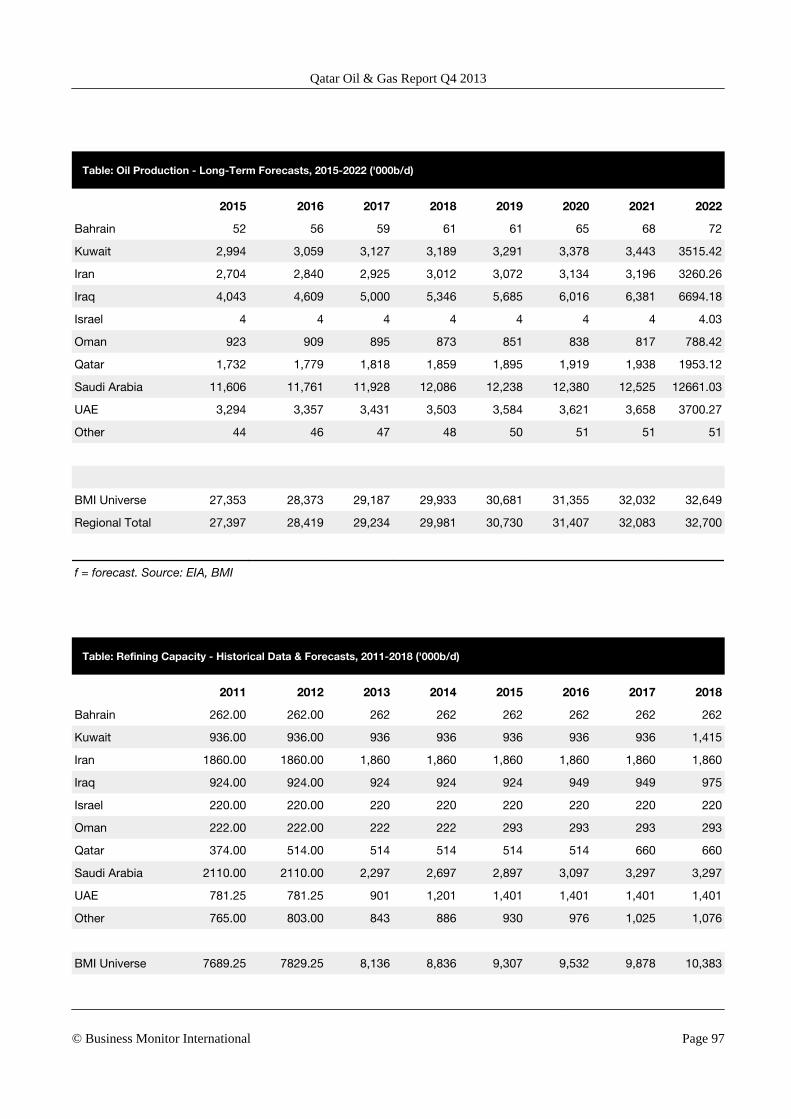
Table: Oil Production - Long-Term Forecasts, 2015-2022 ('000b/d)
2015 2016 2017 2018 2019 2020 2021 2022
Bahrain 52 56 59 61 61 65 68 72
Kuwait 2,994 3,059 3,127 3,189 3,291 3,378 3,443 3515.42
Iran 2,704 2,840 2,925 3,012 3,072 3,134 3,196 3260.26
Iraq 4,043 4,609 5,000 5,346 5,685 6,016 6,381 6694.18
Israel 4 4 4 4 4 4 4 4.03
Oman 923 909 895 873 851 838 817 788.42
Qatar 1,732 1,779 1,818 1,859 1,895 1,919 1,938 1953.12
Saudi Arabia 11,606 11,761 11,928 12,086 12,238 12,380 12,525 12661.03
UAE 3,294 3,357 3,431 3,503 3,584 3,621 3,658 3700.27
Other 44 46 47 48 50 51 51 51
BMI Universe 27,353 28,373 29,187 29,933 30,681 31,355 32,032 32,649
Regional Total 27,397 28,419 29,234 29,981 30,730 31,407 32,083 32,700
f = forecast. Source: EIA, BMI
Table: Refining Capacity - Historical Data & Forecasts, 2011-2018 ('000b/d)
2011 2012 2013 2014 2015 2016 2017 2018
Bahrain 262.00 262.00 262 262 262 262 262 262
Kuwait 936.00 936.00 936 936 936 936 936 1,415
Iran 1860.00 1860.00 1,860 1,860 1,860 1,860 1,860 1,860
Iraq 924.00 924.00 924 924 924 949 949 975
Israel 220.00 220.00 220 220 220 220 220 220
Oman 222.00 222.00 222 222 293 293 293 293
Qatar 374.00 514.00 514 514 514 514 660 660
Saudi Arabia 2110.00 2110.00 2,297 2,697 2,897 3,097 3,297 3,297
UAE 781.25 781.25 901 1,201 1,401 1,401 1,401 1,401
Other 765.00 803.00 843 886 930 976 1,025 1,076
BMI Universe 7689.25 7829.25 8,136 8,836 9,307 9,532 9,878 10,383
Qatar Oil & Gas Report Q4 2013
© Business Monitor International Page 97
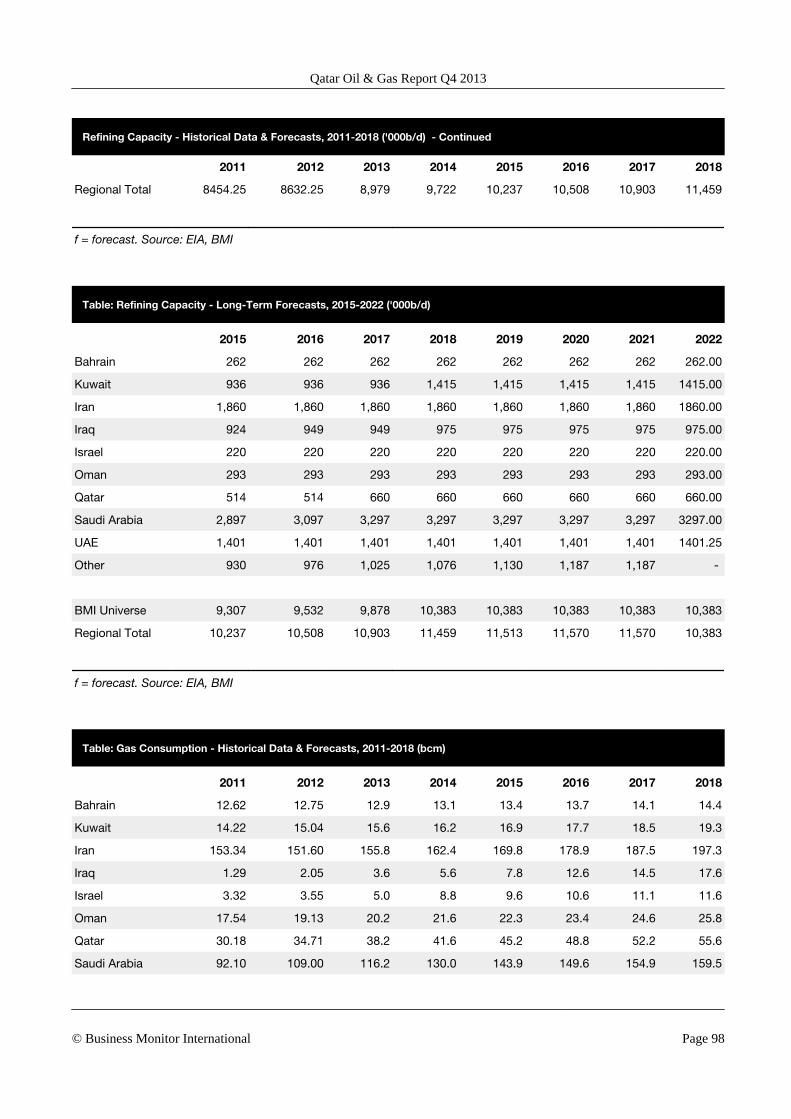
Refining Capacity - Historical Data & Forecasts, 2011-2018 ('000b/d) - Continued
2011 2012 2013 2014 2015 2016 2017 2018
Regional Total 8454.25 8632.25 8,979 9,722 10,237 10,508 10,903 11,459
f = forecast. Source: EIA, BMI
Table: Refining Capacity - Long-Term Forecasts, 2015-2022 ('000b/d)
2015 2016 2017 2018 2019 2020 2021 2022
Bahrain 262 262 262 262 262 262 262 262.00
Kuwait 936 936 936 1,415 1,415 1,415 1,415 1415.00
Iran 1,860 1,860 1,860 1,860 1,860 1,860 1,860 1860.00
Iraq 924 949 949 975 975 975 975 975.00
Israel 220 220 220 220 220 220 220 220.00
Oman 293 293 293 293 293 293 293 293.00
Qatar 514 514 660 660 660 660 660 660.00
Saudi Arabia 2,897 3,097 3,297 3,297 3,297 3,297 3,297 3297.00
UAE 1,401 1,401 1,401 1,401 1,401 1,401 1,401 1401.25
Other 930 976 1,025 1,076 1,130 1,187 1,187 -
BMI Universe 9,307 9,532 9,878 10,383 10,383 10,383 10,383 10,383
Regional Total 10,237 10,508 10,903 11,459 11,513 11,570 11,570 10,383
f = forecast. Source: EIA, BMI
Table: Gas Consumption - Historical Data & Forecasts, 2011-2018 (bcm)
2011 2012 2013 2014 2015 2016 2017 2018
Bahrain 12.62 12.75 12.9 13.1 13.4 13.7 14.1 14.4
Kuwait 14.22 15.04 15.6 16.2 16.9 17.7 18.5 19.3
Iran 153.34 151.60 155.8 162.4 169.8 178.9 187.5 197.3
Iraq 1.29 2.05 3.6 5.6 7.8 12.6 14.5 17.6
Israel 3.32 3.55 5.0 8.8 9.6 10.6 11.1 11.6
Oman 17.54 19.13 20.2 21.6 22.3 23.4 24.6 25.8
Qatar 30.18 34.71 38.2 41.6 45.2 48.8 52.2 55.6
Saudi Arabia 92.10 109.00 116.2 130.0 143.9 149.6 154.9 159.5
Qatar Oil & Gas Report Q4 2013
© Business Monitor International Page 98
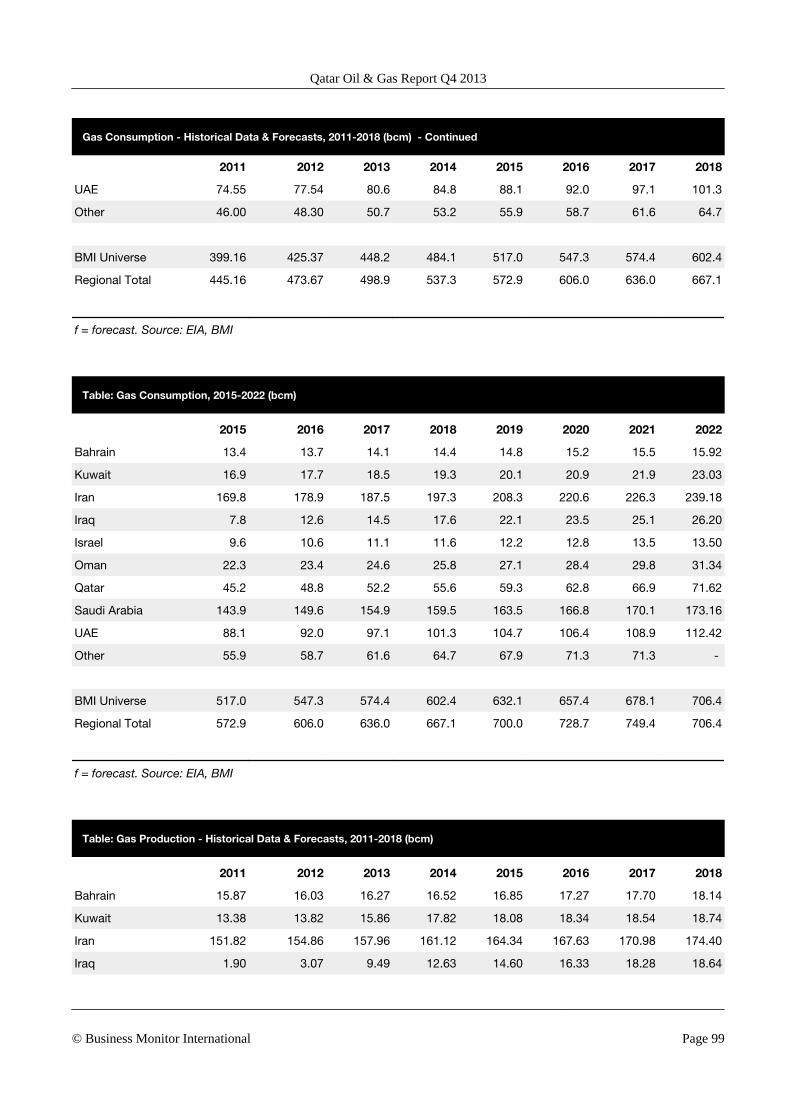
Gas Consumption - Historical Data & Forecasts, 2011-2018 (bcm) - Continued
2011 2012 2013 2014 2015 2016 2017 2018
UAE 74.55 77.54 80.6 84.8 88.1 92.0 97.1 101.3
Other 46.00 48.30 50.7 53.2 55.9 58.7 61.6 64.7
BMI Universe 399.16 425.37 448.2 484.1 517.0 547.3 574.4 602.4
Regional Total 445.16 473.67 498.9 537.3 572.9 606.0 636.0 667.1
f = forecast. Source: EIA, BMI
Table: Gas Consumption, 2015-2022 (bcm)
2015 2016 2017 2018 2019 2020 2021 2022
Bahrain 13.4 13.7 14.1 14.4 14.8 15.2 15.5 15.92
Kuwait 16.9 17.7 18.5 19.3 20.1 20.9 21.9 23.03
Iran 169.8 178.9 187.5 197.3 208.3 220.6 226.3 239.18
Iraq 7.8 12.6 14.5 17.6 22.1 23.5 25.1 26.20
Israel 9.6 10.6 11.1 11.6 12.2 12.8 13.5 13.50
Oman 22.3 23.4 24.6 25.8 27.1 28.4 29.8 31.34
Qatar 45.2 48.8 52.2 55.6 59.3 62.8 66.9 71.62
Saudi Arabia 143.9 149.6 154.9 159.5 163.5 166.8 170.1 173.16
UAE 88.1 92.0 97.1 101.3 104.7 106.4 108.9 112.42
Other 55.9 58.7 61.6 64.7 67.9 71.3 71.3 -
BMI Universe 517.0 547.3 574.4 602.4 632.1 657.4 678.1 706.4
Regional Total 572.9 606.0 636.0 667.1 700.0 728.7 749.4 706.4
f = forecast. Source: EIA, BMI
Table: Gas Production - Historical Data & Forecasts, 2011-2018 (bcm)
2011 2012 2013 2014 2015 2016 2017 2018
Bahrain 15.87 16.03 16.27 16.52 16.85 17.27 17.70 18.14
Kuwait 13.38 13.82 15.86 17.82 18.08 18.34 18.54 18.74
Iran 151.82 154.86 157.96 161.12 164.34 167.63 170.98 174.40
Iraq 1.90 3.07 9.49 12.63 14.60 16.33 18.28 18.64
Qatar Oil & Gas Report Q4 2013
© Business Monitor International Page 99
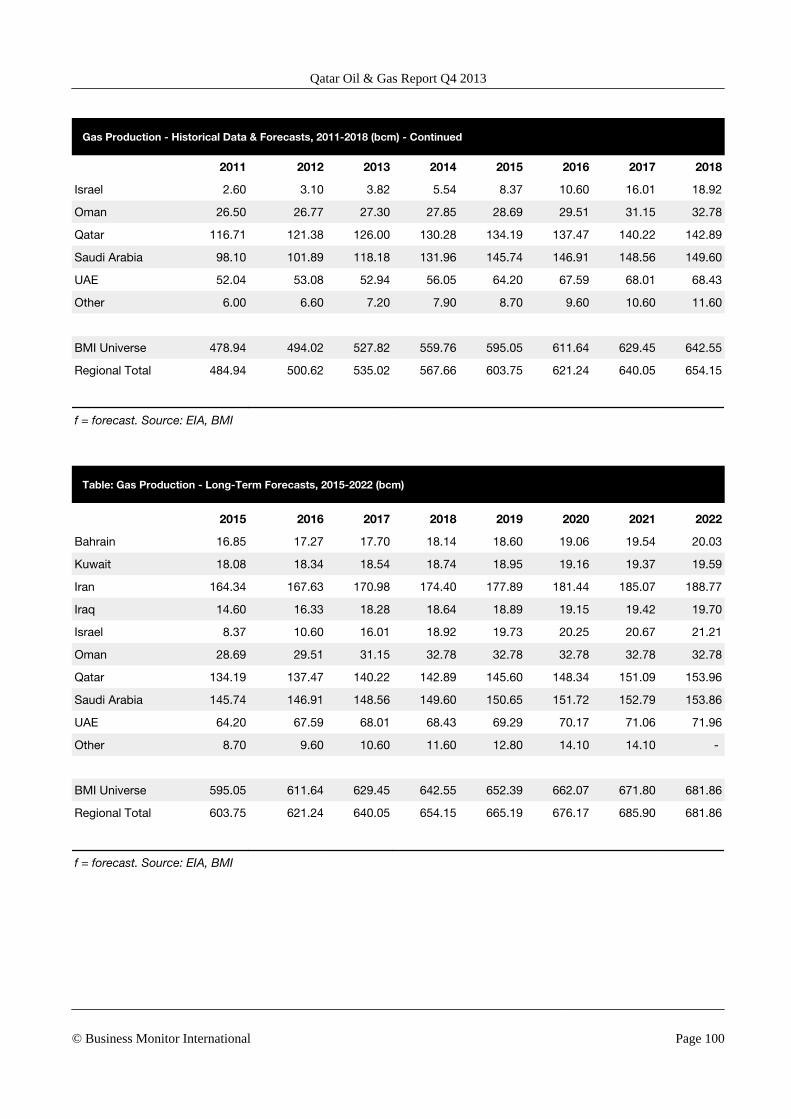
Gas Production - Historical Data & Forecasts, 2011-2018 (bcm) - Continued
2011 2012 2013 2014 2015 2016 2017 2018
Israel 2.60 3.10 3.82 5.54 8.37 10.60 16.01 18.92
Oman 26.50 26.77 27.30 27.85 28.69 29.51 31.15 32.78
Qatar 116.71 121.38 126.00 130.28 134.19 137.47 140.22 142.89
Saudi Arabia 98.10 101.89 118.18 131.96 145.74 146.91 148.56 149.60
UAE 52.04 53.08 52.94 56.05 64.20 67.59 68.01 68.43
Other 6.00 6.60 7.20 7.90 8.70 9.60 10.60 11.60
BMI Universe 478.94 494.02 527.82 559.76 595.05 611.64 629.45 642.55
Regional Total 484.94 500.62 535.02 567.66 603.75 621.24 640.05 654.15
f = forecast. Source: EIA, BMI
Table: Gas Production - Long-Term Forecasts, 2015-2022 (bcm)
2015 2016 2017 2018 2019 2020 2021 2022
Bahrain 16.85 17.27 17.70 18.14 18.60 19.06 19.54 20.03
Kuwait 18.08 18.34 18.54 18.74 18.95 19.16 19.37 19.59
Iran 164.34 167.63 170.98 174.40 177.89 181.44 185.07 188.77
Iraq 14.60 16.33 18.28 18.64 18.89 19.15 19.42 19.70
Israel 8.37 10.60 16.01 18.92 19.73 20.25 20.67 21.21
Oman 28.69 29.51 31.15 32.78 32.78 32.78 32.78 32.78
Qatar 134.19 137.47 140.22 142.89 145.60 148.34 151.09 153.96
Saudi Arabia 145.74 146.91 148.56 149.60 150.65 151.72 152.79 153.86
UAE 64.20 67.59 68.01 68.43 69.29 70.17 71.06 71.96
Other 8.70 9.60 10.60 11.60 12.80 14.10 14.10 -
BMI Universe 595.05 611.64 629.45 642.55 652.39 662.07 671.80 681.86
Regional Total 603.75 621.24 640.05 654.15 665.19 676.17 685.90 681.86
f = forecast. Source: EIA, BMI
Qatar Oil & Gas Report Q4 2013
© Business Monitor International Page 100
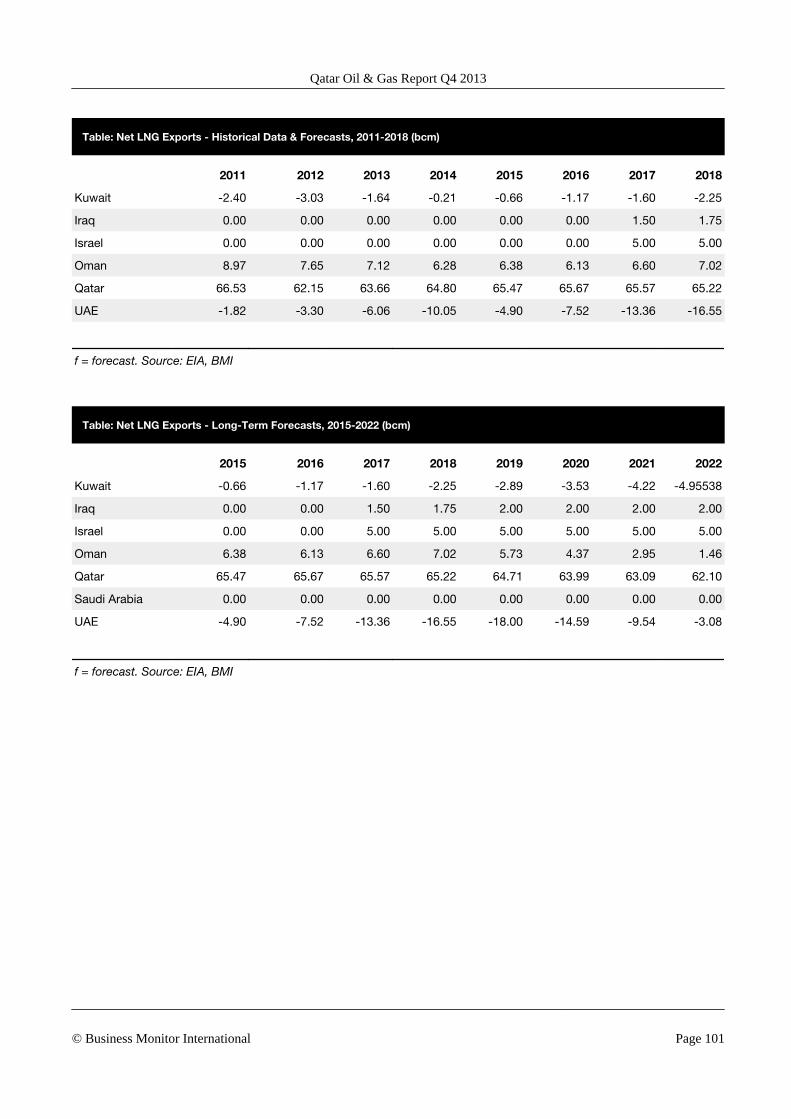
Table: Net LNG Exports - Historical Data & Forecasts, 2011-2018 (bcm)
2011 2012 2013 2014 2015 2016 2017 2018
Kuwait -2.40 -3.03 -1.64 -0.21 -0.66 -1.17 -1.60 -2.25
Iraq 0.00 0.00 0.00 0.00 0.00 0.00 1.50 1.75
Israel 0.00 0.00 0.00 0.00 0.00 0.00 5.00 5.00
Oman 8.97 7.65 7.12 6.28 6.38 6.13 6.60 7.02
Qatar 66.53 62.15 63.66 64.80 65.47 65.67 65.57 65.22
UAE -1.82 -3.30 -6.06 -10.05 -4.90 -7.52 -13.36 -16.55
f = forecast. Source: EIA, BMI
Table: Net LNG Exports - Long-Term Forecasts, 2015-2022 (bcm)
2015 2016 2017 2018 2019 2020 2021 2022
Kuwait -0.66 -1.17 -1.60 -2.25 -2.89 -3.53 -4.22 -4.95538
Iraq 0.00 0.00 1.50 1.75 2.00 2.00 2.00 2.00
Israel 0.00 0.00 5.00 5.00 5.00 5.00 5.00 5.00
Oman 6.38 6.13 6.60 7.02 5.73 4.37 2.95 1.46
Qatar 65.47 65.67 65.57 65.22 64.71 63.99 63.09 62.10
Saudi Arabia 0.00 0.00 0.00 0.00 0.00 0.00 0.00 0.00
UAE -4.90 -7.52 -13.36 -16.55 -18.00 -14.59 -9.54 -3.08
f = forecast. Source: EIA, BMI
Qatar Oil & Gas Report Q4 2013
© Business Monitor International Page 101
Methodology
Oil & Gas Risk/Reward Ratings Methodology
BMI's approach in assessing the risk/reward balance for oil and gas industry investors is threefold. First, we
have disaggregated the upstream (oil and gas E&P) and downstream (oil refining and marketing, gas
processing and distribution), enabling us to take a more nuanced approach to analysing the potential within
each segment, and identifying the different risks along the value chain. Second, we have identified objective
indicators that may serve as proxies for issues and trends that were previously evaluated on a subjective
basis. Finally, we have used BMI's proprietary Country Risk Ratings (CRR) in a more refined manner in
order to ensure that only those risks most relevant to the industry have been included. Overall, the new
ratings system - which is now integrated with those of all industries covered by BMI - offers an industry-
leading insight into the prospects/risks for companies across the globe.
Ratings Overview
Conceptually, the new ratings system is organised in a manner that enables us clearly to present the
comparative strengths and weaknesses of each state. As before, the headline oil and gas rating is the
principal rating. However, the differentiation of upstream and downstream and the articulation of the
elements that comprise each segment enable more sophisticated conclusions to be drawn, and also facilitate
the use of the ratings by clients who have varying levels of exposure and risk appetite.
Oil & Gas Risk Reward Rating: This is the overall rating, which comprises 50% upstream BER and 50%
downstream;
Upstream Oil & Gas Risk Reward Rating: This is the overall upstream rating, which is composed of
rewards/risks (see below);
Downstream Oil & Gas Risk Reward Rating: This is the overall downstream rating, which comprises
rewards/risks (see below);
Both the upstream RRR and downstream RRR are composed of Rewards/Risks sub-ratings, which
themselves comprise industry-specific and broader country risk components;
Rewards: Evaluates the sector's size and growth potential in each state, and also broader industry and state
characteristics that may inhibit its development;
Qatar Oil & Gas Report Q4 2013
© Business Monitor International Page 102
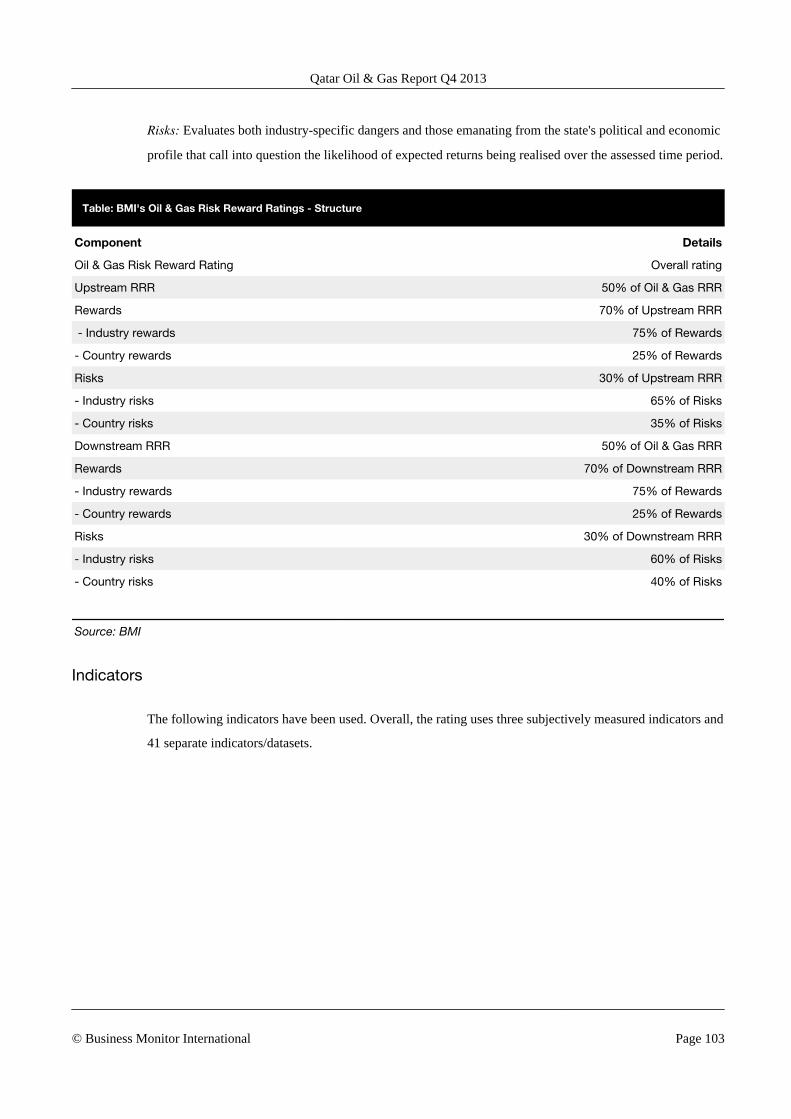
Risks: Evaluates both industry-specific dangers and those emanating from the state's political and economic
profile that call into question the likelihood of expected returns being realised over the assessed time period.
Table: BMI's Oil & Gas Risk Reward Ratings - Structure
Component Details
Oil & Gas Risk Reward Rating Overall rating
Upstream RRR 50% of Oil & Gas RRR
Rewards 70% of Upstream RRR
- Industry rewards 75% of Rewards
- Country rewards 25% of Rewards
Risks 30% of Upstream RRR
- Industry risks 65% of Risks
- Country risks 35% of Risks
Downstream RRR 50% of Oil & Gas RRR
Rewards 70% of Downstream RRR
- Industry rewards 75% of Rewards
- Country rewards 25% of Rewards
Risks 30% of Downstream RRR
- Industry risks 60% of Risks
- Country risks 40% of Risks
Source: BMI
Indicators
The following indicators have been used. Overall, the rating uses three subjectively measured indicators and
41 separate indicators/datasets.
Qatar Oil & Gas Report Q4 2013
© Business Monitor International Page 103
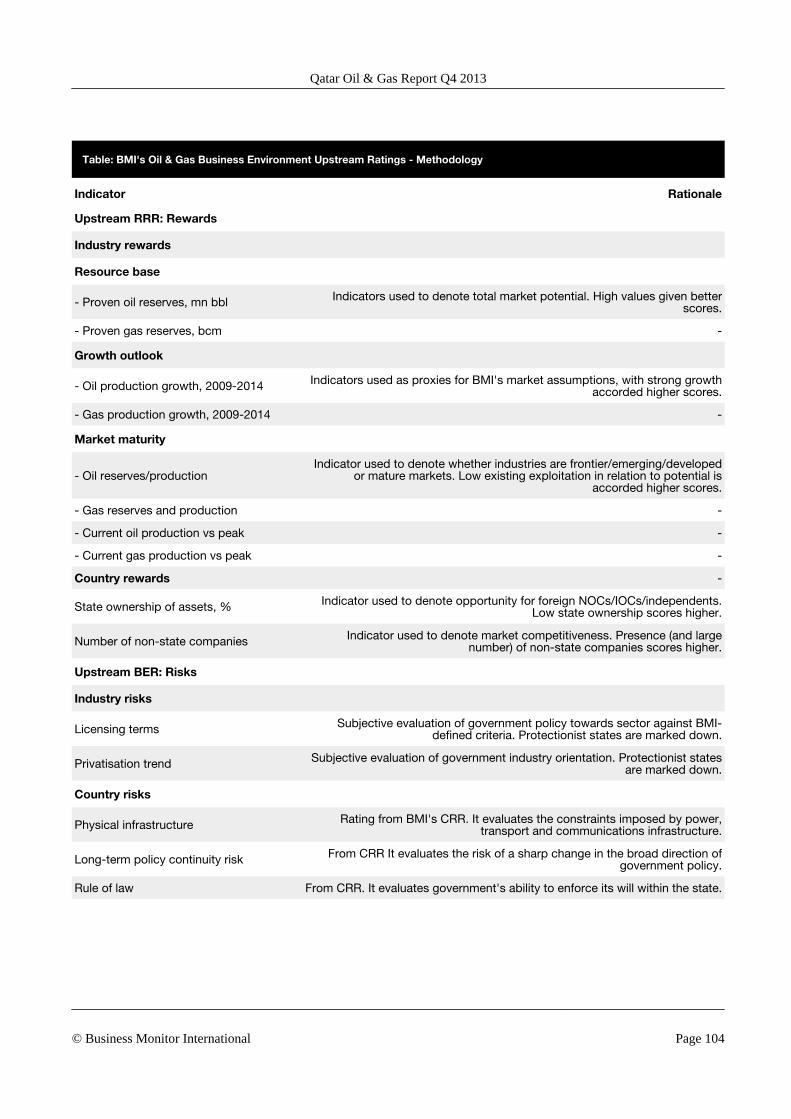
Table: BMI's Oil & Gas Business Environment Upstream Ratings - Methodology
Indicator Rationale
Upstream RRR: Rewards
Industry rewards
Resource base
- Proven oil reserves, mn bbl Indicators used to denote total market potential. High values given betterscores.
- Proven gas reserves, bcm -
Growth outlook
- Oil production growth, 2009-2014 Indicators used as proxies for BMI's market assumptions, with strong growthaccorded higher scores.
- Gas production growth, 2009-2014 -
Market maturity
- Oil reserves/productionIndicator used to denote whether industries are frontier/emerging/developed
or mature markets. Low existing exploitation in relation to potential isaccorded higher scores.
- Gas reserves and production -
- Current oil production vs peak -
- Current gas production vs peak -
Country rewards -
State ownership of assets, % Indicator used to denote opportunity for foreign NOCs/IOCs/independents.Low state ownership scores higher.
Number of non-state companies Indicator used to denote market competitiveness. Presence (and largenumber) of non-state companies scores higher.
Upstream BER: Risks
Industry risks
Licensing terms Subjective evaluation of government policy towards sector against BMI-defined criteria. Protectionist states are marked down.
Privatisation trend Subjective evaluation of government industry orientation. Protectionist statesare marked down.
Country risks
Physical infrastructure Rating from BMI's CRR. It evaluates the constraints imposed by power,transport and communications infrastructure.
Long-term policy continuity risk From CRR It evaluates the risk of a sharp change in the broad direction ofgovernment policy.
Rule of law From CRR. It evaluates government's ability to enforce its will within the state.
Qatar Oil & Gas Report Q4 2013
© Business Monitor International Page 104
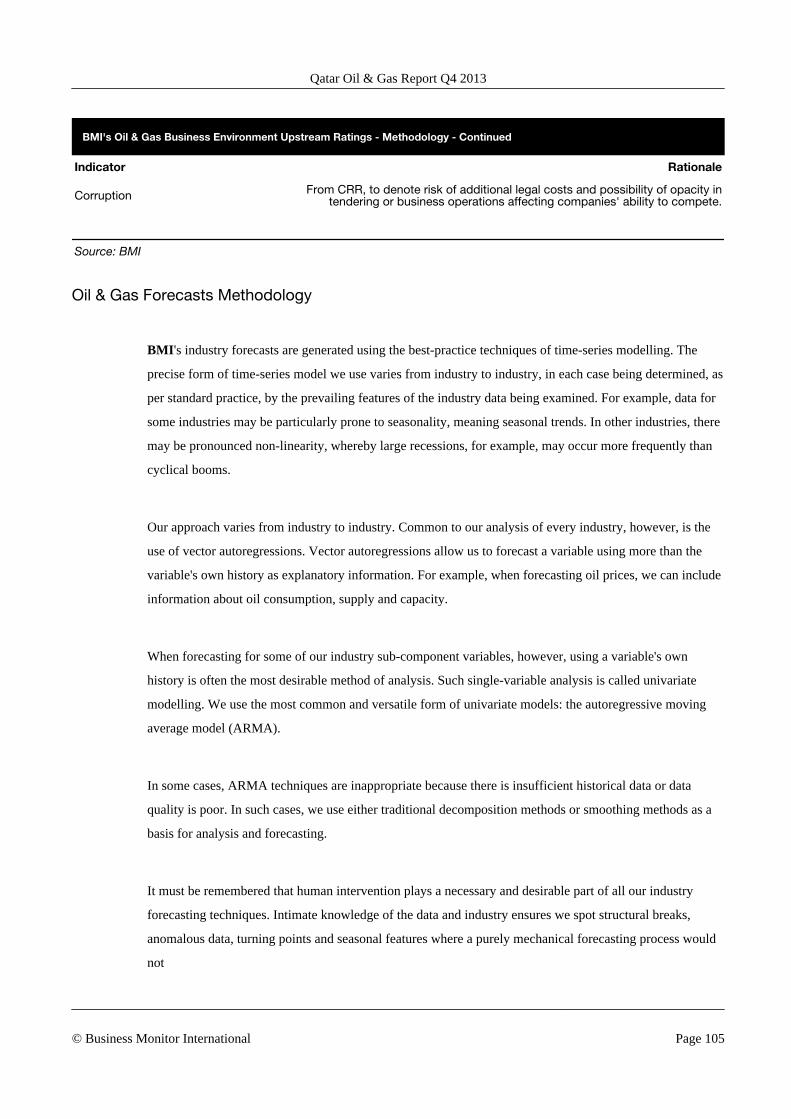
BMI's Oil & Gas Business Environment Upstream Ratings - Methodology - Continued
Indicator Rationale
Corruption From CRR, to denote risk of additional legal costs and possibility of opacity intendering or business operations affecting companies' ability to compete.
Source: BMI
Oil & Gas Forecasts Methodology
BMI's industry forecasts are generated using the best-practice techniques of time-series modelling. The
precise form of time-series model we use varies from industry to industry, in each case being determined, as
per standard practice, by the prevailing features of the industry data being examined. For example, data for
some industries may be particularly prone to seasonality, meaning seasonal trends. In other industries, there
may be pronounced non-linearity, whereby large recessions, for example, may occur more frequently than
cyclical booms.
Our approach varies from industry to industry. Common to our analysis of every industry, however, is the
use of vector autoregressions. Vector autoregressions allow us to forecast a variable using more than the
variable's own history as explanatory information. For example, when forecasting oil prices, we can include
information about oil consumption, supply and capacity.
When forecasting for some of our industry sub-component variables, however, using a variable's own
history is often the most desirable method of analysis. Such single-variable analysis is called univariate
modelling. We use the most common and versatile form of univariate models: the autoregressive moving
average model (ARMA).
In some cases, ARMA techniques are inappropriate because there is insufficient historical data or data
quality is poor. In such cases, we use either traditional decomposition methods or smoothing methods as a
basis for analysis and forecasting.
It must be remembered that human intervention plays a necessary and desirable part of all our industry
forecasting techniques. Intimate knowledge of the data and industry ensures we spot structural breaks,
anomalous data, turning points and seasonal features where a purely mechanical forecasting process would
not
Qatar Oil & Gas Report Q4 2013
© Business Monitor International Page 105
Energy Industry
There are a number of principal criteria that drive our forecasts for each Energy indicator.
Energy supply
Supply of crude oil, natural gas, refined oil products and electrical power is determined largely by
investment levels, available capacity, plant utilisation rates and national policy. We therefore examine:
■ National energy policy, stated output goals and investment levels;
■ Company-specific capacity data, output targets and capital expenditures, using national, regional andmultinational company sources;
■ International quotas, guidelines and projections such as OPEC, IEA, and EIA.
Energy consumption
A mixture of methods are used to generate demand forecasts, applied as appropriate to each individual
country:
■ Underlying economic (GDP) growth for individual countries/regions, sourced from BMI publishedestimates. Historic relationships between GDP growth and energy demand growth at an individualcountry are analysed and used as the basis for predicting levels of consumption;
■ Government projections for oil, gas and electricity demand;
■ Third-party agency projections for regional demand, such as IEA, EIA, OPEC;
Extrapolation of capacity expansion forecasts based on company- or state-specific investment levels.
Cross checks
Whenever possible, we compare government and/or third party agency projections with the declared
spending and capacity expansion plans of the companies operating in each individual country. Where there
are discrepancies, we use company-specific data as physical spending patterns to ultimately determine
capacity and supply capability. Similarly, we compare capacity expansion plans and demand projections to
check the energy balance of each country. Where the data suggest imports or exports, we check that
necessary capacity exists or that the required investment in infrastructure is taking place.
Qatar Oil & Gas Report Q4 2013
© Business Monitor International Page 106
Sources
Sources include those international bodies mentioned above such as OPEC, IEA, and EIA, as well as local
energy ministries, official company information, and international and national news, and international and
national news agencies.
Qatar Oil & Gas Report Q4 2013
© Business Monitor International Page 107

Copyright of Qatar Oil & Gas Report is the property of Business Monitor International and itscontent may not be copied or emailed to multiple sites or posted to a listserv without thecopyright holder's express written permission. However, users may print, download, or emailarticles for individual use.