Embed Size (px)
Citation preview

Qatar Mid-Year Equity Strategy 2018
Thursday, 3 May 2018
Thursday, 03 May 2018 1
Attractive Fundamentals Bolstered by FOL Catalyst
After our dividend thesis for 2017 played out in the early part of 2018, FOL increases and fund-flows should support the QSE Index through
mid-2018. 2018 saw a slow start to the year for Qatari equities after a robust December 2017. Between January 1 and March 11 of this year, the
QSE Index dropped marginally by ~3%. However, from that point on, the picture changed materially as buying ahead of ex-dividend dates was
further bolstered by positive news regarding potential/implemented foreign ownership limit (FOL) increases to 49% for select QSE-listed
equities. QNB Group (QNBK) was the first to announce on the morning of March 12 that it will propose an increase to the FOL to 49% at the
company’s AGM. From that point on, eight other companies announced plans to increase FOLs (IQCD, QIBK, QEWS, BRES, MPHC, QFLS, GISS,
and QIIK). This led to a material rally in the Qatar All-Share Index driving it higher by ~12% through May 1 (YTD up ~9%), while the
aforementioned nine names increased by ~16% over the same period (YTD up ~15%). We estimate that this will result in material inflows as
part of the MSCI and FTSE rebalancing, which could drive ~QR7bn (~$2bn) in passive funds into these QSE-listed names.
Longer-term, we remain optimistic on the Qatari equity market even after FOL impact as fundamentals remain attractive; play QEWS, GWCS
and QGTS. Within our coverage universe, we forecast a normalized 4.4% increase in aggregate earnings in 2018 followed by a more robust 2019
with 14.6%. Despite the issues related to the blockade, we highlight that we continue to expect Qatari equities to post ROE metrics for 2018 and
2019 that are in line with peers (~11.4/12.2% vs. regional peer averages at ~11.8/12.2%). Similarly, Qatari equities are expected to register
dividend yields in line with peer average over the next 2 years at ~4.6/4.9% vs. ~4.7/5.0%. With that in mind, we compiled net income
expectations of key Qatari equities that we cover. Our Qatari coverage list constituted a significant ~43% of the overall total market
capitalization (ex. QNB Group) of the Qatar Exchange. Factors that can negatively impact our thesis include deceleration of global economic
growth prospects, regional geo-political issues, significant deterioration in oil prices, increase in volatility, exit of hot money from
emerging/frontier markets, etc. From our Qatari coverage universe, we favor QEWS, GWCS and QGTS.
QEWS (ACCUMULATE; QR223.00 TP). We like QEWS as a solid long-term play with a defensive business model. Essentially a
capacity provider, QEWS takes on insignificant demand/costs/funding risks holding secure contracted assets with long-term (~25
years) fuel agreements/PWPAs and committed funding. This also leads to visible cash flows and a stable operating profile. The State
of Qatar (through various entities) owns 60% of the company.
GWCS (OUTPERFORM; QR51.00 TP). GWCS has withstood the blockade well with freight forwarding bouncing back nicely and some
after an initial hit. The company’s logistics business has also picked up steam driven by contract logistics and increasing occupancy
in Bu Sulba. GWCS stock is down 12%, on a total return basis, since the beginning of the blockade vs. 2%/5% declines in MSCI
Qatar/QSE and we continue to think this underperformance is unwarranted. Growth post Bu Sulba (~100% occupancy later in 2018)
will decline, but as we had flagged previously, GWCS should start generating substantial FCF from 2018 onward. With major capex
already done, there could be upside to dividends medium-term.
QGTS (OUTPERFORM; QR21.00 TP). We continue to favor Nakilat, #1 owner/operator of LNG vessels globally, as a LT play geared to
Qatari LNG’s dominance & anticipated growth in the LNG market. We believe the stock is attractive at current levels. QGTS is a vital
part of Qatar’s LNG value chain and enjoys stable revenue/cash flow from LT (25 years/~15 years left) and fixed-rate time LNG
charter contracts (take or pay) with Qatargas and its affiliates. The availability-based take or pay contracts shields QGTS from end-
demand volatility and delays in charterers’ projects. 11 ships are on spot-to-medium-term charters; LPG is a spot business. The
company has high leverage but debt is mostly secured by watertight charter agreements; we do not foresee any challenges in debt
servicing/repayments.
Qatari equities trading in line with regional peers as post-blockade recovery is sustained. Valuations are attractive vs. the region's forward
price-to-earnings multiples; the Qatar Stock Exchange Index (DSM) trades at a 2018 P/E of 12.5x, complemented by a dividend yield of 4.6%,
while regional peer median is at a 11.5x P/E along with a dividend yield of 4.7%. While the bounce YTD was fueled by optimism regarding
government spending and net buying interest in selected names by foreign/GCC investors, the way forward will depend on continued recovery
in the macro operating environment. LT, attractive fundamentals and a significant spending program should provide tailwinds for growth.
Macro picture remains resilient as per our economics & strategy team. The team revised up their GDP forecasts for 2018 for three main reasons.
First, the impact of their increased forecast for oil prices from $55/b to $63/b, which will lead to higher incomes and spending in the non-
hydrocarbon sector. Second, their expectation of a sharper rebound in hydrocarbon output. Third, the expectation of a reduced economic impact
of the blockade on 2018 GDP. As a result, they are now forecasting overall real GDP growth of 2.8% in 2018 from 2.5% previously. In the longer
term, Qatar’s economy should benefit from a number of recent measures. Investment should be bolstered by new projects related to the
expansion of LNG production and projects aimed at ensuring self-sufficiency and sustainability as well as an expected new law to allow 100%
foreign ownership of new companies. Therefore, we expect the underlying growth rate of both the hydrocarbon and non-hydrocarbon sectors to
continue rising into the medium term.

Thursday, 03 May 2018 2
Key Qatari Stocks Under Coverage
Source: Bloomberg, QNBFS Research; Note: upside based on May 1, 2018 closing prices
Mkt. Cap. Div. I mplie d
Ticke r Analyst (QR mn) Y ie ld Last Targe t R e comme ndation R e turn I nve stme nt The sis
Banks & Financial S e rvice s
ABQK Shahan Keushgerian 6,311 3.3% 30.00 33.00 MARKET PERFORM 10.0% Stock is fairly valued trading at a PEG of 0.9x based on a CAGR (2017-2022) of 10.5%.
The only catalyst for the name is an increase in liquidity as the stock is closely held.
KCBK Shahan Keushgerian 3,964 6.8% 11.01 15.00 ACCUMULATE 36.2% The name trades at a 30% discount to its book value. A significant catalyst for the
stock is further progress in management's strategy: 1) an expansion of attributable
RoE beyond 12% (2018 and 2019e RoE: 8.0% and 10.7%, respectively) vs. its cost of
equity of 12.6%. We expect KCBK to generate a RoE of 12.6% by 2022.
CBQK Shahan Keushgerian 14,570 4.2% 36.00 35.00 MARKET PERFORM (2.8%) Stock price performance thus far has rewarded investors’ optimism in the company’s
change in strategy and positive stewardship shown by its new CEO. The stock has re-
rated from a steep 30% discount to book to almost at par with book. While positive
2018e and 2019e results could fuel more momentum in the name, the reality of
negative residual value derived from on- going operations cannot be minimized. We
believe while recent gains are not entirely unjustified, we do think that the stock is
fairly valued.
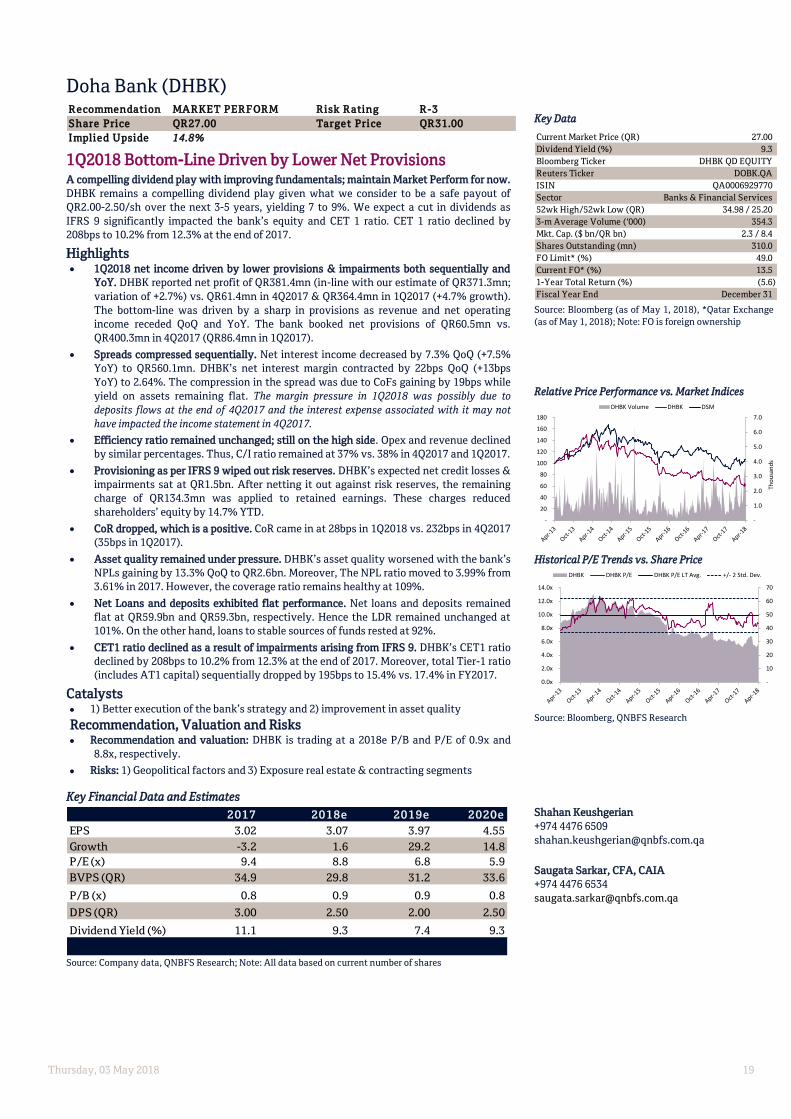
DHBK Shahan Keushgerian 8,371 9.3% 27.00 31.00 MARKET PERFORM 14.8% DHBK remains a compelling dividend play given what we consider to be a safe payout
of QR2.00-2.50/sh over the next 3-5 years, yielding 7 to 9%. We expect a cut in
dividends as IFRS 9 significantly impacted the bank's equity and CET 1 ratio. CET1
ratio declined by 208bps to 10.2% from 12.3% at the end of 2017. Moreover, total Tier-1
ratio (includes AT1 capital) sequentially dropped by 195bps to 15.4% vs. 17.4% in
FY2017.
MARK Shahan Keushgerian 26,250 5.7% 35.00 34.00 MARKET PERFORM (2.9%) MARK has the best asset quality among Qatari banks with a NPL ratio of 0.50%, one of
the highest RoEs of ~16% and robust capitalization at 18%. However, valuations
remain overstretched, with the name trading at ~2x P/B.
QIIK Shahan Keushgerian 8,328 7.3% 55.02 63.00 MARKET PERFORM 14.5% We view QIIK as a value stock with an attractive dividend yield of 7.3%.
QIBK Shahan Keushgerian 25,059 5.0% 106.05 104.00 MARKET PERFORM (1.9%) In our view, QIBK's turnaround/restructuring phase is already priced in the stock. The
name is trading close to its fair value (PEG of 0.8x based on our estimates). The only
catalyst we see: FOL increase to 49% is already implemented; weight to double to
0.06% in MSCI EM on May 31 attracting QR420mn in funds.
I ndustrials
IQCD Saugata Sarkar 67,760 4.5% 112.00 109.00 MARKET PERFORM (2.7%) Strong FCF generation support dividends despite high payout ratio vs. historicals.
IQCD’s FCF (OCF + Cash dividends from JVs-steel capex), should come in at QR3.5bn in
2018 and should average QR4.5bn over 2017 to 2026 with an average dividend cover of
1.3x. We forecast a DPS of QR5 for 2018, which is flat and could see upside. However,
payouts will remain high at an average of around ~71% over 2018 to 2026 (91% payout
in 2017).
QEWS Saugata Sarkar 21,450 4.0% 195.00 223.00 ACCUMULATE 14.4% We like QEWS as a solid long-term play with a defensive business model. Essentially
a capacity provider, QEWS takes on insignificant demand/costs/funding risks holding
secure contracted assets with long-term (~25 years) fuel agreements/PWPAs and
committed funding. This also leads to visible cash flows and a stable operating profile.
The State of Qatar (through various entities) owns 60% of the company.
Transportation
QNNS Shahan Keushgerian 6,413 6.2% 56.00 81.00 MARKET PERFORM 44.6% We continue to believe that QNNS’ business is levered to Qatar’s economic growth
through: 1) offshore oil & gas (22% of 2016 revenue); 2) the construction sector (14%);
3) import and export activities/logistics (35%); 4) the LNG and LPG shipping markets
(18%); 5) the property market (6%) and 6) an investment portfolio invested in Qatari
blue chip equities (5%).
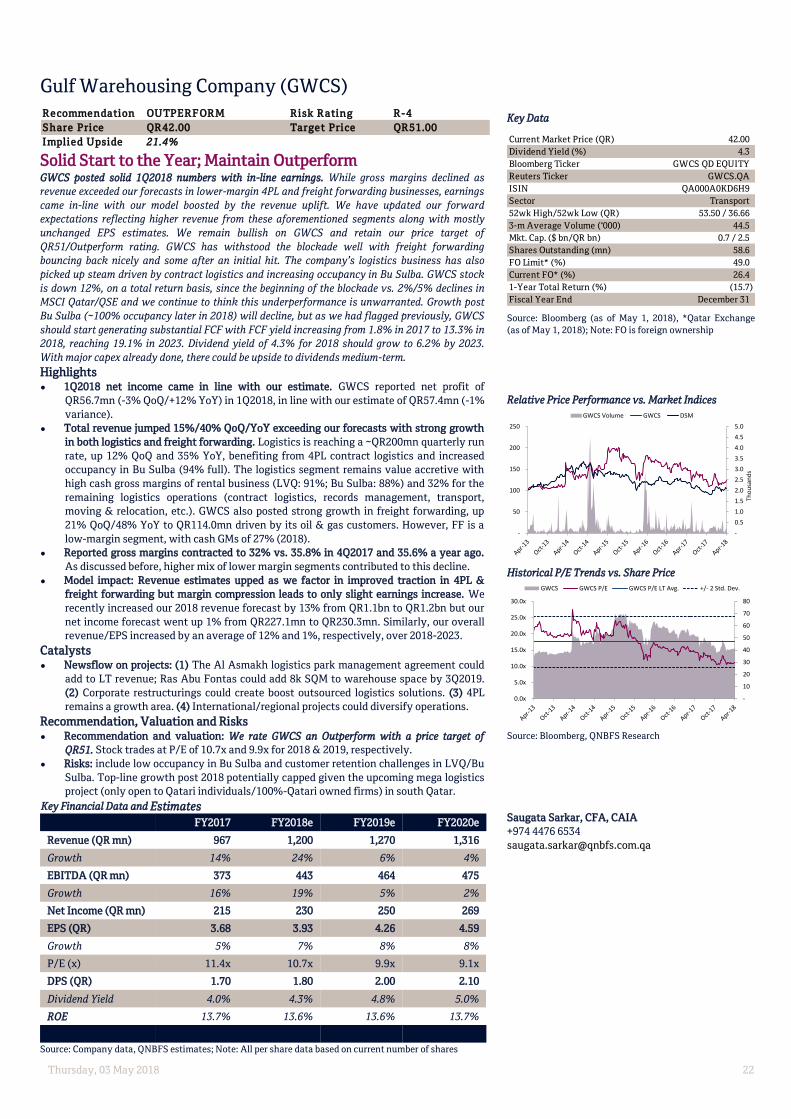
GWCS Saugata Sarkar 2,461 4.3% 42.00 51.00 OUTPERFORM 21.4% GWCS has withstood the blockade well with freight forwarding bouncing back nicely
and some after an initial hit. The company’s logistics business has also picked up
steam driven by contract logistics and increasing occupancy in Bu Sulba. GWCS stock
is down 12%, on a total return basis, since the beginning of the blockade vs. 2%/5%
declines in MSCI Qatar/QSE and we continue to think this underperformance is
unwarranted. Growth post Bu Sulba (~100% occupancy later in 2018) will decline, but
as we had flagged previously, GWCS should start generating substantial FCF from
2018 onward. With major capex already done, there could be upside to dividends
medium-term.
QGTS Saugata Sarkar 8,144 7.1% 14.70 21.00 OUTPERFORM 42.9% We continue to favor Nakilat, #1 owner/operator of LNG vessels globally, as a LT play
geared to Qatari LNG’s dominance & anticipated growth in the LNG market. We
believe the stock is attractive at current levels. QGTS is a vital part of Qatar’s LNG
value chain and enjoys stable revenue/cash flow from LT (25 years/~15 years left)
and fixed-rate time LNG charter contracts (take or pay) with Qatargas and its
affiliates. The availability-based take or pay contracts shields QGTS from end-demand
volatility and delays in charterers’ projects. 11 ships are on spot-to-medium-term
charters; LPG is a spot business. Company has high leverage but debt is mostly secured
by watertight charter agreements; we do not foresee any challenges in debt
servicing/repayments.
R e al Estate
BRES Mohamed Abo Daff 13,503 7.2% 34.70 39.00 ACCUMULATE 12.4% We positively view BRES’ operating assets and development pipeline especially its
rental income segment. We expect top line/adj. EBITDA to experience a ~6/13% CAGR
through 2020 as rental income strength more than offsets “normalized” Finance
Lease/Consultancy operations while management efforts to cut operating expenses
should drive rental gross margin expansion through the same period to ~80% from
~74% in 2017.
UDCD Mohamed Abo Daff 5,113 8.7% 14.44 20.00 ACCUMULATE 38.5% UDCD remains our preferred exposure to the real estate space in Qatar given current
real estate weakness and is seen as a play on the Qatar long-term growth story. The
company continues to enjoy a significant land bank from which it supplements its
recurring earnings through land plot sales along with stable utility exposure through
Qatar Cool. With a cleaner balance sheet vs. other peers, UDCD is positioned to
effectively grow its earnings-generating asset portfolio while maintaining peer
average leverage/debt service profiles.
Ove rall Ave rage 6.0% 17.1%
Ove rall Me dian 6.0% 14.4%
Price s (QR )

Thursday, 03 May 2018 3
Proposed and/or Implemented FOL Increases
Source: Company press releases, QSE, QNBFS Research & Sales
Proposed and/or Implemented FOL Increases
Source: Bloomberg, QNBFS Research
QE Index Performance (2017 – YTD 2018)
Source: Bloomberg, QNBFS Research
S TOCK US D mn QAR mn S hare s mn FOL Incre ase S tatus Earlie st R e alistic Earlie st R e alistic
FOL 49% Impact
QNBK 922 3,356 22.5 Approved + Implemented 31-May-18 30-Aug-18 20-Sep-18 20-Sep-18
IQCD 197 717 6.4 Approved + Implemented 31-May-18 31-May-18 14-Jun-18 14-Jun-18
QIBK 181 658 6.2 Approved + Implemented 31-May-18 31-May-18 14-Jun-18 14-Jun-18
QEWS 118 429 2.2 Approved + Implemented 31-May-18 31-May-18 14-Jun-18 14-Jun-18
BRES 92 337 9.7 Pending EGM, Date TBA 30-Aug-18 30-Aug-18 14-Jun-18 20-Sep-18
MPHC 176 641 38.5 Approved + Implemented 29-Nov-18 29-May-19 14-Mar-19 14-Mar-19
QFLS 204 743 5.4 Pending EGM May 6 29-Nov-18 29-May-19 14-Mar-19 14-Mar-19
GISS 9 33 1.8 Approved + Implemented 31-May-18 30-Aug-18 14-Jun-18 20-Sep-18
QIIK 80 292 5.3 No Update on FOL Increase 30-Aug-18 NA NA NA
Total Flow 1,978 7,204 98.0
MSCI Inclusion FTSE InclusionMSCI/FTSE Expected In/(Out)flow
De c-31 Mar-11 May-01 31/12 - 03/11 03/11 - 05/1 31/12 - 05/01
All-Share Index 2,452.49 2,373.68 2,666.66 -3.2% 12.3% 8.7%
QSE Index 8,523.38 8,252.66 9,014.32 -3.2% 9.2% 5.8%
FOL 49% I mpact
QNBK 126.01 118.00 149.15 (6.4%) 26.4% 18.4%
IQCD 97.00 93.00 112.00 (4.1%) 20.4% 15.5%
QIBK 97.00 93.01 106.05 (4.1%) 14.0% 9.3%
QEWS 178.00 171.10 195.00 (3.9%) 14.0% 9.6%
BRES 32.00 31.86 34.70 (0.4%) 8.9% 8.4%
MPHC 12.59 13.00 16.64 3.3% 28.0% 32.2%
QFLS 102.06 113.30 137.50 11.0% 21.4% 34.7%
GISS 17.70 16.88 18.49 (4.6%) 9.5% 4.5%
QIIK 54.60 57.00 55.02 4.4% (3.5%) 0.8%
Ave rage (0.5%) 15.5% 14.8%
PerformanceClose

Thursday, 03 May 2018 4
QE Index Performance (YTD 2018)
Source: Bloomberg, QNBFS Research
Key Financial Data and Estimates
Source: Company reports, QNBFS Research
Div.
Ticke r Company Y ie ld 2016a 2017a 2018e 2019e 2017a 2018e 2019e
ABQK Ahli Bank QSC 3.3% 3.00 3.04 3.20 3.49 1.2% 5.2% 9.3%
KCBK Al Khalij Commercial Bank PQSC 6.8% 1.07 1.38 1.44 1.71 29.0% 4.0% 19.2%
CBQK Commercial Bank PQSC/The 4.2% 0.82 0.90 2.87 3.69 9.9% nmf 28.5%
DHBK Doha Bank QPSC 9.3% 3.12 3.02 3.07 3.97 (3.2%) 1.6% 29.2%
GW CS Gulf Warehousing Co 4.3% 3.54 3.68 3.93 4.26 4.0% 6.8% 8.4%
I QCD Industries Qatar QSC 4.5% 4.88 5.48 6.46 7.07 12.3% 17.8% 9.6%
MAR K Masraf Al Rayan QSC 5.7% 2.77 2.70 2.82 3.25 (2.3%) 4.1% 15.5%
QEW S Qatar Electricity & Water Co QSC 4.0% 14.02 14.69 13.32 14.36 4.8% (9.3%) 7.8%
QI I K Qatar International Islamic Bank QSC 7.3% 5.18 5.50 5.88 6.54 6.2% 6.8% 11.2%
QI BK Qatar Islamic Bank SAQ 5.0% 8.55 9.31 10.12 11.52 8.9% 8.7% 13.9%
QNNS Qatar Navigation QSC 6.2% 6.26 4.14 6.01 6.60 (33.9%) nmf 9.7%
QGTS Qatar Gas Transport Co Ltd 7.1% 1.72 1.53 1.54 1.73 (11.0%) 0.6% 12.3%
BR ES Barwa Real Estate Co 7.2% 1.96 2.01 2.13 2.56 2.7% 6.0% 19.9%
UDCD United Development Co QSC 8.7% 1.91 1.55 1.56 1.70 (18.9%) 0.7% 9.4%
Ave rage 6.0% 0.7% 4.4% 14.6%
Me dian 6.0% 3.3% 4.7% 11.7%
nmf: Not Meaningful
NA: Not Applicable
EPS Growth

Thursday, 03 May 2018 5
QE Index Forward P/E vs. ROE
Source: Bloomberg, QNBFS Research
Forward P/E vs. ROE Spread between QE Index & Saudi Index
Source: Bloomberg, QNBFS Research
Forward P/E vs. ROE Spread between QE Index & Abu Dhabi Index
Source: Bloomberg, QNBFS Research
5x
7x
9x
11x
13x
15x
17x
19x
Historical DSM INDEX NTM P/E
DSM INDEX DSM INDEX LT Avg. +/- 1 St. Dev. +/- 2 St. Dev.
NTM P/E: 12.6x vs. 13.3x LT Avg.
8%
10%
12%
14%
16%
18%
20%
22%
Historical DSM INDEX ROE
DSM INDEX DSM INDEX LT Avg. +/- 1 St. Dev. +/- 2 St. Dev.
ROE: 11.4% vs. 15.4% LT Avg.
(5x)
(4x)
(3x)
(2x)
(1x)
0x
1x
2x
3x
NTM P/E - DSM INDEX Spread vs. SASEIDX INDEX
DSM INDEX Spread LT Spread
NTM P/E Spread: -2.5x vs. -0.9x LT Spread Avg.
(1%)
0%
1%
2%
3%
4%
5%
6%
7%
8%
9%
ROE - DSM INDEX Spread vs. SASEIDX INDEX
DSM INDEX Spread LT Spread +/- 1 St. Dev. +/- 2 St. Dev.
ROE Spread: -0.4% vs. 3.9% LT Spread Avg.
(1x)
0x
1x
2x
3x
4x
5x
NTM P/E - DSM INDEX Spread vs. ADSMI INDEX
DSM INDEX Spread LT Spread
NTM P/E Spread: 1.2x vs. 1.7x LT Spread Avg.
(3%)
(2%)
(1%)
0%
1%
2%
3%
4%
5%
ROE - DSM INDEX Spread vs. ADSMI INDEX
DSM INDEX Spread LT Spread +/- 1 St. Dev. +/- 2 St. Dev.
ROE Spread: -0.4% vs. 1.4% LT Spread Avg.

Thursday, 03 May 2018 6
Forward P/E vs. ROE Spread between QE Index & Dubai Index
Source: Bloomberg, QNBFS Research
Forward P/E vs. ROE Spread between QE Index & Muscat Index
Source: Bloomberg, QNBFS Research
Forward P/E Spread between QE Index & Kuwait
Source: Bloomberg, QNBFS Research
(8x)
(6x)
(4x)
(2x)
0x
2x
4x
6x
8x
NTM P/E - DSM INDEX Spread vs. DFMGI INDEX
DSM INDEX Spread LT Spread
NTM P/E Spread: 4.6x vs. 1.3x LT Spread Avg.
(4%)
(2%)
0%
2%
4%
6%
8%
10%
ROE - DSM INDEX Spread vs. DFMGI INDEX
DSM INDEX Spread LT Spread +/- 1 St. Dev. +/- 2 St. Dev.
ROE Spread: -0.9% vs. 3.2% LT Spread Avg.
0x
1x
2x
3x
4x
5x
6x
NTM P/E - DSM INDEX Spread vs. MSM30 INDEX
DSM INDEX Spread LT Spread
NTM P/E Spread: 2.7x vs. 3.2x LT Spread Avg.
(3%)
(2%)
(1%)
0%
1%
2%
3%
4%
5%
6%
7%
ROE - DSM INDEX Spread vs. MSM30 INDEX
DSM INDEX Spread LT Spread +/- 1 St. Dev. +/- 2 St. Dev.
ROE Spread: 2.1% vs. 3.3% LT Spread Avg.
(2x)
(1x)
0x
1x
2x
3x
4x
5x
6x
NTM P/E - DSM INDEX Spread vs. SECTMIND INDEX
DSM INDEX Spread LT Spread
NTM P/E Spread: 0.9x vs. 1.4x LT Spread Avg.
Thursday, 03 May 2018 7
Forward P/E Multiples for our Qatari Coverage Universe
Source: Bloomberg, QNBFS Research
EPS Growth for our Qatari Coverage Universe
Source: Bloomberg, QNBFS Research
Forward P/B Multiples for our Qatari Coverage Universe
Source: Bloomberg, QNBFS Research
-
2.0x
4.0x
6.0x
8.0x
10.0x
12.0x
14.0x
16.0x
18.0x
20.0x
AB
QK
KC
BK
CB
QK
DH
BK
GW
CS
IQC
D
MA
RK
QEW
S
QIIK
QIB
K
QN
NS
QG
TS
BR
ES
UD
CD
2018e 2019e 2018e Average
(15%)
(10%)
(5%)
-
5%
10%
15%
20%
25%
30%
35%
AB
QK
KC
BK
CB
QK
DH
BK
GW
CS
IQC
D
MA
RK
QEW
S
QII
K
QIB
K
QN
NS
QG
TS
BR
ES
UD
CD
2018e 2019e 2018e Average
-
0.5x
1.0x
1.5x
2.0x
2.5x
AB
QK
KC
BK
CB
QK
DH
BK
GW
CS
IQC
D
MA
RK
QEW
S
QIIK
QIB
K
QN
NS
QG
TS
BR
ES
UD
CD
2018e 2019e 2018e Average

Thursday, 03 May 2018 8
Dividend Yield for our Qatari Coverage Universe
Source: Source: Bloomberg, QNBFS Research
Forward Valuations and Profitability Metrics for Regional Indices
Source: Bloomberg, QNBFS Research
-
1%
2%
3%
4%
5%
6%
7%
8%
9%
10%
AB
QK
KC
BK
CB
QK
DH
BK
GW
CS
IQC
D
MA
RK
QEW
S
QIIK
QIB
K
QN
NS
QG
TS
BR
ES
UD
CD
2018e 2019e 2018e Average
Inde x 2018 2019 2018 2019 2018 2019 2018 2019
Qatar Exchange Index 12.5x 11.2x 4.6% 4.9% 1.4x 1.3x 11.4% 12.2%
QE All Share Index 11.8x 10.7x 4.2% 4.4% 1.5x 1.4x 12.6% 13.2%
Tadawul All Share Index 15.0x 13.2x 3.3% 3.7% 1.7x 1.7x 11.8% 12.4%
Dubai Financial Market General Index 8.0x 7.1x 5.4% 5.6% 1.1x 1.0x 12.4% 12.7%
Abu Dhabi Securities Market General Index 11.7x 10.8x 5.5% 5.8% 1.6x 1.5x 13.0% 13.9%
Muscat Securities MSM 30 Index 9.9x 9.1x 5.2% 5.5% 0.8x 0.8x 9.3% 8.9%
Ave rage 11.5x 10.3x 4.7% 5.0% 1.3x 1.3x 11.8% 12.2%
Me dian 11.8x 10.7x 4.9% 5.2% 1.4x 1.3x 12.1% 12.5%
nmf: Not Meaningful
NA: Not Applicable
P/E Divide nd Y ie ld % P/B R OE (%)

Thursday, 03 May 2018 9
COMPANY UPDATES

Thursday, 03 May 2018 10
Ahli Bank (ABQK)
In-Line 1Q2018; Spreads Compressed
Ahli Bank is one of Qatar's smallest lenders with a focus on the corporate and retail
sectors. ABQK has a ~3% market share of loans and deposits (among listed banks).
Focused on Qatar, along with a strategic shareholder (Qatar Foundation), ABQK’s
management has set forth a strategy targeting a 5% to 7% market share in loans and
deposits.
Highlights
ABQK’s 1Q2018 QoQ surge in bottom-line driven by a sharp drop in provisions
coupled with a drop in opex. ABQK posted a net profit of QR176.1mn (in-line with
our estimate of QR171.8mn, +2.5% variation), surging by 44.9% QoQ. Net profit
grew by 3.6% YoY mainly due to the lack of investment provisions.
Margins continued to compress. Net interest income dropped by 2.7% QoQ (+1.8%
YoY) to QR206.0mn (in-line with our estimate). NIM compressed by 10bps and
7bps QoQ and YoY to 2.21%, respectively. The contraction was attributed to CoFs
rising more than yield on assets. CoFs moved up by 20bps QoQ (+49bps YoY) to
2.78%, while yield on assets increased by only 7bps QoQ (+31bps YoY) to 4.57%.
Efficiency ratio remained at acceptable levels, garnered JAWS. Total revenue
decreased by 2.2% while opex dropped by 19.4% QoQ, resulting in a reduction in
the C/I ratio to 30.0% vs. 36.3% in 4Q2017. On a YoY basis revenue and opex grew
in-line, resulting in a flat C/I ratio.
Asset quality remains healthy. NPL ratio remained flat at 0.96% vs. 0.99% in
2017, while the coverage ratio came in at 103%. As per IFRS 9, stage 1 loans
represent 96% of total loans, which is a positive indicator.
IFRS 9 impairments had a negligible impact on capitalization. ABQK’s CET1 ratio
rested at 15.5% at the end of 1Q2018 vs. 15.8% in FY2017.
Loan growth outpaced deposits. ABQ’s net loans grew by 4.7% YTD, while
deposits only increased by 2.3% in 1Q2018. Hence, the LDR moved to 124% vs.
121% in 2017.
Catalysts
1) Improvement in the stock's trading liquidity.
Recommendation, Valuation and Risks
Recommendation and valuation: We maintain ABQK's price target at QR33.00 and
Market Perform Rating. ABQK trades at a FY2018e P/B and P/E of 1.2x and 9.4x,
respectively. Moreover, the stock trades at PEG of 0.9x (based on a 2017-22e CAGR
of 10.5%), indicating the stock is trading around its fair value.
Risks: 1) Ahli Bank's market share gains do not materialize and 3) concentration
risk and general risks rising from regional socio-political issues.
Key Financial Data and Estimates
Source: Company data, QNBFS Research; Note: All data based on current number of shares
Key Data
Source: Bloomberg (as of May 1, 2018), *Qatar Exchange
(as of May 1, 2018); Note: FO is foreign ownership
Relative Price Performance vs. Market Indices
Historical P/E Trends vs. Share Price
Source: Bloomberg, QNBFS Research
Shahan Keushgerian
+974 4476 6509
Saugata Sarkar, CFA, CAIA
+974 4476 6534
Recommendation MARKET PERFORM Risk Rating R-3
Share Price QR30.00 Target Price QR33.00
Implied Upside 10.0%
(In QR m n ) 2017 2018e 2019e 2020e
EPS (QR) 3.17 3.20 3.49 3.79
Growth (%) 0.6 0.8 9.3 8.6
P/E (x) 9.9 9.4 8.6 7.9
BVPS (QR) 25.2 24.0 26.4 29.0
P/B (x) 1.2 1.2 1.1 1.0
DPS (QR) 0.95 1.00 1.15 1.30
Dividend Yield (%) 3.2 3.3 3.8 4.3
Current Market Price (QR) 30.00
Dividend Yield (%) 3.3
Bloomberg Ticker ABQK QD EQUITY
Reuters Ticker AABQ.QA
ISIN QA0001200748
Sector Banks & Financial Services
52wk High/52wk Low (QR) 42.37 / 24.29
3-m Average Volume (‘000) 6.1
Mkt. Cap. ($ bn/QR bn) 1.7 / 6.3
Shares Outstanding (mn) 210.4
FO Limit* (%) 25.0
Current FO* (%) 0.2
1-Year Total Return (%) (4.9)
Fiscal Year End December 31
-
0.5
1.0
1.5
2.0
2.5
3.0
3.5
4.0
4.5
-
20
40
60
80
100
120
140
160
180
Tho
usa
nd
s
ABQK Volume ABQK DSM
-
5
10
15
20
25
30
35
40
45
50
0.0x
2.0x
4.0x
6.0x
8.0x
10.0x
12.0x
14.0x
16.0x
18.0x
20.0x
ABQK ABQK P/E ABQK P/E LT Avg. +/- 2 Std. Dev.

Thursday, 03 May 2018 11
Detailed Financial Statements
Key Ratios 2017 2018e 2019e 2020e
Profitability (%)
RoAE (Attributable) 12.6 13.0 13.9 13.7
NIM 2.3 2.2 2.3 2.3
RoRWA (Attributable) 2.1 2.0 2.0 2.0
Efficiency (%)
Cost-to-Income (Headline) 30.6 30.7 29.9 29.7
Cost-to-Income (Core) 30.8 30.9 30.0 29.9
Liquidity (%)
LDR 120.6 121.2 117.5 115.9
Loans/Assets 72.6 74.2 72.6 72.8
Cash & Interbank Loans-to-Total Assets 19.7 18.1 19.9 19.4
Asset Quality (%)
NPL Ratio 1.31 0.98 1.02 1.08
Coverage Ratio 108.4 156.8 147.6 145.7
Cost of Risk 24 19 19 22
Capitalization (%)
Tier 1 Ratio 15.3 14.7 14.2 14.4
CAR 15.5 14.8 14.4 14.6
Growth (%)
Net Interest Income 13.5 2.8 9.0 9.5
Net Operating Income 9.1 1.6 9.8 9.4
Net Income 1.3 5.1 9.3 8.6
Loans 7.7 7.5 8.6 8.5
Deposits -12.0 7.0 12.0 10.0
Source: Company data, QNBFS Research
Income Statement (In QR mn) 2017 2018e 2019e 2020e
Net Interest Income 834 858 935 1,024
Fees & Commissions 174 166 177 199
FX Income 23 20 26 19
Other Income 13 20 16 17
Non-Interest Income 210 205 219 235
Total Revenue 1,044 1,063 1,154 1,259
Operating Expenses (319) (326) (345) (374)
Net Operating Income 725 736 809 885
Net Provisions & Investment Impairment (85) (64) (74) (88)
Net Profit (Headline/Reported) 640 672 735 798
Social & Sports Contribution Fund (16) (17) (18) (20)
Net Profit (Attributable) 624 655 716 778
Source: Company data, QNBFS Research

Thursday, 03 May 2018 12
Balance Sheet (In QR mn) 2017 2018e 2019e 2020e
Assets
Cash & Balances with Central Bank 1,980 1,899 2,357 2,530
Interbank Loans 2,202 1,898 2,702 2,565
Net Investments 6,100 6,316 6,945 7,761
Net Loans 28,936 31,109 33,780 36,642
Other Assets 407 467 507 550
Net PP&E 259 256 258 267
Total Assets 39,883 41,944 46,550 50,314
Liabilities
Interbank Deposits 3,982 4,049 4,332 4,102
Customer Deposits 23,987 25,666 28,746 31,621
Term Loans & Other Borrowings 5,817 6,282 6,910 7,394
Other Liabilities 804 898 1,006 1,107
Total Liabilities 34,590 36,895 40,995 44,224
Total Shareholders’ Equity 5,294 5,049 5,555 6,091
Total Liabilities & Shareholders’ Equity 39,883 41,944 46,550 50,314
Source: Company data, QNBFS Research

Thursday, 03 May 2018 13
Al Khalij Commercial Bank (KCBK)
In-Line 1Q2018; Margins Expand
Al Khalij Commercial Bank is one of the smallest banks domestically. In terms of loans (~4%
market share as of 2017), KCBK is one of the smallest of the five-listed conventional banks (6th
among the eight-listed banks). KCBK has one of the lowest RoEs (8.0% 2017) among listed banks
and it is below its cost of equity of 12.58%. Based on average RoE of 12.41% within our forecast
horizon vs. cost of equity of 12.58%, the bank is generating economic losses.
Highlights
KCBK QoQ surge in net income driven by a significant drop in provisions &
impairments; YoY growth in profitability was a result of better operating income (due
to higher NII), lower opex and provisions. KCBK reported net income of QR169.5mn (in-
line with our estimate of QR160.1mn) surging by 74.8% QoQ (+5.3% YoY).
Operating efficiency continued its positive trajectory which resulted in strong JAWS.
Revenue grew by 11.5% QoQ (+1.2% YoY) while opex moved up by 2.0% QoQ (declined
by 3.2% YoY). As a result KCBK generated JAWS of 9.6% and 4.4% QoQ and YoY,
respectively. Moreover, C/I ratio declined to 25.7% in 1Q2018 vs. 28.1% in 4Q2017
(26.8% in 1Q2017). Management has been delivering on its efficiency target. Going
forward we expect further improvement in the C/I ratio mainly through topline growth.
Margins improved sequentially and on a YoY basis. Net interest income increased by
4.5% QoQ (+5.7% YoY) to QR244.0mn, in-line with our estimate of QR236.8mn (+3.0%
variation). NIM expanded by 14bps QoQ and 21bps YoY to 1.86%. Yields moved up by
19bps QoQ (+43bps YoY) while CoFs remained flat (+15bps YoY), leading the expansion
in margins.
Gross loans remained flat while deposits dropped. Gross loans remained flat QoQ at
QR36.1bn while deposits receded by 3.8% to QR31.4bn. As such, LDR moved up to
109% vs. 107% in at the end of 2017. Including EMTN as a source of long-term funding,
LDR works out to 98%.
NPLs remained stable, CoR dropped. The bank’s NPLs remained stable QR703.3mn. As
such, the NPL ratio also remained constant at 1.95% vs. 1.94% at the end of 2017.
Moreover, the coverage ratio (coverage of stage 3 loans/NPLs) remained healthy at
106%. We expect the coverage ratio to continuously increase as management exercises
prudent risk control. CoR improved, declining to 50bps vs. 84bps in 2017. Under IFRS 9,
stage 1 loans represent 87% of total loans while stage 2 loans are 11%.
IFRS 9 negatively impacted KCBK’s equity base. The bank disclosed ECLs of QR1bn
which was netted against equity in 1Q2018. ECLs negatively impacted equity by 13%.
Tier 1 capital negatively impacted by IFRS 9; however capital position remains strong.
KCBK ended 1Q2018 with a CET1 ratio of 12.8% and Tier-1 ratio of 16.6% (including
AT1 capital) vs. 14.2% and 16.7% at the end of 2017, respectively. ECLs of QR1bn
shaved off 129bps from CET1 ratio.
Catalysts
Visible progress in management's strategy: 1) an expansion of attributable RoE beyond
12% (2018 and 2019e RoE: 8.0% and 10.7%, respectively)
Recommendation, Valuation and Risks Recommendation and valuation: We maintain our Price Target at QR15.00. KCBK trades
at P/TB and P/E of 0.7x and 7.7x on our 2018 estimates, respectively.
Risks: 1) Geopolitical Factors/issues, 2) KCBK's market share gains do not materialize; 3)
possible asset quality concerns and 4) concentration risk.
Key Financial Data and Estimates
Source: Company data, QNBFS Research; Note: All data based on current number of shares
Key Data
Source: Bloomberg (as of May 1, 2018), *Qatar Exchange
(as of May 1, 2018); Note: FO is foreign ownership
Relative Price Performance vs. Market Indices
Historical P/E Trends vs. Share Price
Source: Bloomberg, QNBFS Research
Shahan Keushgerian
+974 4476 6509
Saugata Sarkar, CFA, CAIA
+974 4476 6534
Recommendation ACCUMULATE Risk Rating R-3
Share Price QR11.01 Target Price QR15.00
Implied Upside 36.2%
(In QR m n ) 2017 2018e 2019e 2020e
EPS (QR) 1.38 1.44 1.71 1.96
Growth (%) 28.8 4.3 19.2 14.9
P/E (x) 8.0 7.7 6.4 5.6
TBVPS (QR) 17.0 15.1 16.0 17.2
P/B (x) 0.6 0.7 0.7 0.6
DPS (QR) 0.75 0.75 0.75 1.00
Dividend Yield (%) 6.8 6.8 6.8 9.1
Current Market Price (QR) 11.01
Dividend Yield (%) 6.8
Bloomberg Ticker KCBK QD EQUITY
Reuters Ticker KCBK.QA
ISIN QA000A0M6MD5
Sector Banks & Financial Services
52wk High/52wk Low (QR) 15.20 / 10.81
3-m Average Volume (‘000) 171.9
Mkt. Cap. ($ bn/QR bn) 1.1 / 4.0
Shares Outstanding (mn) 360.0
FO Limit* (%) 49.0
Current FO* (%) 14.3
1-Year Total Return (%) (21.0)
Fiscal Year End December 31
-
1.0
2.0
3.0
4.0
5.0
6.0
-
20
40
60
80
100
120
140
160
180
Tho
usa
nd
s
KCBK Volume KCBK DSM
-
5
10
15
20
25
0.0x
2.0x
4.0x
6.0x
8.0x
10.0x
12.0x
14.0x
16.0x
18.0x
KCBK KCBK P/E KCBK P/E LT Avg. +/- 2 Std. Dev.

Thursday, 03 May 2018 14
Detailed Financial Statements
Ratios/Financial Indicators FY2017 FY2018e FY2019e FY2020e
Profitability (%)
RoAE (Attributable) 7.8 8.5 10.4 11.2
RoAA (Attributable) 0.8 0.9 1.0 1.1
RoRWA (Attributable) 0.9 1.0 1.1 1.2
NIM (% of IEAs) 1.8 1.9 2.0 2.1
NIM (% of RWAs) 2.4 2.6 2.7 2.7
NIM (% of AAs) 1.7 1.8 1.9 2.0
Spread 1.7 1.6 1.7 1.7
Efficiency (%)
Cost-to-Income (Headline) 27.6 25.6 25.0 25.9
Cost-to-Income (Core) 27.8 25.8 25.2 26.1
Liquidity (%)
LDR 107 100 97 98
Loans/Assets 60.6 61.6 66.9 68.8
Cash & Interbank Loans-to-Total Assets 15.9 15.6 11.7 13.4
Deposits to Assets 56.5 61.3 68.8 70.6
Wholesale Funding to Loans 46.3 39.5 24.9 22.0
IEAs to IBLs 117.6 117.1 117.5 118.5
Asset Quality (%)
NPL Ratio 1.94 2.30 2.10 1.50
NPL to Shareholder's Equity 11.10 15.64 14.61 10.92
NPLs to Tier-1 Capital 10.49 14.15 13.30 10.10
Coverage Ratio 118 115 131 183
ALL/Average Loans 2.3 5.0 5.0 4.8
Cost of Risk 84 88 78 60
Capitalization (%)
Tier-1 Ratio 16.7 15.6 15.5 14.5
CAR 16.7 15.6 15.5 14.5
Tier-1 Capital to Assets 11.5 10.5 11.1 10.7
Tier-1 Capital to Loans 19.0 17.1 16.6 15.6
Tier-1 Capital to Deposits 20.4 17.2 16.1 15.2
Leverage (x) 9.2 10.5 9.9 10.1
Growth (%)
Net Interest Income 7.9 3.7 8.8 8.4
Non-Interest Income -6.9 3.5 8.6 -4.2
OPEX -1.9 -3.5 6.0 9.8
Net Operating Income 7.5 6.4 9.7 4.8
Net Income (Reported/Headline) 29.1 3.5 17.8 13.6
Loans -0.2 2.9 8.5 12.3
Deposits 1.5 10.0 12.0 12.0
Assets -4.5 1.3 -0.1 9.2
RWAs -3.1 -0.6 5.8 12.4
Source: Company data, QNBFS Research
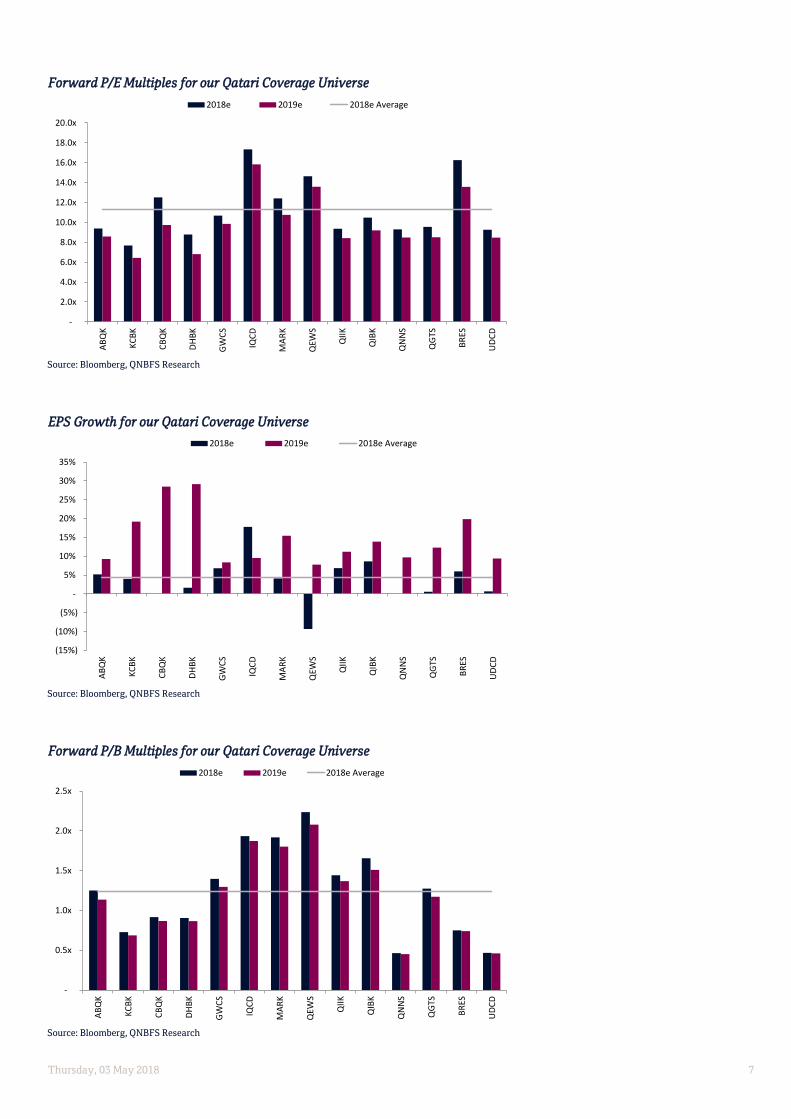
Thursday, 03 May 2018 15
Income Statement (In QR mn) FY2017 FY2018e FY2019e FY2020e
Net Interest Income 984 1,021 1,110 1,204
Fees & Commissions 182 186 200 182
FX Income 39 43 46 52
Other Income 9 10 12 14
Non-Interest Income 231 239 259 248
Total Revenue 1,215 1,259 1,369 1,452
Operating Expenses (335) (323) (342) (376)
Net Operating Income 880 936 1,027 1,076
Net Provisions & Investment Impairments (319) (344) (330) (284)
Net Profit Before Taxes & Non-Recurring Items 562 592 697 792
Non-Recurring Income/(Loss) - - - -
Net Profit Before Taxes 562 592 697 792
Tax (11) (23) (26) (30)
Net Profit (Headline/Reported) 551 570 671 762
Interest Payment on AT1 Note (55) (55) (55) (55)
Social & Sports Contribution Fund (14) (14) (17) (19)
Net Profit (Attributable) 482 500 599 688
Source: Company data, QNBFS Research
Balance Sheet (In QR mn) FY2017 FY2018e FY2019e FY2020e
Assets
Cash & Balances with Central Bank 2,587 2,696 2,013 2,706
Interbank Loans 6,617 6,471 4,832 5,863
Net Investments 12,506 12,393 11,553 10,383
Net Loans 35,094 36,119 39,177 43,982
Other Assets 689 542 588 616
Net PP&E 235 248 247 247
Goodwill & Intangible Assets 156 143 143 125
Total Assets 57,885 58,613 58,553 63,922
Liabilities
Interbank Deposits 10,597 8,624 4,107 4,033
Customer Deposits 32,683 35,951 40,265 45,097
Term Loans & Other Borrowings 5,743 5,656 5,656 5,656
Other Liabilities 1,570 1,798 1,611 1,804
AT1 Perpetual Bonds 1,000 1,000 1,000 1,000
Total Liabilities 51,593 53,029 52,639 57,590
Shareholders’ Equity 6,292 5,585 5,914 6,332
Total Liabilities & Shareholders’ Equity 57,885 58,613 58,553 63,922
Source: Company data, QNBFS Research

Thursday, 03 May 2018 16
Commercial Bank of Qatar (CBQK)
1Q2018 Beats Estimates; CoR Normalizes CBQK posted good results in 1Q2018, while continuously delivering on its objectives from its 5-
year strategy. Stock price performance thus far has rewarded investors’ optimism in the
company’s change in strategy and positive stewardship shown by its new CEO. The stock has re-
rated from a steep 30% discount to book to almost at par with book. While positive 1Q2018
results could fuel more momentum in the name, the reality of negative residual value derived from
on- going operations cannot be minimized. We believe while recent gains are not entirely
unjustified, we do think that the stock is fairly valued at present levels. We remain Market
Perform on the name and maintain our PT of QR35/sh. vs. PT QR29/sha. Previously on better
expectations of RoE generation in the outer years.
Highlights CBQK’s 1Q2018 bottom-line soars QoQ and YoY driven by normalization of credit costs
and lower opex. CBQK reported net profit of QR404.7mn, gaining by 17.4% QoQ
(+343.6% YoY). Earnings beat our estimates by 11.6% on the back of lower provisions
as net interest income (QR665.0mn, -0.9% variation) was in-line and net operating
income was broadly in-line (QR622.0mn, +4.7% variation).
Margins sequentially compressed. NIM contracted by 18bps QoQ (+7bps YoY) to 2.17%
due to a decline in yield on assets coupled with an increase in CoFs. Yield on assets
receded by 13bps QoQ (+55bps YoY) while CoFs moved up by 7bps (+54bps YoY).
NPLs stable; CoR normalized. NPLs remained stable at QR5.2bn, while the NPL ratio
declined to 5.30% vs. 5.65% in 2017 (majority of NPLs are legacy). On the other hand,
coverage ratio improved to 86% from 81% in 2017. Net provisions and impairments
dropped by 7.7% (halved YoY) to QR235.9mn vs. QR255.6mn in 4Q2017 & QR484.8mn
in 1Q2017. CoR improved to 92bps vs. 108bps in 4Q2017. Management is guiding to a CoR
of 100bps in 2018.As per IFRS 9, stage 1 loans represents 80% of total loans while stage
2 is 15%.
Operating efficiency continued its positive trajectory, Generating Strong JAWs. CBQK
posted opex of QR311.5mn, dropping by 0.4% QoQ (-12.4% YoY). Hence the C/I ratio
dropped to 32.4% vs. 34.5% in 4Q2017 (38% in 1Q2017). Moreover, the bank generated
positive JAWs of 6.5% and 15.2% QoQ and YoY, respectively. Improving efficiency is
part of management’s strategy by reducing C/I ratio to low-30%s and they have been
delivering.
Loan growth outpaced deposit growth; LDR remains elevated, however. Net loans
expanded by 4.0% YTD to QR92.7bn, while customer deposits increased by 2.1% to
QR79.3bn. As such, the bank’s LDR remained at 117% vs. 115% at the end of 2017.
Tier-1 capital adversely impacted by IFRS 9. As a result of one time impairment charges
to the bank’s equity, CET-1 ratio declined to 9.4% (11.2% in FY2017). CBQK’s CAR also
declined to 14.8% vs. 16.1% in FY2017.
Catalysts
Delivering better profitability metrics than expected/estimated.
Recommendation, Valuation and Risks Recommendation and valuation: We maintain our Price Target of QR35/sh. and maintain
our Market Perform rating. CBQK is trading at a 2018e P/TB and P/E of 0.9x and 12.5x,
respectively.
Risks: 1) Failing to achieve goals & objectives from 5-year plan & 2) Further
deterioration in asset quality.
Key Financial Data and Estimates
Source: Company data, QNBFS Research; Note: All data based on current number of shares
Key Data
Source: Bloomberg (as of May 1, 2018), *Qatar Exchange
(as of May 1, 2018); Note: FO is foreign ownership
Relative Price Performance vs. Market Indices
Historical P/E Trends vs. Share Price
Source: Bloomberg, QNBFS Research
Shahan Keushgerian
+974 4476 6509
Saugata Sarkar, CFA, CAIA
+974 4476 6534
Recommendation MARKET PERFORM Risk Rating R-3
Share Price QR36.00 Target Price QR35.00
Implied Upside (2.8%)
(In QR m n ) 2017 2018e 2019e 2020e
EPS 0.90 2.87 3.69 3.93
EPS Growth (%) 0.2 220.0 28.5 6.5
P/E (x) 40.1 12.5 9.7 9.2
Tangible BVPS (QR) 41.0 39.3 41.5 44.0
P/TBV (x) 0.9 0.9 0.9 0.8
DPS (QR) 1.00 1.50 1.50 2.00
Dividend Yield (%) 2.8 4.2 4.2 5.6
Current Market Price (QR) 36.00
Dividend Yield (%) 4.2
Bloomberg Ticker CBQK QD EQUITY
Reuters Ticker COMB.QA
ISIN QA0007227752
Sector Banks & Financial Services
52wk High/52wk Low (QR) 36.25 / 24.50
3-m Average Volume (‘000) 194.5
Mkt. Cap. ($ bn/QR bn) 4.0 / 14.6
Shares Outstanding (mn) 404.7
FO Limit* (%) 49.0
Current FO* (%) 14.2
1-Year Total Return (%) 24.9
Fiscal Year End December 31
-
2.0
4.0
6.0
8.0
10.0
12.0
-
20
40
60
80
100
120
140
160
180
Tho
usa
nd
s
CBQK Volume CBQK DSM
-
10
20
30
40
50
60
70
0.0x
10.0x
20.0x
30.0x
40.0x
50.0x
60.0x
70.0x
80.0x
CBQK CBQK P/E CBQK P/E LT Avg. +/- 2 Std. Dev.

Thursday, 03 May 2018 17
Detailed Financial Statements
Ratios FY2017 FY2018e FY2019e FY2020e
Profitability (%)
RoAE (Attributable) 2.2 6.8 8.7 8.8
RoAA (Attributable) 0.3 0.8 0.9 0.9
RoRWA (Attributable) 0.3 3.1 1.9 1.8
NIM (% of IEAs) 2.18 2.17 2.17 2.16
NIM (% of RWAs) 2.18 2.22 2.25 2.25
NIM (% of AAs) 1.87 1.88 1.91 1.91
Spread 1.8 1.7 1.7 1.7
Efficiency (%)
Cost-to-Income (Headline) 36.0 33.4 31.4 31.0
Cost-to-Income (Core) 38.1 35.1 33.0 32.6
Liquidity (%)
LDR 115 108 104 102
LDR (including CDs) 115 108 104 102
Loans/Assets 64 64 65 65
Cash & Interbank Loans-to-Total Assets 12.9 14.8 14.4 14.5
Deposits to Assets 56 59 62 63
Wholesale Funding to Loans 39 37 32 33
IEAs to IBLs 118 116 114 115
Asset Quality (%)
NPL Ratio 5.6 5.8 5.9 5.0
NPLs to Shareholder's Equity 31.0 36.1 38.4 33.9
NPLs to Tier 1 Capital 31.0 33.6 35.9 32.2
Coverage Ratio 81.0 106.3 103.5 122.6
ALL/Average Loans 4.9 6.4 6.4 6.4
Cost of Risk 1.95 1.13 1.01 1.00
Capitalization (%)
Tier 1 Ratio 14.5 13.9 13.3 12.6
CAR 16.1 15.6 15.0 14.3
Tier 1 Capital to Assets 12.3 11.8 11.3 10.7
Tier 1 Capital to Loans 19.1 18.4 17.5 16.5
Tier 1 Capital to Deposits 21.9 19.9 18.2 16.8
Leverage (x) 8.1 9.1 9.5 9.9
Growth (%)
Net Interest Income 7.6 7.3 9.6 9.4
Non-Interest Income -4.0 3.7 7.3 -2.3
Total Revenue 3.6 6.2 8.9 5.9
Operating Expenses -22.1 -1.6 2.4 4.5
Net Operating Income 27.4 10.6 12.2 6.5
Net Provisions & Investment Impairments 29.7 -33.5 -2.1 8.0
Net Income (Headline/Reported) 20.5 132.5 23.6 5.6
Net Income (Attributable) 30.0 223.8 28.7 6.5
Loans 14.6 6.6 10.1 10.0
Deposits 9.5 13.0 15.0 12.0
Assets 6.2 7.4 8.9 10.0
RWAs 2.7 7.8 9.0 10.1
Source: Company data, QNBFS Research

Thursday, 03 May 2018 18
Income Statement (In QR mn) FY2017 FY2018e FY2019e FY2020e
Net Interest Income 2,518 2,702 2,962 3,241
Fees & Commissions 720 742 816 800
FX Income 163 187 209 178
Other Income 276 273 264 282
Non-Interest Income 1,159 1,202 1,290 1,260
Total Revenue 3,677 3,904 4,251 4,501
Operating Expenses (1,325) (1,303) (1,335) (1,395)
Net Operating Income 2,352 2,600 2,917 3,107
Net Provisions & Impairments (1,743) (1,160) (1,136) (1,227)
Net Profit Before Taxes & Non-Recurring Items 609 1,440 1,781 1,880
Non-Recurring Income 0 0 0 0
Net Profit After Non-Recurring Income 609 1,440 1,781 1,880
Tax (5) (37) (45) (48)
Net Profit Before Minority Interest 604 1,404 1,735 1,832
Minority Interest (0) (0) (0) (0)
Net Profit (Headline/Reported) 604 1,404 1,735 1,832
Interest on Tier-1 Note (240) (240) (240) (240)
Social & Sports Contribution Fund (15) (35) (43) (46)
Net Profit (Attributable) 349 1,128 1,452 1,546
Source: Company data, QNBFS Research
Balance Sheet (In QR mn) FY2017 FY2018e FY2019e FY2020e
Assets
Cash & Balances with Central Bank 7,374 8,422 9,382 10,169
Interbank Loans 10,499 13,649 13,949 15,623
Net Investments 19,629 21,942 24,061 26,906
Net Loans 89,122 94,997 104,566 114,995
Investment In Associates 2,088 2,166 2,248 2,337
Other Assets 6,715 4,560 4,810 5,175
Net PP&E 2,591 2,548 2,582 2,623
Goodwill & Other Intangibles 430 375 319 263
Total Assets 138,449 148,658 161,918 178,091
Liabilities
Interbank Deposits 13,516 12,370 9,469 11,049
Certificate of Deposits - - - -
Customer Deposits 77,633 87,726 100,885 112,991
Term Loans 20,908 22,581 24,387 26,338
Tier-1 Perpetual Notes 4,000 4,000 4,000 4,000
Other Liabilities 5,370 5,702 6,053 5,650
Total Liabilities 121,428 132,379 144,794 160,027
Shareholders’ Equity
Total Shareholders’ Equity 17,022 16,279 17,124 18,063
Total Liabilities & Shareholders’ Equity 138,449 148,658 161,918 178,091
Source: Company data, QNBFS Research
Thursday, 03 May 2018 19
Doha Bank (DHBK)
1Q2018 Bottom-Line Driven by Lower Net Provisions A compelling dividend play with improving fundamentals; maintain Market Perform for now.
DHBK remains a compelling dividend play given what we consider to be a safe payout of
QR2.00-2.50/sh over the next 3-5 years, yielding 7 to 9%. We expect a cut in dividends as
IFRS 9 significantly impacted the bank’s equity and CET 1 ratio. CET 1 ratio declined by
208bps to 10.2% from 12.3% at the end of 2017.
Highlights 1Q2018 net income driven by lower provisions & impairments both sequentially and
YoY. DHBK reported net profit of QR381.4mn (in-line with our estimate of QR371.3mn;
variation of +2.7%) vs. QR61.4mn in 4Q2017 & QR364.4mn in 1Q2017 (+4.7% growth).
The bottom-line was driven by a sharp in provisions as revenue and net operating
income receded QoQ and YoY. The bank booked net provisions of QR60.5mn vs.
QR400.3mn in 4Q2017 (QR86.4mn in 1Q2017).
Spreads compressed sequentially. Net interest income decreased by 7.3% QoQ (+7.5%
YoY) to QR560.1mn. DHBK’s net interest margin contracted by 22bps QoQ (+13bps
YoY) to 2.64%. The compression in the spread was due to CoFs gaining by 19bps while
yield on assets remaining flat. The margin pressure in 1Q2018 was possibly due to
deposits flows at the end of 4Q2017 and the interest expense associated with it may not
have impacted the income statement in 4Q2017.
Efficiency ratio remained unchanged; still on the high side. Opex and revenue declined
by similar percentages. Thus, C/I ratio remained at 37% vs. 38% in 4Q2017 and 1Q2017.
Provisioning as per IFRS 9 wiped out risk reserves. DHBK’s expected net credit losses &
impairments sat at QR1.5bn. After netting it out against risk reserves, the remaining
charge of QR134.3mn was applied to retained earnings. These charges reduced
shareholders’ equity by 14.7% YTD.
CoR dropped, which is a positive. CoR came in at 28bps in 1Q2018 vs. 232bps in 4Q2017
(35bps in 1Q2017).
Asset quality remained under pressure. DHBK’s asset quality worsened with the bank’s
NPLs gaining by 13.3% QoQ to QR2.6bn. Moreover, The NPL ratio moved to 3.99% from
3.61% in 2017. However, the coverage ratio remains healthy at 109%.
Net Loans and deposits exhibited flat performance. Net loans and deposits remained
flat at QR59.9bn and QR59.3bn, respectively. Hence the LDR remained unchanged at
101%. On the other hand, loans to stable sources of funds rested at 92%.
CET1 ratio declined as a result of impairments arising from IFRS 9. DHBK’s CET1 ratio
declined by 208bps to 10.2% from 12.3% at the end of 2017. Moreover, total Tier-1 ratio
(includes AT1 capital) sequentially dropped by 195bps to 15.4% vs. 17.4% in FY2017.
Catalysts 1) Better execution of the bank’s strategy and 2) improvement in asset quality
Recommendation, Valuation and Risks Recommendation and valuation: DHBK is trading at a 2018e P/B and P/E of 0.9x and
8.8x, respectively.
Risks: 1) Geopolitical factors and 3) Exposure real estate & contracting segments
Key Financial Data and Estimates
Source: Company data, QNBFS Research; Note: All data based on current number of shares
Key Data
Source: Bloomberg (as of May 1, 2018), *Qatar Exchange
(as of May 1, 2018); Note: FO is foreign ownership
Relative Price Performance vs. Market Indices
Historical P/E Trends vs. Share Price
Source: Bloomberg, QNBFS Research
Shahan Keushgerian
+974 4476 6509
Saugata Sarkar, CFA, CAIA
+974 4476 6534
Recommendation MARKET PERFORM Risk Rating R-3
Share Price QR27.00 Target Price QR31.00
Implied Upside 14.8%
2017 2018e 2019e 2020e
EPS 3.02 3.07 3.97 4.55
Growth -3.2 1.6 29.2 14.8
P/E (x) 9.4 8.8 6.8 5.9
BVPS (QR) 34.9 29.8 31.2 33.6
P/B (x) 0.8 0.9 0.9 0.8
DPS (QR) 3.00 2.50 2.00 2.50
Dividend Yield (%) 11.1 9.3 7.4 9.3
Current Market Price (QR) 27.00
Dividend Yield (%) 9.3
Bloomberg Ticker DHBK QD EQUITY
Reuters Ticker DOBK.QA
ISIN QA0006929770
Sector Banks & Financial Services
52wk High/52wk Low (QR) 34.98 / 25.20
3-m Average Volume (‘000) 354.3
Mkt. Cap. ($ bn/QR bn) 2.3 / 8.4
Shares Outstanding (mn) 310.0
FO Limit* (%) 49.0
Current FO* (%) 13.5
1-Year Total Return (%) (5.6)
Fiscal Year End December 31
-
1.0
2.0
3.0
4.0
5.0
6.0
7.0
-
20
40
60
80
100
120
140
160
180
Tho
usa
nd
s
DHBK Volume DHBK DSM
-
10
20
30
40
50
60
70
0.0x
2.0x
4.0x
6.0x
8.0x
10.0x
12.0x
14.0x
DHBK DHBK P/E DHBK P/E LT Avg. +/- 2 Std. Dev.

Thursday, 03 May 2018 20
Company Description Doha Bank is Qatar’s 3
rd largest conventional bank with a market share of ~8% in loans and deposits, respectively (5
th largest among all listed
banks). DHBK was known for solely being a retail bank with retail loans representing ~42% of its loan book in 2008. However, the bank has
shifted its strategy by tapping other sectors of the economy such as contracting and real estate. As of FY2017, loans to contractors made up ~17%
of its loan portfolio vs. ~10% in 2008. During the same period, retail loans dropped from ~42% to ~14%.
Detailed Financial Statements Ratios FY2017 FY2018e FY2019e FY2020e
Profitability (%)
RoAE (Attributable) 8.5 9.2 12.6 13.7
RoAA (Attributable) 1.2 1.2 1.4 1.5
RoRWA (Attributable) 1.1 1.1 1.4 1.4
NIM (% of IEAs) 2.71 2.81 2.83 2.87
NIM (% of RWAs) 2.85 3.00 3.00 2.95
NIM (% of AAs) 2.45 2.54 2.60 2.63
Spread 2.5 2.6 2.6 2.6
Efficiency (%)
Cost-to-Income (Headline) 37.4 36.2 35.1 35.6
Cost-to-Income (Core) 38.1 36.8 35.6 36.4
Liquidity (%)
LDR 100.6 98.4 96.1 97.0
Loans/Assets 64.0 63.5 62.2 64.0
Cash & Interbank Loans-to-Total Assets 15.5 14.0 15.2 13.0
Deposits to Assets 63.6 64.5 64.7 66.0
Wholesale Funding to Loans 28.6 30.6 31.9 28.7
IEAs to IBLs 109.3 109.7 108.2 109.1
Asset Quality (%)
NPL Ratio 3.61 3.95 4.06 4.30
NPLs to Shareholders’ Equity 20.9 28.2 29.7 31.5
NPLs to Tier 1 Capital 23.3 30.9 31.7 34.1
Coverage Ratio 124.8 124.5 130.0 126.3
ALL/Average Loans 4.5 7.2 7.5 7.6
Cost of Risk 95 106 89 77
Capitalization (%)
Tier 1 Ratio 17.4 15.1 14.1 13.7
CAR 17.5 15.3 14.2 13.9
Tier 1 Capital to Assets 14.7 12.9 12.4 12.3
Tier 1 Capital to Loans 22.9 20.3 19.9 19.3
Tier 1 Capital to Deposits 23.0 20.0 19.1 18.7
Leverage (x) 8.7 10.5 10.9 10.6
Growth (%)
Net Interest Income 8.8 7.3 8.3 8.0
Non-Interest Income 2.1 1.4 6.2 1.1
Total Revenue 7.1 5.9 7.8 6.4
Opex 2.3 2.5 4.6 8.0
Net Operating Income 10.3 8.0 9.6 5.6
Net Income (Headline/Reported) 5.3 5.5 23.7 12.5
Net Income (Attributable) 6.8 7.0 29.4 14.9
Loans 1.0 2.7 6.5 8.0
Deposits 6.7 5.0 9.0 7.0
Assets 3.5 3.5 8.7 5.0
RWAs -0.7 4.3 12.5 7.4
Source: Company data, QNBFS Research

Thursday, 03 May 2018 21
Income Statement (In QR mn) FY2017 FY2018e FY2019e FY2020e
Net Interest Income 2,255 2,421 2,621 2,830
Fees & Commissions 465 476 505 507
FX Income 107 111 117 109
Other Income 119 113 122 136
Non-Interest Income 691 700 744 752
Total Revenue 2,946 3,121 3,365 3,582
Operating Expenses (1,103) (1,130) (1,182) (1,276)
Net Operating income 1,843 1,991 2,183 2,306
Net Provisions & Investment Impairment (735) (814) (728) (667)
Net Profit Before Taxes 1,109 1,177 1,456 1,639
Tax 1 (5) (7) (7)
Net Profit (Headline/Reported) 1,110 1,172 1,449 1,631
Interest on Tier-1 Note (220) (220) (220) (220)
Social & Sports Contribution Fund (28) (29) (36) (41)
Attributable Net Profit 862 922 1,193 1,370
Source: Company data, QNBFS Research
Balance Sheet (In QR mn) FY2017 FY2018e FY2019e FY2020e
Assets
Cash & Balances with Central Bank 6,670 4,995 6,126 5,826
Interbank Loans 7,822 8,599 9,816 8,480
Net Investments 17,513 20,109 22,176 23,768
Net Loans 59,804 61,423 65,440 70,671
Other Assets 978 994 993 1,072
Net PP&E 709 643 614 587
Total Assets 93,495 96,764 105,166 110,404
Liabilities
Interbank Deposits 11,005 12,068 13,352 11,623
Customer Deposits 59,468 62,442 68,061 72,826
Term Loans 6,091 6,700 7,504 8,629
Other Liabilities 2,124 2,310 2,586 2,913
Tier 1 Perpetual Note 4,000 4,000 4,000 4,000
Total Liabilities 82,688 87,519 95,503 99,991
Total Shareholders’ Equity 10,807 9,245 9,663 10,413
Total Liabilities & Shareholders’ Equity 93,495 96,764 105,166 110,404
Source: Company data, QNBFS Research
Thursday, 03 May 2018 22
Gulf Warehousing Company (GWCS)
Solid Start to the Year; Maintain Outperform GWCS posted solid 1Q2018 numbers with in-line earnings. While gross margins declined as
revenue exceeded our forecasts in lower-margin 4PL and freight forwarding businesses, earnings
came in-line with our model boosted by the revenue uplift. We have updated our forward
expectations reflecting higher revenue from these aforementioned segments along with mostly
unchanged EPS estimates. We remain bullish on GWCS and retain our price target of
QR51/Outperform rating. GWCS has withstood the blockade well with freight forwarding
bouncing back nicely and some after an initial hit. The company’s logistics business has also
picked up steam driven by contract logistics and increasing occupancy in Bu Sulba. GWCS stock
is down 12%, on a total return basis, since the beginning of the blockade vs. 2%/5% declines in
MSCI Qatar/QSE and we continue to think this underperformance is unwarranted. Growth post
Bu Sulba (~100% occupancy later in 2018) will decline, but as we had flagged previously, GWCS
should start generating substantial FCF with FCF yield increasing from 1.8% in 2017 to 13.3% in
2018, reaching 19.1% in 2023. Dividend yield of 4.3% for 2018 should grow to 6.2% by 2023.
With major capex already done, there could be upside to dividends medium-term.
Highlights 1Q2018 net income came in line with our estimate. GWCS reported net profit of
QR56.7mn (-3% QoQ/+12% YoY) in 1Q2018, in line with our estimate of QR57.4mn (-1%
variance).
Total revenue jumped 15%/40% QoQ/YoY exceeding our forecasts with strong growth
in both logistics and freight forwarding. Logistics is reaching a ~QR200mn quarterly run
rate, up 12% QoQ and 35% YoY, benefiting from 4PL contract logistics and increased
occupancy in Bu Sulba (94% full). The logistics segment remains value accretive with
high cash gross margins of rental business (LVQ: 91%; Bu Sulba: 88%) and 32% for the
remaining logistics operations (contract logistics, records management, transport,
moving & relocation, etc.). GWCS also posted strong growth in freight forwarding, up
21% QoQ/48% YoY to QR114.0mn driven by its oil & gas customers. However, FF is a
low-margin segment, with cash GMs of 27% (2018).
Reported gross margins contracted to 32% vs. 35.8% in 4Q2017 and 35.6% a year ago.
As discussed before, higher mix of lower margin segments contributed to this decline.
Model impact: Revenue estimates upped as we factor in improved traction in 4PL &
freight forwarding but margin compression leads to only slight earnings increase. We
recently increased our 2018 revenue forecast by 13% from QR1.1bn to QR1.2bn but our
net income forecast went up 1% from QR227.1mn to QR230.3mn. Similarly, our overall
revenue/EPS increased by an average of 12% and 1%, respectively, over 2018-2023.
Catalysts Newsflow on projects: (1) The Al Asmakh logistics park management agreement could
add to LT revenue; Ras Abu Fontas could add 8k SQM to warehouse space by 3Q2019.
(2) Corporate restructurings could create boost outsourced logistics solutions. (3) 4PL
remains a growth area. (4) International/regional projects could diversify operations.
Recommendation, Valuation and Risks
Recommendation and valuation: We rate GWCS an Outperform with a price target of
QR51. Stock trades at P/E of 10.7x and 9.9x for 2018 & 2019, respectively.
Risks: include low occupancy in Bu Sulba and customer retention challenges in LVQ/Bu
Sulba. Top-line growth post 2018 potentially capped given the upcoming mega logistics
project (only open to Qatari individuals/100%-Qatari owned firms) in south Qatar.
Key Financial Data and Estimates
FY2017 FY2018e FY2019e FY2020e
Revenue (QR mn) 967 1,200 1,270 1,316
Growth 14% 24% 6% 4%
EBITDA (QR mn) 373 443 464 475
Growth 16% 19% 5% 2%
Net Income (QR mn) 215 230 250 269
EPS (QR) 3.68 3.93 4.26 4.59
Growth 5% 7% 8% 8%
P/E (x) 11.4x 10.7x 9.9x 9.1x
DPS (QR) 1.70 1.80 2.00 2.10
Dividend Yield 4.0% 4.3% 4.8% 5.0%
ROE 13.7% 13.6% 13.6% 13.7%
Source: Company data, QNBFS estimates; Note: All per share data based on current number of shares
Key Data
Source: Bloomberg (as of May 1, 2018), *Qatar Exchange
(as of May 1, 2018); Note: FO is foreign ownership
Relative Price Performance vs. Market Indices
Historical P/E Trends vs. Share Price
Source: Bloomberg, QNBFS Research
Saugata Sarkar, CFA, CAIA
+974 4476 6534
Recommendation OUTPERFORM Risk Rating R-4
Share Price QR42.00 Target Price QR51.00
Implied Upside 21.4% Current Market Price (QR) 42.00
Dividend Yield (%) 4.3
Bloomberg Ticker GWCS QD EQUITY
Reuters Ticker GWCS.QA
ISIN QA000A0KD6H9
Sector Transport
52wk High/52wk Low (QR) 53.50 / 36.66
3-m Average Volume (‘000) 44.5
Mkt. Cap. ($ bn/QR bn) 0.7 / 2.5
Shares Outstanding (mn) 58.6
FO Limit* (%) 49.0
Current FO* (%) 26.4
1-Year Total Return (%) (15.7)
Fiscal Year End December 31
-
0.5
1.0
1.5
2.0
2.5
3.0
3.5
4.0
4.5
5.0
-
50
100
150
200
250
Tho
usa
nd
s
GWCS Volume GWCS DSM
-
10
20
30
40
50
60
70
80
0.0x
5.0x
10.0x
15.0x
20.0x
25.0x
30.0x
GWCS GWCS P/E GWCS P/E LT Avg. +/- 2 Std. Dev.
Thursday, 03 May 2018 23
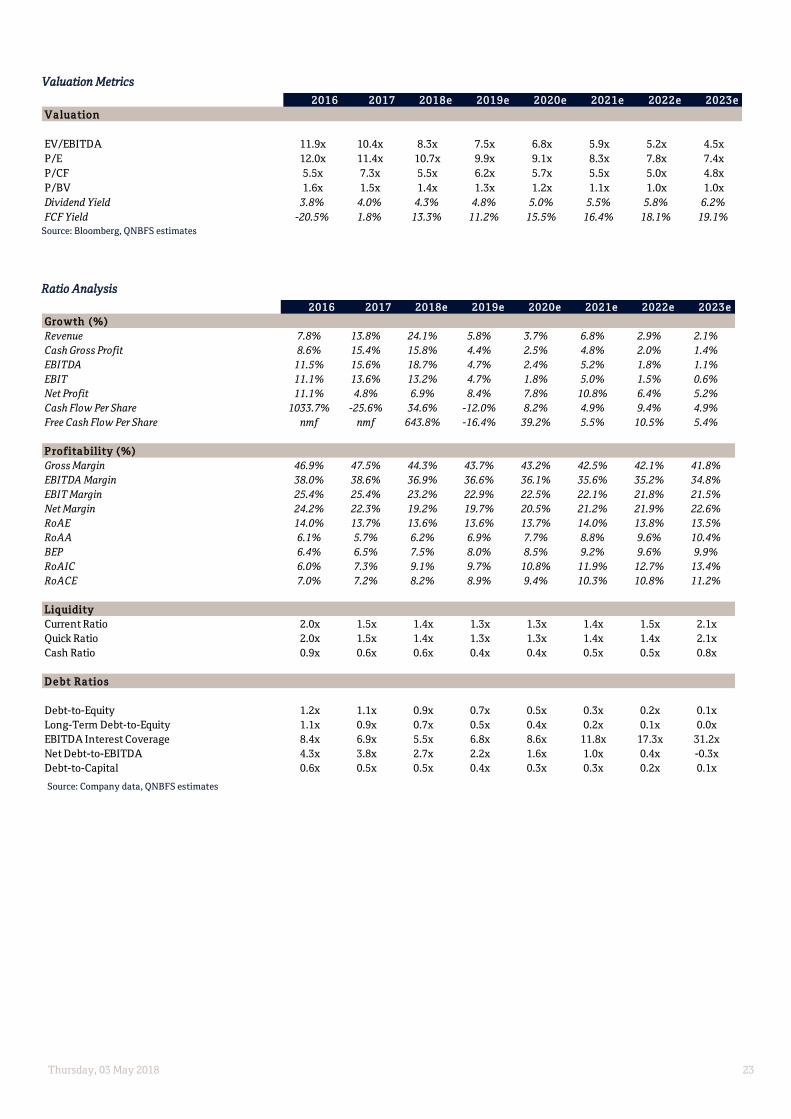
Valuation Metrics
Source: Bloomberg, QNBFS estimates
Ratio Analysis
Source: Company data, QNBFS estimates
2016 2017 2018e 2019e 2020e 2021e 2022e 2023e
Valuation
EV/EBITDA 11.9x 10.4x 8.3x 7.5x 6.8x 5.9x 5.2x 4.5x
P/E 12.0x 11.4x 10.7x 9.9x 9.1x 8.3x 7.8x 7.4x
P/CF 5.5x 7.3x 5.5x 6.2x 5.7x 5.5x 5.0x 4.8x
P/BV 1.6x 1.5x 1.4x 1.3x 1.2x 1.1x 1.0x 1.0x
Dividend Yield 3.8% 4.0% 4.3% 4.8% 5.0% 5.5% 5.8% 6.2%
FCF Yield -20.5% 1.8% 13.3% 11.2% 15.5% 16.4% 18.1% 19.1%
2016 2017 2018e 2019e 2020e 2021e 2022e 2023e
Growth (%)
Revenue 7.8% 13.8% 24.1% 5.8% 3.7% 6.8% 2.9% 2.1%
Cash Gross Profit 8.6% 15.4% 15.8% 4.4% 2.5% 4.8% 2.0% 1.4%
EBITDA 11.5% 15.6% 18.7% 4.7% 2.4% 5.2% 1.8% 1.1%
EBIT 11.1% 13.6% 13.2% 4.7% 1.8% 5.0% 1.5% 0.6%
Net Profit 11.1% 4.8% 6.9% 8.4% 7.8% 10.8% 6.4% 5.2%
Cash Flow Per Share 1033.7% -25.6% 34.6% -12.0% 8.2% 4.9% 9.4% 4.9%
Free Cash Flow Per Share nmf nmf 643.8% -16.4% 39.2% 5.5% 10.5% 5.4%
P rofitability (%)
Gross Margin 46.9% 47.5% 44.3% 43.7% 43.2% 42.5% 42.1% 41.8%
EBITDA Margin 38.0% 38.6% 36.9% 36.6% 36.1% 35.6% 35.2% 34.8%
EBIT Margin 25.4% 25.4% 23.2% 22.9% 22.5% 22.1% 21.8% 21.5%
Net Margin 24.2% 22.3% 19.2% 19.7% 20.5% 21.2% 21.9% 22.6%
RoAE 14.0% 13.7% 13.6% 13.6% 13.7% 14.0% 13.8% 13.5%
RoAA 6.1% 5.7% 6.2% 6.9% 7.7% 8.8% 9.6% 10.4%
BEP 6.4% 6.5% 7.5% 8.0% 8.5% 9.2% 9.6% 9.9%
RoAIC 6.0% 7.3% 9.1% 9.7% 10.8% 11.9% 12.7% 13.4%
RoACE 7.0% 7.2% 8.2% 8.9% 9.4% 10.3% 10.8% 11.2%
Liquidity
Current Ratio 2.0x 1.5x 1.4x 1.3x 1.3x 1.4x 1.5x 2.1x
Quick Ratio 2.0x 1.5x 1.4x 1.3x 1.3x 1.4x 1.4x 2.1x
Cash Ratio 0.9x 0.6x 0.6x 0.4x 0.4x 0.5x 0.5x 0.8x
D e bt Ratios
Debt-to-Equity 1.2x 1.1x 0.9x 0.7x 0.5x 0.3x 0.2x 0.1x
Long-Term Debt-to-Equity 1.1x 0.9x 0.7x 0.5x 0.4x 0.2x 0.1x 0.0x
EBITDA Interest Coverage 8.4x 6.9x 5.5x 6.8x 8.6x 11.8x 17.3x 31.2x
Net Debt-to-EBITDA 4.3x 3.8x 2.7x 2.2x 1.6x 1.0x 0.4x -0.3x
Debt-to-Capital 0.6x 0.5x 0.5x 0.4x 0.3x 0.3x 0.2x 0.1x

Thursday, 03 May 2018 24
Detailed Financial Statements Income Statement (In QR mn) FY2017 FY2018e FY2019e FY2020e FY2021e FY2022e
Revenue 967 1,200 1,270 1,316 1,406 1,447
YoY Growth 14% 24% 6% 4% 7% 3%
Direct Costs (507) (668) (714) (747) (809) (838)
Gross Profit 459 532 555 569 597 609
Gross Margin 48% 44% 44% 43% 42% 42%
General and Administrative Expenses (86) (89) (91) (94) (97) (100)
EBITDA 373 443 464 475 500 509
YoY Growth 16% 19% 5% 2% 5% 2%
EBITDA Margin 39% 37% 37% 36% 36% 35%
Depreciation and Amortization (128) (166) (173) (179) (189) (194)
EBIT 246 278 291 296 311 316
YoY Growth 14% 13% 5% 2% 5% 1%
EBIT Margin 25% 23% 23% 23% 22% 22%
Net Finance Costs and Other Income (30) (48) (41) (27) (13) 2
Net Income to Equity 215 230 250 269 298 317
YoY Growth 5% 7% 8% 8% 11% 6%
Net Margin 22% 19% 20% 20% 21% 22%
EPS (QR) 3.68 3.93 4.26 4.59 5.09 5.41
DPS (QR) 1.70 1.80 2.00 2.10 2.30 2.45
Payout Ratio 46% 46% 47% 46% 45% 45%
Source: Company data, QNBFS estimates
Balance Sheet (In QR mn) FY2017 FY2018e FY2019e FY2020e FY2021e FY2022e
Non-Current Assets
PP&E and Projects in Progress 2,729 2,694 2,651 2,527 2,394 2,255
Investment Properties 37 38 38 38 39 39
Intangible Assets 119 112 104 97 90 82
Total Non-Current Assets 2,886 2,843 2,793 2,663 2,522 2,376
Current Assets
Inventories 11 13 14 15 16 16
Trade and Other Receivables 525 460 487 503 538 553
Bank Balances and Cash 352 365 264 259 270 310
Total Current Assets 888 839 765 777 823 880
Total Assets 3,774 3,682 3,559 3,440 3,345 3,257
Equity & Liabilities
Total Shareholders' Equity 1,636 1,761 1,898 2,044 2,211 2,386
Non-Controlling interests (4) (4) (4) (4) (4) (4)
Non-Current Liabilities
Loans and Borrowings 1,525 1,301 1,031 761 492 222
Employee Benefits 31 35 40 44 48 53
Total Non-Current Liabilities 1,556 1,337 1,071 806 540 275
Current Liabilities
Trade Payables 53 66 68 69 71 71
Loans and Borrowings 261 270 270 270 270 270
Accruals, Provisions & Other Payables 203 253 254 255 256 259
Retention Payable 68 - - - - -
Total Current Liabilities 585 588 593 594 597 600
Total Liabilities 2,142 1,925 1,664 1,400 1,137 874
Total Equity & Liabilities 3,774 3,682 3,559 3,440 3,345 3,257
Source: Company data, QNBFS estimates

Thursday, 03 May 2018 25
Industries Qatar (IQCD)
Steel Segment Strength Boosts 1Q2018; MSCI/FTSE in Focus IQCD reported a strong set of numbers buoyed by revenue/margin expansion in steel; stock could see
further upside given impending MSCI/FTSE weight increases. IQCD shares have jumped 20% from mid-
March driven by expectation of near-doubling of its FOL and the resultant $200mn or so in flows from
passive trackers. We expect some remaining upside as implementation days approach (May 31/June 14
for MSCI/FTSE). Such gains could, however, be short-lived as they have historically and we maintain
our 12-month price target of QR109 for now. While 1Q2018 numbers beat expectations, 2Q could be
more challenging especially in the steel segment. We will adjust our model after 1H2018 results.
Highlights Driven by outperformance in steel, IQCD's bottom line rises 32% QoQ in 1Q2018, exceeding
our estimate. Earnings were up 37% YoY to QR1.27bn in 1Q2018, exceeding our forecast of
QR1.15bn (variation of +10%). For more details, please see page 2.
Steel revenue bests our forecast with strong GMs. IQCD’s revenue (representing its 100%-
owned steel segment) came in at QR1.38bn in 1Q2018, which represents a decrease of 5%
QoQ; steel revenue exceeded our forecast of QR1.24bn. On a YoY basis revenue rose 24%.
Majority of the earnings beat was due to better-than-expected GMs at the wholly-owned steel
segment – cash GMs expanded to 28.2% from 19.3% in 4Q2017 (28.0% in 1Q2017) vs. our
estimate of 23%. According to the company, sales improved due to changes in geographical
mix; steel prices increased significantly QoQ and YoY due to an increase in iron ore costs and
short supply of electrodes, which are consumables. We note that during the quarter, IQCD
signed an offtake agreement with Muntajat for its steel products.
Income from JVs (that represent IQCD’s 75% stake in QAFCO, 80% share in QAPCO and 50%
ownership of QAFAC) came in-line with our estimates. According to IQCD, PE sales benefited
from higher volumes given lack of extended unplanned shutdowns faced during 1Q2017. PE
prices have improved and began stabilizing while fuel additive prices have increased
significantly YoY as crude continues its march higher. Moreover, fertilizer prices as well have
shown a modest rise driven by tightening of supplies, and a general recovery in demand.
Balance sheet remains strong (group debt of QR0.4bn vs. cash of QR8.8bn). Capex needs
remain minimal. Strategic deployment of this cash remains a key question.
No estimate changes; 2Q2018 earnings could fall sequentially especially due to the steel
segment. While our QR3.9bn 2018 earnings estimate appears conservative in light of 1Q
results, we maintain our estimates for now. For 2Q2018, we note: (1) 1Q2018 strength in steel
pricing was driven by shortage of electrodes and increase in iron ore prices, which have
largely reversed. Moreover, summer/Ramadan remains a seasonally soft period for
construction and some large projects in Qatar are coming to a close. We note Qatar Steel
supplies almost all domestic demand. (2) Fertilizers should see stable performance given
higher QoQ volumes and price stability. Medium-term, expected lower Chinese exports as
smaller inefficient plants are shut down bodes well for urea price realizations. (3) PE should
see largely flattish volumes, while prices could continue to strengthen QoQ as oil goes up.
Strong FCF generation support dividends despite high payout ratio vs. historicals. IQCD’s FCF
(OCF + Cash dividends from JVs-steel capex), should come in at QR3.5bn in 2018 and should
average QR4.5bn over 2017 to 2026 with an average dividend cover of 1.3x. We forecast a DPS
of QR5 for 2018, which is flat and could see upside. However, payouts will remain high at an
average of around ~71% over 2018 to 2026 (91% payout in 2017).
Catalysts FOL increase from 25% to 49% acts a near-term catalyst driven by MSCI & FTSE inflows.
However, these gains could prove to be short-lived as they have been historically once
implementation days approach (May 31/June 14 for MSCI/FTSE).
Recommendation, Valuation and Risks Recommendation & valuation: We rate IQCD a Market Perform with a PT of QR109. IQCD is
fully valued-to-expensive @ 17.3x and 15.8x P/E for 2018 and 2019, respectively.
Risks: Weakness in oil prices remain a substantial risk to equity prices and have a direct
detrimental impact on IQCD’s operations. Geopolitical risks remain and cannot be modeled.
Key Financial Data and Estimates
FY2016 FY2017 FY2018e FY2019e
Group Revenue (QR mn) 13,800 14,300 14,773 15,050
EPS (QR) 4.88 5.48 6.46 7.07
DPS (QR) 4.00 5.00 5.00 5.25
RoE (%) 8.8 9.7 11.2 11.8
P/E (x) 22.9 20.4 17.3 15.8
EV/EBITDA (x) 19.2 17.3 14.8 13.6
Dividend Yield % 3.6 4.5 4.5 4.7
2,838 2,904 2,960 3,005 Source: Company data, QNBFS estimates; Note: All data based on current number of shares
Key Data
Source: Bloomberg (as of May 1, 2018), *Qatar Exchange
(as of May 1, 2018); Note: FO is foreign ownership
Relative Price Performance vs. Market Indices
Historical P/E Trends vs. Share Price
Source: Bloomberg, QNBFS Research
Saugata Sarkar, CFA, CAIA
+974 4476 6534
Recommendation MARKET PERFORM Risk Rating R-3
Share Price QR112.00 Target Price QR109.00
Implied Upside (2.7%)
Current Market Price (QR) 112.00
Dividend Yield (%) 4.5
Bloomberg Ticker IQCD QD EQUITY
Reuters Ticker IQCD.QA
ISIN QA000A0KD6K3
Sector Industrials
52wk High/52wk Low (QR) 115.00 / 85.00
3-m Average Volume (‘000) 188.8
Mkt. Cap. ($ bn/QR bn) 18.6 / 67.8
Shares Outstanding (mn) 605.0
FO Limit* (%) 49.0
Current FO* (%) 6.8
1-Year Total Return (%) 13.6
Fiscal Year End December 31
-
1.0
2.0
3.0
4.0
5.0
6.0
7.0
8.0
-
20
40
60
80
100
120
140
160
180
Tho
usa
nd
s
IQCD Volume IQCD DSM
-
50
100
150
200
250
0.0x
10.0x
20.0x
30.0x
40.0x
50.0x
60.0x
70.0x
80.0x
90.0x
100.0x
IQCD IQCD P/E IQCD P/E LT Avg. +/- 2 Std. Dev.

Thursday, 03 May 2018 26
11Q2018 Review
Driven by outperformance in steel, IQCD's bottom line rises 32% QoQ in 1Q2018, exceeding our estimate. Earnings were up 37%
YoY to QR1.27bn in 1Q2018, exceeding our forecast of QR1.15bn (variation of +10%).
Steel revenue bests our forecast with strong GMs. IQCD’s revenue (representing its 100%-owned steel segment) came in at
QR1.38bn in 1Q2018, which represents a decrease of 5% QoQ; steel revenue exceeded our forecast of QR1.24bn. On a YoY basis
revenue rose 24%. Majority of the earnings beat was due to better-than-expected GMs at the wholly-owned steel segment – cash
GMs expanded to 28.2% from 19.3% in 4Q2017 (28.0% in 1Q2017) vs. our estimate of 23%. According to the company, sales
improved due to changes in geographical mix; steel prices increased significantly QoQ and YoY due to an increase in iron ore costs
and short supply of electrodes, which are consumables. We note that during the quarter, IQCD signed an offtake agreement with
Muntajat for its steel products.
Income from JVs (that represent IQCD’s 75% stake in QAFCO, 80% share in QAPCO and 50% ownership of QAFAC) came in-line
with our estimates. According to IQCD, PE sales benefited from higher volumes given lack of extended unplanned shutdowns faced
during 1Q2017. PE prices have improved and began stabilizing while fuel additive prices have increased significantly YoY as crude
continues its march higher. Moreover, fertilizer prices as well have shown a modest rise driven by tightening of supplies, and a
general recovery in demand.
11Q2018 Actual Vs. Estimates and Comparisons
Source: Company data, QNBFS estimates
In QR m n 1Q2018 1Q2018e 4Q2017 1Q2017 A vs. E QoQ YoY 2018e 2017 YoY 2016 YoY
Revenue 1,377.8 1,236.4 1,454.6 1,107.3 11% -5% 24% 4,859.9 4,628.5 5% 4,674.3 -1%
Gross Profit 388.2 284.4 281.3 310.4 37% 38% 25% 1,069.2 935.0 14% 1,370.3 -32%
EBITDA 335.1 222.6 213.7 214.3 51% 57% 56% 767.8 678.0 13% 1,101.0 -38%
EBIT 276.1 164.4 155.8 158.8 68% 77% 74% 542.3 452.5 20% 875.7 -48%
Share of Results of JVs 858.7 856.9 818.5 642.5 0% 5% 34% 2,999.5 2,606.6 15% 1,716.3 52%
Profit for Equity Holders 1,267.9 1,149.9 957.7 927.9 10% 32% 37% 3,905.9 3,315.4 18% 2,955.0 12%
DPS 5.00 5.00 0% 4.00 25%
Group EBITDA (IQ) 1,327.7 1,210.1 1,058.4 986.0 10% 25% 35% 4,134.8 3,652.1 13% 3,193.5 14%
Group EBIT (IQ) 1,268.7 1,152.0 1,000.5 930.6 10% 27% 36% 3,909.3 3,426.7 14% 2,968.1 15%
Gross Margin 28.2% 23.0% 19.3% 28.0% 22.0% 20.2% 29.3%
EBITDA Margin 24.3% 18.0% 14.7% 19.4% 15.8% 14.6% 23.6%
EBIT Margin 20.0% 13.3% 10.7% 14.3% 11.2% 9.8% 18.7%

Thursday, 03 May 2018 27
Comparative Multiples
Fe rti l ize rs Di v.
Company Ticke r Yi el d FY 2018e FY 2019e FY 2018e FY 2019e FY 2018e FY 2019e FY 2018e FY 2019e
Saudi Arabian Fertilizer Co SAFCO 2.7% 20.7x 18.9x 16.1x 14.6x 15.2x 13.7x 4.2% NA
Yara International ASA YAR 3.0% 17.1x 11.7x 8.7x 7.1x 1.1x 0.9x (0.1%) 0.1%
Mosaic Co/The MOS 1.3% 18.7x 15.2x 8.2x 7.2x 8.2x 7.4x 3.5% 5.4%
Ave rage 2.3% 18.8x 13.5x 11.0x 8.7x 8.2x 4.1x 2.5% N A
Me dian 2.7% 18.7x 15.2x 8.7x 7.2x 8.2x 7.4x 3.5% N A
I ndustrie s Qatar QS C I QCD 4.5% 17.3x 15.8x 17.4x 15.9x 14.8x 13.6x 5.6% 6.1%
Note: Where coverage is not available, estimates are based on Bloomberg consensus, if available
Mean/Median calculated if more than 2 observations are present
NA: Not Applicable
nmf: Not Meaningful (typically refers to negative or exceedingly large values)
Source: Bloomberg, QNBFS Research
Pe troche micals Di v.
Company Ticke r Yi el d FY 2018e FY 2019e FY 2018e FY 2019e FY 2018e FY 2019e FY 2018e FY 2019e
Yanbu National Petrochemical Co YANSAB 4.7% 14.0x 14.4x 9.6x 12.5x 9.1x 9.4x 8.6% 8.7%
Saudi Kayan Petrochemical Co KAYAN NA 15.4x 13.3x 7.4x 6.1x 8.6x 8.3x 0.1% 0.3%
Saudi Basic Industries Corp SABIC 3.7% 15.7x 14.8x 7.9x 9.8x 8.1x 7.7x 7.9% 8.3%
Rabigh Refining & Petrochemical Co PETROR 1.8% 16.6x 12.4x 4.9x 4.4x 13.8x 10.9x 11.4% 14.2%
Saudi International Petrochemical Co SIPCHEM 2.4% 12.9x 13.0x 4.8x 4.5x 7.7x 7.4x NA NA
Ave rage 3.1% 14.9x 14.5x 6.9x 9.5x 9.5x 8.1x 7.0% 8.1%
Me dian 3.0% 15.4x 13.3x 7.4x 6.1x 8.6x 8.3x 8.2% 8.5%
I ndustrie s Qatar QS C I QCD 4.5% 17.3x 15.8x 17.4x 15.9x 14.8x 13.6x 5.6% 6.1%
Note: Where coverage is not available, estimates are based on Bloomberg consensus, if available
Mean/Median calculated if more than 2 observations are present
NA: Not Applicable
nmf: Not Meaningful (typically refers to negative or exceedingly large values)
Source: Bloomberg, QNBFS Research
S te e l Di v.
Company Ticke r Yi el d FY 2018e FY 2019e FY 2018e FY 2019e FY 2018e FY 2019e FY 2018e FY 2019e
ArcelorMittal MT NA 8.7x 9.0x 5.0x 4.8x 5.1x 5.2x 8.9% 10.5%
thyssenkrupp AG TKA 0.7% 13.7x 11.3x 7.0x 6.5x 5.8x 5.5x 3.1% 4.8%
Nucor Corp NUE 2.4% 10.3x 11.0x 7.6x 7.3x 6.6x 7.1x 6.8% 9.9%
United States Steel Corp X 0.6% 6.3x 6.1x 4.8x 4.0x 4.1x 4.1x 5.0% 11.6%
JFE Holdings Inc 5411 3.5% 11.1x 7.9x 4.7x 4.6x 6.5x 6.3x 4.5% 7.5%
Steel Authority of India Ltd SAIL NA 26.0x 12.5x 9.4x 7.4x 9.8x 7.4x 2.4% 11.8%
JSW Steel Ltd JSTL 0.7% 12.4x 12.9x 8.4x 8.0x 7.8x 7.2x 4.0% 5.0%
Ave rage 1.6% 12.6x 10.1x 6.7x 6.0x 6.5x 6.7x 5.0% 7.3%
Me dian 0.7% 11.1x 11.0x 7.0x 6.5x 6.5x 6.3x 4.5% 9.9%
I ndustrie s Qatar QS C I QCD 4.5% 17.3x 15.8x 17.4x 15.9x 14.8x 13.6x 5.6% 6.1%
Note: Where coverage is not available, estimates are based on Bloomberg consensus, if available
Mean/Median calculated if more than 2 observations are present
NA: Not Applicable
nmf: Not Meaningful (typically refers to negative or exceedingly large values)
Source: Bloomberg, QNBFS Research
P/CFPS EV /EBI TDA FCF Y ie ldP/E
P/E P/CFPS EV /EBI TDA FCF Y ie ld
P/E P/CFPS EV /EBI TDA FCF Y ie ld
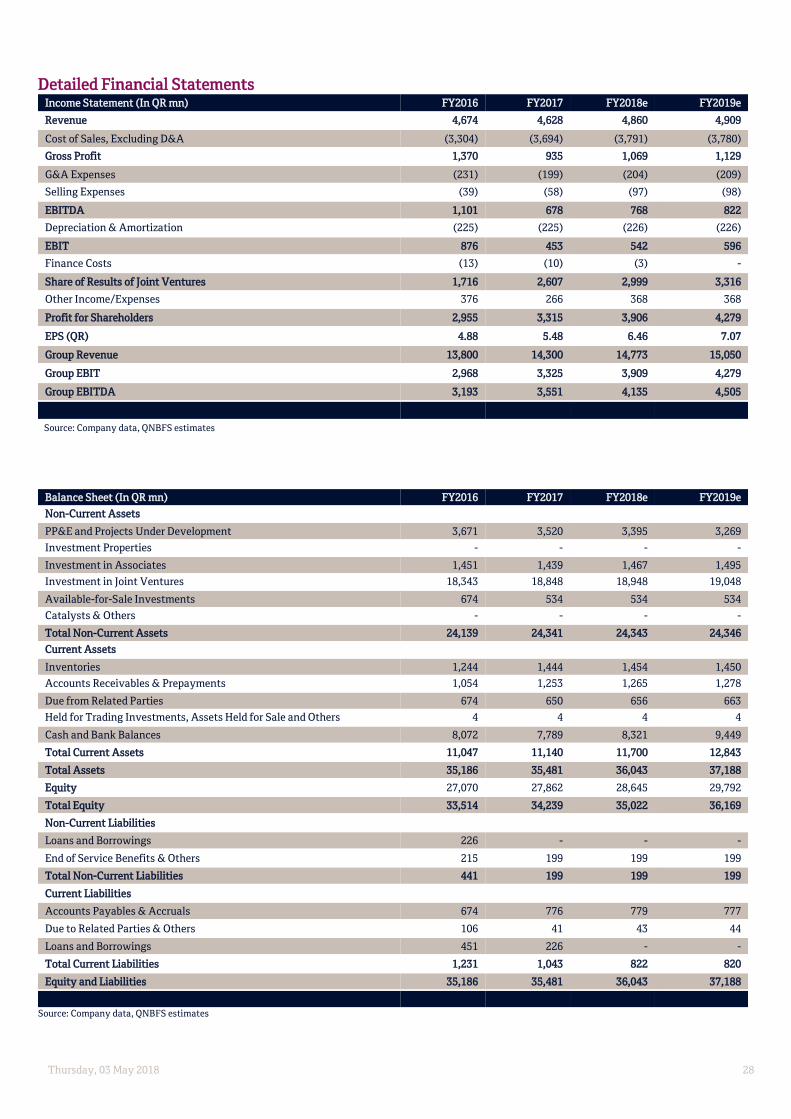
Thursday, 03 May 2018 28
Detailed Financial Statements Income Statement (In QR mn) FY2016 FY2017 FY2018e FY2019e
Revenue 4,674 4,628 4,860 4,909
Cost of Sales, Excluding D&A (3,304) (3,694) (3,791) (3,780)
Gross Profit 1,370 935 1,069 1,129
G&A Expenses (231) (199) (204) (209)
Selling Expenses (39) (58) (97) (98)
EBITDA 1,101 678 768 822
Depreciation & Amortization (225) (225) (226) (226)
EBIT 876 453 542 596
Finance Costs (13) (10) (3) -
Share of Results of Joint Ventures 1,716 2,607 2,999 3,316
Other Income/Expenses 376 266 368 368
Profit for Shareholders 2,955 3,315 3,906 4,279
EPS (QR) 4.88 5.48 6.46 7.07
Group Revenue 13,800 14,300 14,773 15,050
Group EBIT 2,968 3,325 3,909 4,279
Group EBITDA 3,193 3,551 4,135 4,505
Source: Company data, QNBFS estimates
Balance Sheet (In QR mn) FY2016 FY2017 FY2018e FY2019e
Non-Current Assets
PP&E and Projects Under Development 3,671 3,520 3,395 3,269
Investment Properties - - - -
Investment in Associates 1,451 1,439 1,467 1,495
Investment in Joint Ventures 18,343 18,848 18,948 19,048
Available-for-Sale Investments 674 534 534 534
Catalysts & Others - - - -
Total Non-Current Assets 24,139 24,341 24,343 24,346
Current Assets
Inventories 1,244 1,444 1,454 1,450
Accounts Receivables & Prepayments 1,054 1,253 1,265 1,278
Due from Related Parties 674 650 656 663
Held for Trading Investments, Assets Held for Sale and Others 4 4 4 4
Cash and Bank Balances 8,072 7,789 8,321 9,449
Total Current Assets 11,047 11,140 11,700 12,843
Total Assets 35,186 35,481 36,043 37,188
Equity 27,070 27,862 28,645 29,792
Total Equity 33,514 34,239 35,022 36,169
Non-Current Liabilities
Loans and Borrowings 226 - - -
End of Service Benefits & Others 215 199 199 199
Total Non-Current Liabilities 441 199 199 199
Current Liabilities
Accounts Payables & Accruals 674 776 779 777
Due to Related Parties & Others 106 41 43 44
Loans and Borrowings 451 226 - -
Total Current Liabilities 1,231 1,043 822 820
Equity and Liabilities 35,186 35,481 36,043 37,188
Source: Company data, QNBFS estimates

Thursday, 03 May 2018 29
Masraf Al Rayan (MARK)
Valuations Remain Rich; Spreads Continued to Contract Masraf Al Rayan (MARK) is the second largest Shari’ah compliant bank among listed banks.
It is currently in negotiations (due diligence process is over) with Barwa Bank and
International Bank of Qatar (IBQ) regarding the pricing of the three-way merger.
Incorporated in 2006, MARK is focused on the public sector, which dominates its loan
portfolio. Public sector loans grew by a CAGR (2010-2017) of 22% and represents 56%
(December 2017) of MARK’s loan portfolio. Notably, MARK has the best asset quality among
Qatari banks with a NPL ratio of 0.50%, one of the highest RoEs of ~16% and robust
capitalization at 18%.
Highlights
MARK’s 1Q2018 bottom-line increased due to a sharp drop in provisions &
impairments. MARK reported net income of QR531.1mn (in-line with our estimate
QR517.7mn; +2.6% variation), increasing by 13.3% QoQ (+4.1% YoY). The growth
was due to a sharp drop in provisions & impairments where the bank booked
QR16.5mn vs. 115.8mn in 4Q2017. On the other hand total revenue receded by
1.2% QoQ (+9.1% YoY) to QR713.8mn due to a drop in investment income and fees
while net interest income exhibited flattish performance. On a YoY basis, figures
were generally positive across the board with net operating income growing by
7.7%. However, provisions vs. net reversals in 1Q2017 limited earnings growth to
4.1%.
Margins remained under pressure. Net interest margin decreased by 10bps QoQ (-
9bps YoY) to 2.34%. Tightening of the NIM was led by a rise in cost of funds
exceeding the increase in yield on assets. Cost of funds increased by 30bps QoQ to
2.56% (+50bps YoY), whereas yield on assets increased by only 16bps to 4.47%
(+38bps YoY). The drop in margins is in-line with our expectations.
Asset quality risks still remain negligible, IFRS 9 impact not material. NPL ratio
remained unchanged at 0.50% while absolute NPLs remained stable at QR386mn.
Coverage ratio of stage 3 loans (impaired or non-performing) remained unchanged
at 44% vs. 43% at the end of 2017. MARK’s stage one loans (credit risk has not
increased significantly since initial recognition) represent 93.4% of total loans
while stage two loans (past due but not impaired; credit risk has increased
significantly since initial recognition) represent 6.1%.
Net Loans and deposits experienced flat performance YTD. Net loans came in
QR72.3bn vs. QR72.1bn in FY2017, while deposits moved to QR62.7bn vs.
QR62.5bn at the end of 2017. Thus, MARK’s LDR remained elevated and
unchanged at 115%. We are still of the opinion that the bank may increase its
borrowings in order to enhance its liquidity profile/lower LDR.
Catalysts
News flow about the upcoming merger could act as a catalyst.
Recommendation, Valuation and Risks
Recommendation and valuation: We maintain our Price Target of QR34 and Market
Perform recommendation. MARK is trading at P/B and P/E of 1.9x and 12.4x on our
2018 estimates, respectively. The market is pricing a fundamental P/B (1.9x) and a
sustainable RoE (17.9%) vs. our estimates (P/B: 1.9x & RoE: 17.0%). The name
trades at a PEG of 1.6x based on 7.8% CAGR (2017-23e)
Risks: 1) Geopolitical factors, 2) More than expected increase in credit costs and 3)
losing market share in the government segment.
Key Financial Data and Estimates
Source: Company data, QNBFS Research; Note: All data based on current number of shares
Key Data
Source: Bloomberg (as of May 1, 2018), *Qatar Exchange (as
of May 1, 2018); Note: FO is foreign ownership
Relative Price Performance vs. Market Indices
Historical P/E Trends vs. Share Price
Source: Bloomberg, QNBFS Research
.
Shahan Keushgerian
+974 4476 6509
Saugata Sarkar, CFA, CAIA
+974 4476 6534
Recommendation MARKET PERFORM Risk Rating R-3
Share Price QR35.00 Target Price QR34.00
Implied Upside (2.9%)
(In QR m n ) 2017 2018e 2019e 2020e
EPS (QR) 2.70 2.82 3.25 3.48
EPS Growth (%) -2.3 4.1 15.5 6.9
P/E (x) 12.9 12.4 10.8 10.1
Tangible BVPS (QR) 17.6 18.2 19.4 0.0
P/TBV (x) 2.0 1.9 1.8 1.7
DPS (QR) 2.00 2.00 2.25 2.50
Dividend Yield (%) 5.7 5.7 6.4 7.1
Current Market Price (QR) 35.00
Dividend Yield (%) 5.7
Bloomberg Ticker MARK QD EQUITY
Reuters Ticker MARK.QA
ISIN QA000A0M8VM3
Sector Banks & Financial Services
52wk High/52wk Low (QR) 45.40 / 33.32
3-m Average Volume (‘000) 429.7
Mkt. Cap. ($ bn/QR bn) 7.2 / 26.3
Shares Outstanding (mn) 750.0
FO Limit* (%) 49.0
Current FO* (%) 17.9
1-Year Total Return (%) (11.9)
Fiscal Year End December 31
-
5.0
10.0
15.0
20.0
25.0
30.0
35.0
40.0
-
50
100
150
200
250
300
Tho
usa
nd
s
MARK Volume MARK DSM
-
10
20
30
40
50
60
70
0.0x
5.0x
10.0x
15.0x
20.0x
25.0x
30.0x
MARK MARK P/E MARK P/E LT Avg. +/- 2 Std. Dev.

Thursday, 03 May 2018 30
Detailed Financial Statements
Ratios FY2017 FY2018e FY2019e FY2020e
Profitability (%)
RoAE (Attributable) 15.9 15.3 16.8 17.0
RoAA (Attributable) 2.1 1.9 2.1 2.1
RoRWA (Attributable) 3.4 3.2 3.4 3.1
NIM (% of IEAs) 2.43 2.39 2.50 2.51
NIM (% of RWAs) 3.58 3.75 3.79 3.60
NIM (% of AAs) 2.27 2.27 2.38 2.39
Spread 2.0 2.0 2.0 2.0
Efficiency (%)
Cost-to-Income (Headline) 21.1 21.8 21.5 21.2
Cost-to-Income (Core) 21.9 22.2 22.0 21.8
Liquidity (%)
LDR 113.7 114.7 112.0 109.0
Loans/Assets 68.3 70.1 72.1 72.6
Cash & Interbank Loans-to-Total Assets 6.7 6.1 6.1 6.8
Deposits to Assets 60.1 61.1 64.4 66.7
Wholesale Funding to Loans 36.4 34.5 29.0 26.5
IEAs to IBLs 124.3 119.3 116.6 116.3
Asset Quality (%)
NPL Ratio 0.14 0.56 0.80 1.00
NPLs to Shareholder's Equity 0.77 3.37 4.92 6.50
NPLs to Tier 1 Capital 0.91 3.95 5.79 7.70
Coverage Ratio 50.5 66.0 54.1 55.5
ALL/Average Loans 0.1 0.9 0.9 1.0
Cost of Risk 0.00 0.18 0.10 0.18
Capitalization (%)
Tier 1 Ratio 18.2 17.6 16.7 14.9
CAR 18.2 17.6 16.7 14.9
Tier 1 Capital to Assets 11.1 10.8 10.7 10.1
Tier 1 Capital to Loans 16.2 15.4 14.8 14.0
Tier 1 Capital to Deposits 18.5 17.6 16.6 15.2
Leverage (x) 7.6 7.9 7.9 8.3
Growth (%)
Net Interest Income 14.0 6.3 10.9 9.2
Non-Interest Income -0.2 6.7 12.8 11.9
OPEX 23.5 10.1 9.3 8.5
Net Operating Income 8.0 5.3 11.7 10.0
Net Income (Attributable) 2.2 4.1 15.5 6.9
Loans 2.4 5.6 9.4 11.9
Deposits 5.0 6.2 12.0 15.0
Assets 10.8 5.5 6.3 11.2
RWAs 2.4 7.7 11.7 17.7
Source: Company data, QNBFS Research
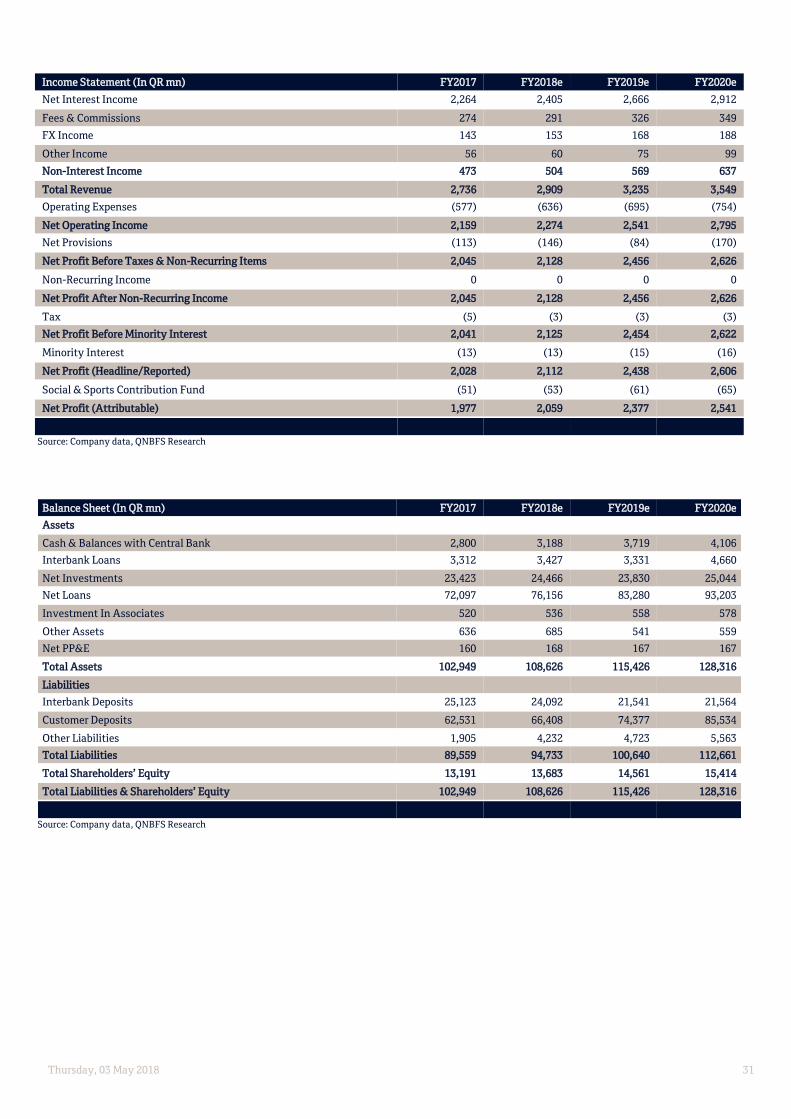
Thursday, 03 May 2018 31
Income Statement (In QR mn) FY2017 FY2018e FY2019e FY2020e
Net Interest Income 2,264 2,405 2,666 2,912
Fees & Commissions 274 291 326 349
FX Income 143 153 168 188
Other Income 56 60 75 99
Non-Interest Income 473 504 569 637
Total Revenue 2,736 2,909 3,235 3,549
Operating Expenses (577) (636) (695) (754)
Net Operating Income 2,159 2,274 2,541 2,795
Net Provisions (113) (146) (84) (170)
Net Profit Before Taxes & Non-Recurring Items 2,045 2,128 2,456 2,626
Non-Recurring Income 0 0 0 0
Net Profit After Non-Recurring Income 2,045 2,128 2,456 2,626
Tax (5) (3) (3) (3)
Net Profit Before Minority Interest 2,041 2,125 2,454 2,622
Minority Interest (13) (13) (15) (16)
Net Profit (Headline/Reported) 2,028 2,112 2,438 2,606
Social & Sports Contribution Fund (51) (53) (61) (65)
Net Profit (Attributable) 1,977 2,059 2,377 2,541
Source: Company data, QNBFS Research
Balance Sheet (In QR mn) FY2017 FY2018e FY2019e FY2020e
Assets
Cash & Balances with Central Bank 2,800 3,188 3,719 4,106
Interbank Loans 3,312 3,427 3,331 4,660
Net Investments 23,423 24,466 23,830 25,044
Net Loans 72,097 76,156 83,280 93,203
Investment In Associates 520 536 558 578
Other Assets 636 685 541 559
Net PP&E 160 168 167 167
Total Assets 102,949 108,626 115,426 128,316
Liabilities
Interbank Deposits 25,123 24,092 21,541 21,564
Customer Deposits 62,531 66,408 74,377 85,534
Other Liabilities 1,905 4,232 4,723 5,563
Total Liabilities 89,559 94,733 100,640 112,661
Total Shareholders’ Equity 13,191 13,683 14,561 15,414
Total Liabilities & Shareholders’ Equity 102,949 108,626 115,426 128,316
Source: Company data, QNBFS Research

Thursday, 03 May 2018 32
Qatar Electricity & Water Company (QEWS)
1Q2018 Exceeds Expectations; Accumulate 1Q2018 beat reinforces our long-term view; maintain our target price of QR223. Quarterly results
exceeded our estimates both on the top-and bottom-lines along with margin expansion given
limited maintenance-related shutdowns vs. our model. We maintain our annual 2018 forecasts for
now but see upside to numbers if results trend higher. The mega Um Al Houl project also seems to
be getting ready for an October commissioning and should act as a catalyst for the stock. QEWS
stock is up 4% since our January 17th
upgrade vs. a 2% decline in the QSE Index and we reiterate
our bullish stance on the name. We maintain our Accumulate rating.
Highlights
QEWS reported net profit of QR394mn in 1Q2018 as compared to QR305mn in
4Q2017/QR350mn in 1Q2017, beating our estimate of QR351mn (variation of +12%). The
company’s reported revenue of QR660mn came in 9% stronger than our estimate,
contributing to the earnings beat. JV income at QR131mn was in-line with our estimate.
EBITDA margins expanded to 52.2% vs. 47.8% in 1Q2017/52.8% in 1Q2016. YoY
comparisons were aided by major maintenance at RLPC (QR30mn net income impact),
59% growth in dividend income and higher tariffs at a key project.
We like QEWS as a solid long-term play with a defensive business model. Essentially a
capacity provider, QEWS takes on insignificant demand/costs/funding risks holding
secure contracted assets with long-term (~25 years) fuel agreements/PWPAs and
committed funding. This also leads to visible cash flows and a stable operating profile.
The State of Qatar (through various entities) owns 60% of the company.
Market leader in Qatar with international expansion gathering steam. Essentially a
monopoly, QEWS owns stakes in all domestic IWPPs/IPPs/IWPs. Moreover, the
company has diversified internationally with close to 15% of its net income expected to
be driven by 60%-owned international JV (Nebras) in 2018. Nebras has operations in
Indonesia, Jordan and Oman and is actively seeking opportunities in MENA and SE Asia.
Solid growth profile with industry leading EBITDA margins and attractive dividend/FCF
yields. We expect EBITDA CAGR of ~2% over 2019-2023 and FCF to grow around 5%
over the same period driven by Facility D (Um Al Houl) and inflation-driven capacity
charge increases. Despite modeled compression, QEWS should maintain above-average
EBITDA margins (avg.: ~48%). We expect dividend yield to average 4.1% over 2018-2023
and FCF yield to average 7.4% over the same period (despite a dip in 2018 given an
expected $250mn equity infusion into the Facility D JV). ROEs remain healthy.
Catalysts
New opportunities currently not in our model: Besides Um Al Houl, our model does not
account for additional expansions domestically (like Facility E; a solar project called
Siraj, etc.) which will lead to LT upside. Beyond Paiton in Indonesia, we do not have color
on other Nebras projects, which could lead to growth relative to our model.
Recommendation, Valuation and Risks
Recommendation & valuation: Our 12-month target is QR223. Shares have generated
81% in total returns over five years, handily outpacing the DSM Index (28%), the MSCI
Qatar Index (15%) and the MSCI EM Index (29%).
Risks: Geopolitical risks cannot be modeled. Besides risks inherent in international
expansion, there is always a chance domestic projects get delayed or shelved. It is
possible Kahramaa renegotiates the terms of existing contracts; however, this is not an
imminent risk. Operational risks include availability of capacity below contracted levels,
which could lead to penalties.
Key Financial Data and Estimates
FY2017 FY2018e FY2019e FY2020e
Revenue (QR mn) 3,071 2,493 2,637 2,697
Revenue Growth (1.0%) (18.8%) 5.8% 2.2%
EPS (QR) 14.69 13.32 14.36 14.88
EPS Growth 4.8% (9.3%) 7.8% 3.6%
P/E (x) 13.9 15.3 14.2 13.7
DPS (QR) 7.75 7.75 8.00 8.25
Dividend Payout 52.7% 58.2% 55.7% 55.5%
ROE 18.0% 15.3% 15.3% 14.8%
Source: Company data, QNBFS estimates; Note: All data based on current number of shares
Key Data
Source: Bloomberg (as of May 1, 2018), *Qatar Exchange
(as of May 1, 2018); Note: FO is foreign ownership
Relative Price Performance vs. Market Indices
Historical P/E Trends vs. Share Price
Source: Bloomberg, QNBFS Research
Saugata Sarkar, CFA, CAIA
+974 4476 6534
Recommendation ACCUMULATE Risk Rating R-2
Share Price QR195.00 Target Price QR223.00
Implied Upside 14.4%
Current Market Price (QR) 195.00
Dividend Yield (%) 4.0
Bloomberg Ticker QEWS QD EQUITY
Reuters Ticker QEWC.QA
ISIN QA0006929812
Sector Industrials
52wk High/52wk Low (QR) 217.70 / 161.99
3-m Average Volume (‘000) 57.7
Mkt. Cap. ($ bn/QR bn) 5.9 / 21.5
Shares Outstanding (mn) 110.0
FO Limit* (%) 49.0
Current FO* (%) 11.3
1-Year Total Return (%) (2.4)
Fiscal Year End December 31
-
0.5
1.0
1.5
2.0
2.5
3.0
-
20
40
60
80
100
120
140
160
180
200
Tho
usa
nd
s
QEWS Volume QEWS DSM
-
50
100
150
200
250
300
0.0x
2.0x
4.0x
6.0x
8.0x
10.0x
12.0x
14.0x
16.0x
18.0x
20.0x
QEWS QEWS P/E QEWS P/E LT Avg. +/- 2 Std. Dev.

Thursday, 03 May 2018 33
Detailed Financial Statements Income Statement (In QR mn) FY2017 FY2018e FY2019e FY2020e
Revenue 3,071 2,493 2,637 2,697
Cost of Sales, Excluding Depreciation (1,312) (1,071) (1,140) (1,172)
Gross Profit 1,759 1,422 1,498 1,525
General & Administrative Expenses (210) (214) (219) (223)
EBITDA 1,549 1,207 1,279 1,302
Deferred Income 0 0 0 0
Depreciation & Amortization (453) (319) (323) (327)
EBIT 1,096 888 956 974
Finance Costs, Net (164) (157) (144) (132)
Dividend Income & Gain on Sale of AFS 95 95 79 90
Other & Miscellaneous Income/Expense & Share of Profits from JVs 613 663 713 729
Share of Associates 0 0 0 0
Profit Before Tax 1,639 1,489 1,604 1,662
Income Tax Expense 0 0 0 0
Profit After Tax (Continuing Operations) 1,639 1,489 1,604 1,662
Discontinued Operations
Minority Interest (23) (24) (24) (25)
Profit for Shareholders 1,616 1,465 1,579 1,637
EPS (QR) 14.69 13.32 14.36 14.88
Source: Company data, QNBFS Research
Balance Sheet (In QR mn) FY2017 FY2018e FY2019e FY2020e
Non-Current Assets
Property, Plant and Equipment 5,745 5,533 5,318 5,099
Available-for-Sale Investments 702 702 702 702
Finance Lease Receivables 1,249 1,141 1,043 954
JV Loans and Investments in JVs 3,136 4,246 4,526 4,709
Other Non-Current assets 330 322 314 306
Total Non-Current Assets 11,161 11,945 11,904 11,769
Current Assets
Finance Lease Receivables & Others 120 120 120 120
Inventories 231 232 240 241
Accounts Receivables & Prepayments 852 854 860 864
Cash and Short-Term Deposits 3,436 2,862 3,265 3,835
Total Current Assets 4,639 4,067 4,485 5,060
Total Assets 15,800 16,012 16,388 16,829
Equity
Equity to the Parent 8,982 9,595 10,321 11,078
Minority Interest 250 274 299 324
Total Equity 9,232 9,869 10,620 11,402
Non-Current Liabilities
Loans and Borrowings 4,442 3,998 3,598 3,238
Employees’ End of Service Benefits 74 92 111 129
Derivatives 27 27 27 27
Total Non-Current Liabilities 4,543 4,117 3,736 3,394
Current Liabilities
Accounts Payables & Others 585 587 593 594
Loans and Borrowings 1,424 1,424 1,424 1,424
Derivatives 15 15 15 15
Total Current Liabilities 2,025 2,026 2,033 2,034
Equity and Liabilities 15,800 16,012 16,388 16,829
Source: Company data, QNBFS Research

Thursday, 03 May 2018 34
Qatar Gas Transport Co./Nakilat (QGTS)
1Q2018 Exceeds Estimates; Maintain Outperform/QR21 TP We maintain our estimates on QGTS post better-than-expected 1Q2018 results. Stock price has been fairly
weak since mid-March as focus has shifted to several other QSE-listed names benefiting from the FOL upside
catalyst. Moreover, QGTS is running the risk of being removed from the MSCI EM Index with a decision
expected May 14. Nevertheless, we continue to favor Nakilat, #1 owner/operator of LNG vessels globally, as a
LT play geared to Qatari LNG’s dominance & anticipated growth in the LNG market. We believe the stock is
attractive at current levels and reiterate our rating.
Highlights QGTS' net profit declines 10% QoQ in 1Q2018, exceeding our estimate by 8%. Nakilat reported a
bottom-line figure of QR216mn in 1Q2018, which was above our forecast of QR201mn. On a YoY
basis, net profit rose 13.2%. Operating results were fairly in-line with our expectations with
modestly higher gross margins and lower D&A expenses contributing to the earnings beat. The QoQ
decline in earnings was primarily due to lower other income (which had QR65mn in realized gains on
investments in 4Q2017). Operating results were actually better sequentially with adjusted EBITDA
growing 4% QoQ. YoY results were positive, aided by higher gross profits and interest/dividend and
other income. (More details on Page 2).
Maintaining our modeled estimates which already include 2 additional conventional LNG vessels in
the Maran JV. We are comfortable with our 2018 forecasts for now. In early March, QGTS announced
it added two conventional LNG ships increasing its fleet from 13 to 15 in 40%-owned Maran JV. Our
estimates reflect these additional ships from March onward along with our estimates of resultant
increase in debt and finance charges (at the JV level).
QGTS is a vital part of Qatar’s LNG value chain and enjoys stable revenue/cash flow from LT (25
years/~15 years left) and fixed-rate time LNG charter contracts (take or pay) with Qatargas and its
affiliates. The availability-based take or pay contracts shields QGTS from end-demand volatility and
delays in charterers’ projects. 11 ships are on spot-to-medium-term charters; LPG is a spot business.
High leverage but debt is mostly secured by watertight charter agreements; we do not foresee any
challenges in debt servicing/repayments. QGTS has $5.7bn in debt on its books (2017 net debt-to-
EBITDA: 7.8x; 3.5x debt-to-equity/2.4x debt-to-equity excluding hedging reserve and another $3bn
in debt in JVs (2017: net debt-to-EBITDA of 7.6x and 2.5x debt-to-equity). However, out of this, only
$500mn is corporate debt with the rest being non-recourse project financing backed by charter
agreements of LNG vessels. A majority of this leverage will be amortized over the remaining life of
charters with last of this debt (in form of bonds) paid off by 2033. 54 of the 65 LNG ships are
chartered by Qatargas with charter payments to Nakilat mostly retaining higher priority than debt
service in the charterer’s cash waterfall. We see no major risk of default as ~QR2bn in interest plus
repayments per annum is met easily by OCF with no major refinancing expected until 2025 with
$2.7bn in bank facility balloon payments. Interestingly, while QGTS will repay all debt by 2033, LNG
ships will retain another 15 years of useful life (until 2048) and can be relevered for fleet growth, etc.
Stable profile with industry-leading EBITDA margins & attractive dividend/FCF yields. Charter
agreements result in stable revenue along with operating costs pass-through (a mixture of capped
and uncapped inflation rates) leading to flattish absolute EBITDA. Nakilat’s stable business profile is
highlighted by its industry-leading margins (average adjusted EBITDA margin of 78.4% over 2010-
2017 followed by 77.3% over 2018-2033). A significant majority of interest payments are locked at
fixed rates via swaps over the length of the charters/debt at around 5.6%. Locked in charter rates
with limited exposure to spot rates along with predictable and declining interest payments virtually
guarantees the residual stream for shareholders as dividends. We model dividend yield of 7.1% in
2018, growing to 18.9% by 2033 with FCF yield of 16.2% growing to 35.7% over the same period.
Catalysts The expansion of Qatar’s LNG output from 77 MTPA to 100 MTPA is a significant driver (potentially
another 30 conventional vessels). QGTS is also considering targeting the FSRU business. Vessels
have 40-years of life vs. maximum debt life of 25 years (last debt maturing 2033), creating
refinancing opportunities to increase fleet size. Medium-term, the shipyard business could improve.
Recommendation, Valuation and Risks Recommendation & valuation: Our 12-month target is QR21. QGTS trades at attractive multiples vs.
peers, while sporting much better EBITDA margins and FCF yields.
Risks: (1) Blockade is an overhang but business impact has been limited thus far. Shipping ultimately
remains the charterers’ concern and comprehensive insurance policies (including war insurance)
cover QGTS for political stress events under force majeure clauses for 36 months (plus 6 months in
many cases). Blockage of the Strait of Hormuz/Gulf of Suez is unlikely. Charterers will also bear any
costs of potential rerouting. (2) There is a risk existing LNG contracts get renegotiated as they are at
a premium to spot (for wholly-owned fleet and some JVs). We would not rule out potential contract
restructuring, with QGTS accepting slightly lower charter rates in return for increasing their lengths
from 25 to 35+ years. However, bargaining power rests with Qatargas and Nakilat may have no
choice but to accept significantly worse contract terms. The likelihood of this is low given
investment grade-rated bonds and contagion effects for other GRE-related bond issues.
Key Financial Data and Estimates FY2016 FY2017 FY2018e FY2019e
EPS (QR) 1.72 1.53 1.54 1.73
P/E (x) 8.5 9.6 9.6 8.5
DPS (QR) 1.00 1.00 1.05 1.10
Dividend Yield 6.8% 6.8% 7.1% 7.5%
Source: Company data, QNBFS estimates; Note: All data based on current number of shares
Key Data
Source: Bloomberg (as of May 1, 2018), *Qatar Exchange
(as of May 1, 2018); Note: FO is foreign ownership
Relative Price Performance vs. Market Indices
Historical P/E Trends vs. Share Price
Source: Bloomberg, QNBFS Research
Saugata Sarkar, CFA, CAIA
+974 4476 6534
Recommendation OUTPERFORM Risk Rating R-3
Share Price QR14.70 Target Price QR21.00
Implied Upside 42.9%Current Market Price (QR) 14.70
Dividend Yield (%) 7.1
Bloomberg Ticker QGTS QD EQUITY
Reuters Ticker QGTS.QA
ISIN QA000A0KD6L1
Sector Transport
52wk High/52wk Low (QR) 19.99 / 13.05
3-m Average Volume (‘000) 428.6
Mkt. Cap. ($ bn/QR bn) 2.2 / 8.1
Shares Outstanding (mn) 554.0
FO Limit* (%) 49.0
Current FO* (%) 17.2
1-Year Total Return (%) (20.8)
Fiscal Year End December 31
-
5.0
10.0
15.0
20.0
25.0
30.0
-
20
40
60
80
100
120
140
160
180
Tho
usa
nd
s
QGTS Volume QGTS DSM
-
5
10
15
20
25
30
0.0x
2.0x
4.0x
6.0x
8.0x
10.0x
12.0x
14.0x
16.0x
18.0x
20.0x
QGTS QGTS P/E QGTS P/E LT Avg. +/- 2 Std. Dev.

Thursday, 03 May 2018 35
1Q2018 Review
QGTS' net profit declines 10% QoQ in 1Q2018, exceeding our estimate by 8%. Nakilat reported a bottom-line figure of QR216mn in
1Q2018, which was above our forecast of QR201mn. On a YoY basis, net profit rose 13.2%. Operating results were fairly in-line with
our expectations with modestly higher gross margins and lower D&A expenses contributing to the earnings beat. The QoQ decline in
earnings was primarily due to lower other income (which had QR65mn in realized gains on investments in 4Q2017). Operating
results were actually better sequentially with adjusted EBITDA growing 4% QoQ. YoY results were positive, aided by higher gross
profits and interest/dividend and other income.
1Q2018 Actual Vs. Estimates and Comparisons
Source: Company data, QNBFS estimates
Relative Valuation
In terms of multiples, QGTS remains relatively cheaper vs. its peers along with substantially better EBITDA margins. We also point
to the company substantial FCF yield resulting from limited capex requirements and significant operating cash flow.
Relative Valuation Versus Peers
In QR m n 1Q2018 1Q2018e 4Q2017 1Q2017 A vs. E QoQ YoY 2018e 2017 YoY 2016 YoY
Revenue from Wholly-Owned Vessels 757.6 752.5 769.3 752.6 1% -2% 1% 3,059.9 3,057.1 0% 3,068.6 0%
Gross Profit 593.0 581.7 588.7 581.8 2% 1% 2% 2,355.4 2,359.6 0% 2,350.6 0%
EBITDA 575.8 563.5 573.8 562.4 2% 0% 2% 2,278.2 2,281.4 0% 2,269.9 1%
EBIT 387.2 370.8 381.2 372.8 4% 2% 4% 1,508.0 1,513.4 0% 1,502.3 1%
Share of Operating Profits from Joint Ventures 84.9 83.1 62.0 83.8 2% 37% 1% 369.1 339.0 9% 553.4 -39%
Net Income to Equity 216.4 201.0 239.8 191.1 8% -10% 13% 852.5 846.2 1% 954.2 -11%
DPS (QR) 1.05 1.00 5% 1.00 0%
Adjusted Revenue 857.4 850.2 845.6 849.7 1% 1% 1% 3,485.4 3,451.3 1% 3,677.2 -6%
Adjusted EBITDA 660.8 646.6 635.8 646.2 2% 4% 2% 2,647.3 2,620.4 1% 2,823.3 -7%
Gross Margin 78.3% 77.3% 76.5% 77.3% 77.0% 77.2% 76.6%
EBITDA Margin 76.0% 74.9% 74.6% 74.7% 74.5% 74.6% 74.0%
EBIT Margin 51.1% 49.3% 49.6% 49.5% 49.3% 49.5% 49.0%
Net Margin 11.2% 11.0% 8.1% 11.1% 12.1% 11.1% 18.0%
Adjusted EBITDA Margin 77.1% 76.0% 75.2% 76.0% 76.0% 75.9% 76.8%
S hippe rs Div.
Company Ticke r Yiel d FY 2018e FY 2019e FY 2018e FY 2019e FY 2018e FY 2019e FY 2018e FY 2019e FY 2018e FY 2019e
COSCO SHIPPING Energy Transportation Co Ltd 1138 5.7% 36.1% 40.4% 9.6x 6.8x 3.2x 2.7x 9.0x 7.4x 3.7% 2.6%
National Shipping Co of Saudi Arabia/The NSCSA 5.2% 34.5% 33.2% 12.5x 11.4x NA NA 9.2x 8.7x NA NA
GasLog Partners LP GLOP 8.6% 72.2% 72.0% 12.4x 11.7x 5.5x 5.3x 9.4x 8.7x (25.8%) (15.0%)
GasLog Ltd GLOG 3.4% 70.4% 73.1% 41.8x 15.1x 4.3x 3.6x 11.2x 9.5x (20.7%) 1.1%
Dynagas LNG Partners LP DLNG 19.7% 72.9% 75.0% 19.7x 13.5x 4.9x 4.8x 10.5x 9.3x (2.9%) NA
Ship Finance International Ltd SFL 10.5% 66.1% 68.6% 15.9x 13.5x 9.2x 8.1x 10.4x 9.9x 8.0% 21.4%
Teekay LNG Partners LP TGP 3.1% 73.7% 76.5% 10.7x 7.3x 5.7x 4.8x 10.6x 8.4x NA NA
Golar LNG Ltd GLNG 0.6% 52.1% 59.8% nmf 44.7x 18.4x 12.1x 27.6x 18.6x 7.8% 6.1%
Tsakos Energy Navigation Ltd TNP 5.6% 52.0% 54.1% nmf 10.8x 2.4x 1.6x 10.0x 8.5x 45.2% 53.5%
Ave rage 6.9% 58.9% 61.4% 17.5x 15.0x 6.7x 5.4x 12.0x 9.9x 2.2% 11.6%
Me dian 5.6% 66.1% 68.6% 12.5x 11.7x 5.2x 4.8x 10.4x 8.7x 3.7% 4.3%
Qatar Gas Transport Co Ltd QGTS 6.8% 76.0% 76.2% 9.6x 8.5x 5.8x 5.4x 9.4x 8.9x 16.2% 17.4%
Note: Where coverage is not available, estimates are based on Bloomberg consensus, if available
Mean/Median calculated if more than 3 observations are present
NA: Not Applicable
nmf: Not Meaningful (typically refers to negative or exceedingly large values)
Source: Bloomberg, QNBFS Research
P/CFPS EV /EBI TDA FCF Y ie ldP/EEBI TDA Margin

Thursday, 03 May 2018 36
Detailed Financial Statements
Income Statement
Income Statement (In QR mn) FY2017 FY2018e FY2019e FY2020e
Revenue – Wholly-Owned Ships 3,057 3,060 3,063 3,066
Direct Costs (697) (704) (708) (712)
Gross Profit 2,360 2,355 2,355 2,354
Income from Marine & Agency Services 55 56 57 59
General and Administrative Expenses (133) (134) (134) (134)
EBITDA 2,281 2,278 2,279 2,279
Depreciation (768) (770) (771) (772)
EBIT 1,513 1,508 1,508 1,507
Share of Profits from Joint Ventures 339 369 419 517
Finance Costs (1,172) (1,127) (1,071) (1,006)
Interest, Dividend & Profit from Islamic Banks 64 64 64 64
Vessels Sub-Chartering & Other Income 103 39 39 39
Profit Before Tax 847 854 959 1,121
Income Tax Expense 0 0 0 0
Profit After Tax 847 854 959 1,121
Minority Interest (1) (1) (1) (2)
Profit for Equity Shareholders 846 852 957 1,120
EPS (QR) 1.53 1.54 1.73 2.02
Adjusted Net Revenue 3,451 3,485 3,539 3,641
Adjusted EBITDA 2,620 2,647 2,698 2,796
Source: Company data, QNBFS estimates
Balance Sheet
Balance Sheet (In QR mn) FY2017 FY2018e FY2019e FY2020e
Non-Current Assets
Property, Plant and Equipment 22,392 21,708 21,023 20,337
Investment in Joint Venture Companies 4,144 4,268 4,394 4,523
Loans to Joint Venture Companies 99 99 99 99
Available-for-Sale Investments 109 109 109 109
Total Non-Current Assets 26,744 26,184 25,624 25,068
Current Assets
Receivables, Inventories and Due from Joint Ventures 400 400 400 401
Cash and Bank Balances 2,775 2,835 2,634 2,536
Total Current Assets 3,175 3,235 3,035 2,937
Total Assets 29,919 29,418 28,659 28,004
Equity
Equity Attributable to the Parent 5,922 6,393 6,941 7,625
Minority Interest 4 5 7 8
Total Equity 5,926 6,398 6,948 7,633
Non-Current Liabilities
Borrowings 19,789 18,638 17,450 16,337
Fair Value of Interest Rate Swaps 2,478 2,323 2,168 2,014
Provision for End of Service Benefits 148 148 148 148
Total Non-Current Liabilities 22,416 21,109 19,766 18,498
Current Liabilities
Borrowings 832 1,158 1,189 1,113
Accounts Payables/Accruals & Due to Related Parties 746 753 756 760
Total Current Liabilities 1,578 1,911 1,945 1,873
Equity and Liabilities 29,919 29,418 28,659 28,004
Source: Company data, QNBFS estimates

Thursday, 03 May 2018 37
United Development Company (UDCD)
Updating Model Following 1Q2018 Results Remain long-term bullish given growth potential – UDCD remains our preferred exposure to the
real estate space in Qatar given current real estate weakness and is seen as a play on the Qatar
long-term growth story. 2017 was a challenging year for all real estate plays in Qatar with lease
rates seeing significant drop of ~10-20% over 2016. Inside the Pearl, prices have experienced
similar trajectory with lease rates down +10% if one factors in landlord offers (e.g. 1-2 months
free; Qatar Cool included, etc.) We view this as a sign of landlord emphasis on increasing
occupancy rates (not just UDCD); something we have been calling for over the past year. The
company continues to enjoy a significant land bank from which it supplements its recurring
earnings through land plot sales along with stable utility exposure through Qatar Cool. With a
cleaner balance sheet vs. other peers, UDCD is positioned to effectively grow its earnings-
generating asset portfolio while maintaining peer average leverage/debt service profiles. We
retain our Accumulate recommendation and QR20.00 TP.
Highlights UDCD posts strong numbers in 1Q2018 despite challenging times – United
Development Company (UDCD) reported net profit of QR214.5mn in 1Q2018 and adj.
profit of QR203.4mn (+12.6% beat to our estimate of QR182.3mn). The beat came on the
back of stronger revenue recognition during the quarter (QR528.5mn), which we
assume contributed to the majority of the beat despite higher-than-expected costs that
drove gross margins lower.
Are results indicative of better occupancy rates? We expect the this performance was
reflective of higher occupancy rates within the Pearl and less-than-expected land plot
sales (which tend to garner significantly higher margins). We would consider this as a
positive as it reinforces our thesis of the company’s emphasis on improving recurring
revenue. As a result, headline/adj. EPS of QR0.61/0.57 was higher than our estimate of
QR0.51. Adj. net income was ~9% lower y/y, which was not a surprise given 1Q2017’s
inclusion of partial recognition from the sale of Abraj Quartier Office Tower 1 (closed in
4Q2016 for QR1.25bn).
Long-term catalysts should drive long-term value – We expect UDCD to continue to
focus advancing several development projects through the design and/or construction
phases including school/medical facility, 04 Mall, and Gewan Island project, a mixed-
use residential and commercial project.
Gewan Island in our model at ~QR825mn value on a price/SqM basis. Recently,
management announced that they awarded 3 contracts worth ~QR334mn for the
development of Gewan Island (400,000SqM) with construction expected to begin in
May 2018. Overall, UDCD expects to spend ~QR2.5bn for total development of the
project. Without specificity on project economics, we elect to include the project in our
valuation on a price/SqM basis which added ~QR825mn to our valuation. On the other
hand, we now apply a ~0.8x multiple of the company’s undeveloped land bank
reflecting the current investor sentiment towards real estate in Qatar.
Catalysts Development of a school/medical facility on the Pearl – unknown. Commercial/full
operations at the third Qatar Cool plant in West Bay – 1Q2018. Al Mutahida Towers –
YE2019. Mall 04 and Gewan Island construction/commercial operations – 2021.
Recommendation, Valuation and Risks Maintaining Accumulate recommendation and QR20.00 TP – We continue to rate the
shares as Accumulate on an attractive dividend yield (~8.7%) and valuation upside.
UDCD is currently trading at ~6.4x our FY2018 CFPS (peers at ~6.8x).
Risks to our thesis. Economic weakness, interest rate and project finance risk.
Key Financial Data and Estimates
Source: Company data, QNBFS Research
Key Data
Source: Bloomberg (as of May 1, 2018), *Qatar Exchange
(as of May 1, 2018); Note: FO is foreign ownership
Relative Price Performance vs. Market Indices
Historical P/E Trends vs. Share Price
Source: Bloomberg, QNBFS Research
Mohamed Abo Daff
+974 4476 6589
Saugata Sarkar, CFA, CAIA
+974 4476 6534
Recommendation ACCUMULATE Risk Rating R-4
Share Price QR14.44 Target Price QR20.00
Implied Upside 38.5%
FY 2016 FY 2017 FY 2018e FY 2019e
Reported EPS (QR/sh) 1.76 1.52 1.59 1.70
Adj. EPS (QR/sh) 1.91 1.55 1.56 1.70
P/E (x) 7.7x 8.4x 7.9x 7.5x
CFPS (QR/sh) 2.22 1.96 1.97 2.22
P/CFPS (x) 6.6x 7.2x 6.4x 6.0x
Adj. EBITDA (QR mn) 896.2 815.7 812.6 878.7
EV/EBITDA (x) 9.0x 9.2x 8.7x 8.3x
Current Market Price (QR) 14.44
Dividend Yield (%) 8.7
Bloomberg Ticker UDCD QD EQUITY
Reuters Ticker UDCD.QA
ISIN QA000A0KD6M9
Sector Real Estate
52wk High/52wk Low (QR) 19.26 / 12.50
3-m Average Volume (‘000) 521.0
Mkt. Cap. ($ bn/QR bn) 1.4 / 5.1
Shares Outstanding (mn) 354.1
FO Limit* (%) 49.0
Current FO* (%) 17.5
1-Year Total Return (%) (18.6)
Fiscal Year End December 31
-
5.0
10.0
15.0
20.0
25.0
30.0
35.0
-
20
40
60
80
100
120
140
160
180
200
Tho
usa
nd
s
UDCD Volume UDCD DSM
-
5
10
15
20
25
30
35
0.0x
5.0x
10.0x
15.0x
20.0x
25.0x
30.0x
35.0x
40.0x
45.0x
UDCD UDCD P/E UDCD P/E LT Avg. +/- 2 Std. Dev.

Thursday, 03 May 2018 38
Source: Company reports, QNBFS Research
I ncome S tate me nt Unit 2013 2014 2015 2016 2017 2018 2019
R e ve nue QR mn 2,081 1,906 1,441 2,391 2,032 1,621 1,667
COGS QR mn (1,148) (731) (566) (1,275) (1,004) (590) (555)
Gross Profit QR mn 933 1,175 875 1,116 1,028 1,031 1,112
Gross Margin % % 44.8% 61.6% 60.7% 46.7% 50.6% 63.6% 66.7%
G&A QR mn (230) (287) (312) (303) (261) (265) (265)
Total Operating Expenses QR mn (35) (262) (114) (220) (212) (218) (233)
Adj . EBI TDA QR mn 898 913 761 896 816 813 879
Adj. EBITDA Margin % % 43.2% 47.9% 52.8% 37.5% 40.1% 50.1% 52.7%
D&A QR mn (112) (84) (75) (102) (93) (109) (120)
Adj . EBI T QR mn 553 855 709 819 748 724 779
Adj. EBIT Margin % % 26.5% 44.9% 49.2% 34.3% 36.8% 44.7% 46.8%
Interest Income QR mn 22 23 35 37 52 28 10
Interest Expense QR mn (84) (148) (131) (123) (182) (136) (102)
Net Interest Expense QR mn (62) (125) (96) (86) (130) (108) (93)
Earnings Be fore Taxe s QR mn 490 730 613 733 617 616 687
Adj . Ne t I ncome QR mn 404 679 570 675 548 552 603
Adj. Profit Margin % % 19.4% 35.6% 39.6% 28.2% 27.0% 34.0% 36.2%
WA Basic Shares Outstading mn 354.1 354.1 354.1 354.1 354.1 354.1 354.1
WA FD Shares Outstading mn 354.1 354.1 354.1 354.1 354.1 354.1 354.1
FD EoP Shares Outstanding mn 337.2 354.1 354.1 354.1 354.1 354.1 354.1
Adj. EPS - FD QR/sh 1.14 1.92 1.61 1.91 1.55 1.56 1.70
CFPS (ex. WC) QR/sh 2.27 2.15 1.78 2.22 1.96 1.97 2.22
CFPS QR/sh 3.16 4.45 2.06 0.83 2.64 1.43 2.22
Balance S he e t 2013 2014 2015 2016 2017 2018 2019
Cash/Equiv QR mn 2,002 2,823 2,277 1,566 1,734 969 264
A/R QR mn 1,729 1,464 1,386 2,265 2,125 2,376 2,376
Inventories QR mn 3,096 1,665 1,370 2,018 1,509 1,429 1,429
Total Curre nt Asse ts QR mn 6,848 5,970 5,033 5,849 5,368 4,775 4,070
PP&E QR mn 3,824 4,001 4,499 3,231 3,053 3,278 3,448
Total Long-Te rm Asse ts QR mn 11,917 13,244 14,106 12,875 12,973 13,171 13,341
TOTAL AS S ETS QR mn 18,765 19,214 19,138 18,723 18,341 17,946 17,411
A/P QR mn 2,313 2,671 2,664 2,589 2,328 2,063 2,063
Total Current Liabilities QR mn 3,775 3,472 4,215 4,000 3,030 2,980 2,980
Total LT Liabilities QR mn 4,243 4,622 3,637 3,413 3,776 3,706 2,947
TOTAL LI ABI LI TI ES QR mn 8,018 8,094 7,852 7,413 6,806 6,685 5,927
Non-Controlling Interest QR mn 315 347 373 412 460 308 391
Issued Capital QR mn 3,372 3,541 3,541 3,541 3,541 3,541 3,541
Retained Earnings QR mn 4,057 4,099 4,258 4,498 4,674 4,509 4,580
TOTAL OW NER S EQUI TY QR mn 10,432 10,772 10,914 10,898 11,076 10,953 11,093
Cash Flow S tate me nt 2013 2014 2015 2016 2017 2018 2019
Operating Cash Flow QR mn 803 761 632 786 695 696 785
Non-Cash Change in WC QR mn 317 816 97 (491) 240 (189) -
CFO QR mn 1,120 1,577 729 294 935 507 785
Capex QR mn (494) (316) (607) (450) (40) (336) (290)
CFI QR mn (455) (510) (1,395) 584 (331) 288 (289)
Net Change in Debt QR mn (2,519) (1,075) (1,938) (293) (355) (545) (758)
Dividends QR mn (345) (346) (458) (544) (461) (421) (443)
CFF QR mn (1,040) (524) (716) (837) (816) (967) (1,201)
FX Translation QR mn - - - - - - -
Ne t Change in Cash QR mn (375) 544 (1,381) 41 (211) (171) (705)

Thursday, 03 May 2018 39
Barwa Real Estate Company (BRES)
Earnings Miss on Higher Costs; Expect to Normalize
Maintaining our long-term positive bias on BRES. We positively view BRES’ operating assets and
development pipeline especially its rental income segment. We expect top line/adj. EBITDA to
experience a ~6/13% CAGR through 2020 as rental income strength more than offsets
“normalized” Finance Lease/Consultancy operations while management efforts to cut operating
expenses should drive rental gross margin expansion through the same period to ~80% from
~74% in 2017. We also note that we view the land bank valuation implied by the current share
price is, in our view, overly conservative as it reflects a ~46% discount to the cost of the land
bank. While BRES’ ~QR973mn annual dividend program could be at risk should material growth
capex initiatives be undertaken requiring significant cash flows, we could potentially see BRES
supplement its earnings through unit sales (especially in Lusail) and/or land sales to help fund
growth and help sustain dividends. We estimate the shares to trade at ~17/14x 2018/2019 adj.
EPS (peers ~14/12x) a reflection of higher growth vs. peers.
Highlights 1Q2018 show resilient rental income segment (~88% of total gross profit) but cost of
sales higher than anticipated. We note that rental revenue was in line at ~QR339mn
(~4% below our estimate) with overall revenue only 2% higher than our ~QR424mn
estimate. Rental and consultancy segments; however experienced higher cost of sales
and as a result posted 5% in gross margin compression (~65% vs. our estimate of ~70%)
Also, income from equity-accounted associates was a significant miss at a loss of
~QR0.5mn vs. a profit ~QR18.8mn 1 year ago.
1Q2018 results slightly miss but we are not worried. As a result of operations, reported
EPS came in at QR1.04; ~16% lower y/y. However, we note that this includes several
line items we consider as 1-time or non-recurring. On a normalized basis, while adj. EPS
was still down (reflecting weaker real estate market, which we believe is priced into the
shares) it came in at QR0.45 vs. our estimate of QR0.56. Despite that, we are happy to
see resilient rental income operations despite weaker real estate conditions. We note
that higher rental/consultancy cost of sales (which we expect to normalize during the
year) accounted for ~QR0.04 of the adj. EPS miss while the lower income from associates
accounted for another ~QR0.05 of the miss. Absent those, adj. EPS would have been
largely in line with our estimates.
Our estimates reflect quarterly results and continue to expect earnings growth to keep
up with peers. We expect top line growth in rental income of 12% CAGR through 2020
(1% CAGR 2014-17) as a result of the contribution of various projects. We expect adj.
EBITDA growth of 13% CAGR through 2020 (flat CAGR 2014-2017) as gross margins
improve due to slower total cost of sales growth (73% average gross margins through
2020 vs. 65% from 2015-2017).
BRES’s position within Qatari real estate supports growth. BRES targets the low-to-mid
end of the market but is transitioning into the mid-to-higher end with Lusail Dara B-F
(design phase). This fits into our view of higher demand for that segment given our
outlook on the Qatari economy by 2022. Note that BRES is 45% owned by Qatari Diar,
which could prove a backstop in case of need to refinance/fund growth.
Catalysts Mawater phase II (3Q18); Lusail Dara A (3Q18); Barwa Village expansion (3Q18); and
Barwa Al Baraha warehouses (2Q19); Salwa Labor City (2Q19).
Recommendation, Valuation and Risks Accumulate with a QR39.00 12-month TP. Our valuation implies that BRES shares are
currently trading at a slight discount to our total NAV estimate (~0.9x).
Risks to thesis. Dividend sustainability. Ability to re-profile debt at comparable cost.
Ability to secure funding for organic/acquisitive growth.
Key Financial Data and Estimates
Source: Company data, QNBFS Research
Key Data
Source: Bloomberg (as of May 1, 2018), *Qatar Exchange
(as of May 1, 2018); Note: FO is foreign ownership
Relative Price Performance vs. Market Indices
Historical P/E Trends vs. Share Price
Source: Bloomberg, QNBFS Research
Mohamed Abo Daff
+974 4476 6589
Saugata Sarkar, CFA, CAIA
+974 4476 6534
Recommendation ACCUMULATE Risk Rating R-3
Share Price QR34.70 Target Price QR39.00
Implied Upside 12.4%
2016 2017 2018e 2019e
Adj. EPS (QR/sh) 1.96 2.01 2.13 2.56
P/E (x) 18.0x 17.6x 16.6x 13.8x
CFPS (QR/sh) 1.82 2.38 2.28 2.75
P/CFPS (x) 19.4x 14.9x 15.5x 12.8x
Adj. EBITDA (QR mn) 921.7 941.7 1,019.0 1,203.6
EV/EBITDA (x) 20.5x 20.1x 18.6x 15.7x
Current Market Price (QR) 34.70
Dividend Yield (%) 7.2
Bloomberg Ticker BRES QD EQUITY
Reuters Ticker BRES.QA
ISIN QA000A0KD6J5
Sector Real Estate
52wk High/52wk Low (QR) 38.79 / 27.36
3-m Average Volume (‘000) 336.1
Mkt. Cap. ($ bn/QR bn) 3.7 / 13.5
Shares Outstanding (mn) 389.1
FO Limit* (%) 25.0
Current FO* (%) 9.6
1-Year Total Return (%) 8.7
Fiscal Year End December 31
-
5.0
10.0
15.0
20.0
25.0
-
50
100
150
200
250
Tho
usa
nd
s
BRES Volume BRES DSM
-
10
20
30
40
50
60
0.0x
5.0x
10.0x
15.0x
20.0x
25.0x
30.0x
35.0x
BRES BRES P/E BRES P/E LT Avg. +/- 2 Std. Dev.

Thursday, 03 May 2018 40
I ncome S tate me nt Unit 2013 2014 2015 2016 2017 2018 2019
R e v e nue QR mn 1,822 1,960 1,792 1,737 1,705 1,702 1,883
COGS QR mn (544) (575) (648) (582) (593) (512) (508)
Gross Profit QR mn 1,278 1,385 1,144 1,154 1,112 1,190 1,375
Gross Margin % % 70.2% 70.6% 63.8% 66.5% 65.2% 69.9% 73.0%
G&A QR mn (430) (335) (262) (241) (261) (260) (260)
Total Operating Expenses QR mn (339) (442) (225) (233) (171) (171) (171)
Adj . EBI TDA QR mn 939 943 919 922 942 1,019 1,204
Adj. EBITDA Margin % % 51.6% 48.1% 51.2% 53.1% 55.2% 59.9% 63.9%
D&A QR mn (94) (93) (67) (57) (43) (51) (55)
Adj . EBI T QR mn 846 850 852 865 899 968 1,148
Adj. EBIT Margin % % 46.4% 43.4% 47.5% 49.8% 52.7% 56.9% 61.0%
Interest Income QR mn 116 271 78 78 95 95 84
Interest Expense QR mn (1,090) (748) (166) (159) (197) (218) (223)
Net Interest Expense QR mn (974) (477) (88) (81) (102) (123) (139)
Earnings Be fore Taxe s QR mn (128) 373 764 784 797 845 1,009
Adj . Ne t I ncome QR mn (129) 361 747 763 783 830 995
Adj. Profit Margin % % (7.1%) 18.4% 41.7% 43.9% 45.9% 48.8% 52.8%
WA Basic Shares Outstading mn 389.1 389.1 389.1 389.1 389.1 389.1 389.1
WA FD Shares Outstading mn 389.1 389.1 389.1 389.1 389.1 389.1 389.1
FD EoP Shares Outstanding mn 389.1 389.1 389.1 389.1 389.1 389.1 389.1
Adj. EPS - FD QR/sh (0.33) 0.93 1.92 1.96 2.01 2.13 2.56
CFPS (ex. WC) QR/sh 0.02 8.39 8.57 1.82 2.38 2.28 2.75
CFPS QR/sh (2.64) 13.21 9.25 0.04 5.69 2.02 2.33
Balance S he e t 2013 2014 2015 2016 2017 2018 2019
Cash/Equiv QR mn 966 1,781 3,834 2,875 3,239 2,238 1,866
A/R QR mn 842 867 1,028 1,103 1,164 1,049 1,217
Inventories QR mn 19,712 3,566 3,793 3,202 1,621 1,848 2,143
Total Curre nt Asse ts QR mn 24,826 7,117 9,405 8,001 6,465 5,400 5,490
PP&E QR mn 417 694 651 592 566 1,442 1,807
Total Long-Te rm Asse ts QR mn 22,303 21,852 19,032 21,202 23,228 24,634 24,998
TOTAL AS S ETS QR mn 47,129 28,969 28,437 29,203 29,693 30,034 30,488
A/P QR mn 3,660 3,735 1,469 1,357 1,725 1,860 2,157
Total Current Liabilities QR mn 6,579 5,025 8,784 1,739 2,290 3,181 4,042
Total LT Liabilities QR mn 26,234 8,025 1,935 9,104 8,262 8,640 7,977
TOTAL LI ABI LI TI ES QR mn 32,813 13,050 10,719 10,843 10,552 11,820 12,019
Non-Controlling Interest QR mn 504 159 147 131 217 228 239
Issued Capital QR mn 3,887 3,887 3,887 3,887 3,891 3,891 3,891
Retained Earnings QR mn 4,479 6,213 7,855 8,515 9,113 8,109 8,255
TOTAL OW NER S EQUI TY QR mn 13,811 15,759 17,571 18,229 18,923 17,986 18,231
Cash Flow S tate me nt 2013 2014 2015 2016 2017 2018 2019
Operating Cash Flow QR mn 7 3,266 3,334 709 924 887 1,070
Non-Cash Change in WC QR mn (1,033) 1,872 264 (694) 1,288 (101) (165)
CFO QR mn (1,026) 5,138 3,598 15 2,212 786 905
Capex QR mn (67) (18) (10) (8) (15) (928) (420)
CFI QR mn 1,131 17,101 (2,352) 933 (63) (571) (247)
Net Change in Debt QR mn 1,127 (18,373) (227) 508 - 685 (98)
Dividends QR mn (321) (419) (848) (841) (964) (1,457) (973)
CFF QR mn 107 (21,903) (1,411) (598) (1,303) (850) (1,031)
FX Translation QR mn - - (7) (6) 7 (0) -
Ne t Change in Cash QR mn 212 336 (172) 343 854 (636) (373)

Thursday, 03 May 2018 41
Qatar International Islamic Bank (QIIK)
Strong 1Q2018; Maintain Market Perform Rating Qatar International Islamic Bank (QIIK) is the smallest Shari’ah compliant bank among listed
banks. The bank has a market share of 3% and 14% among listed banks and Shari’ah compliant
banks, respectively. QIIK is focused on the real estate and retail segments which collectively
make up 66% of the bank’s loan book. The bank recently expanded into Morocco.
Highlights
QIIK delivered a strong 1Q2018, exceeding our estimates (+7.0%) on the back of lower
than expected provisions. QIIK generated a net profit of QR253.2mn vs. QR132.1mn in
4Q2018 (+7.1% YoY) due to strong net interest & investment income, fees, and a sharp
drop in opex and provisions. On the other hand, YoY growth was driven by net interest
& investment income coupled with lower opex. The beat in the bottom-line was due to
lower than expected provisions as net operating income was in-line at QR257.6mn (vs.
our estimate of QR250.4mn). The bank booked provisions of QR4.4mn vs. our estimate
of QR13.8mn.
Margins expanded. NIM gained by 22bps QoQ (+9bps) to 2.75% due to stronger yield on
assets. Yield on assets increased by 23bps QoQ (+33bps YoY) while CoFs remained
(+27bps YoY). Thus, net interest income grew by 8.2% (+9.7% YoY). However, we
expect margin pressure in 2018 and 2019 as QIIK would have to raise expensive
deposits and other sources of funds in order lower its LDR below 100% while
maintaining loan growth.
Bank remains efficient, generating positive JAWS. Revenue grew by 13.2% QoQ (+5.7%
YoY) while opex declined by 25.0% (flattish performance YoY), resulting in positive
JAWS of 38% (6% YoY). Moreover, cost-to-income ratio improved QoQ to 23.9% vs.
36.1% in 4Q2017 (25.4% 1Q2017).
Net loans increased while deposits slipped. QIIK’s loan book expanded by 3.2% YTD to
QR33.6bn while deposits declined by 0.9% to QR32.2bn. Hence, LDR jumped to 104%
vs. 100% at the end of 2017.
NPL ratio remained stable; ECLs of QR239.5mn netted against equity. QIIK’s NPL ratio
remained stable at 1.35% vs. 1.32% at the end of 2017. The company booked credit
provisions of QR2.9mn vs. QR25.0mn in 4Q2017 (QR3.0mn in 1Q2017). Hence, CoR was
insignificant. Moreover, the coverage ratio stood at 87.6%. Under IFRS 9, the bank
reported ECLs of QR239.5mn which was netted against equity (4.7% of CET1 and 71bps
of RWAs).
IFRS 9 impact on CET1 ratio negligible, capitalization remains healthy. QIIK’s CET1
ratio receded by 74bps to 14.2% vs. 14.9% at the end of 2017.
Catalysts
Limited catalysts. 1) Significant increase in traded volumes.
Recommendation, Valuation and Risks
Recommendation and valuation: We maintain our Price Target of QR63.00. QIIK is
trading at a 2018e P/B and P/E of 1.4x and 9.4x, respectively. The stock offers an
attractive yield of 7.3%.
Risks: 1) Exposure to the real estate and consumer segments creates concentration risk
which further results in impairments.
Key Financial Data and Estimates
Source: Company data, QNBFS Research; Note: All data based on current number of shares
Key Data
Source: Bloomberg (as of May 1, 2018), *Qatar Exchange
(as of May 1, 2018); Note: FO is foreign ownership
Relative Price Performance vs. Market Indices
Historical P/E Trends vs. Share Price
Source: Bloomberg, QNBFS Research
Shahan Keushgerian
+974 4476 6509
Saugata Sarkar, CFA, CAIA
+974 4476 6534
Recommendation MARKET PERFORM Risk Rating R-3
Share Price QR55.02 Target Price QR63.00
Implied Upside 14.5%
(In QR m n ) 2017 2018e 2019e 2020e
EPS (QR) 5.50 5.88 6.54 6.82
EPS Growth (%) 6.0 6.9 11.2 4.3
P/E (x) 10.0 9.4 8.4 8.1
Tangible BVPS (QR) 38.3 38.1 40.2 42.5
P/TBV (x) 1.4 1.4 1.4 1.3
DPS (QR) 4.00 4.00 4.00 4.00
Dividend Yield (%) 7.3 7.3 7.3 7.3
Current Market Price (QR) 55.02
Dividend Yield (%) 7.3
Bloomberg Ticker QIIK QD EQUITY
Reuters Ticker QIIB.QA
ISIN QA0006929879
Sector Banks & Financial Services
52wk High/52wk Low (QR) 63.22 / 43.40
3-m Average Volume (‘000) 126.0
Mkt. Cap. ($ bn/QR bn) 2.3 / 8.3
Shares Outstanding (mn) 151.4
FO Limit* (%) 25.0
Current FO* (%) 12.0
1-Year Total Return (%) (4.1)
Fiscal Year End December 31
-
1.0
2.0
3.0
4.0
5.0
6.0
-
20
40
60
80
100
120
140
160
180
200
Tho
usa
nd
s
QIIK Volume QIIK DSM
-
10
20
30
40
50
60
70
80
90
100
0.0x
5.0x
10.0x
15.0x
20.0x
25.0x
QIIK QIIK P/E QIIK P/E LT Avg. +/- 2 Std. Dev.

Thursday, 03 May 2018 42
Detailed Financial Statements
Ratios FY2017 FY2018e FY2019e FY2020e
Profitability (%)
RoAE (Attributable) 13.2 14.0 15.3 15.2
RoAA (Attributable) 1.7 1.7 1.7 1.7
RoRWA (Attributable) 2.4 2.3 2.4 2.3
NIM (% of IEAs) 2.7 2.7 2.6 2.7
NIM (% of RWAs) 3.3 3.2 3.2 3.3
NIM (% of AAs) 2.4 2.3 2.3 2.4
Spread 2.2 2.2 2.1 2.0
Efficiency (%)
Cost-to-Income (Headline) 27.3 26.6 25.7 25.6
Cost-to-Income (Core) 27.5 26.8 26.5 26.4
Liquidity (%)
LDR 100.1 102.2 103.9 104.4
Loans/Assets 69.7 68.7 71.6 72.3
Cash & Interbank Loans-to-Total Assets 12.2 16.3 12.3 13.9
Deposits to Assets 69.7 67.2 68.9 69.2
Wholesale Funding to Loans 20.3 26.1 22.4 22.6
IEAs to IBLs 129.5 118.5 129.6 123.8
Asset Quality (%)
NPL Ratio 1.4 1.3 1.2 1.4
NPLs to Shareholder's Equity 7.8 7.8 7.3 9.4
NPLs to Tier 1 Capital 7.5 7.8 7.3 9.3
Coverage Ratio 58.3 59.2 61.6 51.9
ALL/Average Loans 0.8 1.4 1.3 1.2
Cost of Risk 0.1 0.2 0.2 0.3
Capitalization (%)
Tier 1 Ratio 17.9 15.7 15.7 15.4
CAR 17.9 15.7 15.7 15.4
Tier 1 Capital to Assets 13.0 11.5 11.5 11.1
Tier 1 Capital to Loans 18.6 16.7 16.0 15.3
Tier 1 Capital to Deposits 18.6 17.0 16.6 16.0
Leverage (x) 8.0 8.8 8.8 9.1
Growth (%)
Net Interest Income 4.8 6.6 7.4 10.7
Non-Interest Income -12.2 6.4 18.9 11.3
OPEX 10.2 3.7 5.5 10.3
Net Operating Income -0.7 7.6 10.3 11.0
Net Income (Attributable) 1.9 7.4 12.0 4.6
Loans 19.3 7.2 9.8 10.5
Deposits 21.9 5.0 8.0 10.0
Assets 9.6 8.9 5.3 9.5
RWAs 11.2 9.6 5.3 8.0
Source: Company data, QNBFS Research

Thursday, 03 May 2018 43
Income Statement (In QR mn) FY2017 FY2018e FY2019e FY2020e
Net Interest Income 1,063 1,132 1,216 1,347
Fees & Commissions 119 125 127 140
FX Income 41 42 42 50
Other Income 9 13 45 49
Non-Interest Income 169 180 214 238
Total Revenue 1,232 1,312 1,430 1,585
Operating Expenses (336) (349) (368) (406)
Net Operating Income 896 964 1,063 1,180
Net Provisions (63) (74) (74) (148)
Net Profit Before Taxes, Non-Recurring Items & Minority Interest 832 890 989 1,032
Minority Interest 0 0 0 0
Net Profit (Headline/Reported) 832 890 989 1,032
Payment on Tier-1 Sukuk (55) (55) (55) (55)
Social & Sports Contribution Fund (21) (22) (25) (26)
Net Profit (Attributable) 756 812 909 951
Source: Company data, QNBFS Research
Balance Sheet (In QR mn) FY2017 FY2018e FY2019e FY2020e
Assets
Cash & Balances with Central Bank 2,432 3,069 2,762 3,039
Interbank Loans 3,274 5,228 3,825 5,074
Net Investments 6,180 5,185 5,937 5,343
Net Loans 32,500 34,854 38,255 42,284
Investment In Associates 365 354 355 356
Other Assets 685 815 964 1,060
Net PP&E 757 828 908 941
Investment in Real Estate 427 422 418 414
Total Assets 46,619 50,756 53,424 58,511
Liabilities
Interbank Deposits 6,606 6,026 4,914 5,879
Customer Deposits 32,479 34,103 36,831 40,514
Other Borrowings 0 3,057 3,669 3,669
Tier-1 Sukuk 1,000 1,000 1,000 1,000
Other Liabilities 718 784 921 1,013
Total Liabilities 40,802 44,970 47,334 52,075
Total Shareholders’ Equity 5,817 5,786 6,090 6,436
Total Liabilities & Shareholders’ Equity 46,619 50,756 53,424 58,511
Source: Company data, QNBFS Research

Thursday, 03 May 2018 44
Qatar Islamic Bank (QIBK)
Turnaround/Restructuring Priced in; MSCI/FTSE In Focus QIBK is the largest Islamic bank with a market share of ~12% in both total loans and
deposits. QIBK spent the past number of years regaining lost market share from
conventional banks. The bank’s loan book and net income grew by CAGR of 18.9% & 12.1%
(2012-17), respectively.
Highlights
Headline net profit declined 0.8% QoQ; on an adjusted basis (before minorities)
earnings were up 22.5%. QIBK reported net profit of QR625.2mn in 1Q2018,
receding by 0.8% QoQ (+12.6% YoY), exceeding our estimate by 8.6%. Net income
on an adjusted basis (before minorities) increased by 22.5% (QoQ) to QR596.5mn,
in-line with our estimate of QR575.6mn (+3.6% variation).Total revenue was also
in-line at QR1.1bn. Total revenue grew by 18.4% QoQ (+8.3% YoY) on the back of
net interest & investment income, driven by strong margins/spreads.
Margins significantly improved, CoFs dropped. QIBK’s net interest margin
expanded by 21bps QoQ (+18bps YoY) to ~2.83%. This was a result of yield on
assets gaining by 11bps while cost of funds dropping by 8bps. On a YoY basis,
yield on assets jumped by 31bps while cost of funds moved up by 17bps.
QIBK’s operating efficiency improved QoQ, generating positive JAWs. The bank’s
C/I ratio receded to 26.5% from 30% in 4Q2017 (remained flat YoY). Moreover,
QIBK generated robust JAWs of 12.6% as revenue grew by 18.4% QoQ while opex
increased by 5.8%.
Net loans gained while deposits remained flattish. Net loans increased by 2.0%
YTD to QR104.6bn, while deposits inched up by 0.5% YTD to QR102.3bn. Hence,
QIBK’s LDR remained flattish QoQ at 102% vs. 101% in FY2017.
Asset quality remains stable as shown by stage 1 loans. The bank’s NPL ratio
remained unchanged at 1.2% in 1Q2018. During the same time CoR doubled to
44bps vs. 22bps in 2016. QIBK’s stage one loans (credit risk has not increased
significantly since initial recognition) represent 85.7% of total loans while stage
two loans (past due but not impaired; credit risk has increased significantly since
initial recognition) represent 13.2%. Stage three loans (impaired loans) are only
1.1%.
Capitalization remains strong. The bank’s Tier-1 ratio remained strong at 16.2% in
in 1Q2018 vs. 16.9% in FY2017. Had the bank not implemented IFRS 9, CET-1 ratio
would have been 13.4% vs. the current 12.5%.
Catalysts
1) Consistent improvement in NIMs and spreads
Recommendation, Valuation and Risks
Recommendation and valuation: We maintain our Price Target of QR104.00. QIBK is
trading at a 2018e P/B and P/E of 1.7x and 10.5x, respectively. The stock is trading
close to its fair value ( PEG of 0.8x).
Risks: 1) Geopolitical factors/concerns, 2) Depressed oil prices, 3) Increase in credit
costs and 4) Exposure to real estate segment.
Key Financial Data and Estimates
Source: Company data, QNBFS Research; Note: All data based on current number of shares
Key Data
Source: Bloomberg (as of May 1, 2018), *Qatar Exchange
(as of May 1, 2018); Note: FO is foreign ownership
Relative Price Performance vs. Market Indices
Historical P/E Trends vs. Share Price
Source: Bloomberg, QNBFS Research
Shahan Keushgerian
+974 4476 6509
Saugata Sarkar, CFA, CAIA
+974 4476 6534
Recommendation MARKET PERFORM Risk Rating R-3
Share Price QR106.05 Target Price QR104.00
Implied Upside (1.9%)
(In QR m n ) 2017 2018e 2019e 2020e
EPS (QR) 9.31 10.12 11.52 12.26
EPS Growth (%) 8.9 8.6 13.9 6.4
P/E (x) 11.4 10.5 9.2 8.7
Tangible BVPS (QR) 63.0 64.1 70.2 76.8
P/TBV (x) 1.7 1.7 1.5 1.4
DPS (QR) 5.00 5.25 5.50 5.75
Dividend Yield (%) 4.7 5.0 5.2 5.4
Current Market Price (QR) 106.05
Dividend Yield (%) 5.0
Bloomberg Ticker QIBK QD EQUITY
Reuters Ticker QISB.QA
ISIN QA0006929853
Sector Banks & Financial Services
52wk High/52wk Low (QR) 109.00 / 86.90
3-m Average Volume (‘000) 99.1
Mkt. Cap. ($ bn/QR bn) 6.9 / 25.1
Shares Outstanding (mn) 236.3
FO Limit* (%) 49.0
Current FO* (%) 7.5
1-Year Total Return (%) 12.1
Fiscal Year End December 31
-
0.5
1.0
1.5
2.0
2.5
3.0
3.5
4.0
4.5
5.0
-
20
40
60
80
100
120
140
160
180
200
Tho
usa
nd
s
QIBK Volume QIBK DSM
-
20
40
60
80
100
120
140
0.0x
5.0x
10.0x
15.0x
20.0x
25.0x
QIBK QIBK P/E QIBK P/E LT Avg. +/- 2 Std. Dev.

Thursday, 03 May 2018 45
Detailed Financial Statements
Ratios FY2017 FY2018e FY2019e FY2020e
Profitability (%)
RoAE (Attributable) 14.5 15.1 16.3 15.9
RoAA (Attributable) 1.5 1.5 1.6 1.6
RoRWA (Attributable) 2.0 2.1 2.2 2.1
NIM (% of IEAs) 2.60 2.62 2.71 2.82
NIM (% of RWAs) 3.16 3.30 3.43 3.39
NIM (% of AAs) 2.34 2.37 2.45 2.54
Spread 2.23 2.17 2.21 2.29
Efficiency (%)
Cost-to-Income (Headline) 26.6 24.9 24.3 24.4
Cost-to-Income (Core) 27.0 25.9 25.3 25.4
Liquidity (%)
LDR 100.8 98.4 99.0 97.9
Loans/Assets 68.2 67.1 67.1 70.0
Cash & Interbank Loans-to-Total Assets 6.9 7.4 7.4 7.1
Deposits to Assets 67.7 68.2 67.8 71.5
Wholesale Funding to Loans 23.6 24.9 25.5 18.8
IEAs to IBLs 123.8 121.3 119.0 117.5
Asset Quality (%)
NPL Ratio 1.2 1.5 1.7 1.9
NPLs to Shareholder's Equity 7.9 10.4 12.0 13.5
NPLs to Tier 1 Capital 6.5 9.3 11.0 12.4
Coverage Ratio 99.1 110.7 115.8 124.0
ALL/Average Loans 1.1 2.2 2.5 2.8
Cost of Risk (bps) 44 51 55 62
Capitalization (%)
Tier 1 Ratio 16.9 15.2 14.8 13.9
CAR 17.3 15.6 15.2 14.3
Tier 1 Capital to Assets 12.4 10.7 10.7 10.8
Tier 1 Capital to Loans 18.1 15.9 15.9 15.4
Tier 1 Capital to Deposits 18.3 15.6 15.8 15.1
Leverage (x) 9.8 10.4 10.3 10.1
Growth (%)
Net Interest Income 27.5 8.4 11.2 11.6
Non-Interest Income -22.7 19.9 9.1 2.9
OPEX 1.5 3.5 8.3 10.4
Net Operating Income 19.2 13.0 11.6 9.7
Net Income (Attributable) 8.9 8.7 13.9 6.4
Loans 4.5 5.4 7.7 11.7
Deposits 6.7 8.0 7.0 13.0
Assets 7.5 7.2 7.7 7.1
RWAs 4.7 3.0 10.9 15.0
Source: Company data, QNBFS Research

Thursday, 03 May 2018 46
Income Statement (In QR mn) FY2017 FY2018e FY2019e FY2020e
Net Interest Income 3,400 3,685 4,096 4,572
Fees & Commissions 518 543 590 643
FX Income 139 152 170 153
Other Income 106 219 238 231
Non-Interest Income 763 914 998 1,027
Total Income 4,162 4,600 5,094 5,599
Operating Expenses (1,106) (1,145) (1,239) (1,368)
Net Operating Income 3,057 3,455 3,855 4,230
Net Provisions (785) (890) (886) (1,086)
Net Profit Before Taxes & Non-Recurring Items 2,271 2,565 2,969 3,145
Tax (18) (21) (24) (25)
Net Profit Before Minority Interest 2,253 2,544 2,945 3,120
Minority Interest 155 51 (18) (19)
Non-Recurring/Unusual Gains/(Losses) (2) 0 0 0
Net Profit (Headline/Reported) 2,405 2,595 2,927 3,101
Interest on Tier 1 Sukuk (205) (205) (205) (205)
Social & Sports Contribution Fund (60) (65) (73) (78)
Net Profit (Attributable) 2,140 2,325 2,649 2,818
Source: Company data, QNBFS Research
Balance Sheet (In QR mn) FY2017 FY2018e FY2019e FY2020e
Assets
Cash & Balances with Central Bank 5,546 5,498 5,883 6,648
Interbank Loans 4,876 6,492 6,989 6,506
Net Investments 30,402 34,429 37,194 35,213
Net Loans 102,613 108,196 116,484 130,124
Investment In Associates 669 681 695 709
Other Assets 3,156 3,440 3,972 4,443
Net PP&E 511 496 504 515
Investment in Real Estate 1,944 1,642 1,534 1,433
Assets of a Subsidiary Held for Sale 246
Goodwill & Other Intangibles 411 368 324 281
Total Assets 150,375 161,241 173,579 185,871
Liabilities
Interbank Deposits 17,191 19,883 22,631 17,468
Customer Deposits 101,815 109,960 117,657 132,952
Sukuk Financing 7,057 7,057 7,057 7,057
Other Liabilities 3,432 3,299 3,765 4,387
Liabilities of a Subsidiary Held for Sale 0 0 0 0
Tier-1 Sukuk 4,000 4,000 4,000 4,000
Total Liabilities 133,495 144,199 155,111 165,865
Total Shareholders’ Equity 15,289 15,502 16,911 18,430
Total Liabilities & Shareholders’ Equity 150,375 161,241 173,579 185,871
Source: Company data, QNBFS Research

Contacts
Saugata Sarkar, CFA, CAIA Mohamed Abo Daff Shahan Keushgerian
Head of Research Senior Research Analyst Senior Research Analyst
Tel: (+974) 4476 6534 Tel: (+974) 4476 6589 Tel: (+974) 4476 6509
[email protected] [email protected] [email protected]
Zaid Al Nafoosi, CMT, CFTe QNB Financial Services Co. WLL
Senior Research Analyst Contact Center: (+974) 4476 6666
Tel: (+974) 4476 6535 PO Box 24025
[email protected] Doha, Qatar
Disclaimer and Copyright Notice: This publication has been prepared by QNB Financial Services Co. W.L.L. (“QNBFS”) a wholly-owned subsidiary of Qatar National Bank (Q.P.S.C.).
QNBFS is regulated by the Qatar Financial Markets Authority and the Qatar Exchange. Qatar National Bank (Q.P.S.C.) is regulated by the Qatar Central Bank. This publication
expresses the views and opinions of QNBFS at a given time only. It is not an offer, promotion or recommendation to buy or sell securities or other investments, nor is it intended to
constitute legal, tax, accounting, or financial advice. QNBFS accepts no liability whatsoever for any direct or indirect losses arising from use of this report. Any investment decision
should depend on the individual circumstances of the investor and be based on specifically engaged investment advice. We therefore strongly advise potential investors to seek
independent professional advice before making any investment decision. Although the information in this report has been obtained from sources that QNBFS believes to be reliable,
we have not independently verified such information and it may not be accurate or complete. QNBFS does not make any representations or warranties as to the accuracy and
completeness of the information it may contain, and declines any liability in that respect. For reports dealing with Technical Analysis, expressed opinions and/or recommendations
may be different or contrary to the opinions/recommendations of QNBFS Fundamental Research as a result of depending solely on the historical technical data (price and volume).
QNBFS reserves the right to amend the views and opinions expressed in this publication at any time. It may also express viewpoints or make investment decisions that differ
significantly from, or even contradict, the views and opinions included in this report. This report may not be reproduced in whole or in part without permission from QNBFS.
COPYRIGHT: No part of this document may be reproduced without the explicit written permission of QNBFS.
47
OUTPERFORM
ACCUMULATE
MARKET PERFORM
REDUCE
UNDERPERFORM
Greater than +20%
Between +10% to +20%
Between - 10% to +10%
Between - 10% to - 20%
Lower than - 20%
R - 1
R - 2
R - 3
R - 4
R-5
Significantly lower than average
Lower than average
Medium / In - line with the average
Above average
Significantly above average
Recommendation
Based on the range for the upside / downside offered by the 12- month
target price of a stock versus the current market price
Risk Ratings
Reflecting historic and expected price volatility versus the local market
average and qualitative risk analysis of fundamentals