Embed Size (px)
Citation preview

Q4 and Full Year 2017 Earnings ReportFebruary 6, 2018

Forward-Looking Statements & Non-GAAP Financial Measures This presentation contains forward-looking statements about us and our industry that involve substantial risks and uncertainties. All statements other than statements of historical facts contained in this presentation, including statements regarding our future results of operations or financial condition, business strategy and plans, and objectives of management for future operations, are forward-looking statements. In some cases, you can identify forward-looking statements because they contain words such as “anticipate,” “believe,” “continue,” “could,” “estimate,” “expect,” “intend,” “may,” “plan,” “predict,” “project,” “should,” “will,” or “would” or the negative of these words or other similar terms or expressions.
We have based these forward-looking statements largely on our current expectations and projections about future events and financial trends that we believe may affect our financial condition, results of operations, business strategy, and financial needs. These forward-looking statements are subject to known and unknown risks, uncertainties, and assumptions. Additional risks and uncertainties that could affect our financial results are included in the section titled “Risk Factors” and “Management’s Discussion and Analysis of Financial Condition and Results of Operations” in the final prospectus for our initial public offering, dated March 1, 2017 and our quarterly reports on Form 10-Q, which are available on the SEC’s website at www.sec.gov. Additional information will be made available in Snap Inc.’s annual report on Form 10-K and other filings that we make from time to time with the SEC.
This presentation includes certain non-GAAP financial measures. These non-GAAP financial measures, which may be different than similarly titled measures used by other companies, are presented to enhance investors’ overall understanding of our financial performance and should not be considered a substitute for, or superior to, the financial information prepared and presented in accordance with GAAP. A reconciliation of GAAP to non-GAAP measures is provided in the appendix of this presentation.
You should not rely on forward-looking statements as predictions of future events. We have based the forward-looking statements contained in this presentation primarily on our current expectations and projections about future events and trends that we believe may affect our business, financial condition, results of operations, and prospects. As such, these statements speak only as of the date they were originally made public. We operate in a very competitive and rapidly changing environment. New risks and uncertainties emerge from time to time, and it is not possible for us to predict all risks and uncertainties that could have an impact on the forward-looking statements contained in this presentation. The results, events, and circumstances reflected in the forward-looking statements may not be achieved or occur, and actual results, events, or circumstances could differ materially from those described in the forward-looking statements. Snap assumes no obligation and does not intend to update these forward-looking statements.
In addition, statements that “we believe” and similar statements reflect our beliefs and opinions on the relevant subject. These statements are based on information available to us as of the date of this report. And while we believe that information provides a reasonable basis for these statements, there are inherent challenges in measuring usage of our products all over the world. We continually seek to improve our estimates of our user base, and current estimates may be limited, incomplete, or vary due to improvements or changes in methodology. Our statements should not be read to indicate that we have conducted an exhaustive inquiry into, or review of, all relevant information. These statements are inherently uncertain, and investors are cautioned not to unduly rely on these statements. 2

Quarterly Average Daily Active Users(in millions, unaudited)
3
Global North America1
Rest of WorldEurope2
52 55 57 57 60
Q4'16 Q1'17 Q2'17 Q3'17 Q4'17
39 40 42 44 47
Q4'16 Q1'17 Q2'17 Q3'17 Q4'17
68 71 75 77 80
Q4'16 Q1'17 Q2'17 Q3'17 Q4'17
158 166 173 178 187
Q4'16 Q1'17 Q2'17 Q3'17 Q4'17
3.5Bn+Daily Snaps
Created
3Bn+ Daily Snaps
Created
A Daily Active User is defined as a registered Snapchat user who opens the Snapchat application at least once during a defined 24-hour period. We measure average Daily Active Users for a particular quarter by using the average Daily Active Users for that quarter. Snaps Created is defined as the average of the total number of Snaps created daily throughout the quarter.1North America includes Mexico and the Caribbean.2Europe includes Russia and Turkey.

4
Quarterly Revenue by Geography(in millions, unaudited)
North America1 Rest of WorldEurope2
North America $145 $129 $148 $167 $219
Europe $15 $13 $22 $27 $40
Rest of World $6 $8 $12 $13 $26
Q4'16 Q1'17 Q2'17 Q3'17 Q4'17
$150$166 $182$208
$286
Numbers may not foot due to rounding. Total revenue for geographic reporting is apportioned to each region based on our determination of the geographic location in which advertising impressions are delivered, as this approximates revenue based on user activity. This allocation is consistent with how we determine ARPU.1North America includes Mexico and the Caribbean.2Europe includes Russia and Turkey.

$2.15 $1.81 $1.97
$2.17
$2.75
Q4'16 Q1'17 Q2'17 Q3'17 Q4'17
Quarterly Average Revenue Per User (ARPU)(unaudited)
Global North America1
Rest of World
5
Europe2
$0.15 $0.19 $0.29 $0.30
$0.56
Q4'16 Q1'17 Q2'17 Q3'17 Q4'17
$0.28 $0.24
$0.39 $0.48
$0.66
Q4'16 Q1'17 Q2'17 Q3'17 Q4'17
$1.05 $0.90
$1.05 $1.17
$1.53
Q4'16 Q1'17 Q2'17 Q3'17 Q4'17
We define ARPU as quarterly revenue divided by the average Daily Active Users. For purposes of calculating ARPU, revenue by user geography is apportioned to each region based on our determination of the geographic location in which advertising impressions are delivered, as this approximates revenue based on user activity.1North America includes Mexico and the Caribbean.2Europe includes Russia and Turkey.

8%5%
19% 21%
36%
Q4'16 Q1'17 Q2'17 Q3'17 Q4'17
$113 $99 $106
$121 $131
$22 $23
$23 $22
$28 $17 $20
$18 $21
$25
Q4'16 Q1'17 Q2'17 Q3'17 Q4'17
Cost of Revenue1(unaudited)
6
Cost of Revenue Composition (in millions)Hosting Cost
OtherRevenue Share Cost
SBC–Related Expense $0 $20 $2 $2 $2
D&A Expense $1 $2 $3 $5 $5
Inventory-Related Charges — — — $40 —
Total $1 $22 $5 $47 $7
Numbers may not foot due to rounding.1Excludes stock-based compensation expense and related payroll tax expense (SBC–Related Expense), depreciation and amortization (D&A Expense), and certain other non-cash or non-recurring items impacting net income (loss) from time to time (Spectacles Inventory-Related Charges). 2We define CoRPU as quarterly cost of revenue excluding SBC-Related Expense, D&A Expense, and certain other non-cash or non-recurring items impacting net income (loss) from time to time divided by the average Daily Active Users in the quarter.
CoRPU
$1.05$0.90
$1.05$1.17
$1.53
$0.96$0.85 $0.85
$0.92 $0.98
$152$142 $147
$164
$184
Global ARPU
Hosting Cost $0.72 $0.60 $0.61 $0.68 $0.70
Revenue Share Cost $0.13 $0.14 $0.13 $0.12 $0.15
Other $0.11 $0.11 $0.11 $0.12 $0.13
Total CoRPU $0.96 $0.85 $0.85 $0.92 $0.98
Gross Margin1
ARPU and CoRPU2
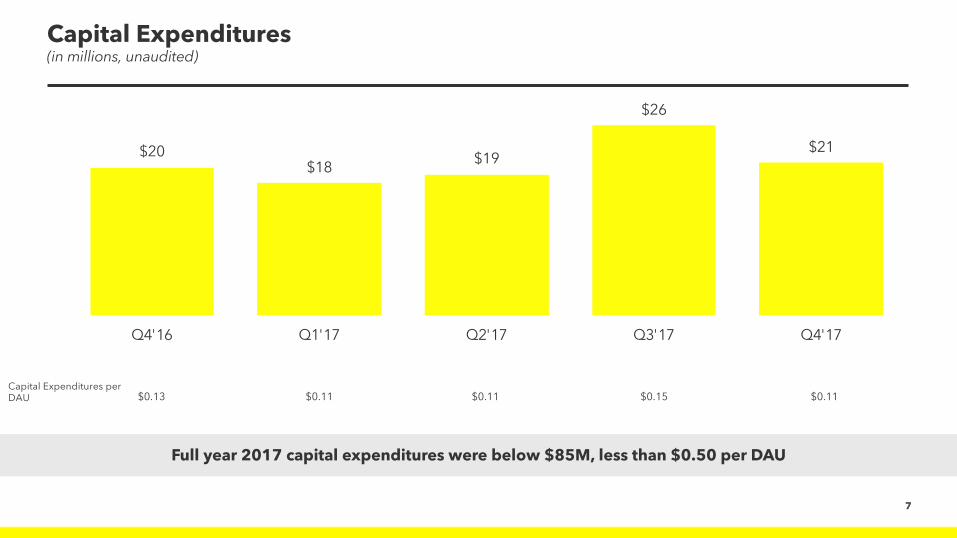
$20 $18 $19
$26
$21
$0. 50
$5. 50
$10.50
$15.50
$20.50
$25.50
$30.50
Q4'16 Q1'17 Q2'17 Q3'17 Q4'17
7
Capital Expenditures(in millions, unaudited)
7
$0.13 $0.11 $0.11 $0.15 $0.11Capital Expenditures per DAU
Full year 2017 capital expenditures were below $85M, less than $0.50 per DAU
$0.13 $0.11 $0.11 $0.15 $0.11Capital Expenditures per DAU

Operating Expense1(in millions, unaudited)
8
$55$78 $86 $87 $96
$47
$56$69 $71
$78$64
$62
$74 $66
$88
Q4'16 Q1'17 Q2'17 Q3'17 Q4'17
$261
$196$166
$223$229
SBC–Related Expense $7 $1,993 $240 $224 $181
D&A Expense $9 $11 $10 $12 $14
Total $16 $2,004 $250 $236 $195
Research and Development General and AdministrativeSales and Marketing
Numbers may not foot due to rounding.1Excludes stock-based compensation expense and related payroll tax expense (SBC–Related Expense) and depreciation and amortization (D&A Expense).

Adjusted EBITDA and Free Cash Flow1(in millions, unaudited)
$(152)
$(188) $(194)$(179)
$(159)
($188)($173)
($229) ($220)($197)
($250)
($200)
($150)
($100)
($50)
$0
Q4'16 Q1'17 Q2'17 Q3'17 Q4'17
91We define Adjusted EBITDA as net income (loss), excluding interest income; interest expense; other income (expense), net; income tax benefit (expense); depreciation and amortization; stock-based compensation expense and related payroll tax expense; and certain other non-cash or non-recurring items impacting net income (loss) from time to time. We define Free Cash Flow as net cash used in operating activities, reduced by purchases of property and equipment. See appendix for reconciliation of net loss to Adjusted EBITDA and net cash used in operating activities to Free Cash Flow.
Modest capital expenditures result in stronger FCF conversion over time
Adjusted EBITDA Free Cash Flow
D&A Expense $11 $12 $13 $17 $19

Appendix

Non-GAAP Financial Measures Reconciliation(in thousands, unaudited)
1
1We define Adjusted EBITDA as net income (loss), excluding interest income; interest expense; other income (expense), net; income tax benefit (expense); depreciation and amortization; stock-based compensation expense and related payroll tax expense; and certain other non-cash or non-recurring items impacting net income (loss) from time to time. Spectacles inventory-related charges were primarily related to excess inventory reserves and inventory purchase commitment cancellation charges. These charges are non-recurring and not reflective of underlying trends in our business.2 We define Free Cash Flow as net cash used in operating activities, reduced by purchases of property and equipment.
Three Months Ended Year Ended
December 31,2016
March 31,2017
June 30,2017
September 30,2017
December 31,2017
December 31,2017
Adjusted EBITDA reconciliation:Net loss $ (169,945) $ (2,208,837) $ (443,093) $ (443,159) $ (349,977) $ (3,445,066)Add (deduct):
Interest income (1,486) (2,424) (6,349) (6,253) (6,070) (21,096)Interest expense 776 695 998 887 876 3,456 Other (income) expense, net 1,215 (187) (786) (1,002) (2,553) (4,528)Income tax (benefit) expense (297) (3,014) 212 (12,300) (3,240) (18,342)Depreciation and amortization 10,633 12,450 12,585 17,467 18,786 61,288 Stock-based compensation expense 6,767 1,992,121 245,028 221,702 181,044 2,639,895 Payroll tax expense related to stock-based compensation 53 20,953 (2,585) 3,890 2,212 24,470 Spectacles inventory-related charges — — — 39,867 — 39,867
Adjusted EBITDA1 $ (152,284) $ (188,243) $ (193,990) $ (178,901) $ (158,922) $ (720,056)
Three Months Ended Year Ended
December 31,2016
March 31,2017
June 30,2017
September 30,2017
December 31,2017
December 31,2017
Free Cash Flow reconciliation:Net cash used in operating activities $ (167,728) $ (154,997) $ (209,574) $ (194,013) $ (176,083) $ (734,667)Less:
Purchases of property and equipment (20,376) (17,993) (19,365) (25,948) (21,212) (84,518)Free Cash Flow2 $ (188,104) $ (172,990) $ (228,939) $ (219,961) $ (197,295) $ (819,185)

Non-GAAP Financial Measures Reconciliation (continued)(in thousands, unaudited)
2
1 We define Non-GAAP Net Loss as net income (loss); excluding amortization of intangible assets; stock-based compensation expense and related payroll tax expense; certain other non-cash or non-recurring items impacting net income (loss) from time to time; and related income tax adjustments. Spectacles inventory-related charges were primarily related to excess inventory reserves and inventory purchase commitment cancellation charges. These charges are non-recurring and not reflective of underlying trends in our business. Non-GAAP Net Loss and weighted average diluted shares are then used to calculate Non-GAAP diluted net loss per share.
Three Months Ended Year Ended
December 31,2016
March 31,2017
June 30,2017
September 30,2017
December 31,2017
December 31,2017
Non-GAAP net loss reconciliation:Net loss $ (169,945) $ (2,208,837) $ (443,093) $ (443,159) $ (349,977) $ (3,445,066)
Amortization of intangible assets 4,849 5,337 5,767 9,743 10,607 31,454 Stock-based compensation expense 6,767 1,992,121 245,028 221,702 181,044 2,639,895 Payroll tax expense related to stock-based compensation 53 20,953 (2,585) 3,890 2,212 24,470 Spectacles inventory-related charges — — — 39,867 — 39,867 Income tax adjustments — (1,567) (623) (123) 60 (2,253)
Non-GAAP net loss1 $ (158,276) $ (191,993) $ (195,506) $ (168,080) $ (156,054) $ (711,633)
Weighted-average common shares - Diluted 835,299 955,003 1,223,443 1,232,993 1,247,017 1,166,085
Three Months Ended Year Ended
December 31,2016
March 31,2017
June 30,2017
September 30,2017
December 31,2017
December 31,2017
Non-GAAP diluted net loss per share reconciliationDiluted net loss per share $ (0.20) $ (2.31) $ (0.36) $ (0.36) $ (0.28) $ (2.95)Non-GAAP adjustment to net loss 0.01 2.11 0.20 0.22 0.15 2.34
Non-GAAP diluted net loss per share1 $ (0.19) $ (0.20) $ (0.16) $ (0.14) $ (0.13) $ (0.61)

Note Regarding User Metrics And Other Data
We define a Daily Active User, or DAU, as a registered Snapchat user who opens the Snapchat application at least once during a defined 24-hour period. We measure average Daily Active Users for a particular quarter by calculating the average Daily Active Users for that quarter. We also break out Daily Active Users by geography because certain markets have a greater revenue opportunity and lower bandwidth costs. We define average revenue per user, or ARPU, as quarterly revenue divided by the average Daily Active Users. For purposes of calculating ARPU, revenue by user geography is apportioned to each region based on our determination of the geographic location in which advertising impressions are delivered, as this approximates revenue based on user activity. This allocation differs from our revenue by geography disclosure in the notes to our consolidated financial statements, where revenue is based on the billing address of the advertising customer.
Unless otherwise stated, statistical information regarding our users and their activities is determined by calculating the daily average of the selected activity for the most recently completed quarter.
While these metrics are determined based on what we believe to be reasonable estimates of our user base for the applicable period of measurement, there are inherent challenges in measuring how our products are used across large populations globally. For example, there may be individuals who have multiple Snapchat accounts, even though we forbid that in our Terms of Service and implement measures to detect and suppress that behavior. We have not determined the number of such multiple accounts. Our user metrics are also affected by technology on certain mobile devices that automatically runs in the background of our Snapchat application when another phone function is used, and this activity can cause our system to miscount the user metrics associated with such account. Changes in our products, mobile operating systems, or metric tracking system, or the introduction of new products, may impact our ability to accurately determine Daily Active Users or other metrics and we may not determine such inaccuracies promptly. We believe that we don’t capture all data regarding all our Daily Active Users. For example, technical issues may not record data from every user’s application. While we believe this underreporting is generally immaterial, we are unable to precisely determine the level of underreporting and for some periods the underreporting may be material. We continually seek to address these technical issues and improve our accuracy, but given the complexity of the systems involved and the rapidly changing nature of mobile devices and systems, we expect underreporting to continue. We do not adjust our reported metrics to reflect this underreporting.
Some of our demographic data may be incomplete or inaccurate. For example, because users self-report their dates of birth, our age-demographic data may differ from our users’ actual ages. And because users who signed up for Snapchat before June 2013 were not asked to supply their date of birth, we exclude those users and estimate their ages based on a sample of the self-reported ages we do have. If our Daily Active Users provide us with incorrect or incomplete information regarding their age or other attributes, then our estimates may prove inaccurate and fail to meet investor expectations.
3

In the past we have relied on third-party analytics providers to calculate our metrics, but today we rely primarily on our analytics platform that we developed and operate. For example, before June 2015, we used a third party that counted a Daily Active User when the application was opened or a notification was received via the application on any device. We now use an analytics platform that we developed and operate and we count a Daily Active User only when a user opens the application and only once per user per day. We believe this methodology more accurately measures our user engagement. We have multiple pipelines of user data that we use to determine whether a user has opened the application during a particular day, and thus is a Daily Active User. This provides redundancy in the event one pipeline of data were to become unavailable for technical reasons, and also gives us redundant data to help measure how users interact with our application.
Additionally, to align our pre-June 2015 Daily Active Users with this new methodology, we reduced our pre-June 2015 Daily Active Users by 4.8%, the amount by which we estimated the data generated by the third party was overstated. As a result, our metrics may not be comparable to prior periods.
If we fail to maintain an effective analytics platform, our metrics calculations may be inaccurate. We regularly review, have adjusted in the past, and are likely in the future to adjust our processes for calculating our internal metrics to improve their accuracy. As a result of such adjustments, our Daily Active Users or other metrics may not be comparable to those in prior periods. Our measures of Daily Active Users may differ from estimates published by third parties or from similarly titled metrics of our competitors due to differences in methodology or data used.
4
Note Regarding User Metrics And Other Data (continued)