Embed Size (px)
Citation preview

financial report
Q4 2017

DOF Subsea ASThormøhlens gate 53 C5006 BergenNORWAYwww.dofsubsea.com
Index
Financial Report 4th quarter 2017 . . . . . . . . . . . . . . . . . . .4
Financial statements 4th quarter 2017 . . . . . . . . . . . . . . .8
Consolidated statement of comprehensive income . . . . . . . . . . . 8
Consolidated statement of financial position . . . . . . . . . . . . . . . . . . 9
Consolidated statement of financial position . . . . . . . . . . . . . . . . 10
Consolidated statement of cash flows. . . . . . . . . . . . . . . . . . . . . . . . 11
Consolidated statement of changes in equity . . . . . . . . . . . . . . . . 12
Notes to the financial statements . . . . . . . . . . . . . . . . . . 14
Note 1 Management reporting . . . . . . . . . . . . . . . . . . . . . . . . . . . . . . . . 14
Note 2 Segment information . . . . . . . . . . . . . . . . . . . . . . . . . . . . . . . . . . 16
Note 3 Financial income and expenses . . . . . . . . . . . . . . . . . . . . . . . 17
Note 4 Tangible assets . . . . . . . . . . . . . . . . . . . . . . . . . . . . . . . . . . . . . . . . . 18
Note 5 Net interest-bearing debt . . . . . . . . . . . . . . . . . . . . . . . . . . . . . . 19
Note 6 Financial instruments and hedging activities . . . . . . . . 20
Note 7 Transactions with related parties . . . . . . . . . . . . . . . . . . . . . 21
Note 8 Investments in associates and joint ventures. . . . . . . . 21
Note 9 Events after the consolidated statement of financial position date. . . . . . . . . . . . . . . . . . . . . . . . . . . . . . . . . . . . . . . . 21
Note 10 Shareholder information. . . . . . . . . . . . . . . . . . . . . . . . . . . . . . 22
Note 11 General. . . . . . . . . . . . . . . . . . . . . . . . . . . . . . . . . . . . . . . . . . . . . . . . . 22
Note 12 Performance measurement definitions. . . . . . . . . . . . . 24
Supplemental information . . . . . . . . . . . . . . . . . . . . . . . . . 26
Condensed statement of comprehensive income 5 last quarters. . . . . . . . . . . . . . . . . . . . . . . . . . . . . . . . . . . . . . . . . . . . . . . . . . . 26
Condensed statement of financial position 5 last quarters. . . . . . . . . . . . . . . . . . . . . . . . . . . . . . . . . . . . . . . . . . . . . . . . . . . 27
Key figures . . . . . . . . . . . . . . . . . . . . . . . . . . . . . . . . . . . . . . . . . . . . . . . . . . . . . . . 27
Financial Report Q4 2017 | DOF SUBSEA
4
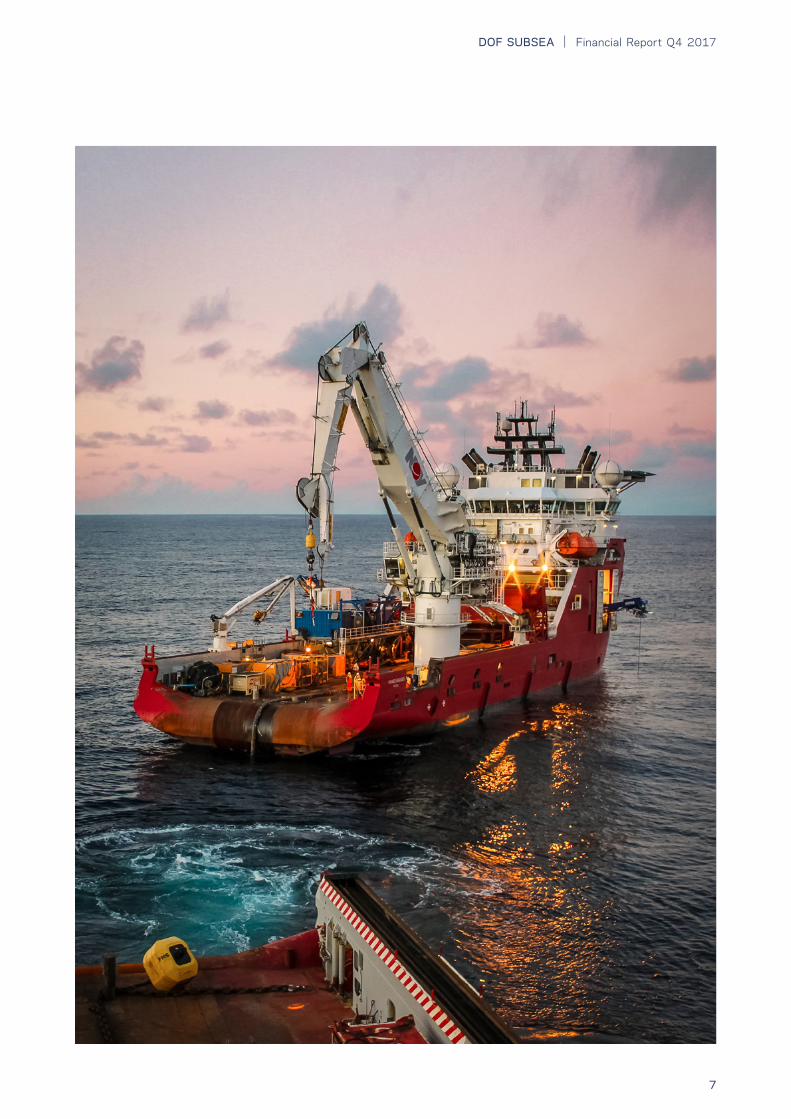
HeadlinesIn the 4th quarter of 2017, DOF Subsea had an operating income of NOK 1 068 million (NOK 1 001 million in the 4th quarter of 2016) and an operating profit before depreciation of NOK 292 million (NOK 385 million including a sales gain of NOK 96 million). The operating profit was NOK 91 million (NOK 10 million) after depreciation and impairment of NOK 201 million (NOK 375 million). The net financial loss was NOK 305 million (NOK 417 million), and the loss before tax was NOK 215 million (NOK 407 million).
For 2017, the Group had an operating income of NOK 3 849 million (NOK 5 099 million) and an operating profit before depreciation of NOK 1 135 million (NOK 1 764 million including a sales gain of NOK 170 million). The operating profit was NOK 136 million (NOK 446 million) after depreciation and impairment of NOK 999 million (NOK 1 318 million). The net financial loss was NOK 259 million (NOK 179 million) giving a loss before tax of NOK 123 million (profit NOK 266 million)
During the quarter the 5-year IMR contract with Shell in Australia commenced, and in December, the Company completed a private placement of NOK 500 million towards the main shareholder, DOF ASA, increasing the number of outstanding shares from 119.7 million to 167.3 million. In connection with the private placement, the DOFSUB07 bond was extended by 2 years.
Key figures (NOK million) 4Q 2017 4Q 2016 2017 2016
Operating income 1 068 1 001 3 849 5 099
EBITDA 292 385 1 135 1 764
EBIT 91 10 136 446
Net interest-bearing debt 8 350 8 357 8 350 8 357
EBITDA proportional method 402 415 1 408 1 901
In the 4th quarter the Group has seen increased activity in both the Asia Pacific region and the North America region with increased utilisation of both personnel and assets. The activity in the Atlantic region and Brazil region was variable during the quarter giving a lower than expected utilisation of both personnel and assets. The general market conditions within our industry are still challenging, however in line with the rebound in the oil price the tendering activity has increased during the quarter for projects with start-up in 2018 and 2019.
During the quarter, the Group has seen improved performance in the Subsea/IMR Projects segment compared to 3rd quarter where the highlight was the start-up of the 5-year Shell Prelude IMR contract, and Skandi Constructor and Skandi Neptune receiving contracts within the renewables industry. In the 4th quarter, Geosea was in transit from Brazil to the North Sea, and Skandi Achiever and Skandi Vitoria were in dry-dock. In general, the idle time between projects has increased, lowering the personnel and vessel utilisation. In the quarter Geosea and
Geograph have been idle, whilst the utilisation of Skandi Niteroi has been 30%. The overall vessel utilisation for both owned and chartered-in vessels was 78% in the 4th quarter, where the uti-lisation in the Long-term Chartering segment was 87% and the utilisation in the Subsea/IMR Projects segment was 75%.
Operational events 4th quarterAs at 31 December 2017, the number of subsea employees was 1 214, and the Group’s fleet comprised 22 owned vessels, 3 chartered-in vessels and 2 newbuilds under construction, plus a fleet of 71 ROVs.
During the 4th quarter, the Asia Pacific region has conducted IMR and construction work for Shell in the Philippines, Chevron, TechnipFMC and Shell in Australia, PTSC in Vietnam and repair and installation work for PT Amman in Indonesia.
In the Atlantic region, the Group has executed engineering, survey, light construction and installation work for Eni in Angola, Conoco Phillips in Norway, TMPC in Libya and TechnipFMC in Libya, work within the renewables industry for Prysmian and Siemens and survey and positioning work for HMC.
In the North America region, the Group has conducted IMR work, installation work and ROV services for Husky Energy, Allseas, Shell, Hess and Enbridge and survey and positioning work for HMC.
In Brazil, the Group has been engaged in ROV inspection work for Petrobras. In addition, the joint venture with TechnipFMC has pro-vided pipelay services to Petrobras and McDermott/Queiroz Galvao.
During the quarter, the Group has been awarded several short-term contracts in the Subsea/IMR Projects segment where the APAC region was awarded contracts for Geotechnical services in Northern Australia utilising Skandi Hercules, and the Atlantic region was awarded contracts in the renewables industry utilising Skandi Constructor and Skandi Neptune. The North America region was awarded contracts by Allseas and Chevron utilising Skandi Achiever and Harvey Deep Sea. The JV company DOFCON Navegacao Ltda was awarded a short-term contract with McDermott utilising Skandi Niteroi.
Utilisation 4Q 2017 3Q 2017 2Q 2017 1Q 2017 4Q 2016
Long-term Chartering 87% 86% 83% 85% 95%
Subsea/IMR Projects 75% 70% 58% 57% 66%
Fleet 78% 74% 66% 65% 75%
Consolidated statement of comprehensive income and consolidated statement of financial positionIn the 4th quarter of 2017, the Group achieved an operating income of NOK 1 068 million compared to an operating income of NOK 1 001 million in the 4th quarter of 2016. The operating
Financial Report 4th quarter 2017

| Financial Report Q4 2017DOF SUBSEA
5
profit before depreciation (EBITDA) was NOK 292 million (NOK 385 million in 2016, including a sales gain of NOK 96 million). The operating profit (EBIT) was NOK 91 million (NOK 10 million). Depreciation and impairment amounted to NOK 201 million (NOK 375 million), of which NOK 64 million was impairment.
NOK million 4Q 2017 4Q 2016 Change %
Operating income 1 068 1 001 7%
EBITDA 292 385 -24%
EBIT 91 10 810%
Net financial loss was NOK 305 million (NOK 417 million), where NOK 194 million (NOK 193 million) was unrealised net loss on derivative instruments and currency positions. The loss before tax was NOK 215 million (NOK 407 million), and the loss for the period was NOK 375 million (NOK 430 million). Income tax expense was NOK 161 million, of which NOK 150 million was im-pairment of deferred tax assets.
The total operating income for 2017 was NOK 3 849 million (NOK 5 099 million in 2016) with an operating profit before depreciation (EBITDA) of NOK 1 135 million (NOK 1 764, in-cluding a sales gain of NOK 170 million) and an operating profit (EBIT) of NOK 136 million (NOK 446 million) after depreciation and impairment of NOK 999 million (NOK 1 318 million). The net financial loss was NOK 259 million (NOK 179 million), giving a loss before tax of NOK 123 million (profit of NOK 266 million). The loss for the period amounted to NOK 273 million (profit of NOK 155 million).
The Group’s total assets were NOK 16 738 million (NOK 16 648 million), where non-current assets amounted to NOK 14 534 million (NOK 14 479 million), including NOK 609 million (NOK 642 million) in intangible assets. Current assets were NOK 2 204 million (NOK 2 170 million), of which NOK 1 097 million (NOK 1 062 million) was cash and cash equivalents.
NOK million 31 .12 .2017 31 .12 .2016 Change %
Total assets 16 738 16 648 1%
Tangible assets 11 773 11 950 -1%
Cash and cash equivalents 1 097 1 062 3%
NIBD 8 350 8 357 -
Total equity 6 348 6 055 5%
The total equity was NOK 6 348 million (NOK 6 055 million), including non-controlling interests of NOK 226 million (NOK 224 million). Non-current liabilities were NOK 8 481 million (NOK 8 632 million). Current liabilities were NOK 1 909 million (NOK 1 961 million), of which NOK 1 191 million (NOK 1 114 million) was current portion of debt. The Group’s total equity and liabilities were NOK 16 738 million (NOK 16 648 million). The net interest-bearing debt (NIBD) was NOK 8 350 million
(NOK 8 357 million). At the end of December, the book equity ratio was 38%, and the value-adjusted equity ratio was 42%. The value-adjusted equity ratio is calculated by adjusting the book equity and total assets by excess values on all owned vessels in the Group.
Cash and cash equivalents have changed due to operating, in-vesting and financing activities. Net cash flow from operating activities in the 4th quarter was NOK -143 million (NOK 27 million). Cash flow from investing activities was NOK -5 million (NOK 759 million), of which NOK -38 million (NOK -185 million) was from investment in assets that increases or will increase ca-pacity for the Group. Cash flow from financing activities was NOK 151 million (NOK -867 million) of which NOK -305 million (NOK -869 million) was instalments and repayments on long-term inter-est-bearing debt. At the end of the 4th quarter, the Group’s cash and cash equivalents were NOK 1 097 million (NOK 1 062 million).
Debt, financing and liquidityThe Group’s current portion of debt at the end of December was NOK 1 191 million, including balloons, bond, drawn credit facilities and ordinary instalments. During the quarter no new loans were drawn, and the Group paid ordinary instalments.
The current weak market conditions have increased the risk for impairment of the Group’s non-current assets, and put pressure on the Group’s liquidity position. In December the Group completed a private placement of NOK 500 million to-wards DOF ASA, increasing the numbers of outstanding shares from 119.7 million to 167.4 million. The private placement was dependent on an extension of the remaining part of the DOFSUB07 bond of NOK 508 million from May 2018 to May 2020. In December the bondholder meeting voted in favour of extending the DOFSUB07 bond from 2018 to 2020, however with an instalment of NOK 100 million in October 2019.
Financial riskThe Group’s operating income is in NOK, USD, AUD, GBP, CAD and BRL, while the Group’s loans are distributed between NOK, USD and CAD. This exposes the Group to the risk of exchange rate fluctuations. The Group has an active exchange rate policy and uses derivatives to hedge the exchange rate exposure.

Financial Report Q4 2017 | DOF SUBSEA
6
The Group is exposed to fluctuations in interest rates. Part of the Group’s loans has fixed interest rates, reducing the exposure. The Group has an active interest rate policy and uses derivatives to hedge the interest rate exposure.
ShareholdersThe shares in DOF Subsea AS are owned by DOF ASA (64.9%), FRC Lux Holding Limited (30.6%) and Dolphin Invest 2 AS (4.5%). The number of outstanding shares is 167 352 762, with a book equity of NOK 37.93 per share.
EmployeesAt the end of 4th quarter, the number of employees in the Group was 1 214. The number does not include marine employees that are employed in DOF Management and Norskan and hired in through shipman agreements to operate and crew the vessels.
The FleetAs at end of December, the Group’s fleet comprised 22 owned vessels, 3 chartered-in vessels and 2 vessels under construction in DOFCON Navegacao Ltda, a 50/50 owned joint venture with TechnipFMC.
The BacklogAs at end of December, the firm contract backlog amounts to NOK 16.1 billion, and including options NOK 34.3 billion. However, the Group is exposed to the short-term market con-ditions in the Subsea/IMR Projects segment. In this segment the management is working to increase the backlog and improve the utilisation of personnel and assets.
Contract Backlog*
* Contract backlog excludes master service agreements (MSAs) within the subsea/
IRM project segment. Under the MSAs only confirmed POs are accounted for.
Events after the consolidated statement of financial position dateIn January, DOF Subsea Brazil was awarded 2 new ROV con-tracts by Petrobras and an extension for 2 additional ROV’s.
In the Atlantic region, the contracts for Skandi Neptune and Skandi Constructor have been extended until the beginning of April and end of February 2018.
Skandi Skansen’s contract with TechnipFMC has been extended, and the vessel has further been awarded a new contract securing high utilisation for the vessel the first four months of the year.
In the Brazil region, Skandi Salvador has been awarded a short-term contract with Saipem.
In the Asia Pacific region, an IMR frame agreement has been extended by one year, under which Skandi Singapore has been awarded 30 days of work in Q1 2018 with potential for additional scope.
In the North America region, Harvey Deep Sea and Skandi Achiever have been awarded short-term contracts securing utilisation in Q1 2018.
Forward looking statementThe Board of Directors is satisfied with the performance in 4th quarter, however the financial numbers for 2017 are below the Board of Directors’ expectations due to one-off events in the North America region and in the Asia Pacific region.
The market has continued to be challenging, with seasonal variations in the different regions during the 4th quarter, and the Board of Directors expects the markets to continue to be challenging in 2018. A continuing weak market, both with regards to terms and margins on new contracts, could lead to reduced earnings and impairment of the vessel values for the Group. As such, the Group will continue its focus on adjusting its capacity and risk exposure to the current challenging market environment. However with oil prices stabilising above USD 60 per barrel, oil companies have increased their tendering activity which may indicate the subsea markets to gradually improve, increasing the demand for the Group’s services in the medium term. The majority of the Group’s high-end assets are committed on long-term contracts, and represents the largest portion of the Group’s backlog, including the two remaining newbuilds committed on 8-year contracts. The Board of Directors would like to thank all employees for the efforts made in 2017.
Bergen, 22 February 2018The Board of Directors of DOF Subsea AS
Contact information:Mons S. Aase, CEO +47 916 61 012Marianne Møgster +47 993 06 916
DOF Subsea ASThormølens gate 53 C5006 Bergen www.dofsubsea.com
| Financial Report Q4 2017DOF SUBSEA
7
Financial Report Q4 2017 | DOF SUBSEA
8
Amounts in NOK million
Financial statements 4th quarter 2017
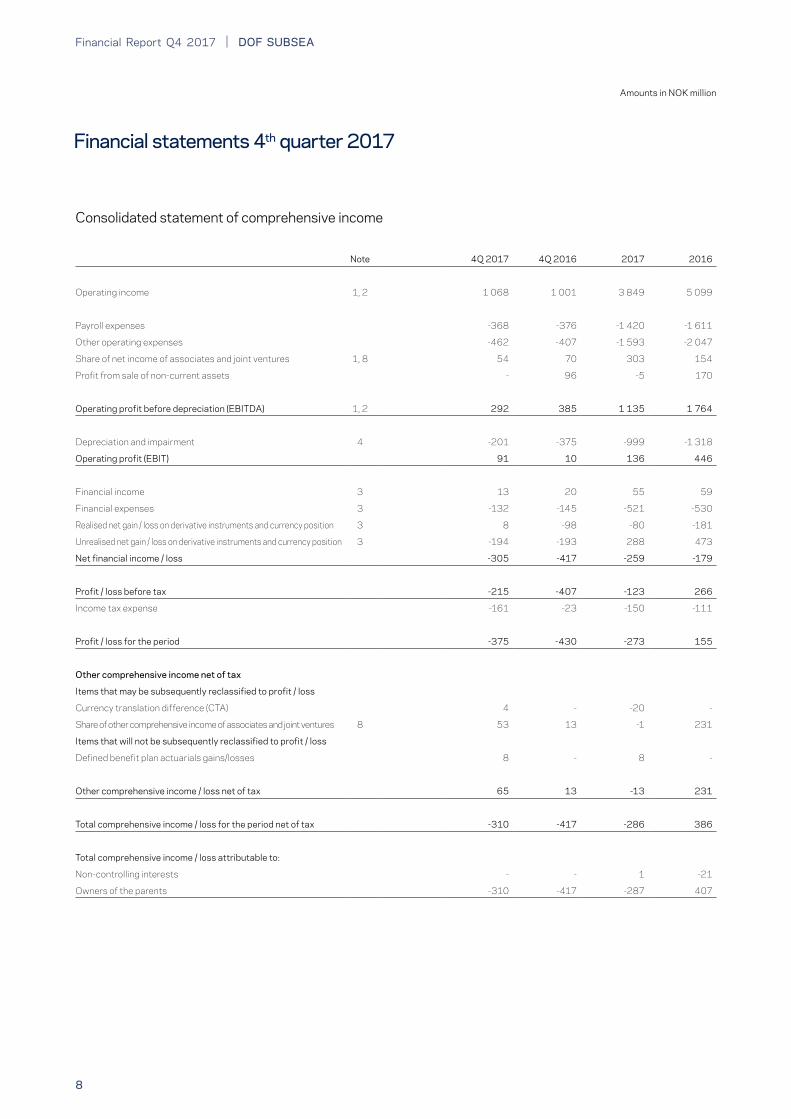
Consolidated statement of comprehensive income
Note 4Q 2017 4Q 2016 2017 2016
Operating income 1, 2 1 068 1 001 3 849 5 099
Payroll expenses -368 -376 -1 420 -1 611
Other operating expenses -462 -407 -1 593 -2 047
Share of net income of associates and joint ventures 1, 8 54 70 303 154
Profit from sale of non-current assets - 96 -5 170
Operating profit before depreciation (EBITDA) 1, 2 292 385 1 135 1 764
Depreciation and impairment 4 -201 -375 -999 -1 318
Operating profit (EBIT) 91 10 136 446
Financial income 3 13 20 55 59
Financial expenses 3 -132 -145 -521 -530
Realised net gain / loss on derivative instruments and currency position 3 8 -98 -80 -181
Unrealised net gain / loss on derivative instruments and currency position 3 -194 -193 288 473
Net financial income / loss -305 -417 -259 -179
Profit / loss before tax -215 -407 -123 266
Income tax expense -161 -23 -150 -111
Profit / loss for the period -375 -430 -273 155
Other comprehensive income net of tax
Items that may be subsequently reclassified to profit / loss
Currency translation difference (CTA) 4 - -20 -
Share of other comprehensive income of associates and joint ventures 8 53 13 -1 231
Items that will not be subsequently reclassified to profit / loss
Defined benefit plan actuarials gains/losses 8 - 8 -
Other comprehensive income / loss net of tax 65 13 -13 231
Total comprehensive income / loss for the period net of tax -310 -417 -286 386
Total comprehensive income / loss attributable to:
Non-controlling interests - - 1 -21
Owners of the parents -310 -417 -287 407

| Financial Report Q4 2017DOF SUBSEA
9
Amounts in NOK million
Consolidated statement of financial position
Assets Note 31 .12 .2017 31 .12 .2016
Tangible assets 4 11 773 11 950
Goodwill 366 373
Deferred tax asset 243 269
Investment in associates and joint ventures 1, 8 1 027 717
Non-current receivables 6 1 125 1 169
Non-current assets 14 534 14 479
Trade receivables 855 791
Other current receivables 6 252 317
Total current receivables 1 107 1 108
Restricted cash 311 305
Unrestricted cash and cash equivalents 786 757
Cash and cash equivalents 5 1 097 1 062
Current assets 2 204 2 170
Total assets 16 738 16 648

Financial Report Q4 2017 | DOF SUBSEA
10
Amounts in NOK million
Equity and liabilities Note 31 .12 .2017 31 .12 .2016
Paid-in equity 10 4 344 3 844
Other equity 1 778 1 987
Non-controlling interests 226 224
Total equity 6 348 6 055
Bond loans 5 1 914 1 297
Debt to credit institutions 5 6 518 7 208
Financial non-current derivatives 6 24 98
Other non-current liabilities 24 29
Non-current liabilities 8 481 8 632
Current portion of debt 5 1 191 1 114
Trade payables 392 500
Other current liabilities 6 325 347
Current liabilities 1 909 1 961
Total liabilities 10 390 10 594
Total equity and liabilities 16 738 16 648
Consolidated statement of financial position

| Financial Report Q4 2017DOF SUBSEA
11
Amounts in NOK million
Consolidated statement of cash flows
Note 4Q 2017 4Q 2016 2017 2016
Operating profit (EBIT) 91 10 136 446
Depreciation and impairment 4 201 374 999 1 318
Profit from sale of non-current assets - -97 5 -170
Share of net income of associates and joint ventures 1, 8 -54 -70 -302 -154
Change in trade receivables -141 -11 -64 361
Change in trade payables -10 -10 -108 -339
Changes in other working capital -142 -35 -3 21
Exchange rate effect on operating activities 55 17 -4 -62
Cash flow from operating activities - 180 659 1 423
Interest received 2 2 28 30
Interest paid -113 -154 -494 -553
Tax paid -32 -1 -50 -40
Net cash flow from operating activities -143 27 143 859
Sale of tangible assets - 938 -2 1 489
Purchase of tangible assets 4 -38 -185 -625 -479
Purchase of shares - 2 -9 -
Dividends received - - - 3
Net cash flows from other non-current receivables 32 5 -43 -249
Cash flow from investing activities -5 759 -678 763
Proceeds of interest-bearing debt -44 - 1 932 319
Instalments on interest-bearing debt -305 -869 -1 875 -2 279
Payments to non-controlling interests - 2 - -24
Share issue 500 - 500 -
Cash flow from financing activities 151 -867 558 -1 983
Net change in cash and cash equivalents 3 -81 23 -361
Cash and cash equivalents at the beginning of period 1 097 1 137 1 062 1 464
Cash and cash equivalents from merger and acquisition - - 27 -
Exchange rate effect on cash and cash equivalents -2 6 -15 -41
Cash and cash equivalents at the end of the period 1 097 1 062 1 097 1 062
Financial Report Q4 2017 | DOF SUBSEA
12
Amounts in NOK million
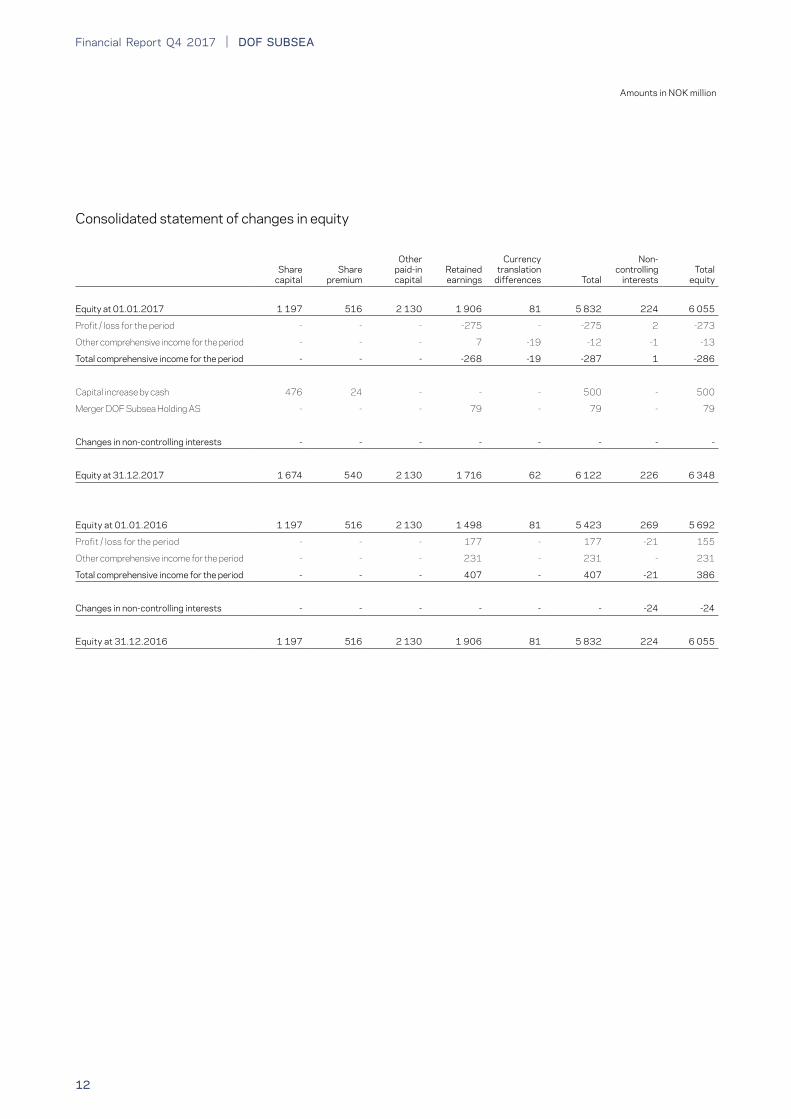
Consolidated statement of changes in equity
Share
capital
Share
premium
Other paid-in capital
Retained earnings
Currency translation
differences
Total
Non- controlling
interests
Total
equity
Equity at 01 .01 .2017 1 197 516 2 130 1 906 81 5 832 224 6 055
Profit / loss for the period - - - -275 - -275 2 -273
Other comprehensive income for the period - - - 7 -19 -12 -1 -13
Total comprehensive income for the period - - - -268 -19 -287 1 -286
Capital increase by cash 476 24 - - - 500 - 500
Merger DOF Subsea Holding AS - - - 79 - 79 - 79
Changes in non-controlling interests - - - - - - - -
Equity at 31 .12 .2017 1 674 540 2 130 1 716 62 6 122 226 6 348
Equity at 01 .01 .2016 1 197 516 2 130 1 498 81 5 423 269 5 692
Profit / loss for the period - - - 177 - 177 -21 155
Other comprehensive income for the period - - - 231 - 231 - 231
Total comprehensive income for the period - - - 407 - 407 -21 386
Changes in non-controlling interests - - - - - - -24 -24
Equity at 31 .12 .2016 1 197 516 2 130 1 906 81 5 832 224 6 055
| Financial Report Q4 2017DOF SUBSEA
13
Financial Report Q4 2017 | DOF SUBSEA
14
Amounts in NOK million
Notes to the financial statements
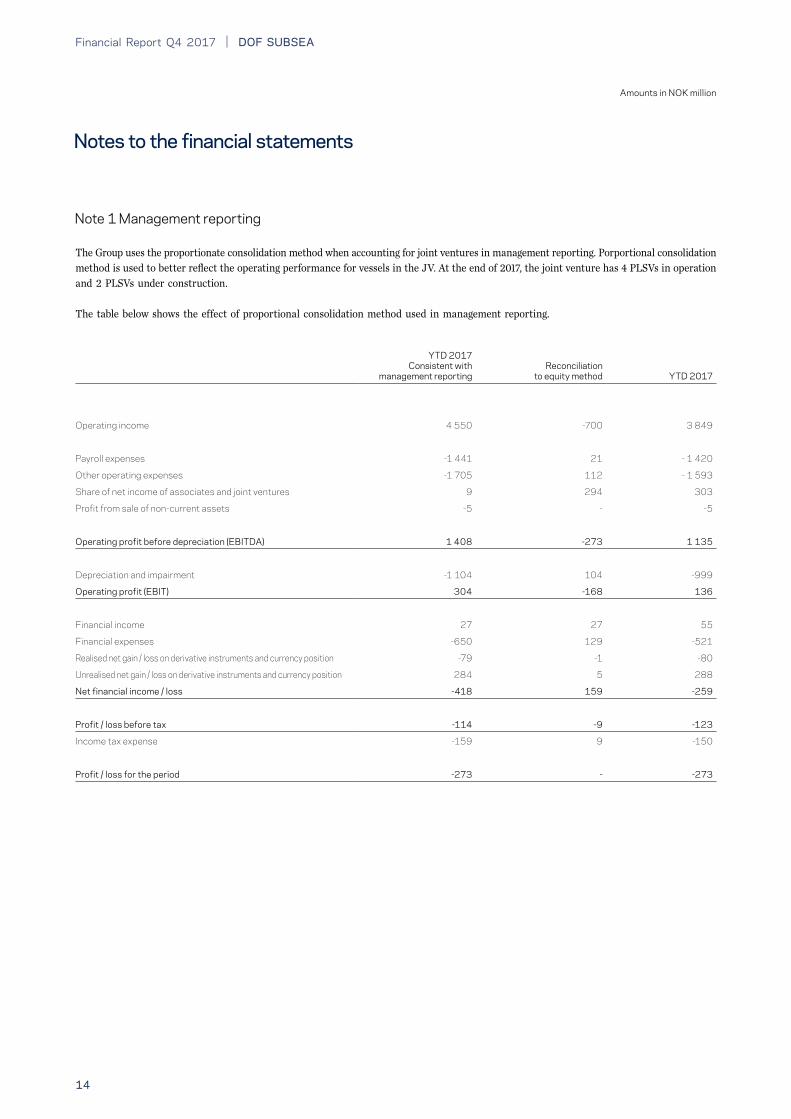
Note 1 Management reporting
The Group uses the proportionate consolidation method when accounting for joint ventures in management reporting. Porportional consolidation method is used to better reflect the operating performance for vessels in the JV. At the end of 2017, the joint venture has 4 PLSVs in operation and 2 PLSVs under construction.
The table below shows the effect of proportional consolidation method used in management reporting.
YTD 2017Consistent with
management reportingReconciliation
to equity method YTD 2017
Operating income 4 550 -700 3 849
Payroll expenses -1 441 21 - 1 420
Other operating expenses -1 705 112 - 1 593
Share of net income of associates and joint ventures 9 294 303
Profit from sale of non-current assets -5 - -5
Operating profit before depreciation (EBITDA) 1 408 -273 1 135
Depreciation and impairment -1 104 104 -999
Operating profit (EBIT) 304 -168 136
Financial income 27 27 55
Financial expenses -650 129 -521
Realised net gain / loss on derivative instruments and currency position -79 -1 -80
Unrealised net gain / loss on derivative instruments and currency position 284 5 288
Net financial income / loss -418 159 -259
Profit / loss before tax -114 -9 -123
Income tax expense -159 9 -150
Profit / loss for the period -273 - -273

| Financial Report Q4 2017DOF SUBSEA
15
Amounts in NOK million
Note 1 Management reporting (continued from previous page)
Consolidated statement of financial position
31 .12 .2017Consistent with
management reportingReconciliation
to equity method YTD 2017
Intangible assets 673 -64 609
Tangible assets 16 397 -4 624 11 773
Financial assets 759 1 393 2 152
Non-current assets 17 829 -3 295 14 534
Current assets 2 607 -403 2 204
Total assets 20 436 -3 698 16 738
Consolidated statement of financial position
31 .12 .2017Consistent with
management reportingReconciliation
to equity method YTD 2017
Total equity 6 348 - 6 348
Non-current liabilities 11 648 -3 166 8 481
Current liabilities 2 440 -532 1 909
Total liabilities 14 088 -3 698 10 390
Total equity and liabilities 20 436 -3 698 16 738
Consolidated statement of cash flows
31 .12 .2017Consistent with
management reportingReconciliation
to equity method YTD 2017
Net cash flow from operating activities 569 -426 143
Cash flow from investing activities -1 029 351 -678
Cash flow from financing activities 533 25 558
Net change in cash and cash equivalents 72 -49 23
Cash and cash equivalent at the beinning of the period 1 189 -127 1 062
Effect of merger and acquisition 27 - 27
Exchange rate effect on cash and cash equivalents -19 4 -15
Cash and Cash equivalents at the end of the period 1 269 -172 1 097
Financial Report Q4 2017 | DOF SUBSEA
16
Amounts in NOK million
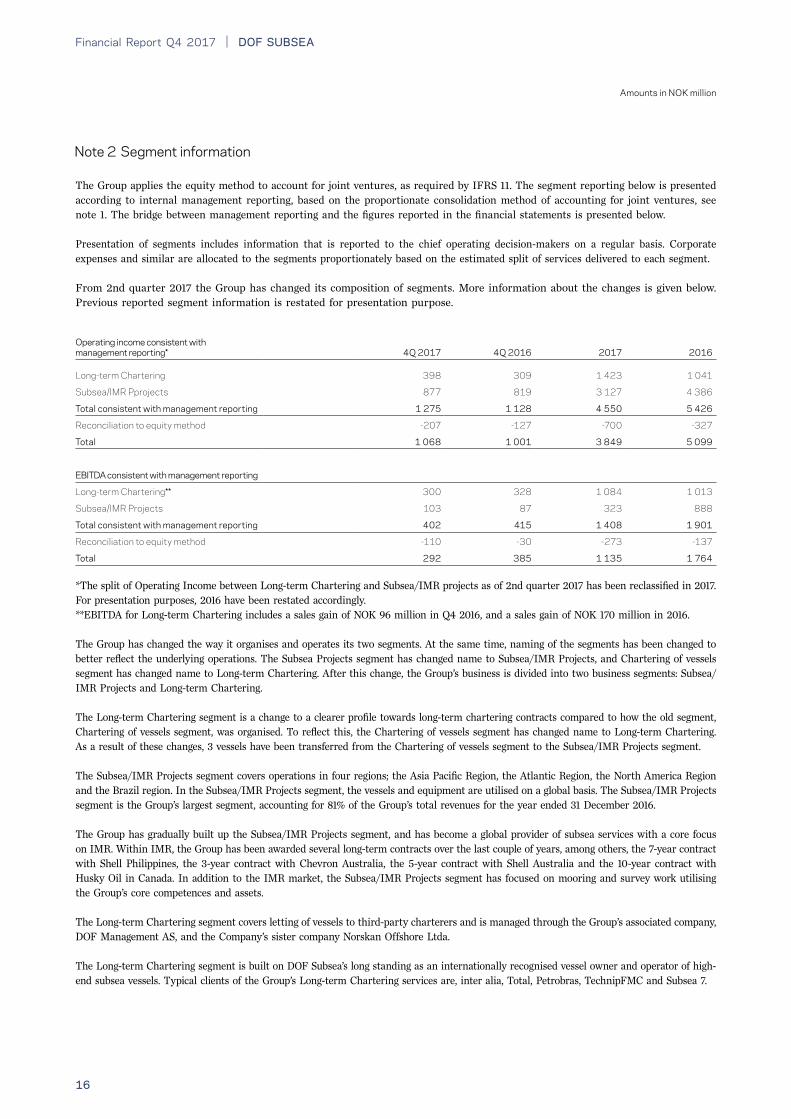
Note 2 Segment information
The Group applies the equity method to account for joint ventures, as required by IFRS 11. The segment reporting below is presented according to internal management reporting, based on the proportionate consolidation method of accounting for joint ventures, see note 1. The bridge between management reporting and the figures reported in the financial statements is presented below.
Presentation of segments includes information that is reported to the chief operating decision-makers on a regular basis. Corporate expenses and similar are allocated to the segments proportionately based on the estimated split of services delivered to each segment.
From 2nd quarter 2017 the Group has changed its composition of segments. More information about the changes is given below. Previous reported segment information is restated for presentation purpose.
*The split of Operating Income between Long-term Chartering and Subsea/IMR projects as of 2nd quarter 2017 has been reclassified in 2017. For presentation purposes, 2016 have been restated accordingly. **EBITDA for Long-term Chartering includes a sales gain of NOK 96 million in Q4 2016, and a sales gain of NOK 170 million in 2016.
The Group has changed the way it organises and operates its two segments. At the same time, naming of the segments has been changed to better reflect the underlying operations. The Subsea Projects segment has changed name to Subsea/IMR Projects, and Chartering of vessels segment has changed name to Long-term Chartering. After this change, the Group’s business is divided into two business segments: Subsea/IMR Projects and Long-term Chartering.
The Long-term Chartering segment is a change to a clearer profile towards long-term chartering contracts compared to how the old segment, Chartering of vessels segment, was organised. To reflect this, the Chartering of vessels segment has changed name to Long-term Chartering. As a result of these changes, 3 vessels have been transferred from the Chartering of vessels segment to the Subsea/IMR Projects segment.
The Subsea/IMR Projects segment covers operations in four regions; the Asia Pacific Region, the Atlantic Region, the North America Region and the Brazil region. In the Subsea/IMR Projects segment, the vessels and equipment are utilised on a global basis. The Subsea/IMR Projects segment is the Group’s largest segment, accounting for 81% of the Group’s total revenues for the year ended 31 December 2016.
The Group has gradually built up the Subsea/IMR Projects segment, and has become a global provider of subsea services with a core focus on IMR. Within IMR, the Group has been awarded several long-term contracts over the last couple of years, among others, the 7-year contract with Shell Philippines, the 3-year contract with Chevron Australia, the 5-year contract with Shell Australia and the 10-year contract with Husky Oil in Canada. In addition to the IMR market, the Subsea/IMR Projects segment has focused on mooring and survey work utilising the Group’s core competences and assets.
The Long-term Chartering segment covers letting of vessels to third-party charterers and is managed through the Group’s associated company, DOF Management AS, and the Company’s sister company Norskan Offshore Ltda.
The Long-term Chartering segment is built on DOF Subsea’s long standing as an internationally recognised vessel owner and operator of high-end subsea vessels. Typical clients of the Group’s Long-term Chartering services are, inter alia, Total, Petrobras, TechnipFMC and Subsea 7.
Operating income consistent with management reporting*
4Q 2017
4Q 2016
2017
2016
Long-term Chartering 398 309 1 423 1 041
Subsea/IMR Pprojects 877 819 3 127 4 386
Total consistent with management reporting 1 275 1 128 4 550 5 426
Reconciliation to equity method -207 -127 -700 -327
Total 1 068 1 001 3 849 5 099
EBITDA consistent with management reporting
Long-term Chartering** 300 328 1 084 1 013
Subsea/IMR Projects 103 87 323 888
Total consistent with management reporting 402 415 1 408 1 901
Reconciliation to equity method -110 -30 -273 -137
Total 292 385 1 135 1 764

| Financial Report Q4 2017DOF SUBSEA
17
Amounts in NOK million
Note 3 Financial income and expenses
4Q 2017 4Q 2016 2017 2016
Interest income 11 18 49 49
Other financial income 2 2 5 10
Financial income 13 20 55 59
Interest expenses -125 -115 -490 -484
Capitalisation of interest - - 3 -
Other financial expenses -7 -30 -34 -46
Financial expenses -132 -145 -521 -530
Net gain / loss on non-current debt 15 -92 -80 -161
Net gain / loss on operational capital -13 -9 -12 -
Net gain / loss on financial derivatives 6 2 11 -21
Net realised gain / loss on financial instruments 8 -98 -80 -181
Net unrealised gain / loss on non-current debt -145 -65 235 293
Net unrealised gain / loss on operational capital 2 5 -1 -22
Net unrealised gain / loss on financial derivatives -52 -133 54 201
Unrealised gain / loss on financial instruments -194 -193 288 473
Net financial income / loss -305 -417 -259 -179

Financial Report Q4 2017 | DOF SUBSEA
18
Amounts in NOK million
Note 4 Tangible assets
31 .12 .2017
Vessels & periodic maintenance
ROVs
Machinery & other equipment
Newbuilds
Total
Net booked value 01 .01 . 10 686 859 378 28 11 950
Additions 136 13 78 635 862
Vessel completed 498 - - -498 -
Disposals - -3 - - -3
Reclassification - 137 15 -154 -
Depreciation -328 -148 -87 - -563
Impairment -425 - - - -425
Currency translation differences -41 -2 -4 - -47
Net booked value 31 .12 . 10 525 856 381 11 11 773
31 .12 .2016
Net booked value 01 .01 . 11 990 963 455 7 13 425
Additions 380 12 73 53 517
Disposals -823 - -19 - -842
Reclassification - 43 -11 -32 -
Depreciation -335 -158 -97 - -590
Impairment -632 -5 -19 - -656
Currency translation differences 96 4 -3 - 97
Net booked value 31 .12 . 10 686 859 378 28 11 950
The challenging market conditions for offshore service vessels have continued. In the 4th quarter 2017, the Group faced lower market values for some of the Group`s vessels. Impairment indicators are observed, and an impairment test for vessels in the Group has been performed. Impairment tests are performed in line with accounting principles presented in the annual report for 2016. Impairments of NOK 64 million have been recognised in the 4th quarter of 2017. YTD 2017, the Group has recognised an impairment of NOK 425 million.
| Financial Report Q4 2017DOF SUBSEA
19
Amounts in NOK million
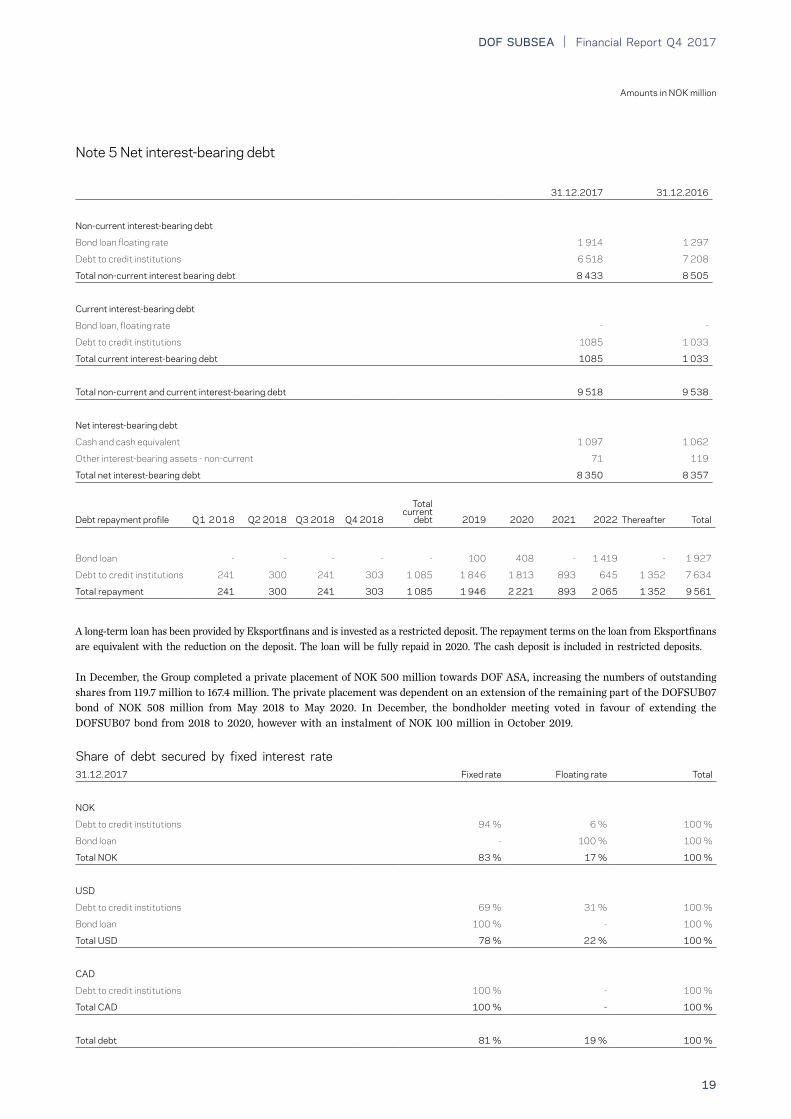
Note 5 Net interest-bearing debt
31 .12 .2017 31 .12 .2016
Non-current interest-bearing debt
Bond loan floating rate 1 914 1 297
Debt to credit institutions 6 518 7 208
Total non-current interest bearing debt 8 433 8 505
Current interest-bearing debt
Bond loan, floating rate - -
Debt to credit institutions 1085 1 033
Total current interest-bearing debt 1085 1 033
Total non-current and current interest-bearing debt 9 518 9 538
Net interest-bearing debt
Cash and cash equivalent 1 097 1 062
Other interest-bearing assets - non-current 71 119
Total net interest-bearing debt 8 350 8 357
Share of debt secured by fixed interest rate31 .12 .2017 Fixed rate Floating rate Total
NOK
Debt to credit institutions 94 % 6 % 100 %
Bond loan - 100 % 100 %
Total NOK 83 % 17 % 100 %
USD
Debt to credit institutions 69 % 31 % 100 %
Bond loan 100 % - 100 %
Total USD 78 % 22 % 100 %
CAD
Debt to credit institutions 100 % - 100 %
Total CAD 100 % - 100 %
Total debt 81 % 19 % 100 %
A long-term loan has been provided by Eksportfinans and is invested as a restricted deposit. The repayment terms on the loan from Eksportfinans are equivalent with the reduction on the deposit. The loan will be fully repaid in 2020. The cash deposit is included in restricted deposits.
In December, the Group completed a private placement of NOK 500 million towards DOF ASA, increasing the numbers of outstanding shares from 119.7 million to 167.4 million. The private placement was dependent on an extension of the remaining part of the DOFSUB07 bond of NOK 508 million from May 2018 to May 2020. In December, the bondholder meeting voted in favour of extending the DOFSUB07 bond from 2018 to 2020, however with an instalment of NOK 100 million in October 2019.
Debt repayment profile Q1 2018 Q2 2018 Q3 2018 Q4 2018
Total current
debt 2019 2020 2021 2022 Thereafter Total
Bond loan - - - - - 100 408 - 1 419 - 1 927
Debt to credit institutions 241 300 241 303 1 085 1 846 1 813 893 645 1 352 7 634
Total repayment 241 300 241 303 1 085 1 946 2 221 893 2 065 1 352 9 561

Financial Report Q4 2017 | DOF SUBSEA
20
Amounts in NOK million
Note 5 Interest-bearing debt (continued from previous page)
Note 6 Financial instruments and hedging activities
Financial covenantsThe Group’s long-term financing agreements include the following covenants: - The Group shall have available cash of at least NOK 500 million at all times - The Group shall have value-adjusted equity to value-adjusted assets of at least 30% - The Group shall have book equity of at least NOK 3 000 million at all times - The Group shall have positive working capital at all times, excl. short portion of debt to credit institutions - The fair value of the Group’s vessels shall always be at least 100-130% of the outstanding loan amount In addition to the above mentioned financial covenants, the loan agreements are also subject to the following covenants:- The Group’s assets shall be fully insured - There shall not be any change to classification, management or ownership of the ships without the prior written approval of the lenders- DOF ASA shall be the principal shareholder in DOF Subsea AS, and own a minimum of 50.1 % of the shares- DOF Subsea AS shall not merge or demerge activities without the prior written approval of the lenders - DOF Subsea AS shall report financial information to the lenders and Oslo Stock Exchange on a regular basis - The Group’s vessels shall be operated in accordance with applicable laws and regulations
The Group is in compliance with all covenants.
Assets
31 .12 .2017
Liabilities
Assets
31 .12 .2016
Liabilities
Non-current and current portion
Interest rate swaps - cash flow hedges 18 35 25 80
Foreign exchange contracts cash flow hedges 17 65 40 105
Total non-current and current 35 100 66 185
Non-current portion
Interest rate swaps - cash flow hedges 18 20 25 80
Foreign exchange contracts cash flow hedges 3 4 12 18
Total non-current portion 21 24 37 98
Total current portion 14 76 28 87
Committed Received
31 .12 .2017
Amount
Committed Received
31 .12 .2016
Amount
Instrument
Foreign exchange contracts, buy NOK NOK 2 225 NOK 3 214
| Financial Report Q4 2017DOF SUBSEA
21
Amounts in NOK million
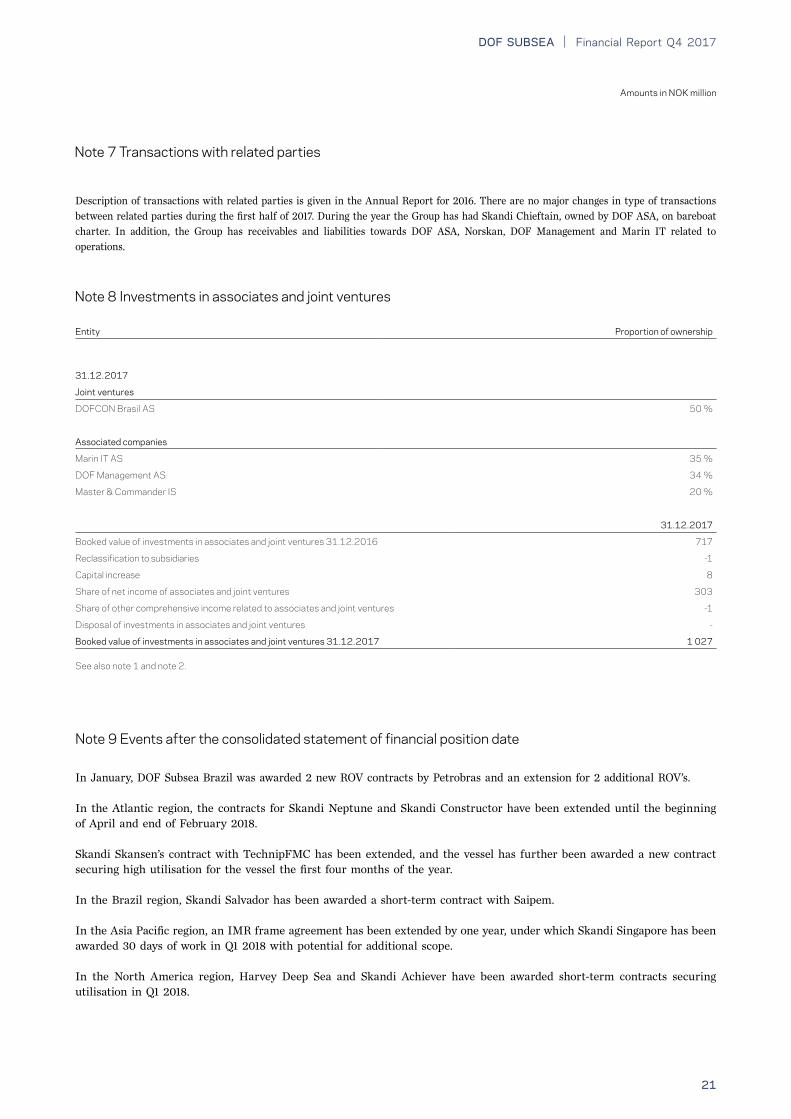
Note 8 Investments in associates and joint ventures
Entity Proportion of ownership
31 .12 .2017
Joint ventures
DOFCON Brasil AS 50 %
Associated companies
Marin IT AS 35 %
DOF Management AS 34 %
Master & Commander IS 20 %
31 .12 .2017
Booked value of investments in associates and joint ventures 31.12.2016 717
Reclassification to subsidiaries -1
Capital increase 8
Share of net income of associates and joint ventures 303
Share of other comprehensive income related to associates and joint ventures -1
Disposal of investments in associates and joint ventures -
Booked value of investments in associates and joint ventures 31 .12 .2017 1 027
See also note 1 and note 2.
Note 7 Transactions with related parties
Description of transactions with related parties is given in the Annual Report for 2016. There are no major changes in type of transactions between related parties during the first half of 2017. During the year the Group has had Skandi Chieftain, owned by DOF ASA, on bareboat charter. In addition, the Group has receivables and liabilities towards DOF ASA, Norskan, DOF Management and Marin IT related to operations.
Note 9 Events after the consolidated statement of financial position date
In January, DOF Subsea Brazil was awarded 2 new ROV contracts by Petrobras and an extension for 2 additional ROV’s.
In the Atlantic region, the contracts for Skandi Neptune and Skandi Constructor have been extended until the beginning of April and end of February 2018.
Skandi Skansen’s contract with TechnipFMC has been extended, and the vessel has further been awarded a new contract securing high utilisation for the vessel the first four months of the year.
In the Brazil region, Skandi Salvador has been awarded a short-term contract with Saipem.
In the Asia Pacific region, an IMR frame agreement has been extended by one year, under which Skandi Singapore has been awarded 30 days of work in Q1 2018 with potential for additional scope.
In the North America region, Harvey Deep Sea and Skandi Achiever have been awarded short-term contracts securing utilisation in Q1 2018.

Financial Report Q4 2017 | DOF SUBSEA
22
Amounts in NOK million
Note 10 Shareholder information
Name No . shares Shareholding Voting shares
DOF ASA 108 683 241 65 % 65 %
FRC Lux Holding Limited 51 131 358 31 % 31 %
Dolphin Invest 2 AS 7 538 163 5 % 5 %
Total 167 352 762 100 .0 % 100 .0 %
Note 11 General
This interim report has been prepared in accordance with the standard for interim reporting (IAS 34). The accounting principles and calculation methods applied for the latest published annual accounts have been applied to the quarterly financial report. Amendments and interpretations to the standards which are effective for the financial year beginning on 1 January 2017 are not material to the Group. The Financial Statement is unaudited.
IFRS 15 Revenue from contracts with customers - effective from 1 January 2018The new standard is based on the principle that revenue is recognised when control of goods or service transfers to a customer - the notion of control replaces the existing notion of risks and rewards.
The Group has finalised an internal project regarding the implementation of IFRS 15 Revenue from contracts with customers. The main purpose of the project was to assess the impact of applying the new standard on the Group’s Financial Statements to ensure a good implementation process. All contracts ongoing at year-end are evaluated based on the five step model described in IFRS 15 Revenue from contracts with customers. The purpose of the evaluation was to identify the effect on the equity 1 January 2018. In addition, all types of contracts within the different revenue streams are evaluated on a general basis to determine the effects of the implementation in 2018. As part of the project the Group’s revenue streams has been categorised into the following types: Time Charter revenue and Project revenue.
Time Charter revenue is based on contracts wehre the Group delivers a vessel (including crew) to the client. During the contract period, the client decides how and when to operate the vessel. Based on existing IFRS, and after the implementation of IFRS 15 Revenue from contracts with customers, this revenue stream is recognised over time. The Time Charter revenue will be affected by the implementation of IFRS 15 Revenue from contracts with customers and the bareboat element will be recognised as lease revenue based on IFRS 16 Leases. Result of the assessment is that the timing of the revenue recognition under IFRS 15 Revenue from contracts with customers and IFRS 16 Leases will be the same as under IAS 18 Revenue and IAS 17 Leases.
Project revenue is based on operations where the Group utilises its vessels, equipment and crew to perform tailor made operations on the client’s installations, assets etc. Based on existing IFRS this revenue is recognised over time. Result of the assessment is that the timing of the revenue recognition under IFRS 15 Revenue from contracts with customers will be the same as under IAS 18 Revenue/IAS 11 Construction contracts.
A reverse merger was executed during the quarter effective 1 January 2017 between DOF Subsea AS and DOF Subsea Holding AS. This resulted in DOF Subsea Holding AS being absorbed into DOF Subsea AS, thus changes in the shareholders.
In December the Group made a private placement of NOK 500 million towards DOF ASA, increasing the numbers of outstanding shares from 119.7 million to 167.4 million.
| Financial Report Q4 2017DOF SUBSEA
23
Amounts in NOK million
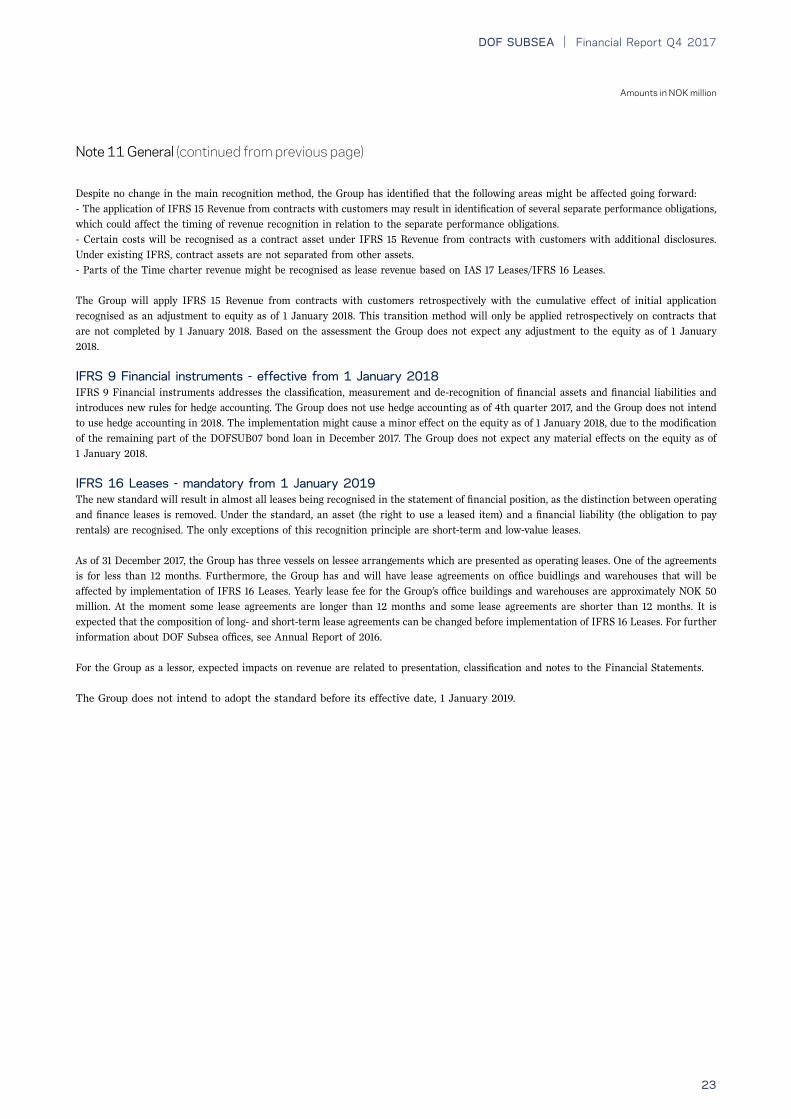
Despite no change in the main recognition method, the Group has identified that the following areas might be affected going forward: - The application of IFRS 15 Revenue from contracts with customers may result in identification of several separate performance obligations, which could affect the timing of revenue recognition in relation to the separate performance obligations. - Certain costs will be recognised as a contract asset under IFRS 15 Revenue from contracts with customers with additional disclosures. Under existing IFRS, contract assets are not separated from other assets. - Parts of the Time charter revenue might be recognised as lease revenue based on IAS 17 Leases/IFRS 16 Leases.
The Group will apply IFRS 15 Revenue from contracts with customers retrospectively with the cumulative effect of initial application recognised as an adjustment to equity as of 1 January 2018. This transition method will only be applied retrospectively on contracts that are not completed by 1 January 2018. Based on the assessment the Group does not expect any adjustment to the equity as of 1 January 2018.
IFRS 9 Financial instruments - effective from 1 January 2018IFRS 9 Financial instruments addresses the classification, measurement and de-recognition of financial assets and financial liabilities and introduces new rules for hedge accounting. The Group does not use hedge accounting as of 4th quarter 2017, and the Group does not intend to use hedge accounting in 2018. The implementation might cause a minor effect on the equity as of 1 January 2018, due to the modification of the remaining part of the DOFSUB07 bond loan in December 2017. The Group does not expect any material effects on the equity as of 1 January 2018.
IFRS 16 Leases - mandatory from 1 January 2019The new standard will result in almost all leases being recognised in the statement of financial position, as the distinction between operating and finance leases is removed. Under the standard, an asset (the right to use a leased item) and a financial liability (the obligation to pay rentals) are recognised. The only exceptions of this recognition principle are short-term and low-value leases.
As of 31 December 2017, the Group has three vessels on lessee arrangements which are presented as operating leases. One of the agreements is for less than 12 months. Furthermore, the Group has and will have lease agreements on office buidlings and warehouses that will be affected by implementation of IFRS 16 Leases. Yearly lease fee for the Group’s office buildings and warehouses are approximately NOK 50 million. At the moment some lease agreements are longer than 12 months and some lease agreements are shorter than 12 months. It is expected that the composition of long- and short-term lease agreements can be changed before implementation of IFRS 16 Leases. For further information about DOF Subsea offices, see Annual Report of 2016.
For the Group as a lessor, expected impacts on revenue are related to presentation, classification and notes to the Financial Statements.
The Group does not intend to adopt the standard before its effective date, 1 January 2019.
Note 11 General (continued from previous page)
Financial Report Q4 2017 | DOF SUBSEA
24
Amounts in NOK million
Operating profit before depreciation (EBITDA)Operating profit before depreciation (EBITDA) is defined as operating profit, including profit from sale of non-current assets, before impairment of tangible and intangible assets, depreciation of tangible assets and amortisation of contract assets. EBITDA represents earnings before interest, tax, depreciation and amortisation, and is a key financial parameter for the Group. This measure is useful in evaluating operating profitability on a more variable cost basis as it excludes depreciation, impairment and amortised expenses related primarily to capital expenditures and acquisitions that occurred in the past. The EBITDA margin presented is defined as EBITDA divided by operating income.
Operating profit (EBIT)Operating profit (EBIT) represents earnings before interest and tax, and is a common non-IFRS measure to assess profitability before financial income and loss items and tax expenses.
Net interest-bearing debt Net interest-bearing debt consists of both current and non-current interest-bearing liabilities less interest bearing financial assets and cash and cash equivalents. Non-current receivables from joint ventures are not included in net interest-bearing debt. Cash and cash equivalents will include restricted cash. Current interest-bearing debt includes interest-bearing debt related to asset held for sale. Net interest-bearing debt is a measure of the Group’s net indebtedness that provides an indicator of the overall statement.
Equity ratioEquity ratio is defined as total equity divided by total assets at the reporting date.
Market valueCalculated average vessel value between two independent brokers’ estimates based on the principle of “willing buyer and willing seller”.
Vessel utilisation Vessel utilisation is a measure of the Group`s ability to keep vessels in operation and on contracts with clients, expressed as a percentage. The vessel utilisation numbers are based on actual available days, including yard-stay days for dry-docking, repairs and upgrade/conversion, transits and idle time between subsea/IMR projects and long-term chartering contracts.
Contract backlog Sum of undiscounted revenue related to secured contracts in the future and optional contract extensions as determined by the client in the future. Contract backlog excludes master service agreements (MSAs) within the Subsea/IRM Projects segment. Under the MSAs only confirmed POs are included.
Firm contract backlog Sum of undiscounted revenue related to secured contracts in the future. Secured contracts are contracts signed with clients in the past, covering future delivery of services.
Backlog optionsSum of undiscounted revenue related to optional contract extensions as determined by the client in the future.
Working capitalThe working capital position of the Group is equal to current assets less current liabilities. It is a measure of the Group’s liquidity and efficiency, and demonstrates the Group’s ability to pay its current liabilities.
Note 12 Performance measurement definitions
| Financial Report Q4 2017DOF SUBSEA
25

Financial Report Q4 2017 | DOF SUBSEA
26
Amounts in NOK million
Supplemental information
Condensed statement of comprehensive income 5 last quarters
4Q 2017 3Q 2017 2Q 2017 1Q 2017 4Q 2016
Operating income 1 275 1 093 1 199 982 1 128
Payroll expenses -381 -363 -337 -360 -376
Other operating expenses -494 -395 -466 -350 -430
Share of net income of associates and joint ventures 2 -3 3 7 -3
Profit from sale of non-current assets - - -4 -1 96
Total operating expenses -872 -762 -804 -704 -713
Operating profit before depreciation (EBITDA) 402 332 396 278 415
Depreciation and impairment -231 -352 -233 -288 -396
Operating profit (EBIT) 172 -21 163 -10 19
Financial income 5 - 15 8 14
Financial expenses -193 -151 -170 -137 -161
Realised gain / loss on financial instruments 8 24 -64 -47 -106
Unrealised gain / loss on financial instruments -195 260 136 83 -149
Net financial income / loss -374 133 -83 -93 -402
Profit / loss before tax -203 112 80 -103 -383
Tax expenses -173 26 8 -21 -47
Profit / loss for the period -375 138 88 -124 -430
The supplemental information below is presented according to internal management reporting, based on the proportionate consolidation method. Proportionate consolidation method implies full consolidation for subsidiaries, and consolidation of 50% of the comprehensive income and financial position for the joint ventures.
| Financial Report Q4 2017DOF SUBSEA
27
Amounts in NOK million
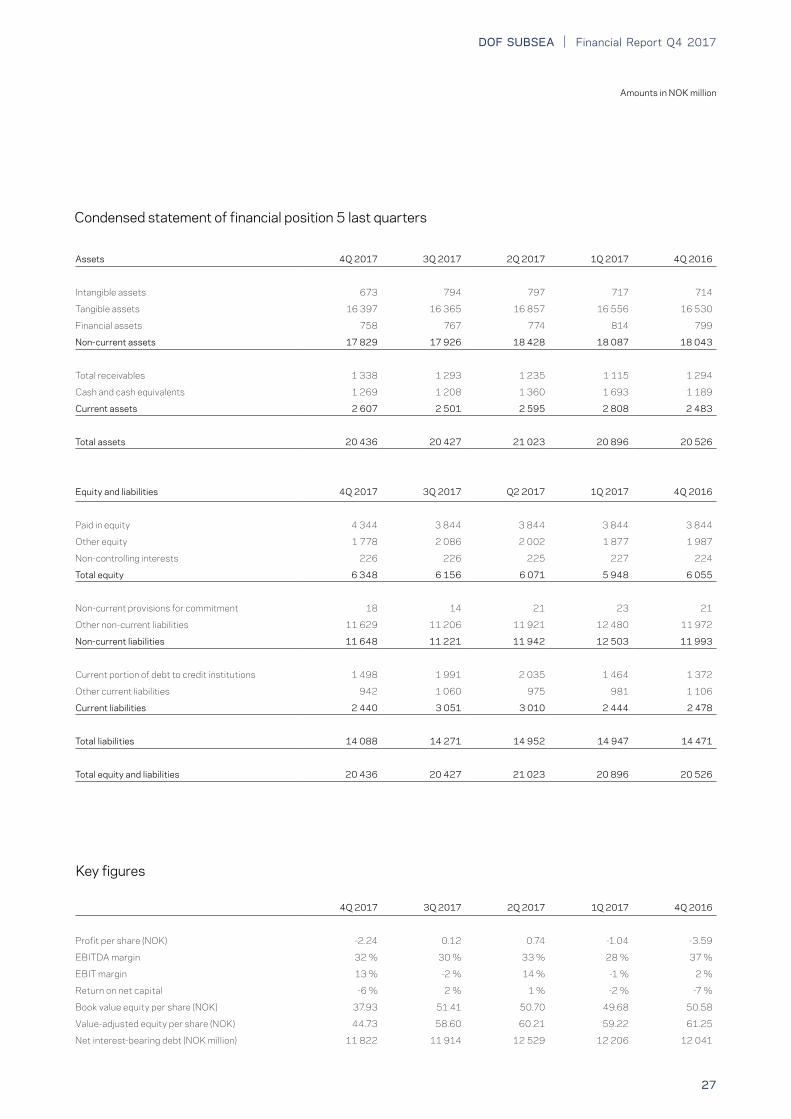
Condensed statement of financial position 5 last quarters
Assets 4Q 2017 3Q 2017 2Q 2017 1Q 2017 4Q 2016
Intangible assets 673 794 797 717 714
Tangible assets 16 397 16 365 16 857 16 556 16 530
Financial assets 758 767 774 814 799
Non-current assets 17 829 17 926 18 428 18 087 18 043
Total receivables 1 338 1 293 1 235 1 115 1 294
Cash and cash equivalents 1 269 1 208 1 360 1 693 1 189
Current assets 2 607 2 501 2 595 2 808 2 483
Total assets 20 436 20 427 21 023 20 896 20 526
Equity and liabilities 4Q 2017 3Q 2017 Q2 2017 1Q 2017 4Q 2016
Paid in equity 4 344 3 844 3 844 3 844 3 844
Other equity 1 778 2 086 2 002 1 877 1 987
Non-controlling interests 226 226 225 227 224
Total equity 6 348 6 156 6 071 5 948 6 055
Non-current provisions for commitment 18 14 21 23 21
Other non-current liabilities 11 629 11 206 11 921 12 480 11 972
Non-current liabilities 11 648 11 221 11 942 12 503 11 993
Current portion of debt to credit institutions 1 498 1 991 2 035 1 464 1 372
Other current liabilities 942 1 060 975 981 1 106
Current liabilities 2 440 3 051 3 010 2 444 2 478
Total liabilities 14 088 14 271 14 952 14 947 14 471
Total equity and liabilities 20 436 20 427 21 023 20 896 20 526
Key figures
4Q 2017 3Q 2017 2Q 2017 1Q 2017 4Q 2016
Profit per share (NOK) -2.24 0.12 0.74 -1.04 -3.59
EBITDA margin 32 % 30 % 33 % 28 % 37 %
EBIT margin 13 % -2 % 14 % -1 % 2 %
Return on net capital -6 % 2 % 1 % -2 % -7 %
Book value equity per share (NOK) 37.93 51.41 50.70 49.68 50.58
Value-adjusted equity per share (NOK) 44.73 58.60 60.21 59.22 61.25
Net interest-bearing debt (NOK million) 11 822 11 914 12 529 12 206 12 041
Financial Report Q4 2017 | DOF SUBSEA
28
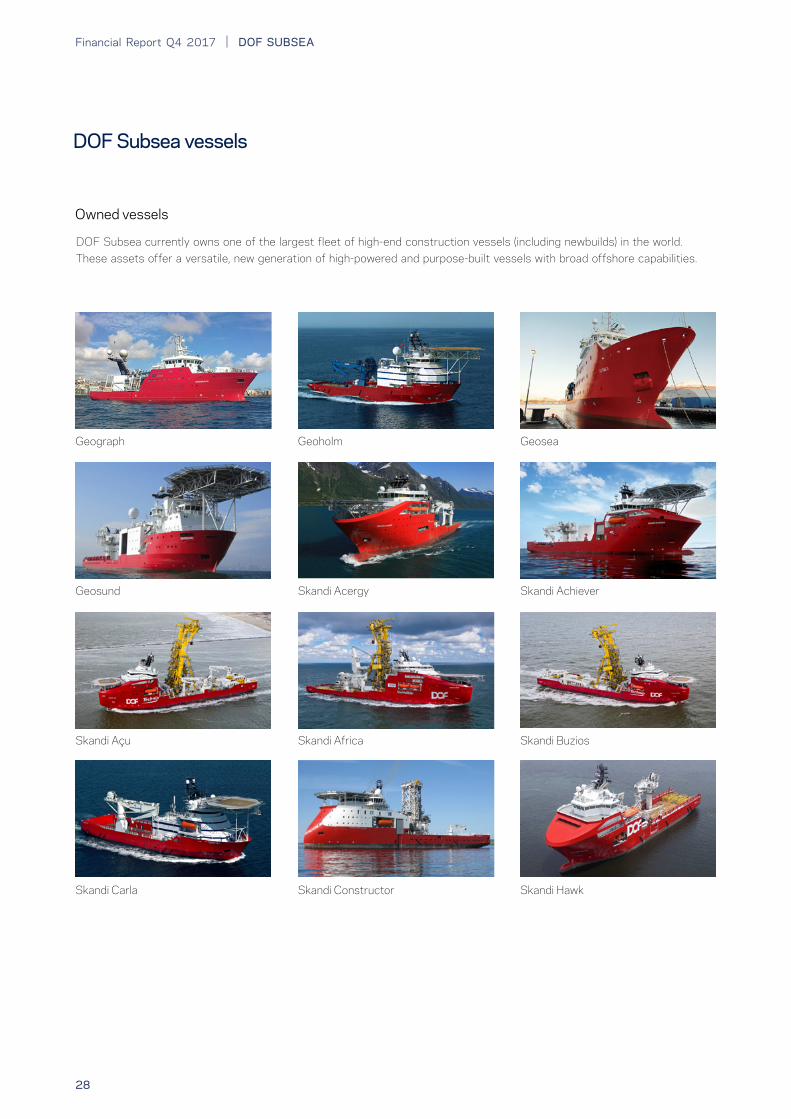
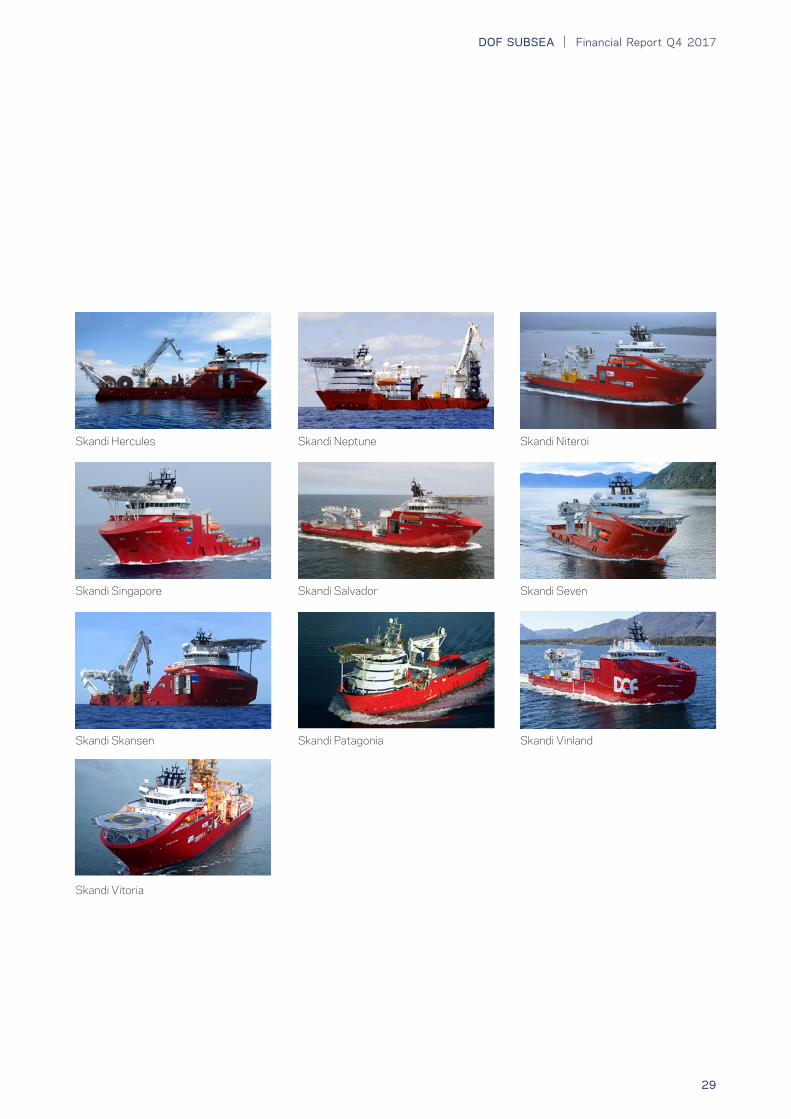
DOF Subsea currently owns one of the largest fleet of high-end construction vessels (including newbuilds) in the world. These assets offer a versatile, new generation of high-powered and purpose-built vessels with broad offshore capabilities.
Owned vessels
Skandi Acergy
Geograph Geoholm Geosea
Geosund
Skandi Carla Skandi Constructor
Skandi Achiever
Skandi Hawk
Skandi Africa Skandi BuziosSkandi Açu
DOF Subsea vessels
| Financial Report Q4 2017DOF SUBSEA
29
Skandi Skansen Skandi Patagonia
Skandi Vitoria
Skandi Salvador Skandi SevenSkandi Singapore
Skandi Neptune Skandi NiteroiSkandi Hercules
Skandi Vinland

Financial Report Q4 2017 | DOF SUBSEA
30
Harvey Deep Sea
DOF Subsea invests in the next generations of vessels. An ambitious Newbuild program utilises new technology and smart engineering to ensure efficient and environmentally-friendly operations in the future.
Newbuilds in joint ventures and associated companies
Chartered-in vessels
DOF Subsea charters in vessels on short and long-term contracts based on operational needs, building greater flexibility and a complementary fleet mix to meet our clients’ subsea challenges.
Skandi Olinda Skandi Recife
Skandi ChieftainSkandi Darwin
DOF Subsea vessels (continued)
AUSTRALIA
DOF Subsea Australia Pty Ltd5th Floor, 181 St. Georges TcePerth, Wa 6000 AUSTRALIAPhone: +61 8 9278 8700Fax: +61 8 9278 8799
DOF Management Australia5th Floor, 181 St. Georges TcePerth, Wa 6000 AUSTRALIAPhone: +61 3 9556 5478Mobile: +61 418 430 939
BRAZIL
DOF Subsea Brasil Serviços LtdaRua Fiscal Juca, 330 Q: W2 – L: 0001 Loteamento Novo Cavaleiros Vale Encantado – Macaé/RJ BRAZIL - CEP 27933-450 Rio address: Rua Lauro Muller 116, 17 andar Torre do Rio Sul - Botafogo Rio de Janeiro, R.J. BRAZIL - CEP: 22290-160 Phone: +55 22 2123-0100 Fax: +55 22 2123-0199
CANADA
DOF Subsea Canada26 Allstone Street, Unit 2Mount Pearl, NewfoundlandCANADA, A1N 0A4Phone: +1 709 576 2033Fax: +1 709 576 2500
SINGAPORE
DOF Subsea Asia Pacific Pte Ltd460 Alexandra Road# 15-02PSA Building, 119963SINGAPOREPhone: +65 6561 2780Fax: +65 6561 2431
GLOBAL HQ
DOF Subsea ASThormøhlensgate 53 C5006 Bergen NORWAYPhone: +47 55 25 22 00Fax: +47 55 25 22 01
NORWAY
DOF Subsea Norway ASThormøhlensgate 53 C5006 Bergen NORWAYPhone: +47 55 25 22 00Fax: +47 55 25 22 01
SEMAR ASOksenøystein 121366 Lysaker NORWAYPhone: +47 67 12 40 06Fax: +47 67 12 40 06
DOF Management ASAlfabygget5392 StorebøNORWAY
Thormøhlensgate 53 C5006 Bergen NORWAYPhone: +47 56 18 10 00Fax: +47 56 18 10 06
ANGOLA
DOF Subsea AngolaBelas Business Park-Talatona Edificio Bengo, 1º AndarSala 106/107, LuandaRepublic of AngolaPhone: +244 222 43 28 58Fax: +244 222 44 40 68Mobile: +244 227 28 00 96 +244 277 28 00 95
DOF Management Pte Ltd460 Alexandra Road# 15-02PSA Building, 119963SINGAPOREPhone: +65 6868 1001Fax: +65 6561 2431
UNITED KINGDOM
DOF Subsea UK LtdHorizons House, 81-83 Waterloo Quay Aberdeen, AB11 5DE UNITED KINGDOMPhone: +44 1224 614 000Fax: +44 1224 614 001
DOF Subsea S&P UK LtdHorizons House, 81-83 Waterloo Quay Aberdeen, AB11 5DE UNITED KINGDOMPhone: +44 1224 614 000Fax: +44 1224 614 001
CSL EngineeringHorizons House, 81-83 Waterloo Quay Aberdeen, AB11 5DE UNITED KINGDOMPhone: +44 1224 285 566Fax: +44 1224 285 599
DOF (UK) LtdHorizons House, 81-83 Waterloo Quay Aberdeen, AB11 5DE UNITED KINGDOMPhone: +44 12 24 58 66 44Fax: +44 12 24 58 65 55
USA
DOF Subsea USA Inc5365 W. Sam Houston Parkway Suite 400, Houston, Texas 77041, USAPhone: +1 713 896 2500Fax: +1 713 726 5800
DOF Subsea ASThormøhlens gate 53 C
5006 BergenNORWAY
www.dofsubsea.com
Rep
ort
desi
gn: D
OF
Cor
pora
te C
omm
unic
atio
n D
epar
tmen
t