Embed Size (px)
Citation preview
1 | Investor Presentation | © 2017 Veeco Instruments Inc.
Investor Presentation August 2017
Veeco Instruments Inc.
2 | Investor Presentation | © 2017 Veeco Instruments Inc.
Safe Harbor
To the extent that this presentation discusses expectations or otherwise
makes statements about the future, such statements are forward-looking
and are subject to a number of risks and uncertainties that could cause
actual results to differ materially from the statements made.
These items include the risk factors discussed in the Business Description
and Management's Discussion and Analysis sections of Veeco's Annual
Report on Form 10-K for the year ended December 31, 2016 and
subsequent Quarterly Reports on Form 10-Q and current reports on Form
8-K. Veeco does not undertake any obligation to update any forward-
looking statements to reflect future events or circumstances after the date
of such statements.
3 | Investor Presentation | © 2017 Veeco Instruments Inc.
Investment Highlights
> Market Leader in Advanced Thin Film
Process Technologies
> Broad Base of Blue Chip Customers
Across Range of Attractive End
Markets
> Cutting-Edge Systems with Focus on
High-Growth Markets
> Well Positioned for Growth Given
Positive End Market Dynamics &
Pending Ultratech Acquisition
> Experienced Leadership Team with
Track Record of Solid Operational
Execution
4 | Investor Presentation | © 2017 Veeco Instruments Inc.
Confidential
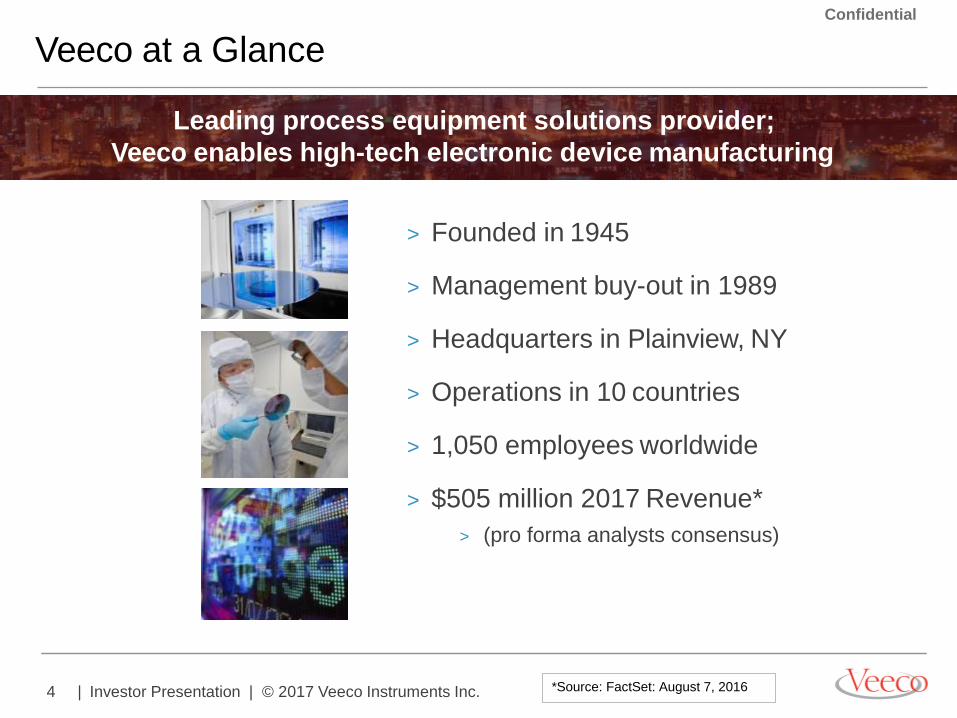
Veeco at a Glance
Leading process equipment solutions provider;
Veeco enables high-tech electronic device manufacturing
> Founded in 1945
> Management buy-out in 1989
> Headquarters in Plainview, NY
> Operations in 10 countries
> 1,050 employees worldwide
> $505 million 2017 Revenue*
> (pro forma analysts consensus)
*Source: FactSet: August 7, 2016
5 | Investor Presentation | © 2017 Veeco Instruments Inc.
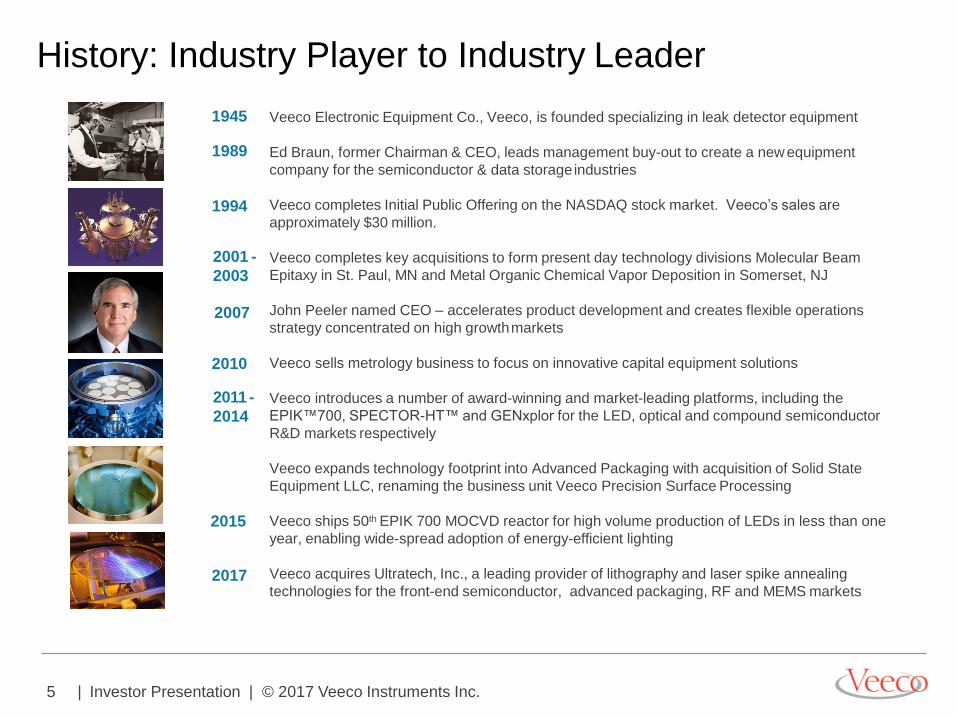
History: Industry Player to Industry Leader
Veeco Electronic Equipment Co., Veeco, is founded specializing in leak detector equipment
Ed Braun, former Chairman & CEO, leads management buy-out to create a new equipment
company for the semiconductor & data storage industries
Veeco completes Initial Public Offering on the NASDAQ stock market. Veeco’s sales are
approximately $30 million.
Veeco completes key acquisitions to form present day technology divisions Molecular Beam
Epitaxy in St. Paul, MN and Metal Organic Chemical Vapor Deposition in Somerset, NJ
John Peeler named CEO – accelerates product development and creates flexible operations
strategy concentrated on high growth markets
Veeco sells metrology business to focus on innovative capital equipment solutions
Veeco introduces a number of award-winning and market-leading platforms, including the
EPIK™700, SPECTOR-HT™ and GENxplor for the LED, optical and compound semiconductor
R&D markets respectively
Veeco expands technology footprint into Advanced Packaging with acquisition of Solid State
Equipment LLC, renaming the business unit Veeco Precision Surface Processing
Veeco ships 50th EPIK 700 MOCVD reactor for high volume production of LEDs in less than one
year, enabling wide-spread adoption of energy-efficient lighting
Veeco acquires Ultratech, Inc., a leading provider of lithography and laser spike annealing
technologies for the front-end semiconductor, advanced packaging, RF and MEMS markets
1945
1989
2015
2001 -
2003
1994
2007
2010
2011 -
2014
2017
6 | Investor Presentation | © 2017 Veeco Instruments Inc.
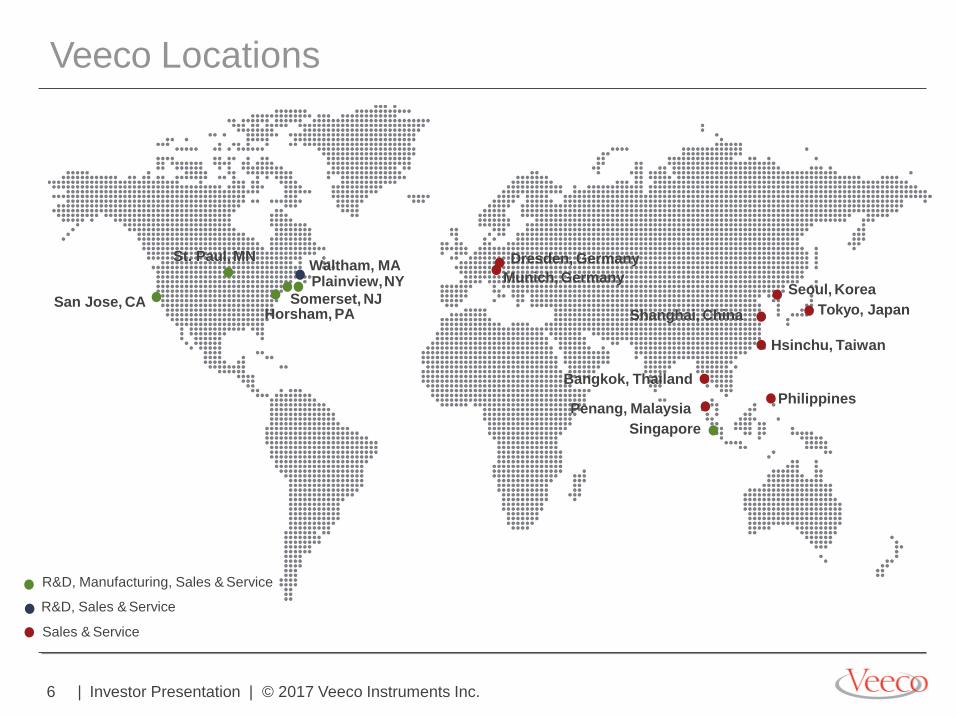
Veeco Locations
San Jose, CA
St. Paul, MN
Shanghai, China
Hsinchu, Taiwan
Philippines
Bangkok, Thailand
Penang, Malaysia
Singapore
Seoul, Korea
Tokyo, Japan Horsham, PA
Waltham, MA Plainview, NY
Somerset, NJ
Dresden, Germany
Munich, Germany
R&D, Manufacturing, Sales & Service
R&D, Sales & Service
Sales & Service
7 | Investor Presentation | © 2017 Veeco Instruments Inc.
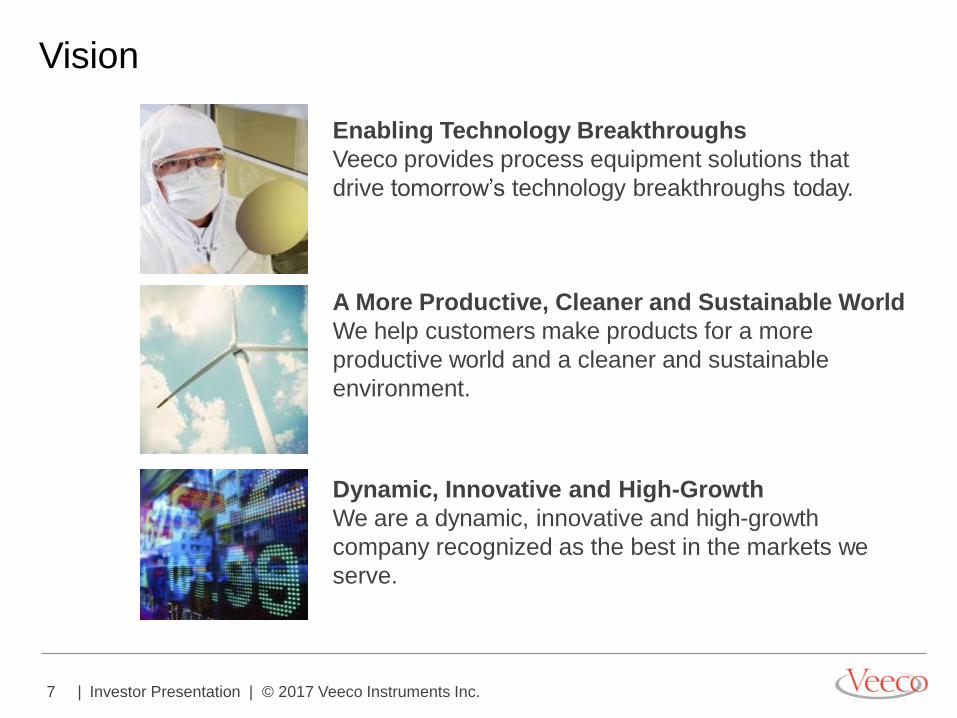
Enabling Technology Breakthroughs
Veeco provides process equipment solutions that
drive tomorrow’s technology breakthroughs today.
Vision
A More Productive, Cleaner and Sustainable World
We help customers make products for a more
productive world and a cleaner and sustainable
environment.
Dynamic, Innovative and High-Growth
We are a dynamic, innovative and high-growth
company recognized as the best in the markets we
serve.
8 | Investor Presentation | © 2017 Veeco Instruments Inc.
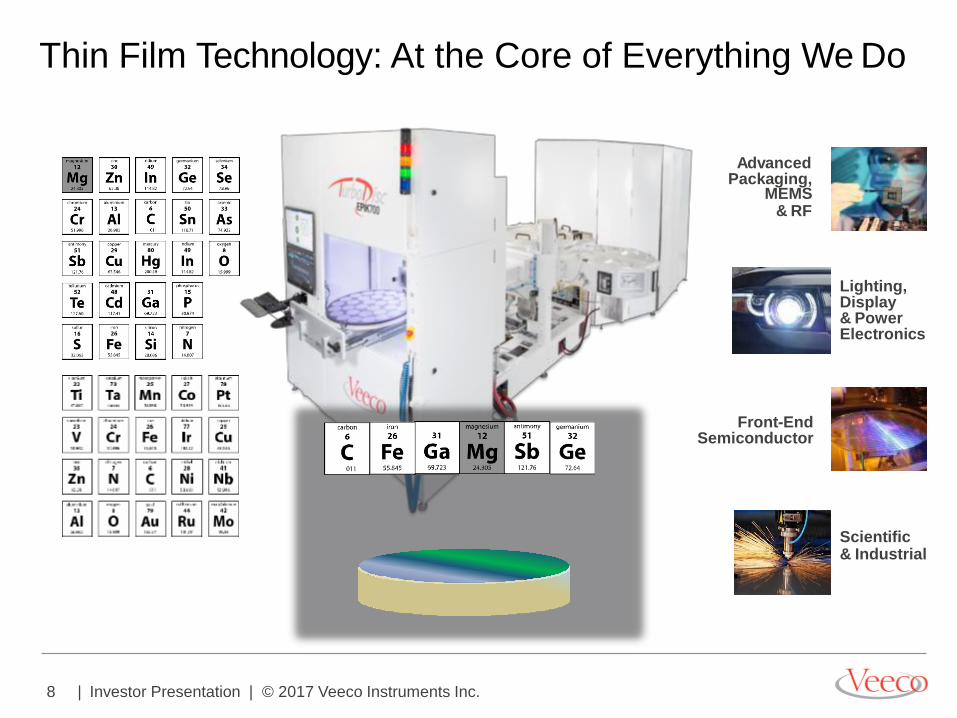
Thin Film Technology: At the Core of Everything We Do
Lighting, Display & Power Electronics
Advanced Packaging,
MEMS & RF
Scientific & Industrial
Front-End Semiconductor
9 | Investor Presentation | © 2017 Veeco Instruments Inc.
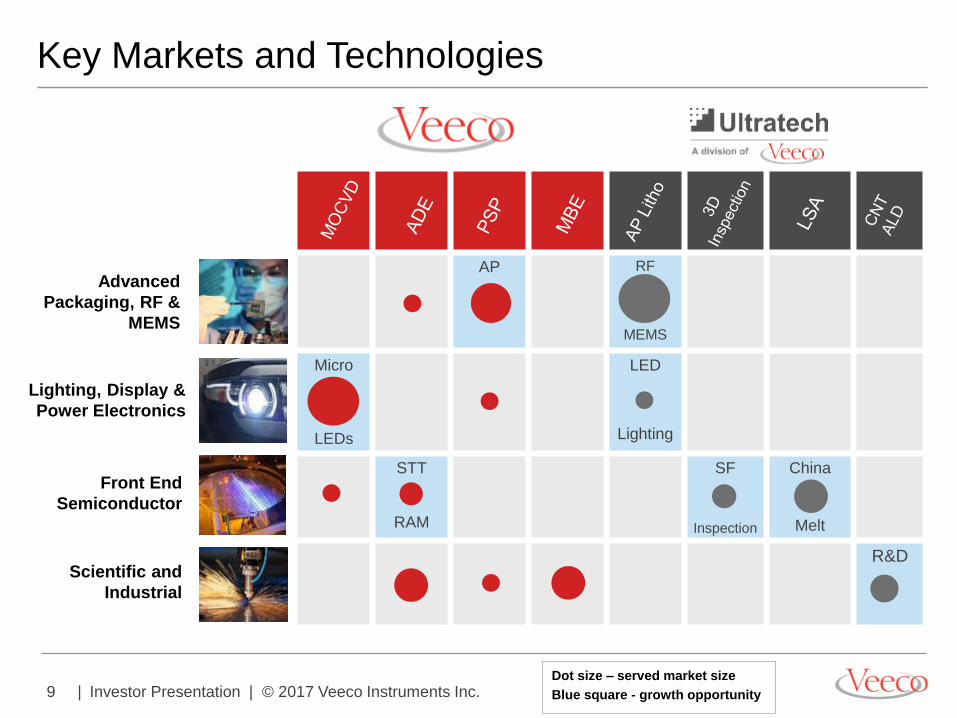
Key Markets and Technologies
AP RF
MEMS
Micro
LEDs
LED
Lighting
STT
RAM
SF
Inspection
China
Melt
R&D
Lighting, Display &
Power Electronics
Advanced
Packaging, RF &
MEMS
Front End
Semiconductor
Scientific and
Industrial
Dot size – served market size
Blue square - growth opportunity
10 | Investor Presentation | © 2017 Veeco Instruments Inc.
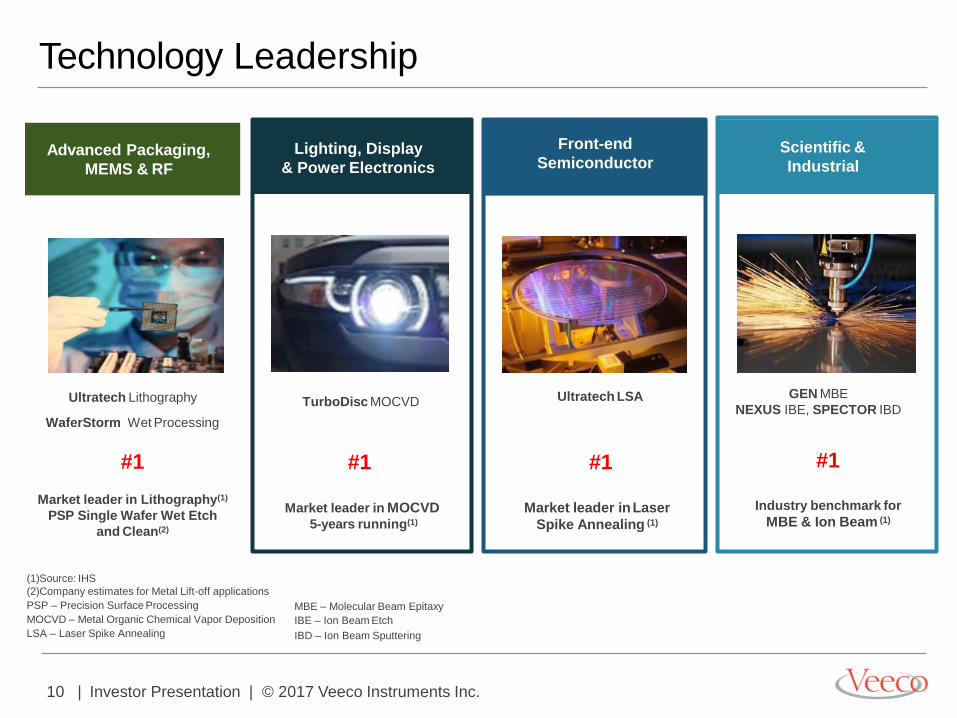
Technology Leadership
(1)Source: IHS
(2)Company estimates for Metal Lift-off applications
PSP – Precision Surface Processing
MOCVD – Metal Organic Chemical Vapor Deposition
LSA – Laser Spike Annealing
Lighting, Display
& Power Electronics
Front-end
Semiconductor
Scientific &
Industrial
TurboDisc MOCVD
#1 Market leader in MOCVD
5-years running(1)
Ultratech LSA
#1 Market leader in Laser
Spike Annealing (1)
GEN MBE
NEXUS IBE, SPECTOR IBD
#1 Industry benchmark for
MBE & Ion Beam (1)
MBE – Molecular Beam Epitaxy
IBE – Ion Beam Etch
IBD – Ion Beam Sputtering
Advanced Packaging,
MEMS & RF
Ultratech Lithography
WaferStorm Wet Processing
#1
Market leader in Lithography(1)
PSP Single Wafer Wet Etch
and Clean(2)
11 | Investor Presentation | © 2017 Veeco Instruments Inc.
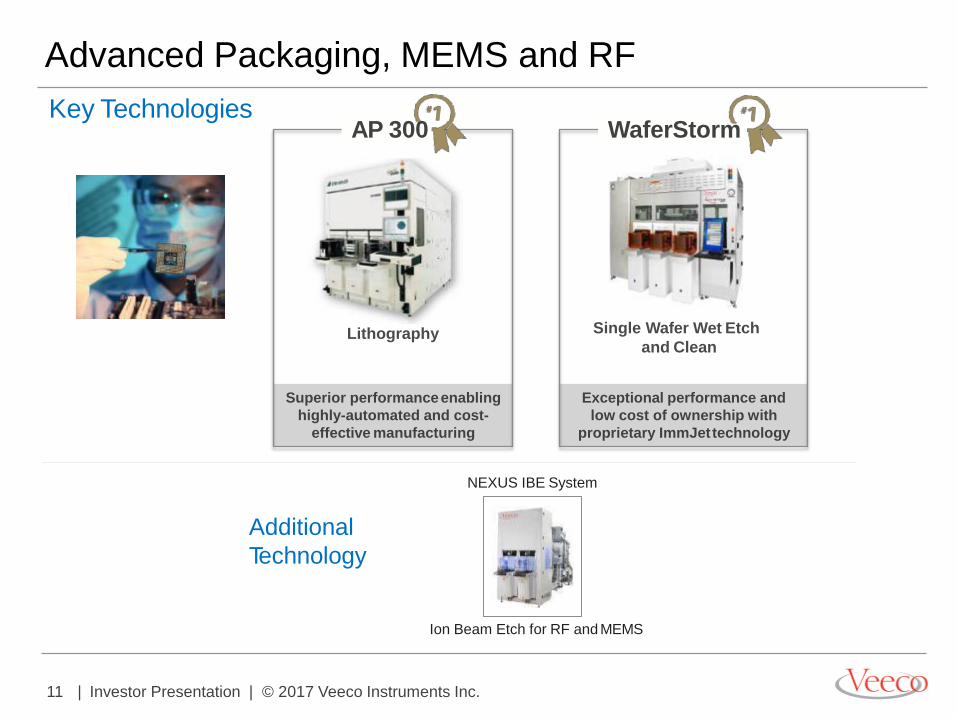
Exceptional performance and
low cost of ownership with
proprietary ImmJet technology
Superior performance enabling
highly-automated and cost-
effective manufacturing
Advanced Packaging, MEMS and RF
Ion Beam Etch for RF and MEMS
AP 300
Lithography Single Wafer Wet Etch
and Clean
WaferStorm
Additional
Technology
Key Technologies
NEXUS IBE System
12 | Investor Presentation | © 2017 Veeco Instruments Inc.
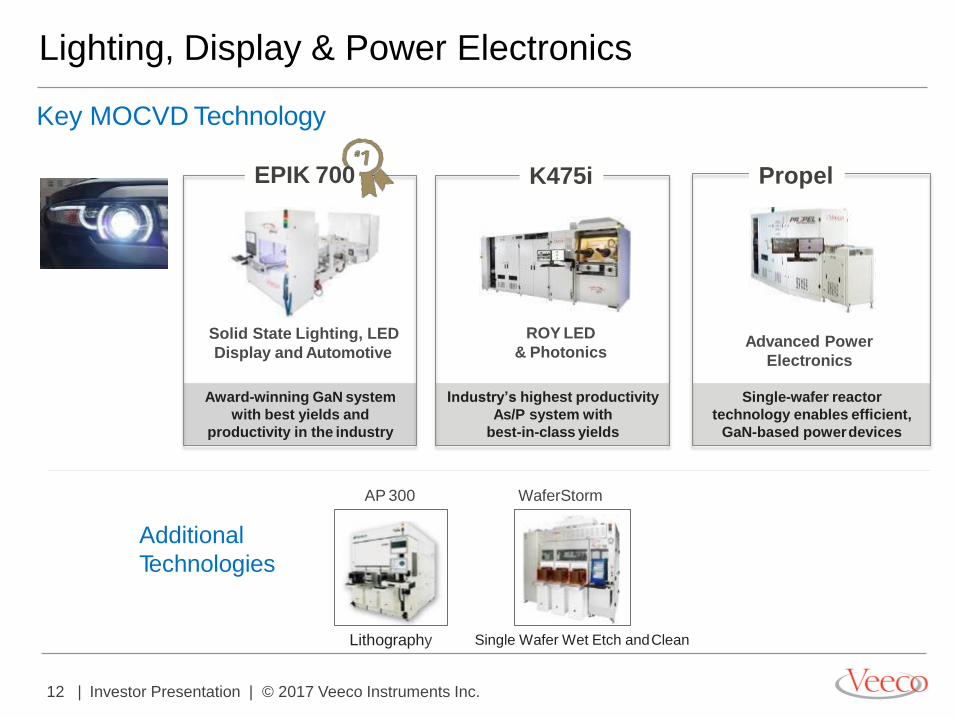
Single-wafer reactor
technology enables efficient,
GaN-based power devices
Industry’s highest productivity
As/P system with
best-in-class yields
Award-winning GaN system
with best yields and
productivity in the industry
Lighting, Display & Power Electronics
Single Wafer Wet Etch and Clean Lithography
Propel
Advanced Power
Electronics
K475i EPIK 700
Solid State Lighting, LED
Display and Automotive
ROY LED
& Photonics
AP 300 WaferStorm
Key MOCVD Technology
Additional
Technologies
13 | Investor Presentation | © 2017 Veeco Instruments Inc.
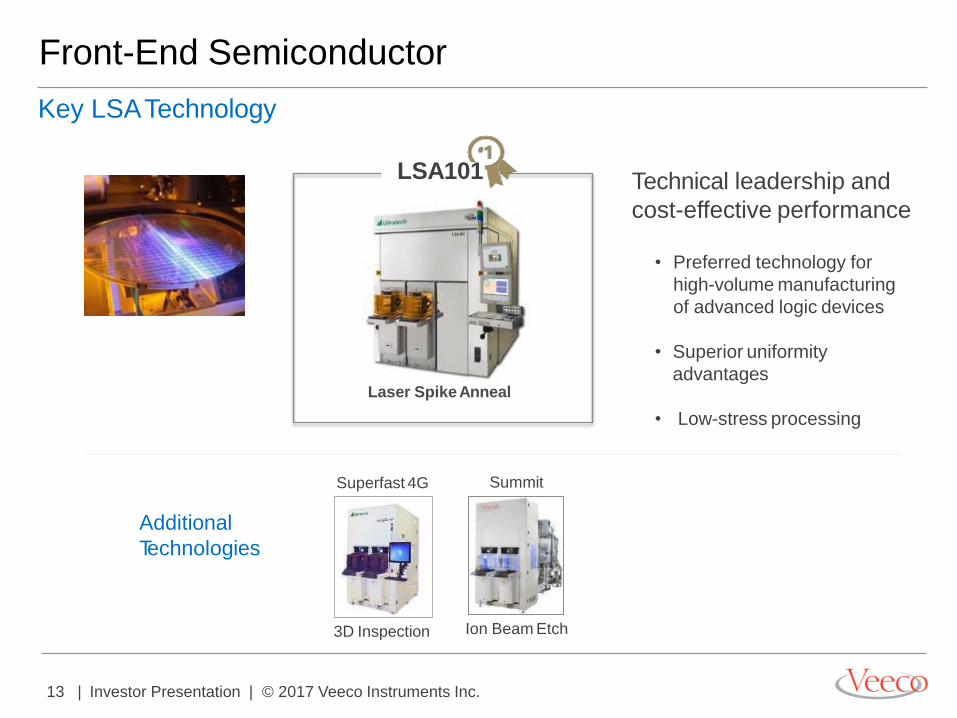
Front-End Semiconductor
LSA101
Laser Spike Anneal
Ion Beam Etch
Additional
Technologies
Key LSA Technology
3D Inspection
Summit Superfast 4G
• Preferred technology for
high-volume manufacturing
of advanced logic devices
• Superior uniformity
advantages
• Low-stress processing
Technical leadership and
cost-effective performance
14 | Investor Presentation | © 2017 Veeco Instruments Inc.
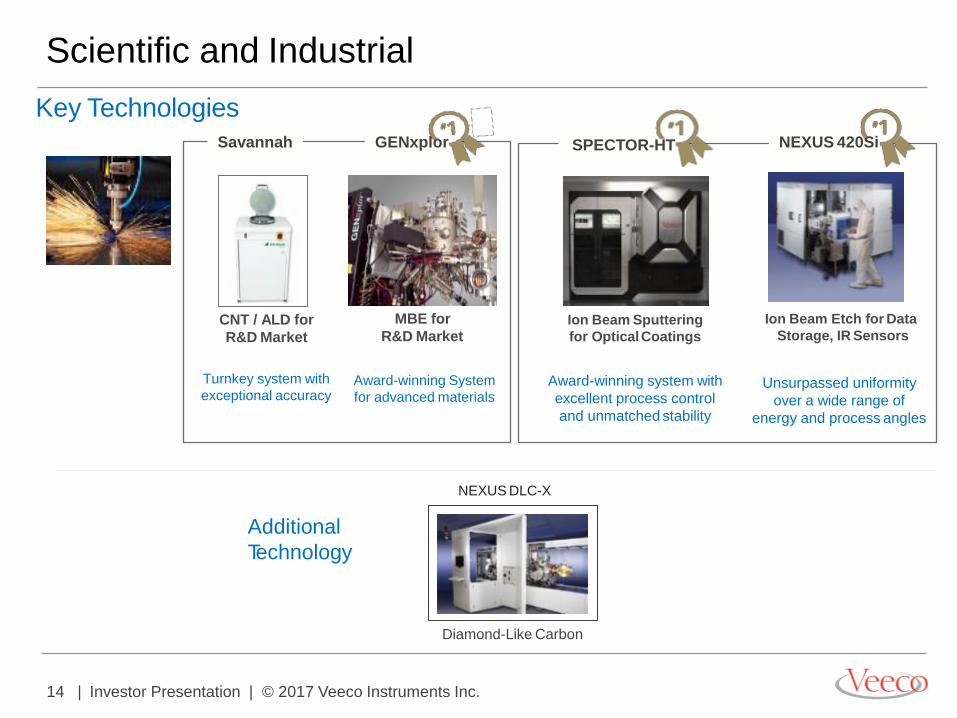
Scientific and Industrial
Diamond-Like Carbon
Ion Beam Etch for Data
Storage, IR Sensors Ion Beam Sputtering
for Optical Coatings
MBE for
R&D Market
Key Technologies
Additional
Technology
GENxplor
CNT / ALD for
R&D Market
NEXUS DLC-X
NEXUS 420Si SPECTOR-HT Savannah
Turnkey system with
exceptional accuracy Award-winning System
for advanced materials Award-winning system with
excellent process control
and unmatched stability
Unsurpassed uniformity
over a wide range of
energy and process angles
15 | Investor Presentation | © 2017 Veeco Instruments Inc.
Competitive Advantages
> Industry leader with exceptional technology, over 1500
patents and systems with lowest cost of ownership
> Decades of expertise in depositing and etching complex
thin film technologies for high-tech electronics
> Innovator in advanced packaging lithography and laser
annealing for advanced semiconductor devices
> Global presence, world-class sales channel and local
process
> engineering to reach and support customers worldwide
> Outsourced and internal manufacturing capability for
maximum production flexibility
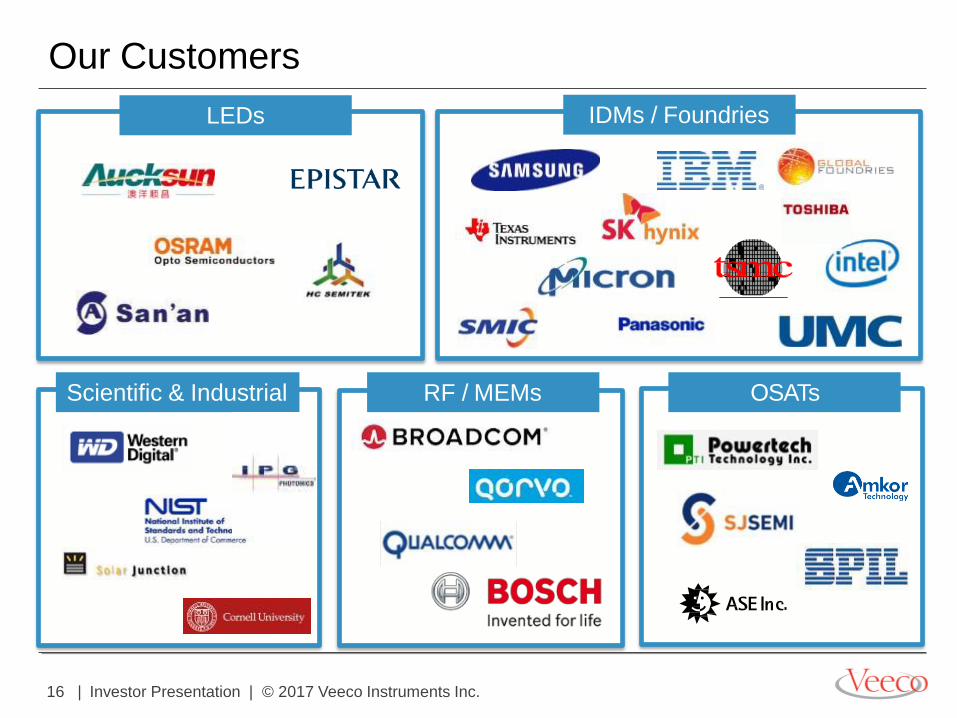
16 | Investor Presentation | © 2017 Veeco Instruments Inc.
Our Customers
LEDs IDMs / Foundries
Scientific & Industrial RF / MEMs OSATs
17 | Investor Presentation | © 2017 Veeco Instruments Inc.
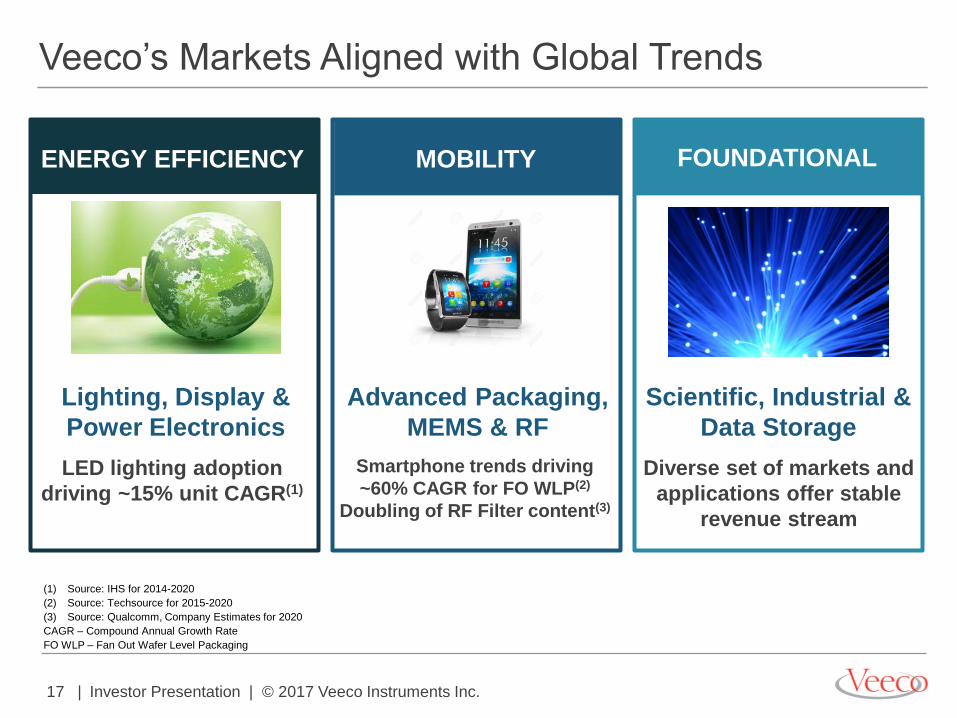
Veeco’s Markets Aligned with Global Trends
Lighting, Display &
Power Electronics
Advanced Packaging,
MEMS & RF
Scientific, Industrial &
Data Storage
ENERGY EFFICIENCY MOBILITY FOUNDATIONAL
Smartphone trends driving
~60% CAGR for FO WLP(2)
Doubling of RF Filter content(3)
(1) Source: IHS for 2014-2020
(2) Source: Techsource for 2015-2020
(3) Source: Qualcomm, Company Estimates for 2020
CAGR – Compound Annual Growth Rate
FO WLP – Fan Out Wafer Level Packaging
LED lighting adoption
driving ~15% unit CAGR(1)
Diverse set of markets and
applications offer stable
revenue stream
18 | Investor Presentation | © 2017 Veeco Instruments Inc.
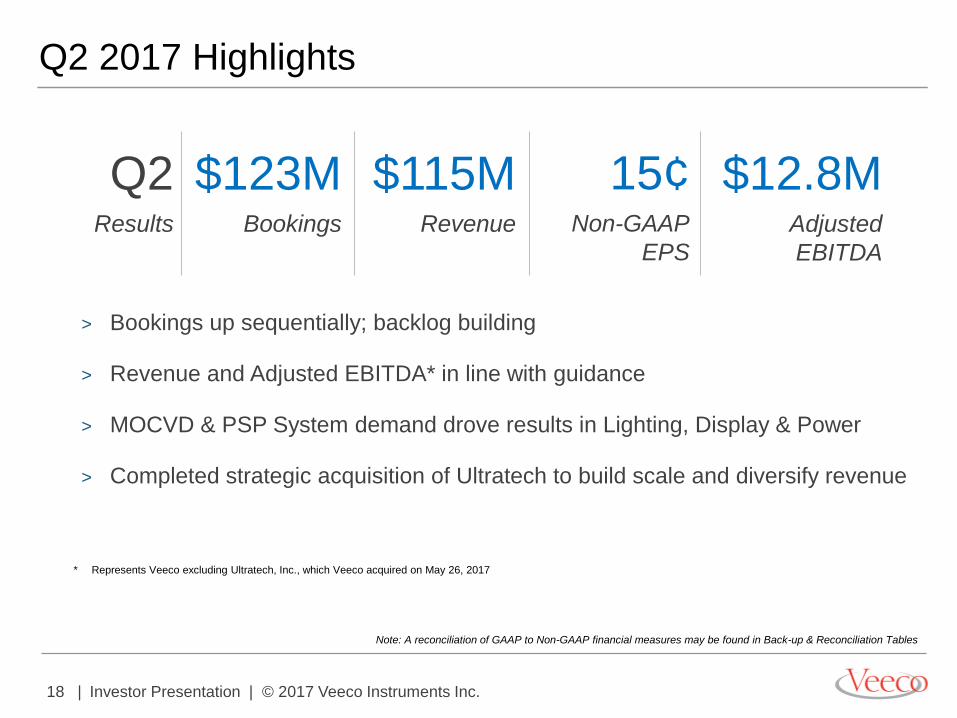
* Represents Veeco excluding Ultratech, Inc., which Veeco acquired on May 26, 2017
15¢ Non-GAAP
EPS
$115M Revenue
Q2 2017 Highlights
> Bookings up sequentially; backlog building
> Revenue and Adjusted EBITDA* in line with guidance
> MOCVD & PSP System demand drove results in Lighting, Display & Power
> Completed strategic acquisition of Ultratech to build scale and diversify revenue
$123M Bookings
Q2 Results
$12.8M Adjusted
EBITDA
Note: A reconciliation of GAAP to Non-GAAP financial measures may be found in Back-up & Reconciliation Tables
19 | Investor Presentation | © 2017 Veeco Instruments Inc.
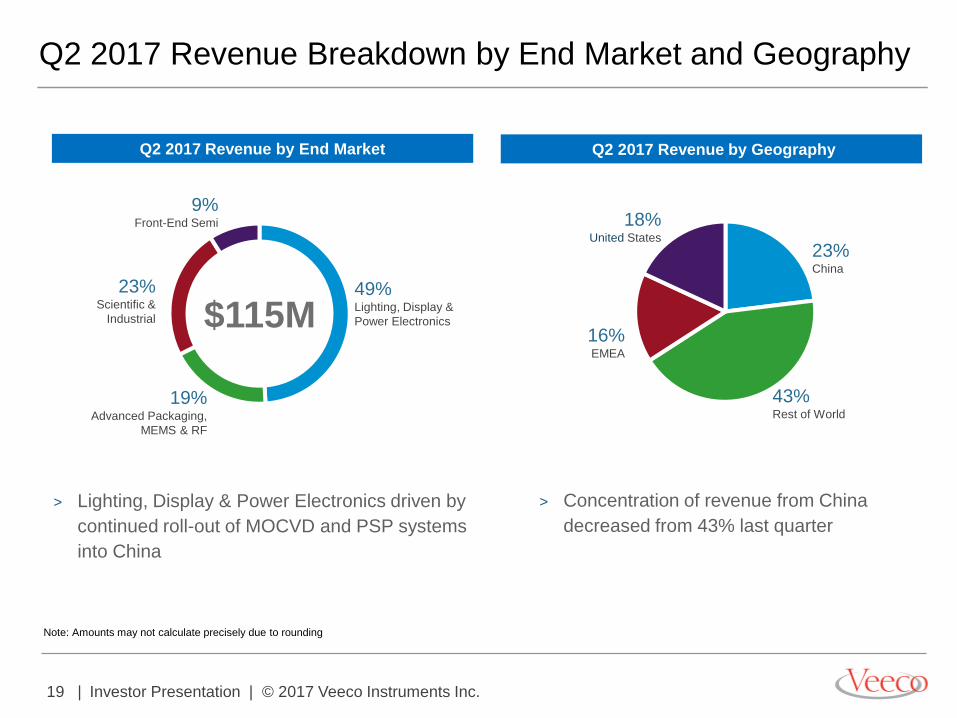
Q2 2017 Revenue Breakdown by End Market and Geography
> Lighting, Display & Power Electronics driven by
continued roll-out of MOCVD and PSP systems
into China
Q2 2017 Revenue by End Market Q2 2017 Revenue by Geography
Note: Amounts may not calculate precisely due to rounding
19% Advanced Packaging,
MEMS & RF
9% Front-End Semi
49% Lighting, Display &
Power Electronics $115M
43% Rest of World
23% China
16% EMEA
18% United States
23% Scientific &
Industrial
> Concentration of revenue from China
decreased from 43% last quarter
20 | Investor Presentation | © 2017 Veeco Instruments Inc.
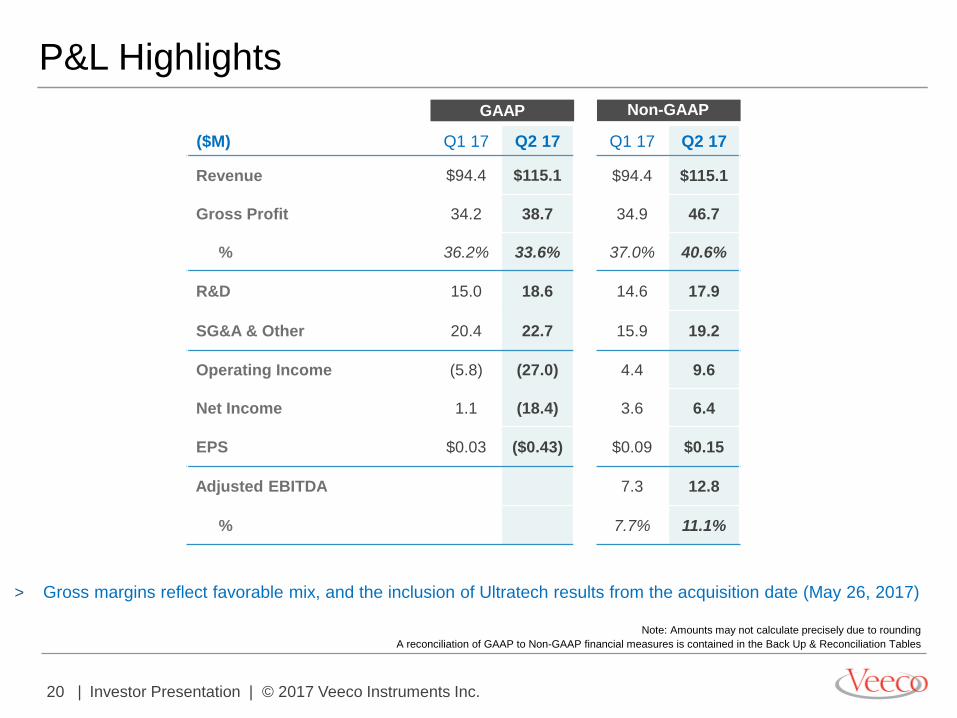
P&L Highlights
($M) Q1 17 Q2 17 Q1 17 Q2 17
Revenue $94.4 $115.1 $94.4 $115.1
Gross Profit 34.2 38.7 34.9 46.7
% 36.2% 33.6% 37.0% 40.6%
R&D 15.0 18.6 14.6 17.9
SG&A & Other 20.4 22.7 15.9 19.2
Operating Income (5.8) (27.0) 4.4 9.6
Net Income 1.1 (18.4) 3.6 6.4
EPS $0.03 ($0.43) $0.09 $0.15
Adjusted EBITDA 7.3 12.8
% 7.7% 11.1%
GAAP Non-GAAP
Note: Amounts may not calculate precisely due to rounding
A reconciliation of GAAP to Non-GAAP financial measures is contained in the Back Up & Reconciliation Tables
> Gross margins reflect favorable mix, and the inclusion of Ultratech results from the acquisition date (May 26, 2017)
21 | Investor Presentation | © 2017 Veeco Instruments Inc.
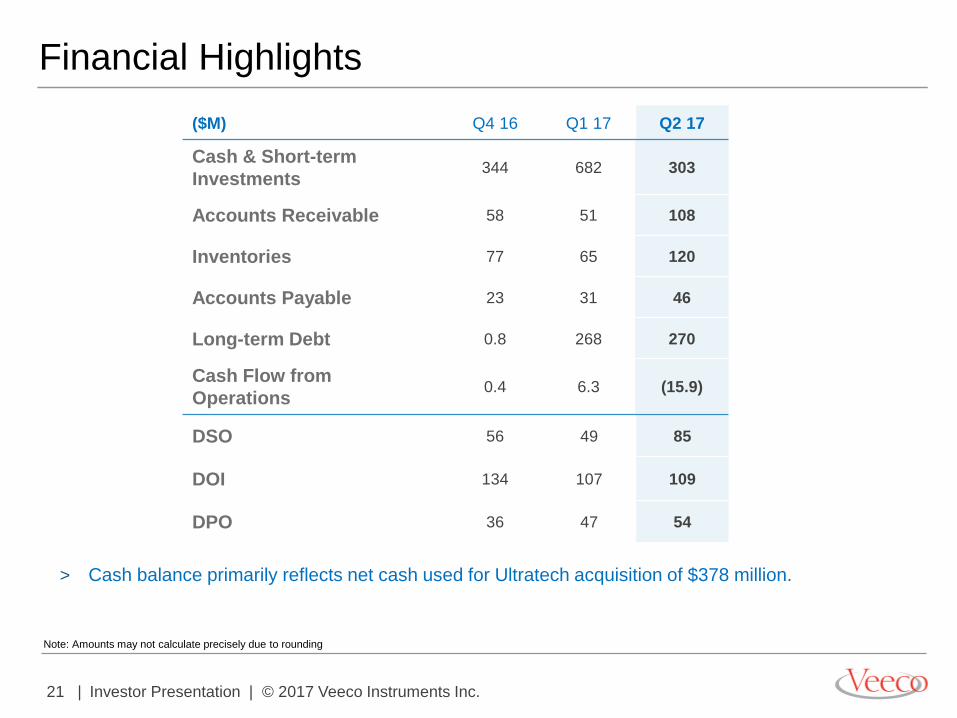
($M) Q4 16 Q1 17 Q2 17
Cash & Short-term
Investments 344 682 303
Accounts Receivable 58 51 108
Inventories 77 65 120
Accounts Payable 23 31 46
Long-term Debt 0.8 268 270
Cash Flow from
Operations 0.4 6.3 (15.9)
Financial Highlights
DSO 56 49 85
DOI 134 107 109
DPO 36 47 54
Note: Amounts may not calculate precisely due to rounding
> Cash balance primarily reflects net cash used for Ultratech acquisition of $378 million.
22 | Investor Presentation | © 2017 Veeco Instruments Inc.
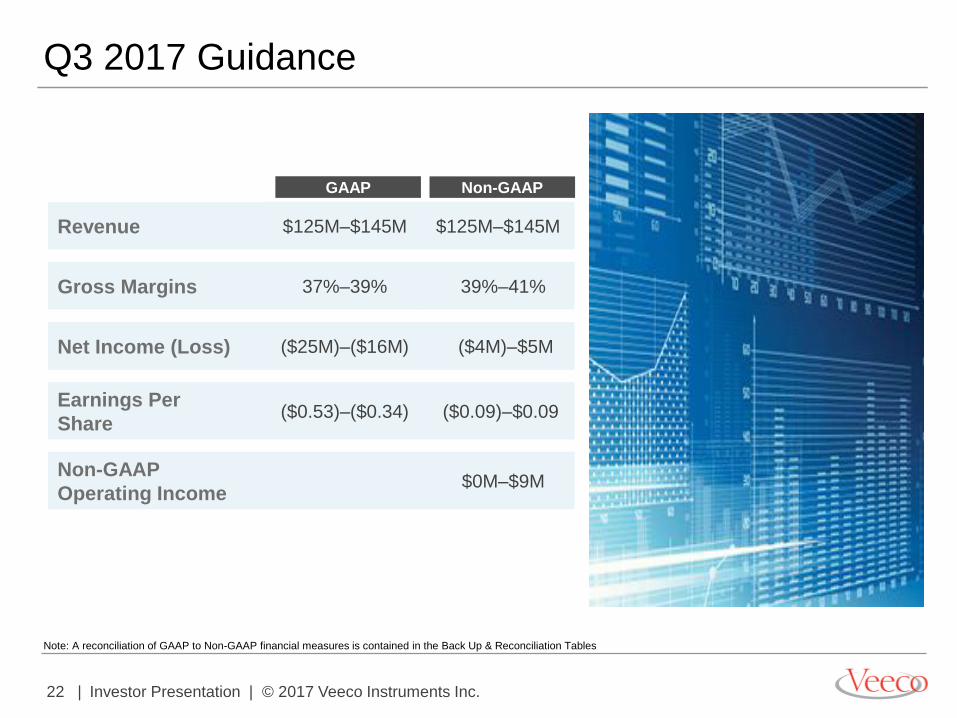
Q3 2017 Guidance
Revenue $125M–$145M $125M–$145M
Gross Margins 37%–39% 39%–41%
Net Income (Loss) ($25M)–($16M) ($4M)–$5M
Earnings Per
Share ($0.53)–($0.34) ($0.09)–$0.09
Non-GAAP
Operating Income $0M–$9M
Non-GAAP GAAP
Note: A reconciliation of GAAP to Non-GAAP financial measures is contained in the Back Up & Reconciliation Tables
23 | Investor Presentation | © 2017 Veeco Instruments Inc.
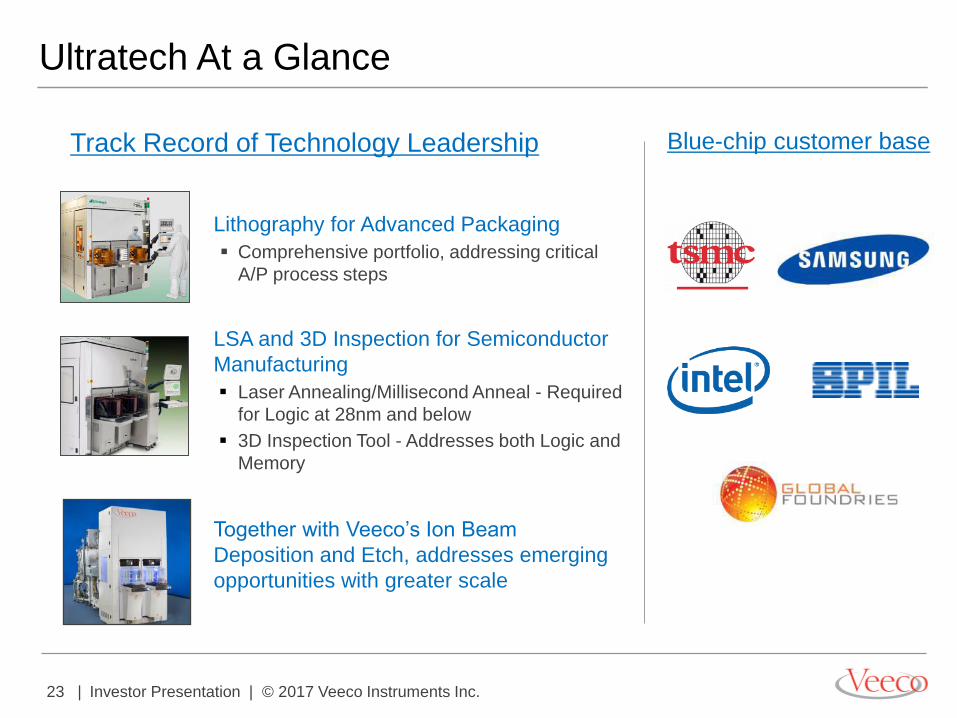
Ultratech At a Glance
Blue-chip customer base
Lithography for Advanced Packaging
Comprehensive portfolio, addressing critical
A/P process steps
Together with Veeco’s Ion Beam
Deposition and Etch, addresses emerging
opportunities with greater scale
LSA and 3D Inspection for Semiconductor
Manufacturing
Laser Annealing/Millisecond Anneal - Required
for Logic at 28nm and below
3D Inspection Tool - Addresses both Logic and
Memory
Track Record of Technology Leadership
24 | Investor Presentation | © 2017 Veeco Instruments Inc.
Ultratech Update – Integration on Track
Integration proceeding well
Key milestones achievable over next 18-24 months
ERP conversion
Field integration
Material cost reductions
Focused R&D projects
Synergies greater than originally anticipated
Acquisition Closed May 26, 2017
Platform to Deliver Enhanced Shareholder Value
Accelerates growth potential in Advanced Packaging
Expected to increase scale and diversify revenue
25 | Investor Presentation | © 2017 Veeco Instruments Inc.
Summary
2017 will be a transformative year for Veeco
Backlog building – expect stronger 2H
Ultratech integration on track
Veeco executing on strategy to increase scale,
diversify revenue and improve profitability
26 | Investor Presentation | © 2017 Veeco Instruments Inc.
Back Up &
Reconciliation
Tables
27 | Investor Presentation | © 2017 Veeco Instruments Inc.
Note On Reconciliation Tables
These tables include financial measures adjusted for the impact of certain items; these financial measures are
therefore not calculated in accordance with U.S. generally accepted accounting principles (“GAAP”). These Non-
GAAP financial measures exclude items such as: share-based compensation expense; charges relating to
restructuring initiatives; non-cash asset impairments; certain other non-operating gains and losses; and
acquisition-related items such as transaction costs, non-cash amortization of acquired intangible assets, and
incremental transaction-related compensation.
These Non-GAAP financial measures may be different from Non-GAAP financial measures used by other
companies. Non-GAAP financial measures should not be considered a substitute for, or superior to, measures of
financial performance prepared in accordance with GAAP. By excluding these items, Non-GAAP financial
measures are intended to facilitate meaningful comparisons to historical operating results, competitors' operating
results, and estimates made by securities analysts. Management is evaluated on key performance metrics
including Adjusted EBITDA and non-GAAP Operating Income, which is used to determine management incentive
compensation as well as to forecast future periods.
These Non-GAAP financial measures may be useful to investors in allowing for greater transparency of
supplemental information used by management in its financial and operational decision-making. In addition, similar
Non-GAAP financial measures have historically been reported to investors; the inclusion of comparable numbers
provides consistency in financial reporting. Investors are encouraged to review the reconciliation of the Non-GAAP
financial measures used in this news release to their most directly comparable GAAP financial measures.
28 | Investor Presentation | © 2017 Veeco Instruments Inc.
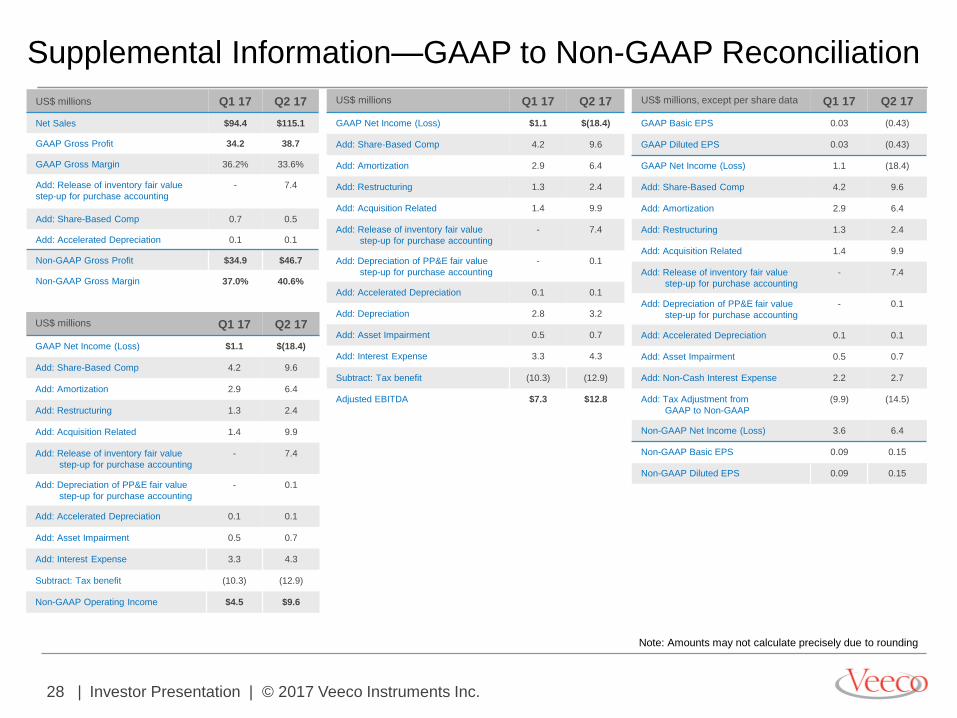
Supplemental Information—GAAP to Non-GAAP Reconciliation
US$ millions Q1 17 Q2 17
GAAP Net Income (Loss) $1.1 $(18.4)
Add: Share-Based Comp 4.2 9.6
Add: Amortization 2.9 6.4
Add: Restructuring 1.3 2.4
Add: Acquisition Related 1.4 9.9
Add: Release of inventory fair value
step-up for purchase accounting
- 7.4
Add: Depreciation of PP&E fair value
step-up for purchase accounting
- 0.1
Add: Accelerated Depreciation 0.1 0.1
Add: Depreciation 2.8 3.2
Add: Asset Impairment 0.5 0.7
Add: Interest Expense 3.3 4.3
Subtract: Tax benefit (10.3) (12.9)
Adjusted EBITDA $7.3 $12.8
Note: Amounts may not calculate precisely due to rounding
US$ millions Q1 17 Q2 17
Net Sales $94.4 $115.1
GAAP Gross Profit 34.2 38.7
GAAP Gross Margin 36.2% 33.6%
Add: Release of inventory fair value
step-up for purchase accounting
- 7.4
Add: Share-Based Comp 0.7 0.5
Add: Accelerated Depreciation 0.1 0.1
Non-GAAP Gross Profit $34.9 $46.7
Non-GAAP Gross Margin 37.0% 40.6%
US$ millions, except per share data Q1 17 Q2 17
GAAP Basic EPS 0.03 (0.43)
GAAP Diluted EPS 0.03 (0.43)
GAAP Net Income (Loss) 1.1 (18.4)
Add: Share-Based Comp 4.2 9.6
Add: Amortization 2.9 6.4
Add: Restructuring 1.3 2.4
Add: Acquisition Related 1.4 9.9
Add: Release of inventory fair value
step-up for purchase accounting
- 7.4
Add: Depreciation of PP&E fair value
step-up for purchase accounting
- 0.1
Add: Accelerated Depreciation 0.1 0.1
Add: Asset Impairment 0.5 0.7
Add: Non-Cash Interest Expense 2.2 2.7
Add: Tax Adjustment from
GAAP to Non-GAAP
(9.9) (14.5)
Non-GAAP Net Income (Loss) 3.6 6.4
Non-GAAP Basic EPS 0.09 0.15
Non-GAAP Diluted EPS 0.09 0.15
US$ millions Q1 17 Q2 17
GAAP Net Income (Loss) $1.1 $(18.4)
Add: Share-Based Comp 4.2 9.6
Add: Amortization 2.9 6.4
Add: Restructuring 1.3 2.4
Add: Acquisition Related 1.4 9.9
Add: Release of inventory fair value
step-up for purchase accounting
- 7.4
Add: Depreciation of PP&E fair value
step-up for purchase accounting
- 0.1
Add: Accelerated Depreciation 0.1 0.1
Add: Asset Impairment 0.5 0.7
Add: Interest Expense 3.3 4.3
Subtract: Tax benefit (10.3) (12.9)
Non-GAAP Operating Income $4.5 $9.6
29 | Investor Presentation | © 2017 Veeco Instruments Inc.
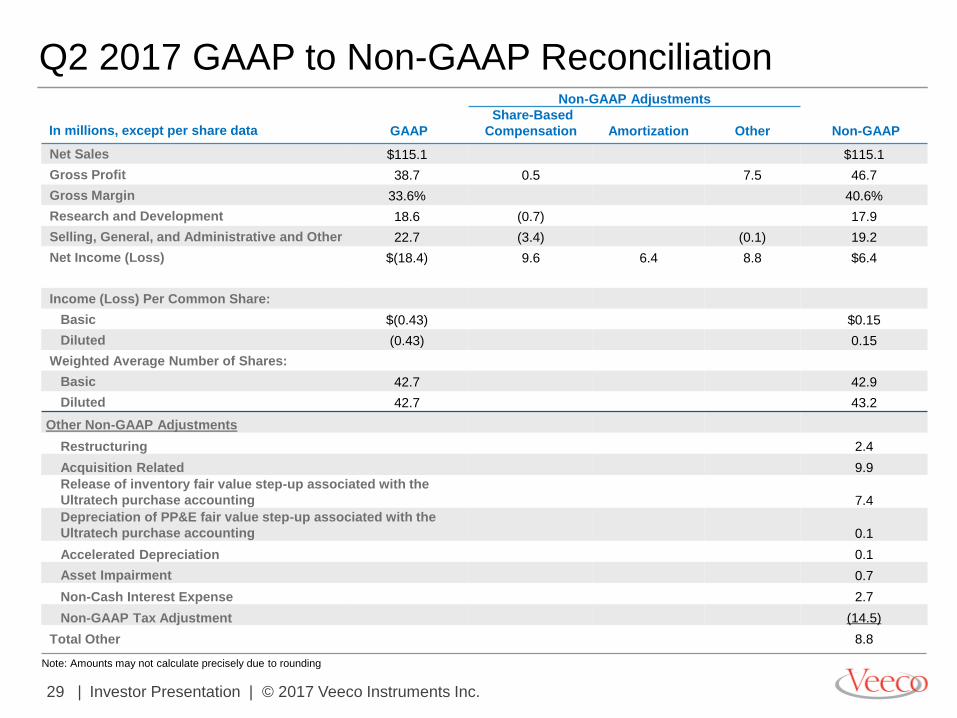
Q2 2017 GAAP to Non-GAAP Reconciliation Non-GAAP Adjustments
In millions, except per share data GAAP
Share-Based
Compensation
Amortization Other Non-GAAP
Net Sales $115.1 $115.1
Gross Profit 38.7 0.5 7.5 46.7
Gross Margin 33.6% 40.6%
Research and Development 18.6 (0.7) 17.9
Selling, General, and Administrative and Other 22.7 (3.4) (0.1) 19.2
Net Income (Loss) $(18.4) 9.6 6.4 8.8 $6.4
Income (Loss) Per Common Share:
Basic $(0.43) $0.15
Diluted (0.43) 0.15
Weighted Average Number of Shares:
Basic 42.7 42.9
Diluted 42.7 43.2
Other Non-GAAP Adjustments
Restructuring 2.4
Acquisition Related 9.9
Release of inventory fair value step-up associated with the
Ultratech purchase accounting 7.4
Depreciation of PP&E fair value step-up associated with the
Ultratech purchase accounting 0.1
Accelerated Depreciation 0.1
Asset Impairment 0.7
Non-Cash Interest Expense 2.7
Non-GAAP Tax Adjustment (14.5)
Total Other 8.8
Note: Amounts may not calculate precisely due to rounding
30 | Investor Presentation | © 2017 Veeco Instruments Inc.
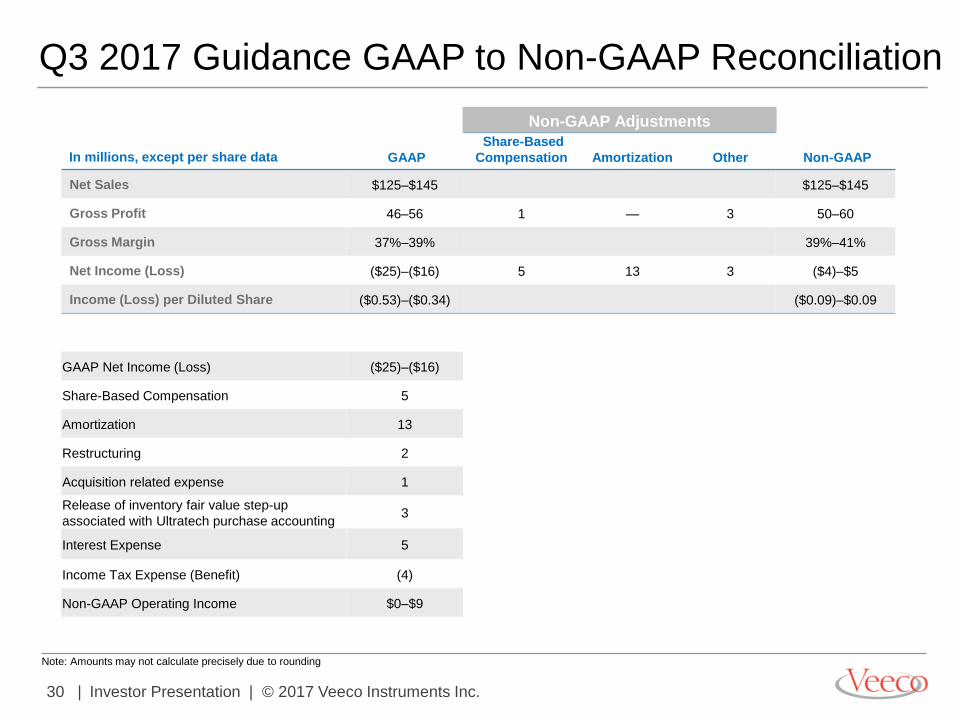
Q3 2017 Guidance GAAP to Non-GAAP Reconciliation
Non-GAAP Adjustments
In millions, except per share data GAAP
Share-Based
Compensation
Amortization Other Non-GAAP
Net Sales $125–$145 $125–$145
Gross Profit 46–56 1 — 3 50–60
Gross Margin 37%–39% 39%–41%
Net Income (Loss) ($25)–($16) 5 13 3 ($4)–$5
Income (Loss) per Diluted Share ($0.53)–($0.34) ($0.09)–$0.09
GAAP Net Income (Loss) ($25)–($16)
Share-Based Compensation 5
Amortization 13
Restructuring 2
Acquisition related expense 1
Release of inventory fair value step-up
associated with Ultratech purchase accounting 3
Interest Expense 5
Income Tax Expense (Benefit) (4)
Non-GAAP Operating Income $0–$9
Non-GAAP Adjustments
Note: Amounts may not calculate precisely due to rounding
31 | Investor Presentation | © 2017 Veeco Instruments Inc.
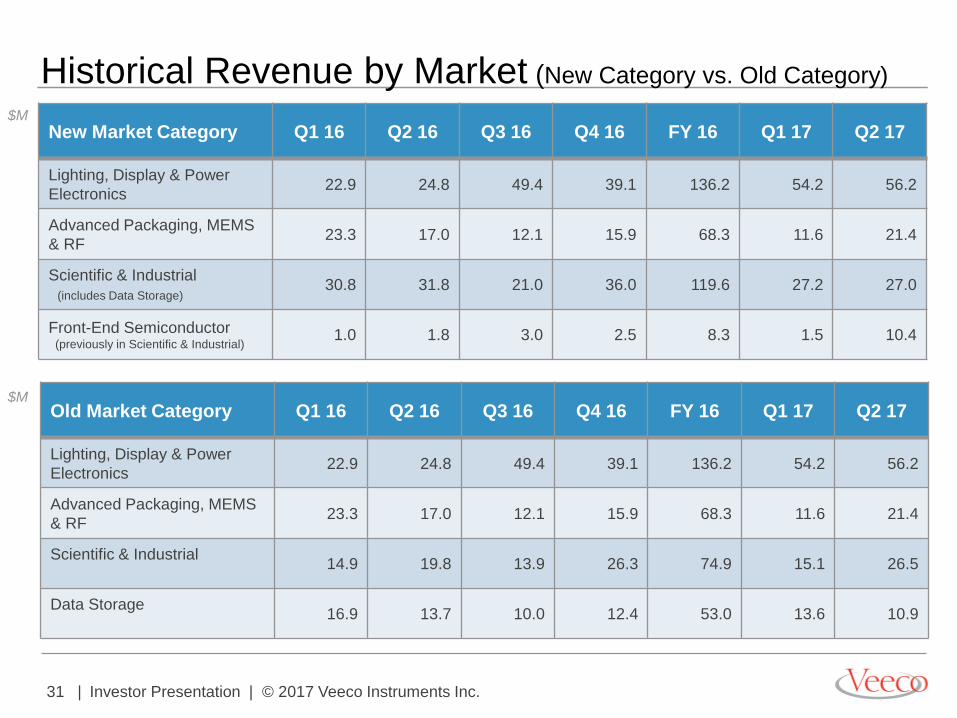
Historical Revenue by Market (New Category vs. Old Category)
New Market Category Q1 16 Q2 16 Q3 16 Q4 16 FY 16 Q1 17 Q2 17
Lighting, Display & Power
Electronics 22.9 24.8 49.4 39.1 136.2 54.2 56.2
Advanced Packaging, MEMS
& RF 23.3 17.0 12.1 15.9 68.3 11.6 21.4
Scientific & Industrial
(includes Data Storage) 30.8 31.8 21.0 36.0 119.6 27.2 27.0
Front-End Semiconductor (previously in Scientific & Industrial)
1.0 1.8 3.0 2.5 8.3 1.5 10.4
Old Market Category Q1 16 Q2 16 Q3 16 Q4 16 FY 16 Q1 17 Q2 17
Lighting, Display & Power
Electronics 22.9 24.8 49.4 39.1 136.2 54.2 56.2
Advanced Packaging, MEMS
& RF 23.3 17.0 12.1 15.9 68.3 11.6 21.4
Scientific & Industrial
14.9 19.8 13.9 26.3 74.9 15.1 26.5
Data Storage
16.9 13.7 10.0 12.4 53.0 13.6 10.9
$M
$M
32 | Investor Presentation | © 2017 Veeco Instruments Inc.