Embed Size (px)
Citation preview

1 | Investor Presentation March 2018 | Veeco Instruments Inc © 2018
Investor Presentation March 2018
Veeco Instruments Inc.
2 | Investor Presentation March 2018 | Veeco Instruments Inc © 2018
Safe Harbor
To the extent that this presentation discusses expectations or otherwise
makes statements about the future, such statements are forward-looking
and are subject to a number of risks and uncertainties that could cause
actual results to differ materially from the statements made.
These items include the risk factors discussed in the Business Description
and Management's Discussion and Analysis sections of Veeco's Annual
Report on Form 10-K for the year ended December 31, 2017 and
subsequent Quarterly Reports on form 10Q and current reports on Form
8-K. Veeco does not undertake any obligation to update any forward-
looking statements to reflect future events or circumstances after the date
of such statements.
3 | Investor Presentation March 2018 | Veeco Instruments Inc © 2018
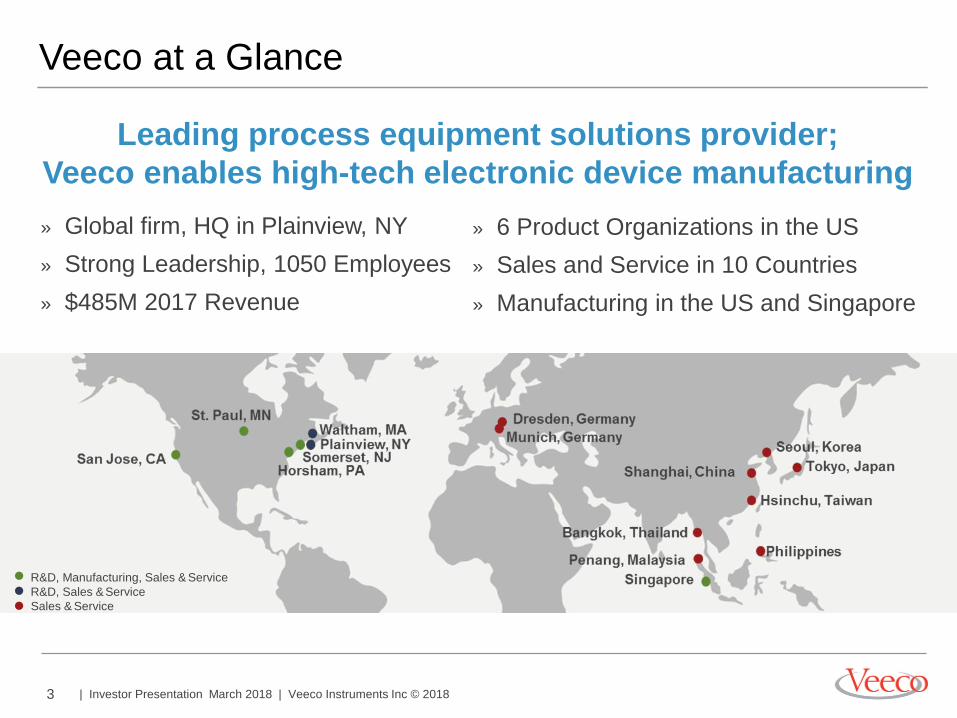
Veeco at a Glance
Leading process equipment solutions provider;
Veeco enables high-tech electronic device manufacturing
» 6 Product Organizations in the US
» Sales and Service in 10 Countries
» Manufacturing in the US and Singapore
» Global firm, HQ in Plainview, NY
» Strong Leadership, 1050 Employees
» $485M 2017 Revenue
R&D, Manufacturing, Sales & Service
R&D, Sales & Service
Sales & Service
4 | Investor Presentation March 2018 | Veeco Instruments Inc © 2018
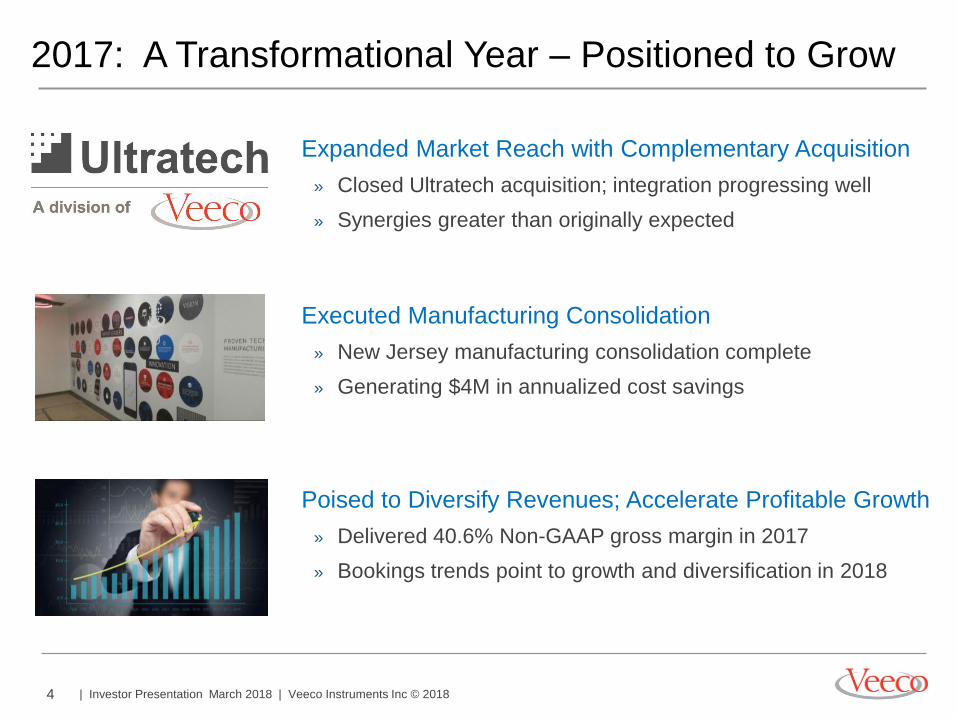
2017: A Transformational Year – Positioned to Grow
Expanded Market Reach with Complementary Acquisition
» Closed Ultratech acquisition; integration progressing well
» Synergies greater than originally expected
Executed Manufacturing Consolidation
» New Jersey manufacturing consolidation complete
» Generating $4M in annualized cost savings
Poised to Diversify Revenues; Accelerate Profitable Growth
» Delivered 40.6% Non-GAAP gross margin in 2017
» Bookings trends point to growth and diversification in 2018
5 | Investor Presentation March 2018 | Veeco Instruments Inc © 2018
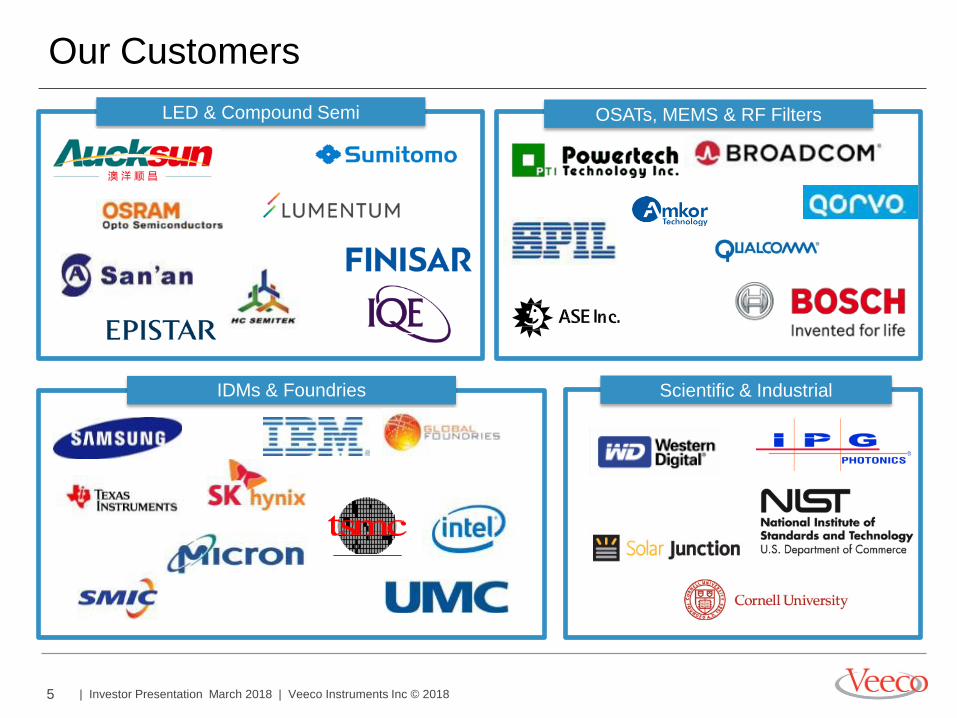
Our Customers
LED & Compound Semi OSATs, MEMS & RF Filters
IDMs & Foundries Scientific & Industrial
6 | Investor Presentation March 2018 | Veeco Instruments Inc © 2018
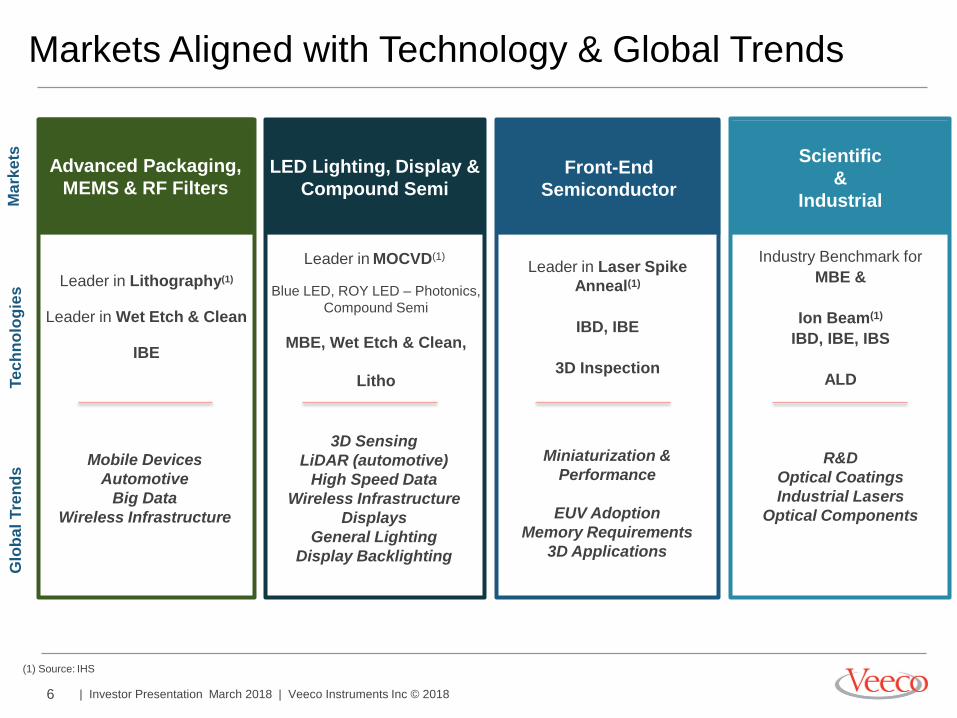
Markets Aligned with Technology & Global Trends
(1) Source: IHS
Scientific
&
Industrial
Front-End
Semiconductor
LED Lighting, Display &
Compound Semi
3D Sensing
LiDAR (automotive)
High Speed Data
Wireless Infrastructure
Displays
General Lighting
Display Backlighting
Leader in MOCVD(1)
Blue LED, ROY LED – Photonics,
Compound Semi
MBE, Wet Etch & Clean,
Litho
Leader in Laser Spike
Anneal(1)
IBD, IBE
3D Inspection
Advanced Packaging,
MEMS & RF Filters
Mobile Devices
Automotive
Big Data
Wireless Infrastructure
Ma
rke
ts
Te
ch
no
log
ies
G
lob
al
Tre
nd
s
Leader in Lithography(1)
Leader in Wet Etch & Clean
IBE
Miniaturization &
Performance
EUV Adoption
Memory Requirements
3D Applications
Industry Benchmark for
MBE &
Ion Beam(1)
IBD, IBE, IBS
ALD
R&D
Optical Coatings
Industrial Lasers
Optical Components
7 | Investor Presentation March 2018 | Veeco Instruments Inc © 2018
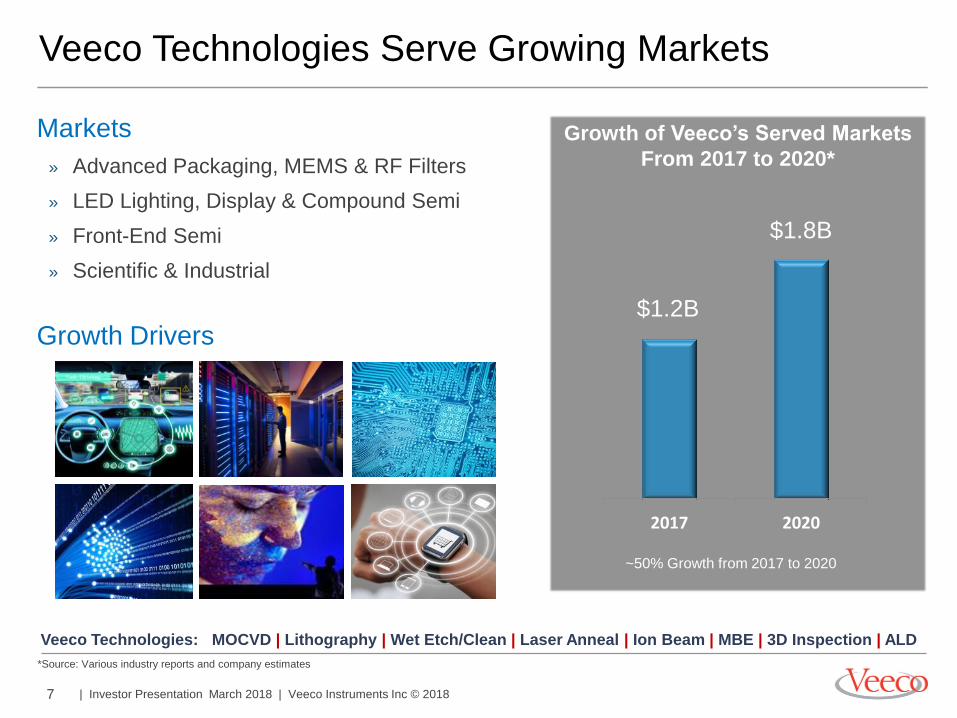
Veeco Technologies Serve Growing Markets
*Source: Various industry reports and company estimates
Veeco Technologies: MOCVD | Lithography | Wet Etch/Clean | Laser Anneal | Ion Beam | MBE | 3D Inspection | ALD
2017 2020
~50% Growth from 2017 to 2020
Growth of Veeco’s Served Markets
From 2017 to 2020*
$1.2B
$1.8B
Markets
» Advanced Packaging, MEMS & RF Filters
» LED Lighting, Display & Compound Semi
» Front-End Semi
» Scientific & Industrial
Growth Drivers
8 | Investor Presentation March 2018 | Veeco Instruments Inc © 2018
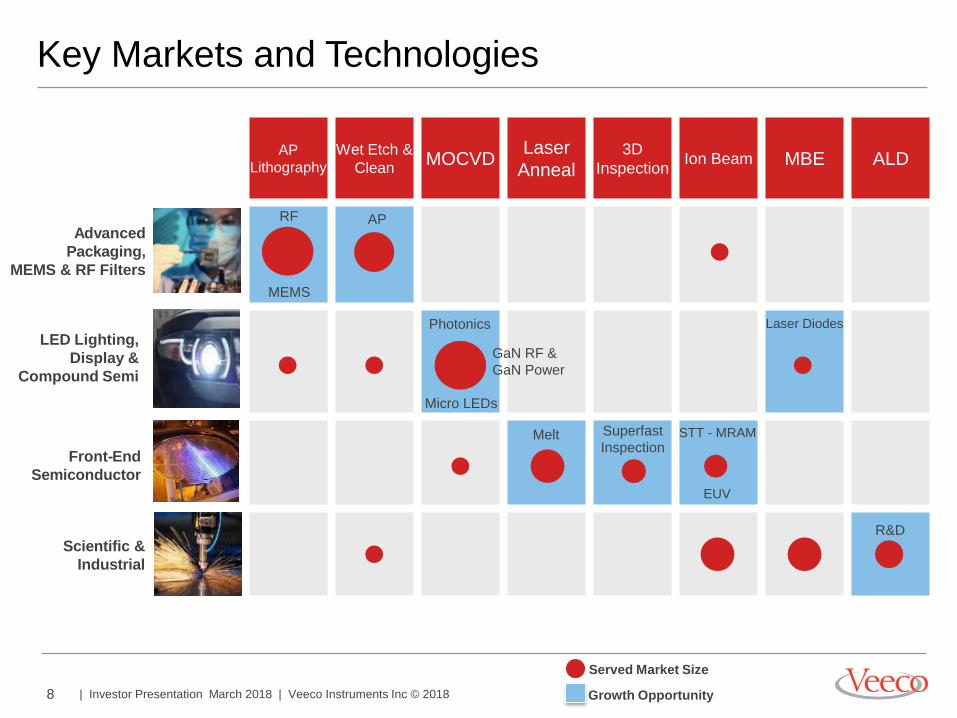
AP
Lithography
Wet Etch &
Clean MOCVD
Laser
Anneal 3D
Inspection Ion Beam MBE ALD
Key Markets and Technologies
Scientific &
Industrial
Photonics
Micro LEDs
GaN RF &
GaN Power
Advanced
Packaging,
MEMS & RF Filters
LED Lighting,
Display &
Compound Semi
Front-End
Semiconductor
AP RF
MEMS
STT - MRAM Superfast
Inspection Melt
R&D
Laser Diodes
Served Market Size
Growth Opportunity
EUV
9 | Investor Presentation March 2018 | Veeco Instruments Inc © 2018
Advanced Packaging,
MEMS & RF Filters
10 | Investor Presentation March 2018 | Veeco Instruments Inc © 2018
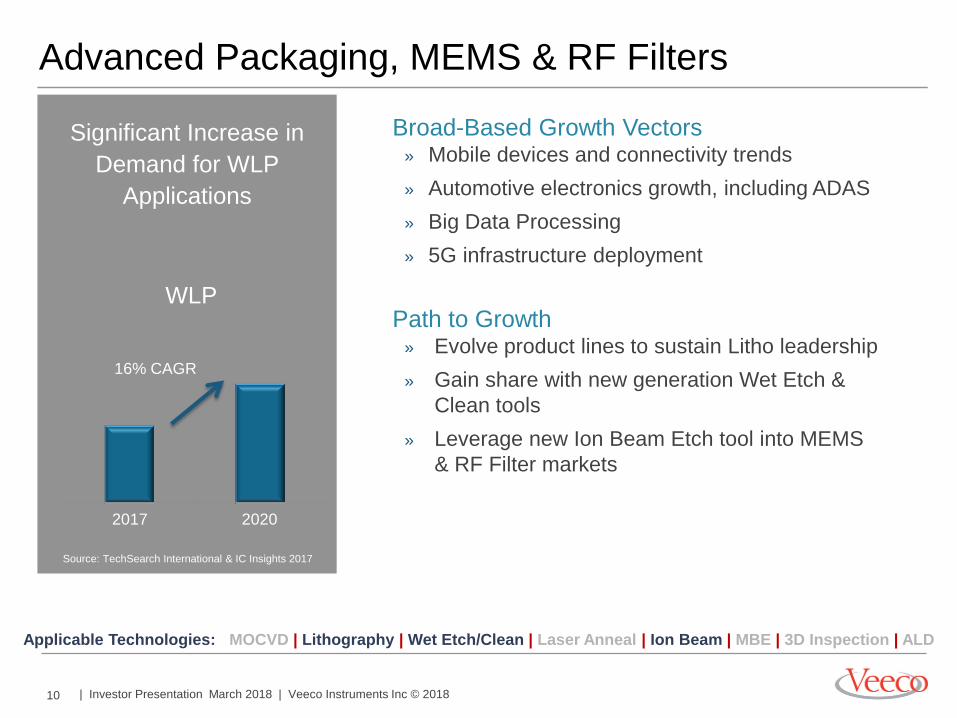
Advanced Packaging, MEMS & RF Filters
Source: TechSearch International & IC Insights 2017
Veeco Advanced Packaging
Revenue
2017
2020
16% CAGR
WLP
Significant Increase in
Demand for WLP
Applications
Reflects new customers or application penetrations 2016
Applicable Technologies: MOCVD | Lithography | Wet Etch/Clean | Laser Anneal | Ion Beam | MBE | 3D Inspection | ALD
Broad-Based Growth Vectors » Mobile devices and connectivity trends
» Automotive electronics growth, including ADAS
» Big Data Processing
» 5G infrastructure deployment
Path to Growth » Evolve product lines to sustain Litho leadership
» Gain share with new generation Wet Etch &
Clean tools
» Leverage new Ion Beam Etch tool into MEMS
& RF Filter markets
11 | Investor Presentation March 2018 | Veeco Instruments Inc © 2018
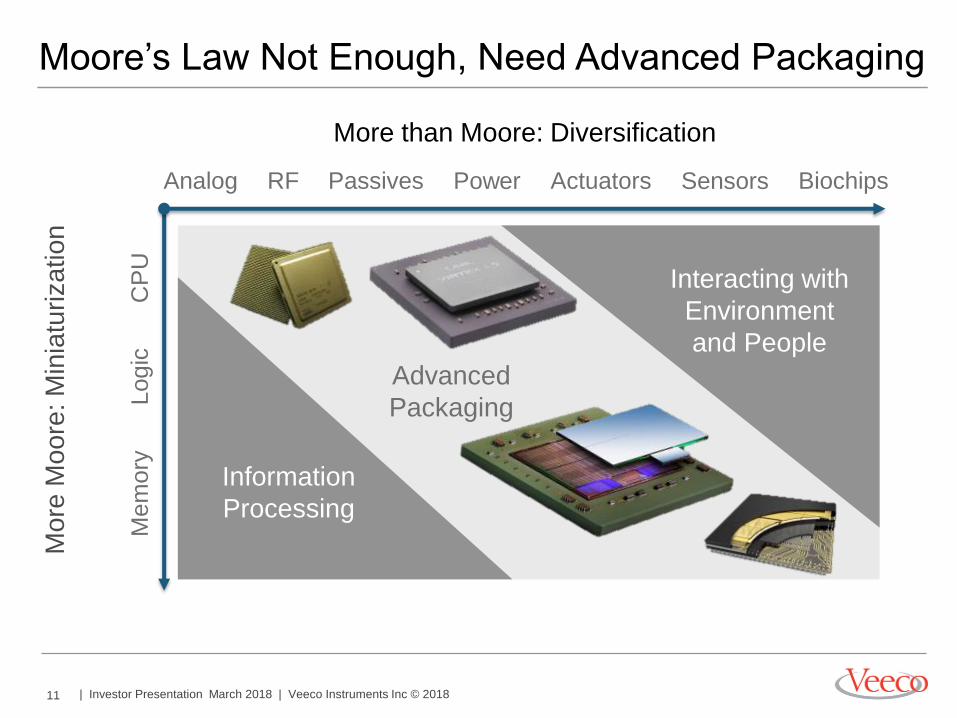
Moore’s Law Not Enough, Need Advanced Packaging M
ore
Mo
ore
: M
inia
turiza
tio
n
More than Moore: Diversification
Analog RF Passives Power Sensors Actuators Biochips
CP
U
Information
Processing
Interacting with
Environment
and People
Logic
M
em
ory
Advanced
Packaging
12 | Investor Presentation March 2018 | Veeco Instruments Inc © 2018
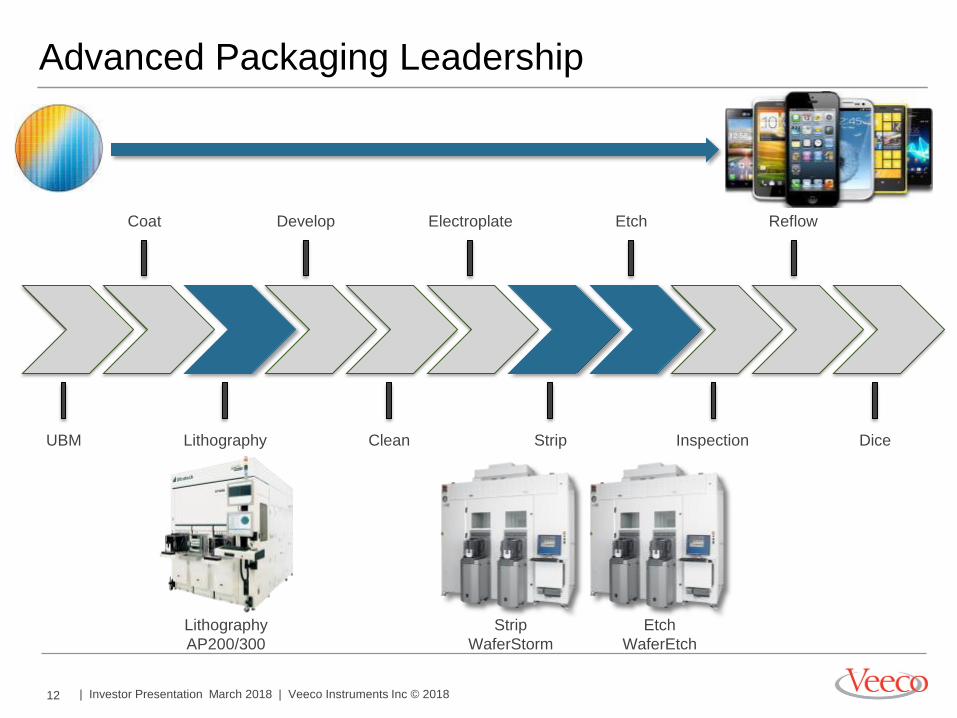
Advanced Packaging Leadership
UBM Lithography Clean Strip Inspection Dice
Coat Develop Electroplate Etch Reflow
Strip
WaferStorm
Lithography
AP200/300
Etch
WaferEtch
13 | Investor Presentation March 2018 | Veeco Instruments Inc © 2018
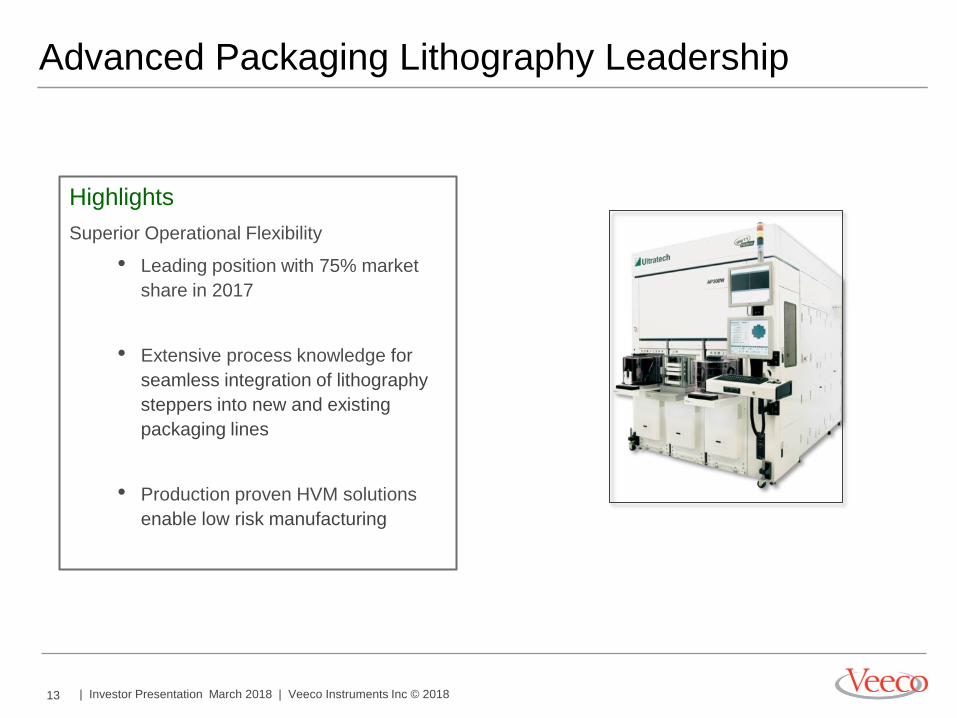
Advanced Packaging Lithography Leadership
Highlights
Superior Operational Flexibility
• Leading position with 75% market
share in 2017
• Extensive process knowledge for
seamless integration of lithography
steppers into new and existing
packaging lines
• Production proven HVM solutions
enable low risk manufacturing
14 | Investor Presentation March 2018 | Veeco Instruments Inc © 2018
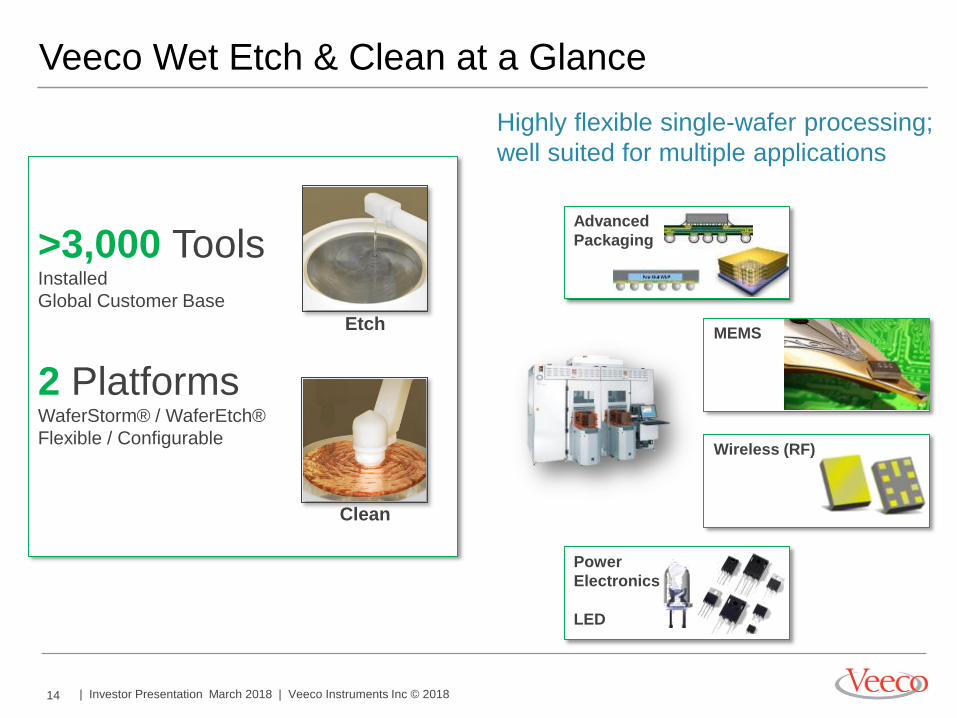
MEMS
>3,000 Tools Installed
Global Customer Base
2 Platforms WaferStorm® / WaferEtch®
Flexible / Configurable
Veeco Wet Etch & Clean at a Glance
Etch
Clean
Advanced
Packaging
Power
Electronics
LED
Wireless (RF)
Highly flexible single-wafer processing;
well suited for multiple applications
15 | Investor Presentation March 2018 | Veeco Instruments Inc © 2018
LED Lighting, Display &
Compound Semi
16 | Investor Presentation March 2018 | Veeco Instruments Inc © 2018
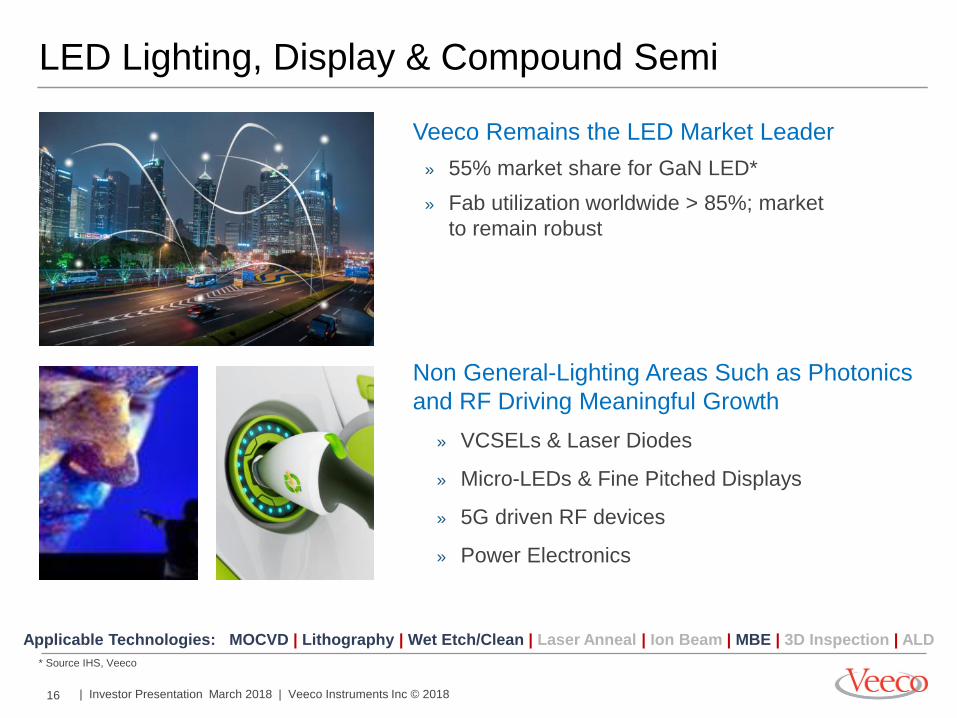
Non General-Lighting Areas Such as Photonics
and RF Driving Meaningful Growth
» VCSELs & Laser Diodes
» Micro-LEDs & Fine Pitched Displays
» 5G driven RF devices
» Power Electronics
LED Lighting, Display & Compound Semi
Veeco Remains the LED Market Leader
» 55% market share for GaN LED*
» Fab utilization worldwide > 85%; market
to remain robust
* Source IHS, Veeco
Applicable Technologies: MOCVD | Lithography | Wet Etch/Clean | Laser Anneal | Ion Beam | MBE | 3D Inspection | ALD
17 | Investor Presentation March 2018 | Veeco Instruments Inc © 2018
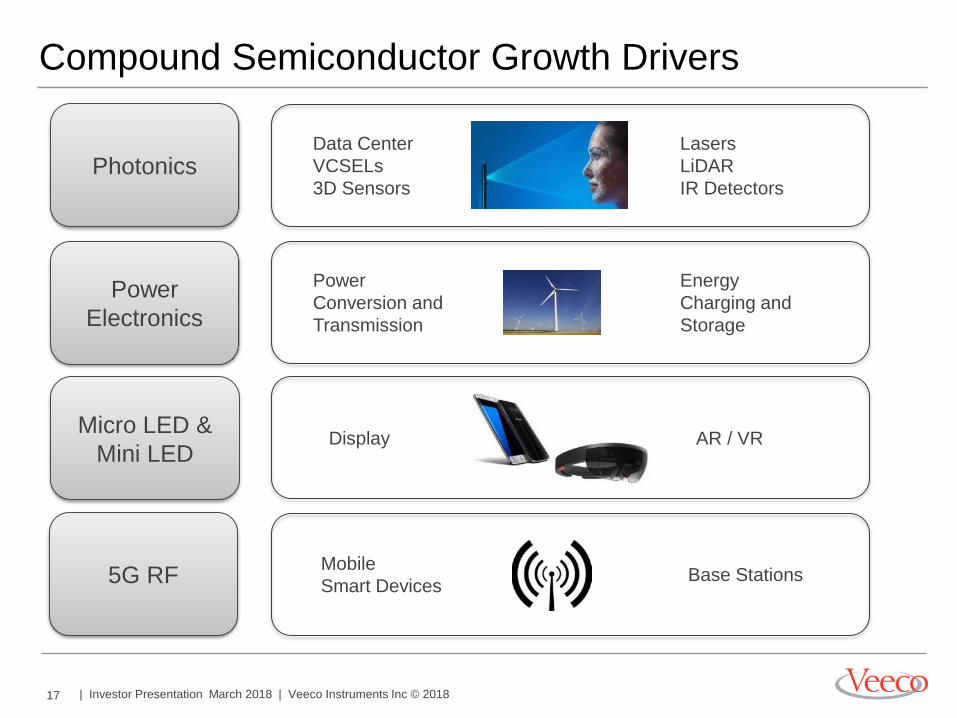
Compound Semiconductor Growth Drivers
Photonics
Power
Electronics
Micro LED &
Mini LED
5G RF
Data Center
VCSELs
3D Sensors
Lasers
LiDAR
IR Detectors
Power
Conversion and
Transmission
Energy
Charging and
Storage
Display AR / VR
Mobile
Smart Devices Base Stations
18 | Investor Presentation March 2018 | Veeco Instruments Inc © 2018
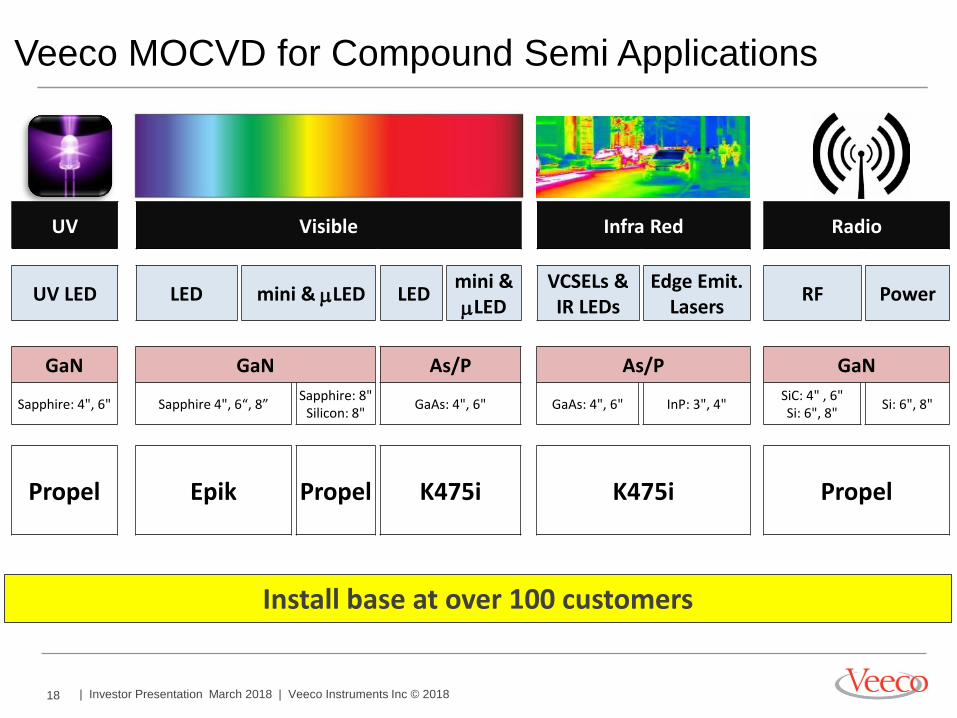
Veeco MOCVD for Compound Semi Applications
UV Visible Infra Red Radio
UV LED LED mini & mLED LED
mini &
mLED
VCSELs & IR LEDs
Edge Emit. Lasers
RF Power
Install base at over 100 customers
GaN GaN As/P As/P GaN
Sapphire: 4", 6" Sapphire 4", 6“, 8” Sapphire: 8"
Silicon: 8" GaAs: 4", 6" GaAs: 4", 6" InP: 3", 4"
SiC: 4" , 6" Si: 6", 8"
Si: 6", 8"
Propel Epik Propel K475i K475i Propel
19 | Investor Presentation March 2018 | Veeco Instruments Inc © 2018
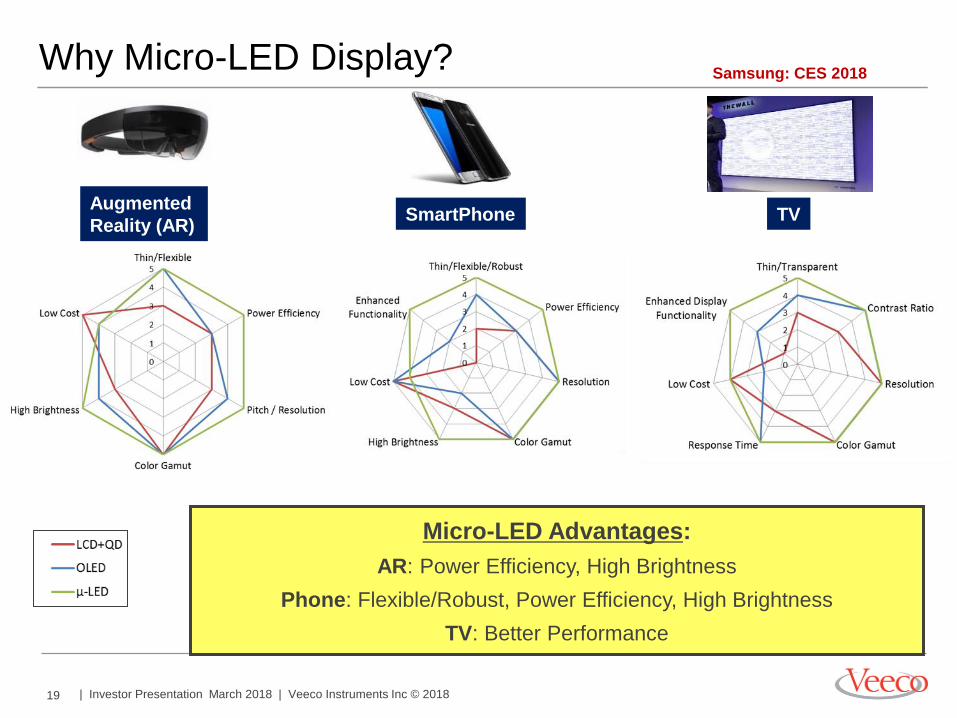
Why Micro-LED Display?
Micro-LED Advantages:
AR: Power Efficiency, High Brightness
Phone: Flexible/Robust, Power Efficiency, High Brightness
TV: Better Performance
Augmented
Reality (AR) SmartPhone TV
Samsung: CES 2018
20 | Investor Presentation March 2018 | Veeco Instruments Inc © 2018
Front-End
Semiconductor
21 | Investor Presentation March 2018 | Veeco Instruments Inc © 2018
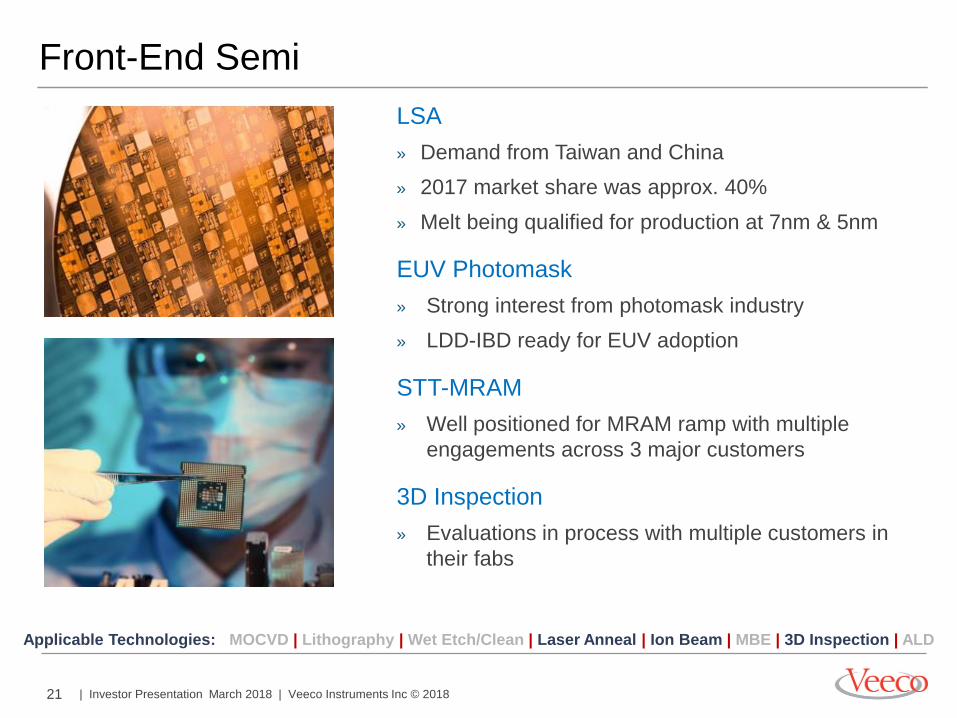
Front-End Semi
LSA
» Demand from Taiwan and China
» 2017 market share was approx. 40%
» Melt being qualified for production at 7nm & 5nm
EUV Photomask
» Strong interest from photomask industry
» LDD-IBD ready for EUV adoption
STT-MRAM
» Well positioned for MRAM ramp with multiple
engagements across 3 major customers
3D Inspection
» Evaluations in process with multiple customers in
their fabs
Applicable Technologies: MOCVD | Lithography | Wet Etch/Clean | Laser Anneal | Ion Beam | MBE | 3D Inspection | ALD
22 | Investor Presentation March 2018 | Veeco Instruments Inc © 2018
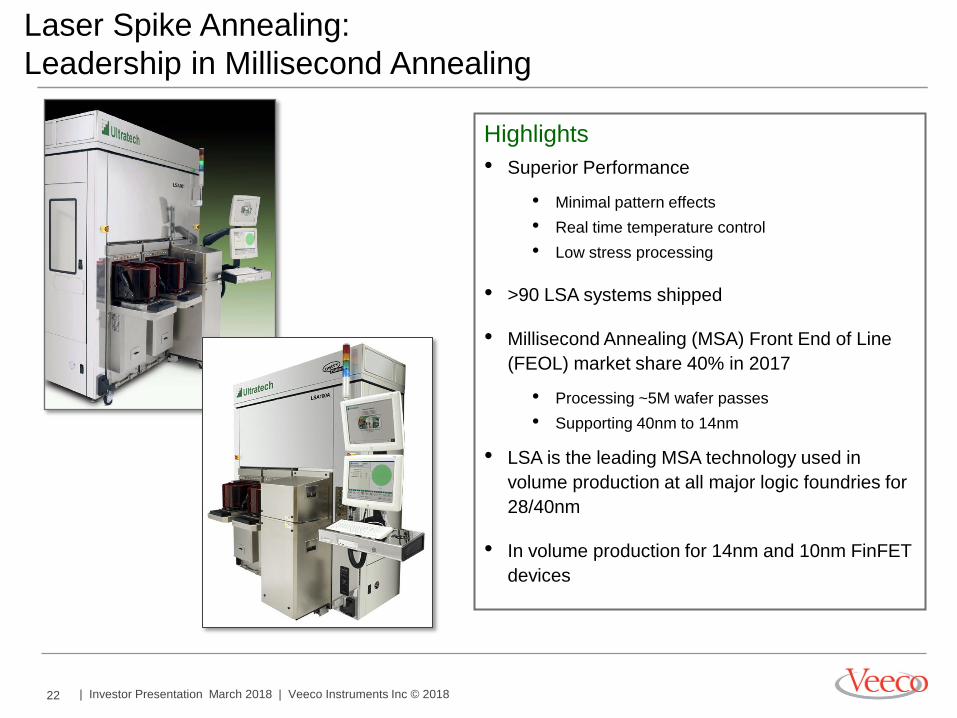
Laser Spike Annealing:
Leadership in Millisecond Annealing
Highlights
• Superior Performance
• Minimal pattern effects
• Real time temperature control
• Low stress processing
• >90 LSA systems shipped
• Millisecond Annealing (MSA) Front End of Line
(FEOL) market share 40% in 2017
• Processing ~5M wafer passes
• Supporting 40nm to 14nm
• LSA is the leading MSA technology used in
volume production at all major logic foundries for
28/40nm
• In volume production for 14nm and 10nm FinFET
devices
23 | Investor Presentation March 2018 | Veeco Instruments Inc © 2018
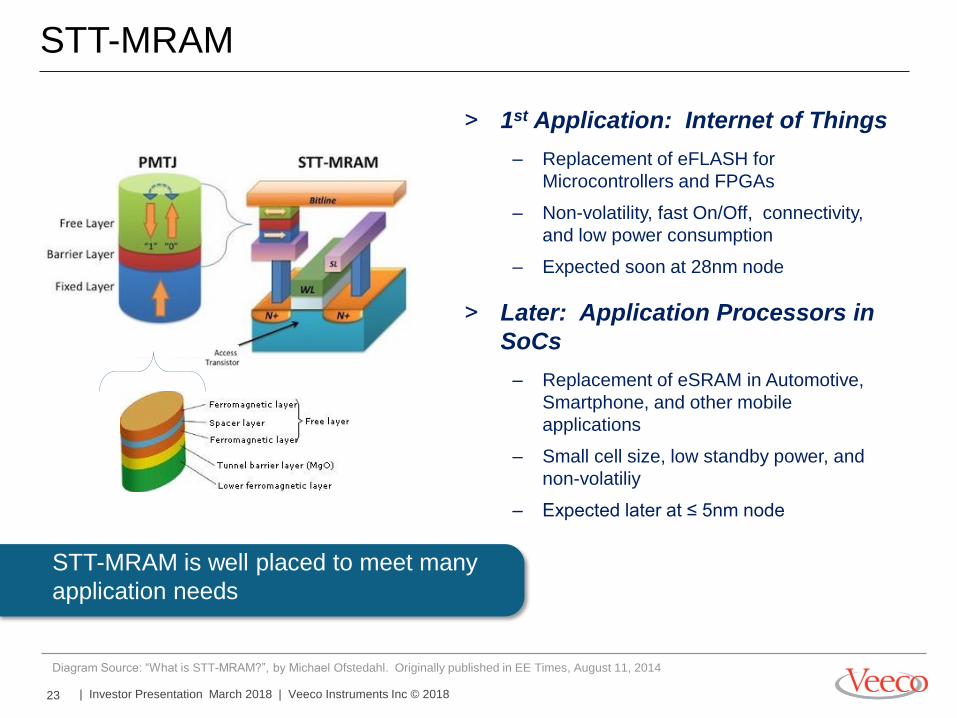
STT-MRAM
˃ 1st Application: Internet of Things
– Replacement of eFLASH for
Microcontrollers and FPGAs
– Non-volatility, fast On/Off, connectivity,
and low power consumption
– Expected soon at 28nm node
˃ Later: Application Processors in
SoCs
– Replacement of eSRAM in Automotive,
Smartphone, and other mobile
applications
– Small cell size, low standby power, and
non-volatiliy
– Expected later at ≤ 5nm node
STT-MRAM is well placed to meet many
application needs
Diagram Source: “What is STT-MRAM?”, by Michael Ofstedahl. Originally published in EE Times, August 11, 2014
24 | Investor Presentation March 2018 | Veeco Instruments Inc © 2018
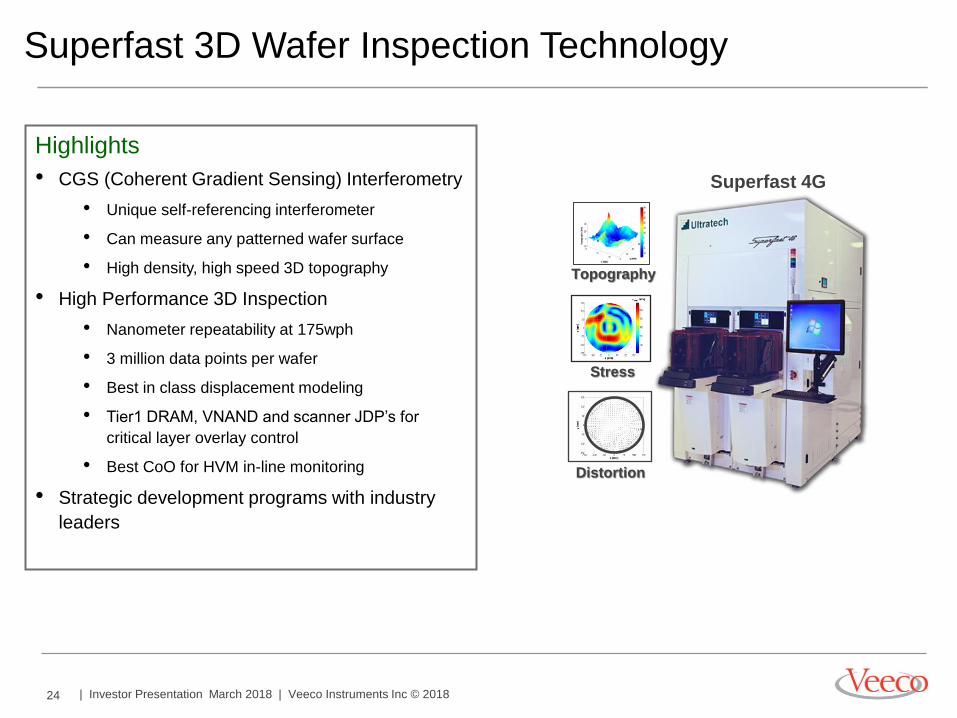
Superfast 3D Wafer Inspection Technology
Highlights
• CGS (Coherent Gradient Sensing) Interferometry
• Unique self-referencing interferometer
• Can measure any patterned wafer surface
• High density, high speed 3D topography
• High Performance 3D Inspection
• Nanometer repeatability at 175wph
• 3 million data points per wafer
• Best in class displacement modeling
• Tier1 DRAM, VNAND and scanner JDP’s for
critical layer overlay control
• Best CoO for HVM in-line monitoring
• Strategic development programs with industry
leaders
Topography
Distortion
Stress
+
Superfast 4G
25 | Investor Presentation March 2018 | Veeco Instruments Inc © 2018
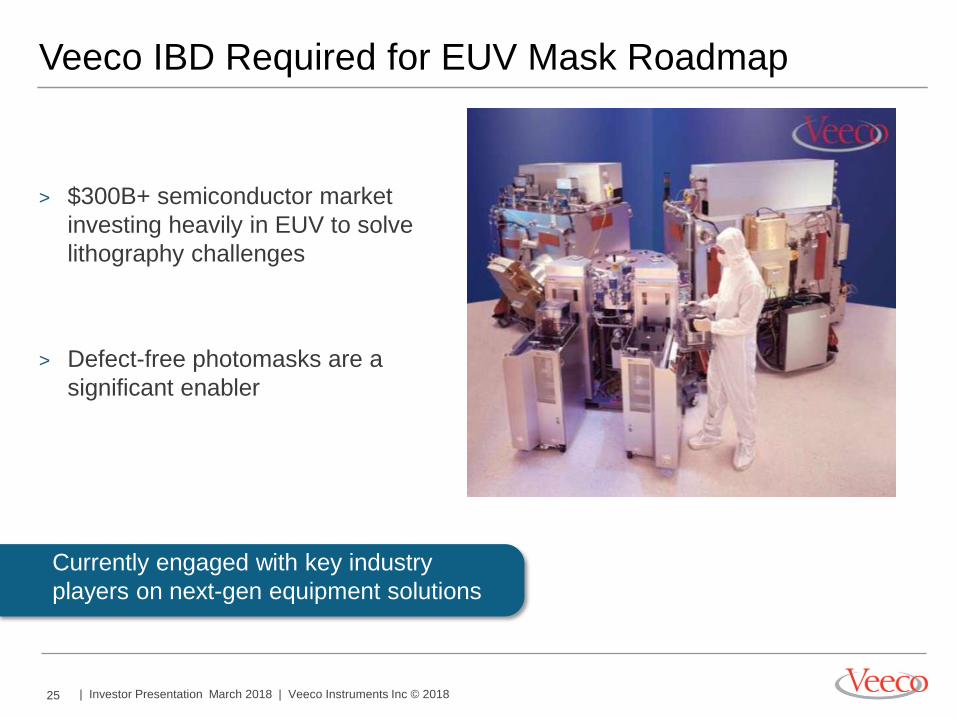
Veeco IBD Required for EUV Mask Roadmap
Currently engaged with key industry
players on next-gen equipment solutions
> $300B+ semiconductor market
investing heavily in EUV to solve
lithography challenges
> Defect-free photomasks are a
significant enabler

26 | Investor Presentation March 2018 | Veeco Instruments Inc © 2018
Scientific & Industrial
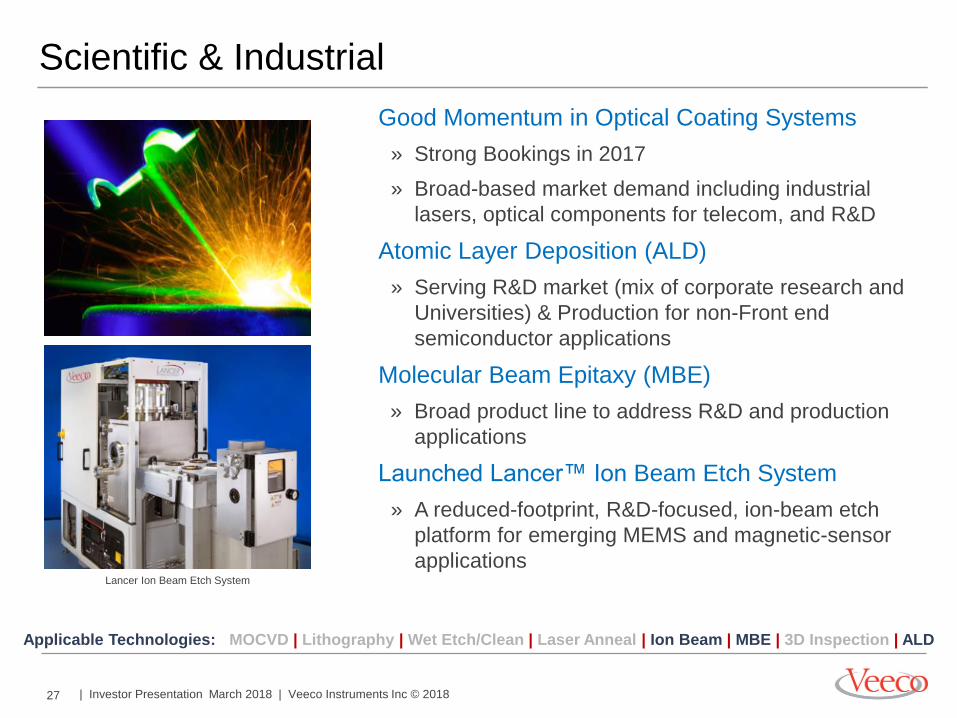
27 | Investor Presentation March 2018 | Veeco Instruments Inc © 2018
Scientific & Industrial
Applicable Technologies: MOCVD | Lithography | Wet Etch/Clean | Laser Anneal | Ion Beam | MBE | 3D Inspection | ALD
Good Momentum in Optical Coating Systems
» Strong Bookings in 2017
» Broad-based market demand including industrial
lasers, optical components for telecom, and R&D
Atomic Layer Deposition (ALD)
» Serving R&D market (mix of corporate research and
Universities) & Production for non-Front end
semiconductor applications
Molecular Beam Epitaxy (MBE)
» Broad product line to address R&D and production
applications
Launched Lancer™ Ion Beam Etch System
» A reduced-footprint, R&D-focused, ion-beam etch
platform for emerging MEMS and magnetic-sensor
applications Lancer Ion Beam Etch System
28 | Investor Presentation March 2018 | Veeco Instruments Inc © 2018
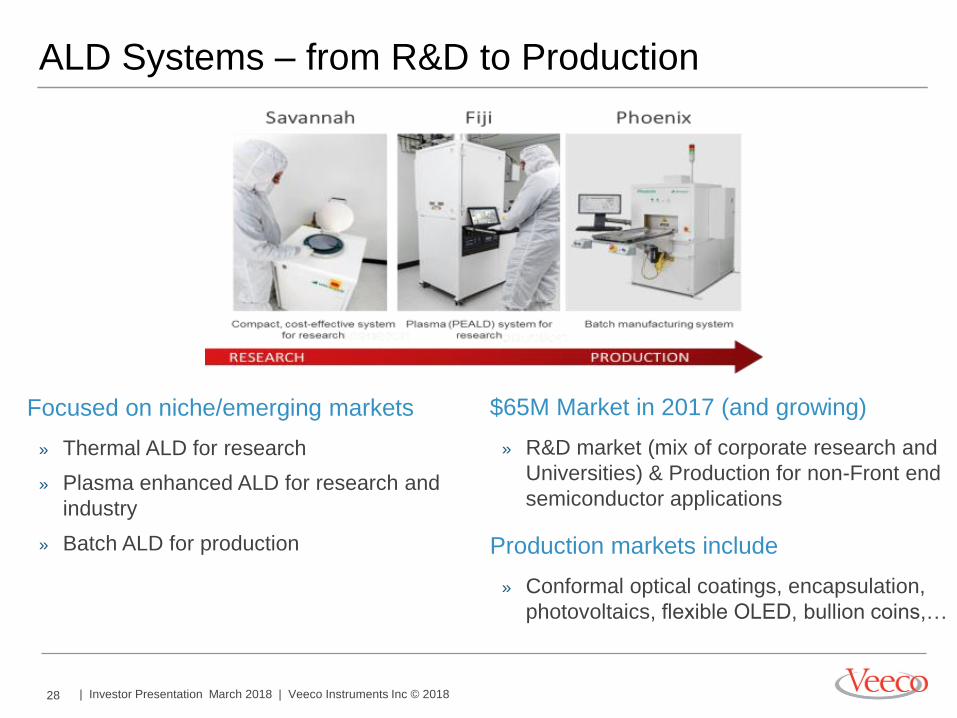
ALD Systems – from R&D to Production
Focused on niche/emerging markets
» Thermal ALD for research
» Plasma enhanced ALD for research and
industry
» Batch ALD for production
$65M Market in 2017 (and growing)
» R&D market (mix of corporate research and
Universities) & Production for non-Front end
semiconductor applications
Production markets include
» Conformal optical coatings, encapsulation,
photovoltaics, flexible OLED, bullion coins,…
29 | Investor Presentation March 2018 | Veeco Instruments Inc © 2018
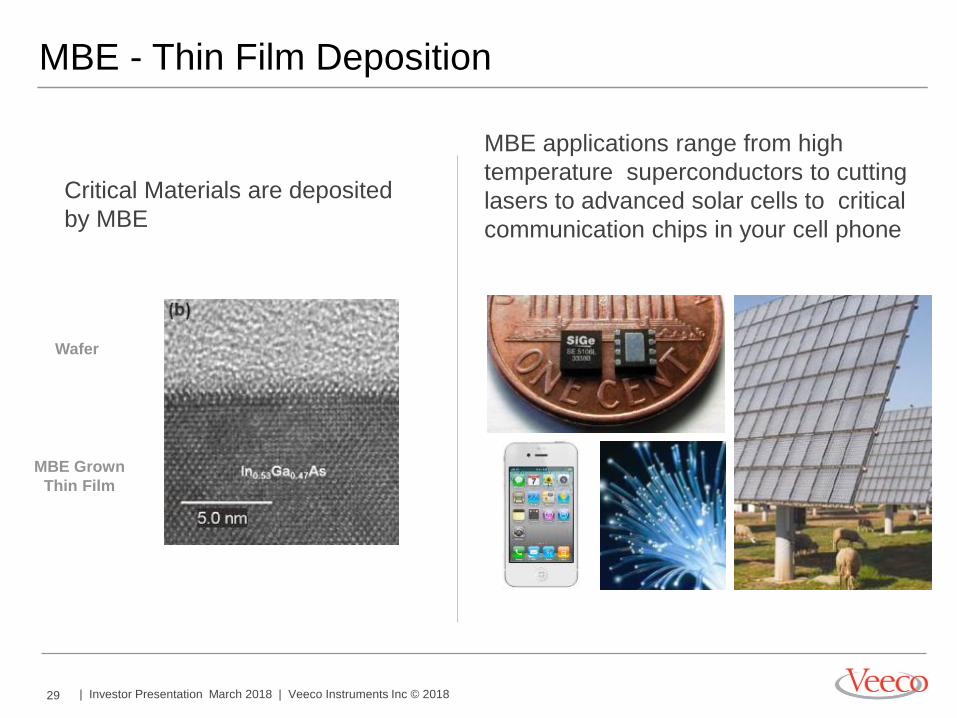
MBE - Thin Film Deposition
Critical Materials are deposited
by MBE
MBE applications range from high
temperature superconductors to cutting
lasers to advanced solar cells to critical
communication chips in your cell phone
Wafer
MBE Grown
Thin Film
30 | Investor Presentation March 2018 | Veeco Instruments Inc © 2018
Q4 2017 Update
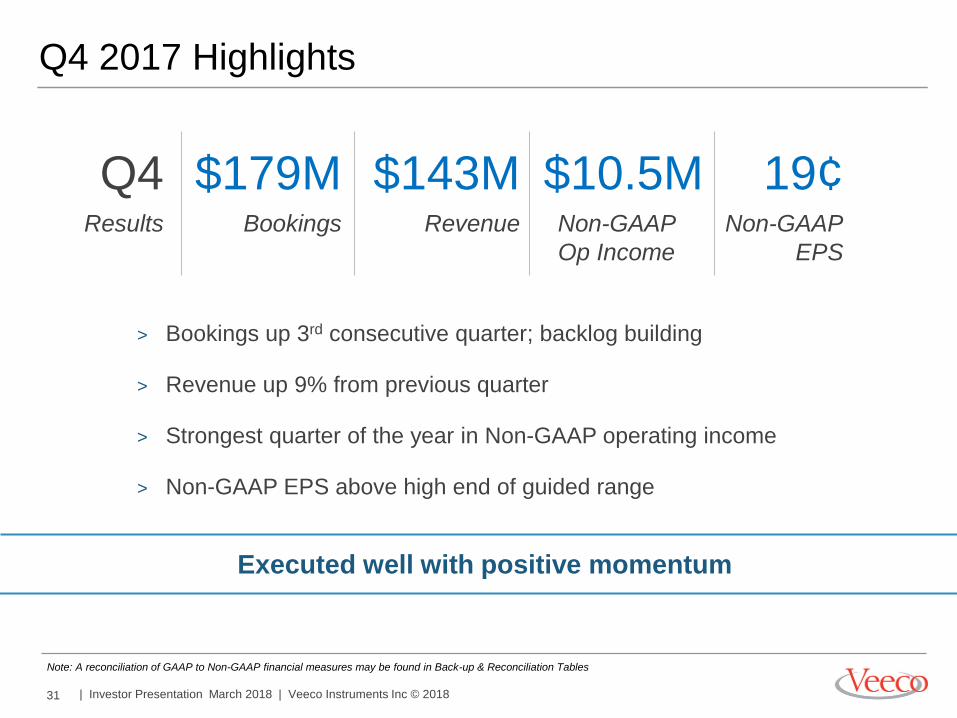
31 | Investor Presentation March 2018 | Veeco Instruments Inc © 2018
19¢ Non-GAAP
EPS
$143M Revenue
Q4 2017 Highlights
> Bookings up 3rd consecutive quarter; backlog building
> Revenue up 9% from previous quarter
> Strongest quarter of the year in Non-GAAP operating income
> Non-GAAP EPS above high end of guided range
$179M Bookings
Q4 Results
Note: A reconciliation of GAAP to Non-GAAP financial measures may be found in Back-up & Reconciliation Tables
$10.5M Non-GAAP
Op Income
Executed well with positive momentum
32 | Investor Presentation March 2018 | Veeco Instruments Inc © 2018
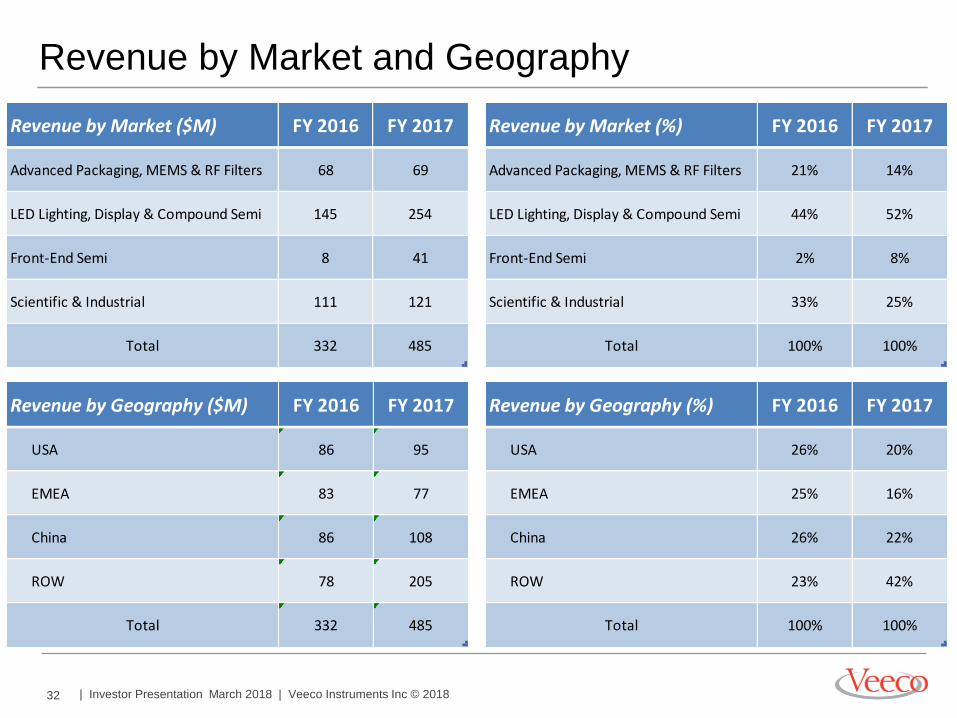
Revenue by Market and Geography
Revenue by Market ($M) FY 2016 FY 2017
Advanced Packaging, MEMS & RF Filters 68 69
LED Lighting, Display & Compound Semi 145 254
Front-End Semi 8 41
Scientific & Industrial 111 121
Total 332 485
Revenue by Market (%) FY 2016 FY 2017
Advanced Packaging, MEMS & RF Filters 21% 14%
LED Lighting, Display & Compound Semi 44% 52%
Front-End Semi 2% 8%
Scientific & Industrial 33% 25%
Total 100% 100%
Revenue by Geography (%) FY 2016 FY 2017
USA 26% 20%
EMEA 25% 16%
China 26% 22%
ROW 23% 42%
Total 100% 100%
Revenue by Geography ($M) FY 2016 FY 2017
USA 86 95
EMEA 83 77
China 86 108
ROW 78 205
Total 332 485
33 | Investor Presentation March 2018 | Veeco Instruments Inc © 2018
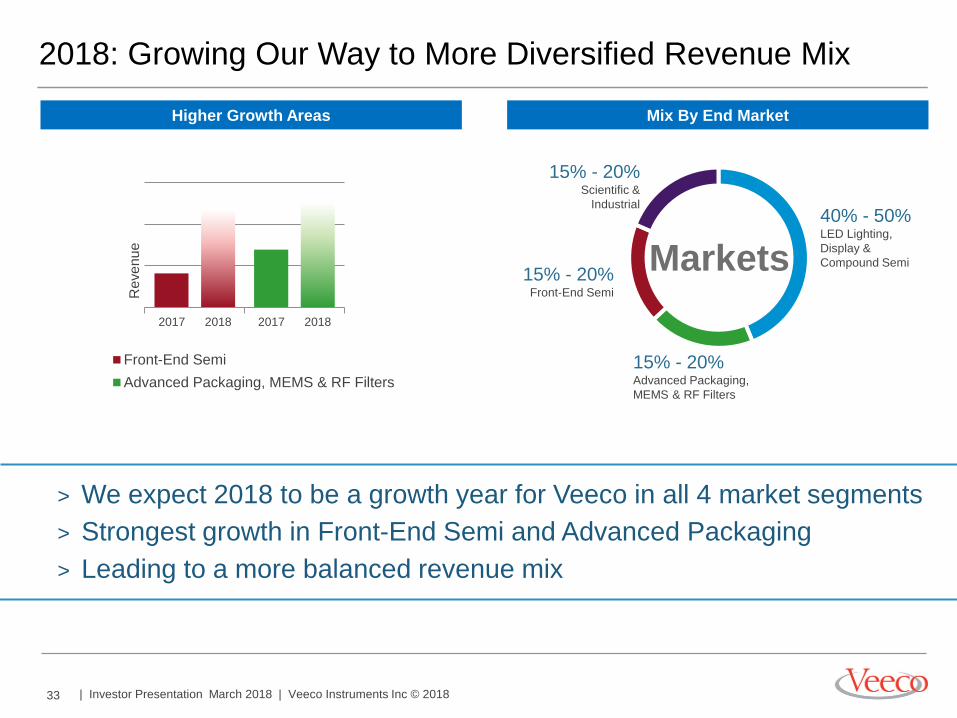
2018: Growing Our Way to More Diversified Revenue Mix
15% - 20% Advanced Packaging,
MEMS & RF Filters
15% - 20% Scientific &
Industrial
15% - 20% Front-End Semi
40% - 50% LED Lighting,
Display &
Compound Semi Markets
Mix By End Market Higher Growth Areas
Front-End Semi
Advanced Packaging, MEMS & RF Filters
> We expect 2018 to be a growth year for Veeco in all 4 market segments
> Strongest growth in Front-End Semi and Advanced Packaging
> Leading to a more balanced revenue mix
2017 2018 2017 2018
Re
ve
nu
e
34 | Investor Presentation March 2018 | Veeco Instruments Inc © 2018
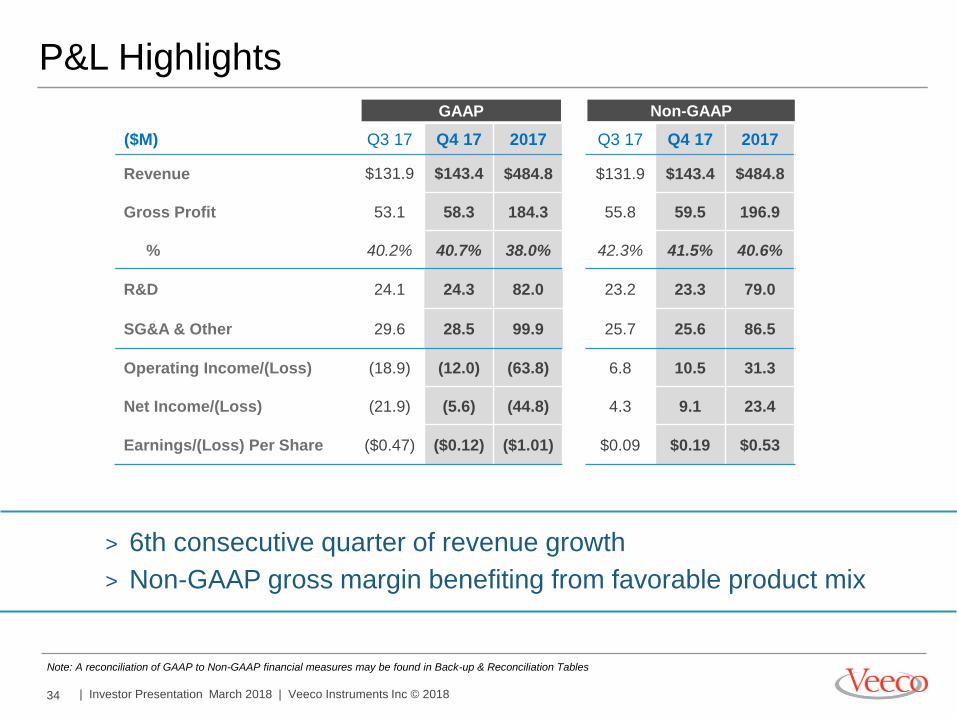
Non-GAAP GAAP
P&L Highlights
($M) Q3 17 Q4 17 2017 Q3 17 Q4 17 2017
Revenue $131.9 $143.4 $484.8 $131.9 $143.4 $484.8
Gross Profit 53.1 58.3 184.3 55.8 59.5 196.9
% 40.2% 40.7% 38.0% 42.3% 41.5% 40.6%
R&D 24.1 24.3 82.0 23.2 23.3 79.0
SG&A & Other 29.6 28.5 99.9 25.7 25.6 86.5
Operating Income/(Loss) (18.9) (12.0) (63.8) 6.8 10.5 31.3
Net Income/(Loss) (21.9) (5.6) (44.8) 4.3 9.1 23.4
Earnings/(Loss) Per Share ($0.47) ($0.12) ($1.01) $0.09 $0.19 $0.53
> 6th consecutive quarter of revenue growth
> Non-GAAP gross margin benefiting from favorable product mix
Note: A reconciliation of GAAP to Non-GAAP financial measures may be found in Back-up & Reconciliation Tables
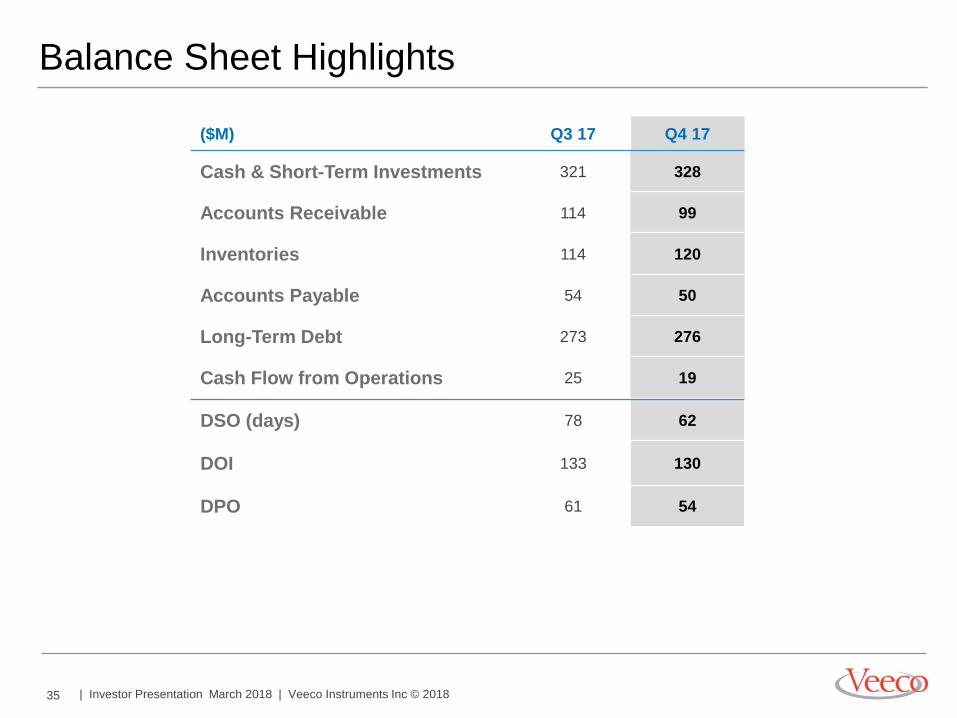
35 | Investor Presentation March 2018 | Veeco Instruments Inc © 2018
DSO (days) 78 62
DOI 133 130
DPO 61 54
($M) Q3 17 Q4 17
Cash & Short-Term Investments 321 328
Accounts Receivable 114 99
Inventories 114 120
Accounts Payable 54 50
Long-Term Debt 273 276
Cash Flow from Operations 25 19
Balance Sheet Highlights
36 | Investor Presentation March 2018 | Veeco Instruments Inc © 2018
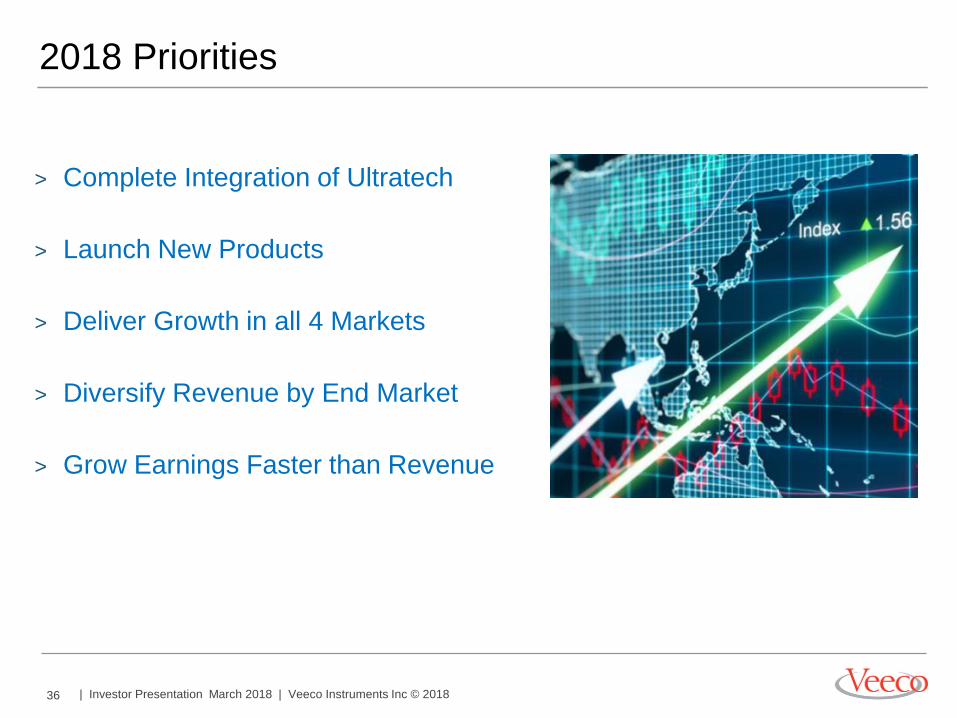
2018 Priorities
> Complete Integration of Ultratech
> Launch New Products
> Deliver Growth in all 4 Markets
> Diversify Revenue by End Market
> Grow Earnings Faster than Revenue
36
37 | Investor Presentation March 2018 | Veeco Instruments Inc © 2018
Back Up &
Reconciliation
Tables
38 | Investor Presentation March 2018 | Veeco Instruments Inc © 2018
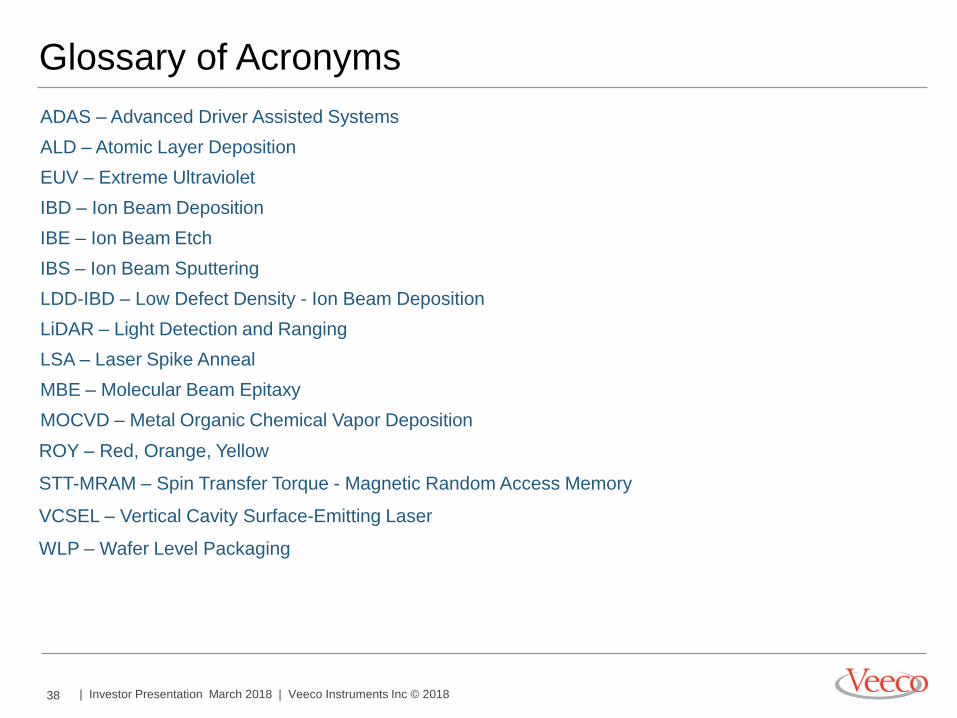
Glossary of Acronyms
ADAS – Advanced Driver Assisted Systems
ALD – Atomic Layer Deposition
EUV – Extreme Ultraviolet
IBD – Ion Beam Deposition
IBE – Ion Beam Etch
IBS – Ion Beam Sputtering
LDD-IBD – Low Defect Density - Ion Beam Deposition
LiDAR – Light Detection and Ranging
LSA – Laser Spike Anneal
MBE – Molecular Beam Epitaxy
MOCVD – Metal Organic Chemical Vapor Deposition
ROY – Red, Orange, Yellow
STT-MRAM – Spin Transfer Torque - Magnetic Random Access Memory
VCSEL – Vertical Cavity Surface-Emitting Laser
WLP – Wafer Level Packaging
39 | Investor Presentation March 2018 | Veeco Instruments Inc © 2018
Note on Reconciliation Tables
These tables include financial measures adjusted for the impact of certain items; these financial measures are
therefore not calculated in accordance with U.S. generally accepted accounting principles (“GAAP”). These Non-
GAAP financial measures exclude items such as: share-based compensation expense; charges relating to
restructuring initiatives; non-cash asset impairments; certain other non-operating gains and losses; and
acquisition-related items such as transaction costs, non-cash amortization of acquired intangible assets, and
incremental transaction-related compensation.
These Non-GAAP financial measures may be different from Non-GAAP financial measures used by other
companies. Non-GAAP financial measures should not be considered a substitute for, or superior to, measures of
financial performance prepared in accordance with GAAP. By excluding these items, Non-GAAP financial
measures are intended to facilitate meaningful comparisons to historical operating results, competitors' operating
results, and estimates made by securities analysts. Management is evaluated on key performance metrics
including Non-GAAP Operating Income, which is used to determine management incentive compensation as well
as to forecast future periods.
These Non-GAAP financial measures may be useful to investors in allowing for greater transparency of
supplemental information used by management in its financial and operational decision-making. In addition, similar
Non-GAAP financial measures have historically been reported to investors; the inclusion of comparable numbers
provides consistency in financial reporting. Investors are encouraged to review the reconciliation of the Non-GAAP
financial measures used in this news release to their most directly comparable GAAP financial measures.
40 | Investor Presentation March 2018 | Veeco Instruments Inc © 2018
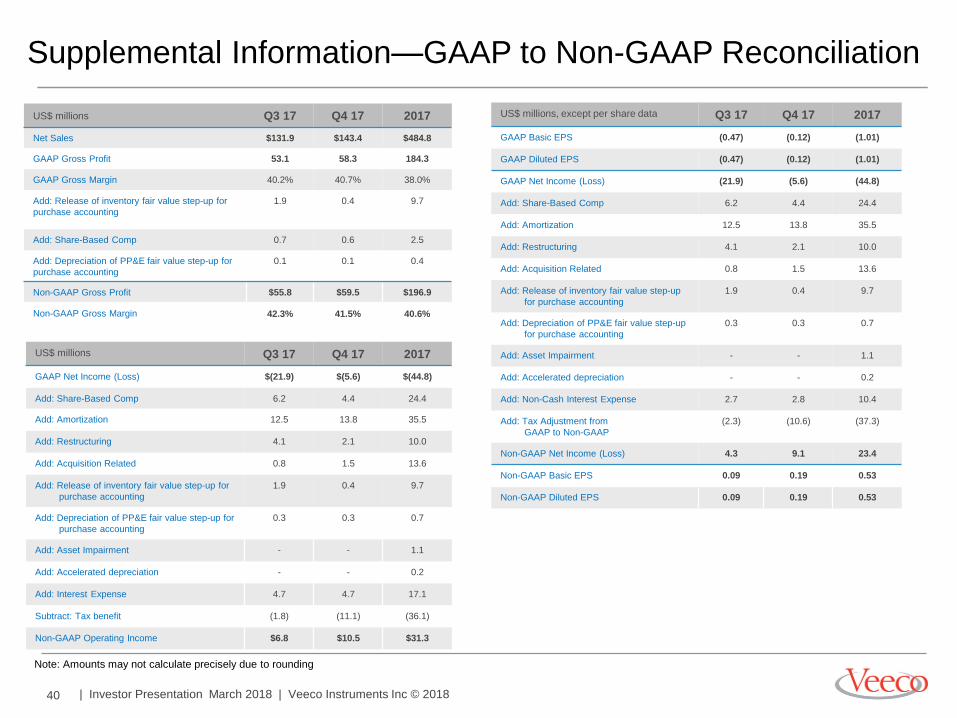
Supplemental Information—GAAP to Non-GAAP Reconciliation
Note: Amounts may not calculate precisely due to rounding
US$ millions Q3 17 Q4 17 2017
Net Sales $131.9 $143.4 $484.8
GAAP Gross Profit 53.1 58.3 184.3
GAAP Gross Margin 40.2% 40.7% 38.0%
Add: Release of inventory fair value step-up for
purchase accounting
1.9 0.4 9.7
Add: Share-Based Comp 0.7 0.6 2.5
Add: Depreciation of PP&E fair value step-up for
purchase accounting
0.1 0.1 0.4
Non-GAAP Gross Profit $55.8 $59.5 $196.9
Non-GAAP Gross Margin 42.3% 41.5% 40.6%
US$ millions, except per share data Q3 17 Q4 17 2017
GAAP Basic EPS (0.47) (0.12) (1.01)
GAAP Diluted EPS (0.47) (0.12) (1.01)
GAAP Net Income (Loss) (21.9) (5.6) (44.8)
Add: Share-Based Comp 6.2 4.4 24.4
Add: Amortization 12.5 13.8 35.5
Add: Restructuring 4.1 2.1 10.0
Add: Acquisition Related 0.8 1.5 13.6
Add: Release of inventory fair value step-up
for purchase accounting
1.9 0.4 9.7
Add: Depreciation of PP&E fair value step-up
for purchase accounting
0.3 0.3 0.7
Add: Asset Impairment - - 1.1
Add: Accelerated depreciation - - 0.2
Add: Non-Cash Interest Expense 2.7 2.8 10.4
Add: Tax Adjustment from
GAAP to Non-GAAP
(2.3) (10.6) (37.3)
Non-GAAP Net Income (Loss) 4.3 9.1 23.4
Non-GAAP Basic EPS 0.09 0.19 0.53
Non-GAAP Diluted EPS 0.09 0.19 0.53
US$ millions Q3 17 Q4 17 2017
GAAP Net Income (Loss) $(21.9) $(5.6) $(44.8)
Add: Share-Based Comp 6.2 4.4 24.4
Add: Amortization 12.5 13.8 35.5
Add: Restructuring 4.1 2.1 10.0
Add: Acquisition Related 0.8 1.5 13.6
Add: Release of inventory fair value step-up for
purchase accounting
1.9 0.4 9.7
Add: Depreciation of PP&E fair value step-up for
purchase accounting
0.3 0.3 0.7
Add: Asset Impairment - - 1.1
Add: Accelerated depreciation - - 0.2
Add: Interest Expense 4.7 4.7 17.1
Subtract: Tax benefit (1.8) (11.1) (36.1)
Non-GAAP Operating Income $6.8 $10.5 $31.3
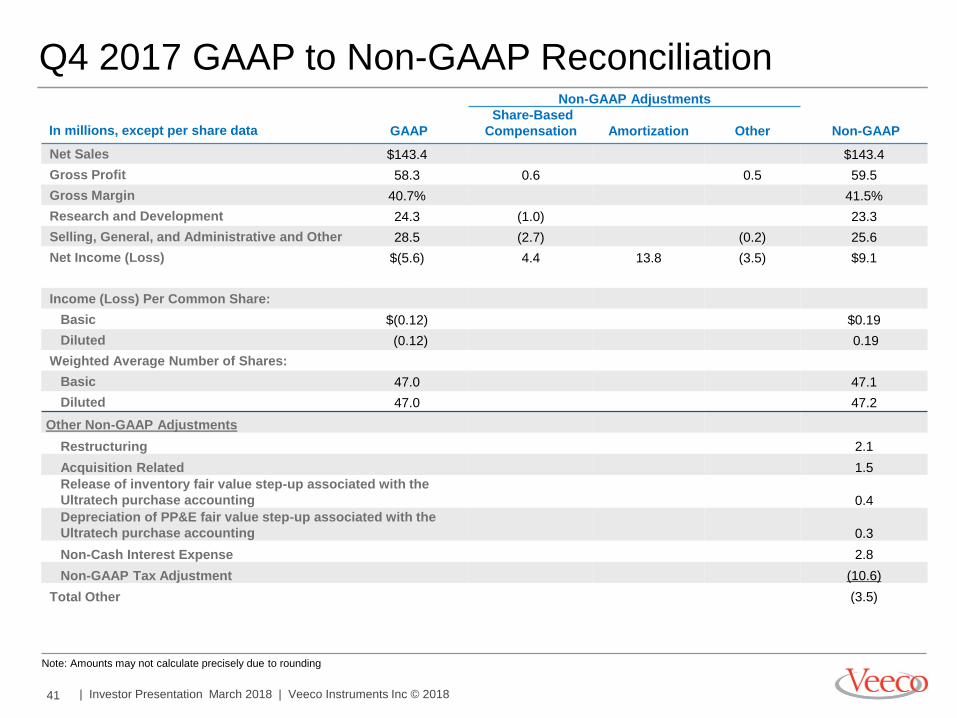
41 | Investor Presentation March 2018 | Veeco Instruments Inc © 2018
Q4 2017 GAAP to Non-GAAP Reconciliation Non-GAAP Adjustments
In millions, except per share data GAAP
Share-Based
Compensation
Amortization Other Non-GAAP
Net Sales $143.4 $143.4
Gross Profit 58.3 0.6 0.5 59.5
Gross Margin 40.7% 41.5%
Research and Development 24.3 (1.0) 23.3
Selling, General, and Administrative and Other 28.5 (2.7) (0.2) 25.6
Net Income (Loss) $(5.6) 4.4 13.8 (3.5) $9.1
Income (Loss) Per Common Share:
Basic $(0.12) $0.19
Diluted (0.12) 0.19
Weighted Average Number of Shares:
Basic 47.0 47.1
Diluted 47.0 47.2
Other Non-GAAP Adjustments
Restructuring 2.1
Acquisition Related 1.5
Release of inventory fair value step-up associated with the
Ultratech purchase accounting 0.4
Depreciation of PP&E fair value step-up associated with the
Ultratech purchase accounting 0.3
Non-Cash Interest Expense 2.8
Non-GAAP Tax Adjustment (10.6)
Total Other (3.5)
Note: Amounts may not calculate precisely due to rounding
42 | Investor Presentation March 2018 | Veeco Instruments Inc © 2018
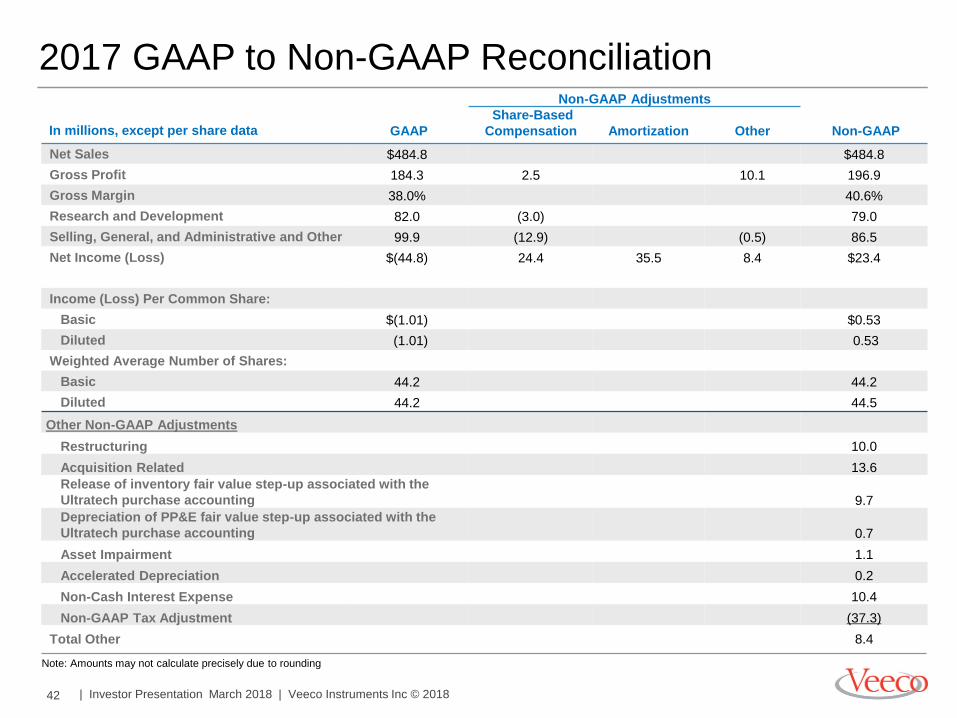
2017 GAAP to Non-GAAP Reconciliation Non-GAAP Adjustments
In millions, except per share data GAAP
Share-Based
Compensation
Amortization Other Non-GAAP
Net Sales $484.8 $484.8
Gross Profit 184.3 2.5 10.1 196.9
Gross Margin 38.0% 40.6%
Research and Development 82.0 (3.0) 79.0
Selling, General, and Administrative and Other 99.9 (12.9) (0.5) 86.5
Net Income (Loss) $(44.8) 24.4 35.5 8.4 $23.4
Income (Loss) Per Common Share:
Basic $(1.01) $0.53
Diluted (1.01) 0.53
Weighted Average Number of Shares:
Basic 44.2 44.2
Diluted 44.2 44.5
Other Non-GAAP Adjustments
Restructuring 10.0
Acquisition Related 13.6
Release of inventory fair value step-up associated with the
Ultratech purchase accounting 9.7
Depreciation of PP&E fair value step-up associated with the
Ultratech purchase accounting 0.7
Asset Impairment 1.1
Accelerated Depreciation 0.2
Non-Cash Interest Expense 10.4
Non-GAAP Tax Adjustment (37.3)
Total Other 8.4
Note: Amounts may not calculate precisely due to rounding