Embed Size (px)
Citation preview

Q3/20 Sector Report
IT / SoftwareVertical Sector Focus: Healthcare IT
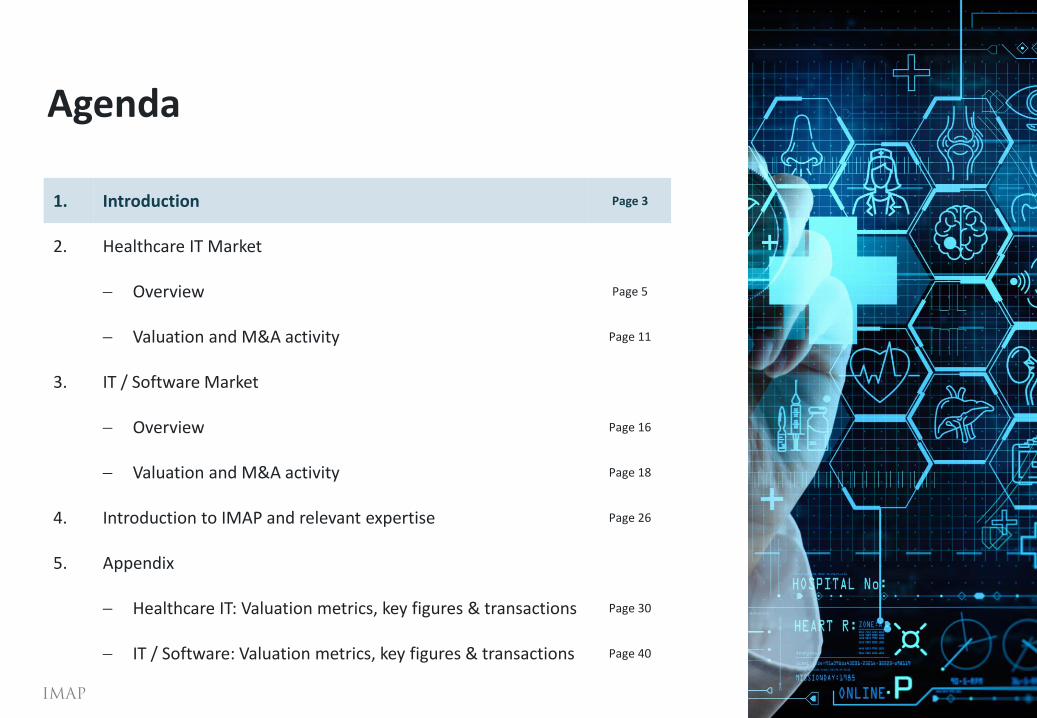
Agenda
November
1. Introduction Page 3
2. Healthcare IT Market
− Overview Page 5
− Valuation and M&A activity Page 11
3. IT / Software Market
− Overview Page 16
− Valuation and M&A activity Page 18
4. Introduction to IMAP and relevant expertise Page 26
5. Appendix
− Healthcare IT: Valuation metrics, key figures & transactions Page 30
− IT / Software: Valuation metrics, key figures & transactions Page 40

Introduction▪ We are pleased to present the IT/ Software Report Q3 2020. This report provides insights and analysis on
current market trends, valuation developments as well as M&A dynamics within the Software and IT Services sector in Q3 2020
▪ This edition includes a special vertical sector focus on Healthcare IT. It provides an overview of market segments, trends and players in healthcare IT as well data on recent M&A activity and valuations
▪ The data shows distinct differences between the Healthcare IT market segments: whereas more traditional segments such as "ERP", "Data Management & Services" or "Administrative or Financial Management Software" have moved mostly sideways, valuations and number of transactions in emerging high-growth segments such as "Telehealth & Virtual Care" have increased strongly - despite and to some degree also favored by the Pandemic
Dr. Carsten LehmannManaging Partner
Martin MichalekAssociate
Lennart HunoldAnalyst
November
Nils KellerDirector
Ruta HildebrandPartner
Healthcare specialistDigital technology team

Agenda
November
1. Introduction Page 3
2. Healthcare IT Market
− Overview Page 5
− Valuation and M&A activity Page 11
3. IT / Software Market
− Overview Page 16
− Valuation and M&A activity Page 18
4. Introduction to IMAP and relevant expertise Page 26
5. Appendix
− Healthcare IT: Valuation metrics, key figures & transactions Page 30
− IT / Software: Valuation metrics, key figures & transactions Page 40

Technology enables individualized medical care and value-based reimbursements
Assessing compliance risk in environment with stringent and dynamic regulation
Automation and digitalization of processes lead to increased efficiency gains
Predictive Analytics allows for coping with increasing complexity and time pressure
AI is increasingly used in product development, diagnostics and fraud detection
Accelerating acceptance of telehealth services among patients and insurers
Wearables facilitate the collection of data and promote new business models
Application of virtual reality for education and treatment purposes in the healthcare industry
Introduction to the Healthcare IT Market
5
Market segmentation and overview of trends and market developments
November 2020
Introduction and segment overview Key trends
Sources: gminsights, statistaNote: 1) Includes: Connected Medical Devices, Healthcare & Medical Apps and mobile Health Services
Global mobile Health market vol.1)
CAGR: 15.6%
▪ The Healthcare Information Technology sector has experienced strong growth in recent years. In particular, global digitalization and new technological opportunities have played a major role as market drivers
▪ The COVID-19 pandemic has accelerated the digitalization of healthcare care provision due to significantly increased demand for remote consultation with physicians and digital therapies
▪ The Healthcare IT market players offer a wide range of products and solutions that contribute to a more efficient and effective healthcare infrastructure. A brief overview of six selected sub-segments reflects the dynamics of this multi-faceted market:
Healthcare Enterprise Software: companies providing inventory management, SCM, POM, HR management software etc.
Data Management and Services: companies providing predictive, descriptive, prescriptive and cognitive analytics software and services
Administrative and Financial Management: companies offering medical billing and financial management software and services
Drug Discovery and Clinical Research: digital solution providers for sequencing and data analysis, docking and molecular modelling etc.
Virtual Care/ Telehealth: companies providing software solutions for real-time tele medicine, remote monitoring and care related applications
Imaging and Diagnostics: companies providing software solutions for image diagnostics (MRI, Ultrasound, Xray, CT, etc)
Global Healthcare IT market vol.
(in EUR bn) (in EUR bn)
163.1
450.1
2020 2026E
31.5 38.9 51.8
70.8
99.2
142.4
209.4
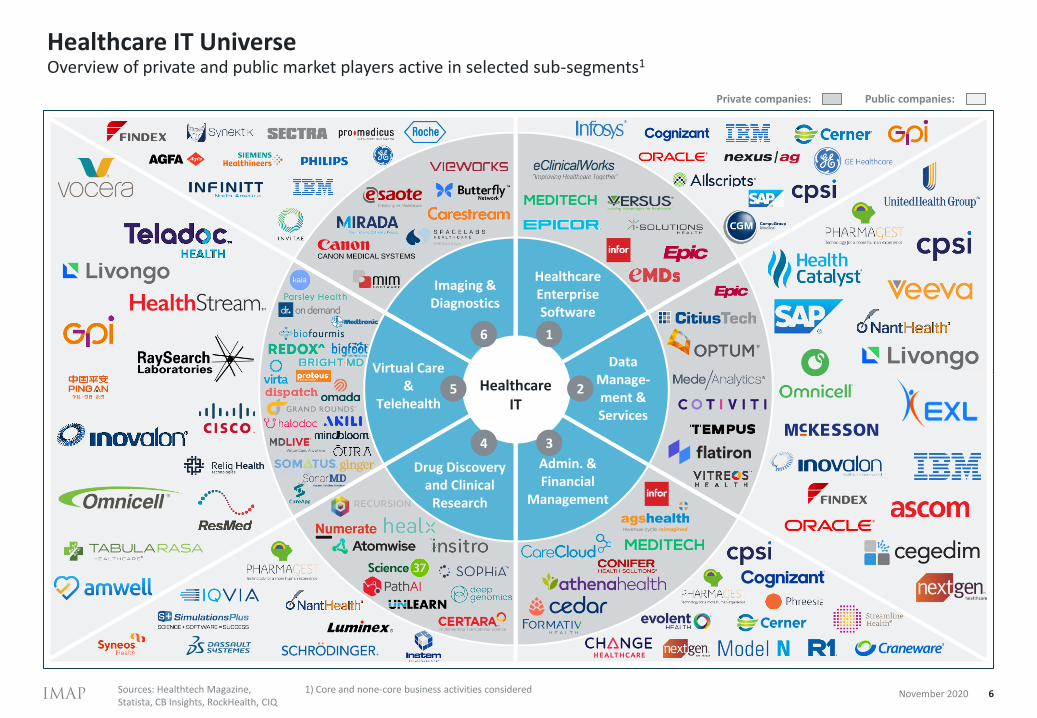
Healthcare IT Universe
6
Overview of private and public market players active in selected sub-segments1
November 2020Sources: Healthtech Magazine, Statista, CB Insights, RockHealth, CIQ
Healthcare Enterprise Software
Data Manage-ment & Services
Admin. & Financial
Management
Drug Discovery and Clinical
Research
Virtual Care &
Telehealth
Imaging & Diagnostics
Healthcare IT
1
2
34
5
6
1) Core and none-core business activities considered
Private companies: Public companies:

Data Management and ServicesHealthcare Enterprise Software
Selected industry trendsHealthcare Enterprise Software | Data Management and Services
Source: Statista, researchandmarkets Note: 1) Global healthcare big data market share by component in 2016 and a forecast for 2025
IT systems allow productivity and efficiency improvements at hospitals and outpatient medical centers
An already high and still growing number of resident physicians use EHR/EMR systems for patient data
Rising R&D activities for the development of innovative software solutions to improve the network coverage
Stringent rules to improve coverage of the entire healthcare network
Market size
36.7
76.5
2019 2025E
CAGR: 13.0%
Transition from paper charts to real-time monitoring systems and the use of electronic health records to gather patients’ health data
Industry players invest significant amounts of money in R&D processes to offer unique platforms and solutions with enhanced features to gain competitive advantage
The outbreak of COVID-19 prompted nations across the globe to reconsider the initiative to implement healthcare analytics
Increasing need for business intelligence to optimize health administration and strategy
Global market % by component1 Market size
10.4
58.3
2016 2025E
CAGR: 21.2%
21
November 2020 7
26% 24%
33% 34%
41% 42%
2016 2025E
Hardware Software Analytics services(in EUR bn) (in EUR bn)

Drug discovery and Clinical Research
November 2020 8
Administrative and Financial Management
Selected industry trendsAdministrative and Financial Management | Drug discovery and Clinical Research
Market size
Source: Statista, researchandmarkets Note: 1) Global AI-enabled drug discovery and clinical trials market by region 2030
Regulatory mandates for the adoption of EHR/EMR to determine whether the patient is eligible for payment
Increasing exposure to challenges such as cybercrime, or changing government regulations requires specific analysis, monitoring and detection solutions
Demand for efficiency-enhancing software to counter increasing cost pressure within the healthcare sector
Reduction in manual billing errors or preventing the duplication of work can improve financial performance
Global market % by region in 20301
AI-enabled prediction tools improve the speed and accuracy of preclinical testing
More efficient design of the R&D process helps companies to reduce costs
Improvement of drug approval rates through IT-supported, and more effective R&D processes
Increasing R&D expenditures in the pharmaceutical and biopharmaceutical industry
58%
25%
13%
4%
NA EUR APAC RoW
CAGR: 26.7%
Market size
(in EUR bn) (in EUR bn)
43
99.9
179.5
2018 2026E
0.2
3.0
2018 2030E
CAGR: 7.6%
Remote consultations and therapies allow healthcare provision to remotely located patients as well as a country wide coverage
Increasing use of smartphones and a growing number of internet users drive the increasing adoption of digital therapeutics among patients
Growing demand for convenient, digital solutions to monitor vital stats without intervention
Monitoring of intake ensures continuous supply of medication to the patient
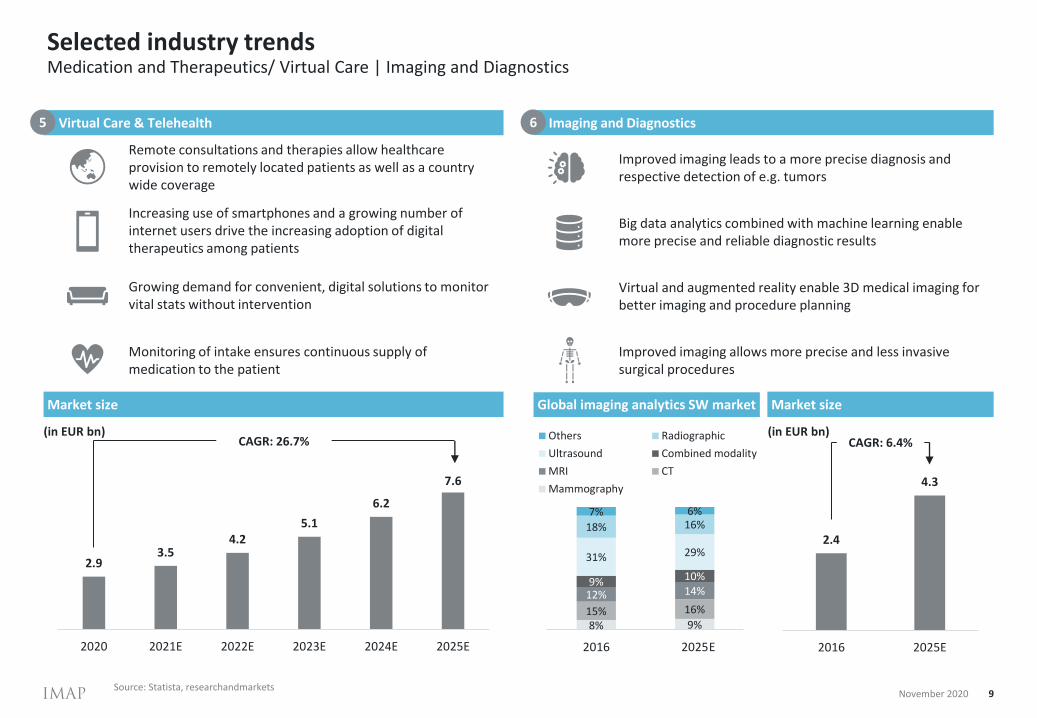
Imaging and Diagnostics
November 2020 9
Virtual Care & Telehealth
Selected industry trendsMedication and Therapeutics/ Virtual Care | Imaging and Diagnostics
Market size
Source: Statista, researchandmarkets
Global imaging analytics SW market
CAGR: 26.7%
Improved imaging leads to a more precise diagnosis and respective detection of e.g. tumors
Big data analytics combined with machine learning enable more precise and reliable diagnostic results
Virtual and augmented reality enable 3D medical imaging for better imaging and procedure planning
Improved imaging allows more precise and less invasive surgical procedures
Market size
8% 9%15% 16%12% 14%9% 10%
31% 29%
18% 16%7% 6%
2016 2025
Others Radiographic
Ultrasound Combined modality
MRI CT
Mammography
(in EUR bn) (in EUR bn)
65
2.4
4.3
2016 2025E
2.93.5
4.25.1
6.2
7.6
2020 2021E 2022E 2023E 2024E 2025E E
CAGR: 6.4%

Agenda
November
1. Introduction Page 3
2. Healthcare IT Market
− Overview Page 5
− Valuation and M&A activity Page 11
3. IT / Software Market
− Overview Page 16
− Valuation and M&A activity Page 18
4. Introduction to IMAP and relevant expertise Page 26
5. Appendix
− Healthcare IT: Valuation metrics, key figures & transactions Page 30
− IT / Software: Valuation metrics, key figures & transactions Page 40
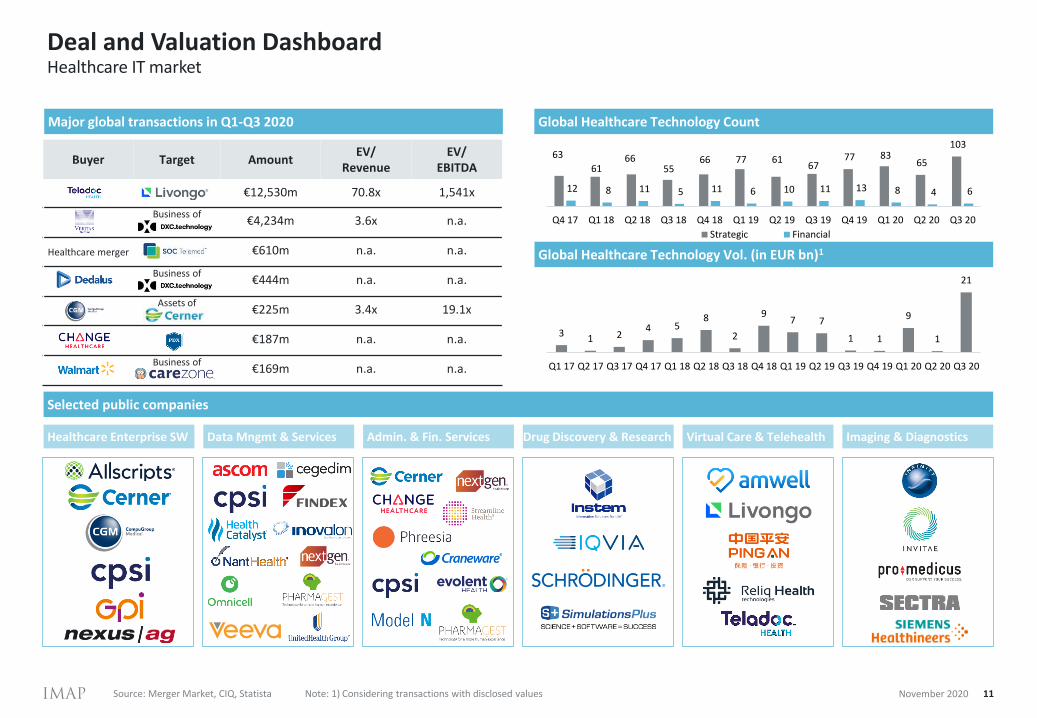
Deal and Valuation Dashboard
11
Healthcare IT market
November 2020Source: Merger Market, CIQ, Statista
Major global transactions in Q1-Q3 2020 Global Healthcare Technology Count
Buyer Target AmountEV/
RevenueEV/
EBITDA
€12,530m 70.8x 1,541x
Business of€4,234m 3.6x n.a.
Healthcare merger €610m n.a. n.a.
Business of€444m n.a. n.a.
Assets of€225m 3.4x 19.1x
€187m n.a. n.a.
Business of€169m n.a. n.a.
Global Healthcare Technology Vol. (in EUR bn)1
31 2
4 58
2
97 7
1 1
9
1
21
Q1 17 Q2 17 Q3 17 Q4 17 Q1 18 Q2 18 Q3 18 Q4 18 Q1 19 Q2 19 Q3 19 Q4 19 Q1 20 Q2 20 Q3 20
63
61 66
55 66 77 61
67 77 83
65
103
12 8 11 5 11 6 10 11 13 8 4 6
Q4 17 Q1 18 Q2 18 Q3 18 Q4 18 Q1 19 Q2 19 Q3 19 Q4 19 Q1 20 Q2 20 Q3 20
Strategic Financial
Note: 1) Considering transactions with disclosed values
Selected public companies
Healthcare Enterprise SW Data Mngmt & Services Admin. & Fin. Services Drug Discovery & Research Virtual Care & Telehealth Imaging & Diagnostics
50%
150%
250%
350%
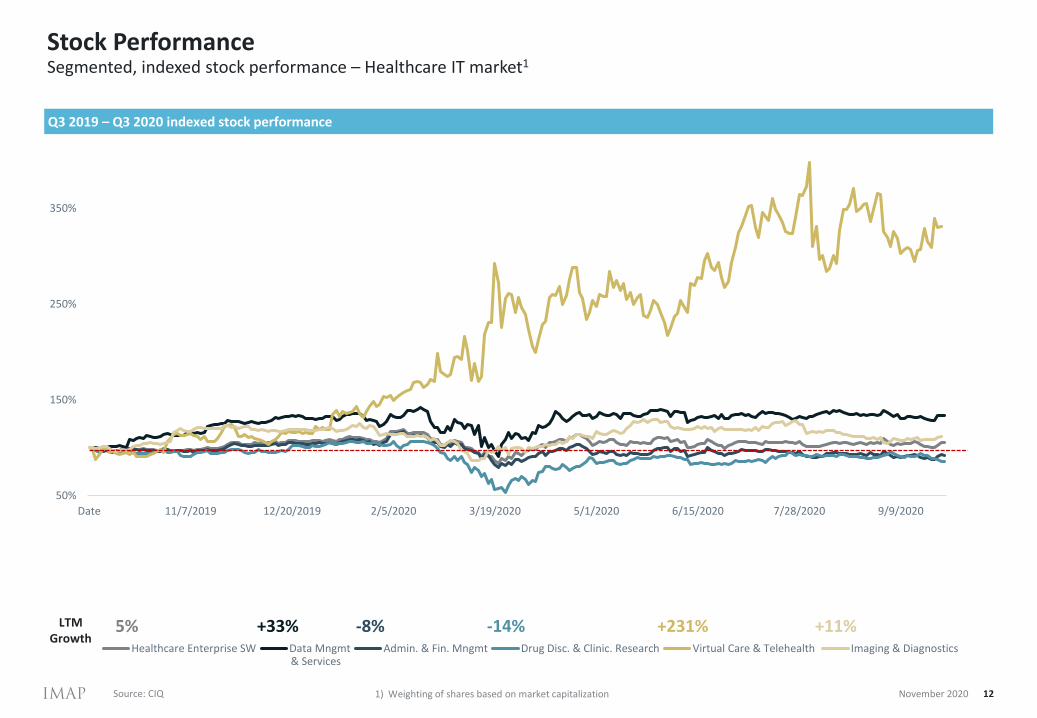
Date 11/7/2019 12/20/2019 2/5/2020 3/19/2020 5/1/2020 6/15/2020 7/28/2020 9/9/2020
Healthcare Enterprise SW Data Mngmt Admin. & Fin. Mngmt Drug Disc. & Clinic. Research Virtual Care & Telehealth Imaging & Diagnostics
Stock Performance
12
Segmented, indexed stock performance – Healthcare IT market1
November 2020Source: CIQ
Q3 2019 – Q3 2020 indexed stock performance
LTM Growth
5% +33% -8% -14% +231% +11%
& Services
1) Weighting of shares based on market capitalization

Segment Valuation (I/II)
13
Median segment valuation metrics and operating KPIs in 2020E
Source: CIQ November 2020
EV/Revenue 2020E Revenue growth 2020E (YOY)
EV/EBITDA 2020E EBITDA margin 2020E
2.9x4.8x
3.4x
17.0x
27.0x
12.4x
HealthcareEnterpriseSoftware
DataManagement &
Services
Admin. &Financial
Management
Drug Discoveryand Clinical
Research
Virtual Care /Telehealth
Imaging &Diagnostics
12.1x 17.2x 17.6x 17.7x
274.7x
55.5x
HealthcareEnterpriseSoftware
DataManagement &
Services
Admin. &Financial
Management
Drug Discoveryand Clinical
Research
Virtual Care /Telehealth
Imaging &Diagnostics
0.0% 0.2% 1.4%
9.6%
63.7%
14.7%
HealthcareEnterpriseSoftware
DataManagement &
Services
Admin. &Financial
Management
Drug Discoveryand Clinical
Research
Virtual Care /Telehealth
Imaging &Diagnostics
20.4%17.5% 16.8%
20.6%
-1.8%
19.2%
HealthcareEnterpriseSoftware
DataManagement &
Services
Admin. &Financial
Management
Drug Discoveryand Clinical
Research
Virtual Care /Telehealth
Imaging &Diagnostics

Segment Valuation (II/II)
14
Development of the median segment valuation metrics between 2020E and 2022E
Source: CIQ November 2020
EV/Revenue 2020E-2022E Revenue growth 2020E-2022E (YOY)
EV/EBITDA 2020E-2022E EBITDA margin 2020E-2022E
2.9x4.8x
3.4x
17.0x
27.0x
12.4x
2.8x 3.5x 3.5x
11.5x
21.9x
11.6x
2.7x 3.1x 3.2x
8.3x
16.0x
9.0x
HealthcareEnterpriseSoftware
DataManagement &
Services
Admin. &Financial
Management
Drug Discoveryand Clinical
Research
Virtual Care /Telehealth
Imaging &Diagnostics
2020E 2021E 2022E
12.1x
17.2x
17.6x 17.7x
274.7x
55.5x
10.5x12.4x 15.3x 15.0x
175.9x
50.6x
9.8x11.2x 14.6x 13.7x
108.5x
45.0x
HealthcareEnterpriseSoftware
DataManagement &
Services
Admin. &Financial
Management
Drug Discoveryand Clinical
Research
Virtual Care /Telehealth
Imaging &Diagnostics
2020E 2021E 2022E
0.0% 0.2% 1.4%
9.6%
63.7%
14.7%
6%9%
2%
18%
38%
10%4%
10% 11%15%
34%
19%
HealthcareEnterpriseSoftware
DataManagement &
Services
Admin. &Financial
Management
Drug Discoveryand Clinical
Research
Virtual Care /Telehealth
Imaging &Diagnostics
2020E 2021E 2022E
20.4%17.5%
16.8%
20.6%
-1.8%
19.2%21%
20% 19%
21%
3%
22%21%
20% 19%22%
8%
22%
HealthcareEnterpriseSoftware
DataManagement &
Services
Admin. &Financial
Management
Drug Discoveryand Clinical
Research
Virtual Care /Telehealth
Imaging &Diagnostics
2020E 2021E 2022E

Agenda
November
1. Introduction Page 3
2. Healthcare IT Market
− Overview Page 5
− Valuation and M&A activity Page 11
3. IT / Software Market
− Overview Page 16
− Valuation and M&A activity Page 18
4. Introduction to IMAP and relevant expertise Page 26
5. Appendix
− Healthcare IT: Valuation metrics, key figures & transactions Page 30
− IT / Software: Valuation metrics, key figures & transactions Page 40
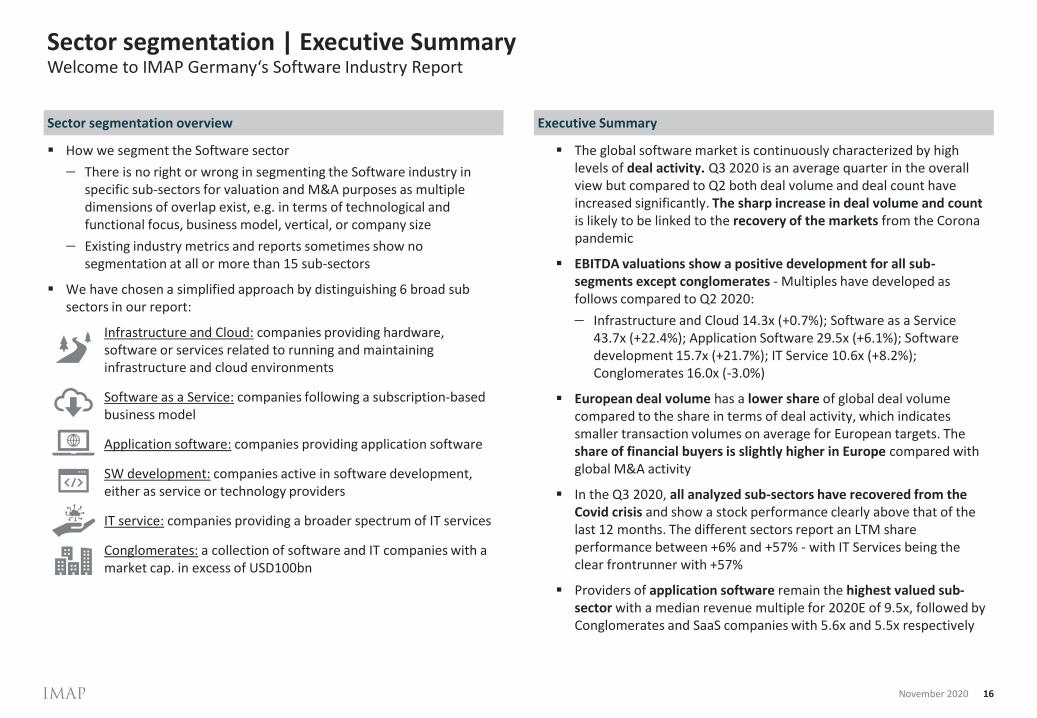
▪ How we segment the Software sector
− There is no right or wrong in segmenting the Software industry in specific sub-sectors for valuation and M&A purposes as multiple dimensions of overlap exist, e.g. in terms of technological and functional focus, business model, vertical, or company size
− Existing industry metrics and reports sometimes show no segmentation at all or more than 15 sub-sectors
▪ We have chosen a simplified approach by distinguishing 6 broad sub sectors in our report:
Infrastructure and Cloud: companies providing hardware, software or services related to running and maintaining infrastructure and cloud environments
Software as a Service: companies following a subscription-based business model
Application software: companies providing application software
SW development: companies active in software development, either as service or technology providers
IT service: companies providing a broader spectrum of IT services
Conglomerates: a collection of software and IT companies with a market cap. in excess of USD100bn
Sector segmentation | Executive Summary
16
Welcome to IMAP Germany‘s Software Industry Report
November 2020
▪ The global software market is continuously characterized by high levels of deal activity. Q3 2020 is an average quarter in the overall view but compared to Q2 both deal volume and deal count have increased significantly. The sharp increase in deal volume and count is likely to be linked to the recovery of the markets from the Corona pandemic
▪ EBITDA valuations show a positive development for all sub-segments except conglomerates - Multiples have developed as follows compared to Q2 2020:
− Infrastructure and Cloud 14.3x (+0.7%); Software as a Service 43.7x (+22.4%); Application Software 29.5x (+6.1%); Software development 15.7x (+21.7%); IT Service 10.6x (+8.2%); Conglomerates 16.0x (-3.0%)
▪ European deal volume has a lower share of global deal volume compared to the share in terms of deal activity, which indicates smaller transaction volumes on average for European targets. The share of financial buyers is slightly higher in Europe compared with global M&A activity
▪ In the Q3 2020, all analyzed sub-sectors have recovered from the Covid crisis and show a stock performance clearly above that of the last 12 months. The different sectors report an LTM share performance between +6% and +57% - with IT Services being the clear frontrunner with +57%
▪ Providers of application software remain the highest valued sub-sector with a median revenue multiple for 2020E of 9.5x, followed by Conglomerates and SaaS companies with 5.6x and 5.5x respectively
Sector segmentation overview Executive Summary
Agenda
November
1. Introduction Page 3
2. Healthcare IT Market
− Overview Page 5
− Valuation and M&A activity Page 11
3. IT / Software Market
− Overview Page 16
− Valuation and M&A activity Page 18
4. Introduction to IMAP and relevant expertise Page 26
5. Appendix
− Healthcare IT: Valuation metrics, key figures & transactions Page 30
− IT / Software: Valuation metrics, key figures & transactions Page 40

Buyer Target AmountEV/
EBITDA
€3,000m 21.7x
€1,000m 16.9x
€155m n.a.
€136m n.a.
€128m n.a.
€91m n.a.
€76m n.a.
Deal Dashboard
18
Application and system software market
Selected global transactions
Quarterly transaction multiples between 2017 and Q3 2020 Top 10 - Most active global buyers 2016 – Q3 2020
Buyer Target AmountEV/
EBITDA
€9,302m 24.0x
Project Viking €4,522m n.a.
€3,931m 13.6x
€1,356m n.a.
€658m ~7.0x
€657m n.a.
€643m n.a.
Selected European transactionsEurope M&A volume in EUR bn
Europe M&A deal count
Source: CIQ, Merger Market
Deal Count Deal volume in EUR bn
November 2020
IBM 35.7
Broadcom Inc. 32.5
salesforce.com, inc. 32.4
Thoma Bravo, LLC 19.5
Vista Equity Partners LLC 15.8
Intel Corporation 15.5
GIC Pte. Ltd. 12.8
Qatar Investment 12.5
Hellman & Friedman LLC 11.9
Canada Pension Plan 11.0
Thoma Bravo, LLC 31
Vista Equity Partners LLC 20
Cisco Systems, Inc. 16
VMware, Inc. 16
salesforce.com, inc. 15
Insight Venture 14
Marlin Equity Partners 14
Hg Capital LLP 13
Oracle Corporation 12
Microsoft Corp. 11
3.1x2.2x 2.7x 2.3x
3.4x
7.0x
3.5x2.6x
3.9x 3.2x 2.5x
4.5x3.4x 2.7x 3.0x
12.7x
16.2x17.9x
15.4x 15.0x 15.4x
17.7x
15.6x
18.4x
15.1x 14.6x 15.0x16.5x
11.0x12.9x
Q12017
Q22017
Q32017
Q42017
Q12018
Q22018
Q32018
Q42018
Q12019
Q22019
Q32019
Q42019
Q12020
Q22020
Q32020
EV/Revenue EV/EBITDA
Global M&A volume in EUR bn
Global M&A Deal Count
21 17 14
45
61
29 2733
24 23
5
37
Q417
Q118
Q218
Q318
Q418
Q119
Q219
Q319
Q419
Q120
Q220
Q320
521 561
578 570
599 593
584 624
635 567
462 581
69 56 81 49 72 60 58 68 67 68 37 68
Q417
Q118
Q218
Q318
Q418
Q119
Q219
Q319
Q419
Q120
Q220
Q320
Strategic Financial
8
24
63
6
23
57
1
5
Q417
Q118
Q218
Q318
Q418
Q119
Q219
Q319
Q419
Q120
Q220
Q320
198
172
189 194 197 208 185
199 199 191 162 204
28 17 34 29 25 31 26 22 31 31 16 39
Q417
Q118
Q218
Q318
Q418
Q119
Q219
Q319
Q419
Q120
Q220
Q320
Strategic Financial
38
2 15 5 4 2 2
72
4 51 2 3
4
94
2 3 1 1 21
3
9
5
3 34 1 2
3
3
1
3 2 22
31
20
14 14 1311
9 9 8
2016 2017 2018 2019 2020
3 2
7 6
24 4
2
4
2
2
2
31
2
3
4
2
2
3
4
1
3
3
4
6
4
15
2
1
1
42
1
2 31
4 1
16 16
15
1211 11 11 11
10
2016 2017 2018 2019 2020
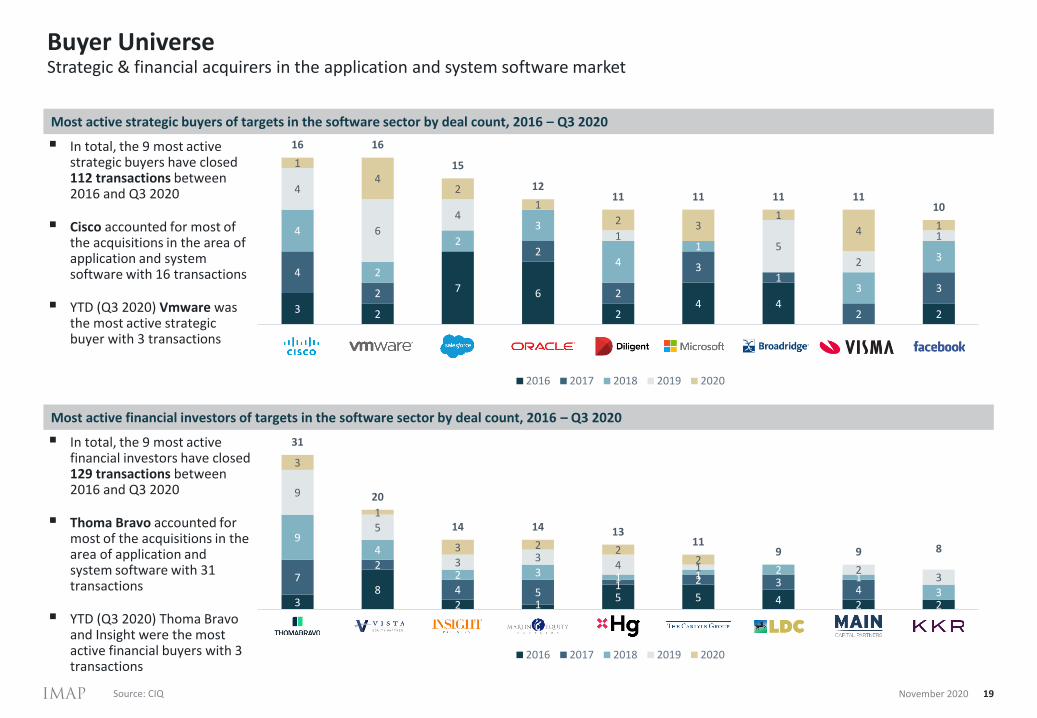
Buyer Universe
19
Strategic & financial acquirers in the application and system software market
Most active strategic buyers of targets in the software sector by deal count, 2016 – Q3 2020
Most active financial investors of targets in the software sector by deal count, 2016 – Q3 2020
▪ In total, the 9 most active strategic buyers have closed 112 transactions between 2016 and Q3 2020
▪ Cisco accounted for most of the acquisitions in the area of application and system software with 16 transactions
▪ YTD (Q3 2020) Vmware wasthe most active strategic buyer with 3 transactions
▪ In total, the 9 most active financial investors have closed 129 transactions between 2016 and Q3 2020
▪ Thoma Bravo accounted for most of the acquisitions in the area of application and system software with 31 transactions
▪ YTD (Q3 2020) Thoma Bravo and Insight were the most active financial buyers with 3 transactions
Source: CIQ November 2020

Public Company Valuation
20
Selected public companies by sub-sector
Σ MCap:XY
∅ EV/Revenue 2020:XY
∅ EV/EBITDA 2020: XY
Infrastructure SaaS Application
Software Development IT Services Conglomerates
November 2020
Median MCap:EURm 6,840
Median EV/Revenue:1.2x
Median EV/EBITDA:10.6x
Median MCap:EURm 4,764
Median EV/Revenue:5.5x
Median EV/EBITDA:43.7x
Median MCap:EURm 16,118
Median EV/Revenue:3.2x
Median EV/EBITDA:15.7x
Median MCap:EURm 13,115
Median EV/Revenue:4.4x
Median EV/EBITDA:14.3x
Median MCap:EURm 30,553
Median EV/Revenue:9.5x
Median EV/EBITDA:29.5x
Median MCap:EURm 177,806
Median EV/Revenue:5.6x
Median EV/EBITDA:16.0x
1) 2020 Median EV/ Revenue and Median EV/EBITDA figures

Stock Performance
21
LTM Growth
Source: CIQ
Q3 2019 – Q3 2020 indexed stock performance
1) Weighting of shares based on market capitalization November 2020
Segmented, indexed stock performance – Software market1
60%
80%
100%
120%
140%
160%
180%
Date 11/7/2019 12/20/2019 2/5/2020 3/19/2020 5/1/2020 6/15/2020 7/28/2020 9/9/2020
Infrastructure SaaS Application Software Developer IT Services Conglomerates
+6% +17% +23% +44% +57% +21%

Segment Valuation (I/III)
22
Median segment valuation metrics and operating KPIs in 2020E
Source: CIQ November 2020
EV/Revenue 2020E Revenue growth 2020E
EV/EBITDA 2020E EBITDA margin 2020E
4.4x
5.5x
9.5x
3.2x
1.2x
5.6x
Infrastructure &Cloud
SaaS Application SoftwareDeveloper
IT Service Conglomerates
Median
14.3x
43.7x
29.5x
15.7x
10.6x
16.0x
Infrastructure &Cloud
SaaS Application SoftwareDeveloper
IT Service Conglomerates
Median
-2%
15%
4%
-1% -1%
2%
Infrastructure &Cloud
SaaS Application SoftwareDeveloper
IT Service Conglomerates
Median
37%
14%
32%
19%
14%
41%
Infrastructure &Cloud
SaaS Application SoftwareDeveloper
IT Service Conglomerates
Median

Segment Valuation (II/III)
23
Development of the median segment valuation metrics between 2020E and 2022E
Source: CIQ November 2020
EV/Revenue 2020E-2022E Revenue growth 2020E-2022E
EV/EBITDA 2020E-2022E EBITDA margin 2020E-2022E
4.4x 5.5x
9.5x
3.2x
1.2x
5.6x
4.3x 4.8x
8.3x
3.1x
1.1x
5.3x
3.9x4.2x
7.0x
2.8x
1.0x
5.0x
Infrastructure &Cloud
SaaS Application SoftwareDeveloper
IT Service Conglomerates
2020E 2021E 2022E
14.3x
43.7x
29.5x
15.7x
10.6x16.0x
13.2x
34.2x
26.0x
16.8x
9.3x 13.6x11.7x
28.2x
23.0x
15.7x
8.8x11.3x
Infrastructure &Cloud
SaaS Application SoftwareDeveloper
IT Service Conglomerates
2020E 2021E 2022E
-2%
15%
4%
-1% -1%
2%3%
11%10%
5%4%
6%6%
13%
11%
7%
5%
10%
Infrastructure &Cloud
SaaS Application SoftwareDeveloper
IT Service Conglomerates
2020E 2021E 2022E
32%
8%
24%
15%
9%
33%31%
11%
27%
16%
9%
32%32%
11%
27%
16%
10%
33%
Infrastructure &Cloud
SaaS Application SoftwareDeveloper
IT Service Conglomerates
2020E 2021E 2022E

Adobe
AlphabetCisco Facebook
IntelIBM
Microsoft
Oracle
Salesforce
SAP
0.0x
5.0x
10.0x
15.0x
-8.0% -4.0% 0.0% 4.0% 8.0% 12.0% 16.0% 20.0% 24.0%
EV/2
02
0E
Rev
enu
e
2020E Revenue Growth
Segment Valuation (III/III)
24
Correlation between EV/Revenue 2020E and revenue growth 2020E
Source: CIQ November 2020
Infrastructure Software Developer
SaaS IT Service
Application Conglomerates
AKAM ANETCHKP
CSCO
CTXS
FFIVJNPRMCRO SCT
VMW
0.0x
5.0x
10.0x
15.0x
-5.0% 0.0% 5.0% 10.0% 15.0%
EV/2
02
0E
Rev
enu
e
2020E Revenue Growth
ADBEBLKB
BOX
DOCU
DBXENV
GWRE
0PFPT
PSTG
QADA
CRM
WDAY
ZEN
ZUO0.0x
10.0x
20.0x
30.0x
40.0x
-10.0% 0.0% 10.0% 20.0% 30.0% 40.0%
EV/2
02
0E
Rev
enu
e
2020E Revenue Growth
ACN
GIB.A
CTSHEPAM
GLOB
HCLTECH
INFY
NRO
PRGS
0.0x
5.0x
10.0x
15.0x
0.0% 5.0% 10.0% 15.0% 20.0% 25.0%
EV/2
02
0E
Rev
enu
e
2020E Revenue Growth
ACN
ADN1AEIN
ATO BC8COK
CAPGIB.A
CTSH
CCC
D6HDVT
IDR
INFY
IBM
NTTSOP
WIP
0.0x
1.0x
2.0x
3.0x
4.0x
5.0x
-10.0% -6.0% -2.0% 2.0% 6.0% 10.0% 14.0%
EV/2
02
0E
Rev
enu
e
2020E Revenue Growth
ACN
GIB.A
CTSH EPAM
GLOB
HCLTECH
INFY
NRO
PRGS
0.0x
5.0x
10.0x
0.0% 5.0% 10.0% 15.0% 20.0% 25.0%
EV/2
02
0E
Rev
enu
e
2020E Revenue Growth
Agenda
November
1. Introduction Page 3
2. Healthcare IT Market
− Overview Page 5
− Valuation and M&A activity Page 11
3. IT / Software Market
− Overview Page 16
− Valuation and M&A activity Page 18
4. Introduction to IMAP and relevant expertise Page 26
5. Appendix
− Healthcare IT: Valuation metrics, key figures & transactions Page 30
− IT / Software: Valuation metrics, key figures & transactions Page 40

IMAP is a leading mid-cap M&A firm specialized on privately owned companies
November 2020 26
Strong track record of more than 200 transactions annually with transaction values ranging from c. € 20m – 300m
Our values:
Execution
Dedication
Talent
Informality
IMAP is a global, integrated and focused platform with 60 offices and more than 500 professionals worldwide
Global M&A organization with more
than 60 offices in 43 countries, thereof 3 in
Germany
c. 500 employeesthereof 40 in Germany
Ø 220 transactions p.a., thereof c. 20-25
in Germany
Annual transactionvolume > USD 10bn. -
typical deal value range: USD 20 - 300m
Successful in the German market since
1997
Managed by partners with
experience, who are only responsible to the
customer
International sector teams
connected via global IT platform
Regularly ranked among Top 10 M&A
advisory firms
23

IMAP Global Technology TeamGlobally active with experienced sector experts
November 2020 27
Expert team Germany
# dealmakers: >30
International sector cooperation IMAP Digital Technology Deal Statistics
IMAP Germany Digital Technology Team
Expert team Nordics
# dealmakers: >15
Expert team BeNeLux
# dealmakers: >40
Expert team Asia
# dealmakers: >20
Expert team UK & Ireland
# dealmakers: >10
Ø approx. 20 deals p.a.
Ø deal value approx. EUR 70 mn
206 deals in the technology sector since 2010
Dr. Carsten LehmannManaging [email protected]
Nils [email protected]
Martin [email protected]
Lennart [email protected]
Deal split by Technology sub-sector1
1) 2010 - Q1 2020
Expert team South America
# dealmakers: >35
Expert team France
# dealmakers: >25
Expert team S/E Europe
# dealmakers: >60
Expert team North America
# dealmakers: >100
Internet Software &services
IT Consulting & services
Other High Tech
Telecommunications
Software
216Deals

November 2020 28
IMAP IT/Software DealsSelected IMAP international deals since 2018
Advisor to EI Towers
Acquired 100%
Advisor to Promedico
Acquired Investment Interest
Advisor to Shoper
Acquired 100%
Advisor to Highland
Acquired a Majority Stake
Advisor to TSS
Acquired 100%
Advisor to neurio
Acquired 100%
Advisor to Lomitel
Acquired 50%
Advisor to Teletronika
Acquired 100%
Advisor to Maximum
Acquired 100%
Advisor to HFM
Acquired 100%
Advisor to Cedacri
Acquired Majority Control
Advisor to Chatmeter
Strategic investment
Acquired 100%
Advisor to ITS Security
Advisor to ArtOrigo
Acquired Minority Shares
Advisor to Omegatech
Acquired 100%
Advisor to WinBooks
Acquired 100%
Advisor to Smulweb
Acquired 100%
Advisor to Trustteam
Acquired Majority Control
Advisor to ISONAS
Acquired 100%
Advisor to loopup
Acquired 100%Acquired 100%
Advisor to APS
Acquired 100%
Advisor to RS
Acquired 100%
Advisor to Canorama
Acquired 100%
Advisor to Cyfrowy Advisor to ETC
Has been acquired in an MBO from
Acquired a Minority stake
Advisor to AOE
Advisor to Catalysts
A Portfolio Company of
Acquired 100%
Advisor to INOBAS
Acquired 100%
Advisor to SemVox
Acquired 100%
Advisor to Ametras
Acquired 100%
Advisor to Onlime
Acquired Satellite Services Business
Advisor to Awetis
Acquired 100%

Agenda
November
1. Introduction Page 3
2. Healthcare IT Market
− Overview Page 5
− Valuation and M&A activity Page 11
3. IT / Software Market
− Overview Page 16
− Valuation and M&A activity Page 18
4. Introduction to IMAP and relevant expertise Page 26
5. Appendix
− Healthcare IT: Valuation metrics, key figures & transactions Page 30
− IT / Software: Valuation metrics, key figures & transactions Page 40
Mkt. Cap Net Debt EV EV/Revenue EV/EBITDA EV/EBIT
Company Segment Country (EUR m) (EUR m) (EUR m) 2020E 2021E 2022E 2020E 2021E 2022E 2020A 2021E 2022E
Allscripts Healthcare Solutions, Inc. 1 US 1,367 832 2,207 1.6x 1.6x 1.6x 8.8x 9.8x 8.9x 15.9x 18.1x 16.2x
Cerner Corporation 1;3 US 18,937 519 19,461 4.1x 4.0x 3.8x 13.0x 12.1x 11.3x 20.6x 18.7x 16.8x
Compugroup Medical SE & Co. KGaA 1 DE 3,982 114 4,096 4.9x 4.5x 4.3x 19.2x 17.2x 16.2x 28.3x 25.1x 23.3x
Computer Programs and Systems, Inc. 1;2;3 US 329 81 407 1.8x 1.7x 1.6x 11.2x 9.1x 8.6x 22.0x 15.4x 13.5x
GPI SpA 1 IT 101 110 213 0.8x 0.8x 0.8x 6.2x 5.8x 5.4x 13.1x 11.4x 10.1x
Nexus AG 1 DE 781 -44 740 4.5x 4.1x 3.8x 19.9x 17.7x 16.0x 34.0x 28.4x 25.0x
Ascom Holding AG 2 CH 368 -1 367 1.4x 1.3x 1.3x 17.4x 12.3x 9.5x 48.4x 22.7x 14.8x
Cegedim SA 2 FR 317 247 564 1.2x 1.1x 1.1x 5.8x 5.3x 5.1x 18.8x 14.8x 13.7x
FINDEX Inc. 2 JP 268 -18 250 6.6x n.a. n.a. 21.1x n.a. n.a. 29.9x n.a. n.a.
Health Catalyst, Inc. 2 US 1,162 -154 1,013 6.5x 5.4x 4.5x n.a. n.a. n.m. n.a. n.a. n.a.
Inovalon Holdings, Inc. 2 US 2,564 784 3,355 5.9x 5.2x 4.7x 17.0x 14.7x 13.2x 53.6x 34.7x 27.8x
NantHealth, Inc. 2 US 191 162 347 5.6x 5.1x 4.5x n.a. n.a. n.a. n.a. n.a. n.a.
NextGen Healthcare, Inc. 2;3 US 797 7 804 1.6x 1.7x 1.6x 9.4x 9.0x 8.6x 58.9x 43.6x 32.4x
Omnicell, Inc. 2 US 3,186 -95 3,089 4.1x 3.5x 3.1x 23.7x 17.5x 14.6x 99.2x 37.9x 27.7x
Pharmagest Interactive SA 2;3 FR 1,312 7 1,323 7.7x 7.0x 6.3x 25.6x 22.4x 19.5x 29.4x 26.5x 23.1x
UnitedHealth Group Incorporated 2 US 254,898 22,349 279,039 1.3x 1.2x 1.1x 12.9x 12.4x 11.2x 14.6x 14.0x 12.4x
Veeva Systems Inc. 2 US 34,743 -1,216 33,507 34.1x 27.5x 22.9x 86.5x 68.8x 58.8x 90.6x 71.8x 60.8x
Change Healthcare Inc. 3 US 3,761 4,489 8,102 2.7x 3.1x 2.7x 9.0x 10.6x 9.0x 18.2x 107.1x 29.2x
Craneware plc 3 GB 462 -41 421 6.6x 6.7x 6.3x 19.6x 19.2x 18.8x 24.2x 23.9x 24.8x
Evolent Health, Inc. 3 US 752 244 988 1.1x 1.2x 1.1x 32.3x 31.1x 20.1x n.a. 34.7x 82.1x
Model N, Inc. 3 US 1,059 -67 994 7.3x 6.6x 5.9x 60.3x 50.8x 39.2x 62.1x 54.8x 43.8x
Phreesia, Inc. 3 US 1,370 -45 1,324 12.0x 10.9x 9.0x n.m. n.m. n.m. n.a. n.a. n.a.
Streamline Health Solutions, Inc. 3 US 41 -2 39 2.3x 3.7x 3.2x 20.5x n.a. n.a. n.a. n.a. n.a.
Instem plc 4 GB 106 -7 98 3.1x 2.9x 2.7x 15.1x 13.8x 12.3x 20.3x 19.1x 16.9x
IQVIA Holdings Inc. 4 US 25,561 9,808 35,683 3.7x 3.3x 3.1x 17.7x 15.1x 13.7x 20.9x 17.5x 15.7x
Schrödinger, Inc. 4 US 2,875 -240 2,642 28.2x 18.3x 12.6x n.a. n.a. n.m. n.a. n.a. n.m.
Simulations Plus, Inc. 4 US 1,117 -6 1,111 32.1x 25.7x 21.1x 84.7x 63.3x 61.4x 110.2x 82.3x 68.7x
American Well Corporation 5 US 4,869 -224 5,362 26.9x 23.9x 18.7x n.a. n.a. n.a. n.a. n.a. n.a.
Livongo Health, Inc. 5 US 12,024 -322 11,699 35.9x 24.2x 16.1x n.m. n.m. n.m. n.a. n.m. n.m.
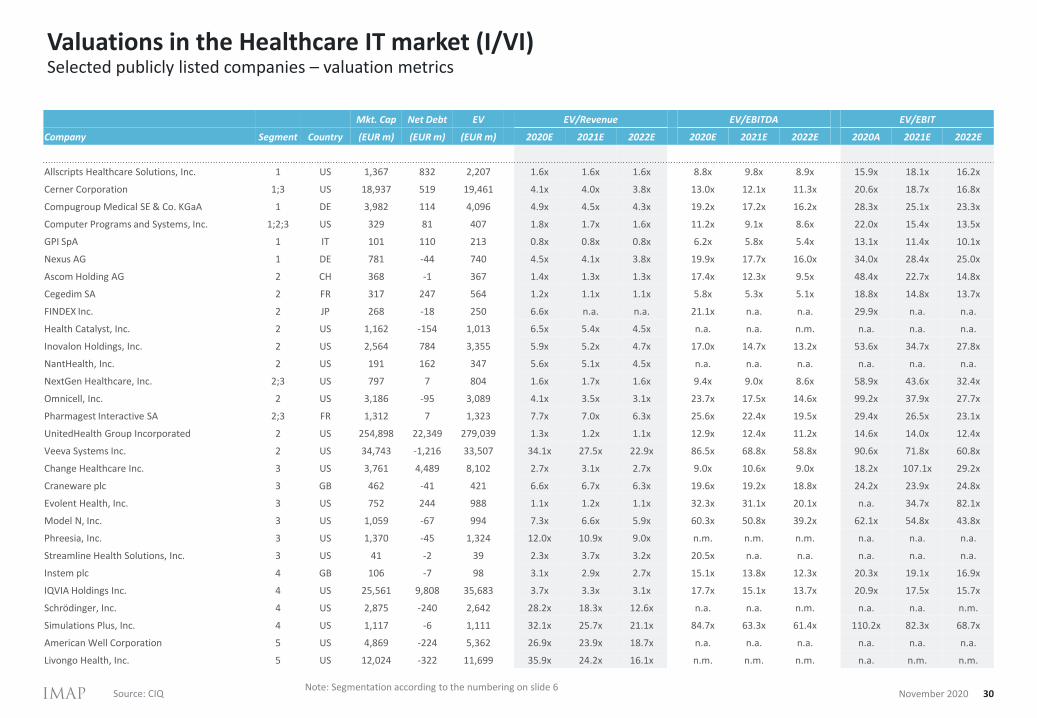
Valuations in the Healthcare IT market (I/VI)
30
Selected publicly listed companies – valuation metrics
Source: CIQ November 2020Note: Segmentation according to the numbering on slide 6
Mkt. Cap Net Debt EV EV/Revenue EV/EBITDA EV/EBIT
Company Segment Country (EUR m) (EUR m) (EUR m) 2020E 2021E 2022E 2020E 2021E 2022E 2020A 2021E 2022E
Ping An Healthcare and Technology Company 5 CN 12,912 -782 12,158 14.2x 10.3x 7.4x n.a. n.a. n.m. n.a. n.m. n.m.
Reliq Health Technologies Inc. 5 CA 22 0 22 n.a. n.a. n.a. n.a. n.a. n.a. n.m. n.m. n.m.
Teladoc Health, Inc. 5 US 23,670 -156 23,513 27.0x 19.8x 15.8x 274.7x 175.9x 108.5x n.a. n.a. n.m.
INFINITT Healthcare Co., Ltd. 6 KR 117 -30 86 n.a. n.a. n.a. n.a. n.a. n.a. n.a. n.a. n.a.
Invitae Corporation 6 US 4,427 -85 4,345 19.5x 10.2x 6.9x n.a. n.a. n.a. n.a. n.a. n.a.
Pro Medicus Limited 6 AU 2,064 -25 2,039 55.7x 48.5x 39.3x 86.4x 70.5x 57.0x 104.3x 85.4x 67.1x
Sectra AB (publ) 6 SE 2,001 -32 1,969 12.7x 12.0x 10.4x 56.5x 51.4x 45.7x 71.8x 66.2x 58.0x
Siemens Healthineers AG 6 DE 39,262 4,769 44,039 3.0x 2.9x 2.6x 15.7x 14.3x 12.3x 20.7x 18.1x 15.5x
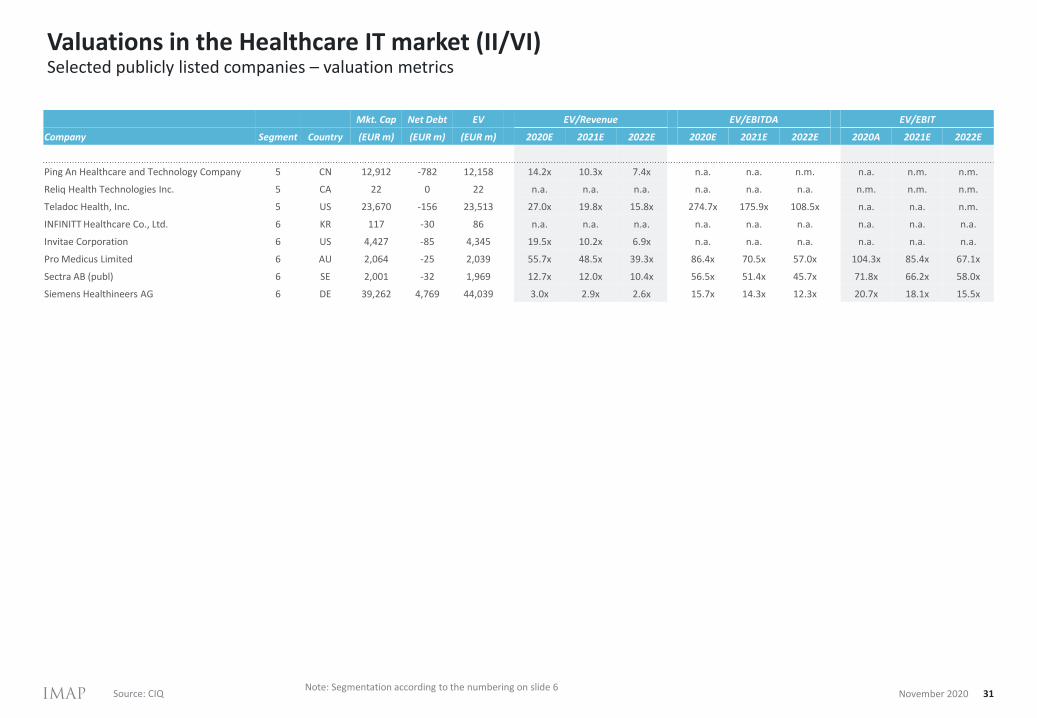
Valuations in the Healthcare IT market (II/VI)
31
Selected publicly listed companies – valuation metrics
Source: CIQ November 2020Note: Segmentation according to the numbering on slide 6

v Mkt. Cap Net Debt EV EV/Revenue EV/EBITDA EV/EBIT
Company Segment Country (EUR m) (EUR m) (EUR m) 2020E 2021E 2022E 2020E 2021E 2022E 2020A 2021E 2022E
Healthcare Enterprise Software 1
Mean 4,188.9 262.7 4,451.7 3.0 2.8 2.6 13.0 11.7 11.0 22.2 19.0 17.3
Median 1,097.2 111.8 1,490.2 2.9 2.8 2.7 12.1 10.5 9.8 21.3 17.1 15.9
Datamanagement 2
Mean 25,011.2 1,846.0 27,005.4 6.5 5.5 4.8 23.1 19.1 16.6 46.5 31.3 25.1
Median 979.8 6.8 908.6 4.8 3.5 3.1 17.2 12.4 11.2 39.1 26.5 23.1
Administrative & Financial Management 3
Mean 2,826.6 515.6 3,326.3 4.7 4.6 4.1 21.7 20.2 16.6 33.2 40.2 32.9
Median 918.2 6.8 980.5 3.4 3.5 3.2 17.6 15.3 14.6 23.8 30.0 26.7
Drug Discovery and Clinical Research 4
Mean 7,433.5 2,388.6 9,897.5 17.4 13.0 10.2 39.7 31.2 29.6 51.1 40.2 34.2
Median 2,100.1 -6.6 1,981.5 17.0 11.5 8.3 17.7 15.0 13.7 20.8 19.1 16.9
Virtual Care and Telehealth 5
Mean 10,699.3 -296.9 10,550.8 26.0 19.6 14.5 274.7 175.9 108.5 n.a. n.a. n.a.
Median 12,023.6 -224.4 11,698.9 27.0 21.9 16.0 274.7 175.9 108.5 n.a. n.a. n.a.
Imaging and Diagnostics 6
Mean 3,221.3 306.5 3,528.5 18.7 18.5 14.9 52.1 44.7 37.8 64.5 55.6 46.3
Median 2,030.3 -30.1 2,005.5 12.4 11.6 9.0 55.5 50.6 45.0 70.5 65.2 57.2
Valuations in the Healthcare IT market (III/VI)
32
Selected publicly listed companies – valuation metrics
Source: CIQ November 2020Note: Segmentation according to the numbering on slide 6
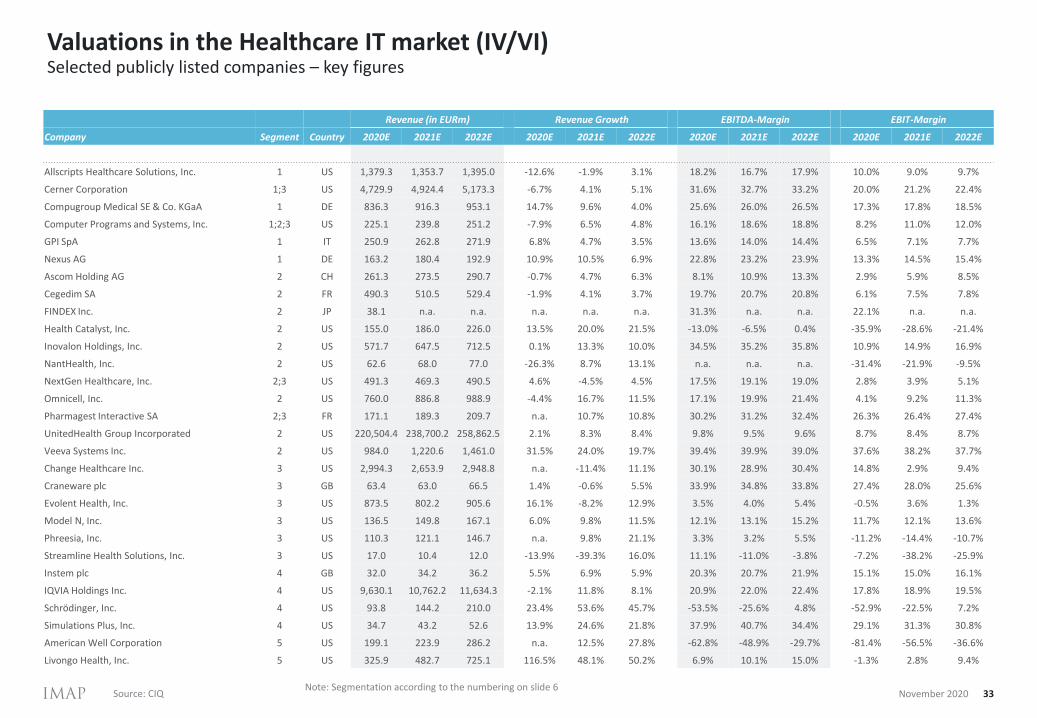
Revenue (in EURm) Revenue Growth EBITDA-Margin EBIT-Margin
Company Segment Country 2020E 2021E 2022E 2020E 2021E 2022E 2020E 2021E 2022E 2020E 2021E 2022E
Allscripts Healthcare Solutions, Inc. 1 US 1,379.3 1,353.7 1,395.0 -12.6% -1.9% 3.1% 18.2% 16.7% 17.9% 10.0% 9.0% 9.7%
Cerner Corporation 1;3 US 4,729.9 4,924.4 5,173.3 -6.7% 4.1% 5.1% 31.6% 32.7% 33.2% 20.0% 21.2% 22.4%
Compugroup Medical SE & Co. KGaA 1 DE 836.3 916.3 953.1 14.7% 9.6% 4.0% 25.6% 26.0% 26.5% 17.3% 17.8% 18.5%
Computer Programs and Systems, Inc. 1;2;3 US 225.1 239.8 251.2 -7.9% 6.5% 4.8% 16.1% 18.6% 18.8% 8.2% 11.0% 12.0%
GPI SpA 1 IT 250.9 262.8 271.9 6.8% 4.7% 3.5% 13.6% 14.0% 14.4% 6.5% 7.1% 7.7%
Nexus AG 1 DE 163.2 180.4 192.9 10.9% 10.5% 6.9% 22.8% 23.2% 23.9% 13.3% 14.5% 15.4%
Ascom Holding AG 2 CH 261.3 273.5 290.7 -0.7% 4.7% 6.3% 8.1% 10.9% 13.3% 2.9% 5.9% 8.5%
Cegedim SA 2 FR 490.3 510.5 529.4 -1.9% 4.1% 3.7% 19.7% 20.7% 20.8% 6.1% 7.5% 7.8%
FINDEX Inc. 2 JP 38.1 n.a. n.a. n.a. n.a. n.a. 31.3% n.a. n.a. 22.1% n.a. n.a.
Health Catalyst, Inc. 2 US 155.0 186.0 226.0 13.5% 20.0% 21.5% -13.0% -6.5% 0.4% -35.9% -28.6% -21.4%
Inovalon Holdings, Inc. 2 US 571.7 647.5 712.5 0.1% 13.3% 10.0% 34.5% 35.2% 35.8% 10.9% 14.9% 16.9%
NantHealth, Inc. 2 US 62.6 68.0 77.0 -26.3% 8.7% 13.1% n.a. n.a. n.a. -31.4% -21.9% -9.5%
NextGen Healthcare, Inc. 2;3 US 491.3 469.3 490.5 4.6% -4.5% 4.5% 17.5% 19.1% 19.0% 2.8% 3.9% 5.1%
Omnicell, Inc. 2 US 760.0 886.8 988.9 -4.4% 16.7% 11.5% 17.1% 19.9% 21.4% 4.1% 9.2% 11.3%
Pharmagest Interactive SA 2;3 FR 171.1 189.3 209.7 n.a. 10.7% 10.8% 30.2% 31.2% 32.4% 26.3% 26.4% 27.4%
UnitedHealth Group Incorporated 2 US 220,504.4 238,700.2 258,862.5 2.1% 8.3% 8.4% 9.8% 9.5% 9.6% 8.7% 8.4% 8.7%
Veeva Systems Inc. 2 US 984.0 1,220.6 1,461.0 31.5% 24.0% 19.7% 39.4% 39.9% 39.0% 37.6% 38.2% 37.7%
Change Healthcare Inc. 3 US 2,994.3 2,653.9 2,948.8 n.a. -11.4% 11.1% 30.1% 28.9% 30.4% 14.8% 2.9% 9.4%
Craneware plc 3 GB 63.4 63.0 66.5 1.4% -0.6% 5.5% 33.9% 34.8% 33.8% 27.4% 28.0% 25.6%
Evolent Health, Inc. 3 US 873.5 802.2 905.6 16.1% -8.2% 12.9% 3.5% 4.0% 5.4% -0.5% 3.6% 1.3%
Model N, Inc. 3 US 136.5 149.8 167.1 6.0% 9.8% 11.5% 12.1% 13.1% 15.2% 11.7% 12.1% 13.6%
Phreesia, Inc. 3 US 110.3 121.1 146.7 n.a. 9.8% 21.1% 3.3% 3.2% 5.5% -11.2% -14.4% -10.7%
Streamline Health Solutions, Inc. 3 US 17.0 10.4 12.0 -13.9% -39.3% 16.0% 11.1% -11.0% -3.8% -7.2% -38.2% -25.9%
Instem plc 4 GB 32.0 34.2 36.2 5.5% 6.9% 5.9% 20.3% 20.7% 21.9% 15.1% 15.0% 16.1%
IQVIA Holdings Inc. 4 US 9,630.1 10,762.2 11,634.3 -2.1% 11.8% 8.1% 20.9% 22.0% 22.4% 17.8% 18.9% 19.5%
Schrödinger, Inc. 4 US 93.8 144.2 210.0 23.4% 53.6% 45.7% -53.5% -25.6% 4.8% -52.9% -22.5% 7.2%
Simulations Plus, Inc. 4 US 34.7 43.2 52.6 13.9% 24.6% 21.8% 37.9% 40.7% 34.4% 29.1% 31.3% 30.8%
American Well Corporation 5 US 199.1 223.9 286.2 n.a. 12.5% 27.8% -62.8% -48.9% -29.7% -81.4% -56.5% -36.6%
Livongo Health, Inc. 5 US 325.9 482.7 725.1 116.5% 48.1% 50.2% 6.9% 10.1% 15.0% -1.3% 2.8% 9.4%
Valuations in the Healthcare IT market (IV/VI)
33
Selected publicly listed companies – key figures
Source: CIQ November 2020Note: Segmentation according to the numbering on slide 6

Revenue (in EURm) Revenue Growth EBITDA-Margin EBIT-Margin
Company Segment Country 2020E 2021E 2022E 2020E 2021E 2022E 2020E 2021E 2022E 2020E 2021E 2022E
Ping An Healthcare and Technology Company 5 CN 855.4 1,182.7 1,651.1 34.7% 38.3% 39.6% -10.4% -3.2% 2.3% -12.0% -5.0% 1.7%
Reliq Health Technologies Inc. 5 CA n.a. n.a. n.a. n.a. n.a. n.a. n.a. n.a. n.a. n.a. n.a. n.a.
Teladoc Health, Inc. 5 US 869.7 1,189.7 1,489.4 77.4% 36.8% 25.2% 9.8% 11.2% 14.6% -6.6% -1.9% 4.4%
INFINITT Healthcare Co., Ltd. 6 KR n.a. n.a. n.a. n.a. n.a. n.a. n.a. n.a. n.a. n.a. n.a. n.a.
Invitae Corporation 6 US 222.6 426.4 633.6 15.0% 91.5% 48.6% -117.9% -17.6% -2.4% -142.0% -47.6% -20.5%
Pro Medicus Limited 6 AU 36.6 42.0 51.8 23.4% 14.8% 23.4% 64.5% 68.8% 69.1% 53.5% 56.9% 58.7%
Sectra AB (publ) 6 SE 155.6 164.6 189.4 18.6% 5.8% 15.1% 22.4% 23.3% 22.8% 17.6% 18.1% 17.9%
Siemens Healthineers AG 6 DE 14,576.2 15,443.6 16,685.5 1.9% 6.0% 8.0% 19.2% 19.9% 21.5% 14.6% 15.8% 17.1%
Valuations in the Healthcare IT market (V/VI)
34
Selected publicly listed companies – key figures
Source: CIQ November 2020Note: Segmentation according to the numbering on slide 6

Revenue (in EURm) Revenue Growth EBITDA-Margin EBIT-Margin
Company Segment Country 2020E 2021E 2022E 2020E 2021E 2022E 2020E 2021E 2022E 2020E 2021E 2022E
Healthcare Enterprise Software 1
Mean 1,265.7 1,321.3 1,380.8 0.9% 6.0% 4.4% 21.3% 22.1% 22.6% 12.6% 13.6% 14.4%
Median 541.7 589.6 612.5 0.0% 5.6% 4.4% 20.4% 20.9% 21.4% 11.6% 12.7% 13.7%
Datamanagement 2
Mean 18,726.2 22,126.5 24,009.0 1.2% 10.2% 10.4% 19.1% 19.9% 21.1% 5.2% 6.8% 9.5%
Median 375.8 469.3 490.5 0.2% 8.7% 10.0% 17.5% 19.5% 19.9% 7.2% 8.4% 8.7%
Administrative & Financial Management 3
Mean 980.4 962.1 1,038.2 -0.2% -2.4% 10.4% 18.9% 17.5% 19.0% 9.2% 5.6% 8.0%
Median 197.8 214.3 230.2 1.4% 1.8% 10.9% 16.8% 18.9% 18.9% 10.0% 7.5% 10.7%
Drug Discovery and Clinical Research 4
Mean 2,442.5 2,740.2 2,977.0 9.9% 24.2% 20.4% 6.4% 14.5% 20.9% 2.3% 10.7% 18.4%
Median 64.1 93.5 131.0 9.6% 18.0% 14.9% 20.6% 21.4% 22.2% 16.4% 17.0% 17.8%
Virtual Care and Telehealth 5
Mean 562.5 769.8 1,037.9 69.7% 33.9% 35.7% -14.1% -7.7% 0.5% -25.3% -15.1% -5.3%
Median 590.6 832.7 1,107.2 63.7% 37.5% 33.7% -1.8% 3.4% 8.4% -9.3% -3.4% 3.1%
Imaging and Diagnostics 6
Mean 3,009.2 4,049.6 4,407.8 11.1% 29.8% 23.5% 0.3% 22.2% 26.4% -9.5% 11.6% 18.3%
Median 155.6 296.0 410.6 14.7% 10.5% 19.2% 19.2% 22.0% 22.2% 14.7% 17.2% 17.5%
Valuations in the Healthcare IT market (VI/VI)
35
Selected publicly listed companies – key figures
Source: CIQ November 2020Note: Segmentation according to the numbering on slide 6
EV EV EV EV
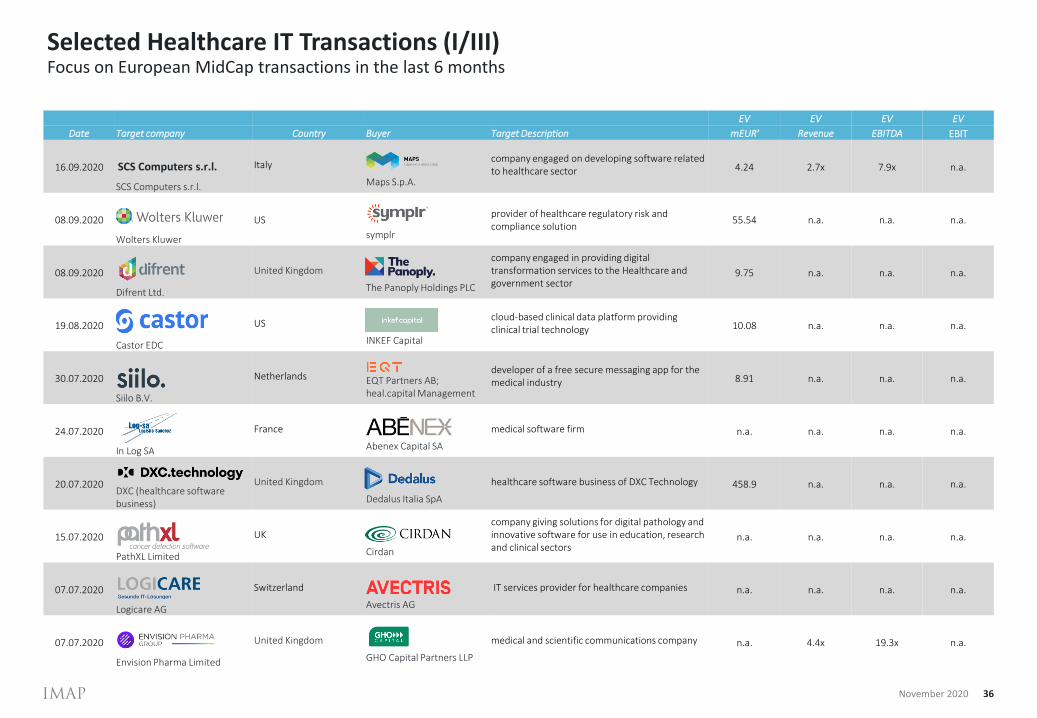
Date Target company Country Buyer Target Description mEUR' Revenue EBITDA EBIT
16.09.2020
SCS Computers s.r.l.
Italy
Maps S.p.A.
company engaged on developing software related to healthcare sector 4.24 2.7x 7.9x n.a.
08.09.2020
Wolters Kluwer
US
symplr
provider of healthcare regulatory risk and compliance solution
55.54 n.a. n.a. n.a.
08.09.2020
Difrent Ltd.
United Kingdom
The Panoply Holdings PLC
company engaged in providing digital transformation services to the Healthcare and government sector
9.75 n.a. n.a. n.a.
19.08.2020
Castor EDC
US
INKEF Capital
cloud-based clinical data platform providing clinical trial technology 10.08 n.a. n.a. n.a.
30.07.2020
Siilo B.V.
Netherlands EQT Partners AB;heal.capital Management
developer of a free secure messaging app for the medical industry 8.91 n.a. n.a. n.a.
24.07.2020
In Log SA
France
Abenex Capital SA
medical software firm n.a. n.a. n.a. n.a.
20.07.2020DXC (healthcare softwarebusiness)
United Kingdom
Dedalus Italia SpA
healthcare software business of DXC Technology 458.9 n.a. n.a. n.a.
15.07.2020
PathXL Limited
UK
Cirdan
company giving solutions for digital pathology and innovative software for use in education, research and clinical sectors
n.a. n.a. n.a. n.a.
07.07.2020
Logicare AG
Switzerland
Avectris AG
IT services provider for healthcare companies n.a. n.a. n.a. n.a.
07.07.2020
Envision Pharma Limited
United Kingdom
GHO Capital Partners LLP
medical and scientific communications company n.a. 4.4x 19.3x n.a.
Selected Healthcare IT Transactions (I/III)
36
Focus on European MidCap transactions in the last 6 months
November 2020
SCS Computers s.r.l.

EV EV/ EV/ EV/
Date Target company Country Buyer Target Description mEUR' Revenue EBITDA EBIT
24.06.2020
medondo AG
Germany
Amalphi AG
Developer of cloud-based modular practice management software solutions for the medical sector
n.a. n.a. n.a. n.a.
19.06.2020
Platform Third Opinion LLC
Russia
MEDSI Group, JSC
Developer of AI-based solutions for the healthcare industry enabling pathologies identification on medical images
n.a. n.a. n.a. n.a.
17.06.2020
Bluebee Holding B.V.
Netherlands
Illumina, Inc.
Cloud-based software company that provides genomics analysis solutions for research and clinical customers
95.0 n.a. n.a. n.a.
04.06.2020
Xperthis SA
Belgium
Infohos Solutions NV
Provider of software solutions for hospitals n.a. n.a. n.a. n.a.
03.06.2020
HospitEasy SAS
France
TMM Software
Developer of software applications for a simplified hospital admission
n.a. n.a. n.a. n.a.
02.06.2020
Statistical Solutions Ltd
Ireland
Insightful Science, LLC
Developer of software for clinical trials and research
7.0 n.a. n.a. n.a.
28.05.2020
MEDINFO GROUP
France
GPI SpA
Provider of blood management software solutions 9.0 2,3x 6,9x n.a.
19.05.2020
Kaiku Health Oy
Finland
Elekta AB
Finland-based developer of patient monitoring software for healthcare providers
n.a. n.a. n.a. n.a.
19.05.2020
Zesty Limited
United Kingdom
Induction Healthcare Group
Digital health company providing on-demand access to healthcare appointments via desktop, tablet, mobile, and cross platform
14,.3 n.a. n.a. n.a.
19.05.2020
ADAS3D Medical SL
Spain
Circle Cardiovascular Inc.
Developer of software for the diagnosis of cardiac electrophysiology
n.a. n.a. n.a. n.a.
Selected Healthcare IT Transactions (II/III)
37
Focus on European MidCap transactions in the last 6 months
November 2020Sources: Capital IQ, Mergermarket
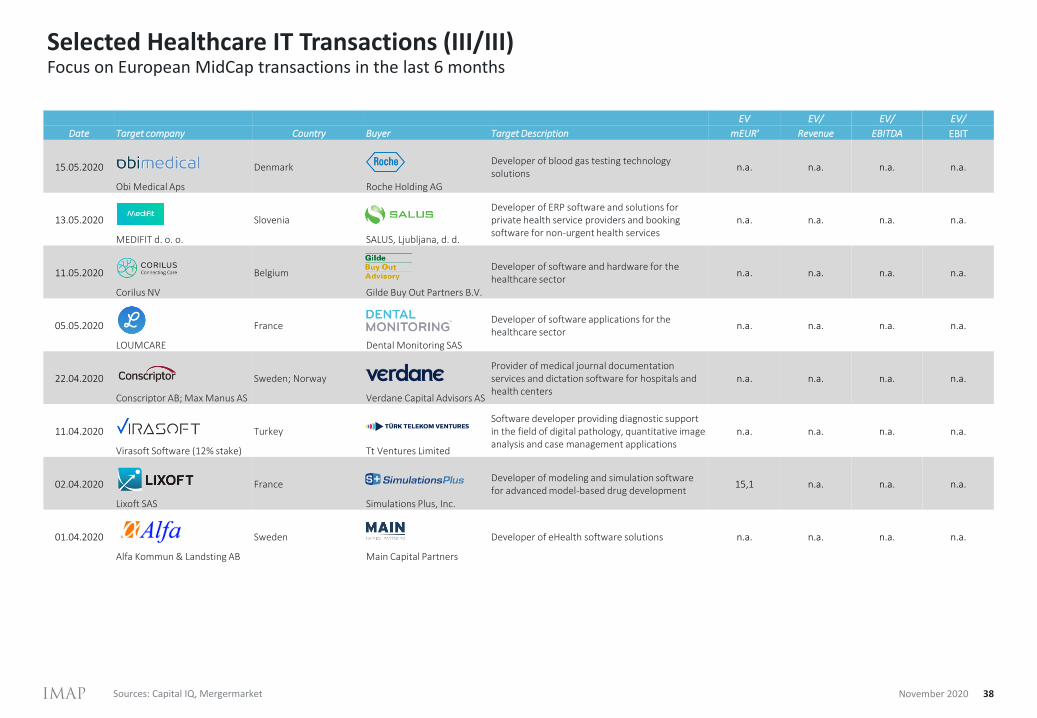
EV EV/ EV/ EV/
Date Target company Country Buyer Target Description mEUR' Revenue EBITDA EBIT
15.05.2020
Obi Medical Aps
Denmark
Roche Holding AG
Developer of blood gas testing technology solutions
n.a. n.a. n.a. n.a.
13.05.2020
MEDIFIT d. o. o.
Slovenia
SALUS, Ljubljana, d. d.
Developer of ERP software and solutions for private health service providers and booking software for non-urgent health services
n.a. n.a. n.a. n.a.
11.05.2020
Corilus NV
Belgium
Gilde Buy Out Partners B.V.
Developer of software and hardware for the healthcare sector
n.a. n.a. n.a. n.a.
05.05.2020
LOUMCARE
France
Dental Monitoring SAS
Developer of software applications for the healthcare sector
n.a. n.a. n.a. n.a.
22.04.2020
Conscriptor AB; Max Manus AS
Sweden; Norway
Verdane Capital Advisors AS
Provider of medical journal documentation services and dictation software for hospitals and health centers
n.a. n.a. n.a. n.a.
11.04.2020
Virasoft Software (12% stake)
Turkey
Tt Ventures Limited
Software developer providing diagnostic support in the field of digital pathology, quantitative image analysis and case management applications
n.a. n.a. n.a. n.a.
02.04.2020
Lixoft SAS
France
Simulations Plus, Inc.
Developer of modeling and simulation software for advanced model-based drug development
15,1 n.a. n.a. n.a.
01.04.2020
Alfa Kommun & Landsting AB
Sweden
Main Capital Partners
Developer of eHealth software solutions n.a. n.a. n.a. n.a.
Selected Healthcare IT Transactions (III/III)
38
Focus on European MidCap transactions in the last 6 months
November 2020Sources: Capital IQ, Mergermarket

Agenda
November
1. Introduction Page 3
2. Healthcare IT Market
− Overview Page 5
− Valuation and M&A activity Page 11
3. IT / Software Market
− Overview Page 16
− Valuation and M&A activity Page 18
4. Introduction to IMAP and relevant expertise Page 26
5. Appendix
− Healthcare IT: Valuation metrics, key figures & transactions Page 30
− IT / Software: Valuation metrics, key figures & transactions Page 40

Mkt. Cap Net Debt EV EV/Revenue EV/EBITDA EV/EBIT
Company Country (EUR m) (EUR m) (EUR m) 2020E 2021E 2022E 2020E 2021E 2022E 2020A 2021E 2022E
Akamai Technologies, Inc. US 15,034 261 15,283 5.7x 5.4x 5.0x 13.2x 12.3x 11.2x 18.7x 17.4x 15.8x
Arista Networks, Inc. US 14,267 -2,406 11,978 6.3x 5.5x 4.9x 15.9x 14.1x 12.1x 16.8x 14.9x 12.9x
Check Point Software Technologies Ltd. IL 14,667 -1,414 13,322 7.7x 7.5x 7.3x 15.4x 15.4x 15.5x 15.7x 15.5x 15.4x
Cisco Systems, Inc. US 140,294 -11,900 128,594 3.1x 3.1x 3.0x 8.3x 8.8x 8.5x 9.2x 9.6x 9.1x
Citrix Systems, Inc. US 14,278 944 15,176 5.6x 5.5x 5.0x 16.1x 16.6x 14.4x 19.3x 18.6x 15.9x
F5 Networks, Inc. US 6,685 -274 6,425 3.2x 3.1x 3.0x 9.4x 9.0x 8.4x 10.6x 10.1x 9.4x
Juniper Networks, Inc. US 6,153 18 6,170 1.7x 1.6x 1.6x 8.2x 7.7x 7.3x 10.8x 9.6x 9.0x
Micro Focus International plc GB 921 4,028 4,755 1.9x 2.0x 2.1x 5.1x 5.4x 5.3x 5.8x 6.1x 6.0x
Softcat plc GB 2,490 -78 2,413 1.9x 1.9x 1.7x 22.4x 22.1x 21.1x 23.2x 23.3x 21.9x
VMware, Inc. US 53,120 2,307 55,427 6.1x 5.6x 5.1x 15.6x 14.8x 13.6x 18.4x 18.5x 16.8x
Mean 25,649.6 -425.7 12,977.1 4.3 4.1 3.9 13.0 12.6 11.8 14.8 14.4 13.2
Median 13,115.5 0.0 1,206.4 4.4 4.3 3.9 14.3 13.2 11.7 16.2 15.2 14.1
Valuations in the Infrastructure & Cloud Segment (I/II)
40
Selected publicly listed companies - multiples
Source: CIQ November 2020
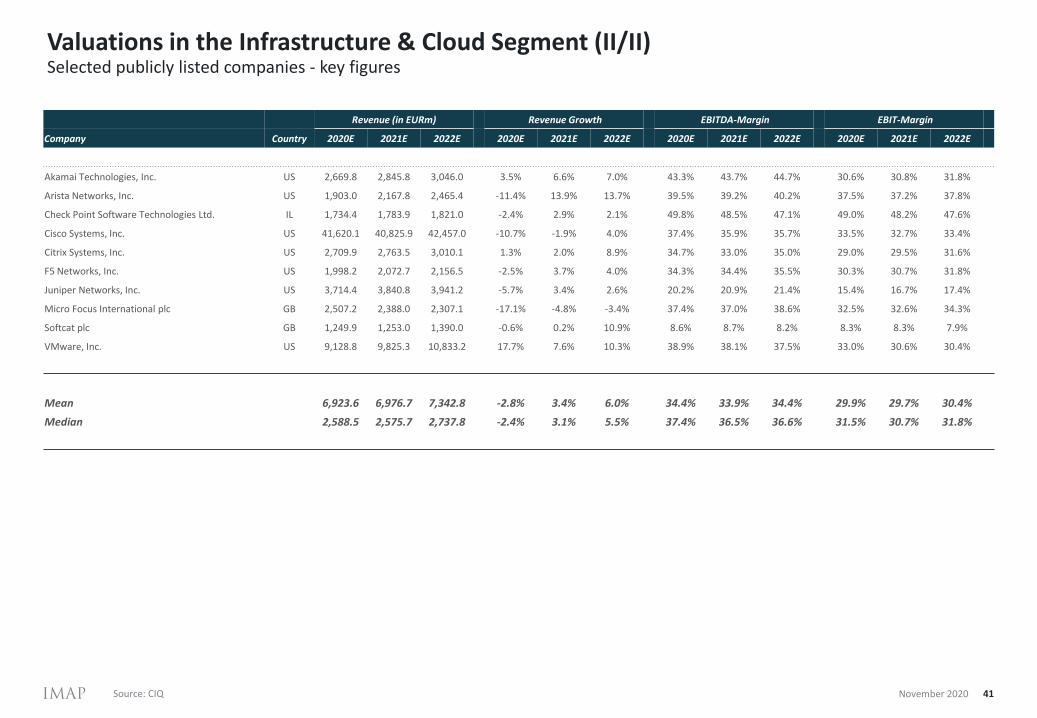
Revenue (in EURm) Revenue Growth EBITDA-Margin EBIT-Margin
Company Country 2020E 2021E 2022E 2020E 2021E 2022E 2020E 2021E 2022E 2020E 2021E 2022E
Akamai Technologies, Inc. US 2,669.8 2,845.8 3,046.0 3.5% 6.6% 7.0% 43.3% 43.7% 44.7% 30.6% 30.8% 31.8%
Arista Networks, Inc. US 1,903.0 2,167.8 2,465.4 -11.4% 13.9% 13.7% 39.5% 39.2% 40.2% 37.5% 37.2% 37.8%
Check Point Software Technologies Ltd. IL 1,734.4 1,783.9 1,821.0 -2.4% 2.9% 2.1% 49.8% 48.5% 47.1% 49.0% 48.2% 47.6%
Cisco Systems, Inc. US 41,620.1 40,825.9 42,457.0 -10.7% -1.9% 4.0% 37.4% 35.9% 35.7% 33.5% 32.7% 33.4%
Citrix Systems, Inc. US 2,709.9 2,763.5 3,010.1 1.3% 2.0% 8.9% 34.7% 33.0% 35.0% 29.0% 29.5% 31.6%
F5 Networks, Inc. US 1,998.2 2,072.7 2,156.5 -2.5% 3.7% 4.0% 34.3% 34.4% 35.5% 30.3% 30.7% 31.8%
Juniper Networks, Inc. US 3,714.4 3,840.8 3,941.2 -5.7% 3.4% 2.6% 20.2% 20.9% 21.4% 15.4% 16.7% 17.4%
Micro Focus International plc GB 2,507.2 2,388.0 2,307.1 -17.1% -4.8% -3.4% 37.4% 37.0% 38.6% 32.5% 32.6% 34.3%
Softcat plc GB 1,249.9 1,253.0 1,390.0 -0.6% 0.2% 10.9% 8.6% 8.7% 8.2% 8.3% 8.3% 7.9%
VMware, Inc. US 9,128.8 9,825.3 10,833.2 17.7% 7.6% 10.3% 38.9% 38.1% 37.5% 33.0% 30.6% 30.4%
Mean 6,923.6 6,976.7 7,342.8 -2.8% 3.4% 6.0% 34.4% 33.9% 34.4% 29.9% 29.7% 30.4%
Median 2,588.5 2,575.7 2,737.8 -2.4% 3.1% 5.5% 37.4% 36.5% 36.6% 31.5% 30.7% 31.8%
Valuations in the Infrastructure & Cloud Segment (II/II)
41
Selected publicly listed companies - key figures
Source: CIQ November 2020

Mkt. Cap Net Debt EV EV/Revenue EV/EBITDA EV/EBIT
Company Country (EUR m) (EUR m) (EUR m) 2020A 2021E 2022E 2020A 2021E 2022E 2020A 2021E 2022E
Adobe Inc. US 200,579 -452 200,124 18.5x 16.0x 14.0x 38.3x 32.8x 28.3x 43.7x 37.1x 31.7x
Blackbaud, Inc. US 2,377 505 2,858 3.7x 3.7x 3.7x 15.2x 15.2x 14.9x 18.6x 18.5x n.a.
Box, Inc. US 2,129 154 2,284 3.6x 3.5x 3.2x 43.7x 16.7x 14.3x 507.2x 27.6x 20.7x
DocuSign, Inc. US 35,659 11 35,671 41.0x 30.5x 23.4x 494.7x 259.5x 162.5x 1123.1x 361.4x 212.7x
Dropbox, Inc. US 6,912 -25 6,889 4.3x 3.9x 3.5x 15.6x 13.1x 11.4x 23.5x 19.0x 15.2x
Envestnet, Inc. US 3,774 524 4,270 5.1x 4.6x 4.1x 22.5x 20.0x 17.2x 291.9x 83.9x 57.2x
Guidewire Software, Inc. US 7,317 -578 6,739 11.3x 10.9x 10.0x 96.0x 378.2x 161.0x 115.0x 3201.9x 255.1x
Proofpoint, Inc. US 5,241 -122 5,125 5.8x 5.0x 4.2x 36.6x 28.4x 23.6x 47.1x 36.8x 28.7x
Pure Storage, Inc. US 4,138 -560 3,578 2.4x 2.6x 2.2x 28.0x 42.8x 28.1x 77.0x 155.6x 49.9x
QAD Inc. US 725 -90 634 2.3x 2.5x 2.3x 58.7x 34.2x 24.8x 129.6x 56.0x 41.9x
salesforce.com, inc. US 196,921 -2,616 194,305 12.7x 11.1x 9.4x 43.9x 36.8x 31.0x 76.3x 63.3x 50.5x
Workday, Inc. US 44,997 -521 44,476 13.6x 12.3x 10.4x 65.7x 49.2x 42.5x 103.6x 68.1x 57.2x
Zendesk, Inc. US 10,915 136 11,045 12.9x 10.4x 8.3x 128.9x 91.0x 63.1x 234.5x 145.2x 81.1x
Zuora, Inc. US 1,076 -89 988 3.9x 3.9x 3.6x n.a. n.a. 152.6x n.a. n.a. n.a.
Mean 34,964.0 -183.7 25,949.3 10.1 8.6 7.3 83.7 78.3 55.4 214.7 328.8 75.2
Median 4,764.6 -88.6 3,217.9 5.5 4.8 4.2 43.7 34.2 28.2 103.6 63.3 50.2
Valuations in the SaaS Segment (I/II)
42
Selected publicly listed companies - multiples
Source: CIQ November 2020Note: EV/EBIT multiples have been excluded due to lack of meaningfulness
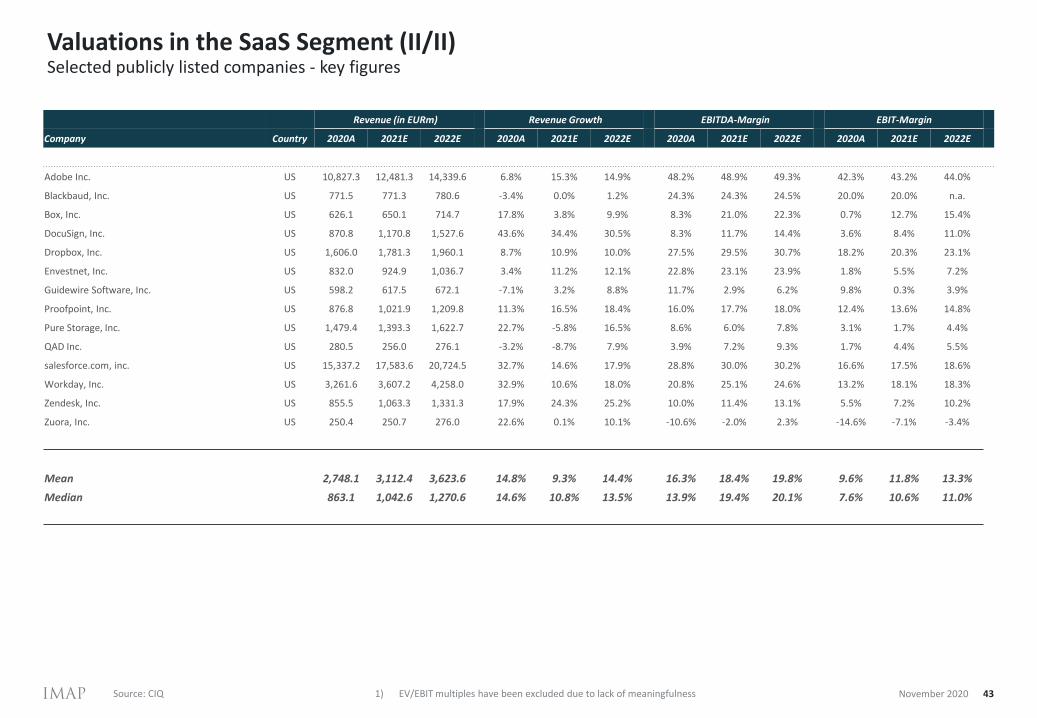
Valuations in the SaaS Segment (II/II)
43
Selected publicly listed companies - key figures
Source: CIQ November 20201) EV/EBIT multiples have been excluded due to lack of meaningfulness
Revenue (in EURm) Revenue Growth EBITDA-Margin EBIT-Margin
Company Country 2020A 2021E 2022E 2020A 2021E 2022E 2020A 2021E 2022E 2020A 2021E 2022E
Adobe Inc. US 10,827.3 12,481.3 14,339.6 6.8% 15.3% 14.9% 48.2% 48.9% 49.3% 42.3% 43.2% 44.0%
Blackbaud, Inc. US 771.5 771.3 780.6 -3.4% 0.0% 1.2% 24.3% 24.3% 24.5% 20.0% 20.0% n.a.
Box, Inc. US 626.1 650.1 714.7 17.8% 3.8% 9.9% 8.3% 21.0% 22.3% 0.7% 12.7% 15.4%
DocuSign, Inc. US 870.8 1,170.8 1,527.6 43.6% 34.4% 30.5% 8.3% 11.7% 14.4% 3.6% 8.4% 11.0%
Dropbox, Inc. US 1,606.0 1,781.3 1,960.1 8.7% 10.9% 10.0% 27.5% 29.5% 30.7% 18.2% 20.3% 23.1%
Envestnet, Inc. US 832.0 924.9 1,036.7 3.4% 11.2% 12.1% 22.8% 23.1% 23.9% 1.8% 5.5% 7.2%
Guidewire Software, Inc. US 598.2 617.5 672.1 -7.1% 3.2% 8.8% 11.7% 2.9% 6.2% 9.8% 0.3% 3.9%
Proofpoint, Inc. US 876.8 1,021.9 1,209.8 11.3% 16.5% 18.4% 16.0% 17.7% 18.0% 12.4% 13.6% 14.8%
Pure Storage, Inc. US 1,479.4 1,393.3 1,622.7 22.7% -5.8% 16.5% 8.6% 6.0% 7.8% 3.1% 1.7% 4.4%
QAD Inc. US 280.5 256.0 276.1 -3.2% -8.7% 7.9% 3.9% 7.2% 9.3% 1.7% 4.4% 5.5%
salesforce.com, inc. US 15,337.2 17,583.6 20,724.5 32.7% 14.6% 17.9% 28.8% 30.0% 30.2% 16.6% 17.5% 18.6%
Workday, Inc. US 3,261.6 3,607.2 4,258.0 32.9% 10.6% 18.0% 20.8% 25.1% 24.6% 13.2% 18.1% 18.3%
Zendesk, Inc. US 855.5 1,063.3 1,331.3 17.9% 24.3% 25.2% 10.0% 11.4% 13.1% 5.5% 7.2% 10.2%
Zuora, Inc. US 250.4 250.7 276.0 22.6% 0.1% 10.1% -10.6% -2.0% 2.3% -14.6% -7.1% -3.4%
Mean 2,748.1 3,112.4 3,623.6 14.8% 9.3% 14.4% 16.3% 18.4% 19.8% 9.6% 11.8% 13.3%
Median 863.1 1,042.6 1,270.6 14.6% 10.8% 13.5% 13.9% 19.4% 20.1% 7.6% 10.6% 11.0%

Mkt. Cap Net Debt EV EV/Revenue EV/EBITDA EV/EBIT
Company Country (EUR m) (EUR m) (EUR m) 2020A 2021E 2022E 2020A 2021E 2022E 2020A 2021E 2022E
Adobe Inc. US 200,579 -452 200,124 18.5x 16.0x 14.0x 38.3x 32.8x 28.3x 43.7x 37.1x 31.7x
Amadeus IT Group, S.A. ES 21,401 2,689 24,101 10.0x 6.2x 5.0x 78.1x 18.0x 12.7x n.a. 43.4x 21.6x
ANSYS, Inc. US 24,076 -176 23,908 17.6x 15.8x 14.1x 41.7x 36.1x 32.0x 42.6x 37.6x 32.5x
Automatic Data Processing, Inc. US 53,281 488 53,745 4.2x 4.5x 4.2x 16.9x 20.1x 17.2x 19.0x 22.9x 19.4x
Constellation Software Inc. CA 20,454 122 20,574 6.3x 5.4x 4.6x 21.8x 19.3x 16.4x 38.5x 33.9x 28.3x
Dassault Systèmes SE FR 41,033 2,208 43,289 9.5x 8.7x 8.1x 29.5x 26.0x 23.0x 32.5x 28.3x 25.2x
Hexagon AB (publ) SE 24,199 1,944 26,178 7.0x 6.6x 6.2x 20.3x 17.8x 16.7x 29.2x 24.7x 23.2x
Intuit Inc. US 74,038 -2,886 71,152 11.3x 10.2x 9.2x 31.5x 26.9x 24.0x 34.7x 29.0x 25.5x
Microsoft Corporation US 1,372,389 -48,324 1,326,415 10.5x 10.0x 9.0x 22.9x 21.5x 19.1x 28.4x 26.6x 23.5x
Open Text Corporation CA 9,468 2,473 11,822 4.3x 4.4x 4.3x 12.2x 11.7x 11.2x 13.3x 12.7x 12.1x
Oracle Corporation US 152,088 23,809 176,699 5.0x 5.2x 5.1x 10.6x 10.6x 10.4x 11.4x 11.5x 11.3x
Pegasystems Inc. US 8,788 53 8,839 9.8x 8.3x 7.0x 205.4x 120.1x 62.6x 941.7x 177.9x 93.2x
PSI Software AG DE 411 -28 383 1.7x 1.6x 1.5x 14.6x 12.5x 11.0x 25.0x 18.5x 15.9x
QAD Inc. US 725 -90 634 2.3x 2.5x 2.3x 58.7x 34.2x 24.8x 129.6x 56.0x 41.9x
salesforce.com, inc. US 196,921 -2,616 194,305 12.7x 11.1x 9.4x 43.9x 36.8x 31.0x 76.3x 63.3x 50.5x
SAP SE DE 151,878 9,453 161,420 5.7x 5.3x 4.9x 15.8x 14.4x 13.1x 19.1x 17.0x 15.2x
Synopsys, Inc. US 29,047 -318 28,733 9.2x 8.5x 7.9x 29.1x 26.0x 23.0x 32.9x 29.2x 25.6x
Workday, Inc. US 44,997 -521 44,476 13.6x 12.3x 10.4x 65.7x 49.2x 42.5x 103.6x 68.1x 57.2x
Zendesk, Inc. US 10,915 136 11,045 12.9x 10.4x 8.3x 128.9x 91.0x 63.1x 234.5x 145.2x 81.1x
Mean 128,725.2 -601.9 121,392.0 9.1 8.1 7.1 46.6 32.9 25.4 103.1 46.5 33.4
Median 30,553.9 26.5 27,455.8 9.5 8.3 7.0 29.5 26.0 23.0 33.8 29.2 25.5
Valuations in the Application Software Segment (I/II)
44
Selected publicly listed companies - multiples
Source: CIQ November 2020
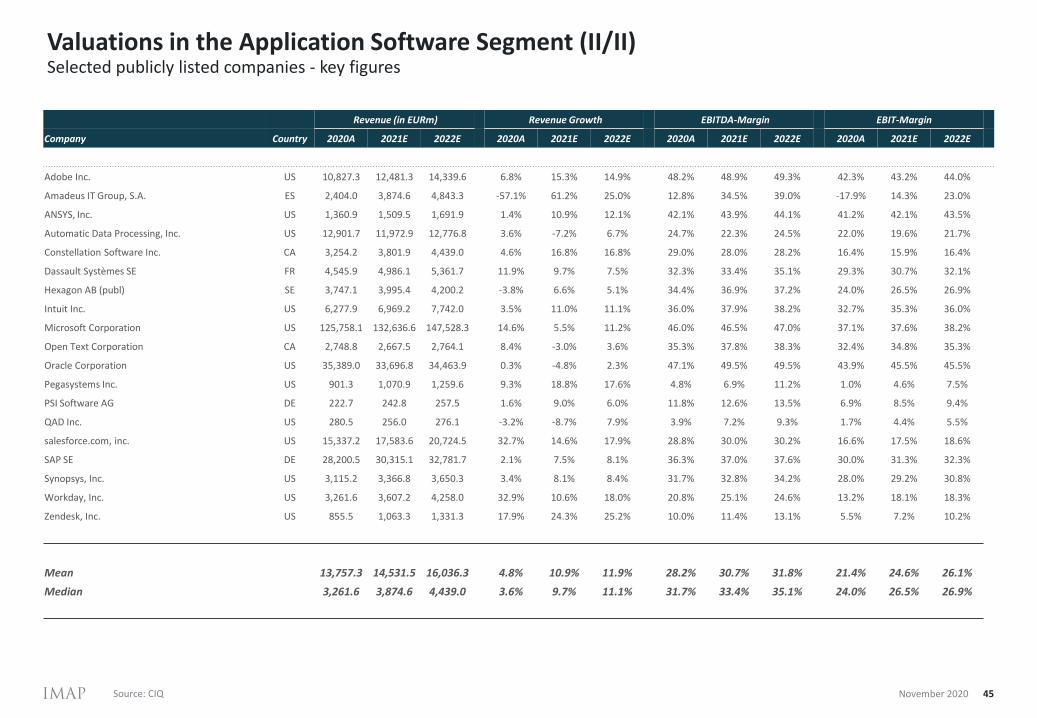
Revenue (in EURm) Revenue Growth EBITDA-Margin EBIT-Margin
Company Country 2020A 2021E 2022E 2020A 2021E 2022E 2020A 2021E 2022E 2020A 2021E 2022E
Adobe Inc. US 10,827.3 12,481.3 14,339.6 6.8% 15.3% 14.9% 48.2% 48.9% 49.3% 42.3% 43.2% 44.0%
Amadeus IT Group, S.A. ES 2,404.0 3,874.6 4,843.3 -57.1% 61.2% 25.0% 12.8% 34.5% 39.0% -17.9% 14.3% 23.0%
ANSYS, Inc. US 1,360.9 1,509.5 1,691.9 1.4% 10.9% 12.1% 42.1% 43.9% 44.1% 41.2% 42.1% 43.5%
Automatic Data Processing, Inc. US 12,901.7 11,972.9 12,776.8 3.6% -7.2% 6.7% 24.7% 22.3% 24.5% 22.0% 19.6% 21.7%
Constellation Software Inc. CA 3,254.2 3,801.9 4,439.0 4.6% 16.8% 16.8% 29.0% 28.0% 28.2% 16.4% 15.9% 16.4%
Dassault Systèmes SE FR 4,545.9 4,986.1 5,361.7 11.9% 9.7% 7.5% 32.3% 33.4% 35.1% 29.3% 30.7% 32.1%
Hexagon AB (publ) SE 3,747.1 3,995.4 4,200.2 -3.8% 6.6% 5.1% 34.4% 36.9% 37.2% 24.0% 26.5% 26.9%
Intuit Inc. US 6,277.9 6,969.2 7,742.0 3.5% 11.0% 11.1% 36.0% 37.9% 38.2% 32.7% 35.3% 36.0%
Microsoft Corporation US 125,758.1 132,636.6 147,528.3 14.6% 5.5% 11.2% 46.0% 46.5% 47.0% 37.1% 37.6% 38.2%
Open Text Corporation CA 2,748.8 2,667.5 2,764.1 8.4% -3.0% 3.6% 35.3% 37.8% 38.3% 32.4% 34.8% 35.3%
Oracle Corporation US 35,389.0 33,696.8 34,463.9 0.3% -4.8% 2.3% 47.1% 49.5% 49.5% 43.9% 45.5% 45.5%
Pegasystems Inc. US 901.3 1,070.9 1,259.6 9.3% 18.8% 17.6% 4.8% 6.9% 11.2% 1.0% 4.6% 7.5%
PSI Software AG DE 222.7 242.8 257.5 1.6% 9.0% 6.0% 11.8% 12.6% 13.5% 6.9% 8.5% 9.4%
QAD Inc. US 280.5 256.0 276.1 -3.2% -8.7% 7.9% 3.9% 7.2% 9.3% 1.7% 4.4% 5.5%
salesforce.com, inc. US 15,337.2 17,583.6 20,724.5 32.7% 14.6% 17.9% 28.8% 30.0% 30.2% 16.6% 17.5% 18.6%
SAP SE DE 28,200.5 30,315.1 32,781.7 2.1% 7.5% 8.1% 36.3% 37.0% 37.6% 30.0% 31.3% 32.3%
Synopsys, Inc. US 3,115.2 3,366.8 3,650.3 3.4% 8.1% 8.4% 31.7% 32.8% 34.2% 28.0% 29.2% 30.8%
Workday, Inc. US 3,261.6 3,607.2 4,258.0 32.9% 10.6% 18.0% 20.8% 25.1% 24.6% 13.2% 18.1% 18.3%
Zendesk, Inc. US 855.5 1,063.3 1,331.3 17.9% 24.3% 25.2% 10.0% 11.4% 13.1% 5.5% 7.2% 10.2%
Mean 13,757.3 14,531.5 16,036.3 4.8% 10.9% 11.9% 28.2% 30.7% 31.8% 21.4% 24.6% 26.1%
Median 3,261.6 3,874.6 4,439.0 3.6% 9.7% 11.1% 31.7% 33.4% 35.1% 24.0% 26.5% 26.9%
Valuations in the Application Software Segment (II/II)
45
Selected publicly listed companies - key figures
Source: CIQ November 2020

Mkt. Cap Net Debt EV EV/Revenue EV/EBITDA EV/EBIT
Company Country (EUR m) (EUR m) (EUR m) 2020A 2021E 2022E 2020A 2021E 2022E 2020A 2021E 2022E
Accenture plc IE 123,913 -4,203 120,086 3.2x 3.1x 2.8x 17.9x 16.8x 15.7x 22.0x 20.4x 18.9x
CGI Inc. CA 14,762 2,137 16,869 2.2x 2.1x 2.0x 11.1x 10.4x 10.2x 14.3x 13.6x 13.2x
Cognizant Technology Solutions Corporation US 33,624 -991 32,682 2.3x 2.2x 2.1x 12.9x 11.8x 11.1x 15.7x 14.3x 13.2x
EPAM Systems, Inc. US 16,321 -698 15,657 7.1x 5.9x 4.8x 37.8x 31.6x 25.6x 42.2x 34.7x 28.0x
Globant S.A. LU 6,520 -233 6,298 9.4x 7.6x 6.2x 50.7x 37.6x 30.1x 69.2x 49.8x 39.9x
HCL Technologies Limited IN 27,192 -597 26,665 3.1x 3.1x 2.8x 13.4x 12.0x 11.0x 16.2x 14.8x 13.4x
Infosys Limited IN 56,034 -2,488 53,613 4.8x 4.7x 4.3x 19.6x 17.5x 16.0x 22.3x 20.0x 18.5x
Neurones S.A. FR 579 -192 418 0.8x 0.8x 0.7x 7.2x n.a. n.a. 10.1x 9.1x 7.7x
Progress Software Corporation US 1,474 76 1,551 4.0x 3.6x 3.5x n.a. n.a. n.a. 10.3x 9.5x 8.9x
Mean 30,955.9 -378.4 14,412.5 4.1 3.7 3.3 21.3 19.7 17.1 24.7 20.7 18.0
Median 16,118.3 -596.5 16,868.8 3.2 3.1 2.8 15.7 16.8 15.7 16.2 14.8 13.4
Valuations in the Software Development Segment (I/II)
46
Selected publicly listed companies - multiples
Source: CIQ November 2020
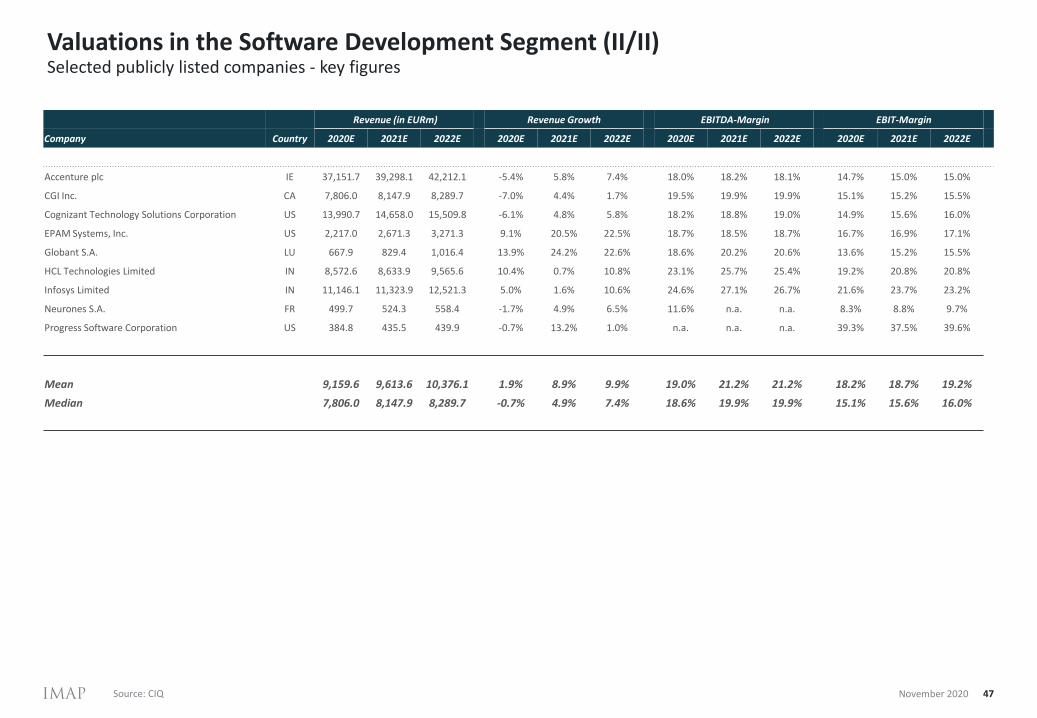
Revenue (in EURm) Revenue Growth EBITDA-Margin EBIT-Margin
Company Country 2020E 2021E 2022E 2020E 2021E 2022E 2020E 2021E 2022E 2020E 2021E 2022E
Accenture plc IE 37,151.7 39,298.1 42,212.1 -5.4% 5.8% 7.4% 18.0% 18.2% 18.1% 14.7% 15.0% 15.0%
CGI Inc. CA 7,806.0 8,147.9 8,289.7 -7.0% 4.4% 1.7% 19.5% 19.9% 19.9% 15.1% 15.2% 15.5%
Cognizant Technology Solutions Corporation US 13,990.7 14,658.0 15,509.8 -6.1% 4.8% 5.8% 18.2% 18.8% 19.0% 14.9% 15.6% 16.0%
EPAM Systems, Inc. US 2,217.0 2,671.3 3,271.3 9.1% 20.5% 22.5% 18.7% 18.5% 18.7% 16.7% 16.9% 17.1%
Globant S.A. LU 667.9 829.4 1,016.4 13.9% 24.2% 22.6% 18.6% 20.2% 20.6% 13.6% 15.2% 15.5%
HCL Technologies Limited IN 8,572.6 8,633.9 9,565.6 10.4% 0.7% 10.8% 23.1% 25.7% 25.4% 19.2% 20.8% 20.8%
Infosys Limited IN 11,146.1 11,323.9 12,521.3 5.0% 1.6% 10.6% 24.6% 27.1% 26.7% 21.6% 23.7% 23.2%
Neurones S.A. FR 499.7 524.3 558.4 -1.7% 4.9% 6.5% 11.6% n.a. n.a. 8.3% 8.8% 9.7%
Progress Software Corporation US 384.8 435.5 439.9 -0.7% 13.2% 1.0% n.a. n.a. n.a. 39.3% 37.5% 39.6%
Mean 9,159.6 9,613.6 10,376.1 1.9% 8.9% 9.9% 19.0% 21.2% 21.2% 18.2% 18.7% 19.2%
Median 7,806.0 8,147.9 8,289.7 -0.7% 4.9% 7.4% 18.6% 19.9% 19.9% 15.1% 15.6% 16.0%
Valuations in the Software Development Segment (II/II)
47
Selected publicly listed companies - key figures
Source: CIQ November 2020
Mkt. Cap Net Debt EV EV/Revenue EV/EBITDA EV/EBIT
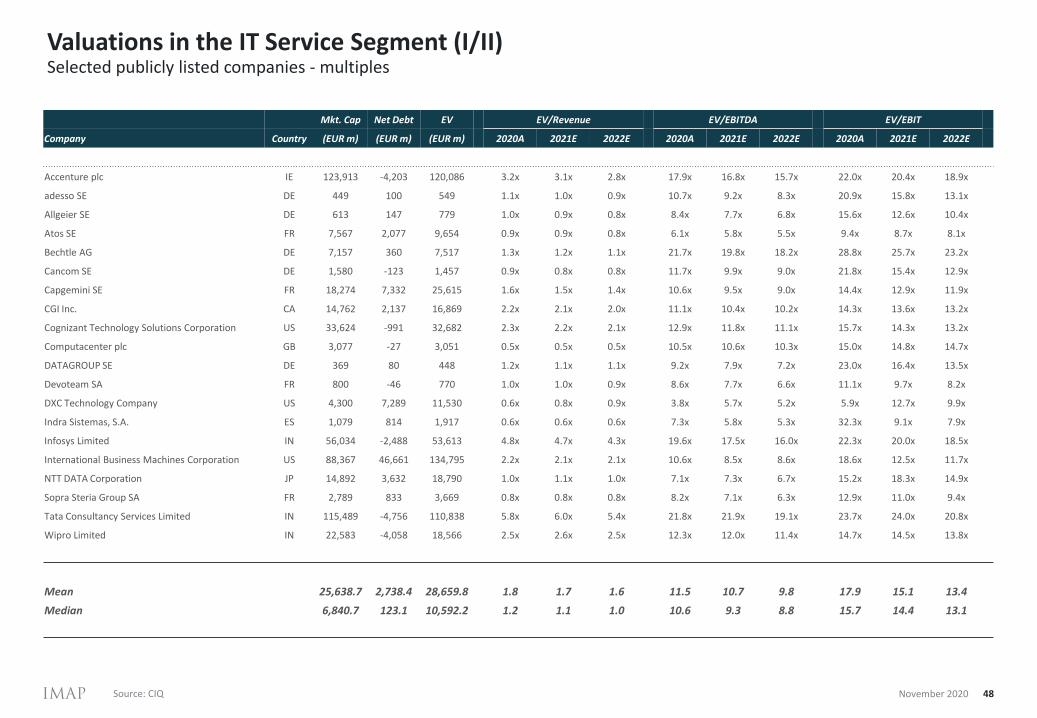
Company Country (EUR m) (EUR m) (EUR m) 2020A 2021E 2022E 2020A 2021E 2022E 2020A 2021E 2022E
Accenture plc IE 123,913 -4,203 120,086 3.2x 3.1x 2.8x 17.9x 16.8x 15.7x 22.0x 20.4x 18.9x
adesso SE DE 449 100 549 1.1x 1.0x 0.9x 10.7x 9.2x 8.3x 20.9x 15.8x 13.1x
Allgeier SE DE 613 147 779 1.0x 0.9x 0.8x 8.4x 7.7x 6.8x 15.6x 12.6x 10.4x
Atos SE FR 7,567 2,077 9,654 0.9x 0.9x 0.8x 6.1x 5.8x 5.5x 9.4x 8.7x 8.1x
Bechtle AG DE 7,157 360 7,517 1.3x 1.2x 1.1x 21.7x 19.8x 18.2x 28.8x 25.7x 23.2x
Cancom SE DE 1,580 -123 1,457 0.9x 0.8x 0.8x 11.7x 9.9x 9.0x 21.8x 15.4x 12.9x
Capgemini SE FR 18,274 7,332 25,615 1.6x 1.5x 1.4x 10.6x 9.5x 9.0x 14.4x 12.9x 11.9x
CGI Inc. CA 14,762 2,137 16,869 2.2x 2.1x 2.0x 11.1x 10.4x 10.2x 14.3x 13.6x 13.2x
Cognizant Technology Solutions Corporation US 33,624 -991 32,682 2.3x 2.2x 2.1x 12.9x 11.8x 11.1x 15.7x 14.3x 13.2x
Computacenter plc GB 3,077 -27 3,051 0.5x 0.5x 0.5x 10.5x 10.6x 10.3x 15.0x 14.8x 14.7x
DATAGROUP SE DE 369 80 448 1.2x 1.1x 1.1x 9.2x 7.9x 7.2x 23.0x 16.4x 13.5x
Devoteam SA FR 800 -46 770 1.0x 1.0x 0.9x 8.6x 7.7x 6.6x 11.1x 9.7x 8.2x
DXC Technology Company US 4,300 7,289 11,530 0.6x 0.8x 0.9x 3.8x 5.7x 5.2x 5.9x 12.7x 9.9x
Indra Sistemas, S.A. ES 1,079 814 1,917 0.6x 0.6x 0.6x 7.3x 5.8x 5.3x 32.3x 9.1x 7.9x
Infosys Limited IN 56,034 -2,488 53,613 4.8x 4.7x 4.3x 19.6x 17.5x 16.0x 22.3x 20.0x 18.5x
International Business Machines Corporation US 88,367 46,661 134,795 2.2x 2.1x 2.1x 10.6x 8.5x 8.6x 18.6x 12.5x 11.7x
NTT DATA Corporation JP 14,892 3,632 18,790 1.0x 1.1x 1.0x 7.1x 7.3x 6.7x 15.2x 18.3x 14.9x
Sopra Steria Group SA FR 2,789 833 3,669 0.8x 0.8x 0.8x 8.2x 7.1x 6.3x 12.9x 11.0x 9.4x
Tata Consultancy Services Limited IN 115,489 -4,756 110,838 5.8x 6.0x 5.4x 21.8x 21.9x 19.1x 23.7x 24.0x 20.8x
Wipro Limited IN 22,583 -4,058 18,566 2.5x 2.6x 2.5x 12.3x 12.0x 11.4x 14.7x 14.5x 13.8x
Mean 25,638.7 2,738.4 28,659.8 1.8 1.7 1.6 11.5 10.7 9.8 17.9 15.1 13.4
Median 6,840.7 123.1 10,592.2 1.2 1.1 1.0 10.6 9.3 8.8 15.7 14.4 13.1
Valuations in the IT Service Segment (I/II)
48
Selected publicly listed companies - multiples
Source: CIQ November 2020

Revenue (in EURm) Revenue Growth EBITDA-Margin EBIT-Margin
Company Country 2020A 2021E 2022E 2020A 2021E 2022E 2020A 2021E 2022E 2020A 2021E 2022E
Accenture plc IE 37,151.7 39,298.1 42,212.1 -5.4% 5.8% 7.4% 18.0% 18.2% 18.1% 14.7% 15.0% 15.0%
adesso SE DE 501.9 562.1 615.6 11.8% 12.0% 9.5% 10.2% 10.6% 10.8% 5.2% 6.2% 6.8%
Allgeier SE DE 797.4 851.3 917.9 1.9% 6.8% 7.8% 11.6% 11.8% 12.5% 6.2% 7.2% 8.2%
Atos SE FR 11,279.4 11,323.0 11,598.4 -2.5% 0.4% 2.4% 14.0% 14.6% 15.2% 9.1% 9.8% 10.3%
Bechtle AG DE 5,711.9 6,288.8 6,853.2 8.8% 10.1% 9.0% 6.1% 6.0% 6.0% 4.6% 4.7% 4.7%
Cancom SE DE 1,650.8 1,795.4 1,922.0 4.8% 8.8% 7.1% 7.6% 8.2% 8.5% 4.0% 5.3% 5.9%
Capgemini SE FR 15,809.6 17,060.0 17,913.4 11.9% 7.9% 5.0% 15.3% 15.8% 15.9% 11.3% 11.7% 12.0%
CGI Inc. CA 7,806.0 8,147.9 8,289.7 -7.2% 4.4% 1.7% 19.5% 19.9% 19.9% 15.1% 15.2% 15.5%
Cognizant Technology Solutions Corporation US 13,990.7 14,658.0 15,509.8 -6.1% 4.8% 5.8% 18.2% 18.8% 19.0% 14.9% 15.6% 16.0%
Computacenter plc GB 5,651.4 5,788.1 5,894.4 -6.5% 2.4% 1.8% 5.1% 5.0% 5.0% 3.6% 3.5% 3.5%
DATAGROUP SE DE 370.5 400.2 420.6 24.4% 8.0% 5.1% 13.2% 14.2% 14.8% 5.3% 6.8% 7.9%
Devoteam SA FR 759.4 791.9 856.3 -0.5% 4.3% 8.1% 11.9% 12.6% 13.5% 9.1% 10.0% 11.0%
DXC Technology Company US 17,860.5 14,736.3 13,340.4 -3.6% -17.5% -9.5% 17.1% 13.8% 16.5% 11.0% 6.2% 8.7%
Indra Sistemas, S.A. ES 3,094.3 3,195.0 3,319.3 -4.3% 3.3% 3.9% 8.4% 10.3% 11.0% 1.9% 6.6% 7.3%
Infosys Limited IN 11,146.1 11,323.9 12,521.3 5.0% 1.6% 10.6% 24.6% 27.1% 26.7% 21.6% 23.7% 23.2%
International Business Machines Corporation US 62,526.5 63,227.2 64,273.4 -8.9% 1.1% 1.7% 20.4% 25.2% 24.3% 11.6% 17.1% 17.8%
NTT DATA Corporation JP 19,208.9 17,646.5 18,410.4 12.2% -8.1% 4.3% 13.7% 14.5% 15.3% 6.4% 5.8% 6.9%
Sopra Steria Group SA FR 4,395.0 4,568.5 4,759.5 -1.5% 3.9% 4.2% 10.2% 11.2% 12.1% 6.4% 7.3% 8.2%
Tata Consultancy Services Limited IN 19,126.2 18,616.4 20,715.4 1.5% -2.7% 11.3% 26.6% 27.2% 28.0% 24.5% 24.8% 25.7%
Wipro Limited IN 7,387.8 7,067.6 7,562.1 -2.2% -4.3% 7.0% 20.4% 21.9% 21.5% 17.1% 18.1% 17.8%
Mean 12,311.3 12,367.3 12,895.3 1.7% 2.6% 5.2% 14.6% 15.4% 15.7% 10.2% 11.0% 11.6%
Median 7,596.9 7,607.8 7,925.9 -1.0% 4.1% 5.5% 13.8% 14.4% 15.3% 9.1% 8.6% 9.5%
Valuations in the IT Service Segment (II/II)
49
Selected publicly listed companies - key figures
Source: CIQ November 2020

Valuations in the Conglomerates Segment (I/II)
50
Selected publicly listed companies - multiples
Source: CIQ November 2020
Mkt. Cap Net Debt EV EV/Revenue EV/EBITDA EV/EBIT
Company Country (EUR m) (EUR m) (EUR m) 2020A 2021E 2022E 2020A 2021E 2022E 2020A 2021E 2022E
Adobe Inc. US 200,579 -452 200,124 18.5x 16.0x 14.0x 38.3x 32.8x 28.3x 43.7x 37.1x 31.7x
Alphabet Inc. US 893,255 -93,247 804,541 5.5x 4.6x 3.9x 16.1x 13.0x 11.2x 28.7x 21.8x 18.2x
Cisco Systems, Inc. US 140,294 -11,900 128,594 3.1x 3.1x 3.0x 8.3x 8.8x 8.5x 9.2x 9.6x 9.1x
Facebook, Inc. US 644,389 -41,974 604,455 8.9x 7.2x 6.0x 17.7x 14.2x 11.4x 26.3x 20.4x 16.4x
Intel Corporation US 210,491 10,766 220,693 3.5x 3.5x 3.4x 7.8x 8.0x 7.3x 10.8x 11.3x 10.5x
International Business Machines Corporation US 88,367 46,661 134,795 2.2x 2.1x 2.1x 10.6x 8.5x 8.6x 18.6x 12.5x 11.7x
Microsoft Corporation US 1,372,389 -48,324 1,326,415 10.5x 10.0x 9.0x 22.9x 21.5x 19.1x 28.4x 26.6x 23.5x
Oracle Corporation US 152,088 23,809 176,699 5.0x 5.2x 5.1x 10.6x 10.6x 10.4x 11.4x 11.5x 11.3x
salesforce.com, inc. US 196,921 -2,616 194,305 12.7x 11.1x 9.4x 43.9x 36.8x 31.0x 76.3x 63.3x 50.5x
SAP SE DE 151,878 9,453 161,420 5.7x 5.3x 4.9x 15.8x 14.4x 13.1x 19.1x 17.0x 15.2x
Mean 416,132.6 -5,391.2 197,602.1 7.6 6.8 6.1 19.2 16.9 14.9 27.2 23.1 19.8
Median 177,806.4 0.0 64,297.0 5.6 5.3 5.0 16.0 13.6 11.3 22.7 18.7 15.8
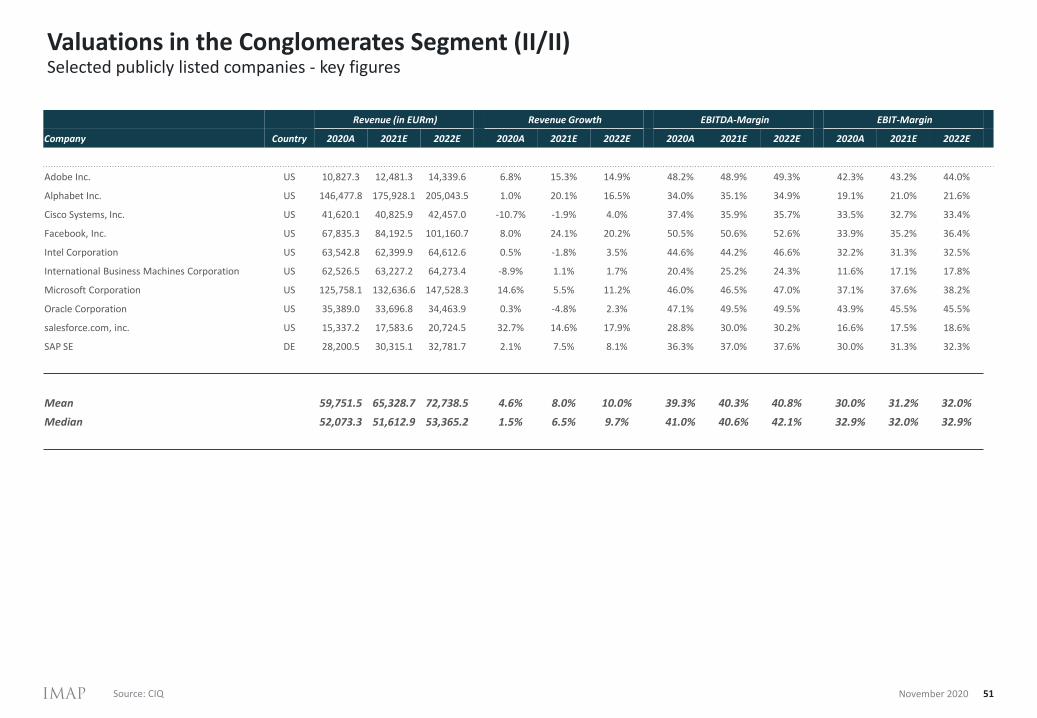
Revenue (in EURm) Revenue Growth EBITDA-Margin EBIT-Margin
Company Country 2020A 2021E 2022E 2020A 2021E 2022E 2020A 2021E 2022E 2020A 2021E 2022E
Adobe Inc. US 10,827.3 12,481.3 14,339.6 6.8% 15.3% 14.9% 48.2% 48.9% 49.3% 42.3% 43.2% 44.0%
Alphabet Inc. US 146,477.8 175,928.1 205,043.5 1.0% 20.1% 16.5% 34.0% 35.1% 34.9% 19.1% 21.0% 21.6%
Cisco Systems, Inc. US 41,620.1 40,825.9 42,457.0 -10.7% -1.9% 4.0% 37.4% 35.9% 35.7% 33.5% 32.7% 33.4%
Facebook, Inc. US 67,835.3 84,192.5 101,160.7 8.0% 24.1% 20.2% 50.5% 50.6% 52.6% 33.9% 35.2% 36.4%
Intel Corporation US 63,542.8 62,399.9 64,612.6 0.5% -1.8% 3.5% 44.6% 44.2% 46.6% 32.2% 31.3% 32.5%
International Business Machines Corporation US 62,526.5 63,227.2 64,273.4 -8.9% 1.1% 1.7% 20.4% 25.2% 24.3% 11.6% 17.1% 17.8%
Microsoft Corporation US 125,758.1 132,636.6 147,528.3 14.6% 5.5% 11.2% 46.0% 46.5% 47.0% 37.1% 37.6% 38.2%
Oracle Corporation US 35,389.0 33,696.8 34,463.9 0.3% -4.8% 2.3% 47.1% 49.5% 49.5% 43.9% 45.5% 45.5%
salesforce.com, inc. US 15,337.2 17,583.6 20,724.5 32.7% 14.6% 17.9% 28.8% 30.0% 30.2% 16.6% 17.5% 18.6%
SAP SE DE 28,200.5 30,315.1 32,781.7 2.1% 7.5% 8.1% 36.3% 37.0% 37.6% 30.0% 31.3% 32.3%
Mean 59,751.5 65,328.7 72,738.5 4.6% 8.0% 10.0% 39.3% 40.3% 40.8% 30.0% 31.2% 32.0%
Median 52,073.3 51,612.9 53,365.2 1.5% 6.5% 9.7% 41.0% 40.6% 42.1% 32.9% 32.0% 32.9%
Valuations in the Conglomerates Segment (II/II)
51
Selected publicly listed companies - key figures
Source: CIQ November 2020
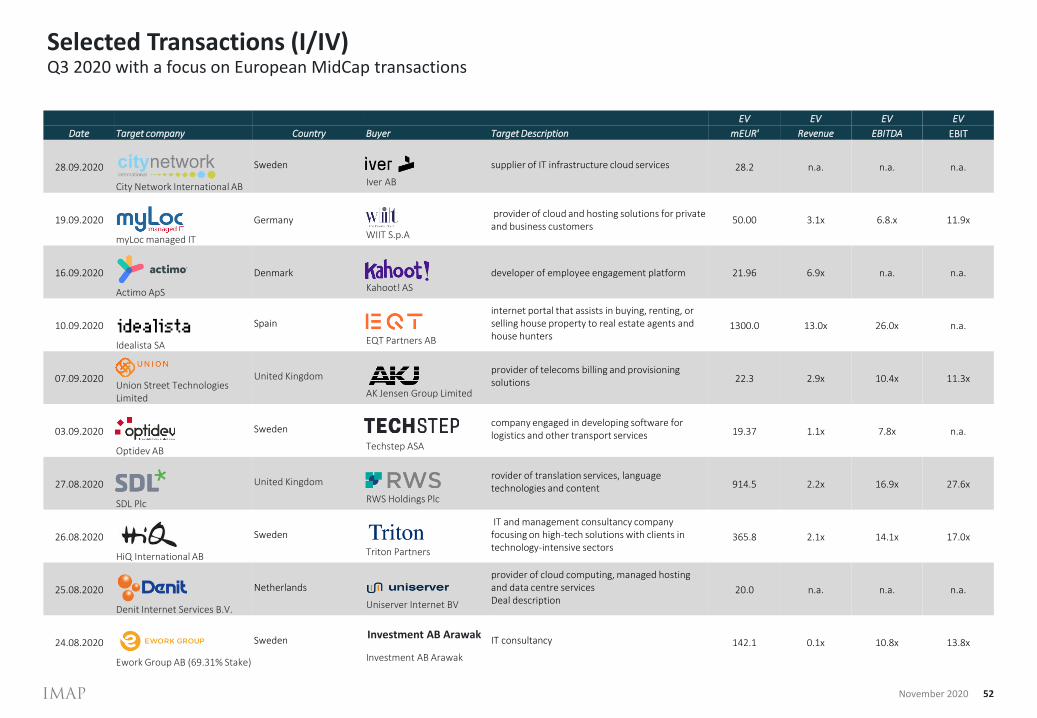
EV EV EV EV
Date Target company Country Buyer Target Description mEUR' Revenue EBITDA EBIT
28.09.2020
City Network International AB
Sweden
Iver AB
supplier of IT infrastructure cloud services 28.2 n.a. n.a. n.a.
19.09.2020
myLoc managed IT
Germany
WIIT S.p.A
provider of cloud and hosting solutions for private and business customers
50.00 3.1x 6.8.x 11.9x
16.09.2020
Actimo ApS
Denmark
Kahoot! AS
developer of employee engagement platform 21.96 6.9x n.a. n.a.
10.09.2020
Idealista SA
Spain
EQT Partners AB
internet portal that assists in buying, renting, or selling house property to real estate agents and house hunters
1300.0 13.0x 26.0x n.a.
07.09.2020Union Street Technologies Limited
United Kingdom
AK Jensen Group Limited
provider of telecoms billing and provisioning solutions 22.3 2.9x 10.4x 11.3x
03.09.2020
Optidev AB
Sweden
Techstep ASA
company engaged in developing software for logistics and other transport services 19.37 1.1x 7.8x n.a.
27.08.2020
SDL Plc
United Kingdom
RWS Holdings Plc
rovider of translation services, language technologies and content 914.5 2.2x 16.9x 27.6x
26.08.2020
HiQ International AB
Sweden
Triton Partners
IT and management consultancy company focusing on high-tech solutions with clients in technology-intensive sectors
365.8 2.1x 14.1x 17.0x
25.08.2020
Denit Internet Services B.V.
Netherlands
Uniserver Internet BV
provider of cloud computing, managed hosting and data centre servicesDeal description
20.0 n.a. n.a. n.a.
24.08.2020
Ework Group AB (69.31% Stake)
Sweden
Investment AB Arawak
IT consultancy 142.1 0.1x 10.8x 13.8x
Selected Transactions (I/IV)
52
Q3 2020 with a focus on European MidCap transactions
November 2020
Investment AB Arawak

EV EV EV EV
Date Target company Country Buyer Target Description mEUR' Revenue EBITDA EBIT
21.08.2020
Visma AS
Norway
Hg Capital; TPG Capital
company engaged in providing software solutions and services n.a. 6.8x 25.0x 61.6
17.08.2020
Codice Software SL
Spain
Unity Software Inc
company focused on the design and development of Software Configuration Management (SCM) solutions
16.8 n.a. n.a. n.a.
17.08.2020Comtrade Digital Services Limited
Ireland
Endava plc
provider of strategic software engineering services and solutions
60.0 n.a. n.a. n.a.
14.08.2020
Aareon AG (30% Stake)
Germany Advent International Corporation
company engaged in providing of systems and consulting services for the property industry 960.0 3.8x 15.7x 24.7x
11.08.2020
Custom Gateway Ltd
United Kingdom
Kornit Digital Ltd.
provider of cloud-based software workflow solutions 14.4 3.3x 35.9x n.a.
11.08.2020
Concent AS
Norway
KMD A/S
developer of software for credit management and debt collection 28.2 n.a. n.a. n.a.
10.08.2020
Qualsys Ltd
United Kingdom
Ideagen Plc
supplier of software's such as governance, risk and compliance management software, electronic quality management software
17.2 5.0x n.a. n.a.
07.08.2020
Techwan SA
Switzerland
Everbridge, Inc.
company that offers state-of-the-art command and control systems for operational and crisis management
19.0 n.a. n.a. n.a.
31.07.2020
Noralis Ltd
United Kingdom
Gordon Technologies LLC
manufacturer of energy drilling equipment and software 16.9 n.a. n.a. n.a.
30.07.2020
Infobip Limited
Croatia
One Equity Partners LLC
B2B software company that provides a cloud communications platform to businesses 848.2 1.4x n.a. n.a.
Selected Transactions (II/IV)
53
Q3 2020 with a focus on European MidCap transactions
November 2020
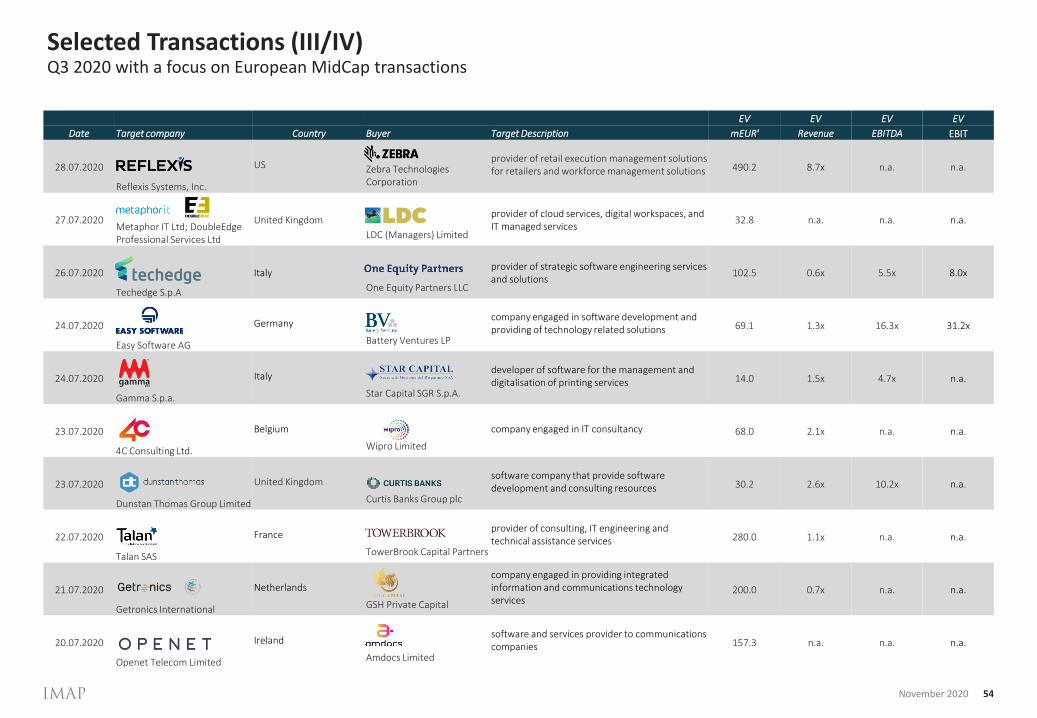
EV EV EV EV
Date Target company Country Buyer Target Description mEUR' Revenue EBITDA EBIT
28.07.2020
Reflexis Systems, Inc.
US Zebra Technologies Corporation
provider of retail execution management solutions for retailers and workforce management solutions 490.2 8.7x n.a. n.a.
27.07.2020Metaphor IT Ltd; DoubleEdgeProfessional Services Ltd
United Kingdom
LDC (Managers) Limited
provider of cloud services, digital workspaces, and IT managed services
32.8 n.a. n.a. n.a.
26.07.2020
Techedge S.p.A
Italy
One Equity Partners LLC
provider of strategic software engineering services and solutions
102.5 0.6x 5.5x 8.0x
24.07.2020
Easy Software AG
Germany
Battery Ventures LP
company engaged in software development and providing of technology related solutions 69.1 1.3x 16.3x 31.2x
24.07.2020
Gamma S.p.a.
Italy
Star Capital SGR S.p.A.
developer of software for the management and digitalisation of printing services 14.0 1.5x 4.7x n.a.
23.07.2020
4C Consulting Ltd.
Belgium
Wipro Limited
company engaged in IT consultancy 68.0 2.1x n.a. n.a.
23.07.2020
Dunstan Thomas Group Limited
United Kingdom
Curtis Banks Group plc
software company that provide software development and consulting resources 30.2 2.6x 10.2x n.a.
22.07.2020
Talan SAS
France
TowerBrook Capital Partners
provider of consulting, IT engineering and technical assistance services 280.0 1.1x n.a. n.a.
21.07.2020
Getronics International
Netherlands
GSH Private Capital
company engaged in providing integrated information and communications technology services
200.0 0.7x n.a. n.a.
20.07.2020
Openet Telecom Limited
Ireland
Amdocs Limited
software and services provider to communications companies 157.3 n.a. n.a. n.a.
Selected Transactions (III/IV)
54
Q3 2020 with a focus on European MidCap transactions
November 2020

EV EV EV EV
Date Target company Country Buyer Target Description mEUR' Revenue EBITDA EBIT
28.07.2020
Ubimax GmbH
Germany
Teamviewer AG
supplier of Enterprise Wearable Computing and Augmented Reality Solutions 136.5 15.0x n.a. n.a.
14.07.2020Industrial & Financial Systems AB
Sweden
EQT Partners AB
company engaged in the development and delivering of business software
3,000.0 4.3x 21.7x n.a.
06.07.2020
EFS Technology Ltd
United Kingdom
Formpipe Software AB
company engaged in providing output & document management solutions to the world’s leading banks, manufacturers, distributors, service companies & academic institutions
5.55 1.5x n.a. n.a.
Selected Transactions (IV/IV)
55
Q3 2020 with a focus on European MidCap transactions
November 2020

IMAP M&A Consultants AG
56
Offices
November 2020
IMAP M&A Consultants AG
Mannheim
Harrlachweg 168163 MannheimTelefon: +49 621 3286-0
Frankfurt am Main
Junghofstraße 2460311 Frankfurt am MainTelefon: +49 69 2999276-600
München
Bernhard-Wicki-Straße 380636 MünchenTelefon: +49 89 5402273-0
E-Mail: [email protected]: www.imap.de

November 2020 57