Embed Size (px)
Citation preview

| © 2016 CoreLogic, Inc. ■ Proprietary & Confidential
Third Quarter 2016Financial Results
October 24, 2016
1

Safe Harbor Statement
2
Certain statements made in this presentation are forward-looking statements within the meaning of the federal securities laws, including but not
limited to those statements related to the Company's updated financial guidance and market expectations; investment and strategic growth
plans, cost reductions, and productivity programs; the Company's overall financial performance, and the Company's margin and cash flow
profile. Risks and uncertainties exist that may cause the results to differ materially from those set forth in these forward-looking statements.
Factors that could cause the anticipated results to differ from those described in the forward-looking statements include the risks and
uncertainties set forth in Part I, Item 1A of our most recent Annual Report on Form 10-K, as amended or updated by our Quarterly Reports on
Form 10-Q. These additional risks and uncertainties include but are not limited to: limitations on access to or increase in prices for data from
external sources, including government and public record sources; changes in applicable government legislation, regulations and the level of
regulatory scrutiny affecting our customers or us, including with respect to consumer financial services and the use of public records and
consumer data; compromises in the security of our data, including the transmission of confidential information or systems interruptions; difficult
conditions in the mortgage and consumer lending industries and the economy generally; our ability to protect proprietary rights; our cost
reduction program, technology and growth strategies, including the launch of the VSG, and our ability to effectively and efficiently implement
them; risks related to the outsourcing of services and international operations; our indebtedness and the restrictions in our various debt
agreements; our ability to realize the anticipated benefits of certain acquisitions and/or divestitures and the timing thereof; the inability to control
the operations or dividend policies of our partially-owned affiliates; and impairments in our goodwill or other intangible assets. The forward-
looking statements speak only as of the date they are made. The Company does not undertake to update forward-looking statements to reflect
circumstances or events that occur after the date the forward-looking statements are made.

Historical Financial Performance (1)
3
(1) $ millions, except EPS. All figures from continuing operations.
2011 – 2015 Revenue growth of 9% CAGR
2011 – 2015 Operating income margin increase of 900 basis points
2011 – 2015 EPS growth of 56% CAGR
2011 – 3Q16 Total capital returned $975 million
2011 ROE of 2% 3Q16 ROE of 13%

3Q16 Financial Highlights
4
(1) These are non-GAAP financial measures. For a reconciliation to the most directly comparable GAAP measures, see the reconciliations included in the appendix.
3Q 2016 2Q 2016 3Q 2015
1 Revenue $523.9 $500.2 $386.4
2 Operating Income 84.8 75.5 65.9
3 Adjusted EPS1 $0.73 $0.65 $0.54
($ millions, except EPS)
Revenues increased 36% from 3Q15, driven by 79% PI growth and RMW market
outperformance.
Operating income increased from 3Q15 levels as operating upsides more than offset
investments in compliance and cyber-security.
Adjusted EPS was $0.73 per share, up 35% reflecting the positive impacts of
growth, reduced operating expenses and interest expense and share repurchases.
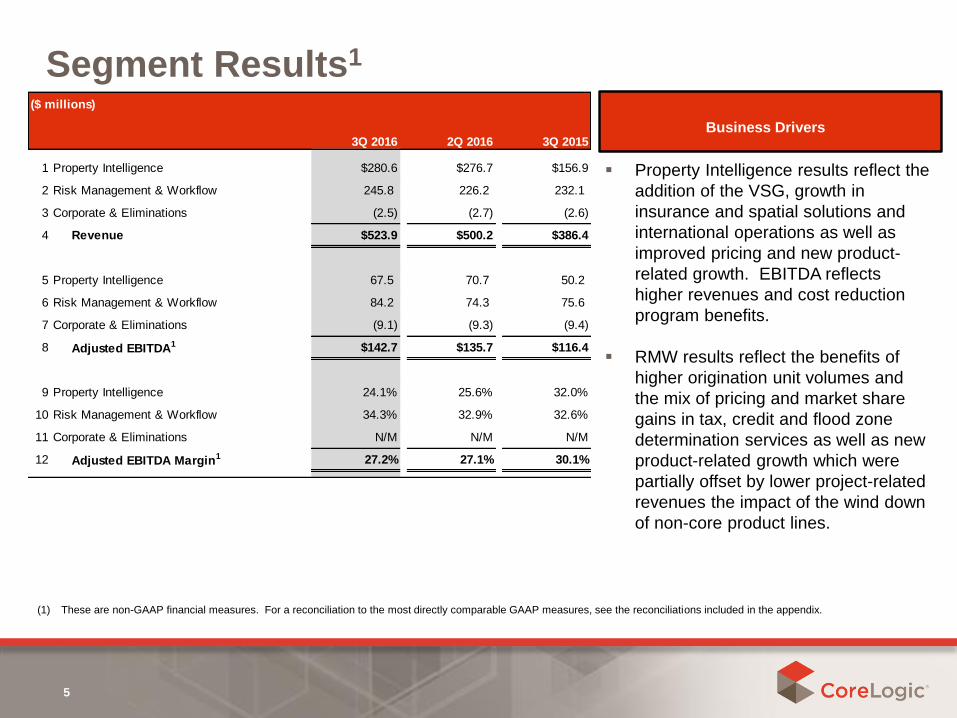
Segment Results1
5
(1) These are non-GAAP financial measures. For a reconciliation to the most directly comparable GAAP measures, see the reconciliations included in the appendix.
Business Drivers3Q 2016 2Q 2016 3Q 2015
1 Property Intelligence $280.6 $276.7 $156.9
2 Risk Management & Workflow 245.8 226.2 232.1
3 Corporate & Eliminations (2.5) (2.7) (2.6)
4 Revenue $523.9 $500.2 $386.4
5 Property Intelligence 67.5 70.7 50.2
6 Risk Management & Workflow 84.2 74.3 75.6
7 Corporate & Eliminations (9.1) (9.3) (9.4)
8 Adjusted EBITDA1 $142.7 $135.7 $116.4
9 Property Intelligence 24.1% 25.6% 32.0%
10 Risk Management & Workflow 34.3% 32.9% 32.6%
11 Corporate & Eliminations N/M N/M N/M
12 Adjusted EBITDA Margin1 27.2% 27.1% 30.1%
($ millions)
Property Intelligence results reflect the
addition of the VSG, growth in
insurance and spatial solutions and
international operations as well as
improved pricing and new product-
related growth. EBITDA reflects
higher revenues and cost reduction
program benefits.
RMW results reflect the benefits of
higher origination unit volumes and
the mix of pricing and market share
gains in tax, credit and flood zone
determination services as well as new
product-related growth which were
partially offset by lower project-related
revenues the impact of the wind down
of non-core product lines.

Consolidated CoreLogic
6
Historical Results
($ millions)
(Unaudited) 4Q 2013 1Q 2014 2Q 2014 3Q 2014 4Q 2014 1Q 2015 2Q 2015 3Q 2015 4Q 2015 1Q 2016 2Q 2016 3Q 2016
Net Income/(Loss) from
Continuing Operations(9.4)$ (2.9)$ 27.0$ 50.1$ 16.8$ 29.5$ 33.3$ 28.6$ 38.1$ 27.5$ 40.4$ 36.0$
Income Taxes (14.7) 1.6 11.0 16.8 9.2 13.9 17.3 24.1 11.3 15.9 20.6 16.4
Stock-based compensation 6.2 8.0 7.7 6.3 3.3 8.7 9.8 7.9 9.4 9.5 9.8 10.5
Non-Operating (Gains)/Losses - 4.1 (6.0) (13.8) (0.1) 0.0 1.6 - (35.5) (1.9) (2.4) 19.0
Strategic & Efficiency Investment 2.8 0.8 0.7 0.1 - 0.3 0.3 2.0 4.8 0.0 0.4 1.1
Transactional Costs 2.5 8.5 1.1 (0.1) (0.5) 0.1 1.7 0.8 2.9 1.0 5.1 0.7
Depreciation and Amortization 29.6 29.5 35.4 35.8 37.8 35.9 37.3 36.4 37.0 39.3 43.3 44.5
Impairment Loss 42.7 0.1 4.1 0.7 0.1 0.1 - - 3.7 0.3 - -
Interest Expense 12.7 15.7 16.3 17.5 17.5 12.4 16.6 16.6 15.8 13.7 17.8 13.7
Amortization of Acquired Software
(Equity in Earnings of Affiliates)- - - - - - - - - 0.7 0.7 0.7
Adjusted EBITDA 72.5$ 65.4$ 97.3$ 113.4$ 84.1$ 100.9$ 117.8$ 116.4$ 87.5$ 106.1$ 135.7$ 142.7$

Property Intelligence
7
Historical Results
($ millions)
(Unaudited) 4Q 2013 1Q 2014 2Q 2014 3Q 2014 4Q 2014 1Q 2015 2Q 2015 3Q 2015 4Q 2015 1Q 2016 2Q 2016 3Q 2016
Net Income/(Loss) from
Continuing Operations3.2$ 13.2$ 32.7$ 31.0$ 23.1$ 25.7$ 24.6$ 25.2$ 19.1$ 16.7$ 33.1$ 28.3$
Income Taxes - - - - - - - - - - - -
Stock-based compensation 1.3 1.8 1.7 1.6 0.7 2.0 2.8 1.3 2.2 2.6 3.1 3.8
Non-Operating (Gains)/Losses - - (6.0) - - - - - - 1.1 (1.1) -
Strategic & Efficiency Investment - - - - - - - 0.3 0.1 - - -
Transactional Costs 0.3 - - - - - 1.4 0.3 0.4 0.0 1.9 0.8
Depreciation and Amortization 17.6 18.7 24.3 24.8 24.8 24.2 24.4 23.1 25.2 27.7 32.4 33.3
Impairment Loss 14.8 0.1 1.5 0.7 0.1 - - - - 0.2 - -
Interest Expense 0.0 0.2 0.0 (0.0) (0.1) 0.1 0.1 0.1 0.5 0.6 0.6 0.6
Amortization of Acquired Software
(Equity in Earnings of Affiliates)- - - - - - - - - 0.7 0.7 0.7
Adjusted EBITDA 37.2$ 34.0$ 54.3$ 58.1$ 48.5$ 51.9$ 53.3$ 50.2$ 47.4$ 49.7$ 70.7$ 67.5$

Risk Management & Workflow
8
Historical Results
($ millions)
(Unaudited) 4Q 2013 1Q 2014 2Q 2014 3Q 2014 4Q 2014 1Q 2015 2Q 2015 3Q 2015 4Q 2015 1Q 2016 2Q 2016 3Q 2016
Net Income/(Loss) from
Continuing Operations3.2$ 31.7$ 40.3$ 53.1$ 41.6$ 50.9$ 64.9$ 64.1$ 36.2$ 52.9$ 66.3$ 76.7$
Income Taxes - - - - - - - - - - - -
Stock-based compensation 2.4 1.5 1.3 1.1 0.7 1.2 1.3 1.6 1.5 1.6 1.4 1.2
Non-Operating (Gains)/Losses - - - - - - - - - - - -
Strategic & Efficiency Investment - - - - - - - 0.4 0.6 - - -
Transactional Costs - - - - - - - - - - - -
Depreciation and Amortization 9.1 7.9 8.1 8.0 7.7 8.2 8.0 9.5 8.0 7.6 6.6 6.3
Impairment Loss 28.0 - 2.5 - - 0.1 - - 3.7 0.1 - -
Interest Expense 0.0 0.0 0.0 0.0 0.0 0.0 0.0 0.0 0.0 0.0 0.0 0.0
Adjusted EBITDA 42.7$ 41.0$ 52.3$ 62.1$ 50.1$ 60.4$ 74.3$ 75.6$ 50.1$ 62.2$ 74.3$ 84.2$

Corporate & Eliminations
9
Historical Results
($ millions)
(Unaudited) 4Q 2013 1Q 2014 2Q 2014 3Q 2014 4Q 2014 1Q 2015 2Q 2015 3Q 2015 4Q 2015 1Q 2016 2Q 2016 3Q 2016
Net Income/(Loss) from
Continuing Operations(15.8)$ (47.8)$ (46.0)$ (34.0)$ (47.9)$ (47.1)$ (56.2)$ (60.7)$ (17.1)$ (42.1)$ (59.0)$ (69.1)$
Income Taxes (14.7) 1.6 11.0 16.8 9.2 13.9 17.3 24.1 11.3 15.9 20.6 16.4
Stock-based compensation 2.5 4.8 4.8 3.7 1.9 5.6 5.7 5.0 5.7 5.3 5.3 5.5
Non-Operating (Gains)/Losses - 4.1 - (13.8) (0.1) - 1.6 - (35.5) (3.0) (1.3) 19.0
Strategic & Efficiency Investment 2.8 0.8 0.7 0.1 - 0.3 0.3 1.4 4.1 0.0 0.4 1.1
Transactional Costs 2.2 8.5 1.1 (0.1) (0.5) 0.1 0.3 0.5 2.5 0.9 3.2 (0.1)
Depreciation and Amortization 2.9 2.9 2.9 2.9 5.2 3.5 4.9 3.9 3.8 4.0 4.3 4.9
Impairment Loss - - - - - - - - - - - -
Interest Expense 12.7 15.5 16.2 17.5 17.7 12.3 16.5 16.5 15.3 13.0 17.2 13.1
Adjusted EBITDA (7.4)$ (9.6)$ (9.3)$ (6.8)$ (14.5)$ (11.4)$ (9.7)$ (9.4)$ (9.9)$ (5.8)$ (9.3)$ (9.1)$

Property Intelligence
10
Revenues
4Q 2013 1Q 2014 2Q 2014 3Q 2014 4Q 2014 1Q 2015 2Q 2015 3Q 2015 4Q 2015 1Q 2016 2Q 2016 3Q 2016
1 Property Information & Analytics 130.2$ 124.7$ 156.8$ 158.4$ 153.3$ 152.2$ 159.9$ 155.8$ 157.6$ 152.7$ 163.0$ 162.5$
2 Valuation Solutions Group 1.3 1.2 1.3 1.4 1.0 1.2 1.2 1.2 34.3 88.8 113.7 118.1
3 Property Intelligence 131.5$ 126.0$ 158.1$ 159.8$ 154.3$ 153.4$ 161.1$ 156.9$ 191.9$ 241.4$ 276.7$ 280.6$
($ millions) Revenue Characteristics & Equity in Earnings

Risk Management & Workflow
11
Revenues & Business Volumes
4Q 2013 1Q 2014 2Q 2014 3Q 2014 4Q 2014 1Q 2015 2Q 2015 3Q 2015 4Q 2015 1Q 2016 2Q 2016 3Q 2016
1 Credit & Screening 69.1$ 77.7$ 81.0$ 79.7$ 68.9$ 86.4$ 90.7$ 86.6$ 73.1$ 87.3$ 92.9$ 101.1$
2 Escrow & Post Closing 129.4 124.3 129.9 130.4 124.7 127.6 136.9 145.5 128.3 127.7 133.3 144.6
3 Risk Management & Work Flow 198.5$ 202.1$ 211.0$ 210.1$ 193.6$ 214.0$ 227.6$ 232.1$ 201.4$ 215.0$ 226.2$ 245.8$
4Q 2013 1Q 2014 2Q 2014 3Q 2014 4Q 2014 1Q 2015 2Q 2015 3Q 2015 4Q 2015 1Q 2016 2Q 2016 3Q 2016
4 Current Period Tax Additions 1,009 826 924 1,113 1,088 1,025 1,371 1,453 1,195 1,371 1,404 1,603
5 Life of Loan Recognition 848 683 805 987 927 893 1,214 1,299 1,067 1,048 1,284 1,452
6 Periodic Recognition 161 142 120 126 161 132 157 154 128 324 120 151
7 Residential Under Tax Service 36,874 35,186 35,446 35,155 34,985 35,902 35,689 36,092 36,120 36,359 36,409 36,652
8 Flood Certifications 1,315 1,397 1,855 1,848 1,757 2,140 2,361 2,159 1,846 2,086 2,444 2,573
9 Credit Inquiries 5,430 6,483 6,504 6,473 5,443 6,516 6,569 6,755 5,640 6,658 6,600 6,812
($ millions) Revenue Characteristics & Equity in Earnings
(Volume in '000) Key Statistics

Depreciation and Amortization
12
3Q 2015 4Q 2015 1Q 2016 2Q 2016 3Q 2016
1 Property, Plant & Equipment $18.8 $17.8 $19.4 $21.4 $21.9
2 Acquisition-Related Intangibles 9.4 10.8 11.7 13.2 13.9
3 Capitalized Data 8.3 8.4 8.5 8.6 8.7
4 Total Depreciation & Amortization $36.4 $37.0 $39.6 $43.3 $44.5
($ millions)

Balance Sheet Summary
13
September 30, 2016 December 31, 2015
Assets
1 Cash and Equivalents $79 $99
2 Other Current Assets 367 443
3 Goodwill and Other Intangibles 2,605 2,234
4 Other Assets 961 898
5 Total Assets $4,012 $3,674
Liabilities
6 Current Liabilities $656 $614
7 Long-Term Deferred Revenue 469 449
8 Long-Term Debt, net of Current Portion 1,527 1,288
9 Other Liabilities 279 273
10 Total Liabilities $2,931 $2,624
11 Equity 1,081 1,049
12 Total Liabilities and Equity $4,012 $3,674
($ millions)

Reconciliation of Adjusted EPS
14
(Unaudited) 4Q 2013 1Q 2014 2Q 2014 3Q 2014 4Q 2014 1Q 2015 2Q 2015 3Q 2015 4Q 2015 1Q 2016 2Q 2016 3Q 2016
Net Income/(Loss) from Continuing Operations (0.10)$ (0.03)$ 0.29$ 0.54$ 0.18$ 0.32$ 0.36$ 0.31$ 0.42$ 0.31$ 0.45$ 0.40$
Stock-based compensation 0.07 0.09 0.08 0.07 0.04 0.10 0.11 0.09 0.10 0.11 0.11 0.12
Non-Operating Gains/(Losses) 0.00 0.04 (0.06) (0.15) (0.00) 0.00 0.02 0.00 (0.40) (0.03) (0.03) 0.22
Efficiency Investments 0.03 0.01 0.01 0.00 0.00 0.00 0.00 0.02 0.05 0.00 0.00 0.01
Transactional Costs 0.03 0.09 0.01 (0.00) (0.01) 0.00 0.02 0.01 0.03 0.01 0.06 0.01
Depreciation and Amortization Adjustments 0.10 0.08 0.14 0.14 0.14 0.14 0.14 0.14 0.15 0.16 0.18 0.19
Amortization of Acquired Intangibles
Included in Equity in Earnings0.00 0.00 0.00 0.00 0.00 0.00 0.00 0.00 0.00 0.01 0.01 0.01
Impairment Loss 0.46 0.00 0.04 0.01 0.00 0.00 0.00 0.00 0.04 0.00 0.00 0.00
Legal Settlement 0.00 0.00 0.00 0.00 0.00 0.00 0.00 0.00 0.00 0.01 0.00 0.00
Income Tax Effect * (0.33) (0.11) (0.12) (0.13) (0.08) (0.10) (0.10) (0.03) (0.06) (0.10) (0.13) (0.23)
Adjusted EPS 0.25$ 0.18$ 0.39$ 0.49$ 0.28$ 0.46$ 0.55$ 0.54$ 0.35$ 0.48$ 0.65$ 0.73$