Embed Size (px)
DESCRIPTION
Â
Citation preview
Q3’12 RESULTSConference Call
The Diagnostic Specialist
1
HigHligHts

2
MAIN TOPICS Revenues:
Strong seasonality effect as already experienced in Q3’11
CLIA sales ex Vitamin D growing double-digit and Vitamin D sales still affected by price effect in North America and Australia
Strong performance in Emerging Markets (LatAm and Asia Pacific)
Murex sales trend improving significantly
Tough economic environment and spending reviews in some European countries, offset by impressive good performance in other European countries
Profitability:
Strong profitability profile sustained by CLIA ex Vitamin D sales
NorDiag consolidation effects partly affected profitability
Installed base: ■ 126 new LIAISON XL ystems installed in Q3’12
■ 4,605 systems installed as of September 30th, 2012
Business development: Pipeline development on track, both in Immunodiagnostics and Molecular Diagnostics
Extraordinary Dividend: Proposal of an extraordinary dividend equal to € 0.83 per share (net of treasury shares)
3
Q3’12 + 9M’12 HIGHLIGHTS AND TRENDS
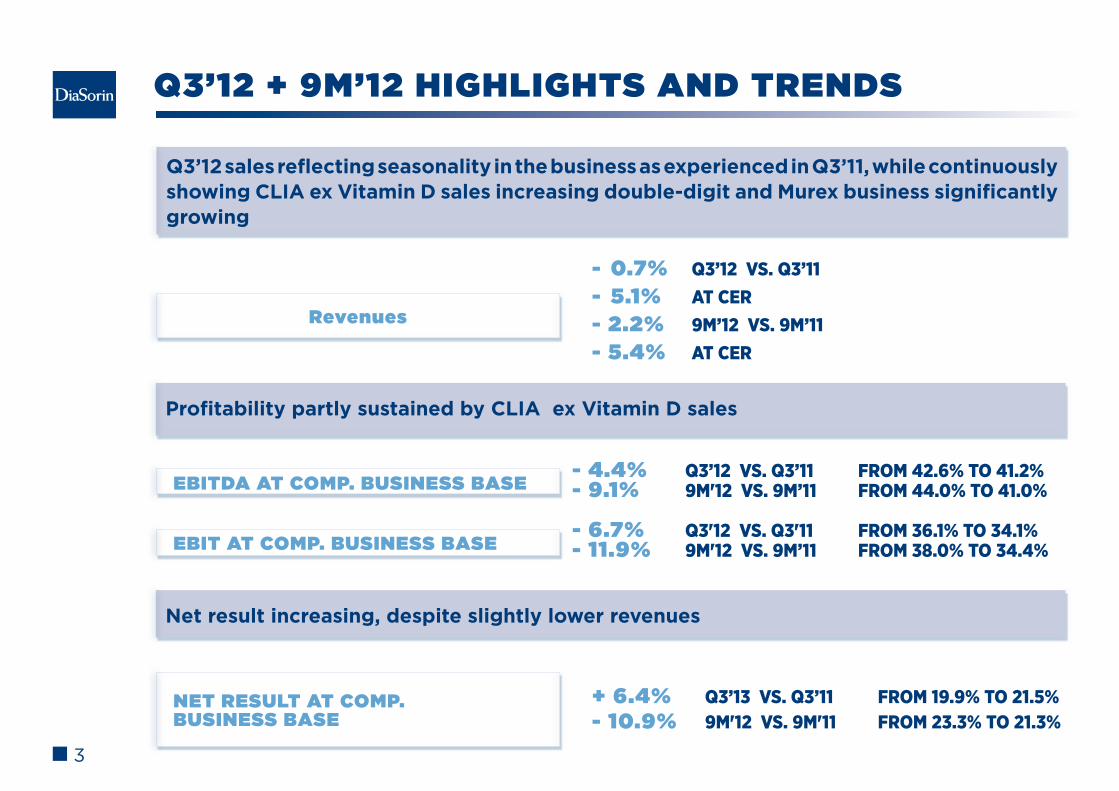
Q3’12 sales reflecting seasonality in the business as experienced in Q3’11, while continuously showing CLIA ex Vitamin D sales increasing double-digit and Murex business significantly growing
Revenues
Profitability partly sustained by CLIA ex Vitamin D sales
EBITDA AT COMP. BuSINESS BASE
EBIT AT COMP. BuSINESS BASE
- 0.7% Q3’12 vs. Q3’11 - 5.1% at cer- 2.2% 9M’12 vs. 9M’11 - 5.4% at cer
- 4.4% Q3’12 vs. Q3’11 froM 42.6% to 41.2%- 9.1% 9M'12 vs. 9M’11 froM 44.0% to 41.0%
- 6.7% Q3'12 vs. Q3'11 froM 36.1% to 34.1%- 11.9% 9M'12 vs. 9M’11 froM 38.0% to 34.4%
Net result increasing, despite slightly lower revenues
+ 6.4% Q3’13 vs. Q3’11 froM 19.9% to 21.5%- 10.9% 9M'12 vs. 9M'11 froM 23.3% to 21.3%
NET RESuLT AT COMP. BuSINESS BASE
4
REVENuES BREAKDOWN: BY TECHNOLOGY
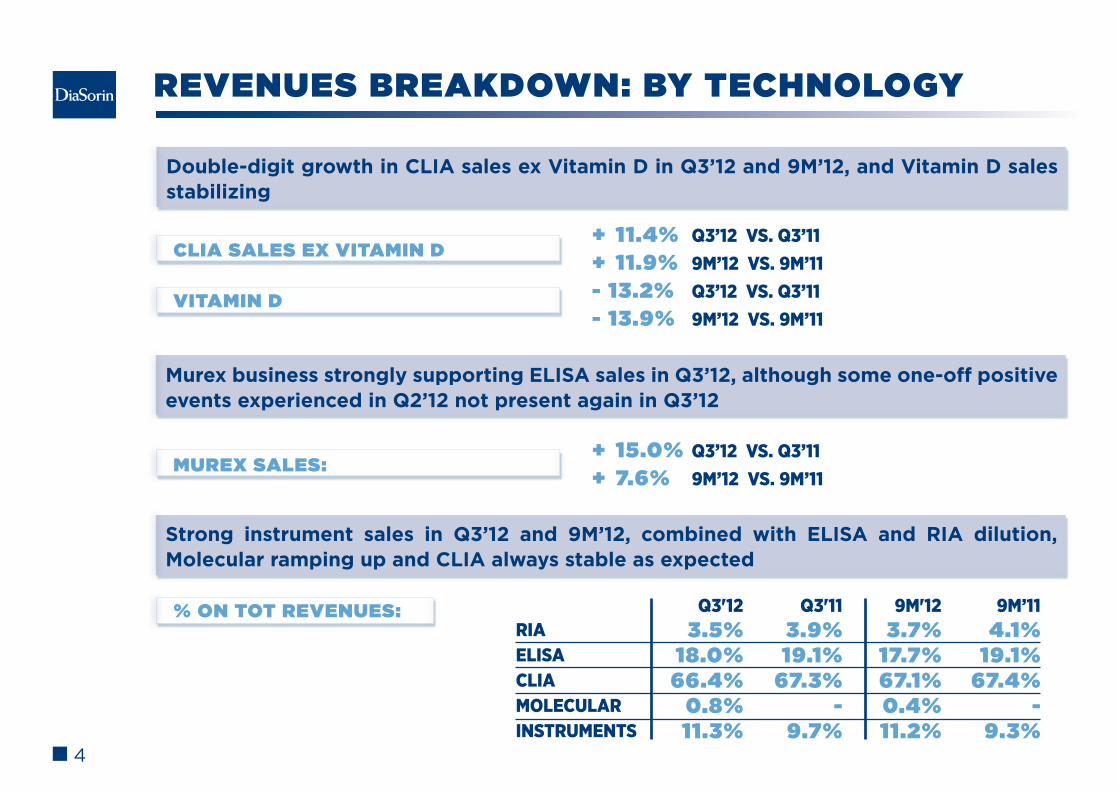
Double-digit growth in CLIA sales ex Vitamin D in Q3’12 and 9M’12, and Vitamin D sales stabilizing
Murex business strongly supporting ELISA sales in Q3’12, although some one-off positive events experienced in Q2’12 not present again in Q3’12
MuREx SALES:
CLIA SALES Ex VITAMIN D
VITAMIN D
+ 11.4% Q3’12 vs. Q3’11 + 11.9% 9M’12 vs. 9M’11- 13.2% Q3’12 vs. Q3’11 - 13.9% 9M’12 vs. 9M’11
+ 15.0% Q3’12 vs. Q3’11 + 7.6% 9M’12 vs. 9M’11
Strong instrument sales in Q3’12 and 9M’12, combined with ELISA and RIA dilution, Molecular ramping up and CLIA always stable as expected
% ON TOT REVENuES:rIaeLIsacLIaMoLecULarINstrUMeNts
Q3'123.5%
18.0%66.4%
0.8%11.3%
Q3'113.9%19.1%
67.3%-
9.7%
9M'123.7%
17.7%67.1%0.4%11.2%
9M’114.1%
19.1%67.4%
-9.3%
5
INSTALLED BASE ENLARGEMENT
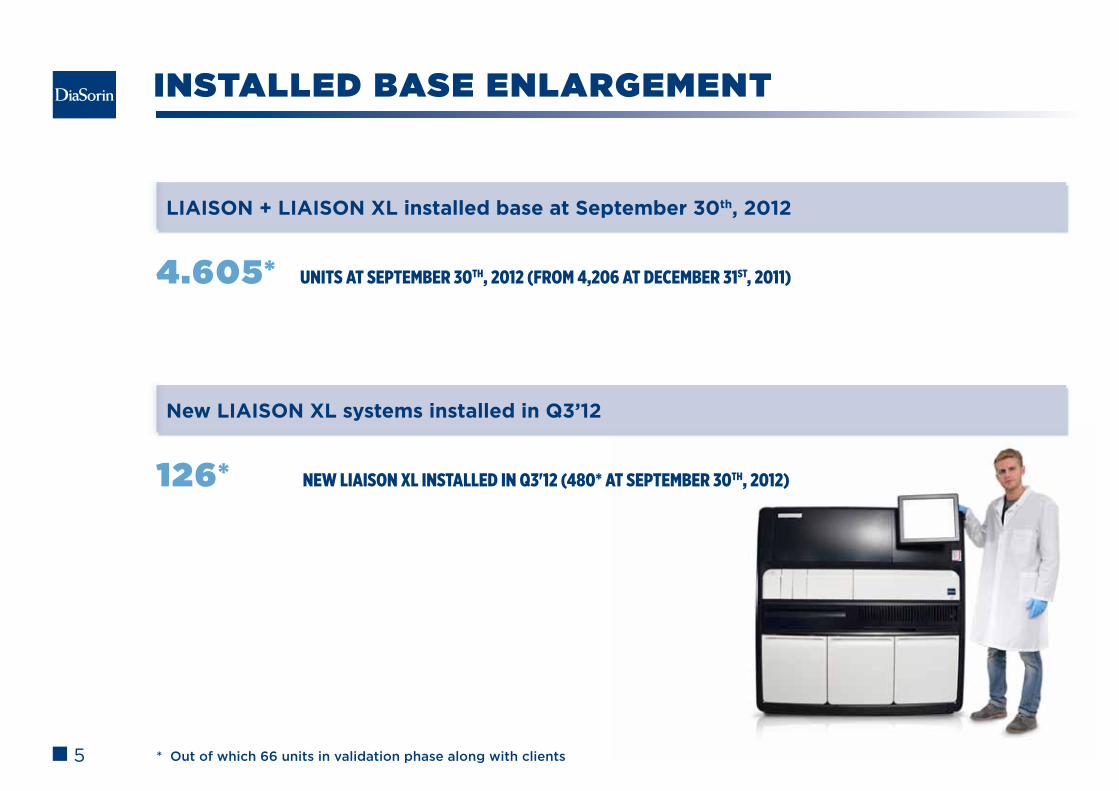
4.605* units at september 30th, 2012 (from 4,206 at December 31st, 2011)
LIAISON + LIAISON XL installed base at September 30th, 2012
New LIAISON XL systems installed in Q3’12
126* new Liaison XL instaLLeD in Q3'12 (480* at september 30th, 2012)
* Out of which 66 units in validation phase along with clients
6
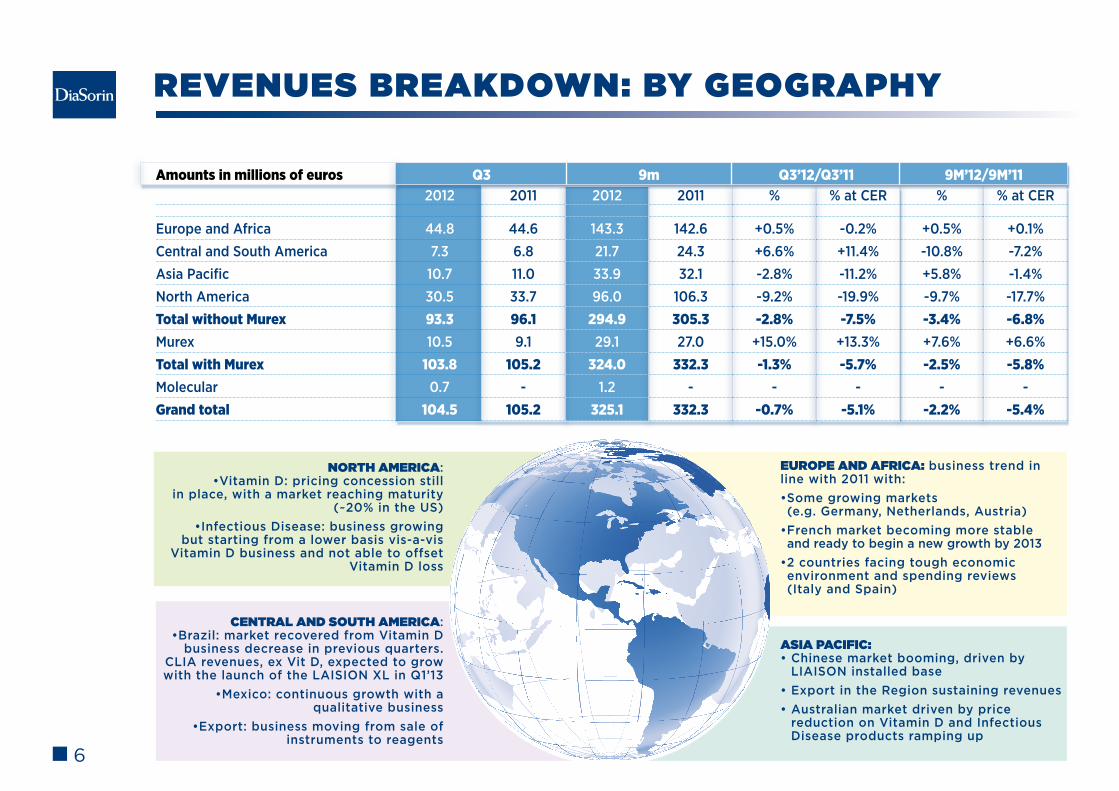
REVENuES BREAKDOWN: BY GEOGRAPHY
CENTRAL AND SOuTH AMERICA:•Brazil: market recovered from Vitamin D
business decrease in previous quarters. CLIA revenues, ex Vit D, expected to grow with the launch of the LAISION XL in Q1’13
•Mexico: continuous growth with a qualitative business
•Export: business moving from sale of instruments to reagents
ASIA PACIfIC:• Chinese market booming, driven by LIAISON installed base
• Export in the Region sustaining revenues
• Australian market driven by price reduction on Vitamin D and Infectious Disease products ramping up
NORTH AMERICA:•Vitamin D: pricing concession still
in place, with a market reaching maturity (~20% in the US)
•Infectious Disease: business growing but starting from a lower basis vis-a-vis
Vitamin D business and not able to offset Vitamin D loss
EuROPE AND AfRICA: business trend in line with 2011 with:
•Some growing markets (e.g. Germany, Netherlands, Austria)
•French market becoming more stable and ready to begin a new growth by 2013
•2 countries facing tough economic environment and spending reviews (Italy and Spain)
amounts in millions of euros Q3 9m Q3’12/Q3’11 9M’12/9M’11 2012 2011 2012 2011 % % at CER % % at CER
Europe and Africa 44.8 44.6 143.3 142.6 +0.5% -0.2% +0.5% +0.1%Central and South America 7.3 6.8 21.7 24.3 +6.6% +11.4% -10.8% -7.2%Asia Pacific 10.7 11.0 33.9 32.1 -2.8% -11.2% +5.8% -1.4%North America 30.5 33.7 96.0 106.3 -9.2% -19.9% -9.7% -17.7%total without Murex 93.3 96.1 294.9 305.3 -2.8% -7.5% -3.4% -6.8%Murex 10.5 9.1 29.1 27.0 +15.0% +13.3% +7.6% +6.6%total with Murex 103.8 105.2 324.0 332.3 -1.3% -5.7% -2.5% -5.8%Molecular 0.7 - 1.2 - - - - -Grand total 104.5 105.2 325.1 332.3 -0.7% -5.1% -2.2% -5.4%

7
Business development
8
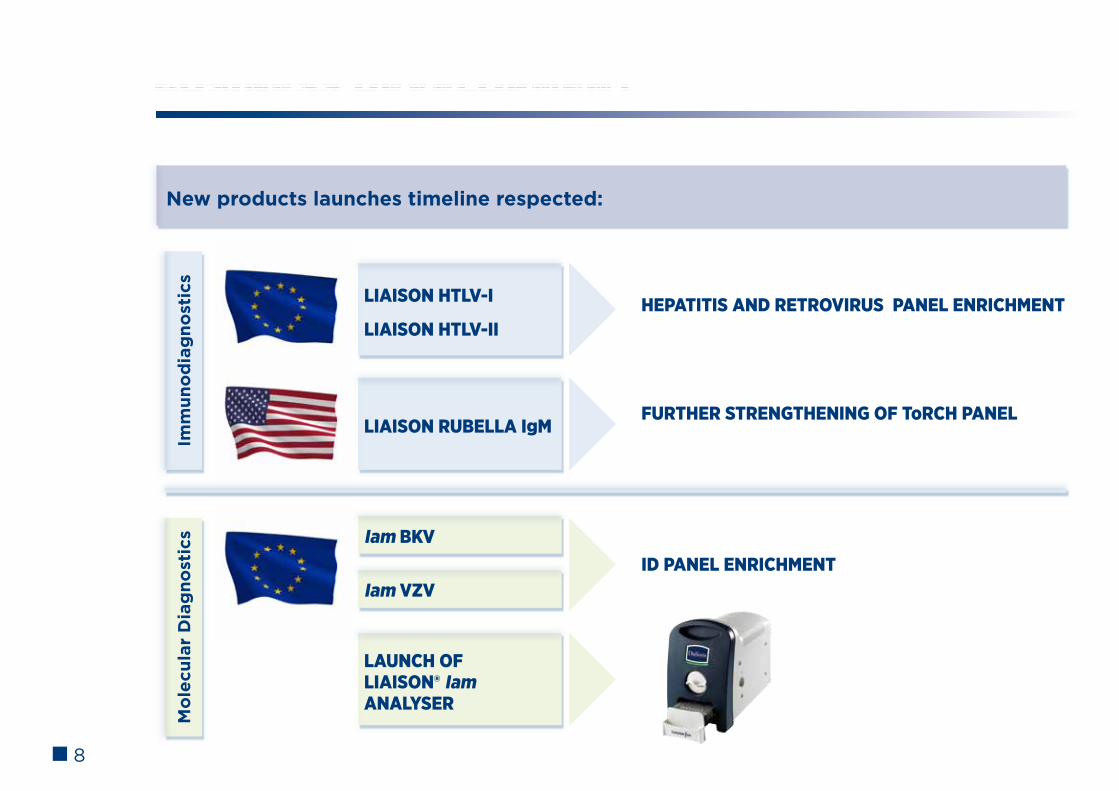
BuSINESS DEVELOPMENT
New products launches timeline respected:
LIaIsoN HtLv-I HepatItIs aNd retrovIrUs paNeL eNrIcHMeNt
fUrtHer streNGtHeNING of torcH paNeL
Id paNeL eNrIcHMeNtIam BKv
LIaIsoN HtLv-II
Iam vZv
LIaIsoN rUBeLLa IgM
LaUNcH ofLIaIsoN® IamaNaLyser
Imm
uno
dia
gno
stic
sM
ole
cula
r D
iag
nost
ics
9
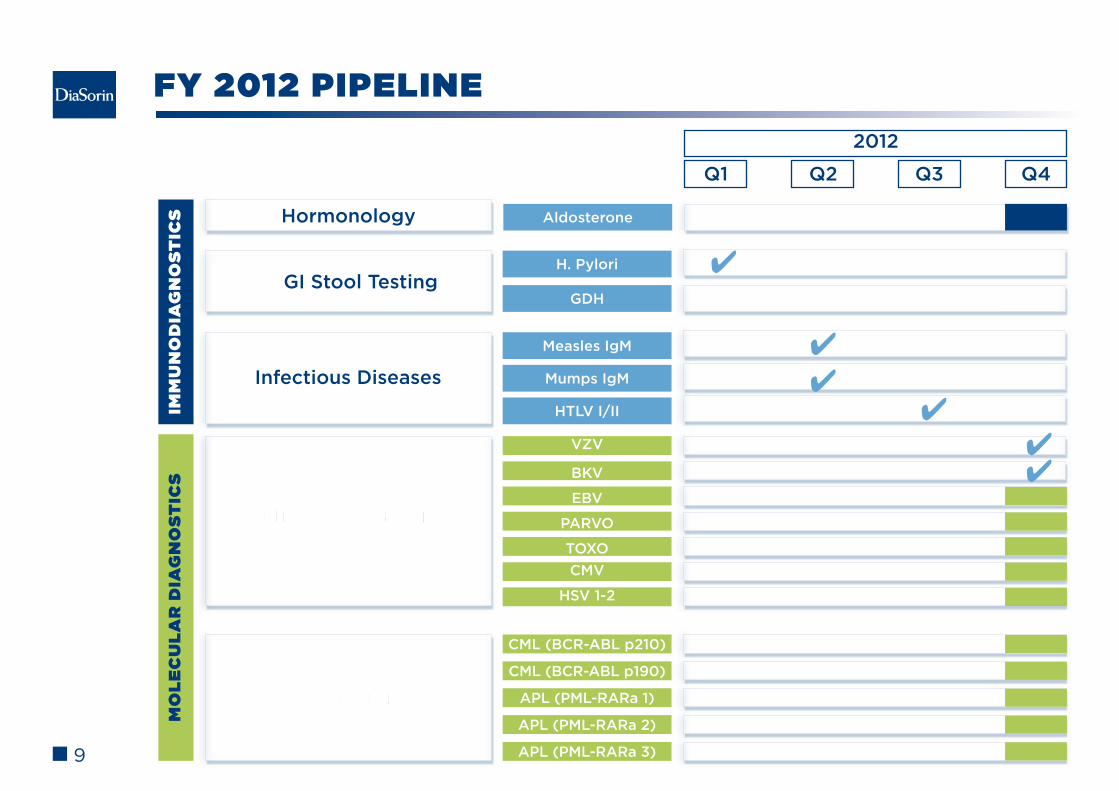
fY 2012 PIPELINE
IMM
uN
OD
IAG
NO
STIC
SM
OLE
Cu
LAR
DIA
GN
OST
ICS
Hormonology
GI Stool Testing
Infectious Diseases
Infectious Diseases
Onco Hematology
Aldosterone
H. Pylori
GDH
Measles IgM
Mumps IgM
HTLV I/II
VZV
BKV
EBV
PARVO
TOXO
CMV
HSV 1-2
CML (BCR-ABL p210)
CML (BCR-ABL p190)
APL (PML-RARa 1)
APL (PML-RARa 2)
APL (PML-RARa 3)
2012
Q2 Q3 Q4Q1
✔
✔✔
✔✔✔
10
Q3’12 and 9m’12 FinanCials
11
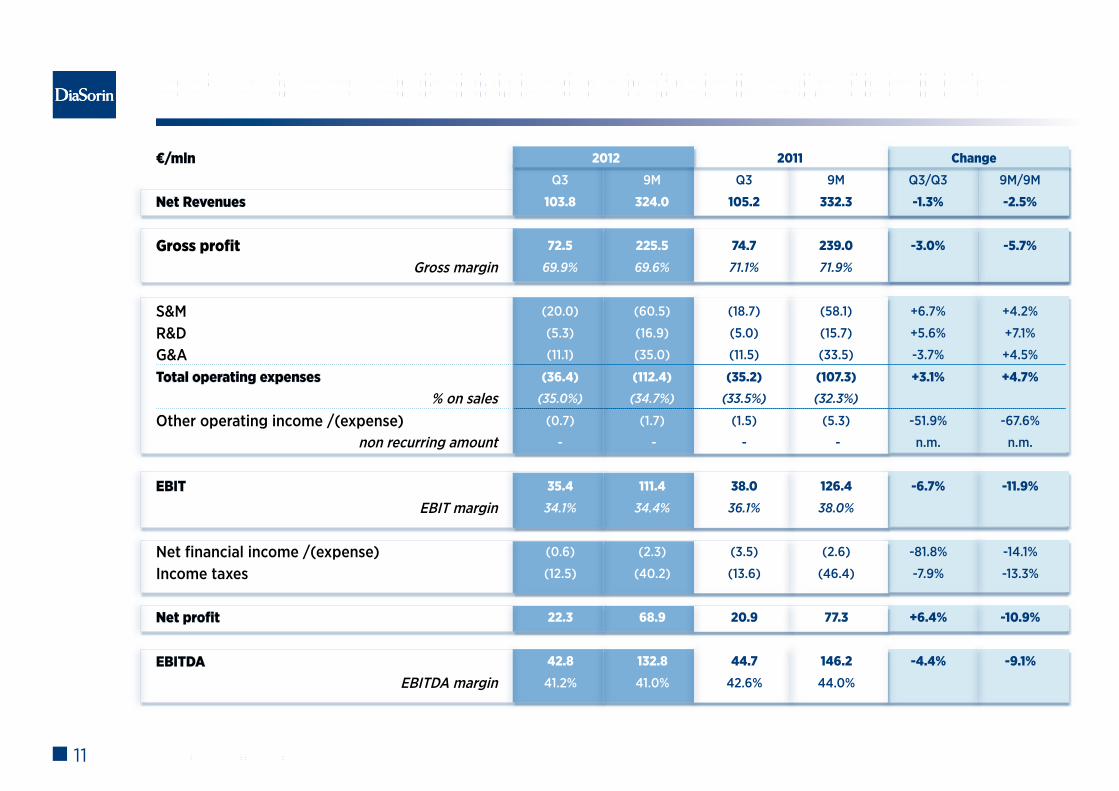
Q3’12 & 9M’12 RESuLTS: INCOME STATEMENT*
* At Constant Business Base
€/mln
Net revenues Gross profit
Gross margin S&M R&D G&A total operating expenses
% on sales Other operating income /(expense)
non recurring amount eBIt
EBIT margin Net financial income /(expense)Income taxes Net profit eBItda
EBITDA margin
2012 2011 change
Q3 9M Q3 9M Q3/Q3 9M/9M
103.8 324.0 105.2 332.3 -1.3% -2.5%
72.5 225.5 74.7 239.0 -3.0% -5.7%
69.9% 69.6% 71.1% 71.9%
(20.0) (60.5) (18.7) (58.1) +6.7% +4.2%
(5.3) (16.9) (5.0) (15.7) +5.6% +7.1%
(11.1) (35.0) (11.5) (33.5) -3.7% +4.5%
(36.4) (112.4) (35.2) (107.3) +3.1% +4.7%(35.0%) (34.7%) (33.5%) (32.3%)
(0.7) (1.7) (1.5) (5.3) -51.9% -67.6%
- - - - n.m. n.m.
35.4 111.4 38.0 126.4 -6.7% -11.9%
34.1% 34.4% 36.1% 38.0%
(0.6) (2.3) (3.5) (2.6) -81.8% -14.1%
(12.5) (40.2) (13.6) (46.4) -7.9% -13.3%
22.3 68.9 20.9 77.3 +6.4% -10.9%
42.8 132.8 44.7 146.2 -4.4% -9.1%
41.2% 41.0% 42.6% 44.0%

12
Q3’12 & 9M’12 RESuLTS: INCOME STATEMENT*
* Including NorDiag
2012 2011 changeQ3 9M Q3 9M Q3/Q3 9M/9M
104.5 325.1 105.2 332.3 -0.7% -2.2%
72.6 225.9 74.7 239.0 -2.9% -5.5%
69.5% 69.5% 71.1% 71.9%
(20.2) (60.8) (18.7) (58.1) +7.8% +4.7%
(5.6) (17.3) (5.0) (15.7) +11.1% +10.2%
(11.2) (35.5) (11.5) (33.5) -2.4% +6.0%
(37.0) (113.7) (35.2) (107.3) +4.9% +5.9%(35.4%) (35.0%) (33.5%) (32.3%)
(1.2) (3.1) (1.5) (5.3) -19.0% -42.2%
(0.3) (1.2) - - n.m. n.m.
34.4 109.2 38.0 126.4 -9.4% -13.6%
32.9% 33.6% 36.1% 38.0%
(0.6) (2.2) (3.5) (2.6) -83.3% -16.0%
(12.4) (40.0) (13.6) (46.4) -8.8% -13.9%
21.4 67.0 20.9 77.3 +2.3% -13.4%
41.8 130.6 44.7 146.2 -6.7% -10.6%
40.0% 40.2% 42.6% 44.0%
€/mlnNet revenues Gross profit
Gross margin S&M R&D G&A total operating expenses
% on sales Other operating income /(expense)
non recurring amount
eBItEBIT margin
Net financial income /(expense)Income taxes Net profit eBItda
EBITDA margin
13
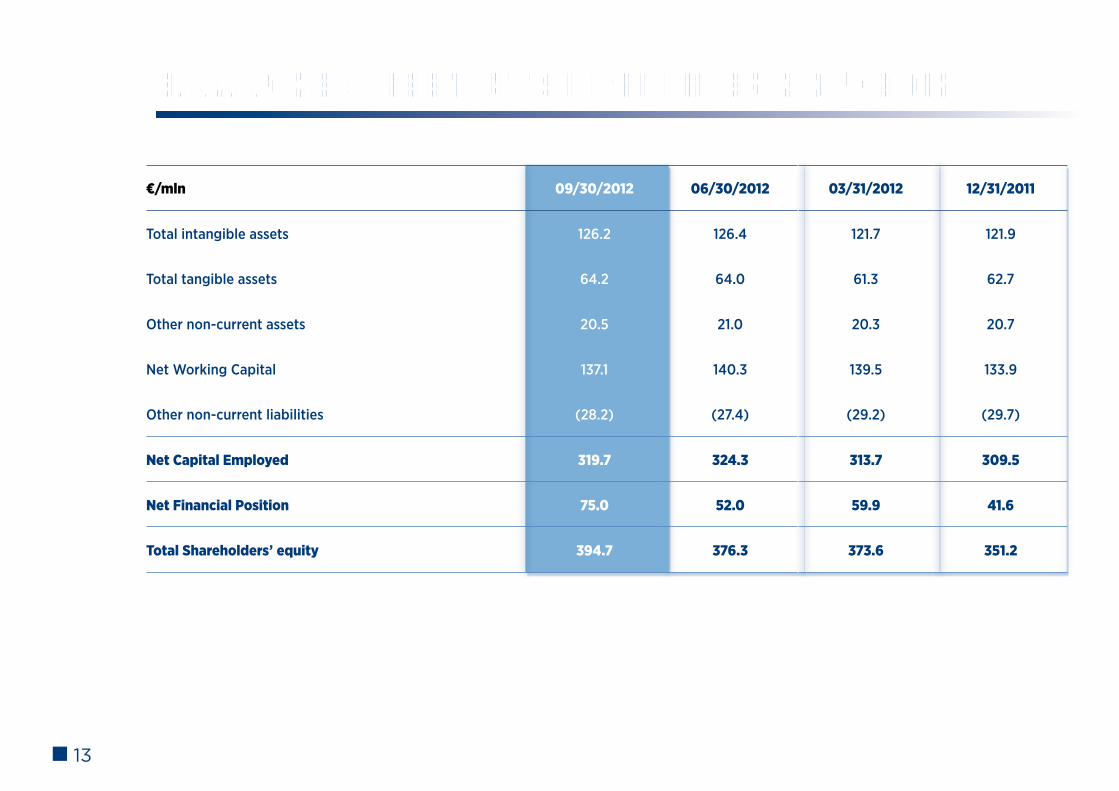
BALANCE SHEET AT SEPTEMBER 30TH, 2012
€/mln 09/30/2012 06/30/2012 03/31/2012 12/31/2011
Total intangible assets 126.2 126.4 121.7 121.9
Total tangible assets 64.2 64.0 61.3 62.7
Other non-current assets 20.5 21.0 20.3 20.7
Net Working Capital 137.1 140.3 139.5 133.9
Other non-current liabilities (28.2) (27.4) (29.2) (29.7)
Net capital employed 319.7 324.3 313.7 309.5
Net financial position 75.0 52.0 59.9 41.6
total shareholders’ equity 394.7 376.3 373.6 351.2
14
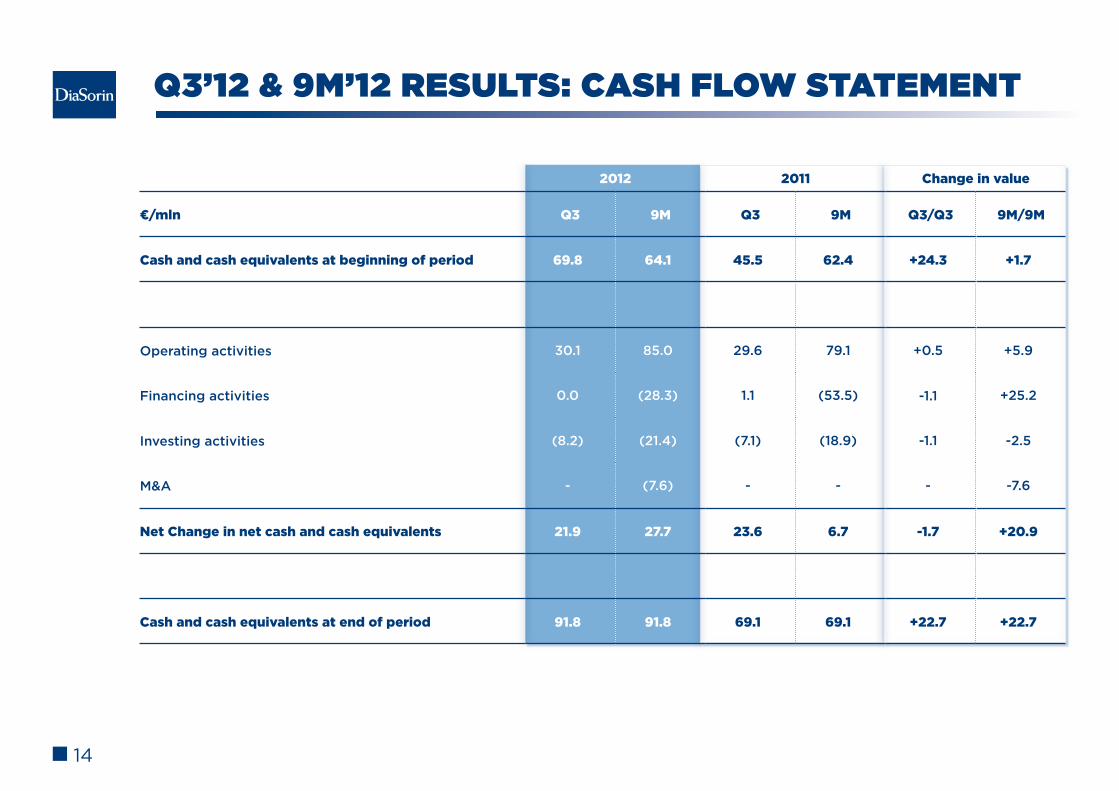
2012 2011 Change in value
€/mln Q3 9M Q3 9M Q3/Q3 9M/9M
Cash and cash equivalents at beginning of period 69.8 64.1 45.5 62.4 +24.3 +1.7
Operating activities 30.1 85.0 29.6 79.1 +0.5 +5.9
Financing activities 0.0 (28.3) 1.1 (53.5) -1.1 +25.2
Investing activities (8.2) (21.4) (7.1) (18.9) -1.1 -2.5
M&A - (7.6) - - - -7.6
Net Change in net cash and cash equivalents 21.9 27.7 23.6 6.7 -1.7 +20.9
Cash and cash equivalents at end of period 91.8 91.8 69.1 69.1 +22.7 +22.7
Q3’12 & 9M’12 RESuLTS: CASH fLOW STATEMENT

15
fY 2012 GuIDANCE
Revenues in line with 2011
EBITDA margin in line with 2011 or slightly below 2011 level (~ 200 bps)
500-600 new systems installed (Liaison + Liaison XL)
16
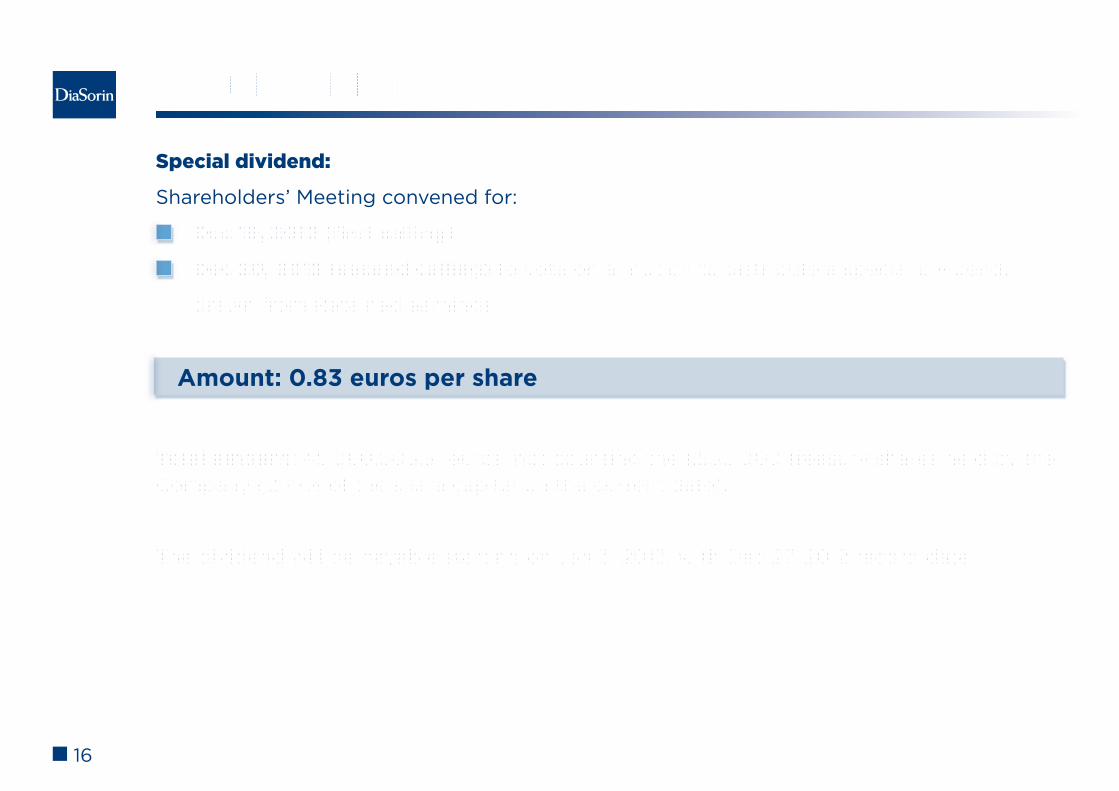
SPECIAL DIVIDEND
Amount: 0.83 euros per share
Special dividend:
Shareholders’ Meeting convened for:
Dec 19, 2012 (first calling)
Dec 20, 2012 (second calling) to vote on a motion to distribute a special dividend,
drawn from Retained earnings
Total amount: 45,080,003.31 euros, not counting the 1,550,000 treasury shares held by the Company (2.77% of the share capital on the current date).
The dividend will be payable starting on Jan 3, 2013, with Dec 27, 2012 record date.